Submitted:
03 July 2023
Posted:
05 July 2023
You are already at the latest version
Abstract
Keywords:
1. Introduction
2. Materials and Methods
2.1. Microfluidic Device Fabrication and Experimental Setup Preparation
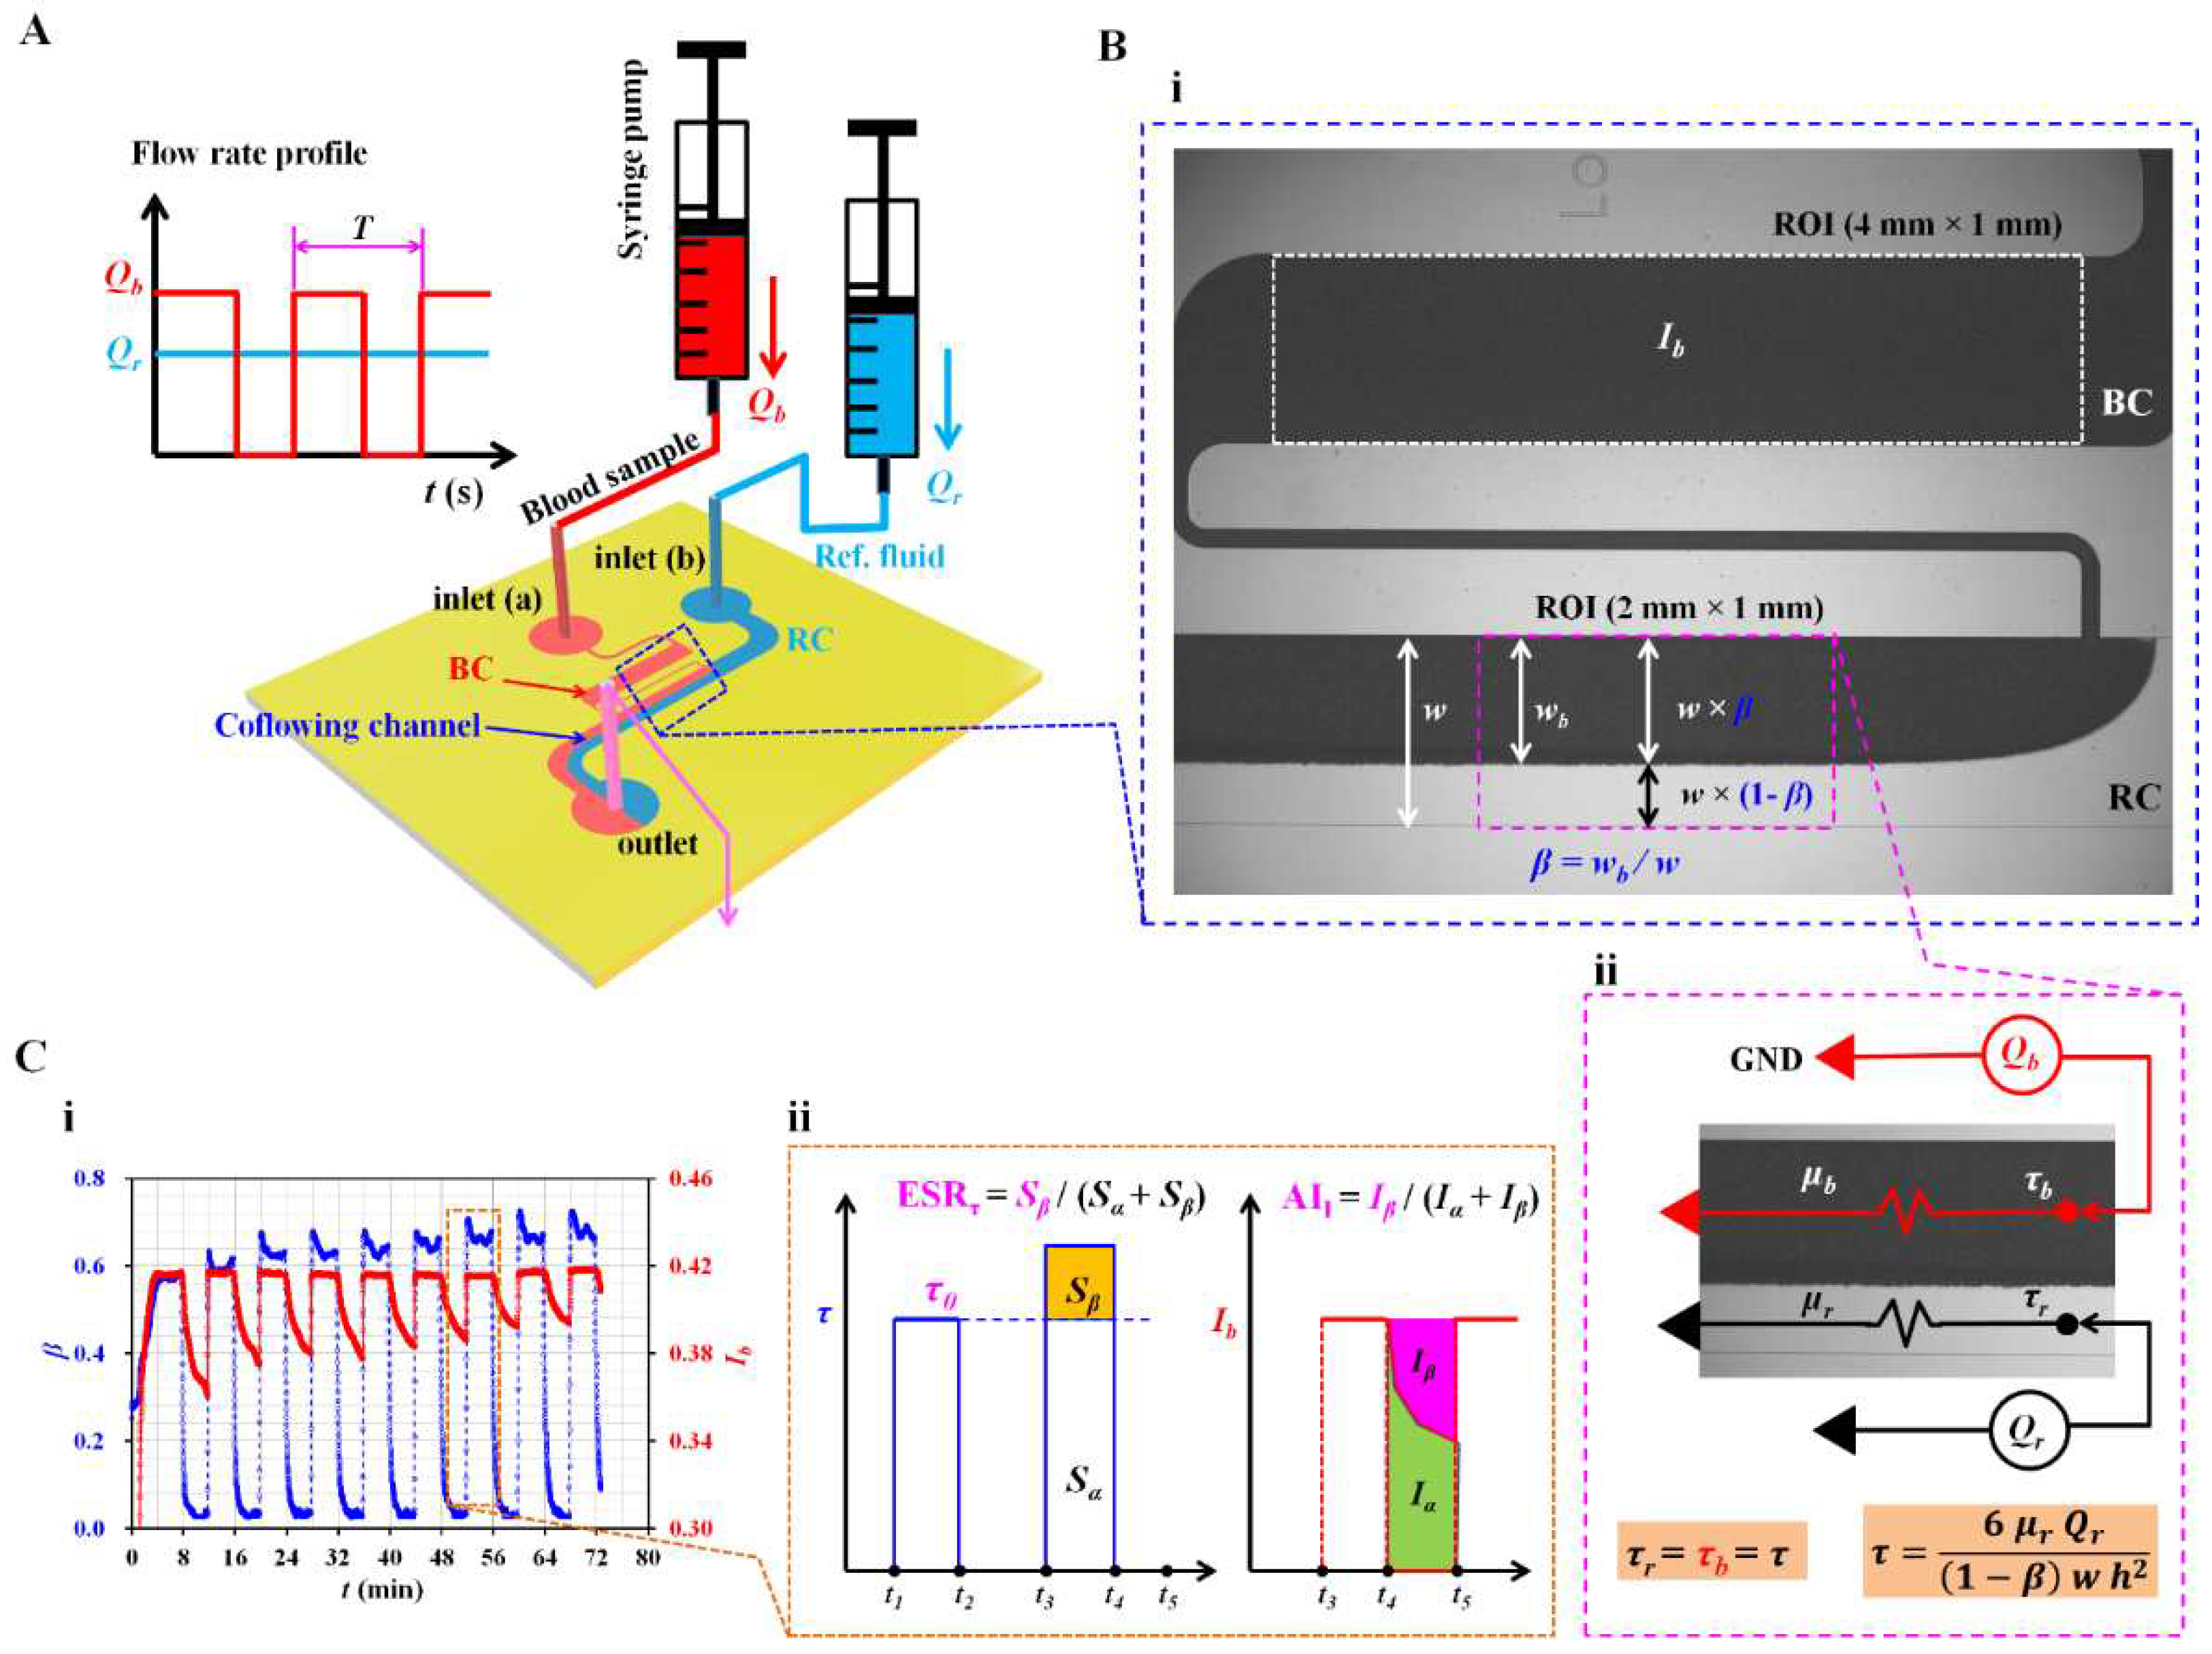
2.2. Quantification of Blood Flow Inside the Capillary Chip
2.3. Simple Mathematical Model for Estimating Shear Stress of Blood Flow in the Coflowing Channel
2.4. Blood Sample Preparation
3. Results and Discussion
3.1. Definition of ESR Index and Aggregation Index in Terms of Blood Shear Stress and Blood Image Intensity
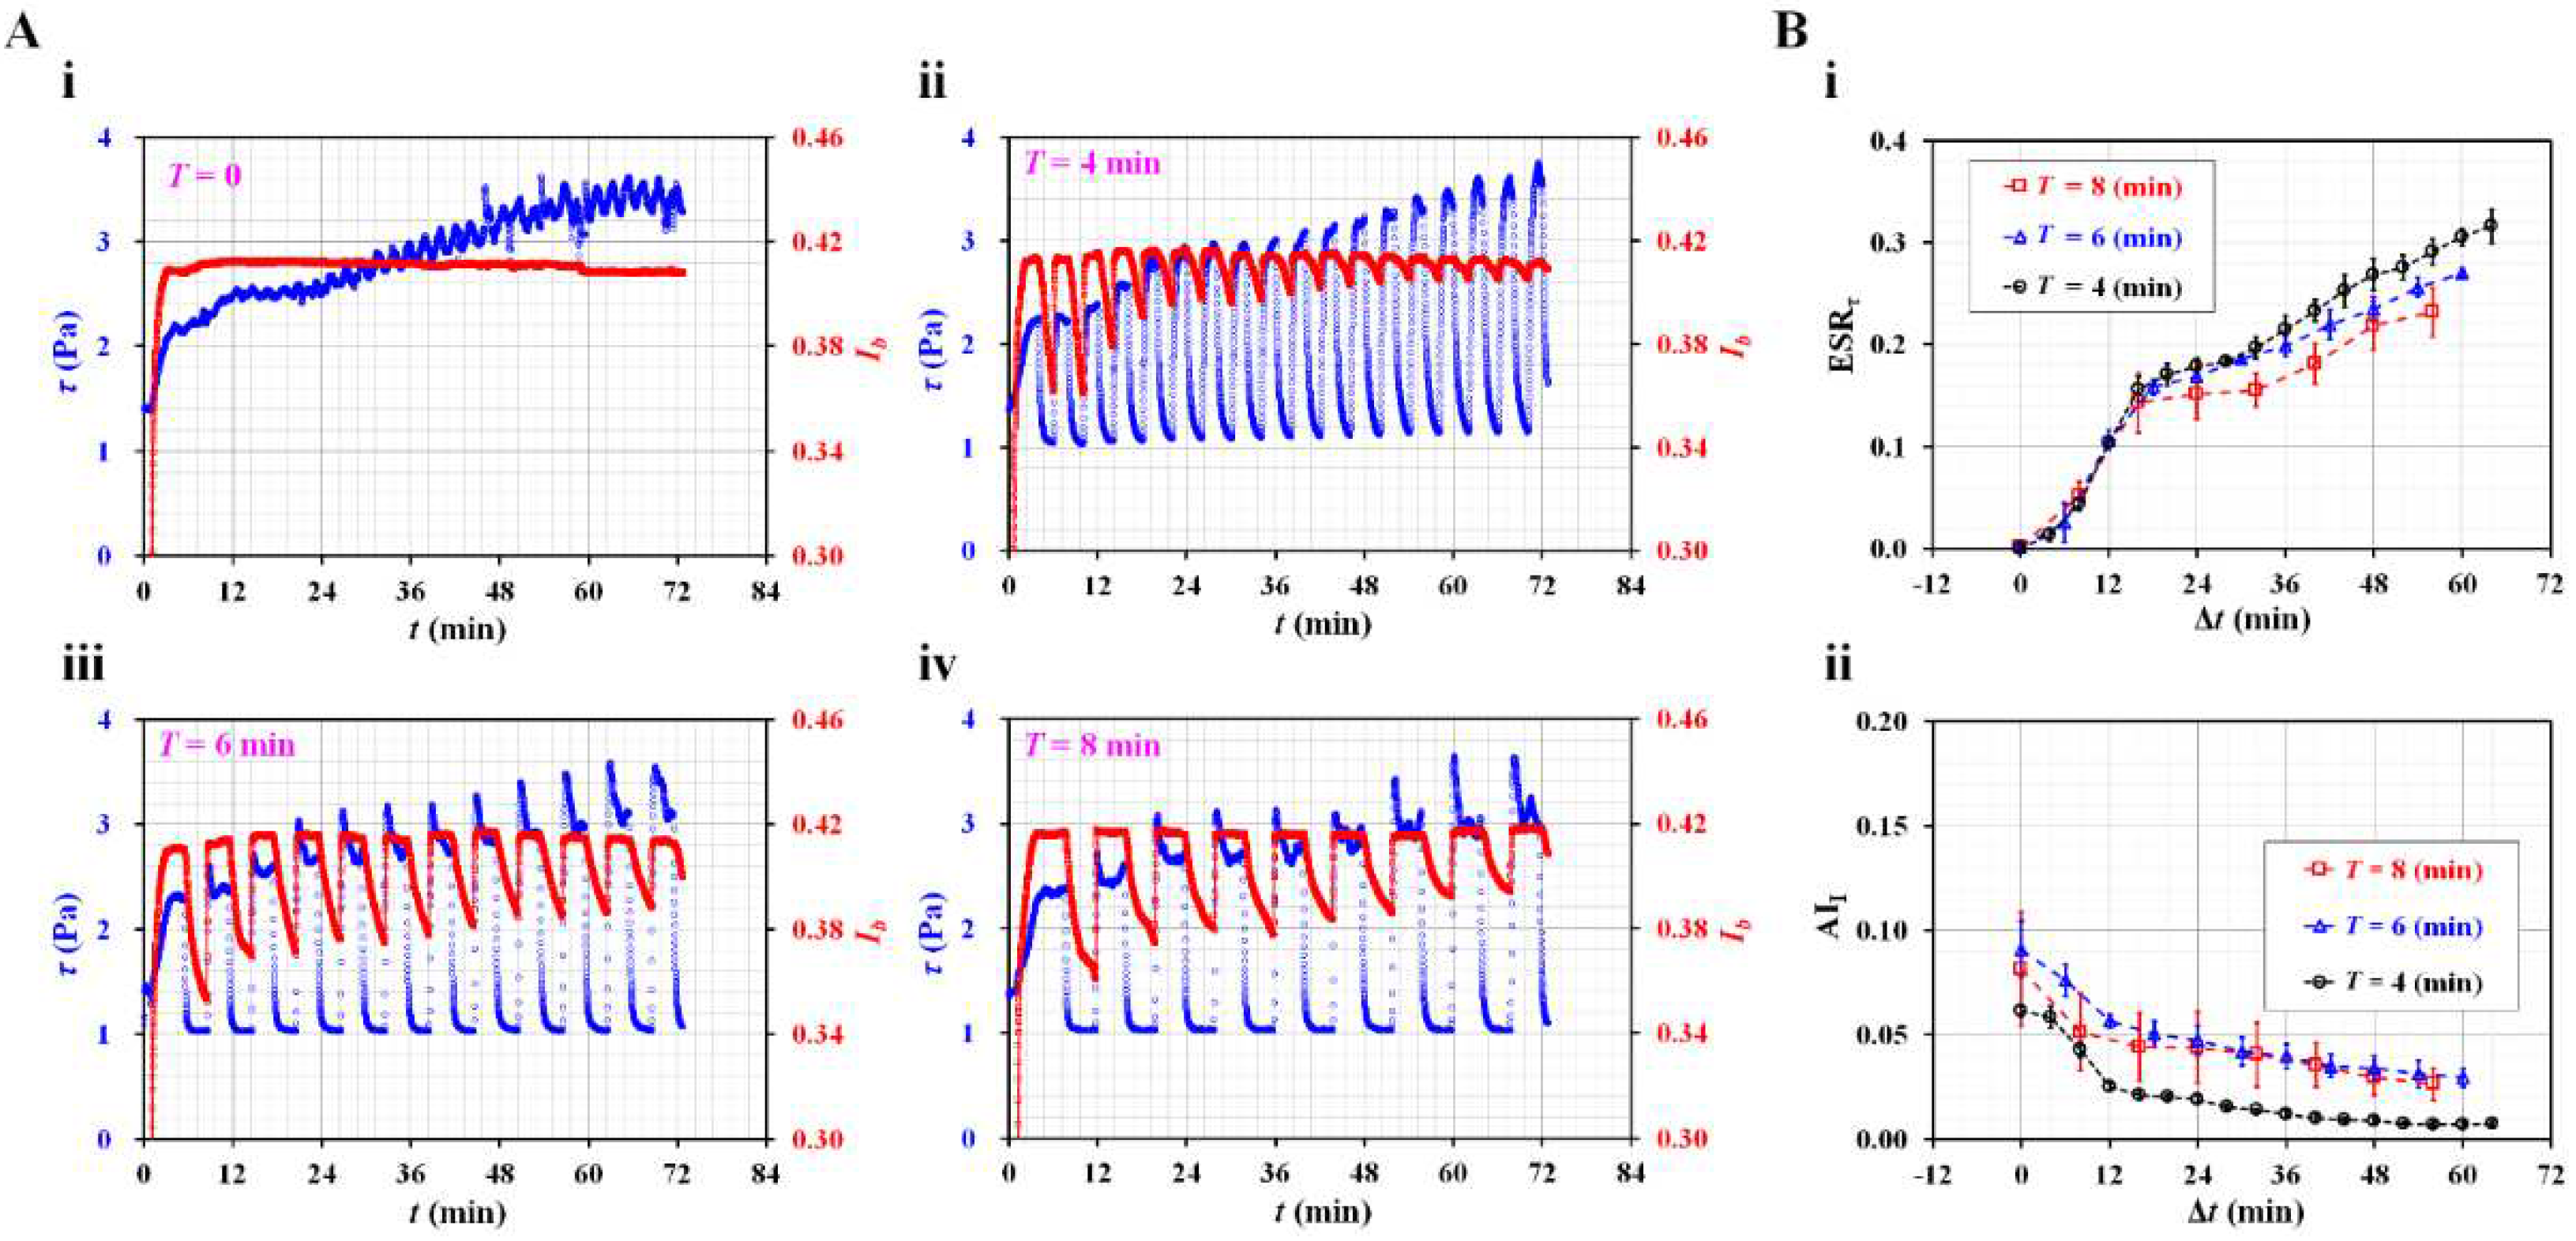
3.2. Contribution of Dynamic Blood Flow to ESR Quantification
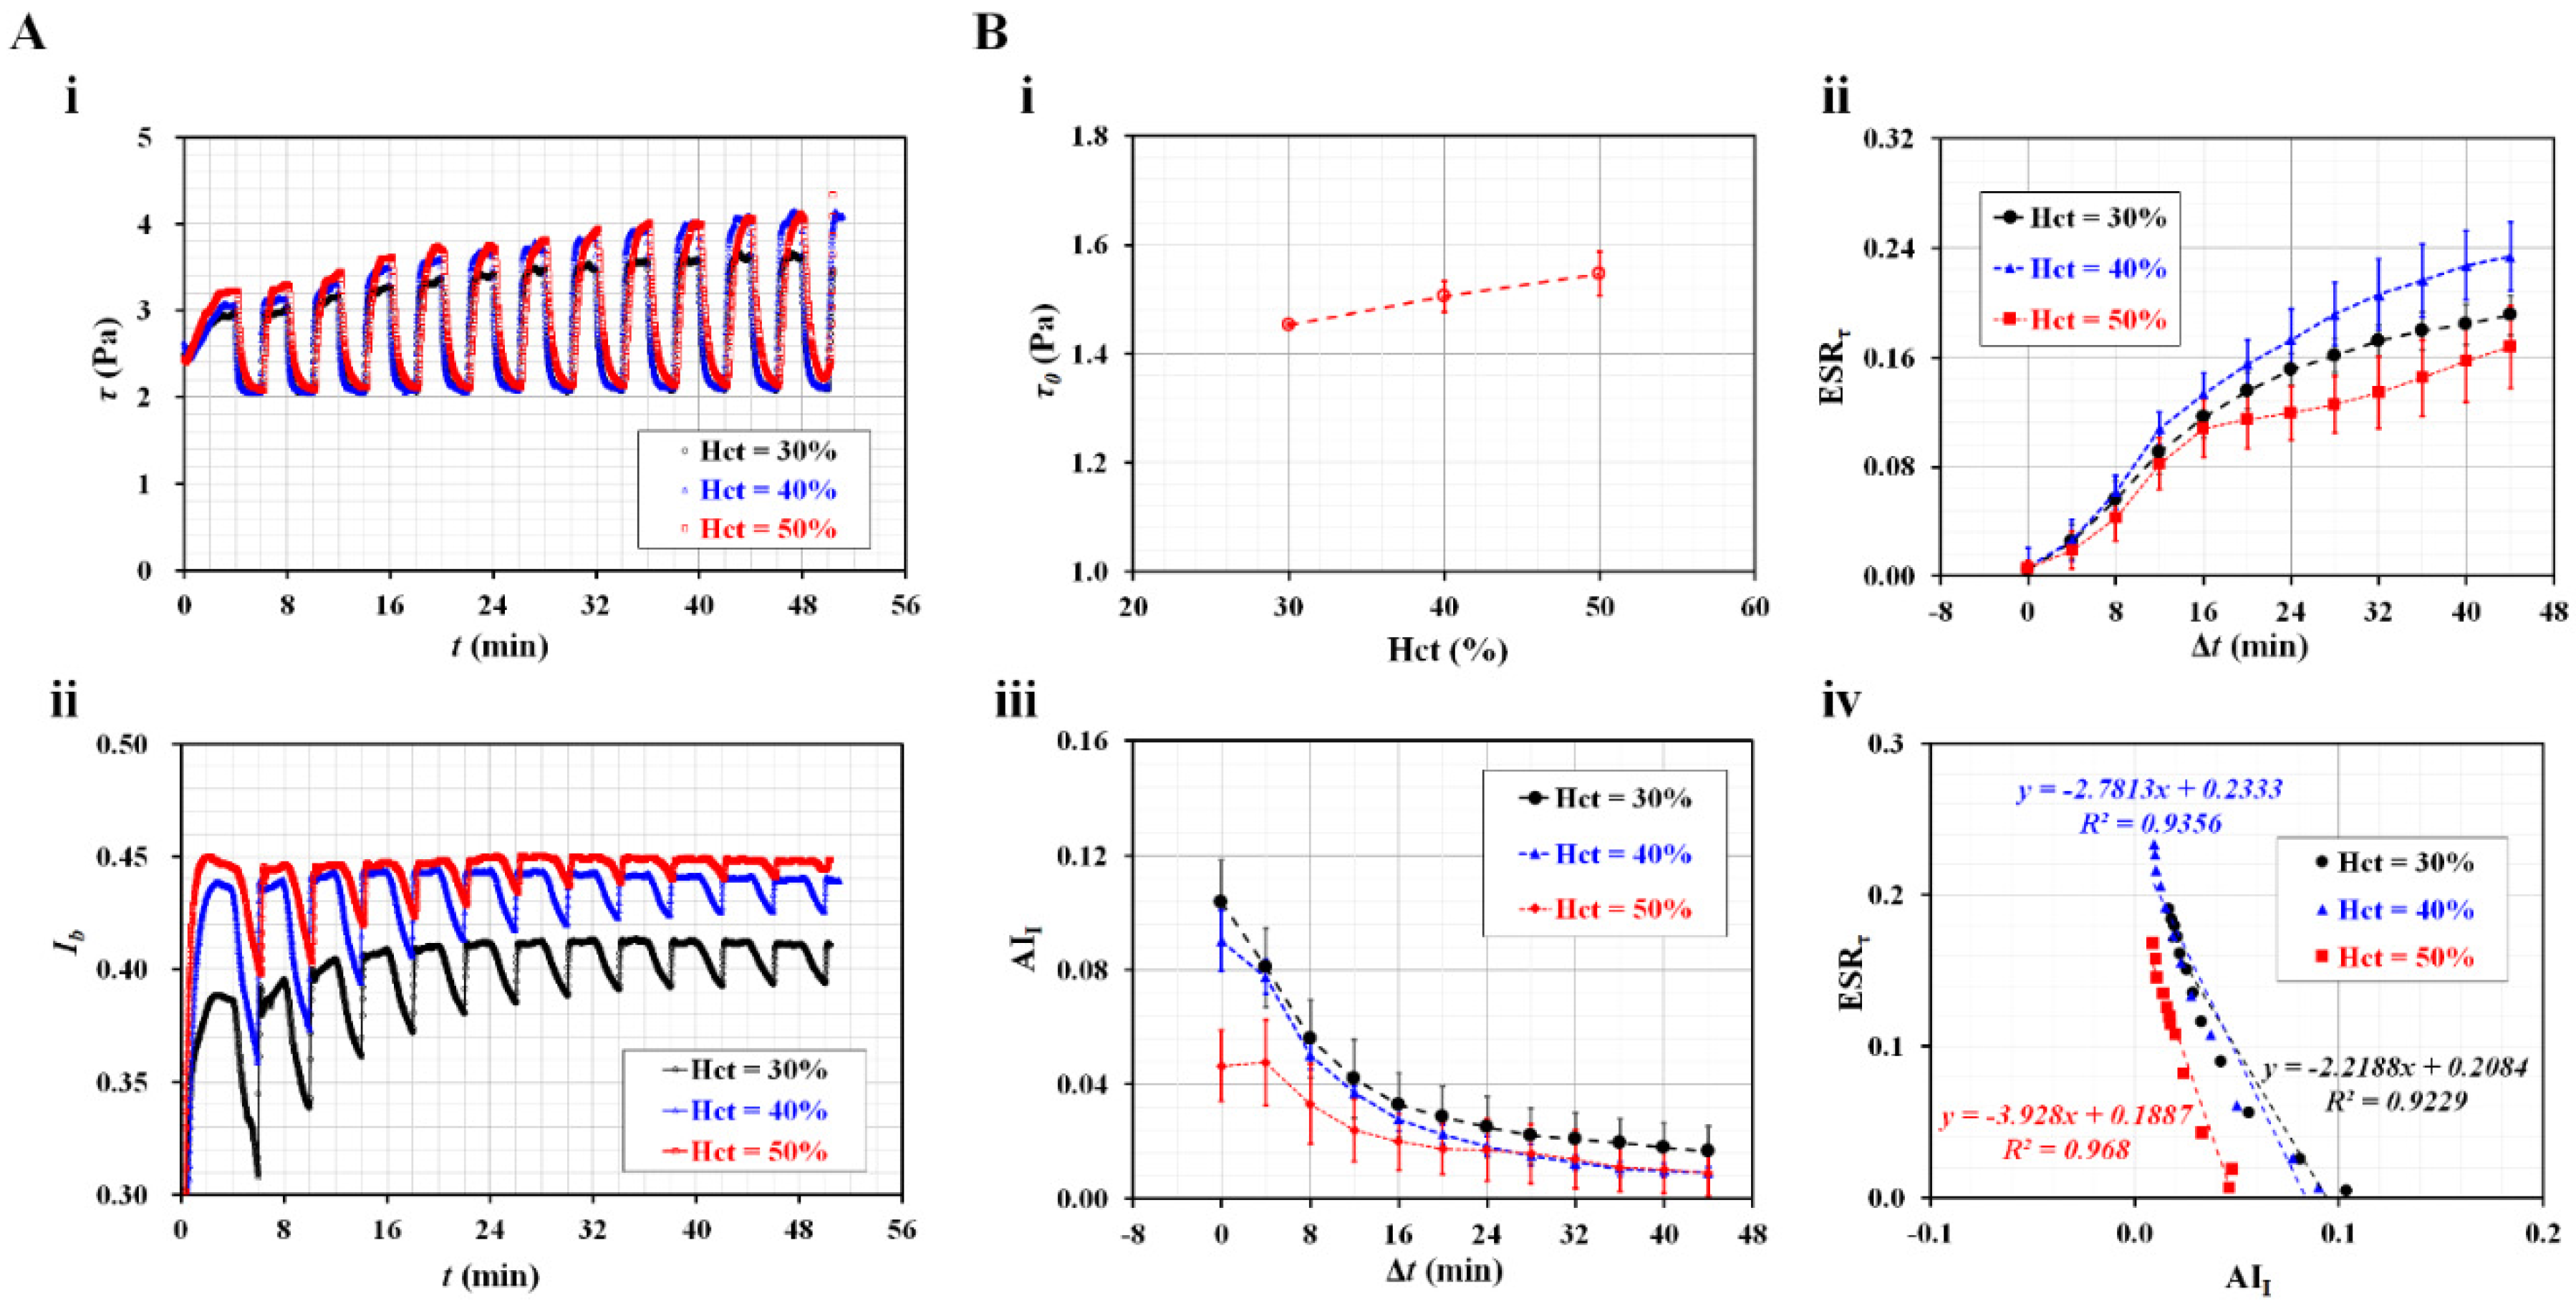
3.3. Contribution of Hematocrit to ESR in Driving Syringe
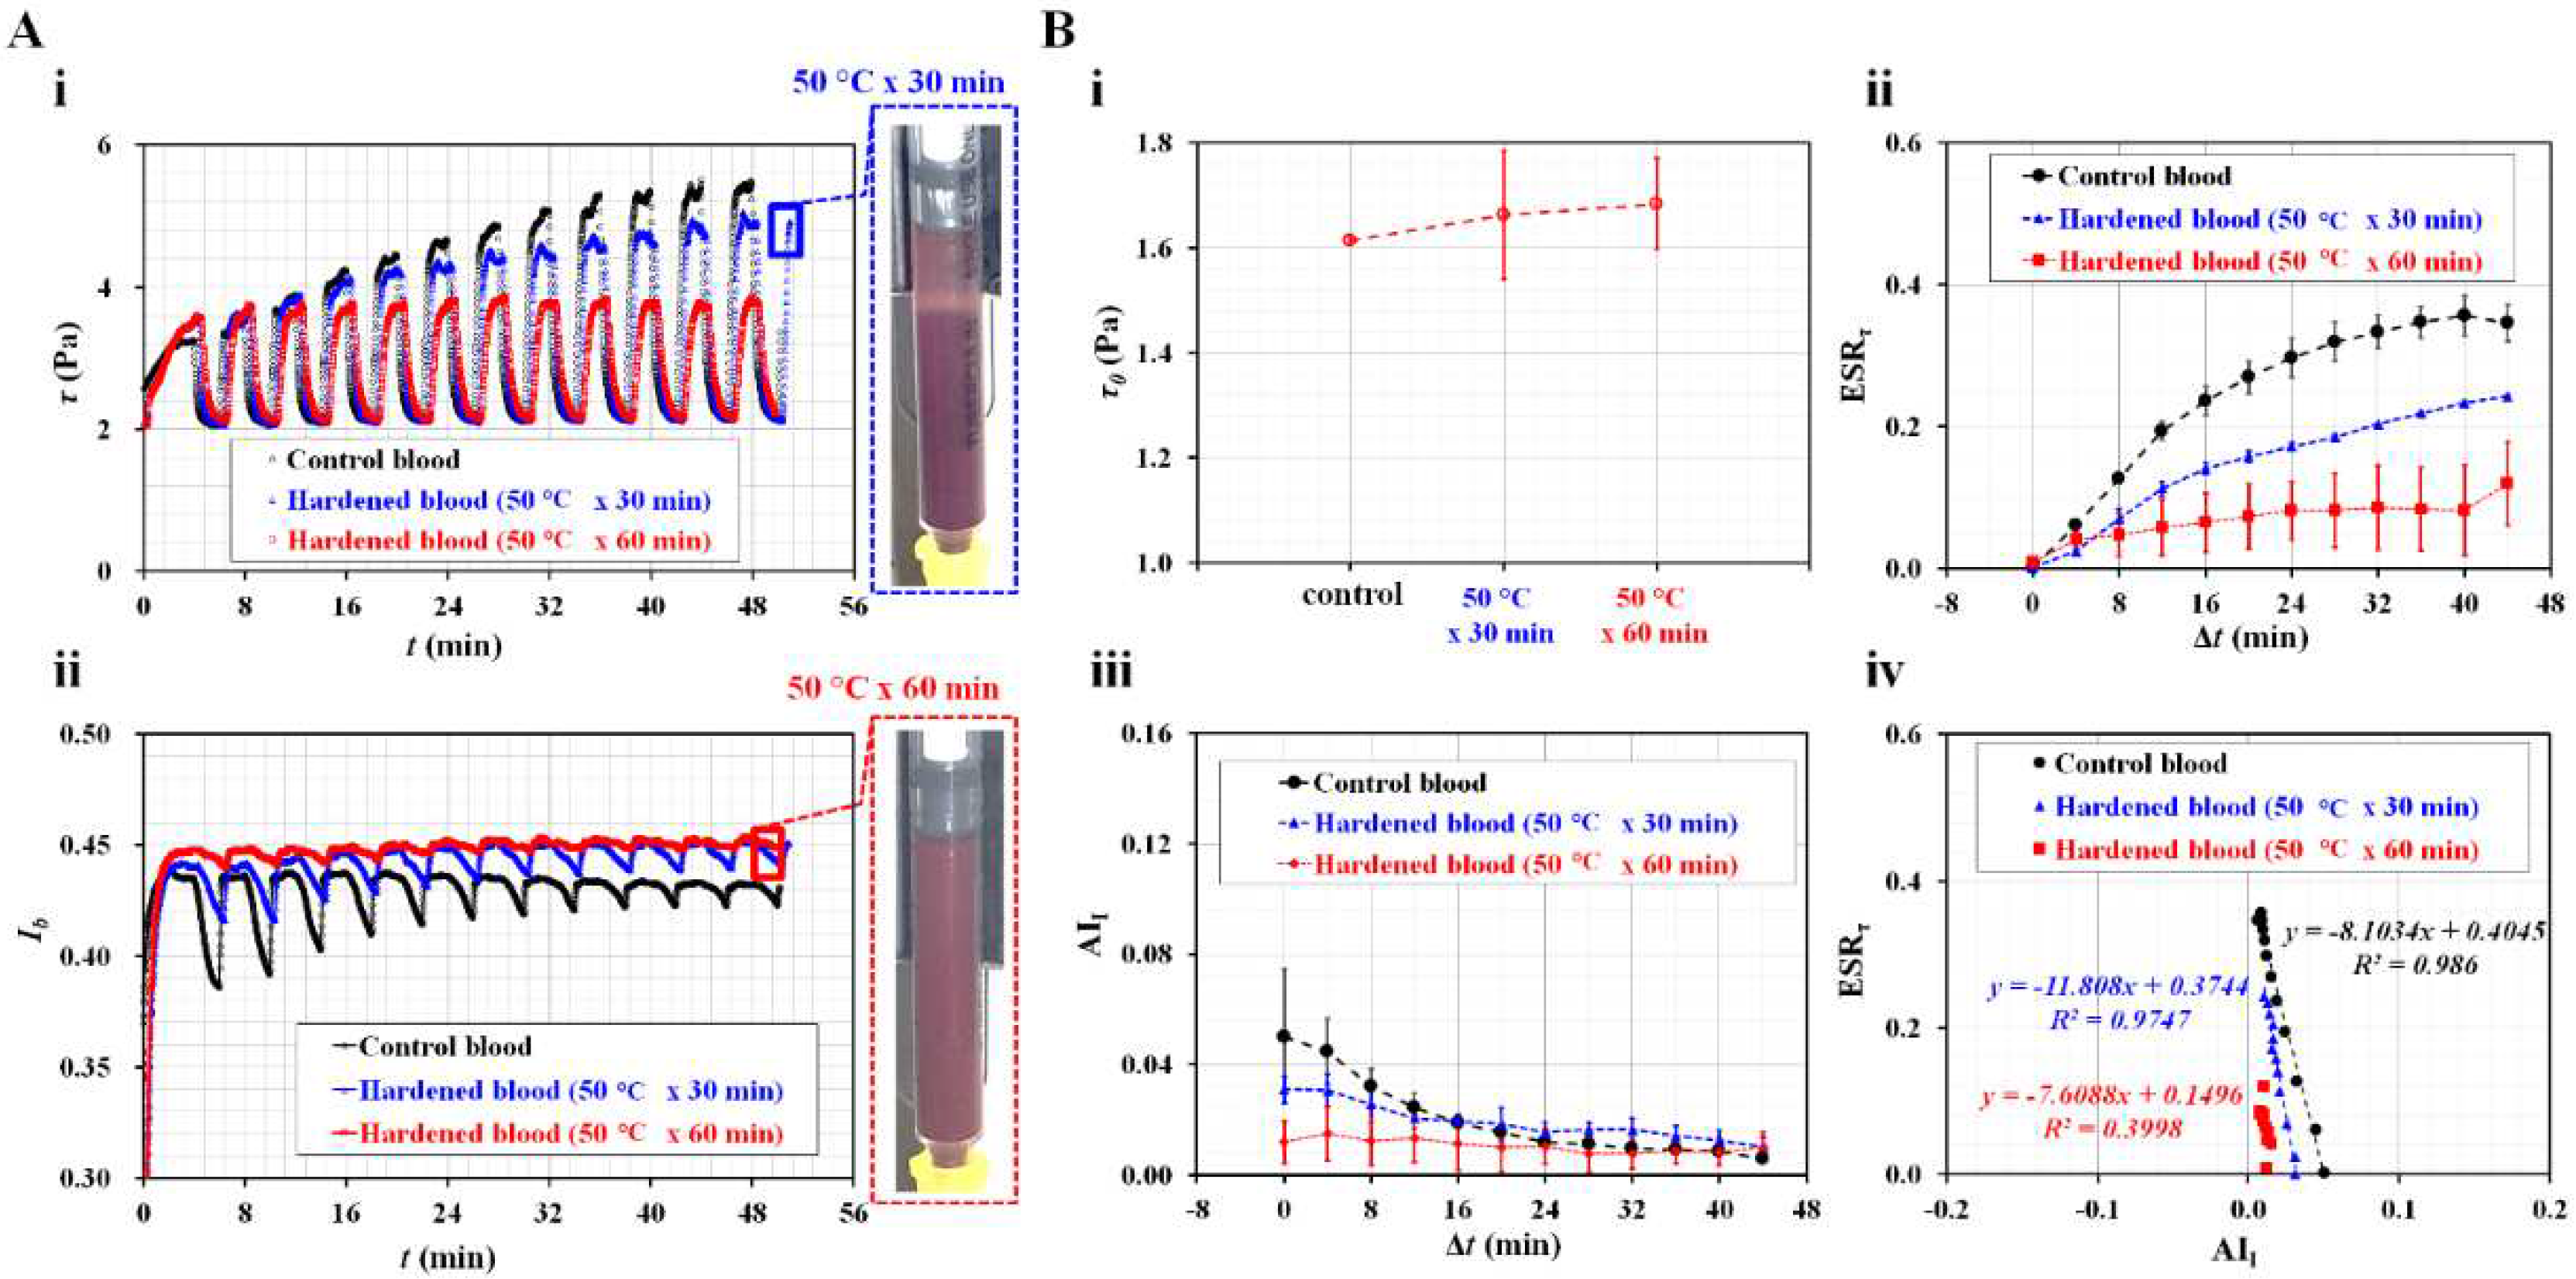
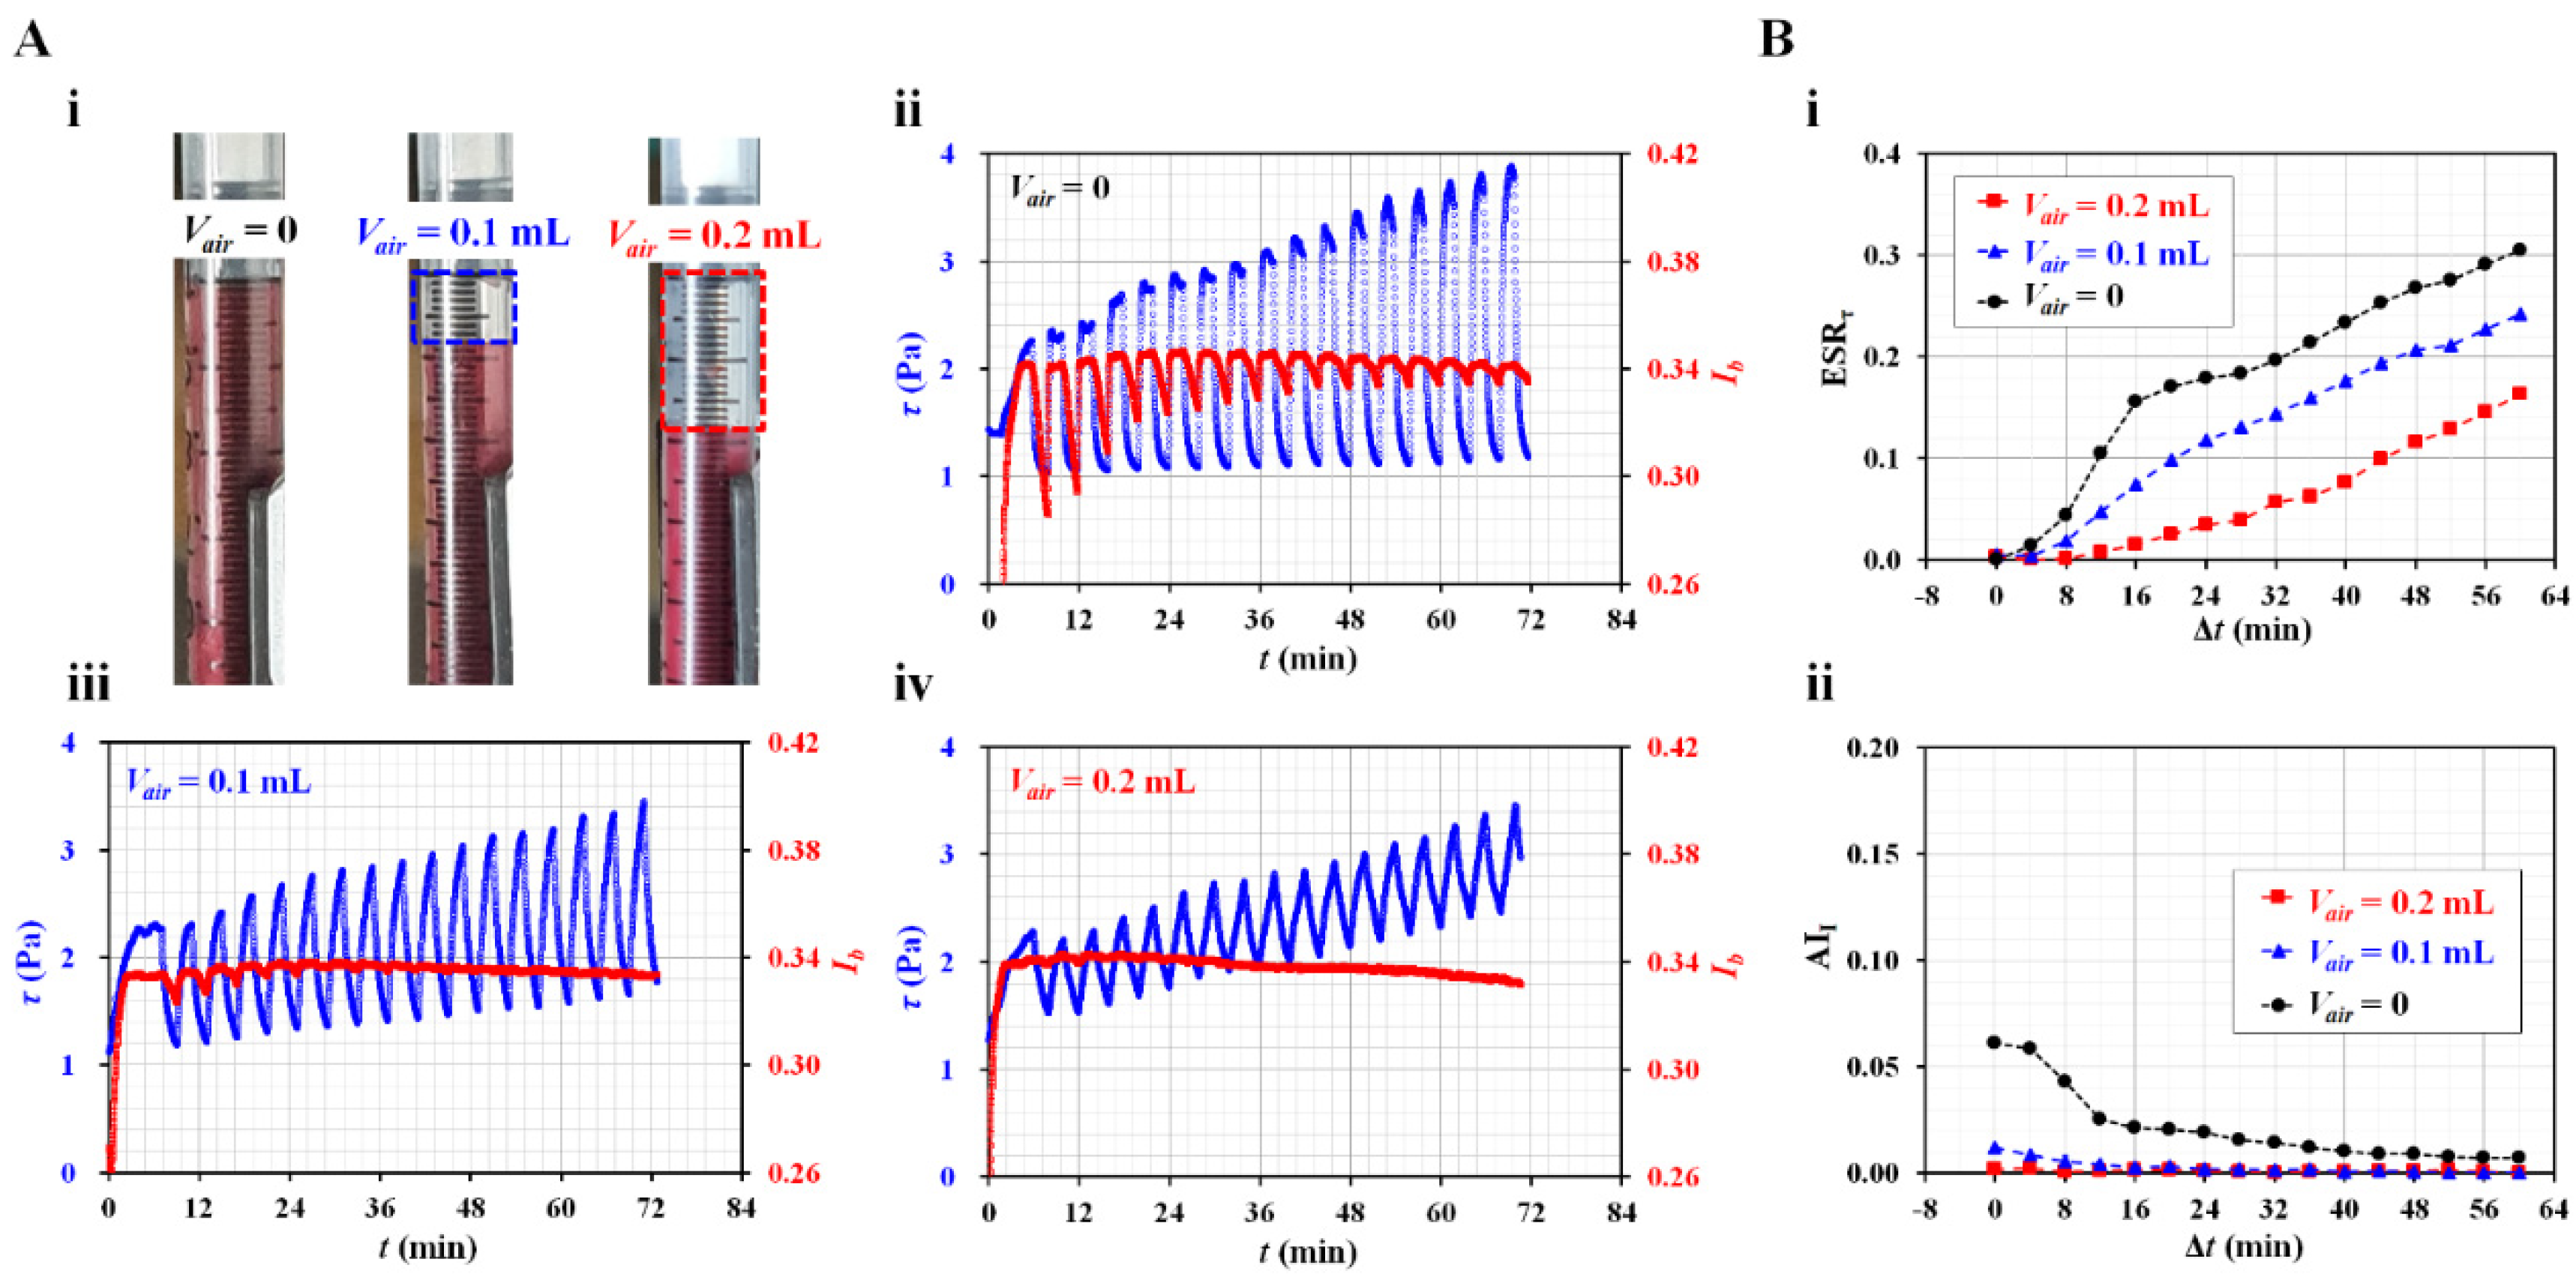
3.4. Contributions of Diluent to ESR in the Driving Syringe
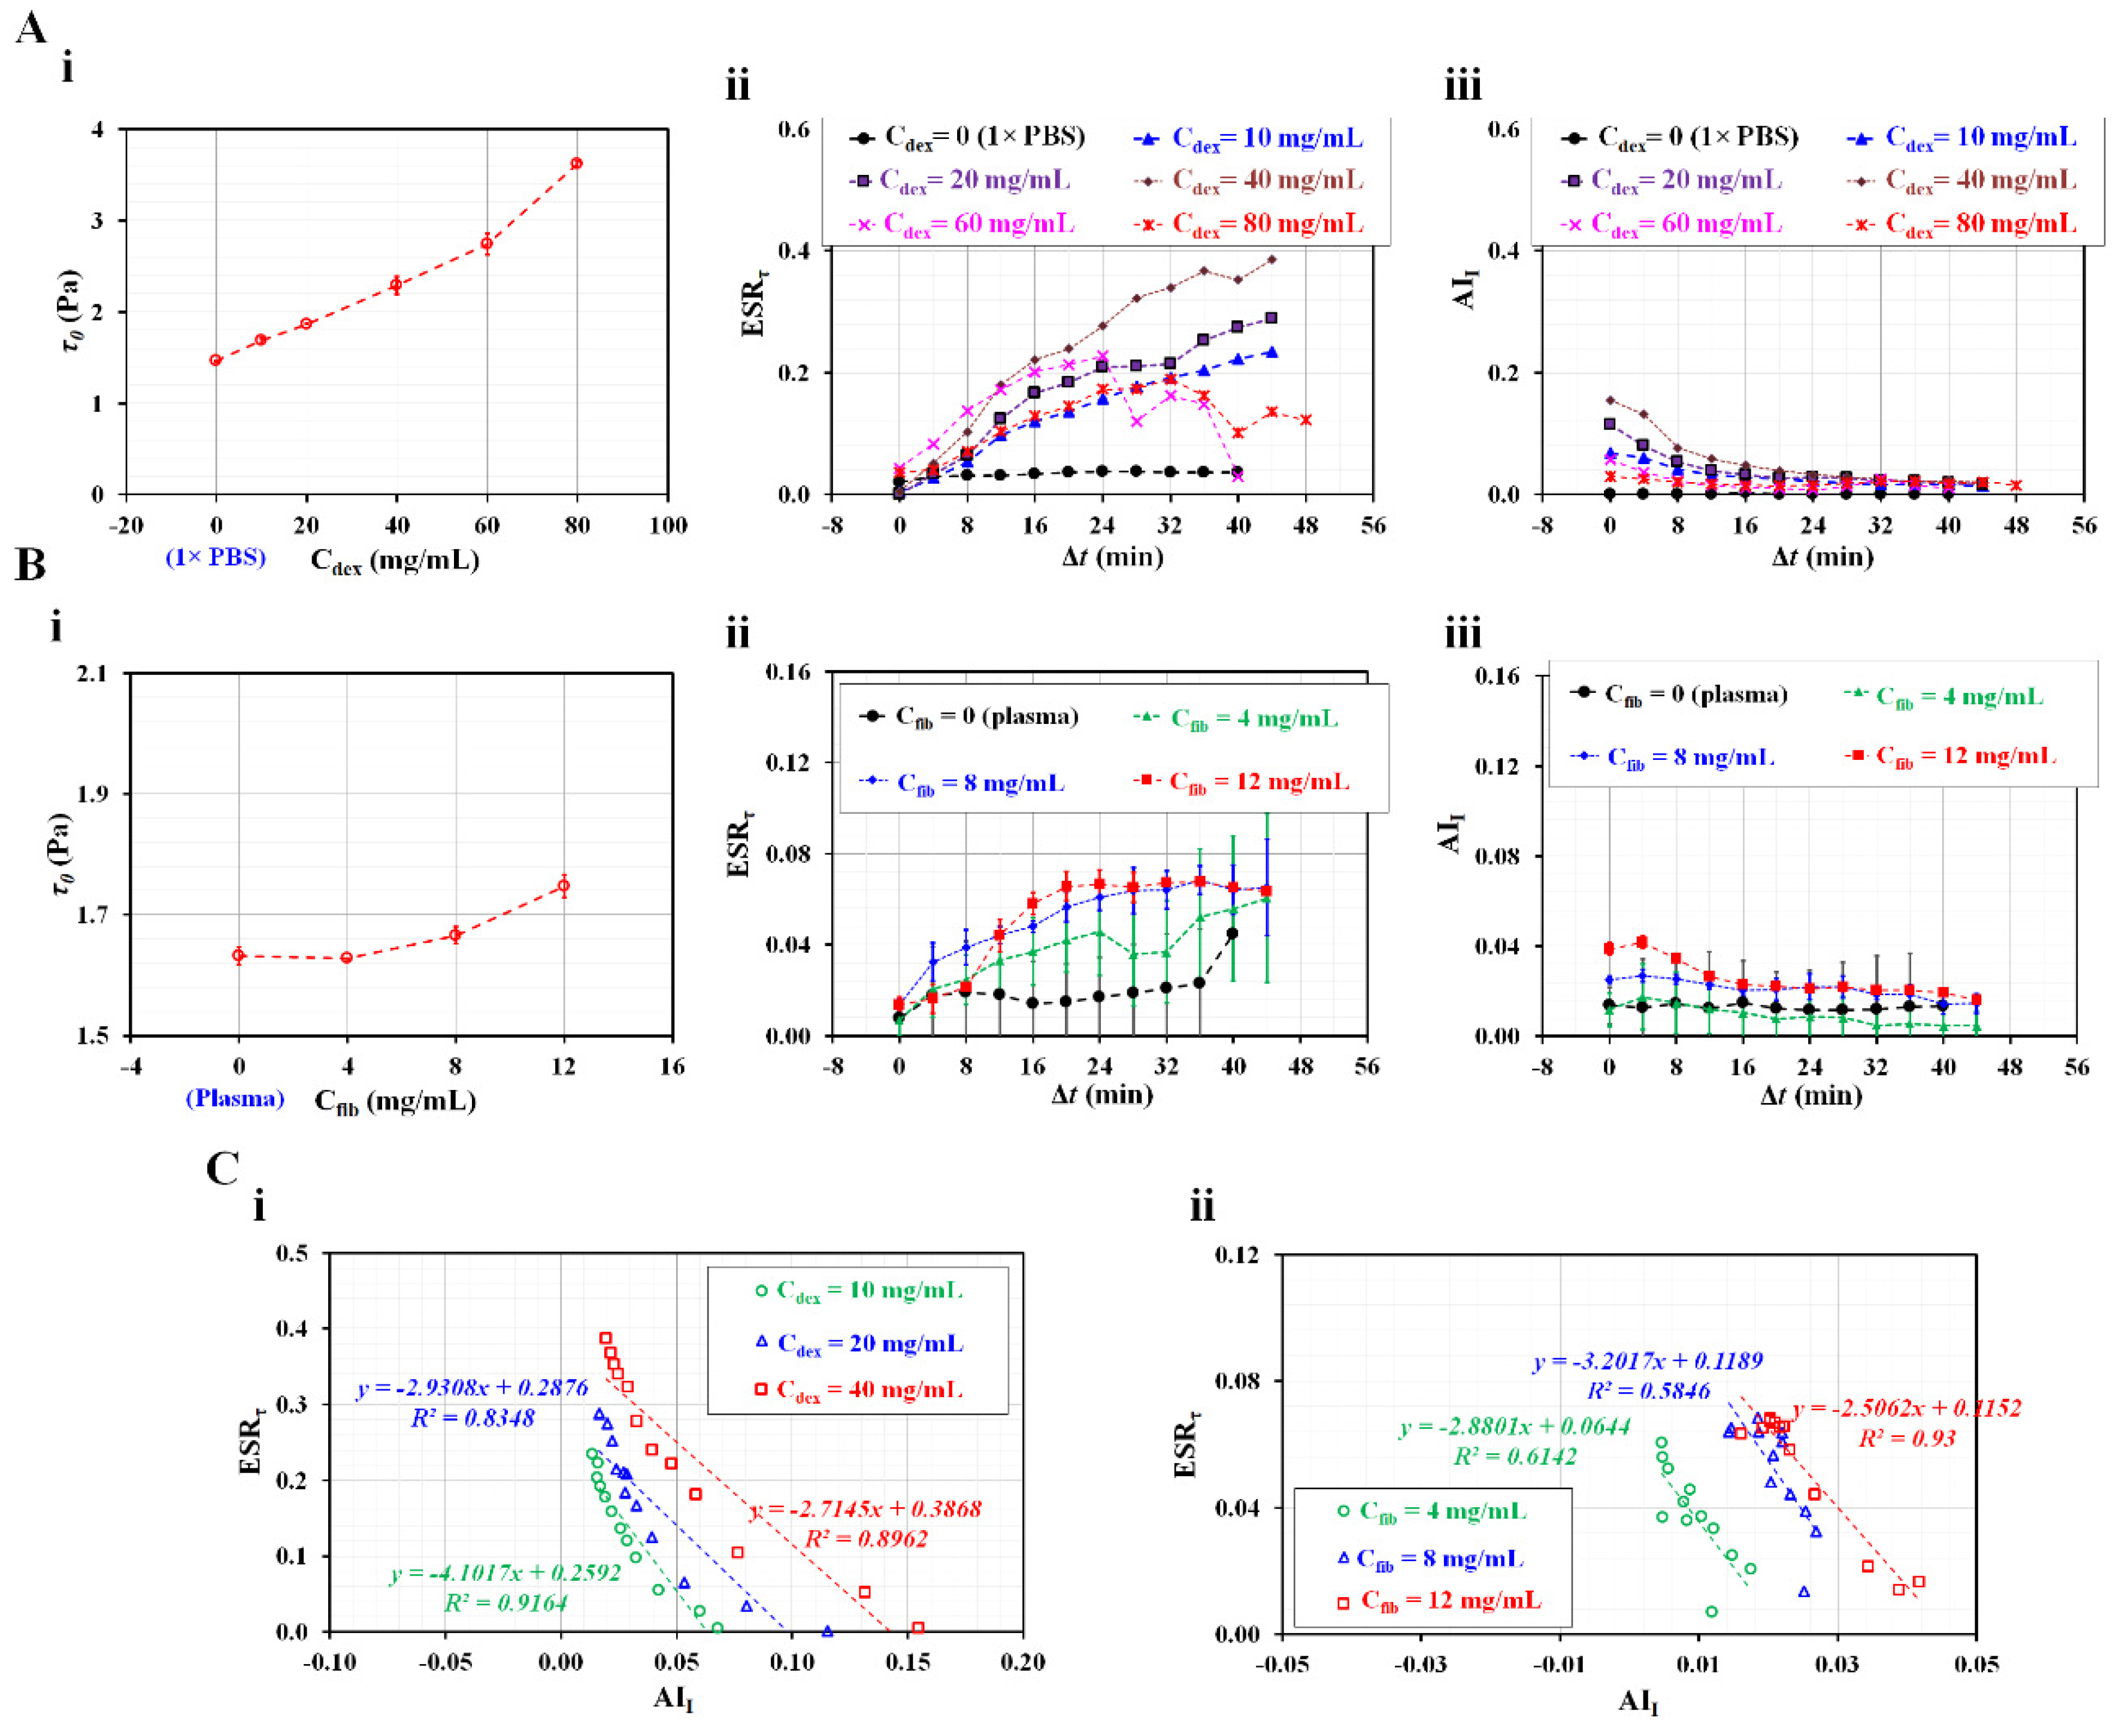
4. Conclusions
Acknowledgments
Conflicts of Interest
References
- Noguchi, H.; Gompper, G. Shape transitions of fluid vesicles and red blood cells in capillary flows. Proc. Natl. Acad. Sci. U. S. A. 2005, 102, 14159–14164. [Google Scholar] [CrossRef] [PubMed]
- Tomaiuolo, G. Biomechanical properties of red blood cells in health and disease towards microfluidics. Biomicrofluidics 2014, 8, 051501. [Google Scholar] [CrossRef] [PubMed]
- Barshtein, G. Biochemical and biophysical properties of red blood cells in disease. Biomolecules 2022, 12, 923. [Google Scholar] [CrossRef] [PubMed]
- Lutz, H.U.; Bogdanova, A. Mechanisms tagging senescent red blood cells for clearance in healthy humans. Front. Physiol. 2013, 4, 387. [Google Scholar] [CrossRef] [PubMed]
- Spencer, C.; Lip, G. Haemorheological factors in hypertension. J. Hum. Hypertens. 2000, 14, 291–293. [Google Scholar] [CrossRef]
- Lee, H.; Na, W.; Lee, S.B.; Ahn, C.W.; Moon, J.S.; Won, K.C.; Shin, S. Potential Diagnostic Hemorheological Indexes for Chronic Kidney Disease in Patients With Type 2 Diabetes. Front. Physiol. 2019, 10, 1062. [Google Scholar] [CrossRef]
- Agrawal, R.; Smart, T.; Nobre-Cardoso, J.; Richards, C.; Bhatnagar, R.; Tufail, A.; Shima, D.; Jones, P.H.; Pavesio, C. Assessment of red blood cell deformability in type 2 diabetes mellitus and diabetic retinopathy by dual optical tweezers stretching technique. Sci. Rep. 2016, 6, 15873. [Google Scholar] [CrossRef]
- Cho, Y.I.; Mooney, M.P.; Cho, D.J. Hemorheological disorders in diabetes mellitus. J. Diabetest Sci. Technol. 2008, 2. [Google Scholar] [CrossRef]
- Guo, Q.; Duffy, S.P.; Matthews, K.; Deng, X.; Santoso, A.T.; Islamzada, E.; Ma, d.H. Deformability based sorting of red blood cells improves diagnostic sensitivity for malaria caused by Plasmodium falciparum. Lab Chip 2016, 16, 645–654. [Google Scholar] [CrossRef]
- Olumuyiwa-Akeredolu, O.-o.O.; Soma, P.; Antoinette V., Buys; Debusho, L.K.; Pretorius, E. Characterizing pathology in erythrocytes using morphological and biophysical membrane properties: Relation to impaired hemorheology and cardiovascular function in rheumatoid arthritis. Biochim. Biophys. Acta-Biomembr 2017, 1859, 2381–2391. [Google Scholar] [CrossRef]
- Upadhyay, R.K. Emerging risk biomarkers in cardiovascular diseases and disorders. J. Liqids 2015, 2015, 971453. [Google Scholar] [CrossRef] [PubMed]
- Lowe, G.; Rumley, A.; Norrie, J.; Ford, I.; Shepherd, J.; Cobbe, S.; Macfarlane, P.; Packard, C. Blood rheology, cardiovascular risk factors, and cardiovascular disease: the west of scotland coronary prevention study. Thromb. Haemost. 2000, 84, 553–558. [Google Scholar] [PubMed]
- Islamzada, E.; Matthews, K.; Lamoureux, E.; Duffy, S.P.; Scott, M.D.; Ma, H. Blood unit segments accurately represent the biophysical properties of red blood cells in blood bags but not hemolysis. Transfusion 2022, 62, 448–456. [Google Scholar] [CrossRef]
- Jeon, H.-J.; Qureshi, M.M.; Lee, S.Y.; Chung, E. Optofluidic laser speckle image decorrelation analysis for the assessment of red blood cell storage. PLoS One 2019, 14, e0224036. [Google Scholar] [CrossRef] [PubMed]
- Xu, Z.; Zheng, Y.; Wang, X.; Shehata, N.; Wang, C.; Sun, Y. Stiffness increase of red blood cells during storage. Microsystems & Nanoengineering 2018, 4, 17103. [Google Scholar]
- Park, H.; Lee, S.; Ji, M.; Kim, K.; Son, Y.; Jang, S.; Park, Y. Measuring cell surface area and deformability of individual human red blood cells over blood storage using quantitative phase imaging. Sci. Rep. 2016, 6, 34257. [Google Scholar] [CrossRef]
- Huang, S.; Hou, H.W.; Kanias, T.; Sertorio, J.; Chen, H.; Sinchar, D.; Gladwin, M.; Han, J. Towards microfluidic-based depletion of stiff and fragile human red cells that accumulate during blood storage. Lab Chip 2015, 15, 448–458. [Google Scholar] [CrossRef]
- Daly, A.; Raval, J.S.; Waters, J.H.; Yazer, M.H.; Kameneva, M.V. Effect of blood bank storage on the rheological properties of male and female donor red blood cells. Clin. Hemorheolo. Microcir. 2014, 56, 337–345. [Google Scholar] [CrossRef]
- Cluitmans, J.C.A.; Chokkalingam, V.; Janssen, A.M.; Brock, R. ; S.Huck, W.T.; GielJ.C.G.M.Bosman. Alterations in red blood cell deformability during storage: a microfluidic approach. Biomed Res. Int. 2014, 2014, 764268. [Google Scholar]
- Yayan, J. Erythrocyte sedimentation rate as a marker for coronary heart disease. Vasc. Health Risk Manag. 2012, 8, 219–223. [Google Scholar] [CrossRef]
- Cho, Y.-I.; Cho, D.J. Hemorheology and Microvascular Disorders. Korean Cir. J. 2011, 41, 287–295. [Google Scholar] [CrossRef]
- Danesh, J.; Collins, R.; Peto, R.; Lowe, G.D.O. Haematocrit, viscosity, erythrocyte sedimentation rate: meta-analyses of prospective studies of coronary heart disease. Eur. Heart J. 2000, 21, 515–520. [Google Scholar] [CrossRef] [PubMed]
- Trejo-Soto, C.; Lázaro, G.R.; Pagonabarraga, I.; Hernández-Machado, A. Microfluidics approach to the mechanical properties of red blood cell membrane and their effect on blood rheology. Membranes 2022, 12, 217. [Google Scholar] [CrossRef] [PubMed]
- Kim, B.J.; Lee, Y.S.; Zhbanov, A.; Yang, S. A physiometer for simultaneous measurement of whole blood viscosity and its determinants: hematocrit and red blood cell deformability. Analyst 2019, 144, 3144–3157. [Google Scholar] [CrossRef] [PubMed]
- Hintermüller, M.A.; Offenzeller, C.; Jakoby, B. A microfluidic viscometer with capacitive readout using screen-printed electrodes. IEEE Sensors J. 2021, 21, 2565–2021. [Google Scholar] [CrossRef]
- Kang, H.; Jang, I.; Song, S.; Bae, S.-C. Development of a paper-based viscometer for blood plasma using colorimetric analysis. Anal. Chem. 2019, 91, 4868–4875. [Google Scholar] [CrossRef] [PubMed]
- Solomon, D.E.; Abdel-Raziq, A.; Vanapalli, S.A. A stress-controlled microfluidic shear viscometer based on smartphone imaging. Rheol. Acta 2016, 55, 727–738. [Google Scholar] [CrossRef]
- Link, A.; Franke, T. Acoustic erythrocytometer for mechanically probing cell viscoelasticity. Lab Chip 2020, 20, 1991–1998. [Google Scholar] [CrossRef]
- Stathoulopoulos, A.; Passos, A.; Balabani, S. Flows of healthy and hardened RBC suspensions through a micropillar array. Med. Eng. Phys. 2022, 107, 103874. [Google Scholar] [CrossRef]
- Piety, N.Z.; Stutz, J. Piety, N.Z.; Stutz, J.; NidaYilmaz; Xia, H.; TatsuroYoshida; Shevkoplyas, S.S. Microfuidic capillary networks are more sensitive than ektacytometry to the decline of red blood cell deformability induced by storage. Sci. Rep. 2021, 11, 604. [Google Scholar] [CrossRef]
- Urbanska, M.; Muñoz, H.E.; Bagnall, J.S.; Otto, O.; Manalis, S.R.; Carlo, D.D.; Guck, J. A comparison of microfluidic methods for high-throughput cell deformability measurements. Nat. Methods 2020, 17, 587–593. [Google Scholar] [CrossRef]
- Hyakutake, T.; Abe, H.; Miyoshi, Y.; Yasui, M.; Suzuki, R.; Tsurumaki, S.; Tsutsumi, Y. In vitro study on the partitioning of red blood cells using a microchannel network. Microvasc. Res. 2022, 140, 104281. [Google Scholar] [CrossRef] [PubMed]
- Zhbanov, A.; Yang, S. Electrochemical impedance spectroscopy of blood for sensitive detection of blood hematocrit, sedimentation and dielectric properties. Anal. Methods 2017, 9, 3302–3313. [Google Scholar] [CrossRef]
- Dasanna, A.K.; Darras, A.; John, T.; Gompper, G.; Kaestner, L.; Wagner, C.; Fedosov, D.A. Erythrocyte sedimentation: Effect of aggregation energy on gel structure during collapse. Phys. Rev. E 2022, 105, 024610. [Google Scholar] [CrossRef] [PubMed]
- Isiksacan, Z.; Erel, O.; Elbuken, C. A portable microfluidic system for rapid measurement of the erythrocyte sedimentation rate. Lab Chip 2016, 16, 4682–4690. [Google Scholar] [CrossRef]
- Pasias, D.; Passos, A.; Constantinides, G.; Balabani, S.; Kaliviotis, E. Surface tension driven flow of blood in a rectangular microfluidic channel: Effect of erythrocyte aggregation. Phys. Fluids 2020, 32, 071903. [Google Scholar] [CrossRef]
- Baskurt, O.K.; Uyuklu, M.; Meiselman, H.J. Time Course of Electrical Impedance During Red Blood Cell Aggregation in a Glass Tube: Comparison With Light Transmittance. IEEE Trans. Biomed. Eng. 2010, 57, 969–978. [Google Scholar] [CrossRef]
- Antonova, N.; Riha, P.; Ivanov, I. Time dependent variation of human blood conductivity as a method for an estimation of RBC aggregation. Clin. Hemorheolo. Microcir. 2008, 39, 69–78. [Google Scholar] [CrossRef]
- Zhbanov, A.; Yang, S. Effects of aggregation on blood sedimentation and conductivity. PLoS One 2015, 10, e0129337. [Google Scholar] [CrossRef]
- Kang, Y.J.; Lee, S.-J. In vitro and ex vivo measurement of the biophysical properties of blood using microfluidic platforms and animal models. Analyst 2018, 143, 2723–2749. [Google Scholar] [CrossRef]
- Kang, Y.J.; Yang, S. Fluidic low pass filter for hydrodynamic flow stabilization in microfluidic environments. Lab Chip 2012, 12, 1881–1889. [Google Scholar] [CrossRef]
- Lim, H.-J.; Lee, Y.-J.; Nam, J.-H.; Chung, S.; Shin, S. Temperature-dependent threshold shear stress of red blood cell aggregation. J. Biomech. 2010, 43, 546–550. [Google Scholar] [CrossRef] [PubMed]
- Shin, S.; Hou, J.X.; Suh, J.-S. Measurement of cell aggregation characteristics by analysis of laser-backscattering in a microfluidic rheometry. Korea-Aust. Rheol. J. 2007, 19, 61–66. [Google Scholar]
- Nam, J.-H.; Xue, S.; Lim, H.; Shin, S. Study of erythrocyte aggregation at pulsatile flow conditions with backscattering analysis. Clin. Hemorheol. Microcirc. 2012, 50, 257–266. [Google Scholar] [CrossRef]
- Namgung, B.; Lee, T.; Tan, J.K.S.; Poh, D.K.H.; Park, S.; Chng, K.Z.; Agrawal, R.; Park, S.-Y.; Leo, H.L.; Kim, S. Vibration motor-integrated low-cost, miniaturized system for rapid quantification of red blood cell aggregation. Lab Chip 2020, 20, 3930–3937. [Google Scholar] [CrossRef] [PubMed]
- Lapić, I.; Padoan, A.; Bozzato, D.; Plebani, M. Erythrocyte sedimentation rate and C-reactive protein in acute inflammation. Am. J. Clin. Pathol. 2020, 153, 14–29. [Google Scholar] [CrossRef] [PubMed]
- Kang, Y.J. Microfluidic-based measurement of RBC aggregation and the ESR using a driving syringe system. Anal. Methods 2018, 10, 1805–1816. [Google Scholar] [CrossRef]
- Kang, Y.J. Contributions of red blood cell sedimentation in a driving syringe to blood flow in capillary channels. Micromachines 2022, 13, 909. [Google Scholar] [CrossRef]
- Kang, Y.J. Sequential quantification of blood and diluent using red cell sedimentation-based separation and pressure-induced work in a microfluidic channel. Anal. Methods 2022, 14, 1194–1207. [Google Scholar] [CrossRef]
- Kang, Y.J. Microfluidic-based measurement method of red blood cell aggregation under hematocrit variations. Sensors 2017, 17, 2037. [Google Scholar] [CrossRef]
- Kang, Y.J. Red Blood Cell Sedimentation Index Using Shear Stress of Blood Flow in Microfluidic Channel. Biosensors 2022, 12, 547. [Google Scholar] [CrossRef]
- Kim, G.; Jeong, S.; Kang, Y.J. Ultrasound standing wave-based cell-to-liquid separation for measuring viscosity and aggregation of blood sample. Sensors 2020, 20, 2284. [Google Scholar] [CrossRef] [PubMed]
- Otsu, N. A threshold selection method from gray-level histograms. IEEE Trans. Syst. Man. Cybern. 1979, 9, 62–66. [Google Scholar] [CrossRef]
- Kang, Y.J. Continuous and simultaneous measurement of the biophysical properties of blood in a microfluidic environment. Analyst 2016, 141, 6583–6597. [Google Scholar] [CrossRef] [PubMed]
- Kang, Y.J. Quantitative monitoring of dynamic blood flows using coflowing laminar streams in a sensorless approach. App. Sci.-Basel 2021, 11, 7260. [Google Scholar] [CrossRef]
- Cheng, N.-S. Formula for the viscosity of a glycerol−water mixture. Ind. Eng. Chem. Res. 2008, 47, 3285–3288. [Google Scholar] [CrossRef]
- Kang, Y.J. Experimental investigation of air compliance effect on measurement of mechanical properties of blood sample flowing in microfluidic channels. Micromachines 2020, 11, 460. [Google Scholar] [CrossRef]
- Lim, H.-J.; Nam, J.-H.; Lee, B.-K.; Suh, J.-S.; Shin, S. Alteration of red blood cell aggregation during blood storage. Korea-Aust. Rheol. J. 2011, 23, 67–70. [Google Scholar] [CrossRef]
- Shin, S.; Nam, J.-H.; Hou, J.-X.; Suh, J.-S. A transient microfluidic approach to the investigation of erythrocyte aggregation: The threshold shear-stress for erythrocyte disaggregation. Clin. Hemorheol. Microcirc. 2009, 42, 117–125. [Google Scholar] [CrossRef]
- Hong, H.; Song, J.M.; Yeom, E. Micro-vibrational erythrocyte sedimentation rate (ESR) for sensitive measurement of erythrocyte aggregation. J. Vis. 2021, 24, 749–760. [Google Scholar] [CrossRef]
- Kang, Y.J. A disposable blood-on-a-chip for simultaneous measurement of multiple biophysical properties. Micromachines 2018, 9, 475. [Google Scholar] [CrossRef]
- Zhou, Y.; Liu, J.; Yan, J.; Zhu, T.; Guo, S.; Li, S.; Li, T. Standing air bubble-based micro-hydraulic capacitors for flow stabilization in syringe pump-driven systems. Micromachines 2020, 11, 396. [Google Scholar] [CrossRef] [PubMed]
- Yeom, E.; Lee, S.-J. Microfluidic-based speckle analysis for sensitive measurement of erythrocyte aggregation: A comparison of four methods for detection of elevated erythrocyte aggregation in diabetic rat blood. Biomicrofluidics 2015, 9, 024110. [Google Scholar] [CrossRef] [PubMed]
- Kang, Y.J.; Ha, Y.-R.; Lee, S.-J. Microfluidic-based measurement of erythrocyte sedimentation rate for biophysical assessment of blood in an in vivo malaria-infected mouse. Biomicrofluidics 2014, 8, 044114. [Google Scholar] [CrossRef] [PubMed]
- Kang, Y.J. Microfluidic-based effective monitoring of bloods by measuring RBC aggregation and blood viscosity under stepwise varying shear rates. Korea-Aust. Rheol. J. 2020, 32, 15–27. [Google Scholar] [CrossRef]
- Tomaiuolo, G.; Carciati, A.; Caserta, S.; Guido, S. Blood linear viscoelasticity by small amplitude oscillatory flow. Rheol. Acta 2016, 55, 485–495. [Google Scholar] [CrossRef]
- Kang, Y.J.; Lee, S.-J. Blood viscoelasticity measurement using steady and transient flow controls of blood in a microfluidic analogue of Wheastone-bridge channel. Biomicrofluidics 2013, 7, 054122. [Google Scholar] [CrossRef]
- lerche, D.; Baumler, H. Moderate heat treatment of only red blood cells (RBC) slows down the rate of RBC-RBC aggregation in plasma. Biorheology 1984, 21, 393–403. [Google Scholar] [CrossRef]
- Lee, K.; Kinnunen, M.; Khokhlova, M.D.; Lyubin, E.V.; Priezzhev, A.V.; Meglinski, I.; Fedyanin, A.A. Optical tweezers study of red blood cell aggregation and disaggregation in plasma and protein solutions. J. Biomed. Opt. 2016, 21, 035001. [Google Scholar] [CrossRef]
- Ermolinskiy, P.; Lugovtsov, A.; Yaya, F.; Lee, K.; Kaestner, L. ; ChristianWagner; Priezzhev, A. Effect of red blood cell aging in vivo on their aggregation properties in vitro: measurements with laser tweezers. App. Sci.-Basel 2020, 10, 7581. [Google Scholar]
- Reinhart, W.H.; Piety, N.Z.; Shevkoplyas, S.S. Influence of red blood cell aggregation on perfusion of an artificial microvascular network. Microcirculation 2017, 24, e12317. [Google Scholar] [CrossRef]
- Sherwood, J.M.; Dusting, J.; Kaliviotis, E.; Balabani, S. The effect of red blood cell aggregation on velocity and cell-depleted layer characteristics of blood in a bifurcating microchannel. Biomicrofluidics 2012, 6, 024119. [Google Scholar] [CrossRef]
- Neu, B.; Wenby, R.; Meiselman, H.J. Effects of dextran molecular weight on red blood cell aggregation. Biophys. J. 2008, 95, 3059–3065. [Google Scholar] [CrossRef] [PubMed]
- Xue, S.; Lee, B.-K.; Shin, S. Disaggregating shear stress: The roles of cell deformability and fibrinogen concentration. Clin. Hemorheol. Microcirc. 2013, 55, 231–240. [Google Scholar] [CrossRef] [PubMed]
- Baskur, O.K.; Meiselman, H.J. Erythrocyte aggregation: Basic aspects and clinical importance. Clin. Hemorheol. Microcirc. 2013, 53, 23–37. [Google Scholar] [CrossRef] [PubMed]
- Lominadze, D.; Schuschke, D.A.; Joshua, I.G.; Dean, W.L. Increased ability of erythrocytes to aggregate in spontaneously hypertensive rats. Clin. Exp. Hypertens. 2002, 24. [Google Scholar] [CrossRef] [PubMed]
Disclaimer/Publisher’s Note: The statements, opinions and data contained in all publications are solely those of the individual author(s) and contributor(s) and not of MDPI and/or the editor(s). MDPI and/or the editor(s) disclaim responsibility for any injury to people or property resulting from any ideas, methods, instructions or products referred to in the content. |
© 2023 by the authors. Licensee MDPI, Basel, Switzerland. This article is an open access article distributed under the terms and conditions of the Creative Commons Attribution (CC BY) license (http://creativecommons.org/licenses/by/4.0/).


