Preprint
Article

Time-Dependent Rheological Properties of Cemented Aeolian Sand-Fly Ash Backfill Vary with the Ratio of Aeolian Sand / Coal Gangue and Plasticizer

Altmetrics

Downloads

142

Views

31

Comments

1

A peer-reviewed article of this preprint also exists.

Submitted:

06 July 2023

Posted:

06 July 2023

You are already at the latest version

Alerts
Abstract
The use of cemented aeolian sand-fly ash backfill (CAFB) material to fill the mining area to improve the surface subsidence damage caused by underground coal mining is in the development stage. Their performance with large overflow water and strength loss is not well understood. Few research has been conducted to understand the effects of aeolian sand and coal gangue on the rheological properties of CAFB with plasticizers. Therefore, the aim of this study is to investigate the effects of a plasticizer on the rheological properties, specifically yield stress and viscosity, of CAFB prepared with aeolian sand and coal gangue. CAFB mixes containing 0%, 0.05%, and 0.1% plasticizer were prepared, and yield stress and viscosity were determined at different time intervals over the period. Additional tests, such as thermal analysis and zeta potential analysis were also conducted. It was found that the rheological properties of CAFB is the comprehensive manifestation of the composite characteristics of various models. Reasonable particle size distribution and less amount of plasticizer can ensure the stability of slurry structure, reduce the slurry settlement and the risk of pipe blocking. The findings of this study will be beneficial in the design and production of CAFB material.
Keywords: 
Subject: Environmental and Earth Sciences  -   Waste Management and Disposal

1. Introduction

In China, the use of cemented aeolian sand-fly ash backfill (CAFB) material to improve the surface subsidence and environmental damage caused by coal mining is in its embryonic stage[1,2,3,4,5,6,7,8]. Yushen mining area, located in the hinterland of the famous Yushenfu-Dongsheng coalfield, known as one of the world’s seven big coalfield, has hundreds of coal mines of various sizes distributed in the Yushen mining area, which are located in the Maowusu Desert and have harsh geological conditions. It can reduce the damage to the surface environment caused by large-scale coal mining, which conveys the large amount of covering aeolian sand on the surface to the mining area through pipeline pressurized[9,10,11,12,13]. CAFB material is usually considered to be a high-density, non-segregating mixture containing 68%-75% solids. Hydraulic binder such as cement, in amounts of 8-12% of the total CAFB material, is an integral part of any CAFB material, which gradually adds additional bonding and mechanical strength during the maintenance process, where increasing the solids content of the CAFB mix is more economical than increasing the amount of binder, which accounts for 75-80% of the cost of the filling operation[14,15]. Typically, fresh CAFB is transported by gravity or by a pipeline pumping system to the downhole mining area. However, in the process of transportation, CAFB with very low water/ash ratio (W/A) may cause huge frictional resistance and pipeline blockage due to its rheological properties changing with the hydration age. The use of a single aggregate aeolian sand in the CAFB slurry will cause large bleeding in the underground mining aera, worsening the underground operating environment, and the loss of the cement, fly ash and water mixed slurry will be reduced the strength of the filling body, the author innovatively proposes the high concentration filling cementing material CAFB, which is prepared by mixing aeolian sand, coal gangue, cement, fly ash and water in a certain ratio, studying the influence of coal gangue dosage and hydration time on the rheology of CAFB slurry, optimizing the material ratio, reducing the frictional resistance of slurry in the pipe, realizing efficient transportation, and improving the underground operating environment and improving the strength of the filling body[1,2,3,4,16]. The yield stress and viscosity are the key rheological parameters for evaluating the CAFB material transport capacity in the design of pipeline reticulation systems. The yield stress is typically realized as the effect of conditions of mutual attraction between individual particles, which can aggregate to form suspensions, which interact to form a continuous three-dimensional mesh structure extending throughout the volume. On this basis, the yield stress is related to the strength of the coherent network structure as the force needed to break down the structure, especially the network bonds or the breaking of the connecting bonds of the structural flow units. There have been many studies of the analysis of colloidal stability and solid particle surface properties under yield stress conditions. Many experimental methods have also been used to study the effect of particle concentration, size, particle size distribution, shape, surface activity, etc. on the yield stress values of various suspension systems[17,18,19,20,21,22]. The yield stress is the critical shear stress that causes irreversible plastic deformation and allows the fluid to flow in the pipe. The yield stress must be in the optimum range to allow laminar transport of CAFB materials in the pipeline, (velocity range 0.1 m/s to 1.5 m/s) without solids settling. The viscosity is the frictional resistance of two layers of concentrated fluid in the flow state. It is well known that the rheology of CAFB is influenced by various factors such as solid concentration, cement type and its dosage, chemical additives and their dosage, particle size distribution, water chemistry and temperature. In addition, the microstructure of CAFB gradually changes during its transport due to the evolution of cement hydration products. CAFB is considered as a non-Newtonian fluid because the shear stress at any point along the pipe cross-section during flow depends on the shear rate and time; therefore, the time-dependent rheology of CAFB is an issue of interest[23,24,25]. The water-reducing effect of plasticizer is mainly realized through the surface-active role of plasticizer. Plasticizer in the solid-liquid interface to produce adsorption, reduce surface tension, improve the surface wetting state of cement particles, fly ash particles and gangue particles, so that the mixture dispersion of thermodynamic instability is reduced, so as to obtain relative stability[26,27,28,29,30]. Plasticizer produces directional adsorption on the surface between the particles, so that the surface of the particles with the same charge, electrostatic repulsion, which destroys the flocculation-like structure between the particles, so that the particles are dispersed. For mines filled with CAFB material, the key to successful pipeline transport lies in the rheological properties of the filled slurry, which is ultimately determined by the particle gradation. A reasonable material gradation should be selected to ensure uniform gradation, slow down the settling of aggregate particles to block the pipeline, and ensure that the slurry has good fluidity and stability with low overflow water over a period. In order to study the influence of the particle size gradation and hydration time of aeolian sand and coal gangue aggregate in different ratios on the rheological characteristics of the filling slurry, this paper elaborates the intrinsic connection between the rheological indicators of the filling slurry and the particle gradation parameters through rheological tests, so as to provide reference for the ratio test of aggregate, crushing and screening as well as the research of long-distance pumping and pressure conveying technology[1,15,16,31,32].

2. Materials and Methods

2.1. Rheological parameters analysis

Yield stress and viscosity are the two basic parameters to characterize the rheology of a slurry. The yield stress can be divided into dynamic yield stress and static yield stress. The mass fraction of the slurry with yield stress is related to the content of fine particles, the smaller the particle size or the higher the content, the lower the mass fraction of the slurry with yield stress. Viscosity reflects the size of the internal friction angle of the slurry flow itself, which is the macroscopic expression of the microscopic action of fluid molecules. The slurry viscosity is related to the particle size, distribution, mass fraction of solid particles, energy exchange between solid and liquid particles and other factors and related to the hydration reaction of cement and the generation rate of products of volcanic ash reaction[33].

2.2. The rheological model

The flow state of the material in different positions in the pipe can be roughly divided into “structural flow”, “laminar flow” and “turbulent flow” according to the flow velocity, and the transmission characteristics are different from the two-phase flow movement law. When the mass fraction of slurry reaches a certain level, the slurry becomes very viscous and the transmission characteristics change greatly along the pipeline, and the slurry moves in a “plunger” shape. Domestic and foreign researchers have confirmed that the Reynolds number of pipeline transporting high mass fraction (paste) slurry is much lower than the Reynolds number from laminar flow to turbulent flow, and the rheological model of high mass fraction slurry is suitable to use H-B model, whose rheological characteristic curve is shown in Figure 1:
τ = τ 0 + μ γ n
where τ is the shear stress, Pa; γ is the shear rate, s-1, μ is the viscosity, Pa·s; τ 0 is the initial yield stress, Pa; n is the fluidity index. When n = 1, τ 0   = 0 , it is a Newtonian body; when n = 1, τ 0 > 0, it is the Bingham body; when n > 1, it is the swelling body; when n < 1, it is pseudoplastic body[34].

2.3. The properties and characteristics of materials

The following details the characteristics of the materials used in this study, such as aeolian sand, coal gangue, cement, fly ash and chemical admixture.

2.3.1. Aeolian sand

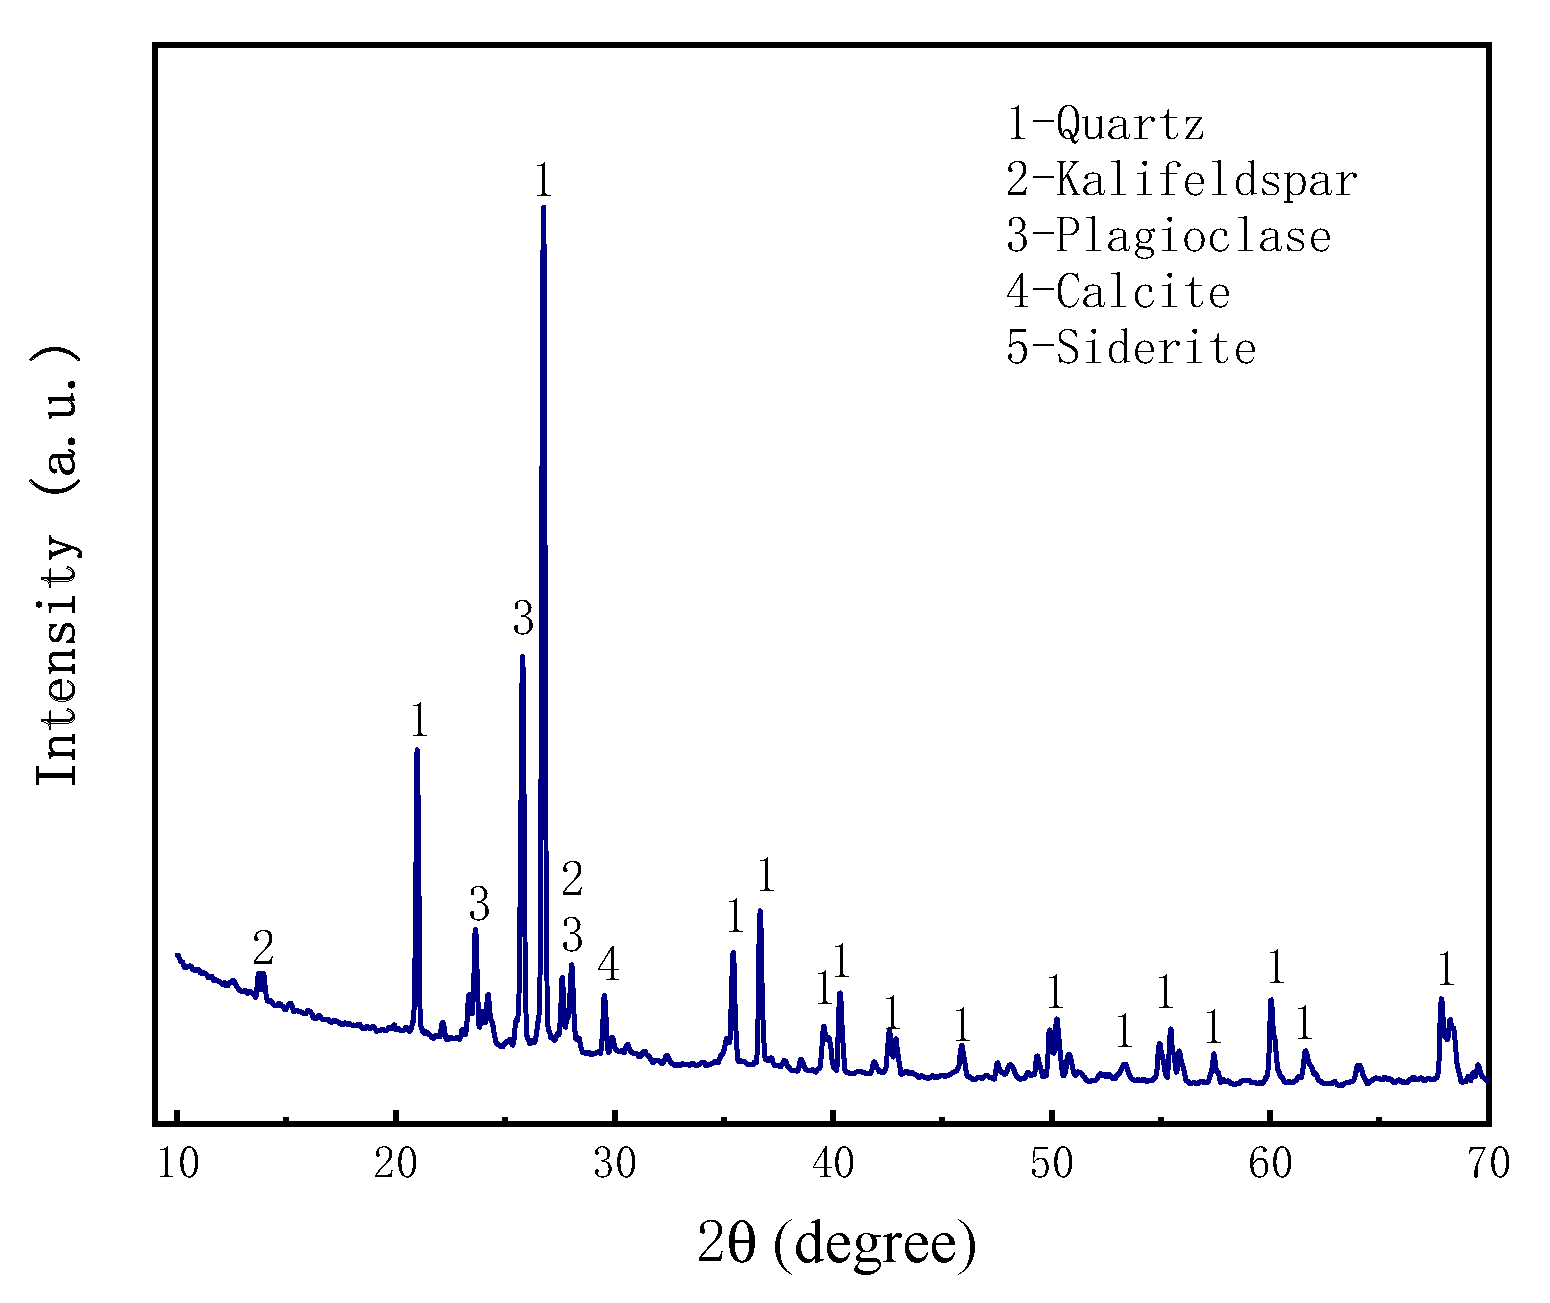
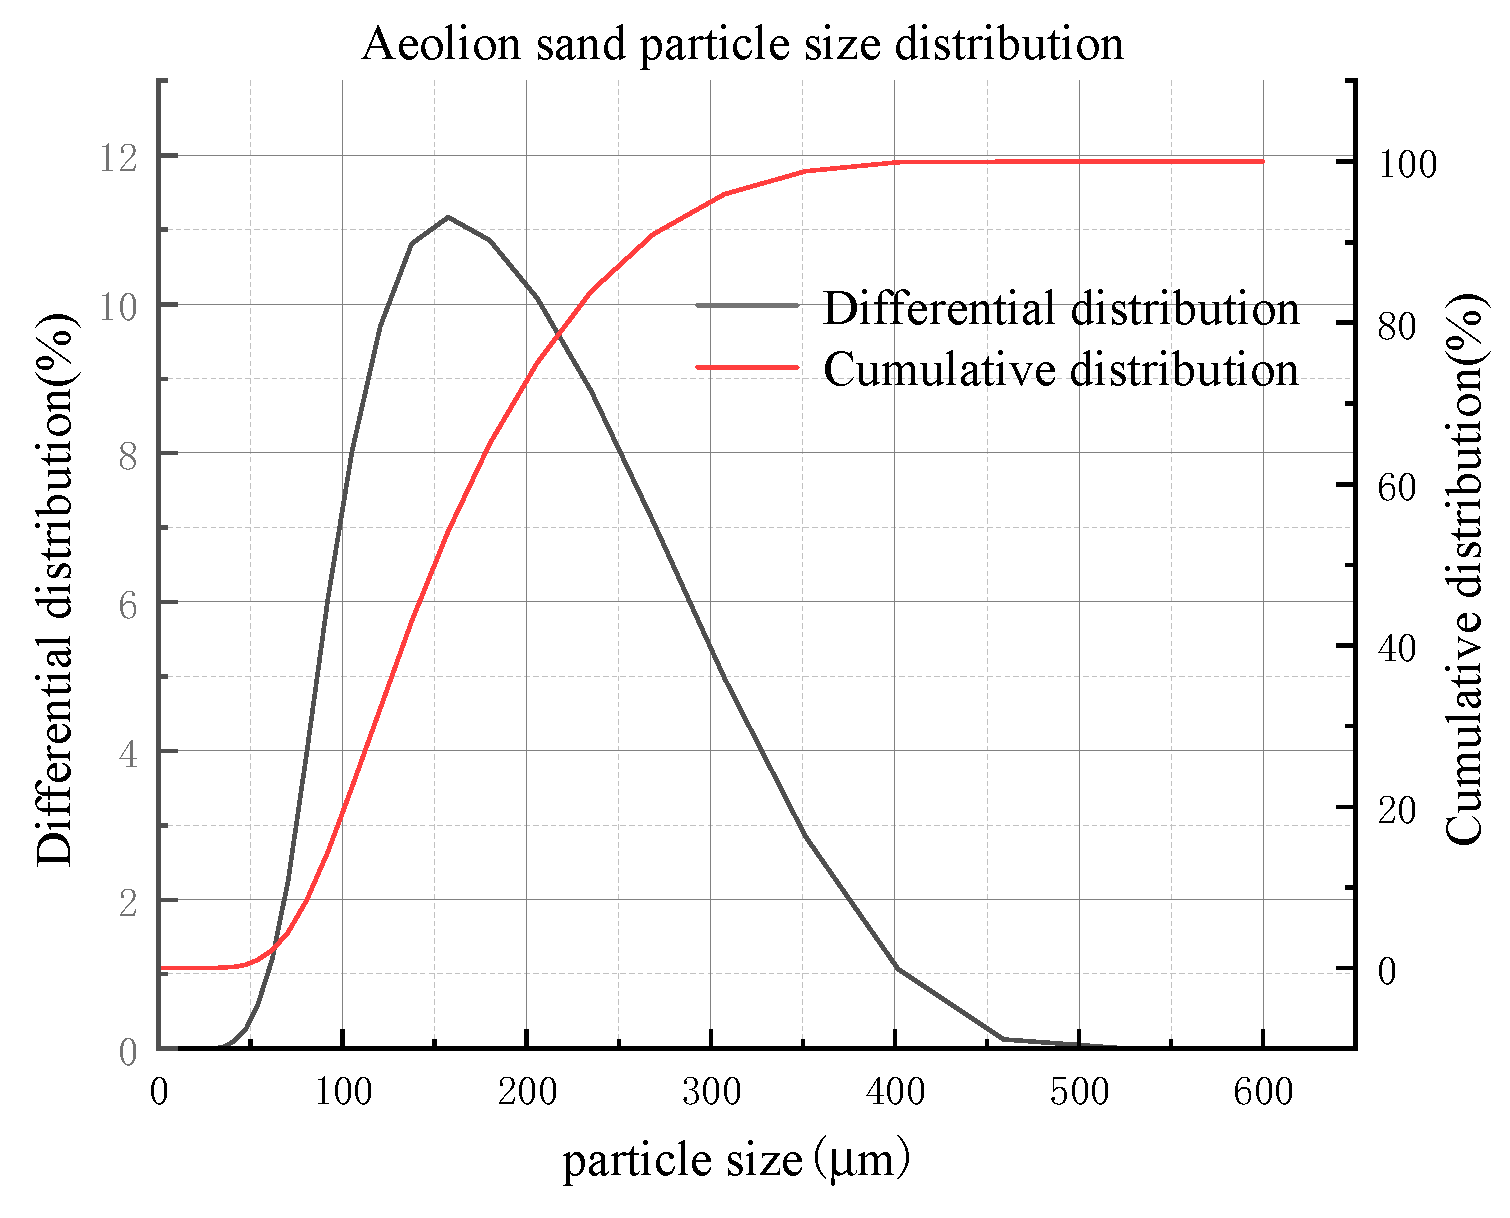
The samples were collected from near the Shiyaodian coal mine in Shenmu, Yulin, Shaanxi, China. The mineralogical analysis of the aeolian sand was carried out using an X-ray diffraction (XRD) spectrometer (Japan Rigaku SmartLab), as shown in Figure 2. The particle size analysis was performed using a particle size analyzer (NKT5200-HF), which showed that the particle size of the aeolian sand was mainly distributed between 100 μm and 300 μm in Figure 6. The chemical composition of the aeolian sand was analyzed by X-ray fluorescence (XRF) spectrometer, as shown in Table 1.

2.3.2. Coal gangue

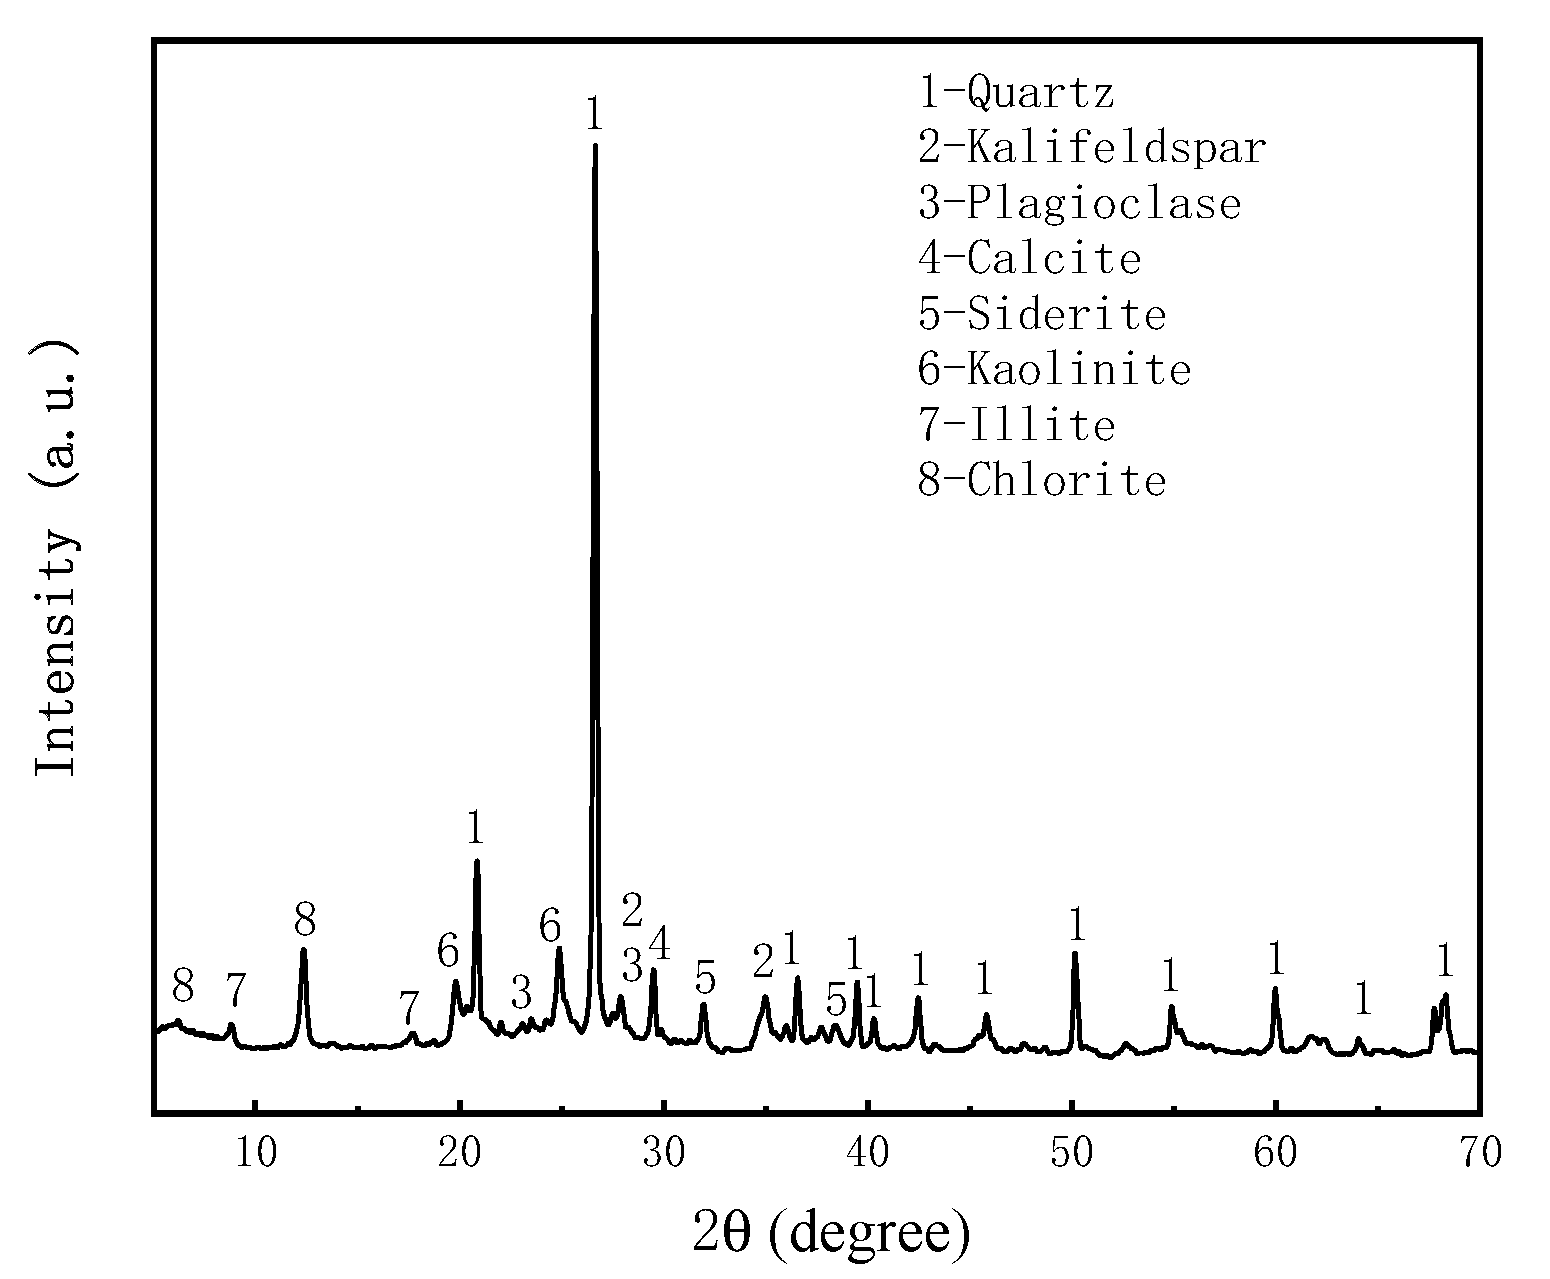
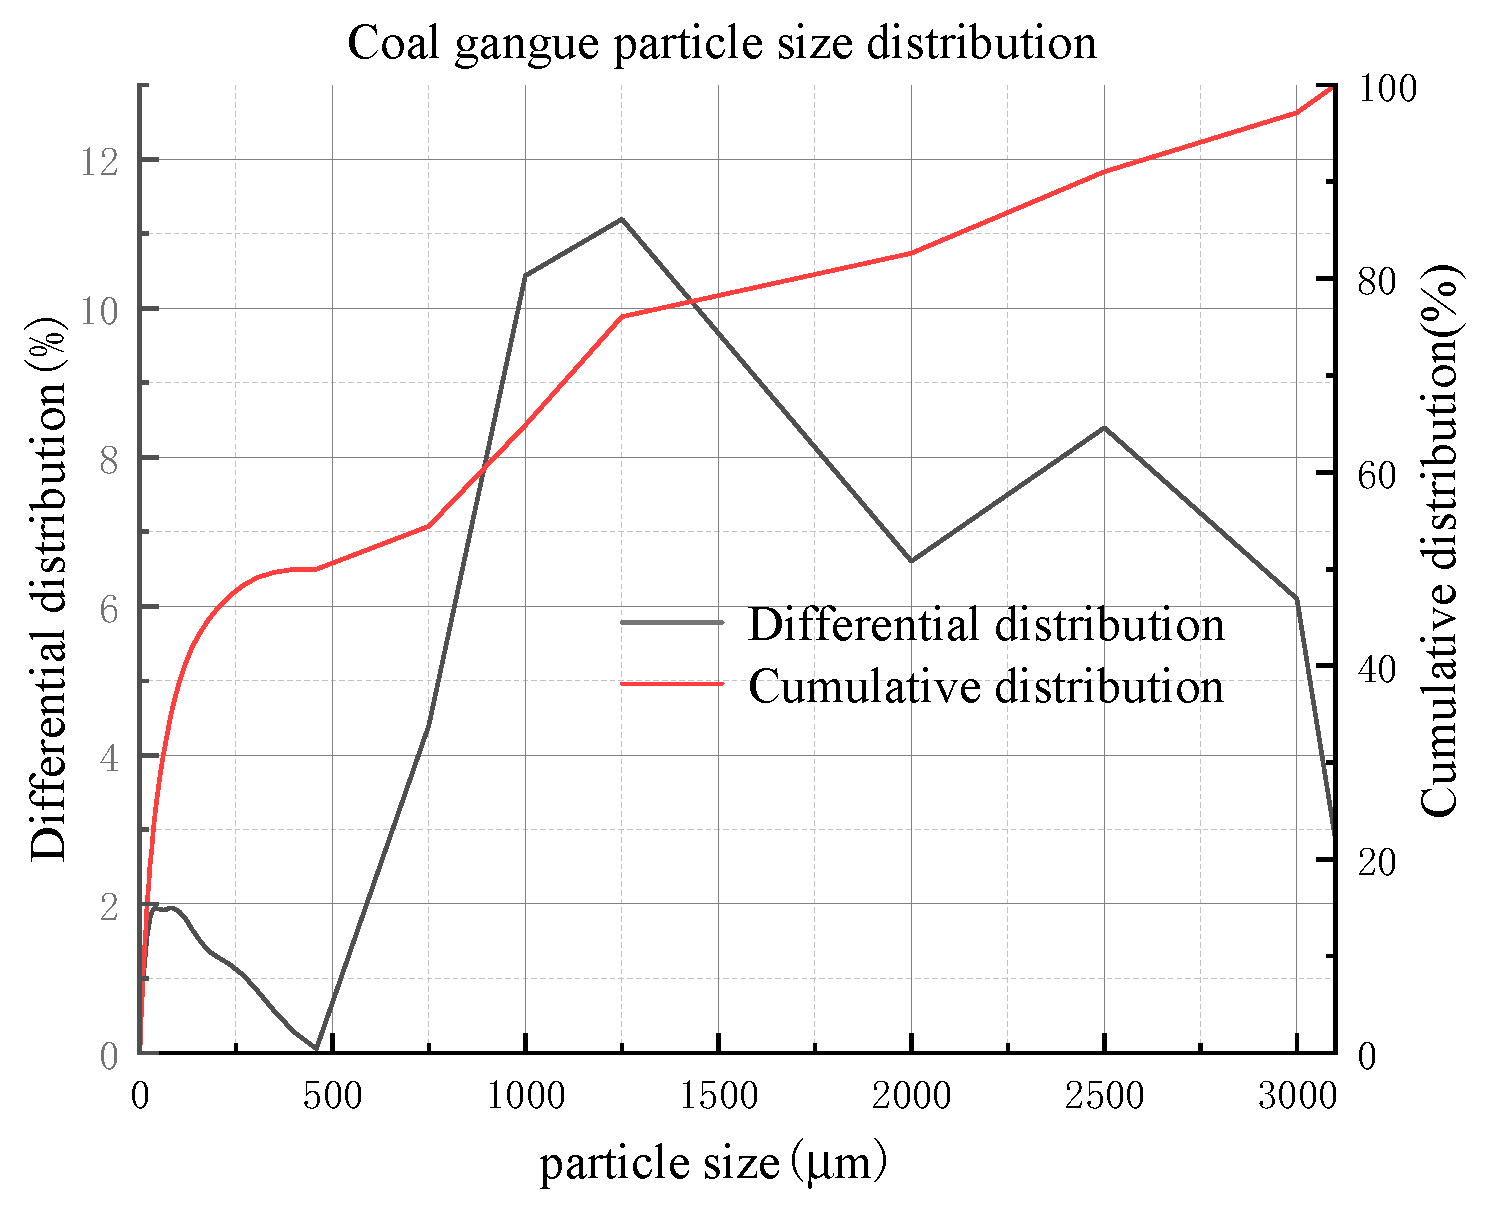
The coal gangue samples were collected from Shenmu Shiyaodian coal mine, Yulin, Shaanxi, China, and the coal gangue was crushed below 3 mm by mechanical processing, and the particle size analysis was carried out using a particle size analyzer (NKT5200-HF), and the results showed that 50% of the coal gangue was less than 500 μm in size in Figure 7. The mineralogical analysis of the coal gangue was carried out using an X-ray diffraction (XRD) spectrometer (Japan Rigaku SmartLab), as shown in Figure 3, and the chemical composition of the coal gangue was analyzed using X-ray fluorescence (XRF) spectrometer, as shown in Table 2.

2.3.3. Fly ash

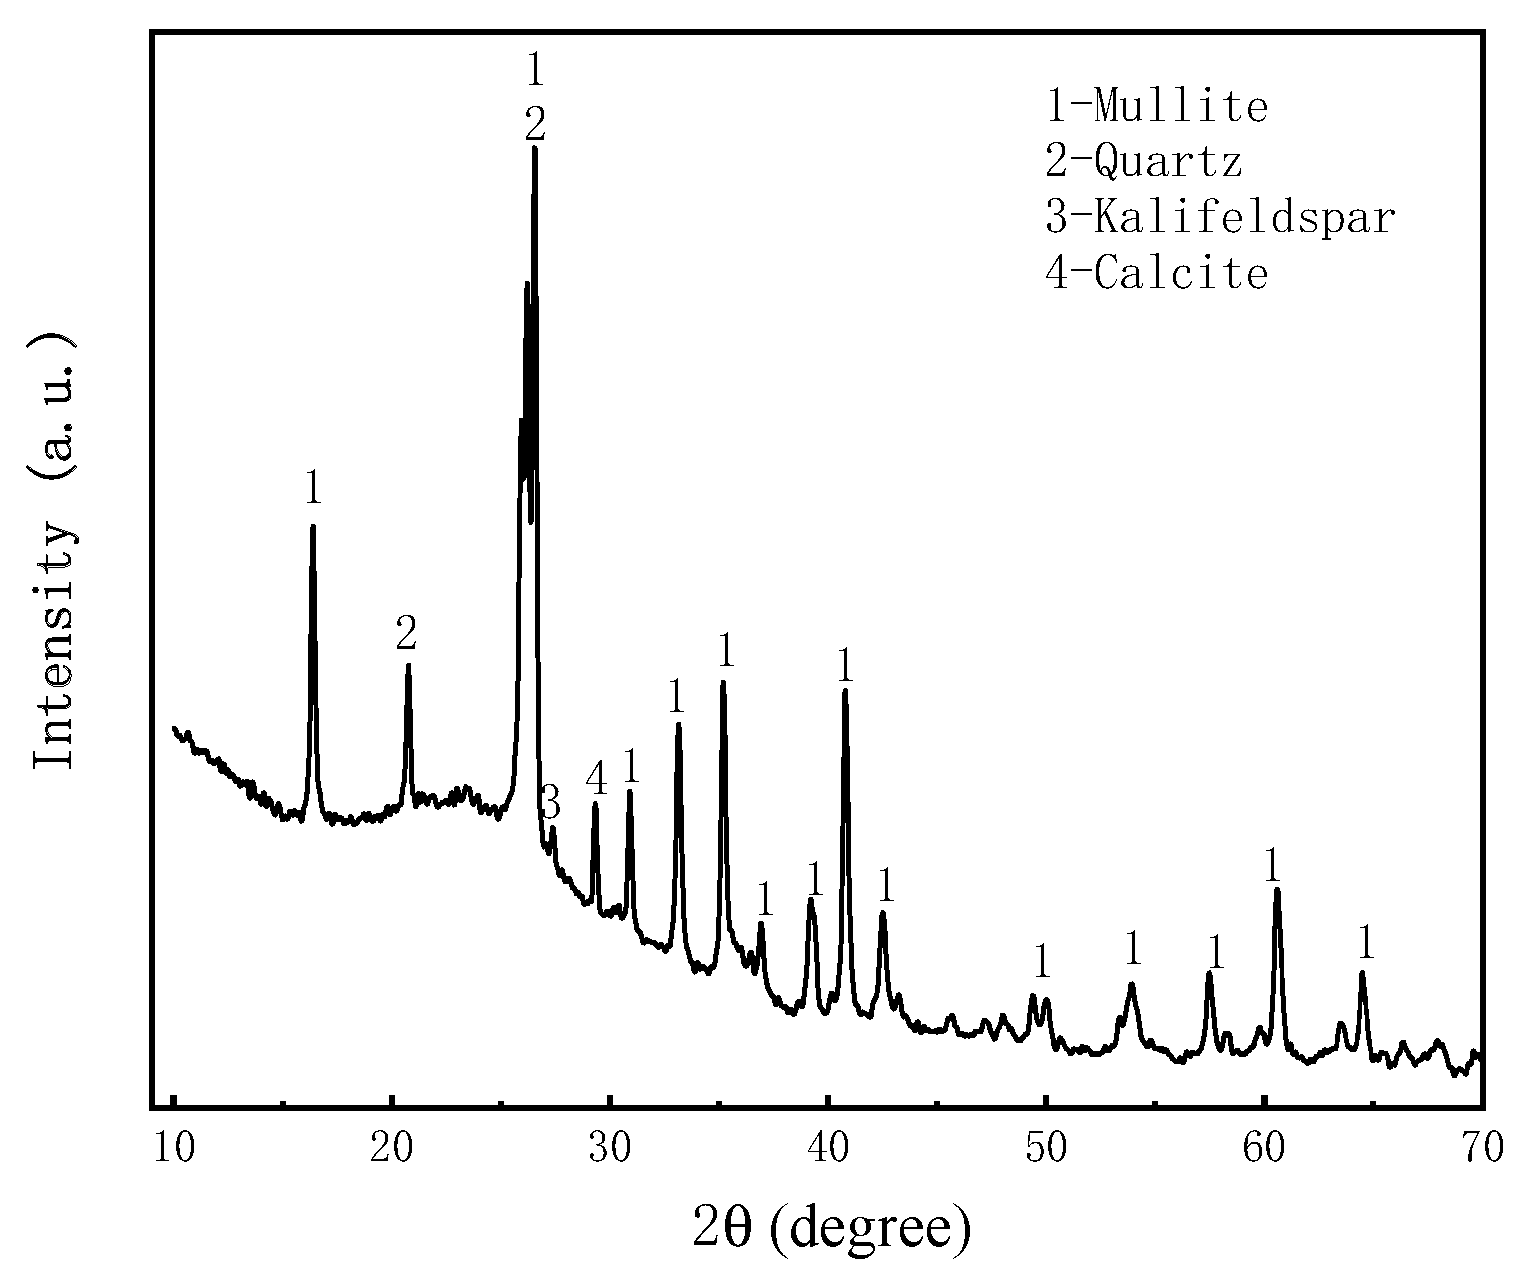
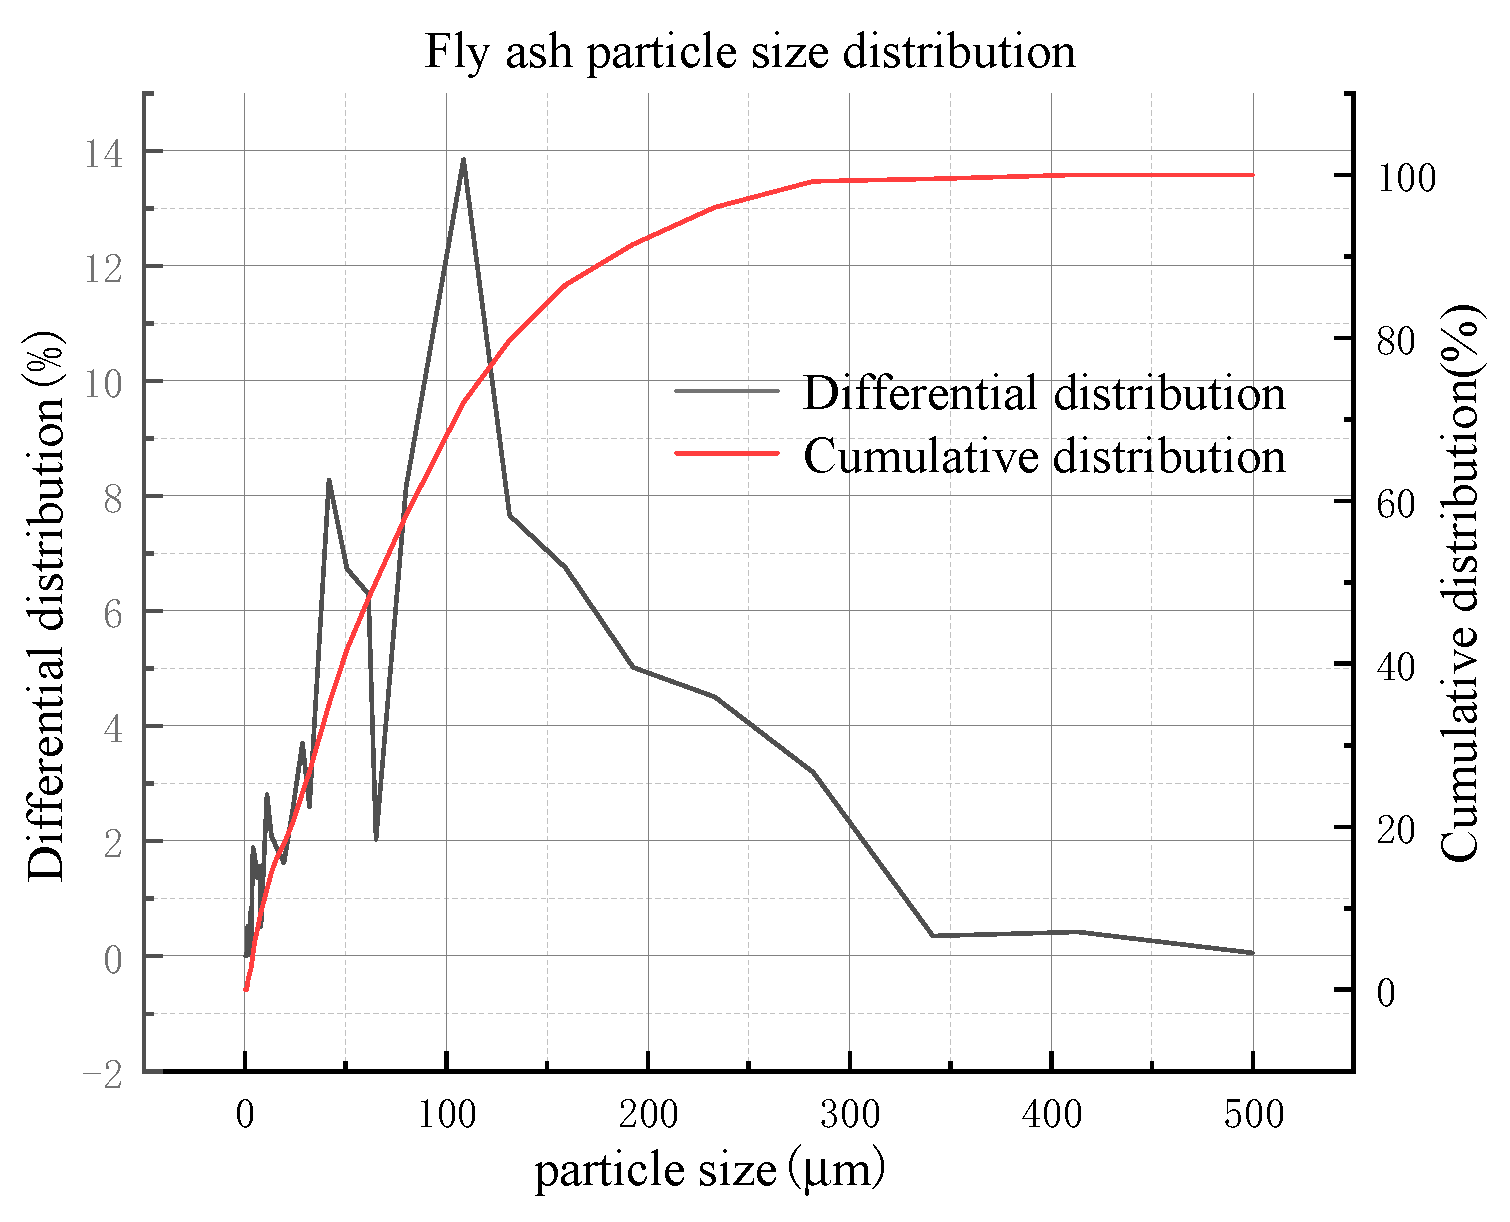
Fly ash samples were collected from the Shenmu Guohua Power Plant in Yulin, Shaanxi, China, and particle size analysis was performed using a particle size analyzer (NKT5200-HF), which showed that the fly ash particle size mainly ranged from 0 μm to 300 μm in Figure 8. The mineralogical analysis of the fly ash was carried out using an X-ray diffraction (XRD) spectrometer (Japan Rigaku SmartLab), as shown in Figure 4 and the chemical composition of fly ash was analyzed using X-ray fluorescence (XRF) spectroscopy, as shown in Table 3.

2.3.4. Cement

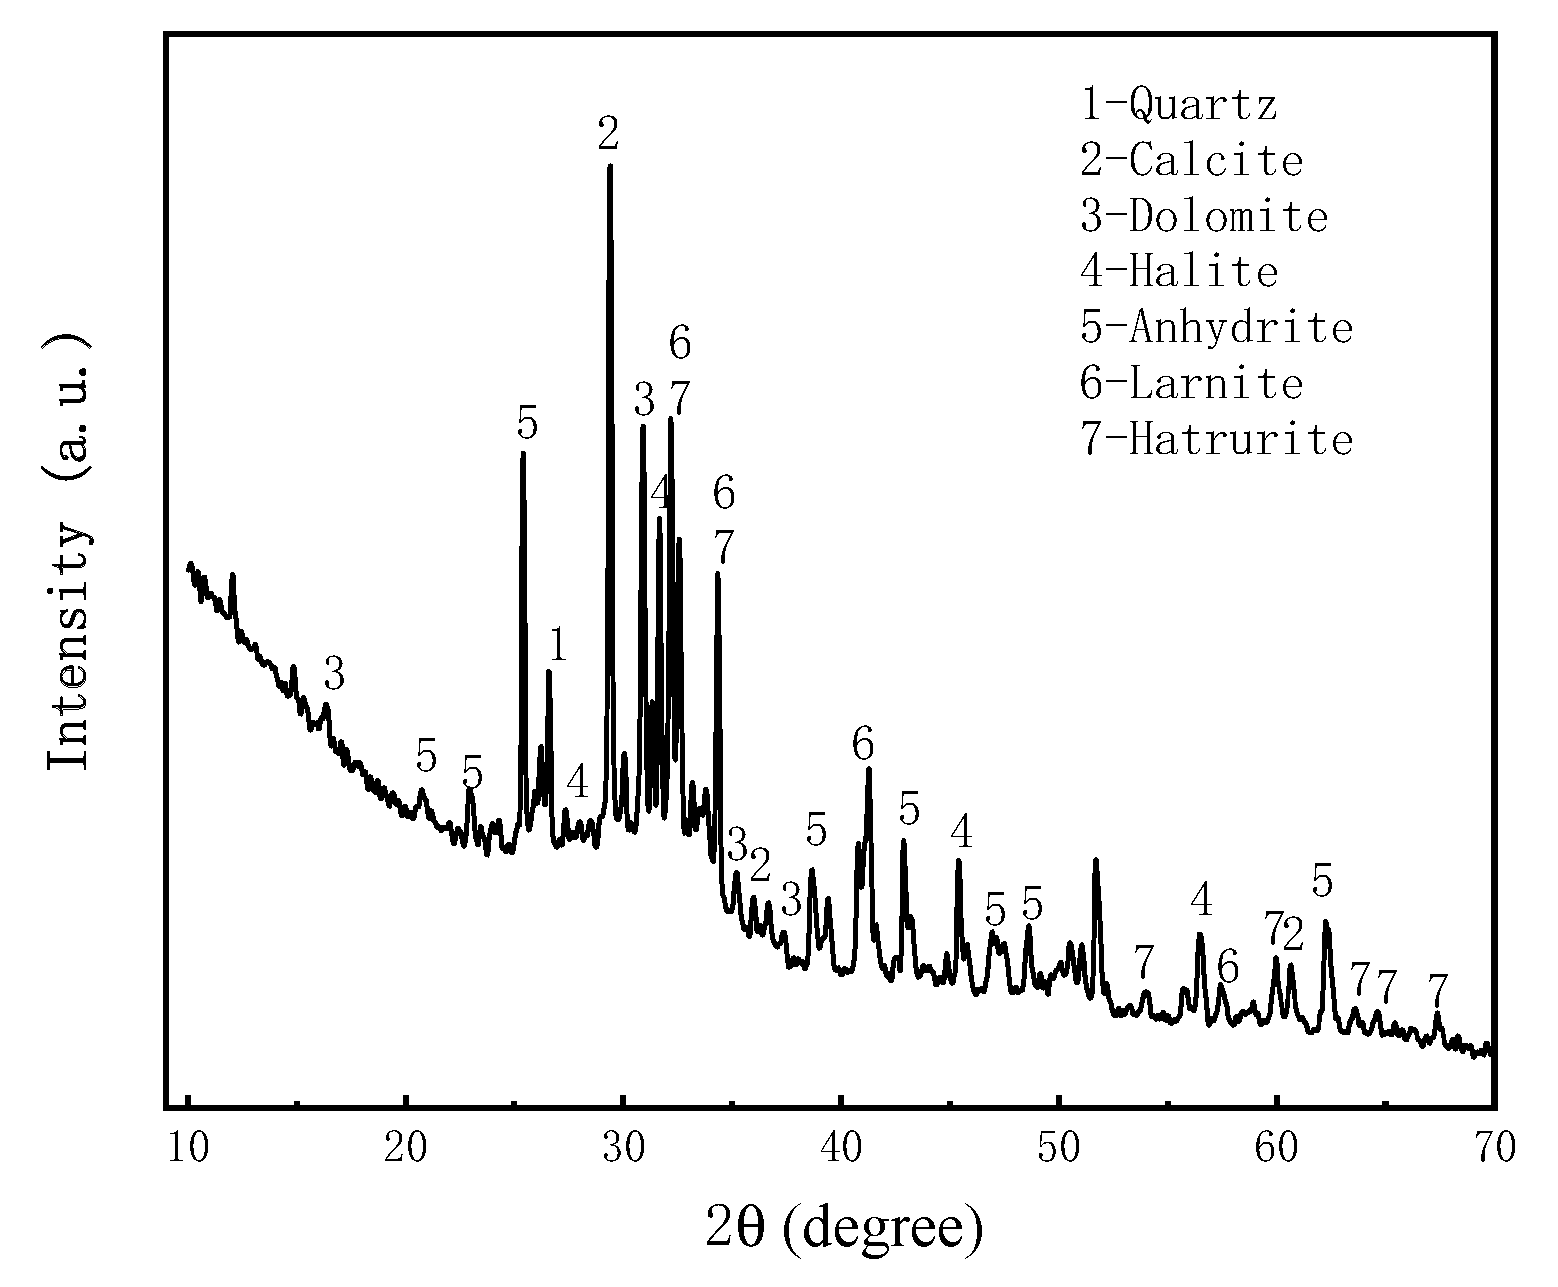
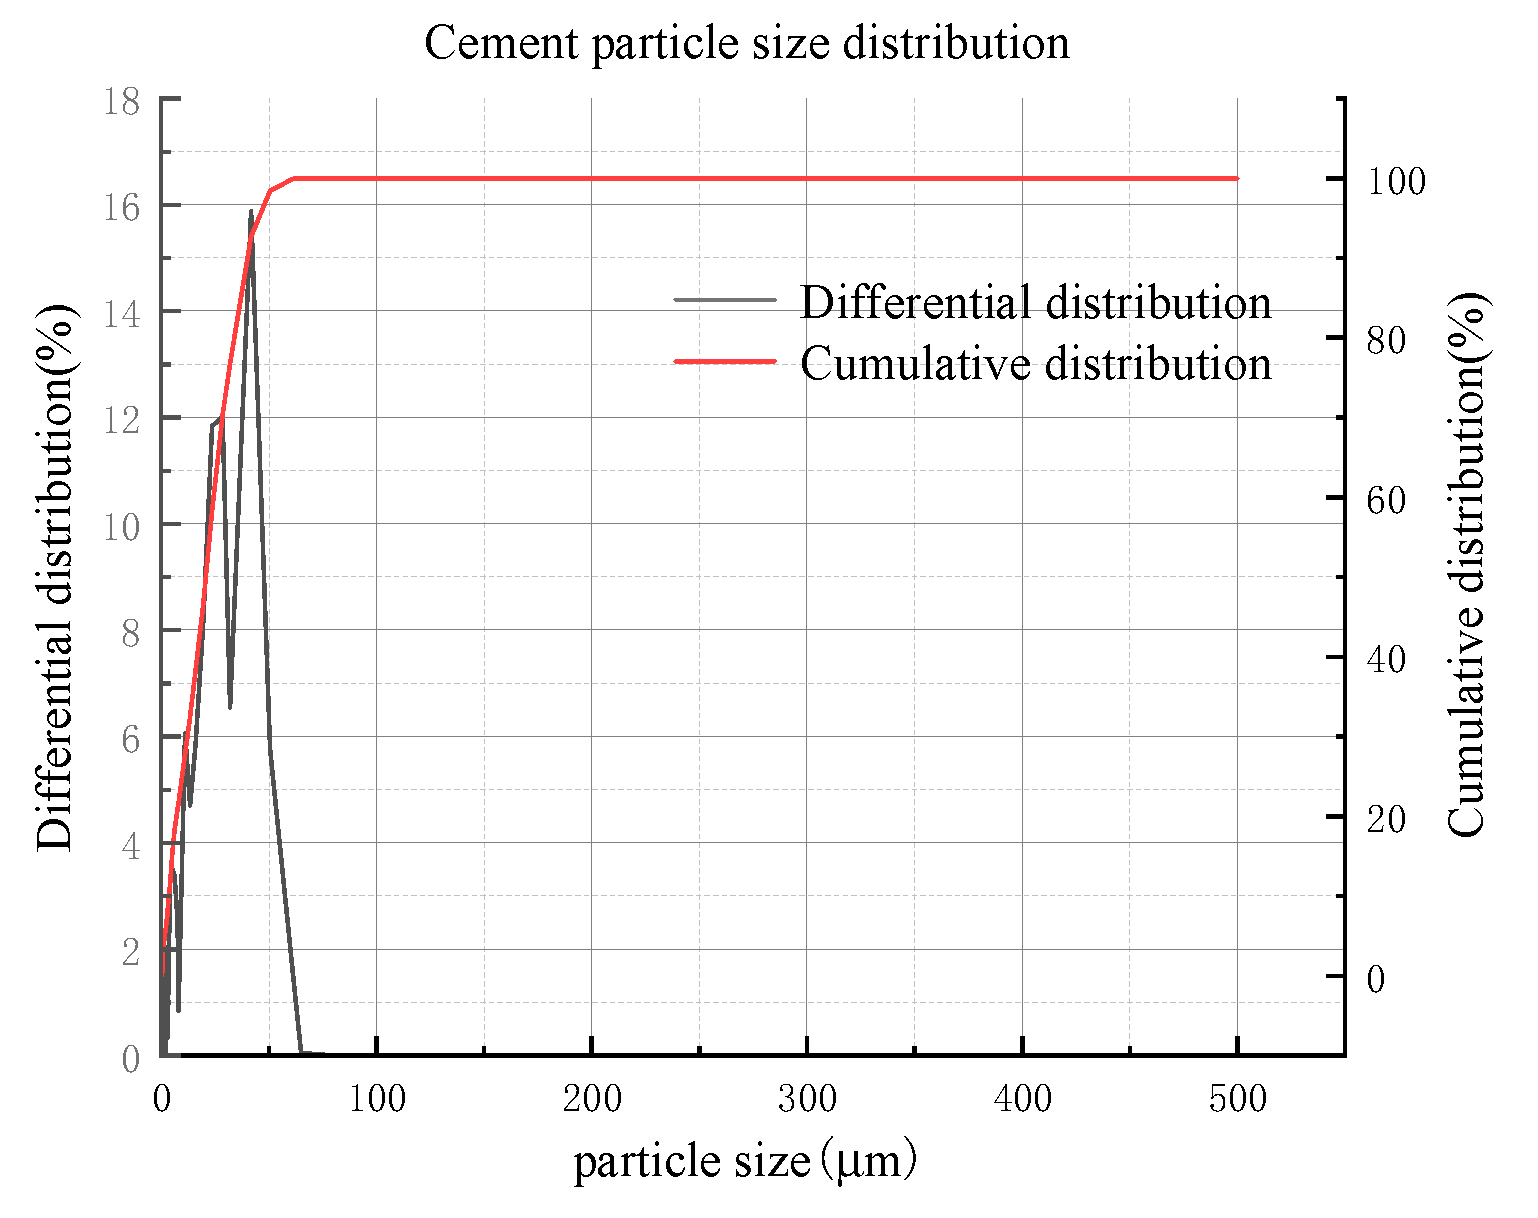
The cement was ordinary Portland cement 425# (P.O. 42.5), the bulk density is 3100 kg/m3,and the initial and final setting time are 165 min and 231 min respectively, and the compressive strengths at 3d and 28d are 18.4 MPa and 46.4 MPa respectively, and the particle size analysis was performed using a particle size analyzer (NKT5200-HF), and the results showed that the cement particle size mainly below 100 μm in Figure 9. The mineralogical analysis of the cement was carried out using an X-ray diffraction (XRD) spectrometer (Japan Rigaku SmartLab), as shown in Figure 5 and the chemical composition of the cement was analyzed using X-ray fluorescence (XRF) spectrometer, as shown in Table 4.

2.3.5. Chemical admixture

Master Glenium 7500 (Master G), a product of the chemical company, Badische Andilin und Soda Fabrik (BASF), was used as the plasticizer in the CAFB mix. It is a full range water reducing admixture generally used for workability improvements and early strength achievement. It meets the ASTM requirements for high range water reducing admixtures[26,35].
Figure 2. X-ray diffractogram of aeolian sand.
Preprints 78731 g002
Figure 3. X-ray diffractogram of coal gangue.
Preprints 78731 g003
Figure 4. X-ray diffractogram of fly ash.
Preprints 78731 g004
Figure 5. X-ray diffractogram of cement.
Preprints 78731 g005
Figure 6. particle size distribution of aeolian sand.
Preprints 78731 g006
Figure 7. particle size distribution of coal gangue.
Preprints 78731 g007
Figure 8. particle size distribution of fly ash.
Preprints 78731 g008
Figure 9. particle size distribution of cement.
Preprints 78731 g009

2.4. Instructions for rheometer and vane spindle

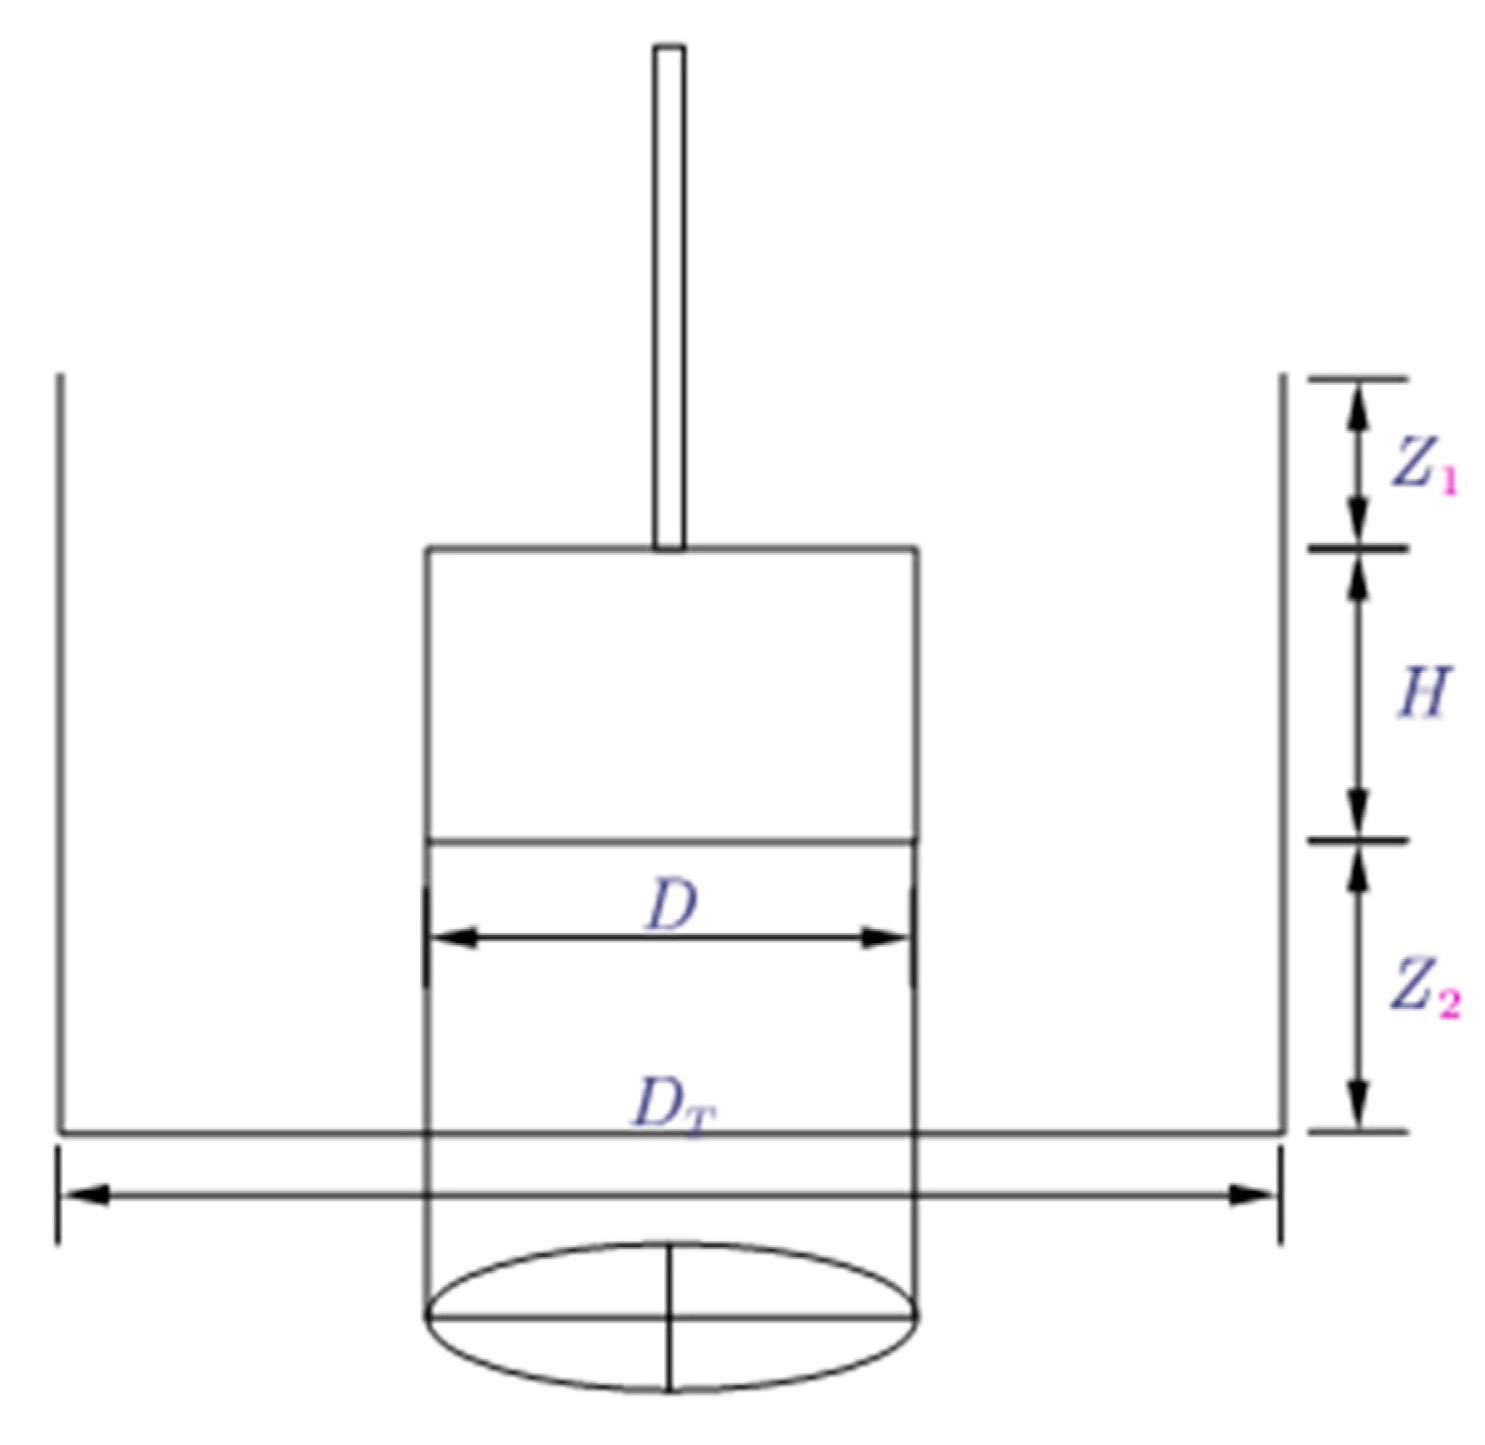
The rheological behavior of CAFB is measured using the RheolabQC rheometer (Anton paar RheolabQC, Germany) with a four-blade sensor[36]. The geometry of the vane sensor corresponds to a cylinder with a diameter of 22 mm and a height of 40 mm. The rheometer can be operated in a controlled shear stress or shear rate mode. The rheometer has shear rate from 1×10⁻³ s-1 to 4×10³ s-1, shear stress from 0.5 Pa to 3×10⁴ Pa, depending on the measurement system, and viscosity from 1 Pa·s to 1×10⁹ Pa·s. The accuracy of the rheometer is 0.1%. The rheometer works on the principle of Searle. The vane spindle has an aspect ratio (height/diameter) of 1.8. The geometry of the blade spindle effectively eliminates any wall slip effects, suppressing any significant interference with the sample that may result during the immersion of the blade into the sample prior to any measurement, thus allowing the paste to yield under the static conditions of the material itself. It will be very important that the suspension is thixotropic in nature. In the phenomenon of wall slip, an extremely thin film of low concentration solid lubricant is formed in the material near the rotating surface of a concentric cylindrical or conical plate rheometer. As a result, the shear stress and viscosity in the film are much lower relative to the remaining dense concentrated material, and therefore the true rheological behavior of the concentrated material may not be captured. Therefore, the vane is best suited for the thixotropic behavior of highly concentrated suspensions. It is important to note that the depth of the CAFB suspension and the diameter of the sample container (beaker or cup) should be at least twice the length and diameter of the vane to minimize the effects caused by rigid boundaries. For satisfactory measurements with the vane spindle, following criteria are followed as per: H/D<3.5, D_T/D>2.0, Z_1/D>1.0, and Z_2/D>0.5(Figure 7). The submerged depth of vane is described by the distances Z_1 and Z_2, while H is the height of vane blades as shown in Figure 10. Here, the diameters of the vane spindle and the sample container are calculated respectively.

2.5. Specimen preparation and experimental methods

The CAFB’s ingredients i.e. solid concentration Cw%, aeolian sand dosage Bw%, coal gangue dosage Dw%, fly ash dosage Ew%, cement dosage Fw%, plasticizer dosage SP(%) and water content Gw% which are used insubsequent sections of this paper are calculated from the following equations(Eq.(2) to Eq.(8)):
C_(W%)=(100×M_(dry-solid))/(M_(dry-solid)+M_water )
B_(W%)=(100×M_(aeolion-sand))/(M_(dry-solid)+M_water )
D_(W%)=(100×M_(coal-gangue))/(M_(dry-solid)+M_water )
E_(W%)=(100×M_(fly-ash))/(M_(dry-solid)+M_water )
F_(W%)=(100×M_cement)/(M_(dry-solid)+M_water )
SP(%)=(100×M_sp)/M_cement
G_(W%)=(100×M_water)/(M_(dry-solid)+M_water )
Where Mwater is mass of water in the paste fill; Mdry-solid is mass of aeolian sand, coal sand, Portland cement, and fly ash. Maeolian-sand is mass of aeolian sand, Mcement is mass of Portland cement, Mcoal-gangue is mass of coal gangue, Mfly-ash is mass of fly ash and Msp is mass of plasticizer. The amount of aeolian sand and coal gangue are varied to prepare different mix composition as shown in Table 5.
Table 5. CAFB mixture proportions.
CAFB code 1# 2# 3# 4# 5# 6# 7#
C W % 77.5 77.5 77.5 77.5 77.5 77.5 77.5
B W % 46 43 40 37 34 40 40
D W % 5 8 11 14 17 11 11
S P % 0 0 0 0 0 0.05 0.1
E W % 17.5 17.5 17.5 17.5 17.5 17.5 17.5
F W % 9 9 9 9 9 9 9
G W % 22.5 22.5 22.5 22.5 22.5 22.5 22.5
Table 6. Characteristic index of particle size gradation of CAFB.
CAFB code d10/μm d30/μm d60/μm d90/μm d50/μm
1# 53.771 80.586 179.465 361.146 138.018
2# 51.263 78.586 207.453 449.321 151.538
3# 48.755 76.587 235.442 533.496 165.059
4# 46.247 74.587 263.43 617.671 178.579
5# 43.74 72.594 291.507 702.089 192.149
Note: d10, d30, d60, and d90 are the corresponding particle sizes when the cumulative particle size content reaches 10%, 30%, 60%, and 90%, respectively.

2.5.1. Vane test to determine yield stress and viscosity

In the following, the procedural steps for developing a slurry material for rheological evaluation are outlined.
Step 1. Initial mixing: The air-dried coal gangue are thoroughly mixed with certain proportion of aeolian sand, cement, and fly ash using spatula in a mixing container. Then specified amount of tap water followed by a certain proportion of SP is added and homogenized thoroughly using the electric and blender at high shear (+1000rpm) for 5min.
Step 2. Final mixing: The slurry was then loaded into a 500 mL beaker, and finally the container loaded with the slurry was assembled with the rheometer for subsequent rheological tests, with a four-blade rotor gradually entering the middle of the beaker and inserted with the slurry sample undisturbed for 30 seconds to allow the mixed slurry to reach its structural balance and at least partially recover its initial structure and strain state.
Step 3. Determination of yield stress and viscosity: For each sample, rheological curves describing the correlation between shear stress and shear rate were obtained experimentally. The rheological parameters describing the rheological properties of the slurry included yield stress and viscosity. The yield stress is the stress value at which the material just starts to yield to a state transition, and the shear rate of the rheological curve is from 0.01s-1 to 150s-1 with an interval of 0.05s-1. The Herschel-bulker rheological model was used to fit the measured rheological curves. In the fitted curves, the intersection of the shear stress curve with the longitudinal coordinate (longitudinal intercept) is the yield stress, the viscosity is the slope of the fitted curve, and the viscosity is the ratio of shear stress to shear rate.
Step 4. The above process was repeated for samples from the same batch of slurry to obtain different parameters i.e., 3 min, 30 min, 60 min after sample preparation. the hydration age was chosen to cover a wide range of transport times encountered during the slurry backfill tests. The shear test was performed using a controlled shear rate by placing the rotor in a 500 mL beaker for rheological testing, rotating it at a variable shear rate, dispensing the slurry several times and taking the average value for multiple measurements to eliminate experimental errors, and recording the corresponding shear stress and viscosity in real time. The test is repeated three times for each slurry sample to ensure reproducible results.

2.5.2. Microstructural analysis

To gain a more in-depth understanding of the effects of different factors on the cement hydration process in CAFB, microstructure analyses, including thermal analyses thermogravimetry (TG) and differential thermogravimetry (DTG), were conducted on the prepared cement fly ash paste (CFP) samples of the CAFB. The CFPs were prepared at a water / binder ratio of 1, cured at room temperature for 1 h and 2 h, respectively. Before testing was carried out, the specimens were dried in an oven-dried at 45°C until a constant mass was attained[37].
The thermal analyses were carried out by using a simultaneous thermogravimetric analyzer and differential scanning calorimeter (SDT) from TA Discovery TGA 550. The dried samples were placed on a plate and heated under an inert nitrogen atmosphere at a rate of 10℃/min from room temperature to 800℃.

2.5.3. Zeta potential test

Zeta potentials of CAFB samples treated with a different dosage of the plasticizer were measured using Malvern Zetasizer Nano series. The device measures the electrophoretic mobility of suspended particles based on phase analysis light scattering (PALS). The zeta potential of the particles is evaluated using the Henry equation[38,39].

2.5.4. Monitoring program

To gain additional insight into the reaction mechanisms responsible for the rheological behavior of the CAFB with varying composition, a 5TE sensor was used to monitor the electrical conductivity (EC), while an MPS-6 sensor was used for suction. Each sensor was placed at the middle of a cylindrical plastic container of 10 cm diameter by 20 cm height filled with the CAFB and readings recorded from the time of cast until 2 h.

2.5.5. Scanning electron microscopy tests

The parts of the dried CAFB specimens were cut into small rectangular specimens (10 mm × 10 mm × 10 mm) with a naturally formed surface. The specimens were placed in a holder with its natural surface facing upwards. The base of the specimens was attached to the holder using conductive adhesive or glue. Finally, micrographs of the prepared SEM specimens were captured using a ZEISS Gemini SEM 300 scanning electron micro-scope with magnifications between 100x and 5000x.

3. Results

CAFB material is added with different proportions of samples of aeolian sand and coal gangue, along with the growth of hydration time, the rheological parameters yield stress and viscosity of the slurry are measured, and the influence of particle gradation of the slurry and the rheological parameters of the slurry are counted by linear regression method to explore the best combination of material gradation, and reduce the resistance loss of the material in the process of pipeline conveying, and establish the corresponding basis.

3.1. Fitting and analysis of rheological parameters

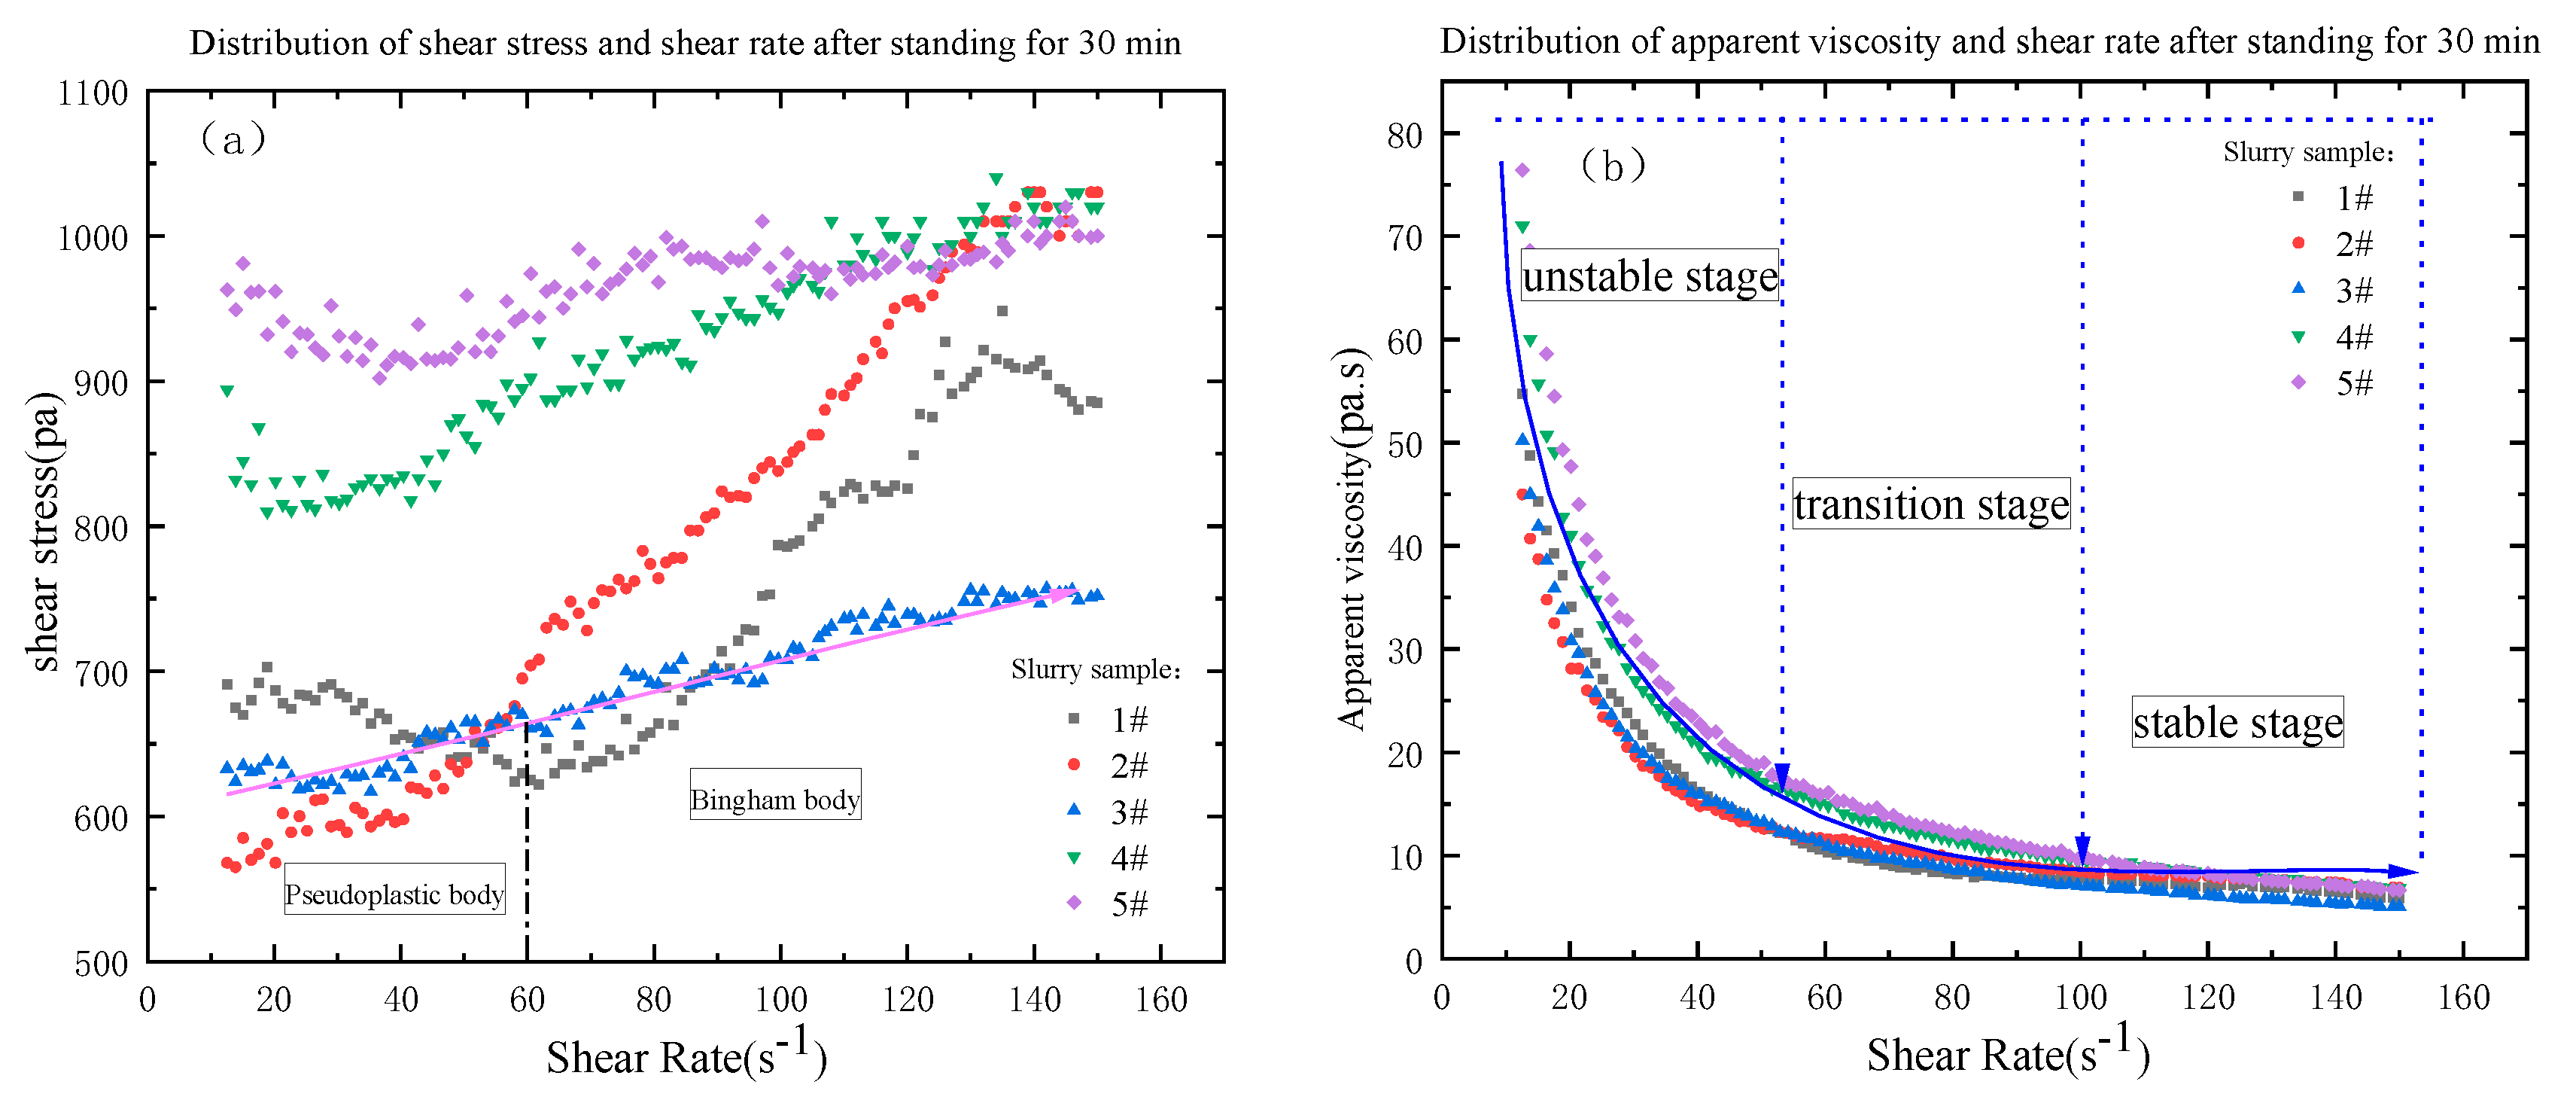
The linear regression analysis of the experimental results was performed to obtain the indicators of the rheological properties of the slurry under different conditions by Eq. (1), as shown in Table 7. From Table 7, it can be concluded that with the extension of the resting time of the slurry, the values of the parameters reflecting the rheological characteristics of the slurry change inconsistently, the initial shear stress of 1#, 2#, 4# and 5# of slurry all increase first and then decrease, and the viscosity of 1#, 3#, 4# and 5# of slurry all increase first and then decrease; with the same resting time, the rheological characteristics of the slurry composed of different materials are different. In the resting time of 30 min, the initial shear stress of 4# and 5# of slurry is larger than the other three groups of slurry. The initial shear stress of 4# and 5# slurry is greater than the other three groups of slurry because the particle gradation of 4# and 5# of slurry is similar, and the volume fraction of fine particles contained in the unit volume is greater, and the rheological model of the slurry is changing as the time grows, the hydration reaction inside the slurry continues, and the number of flocculent network gel products with resistance to mechanical damage is increasing, and the strength is increasing. Comparing the rheological indexes of the characterized slurry in Table 7, it can be concluded that 1#, 2#, 3#, 4# and 5# of slurry are in swelling body after 3 min of resting, and their rheological indexes are greater than 1. 3# and 4# of slurry are in Bingham body after 30 min of resting, and their rheological indexes are basically close to 1. 1# and 5# of slurry are in pseudoplastic body after 60 min of resting, and their rheological indexes are less than 1[5,12].

3.2. The influence of the amount of coal gangue added on the rheological properties of the slurry

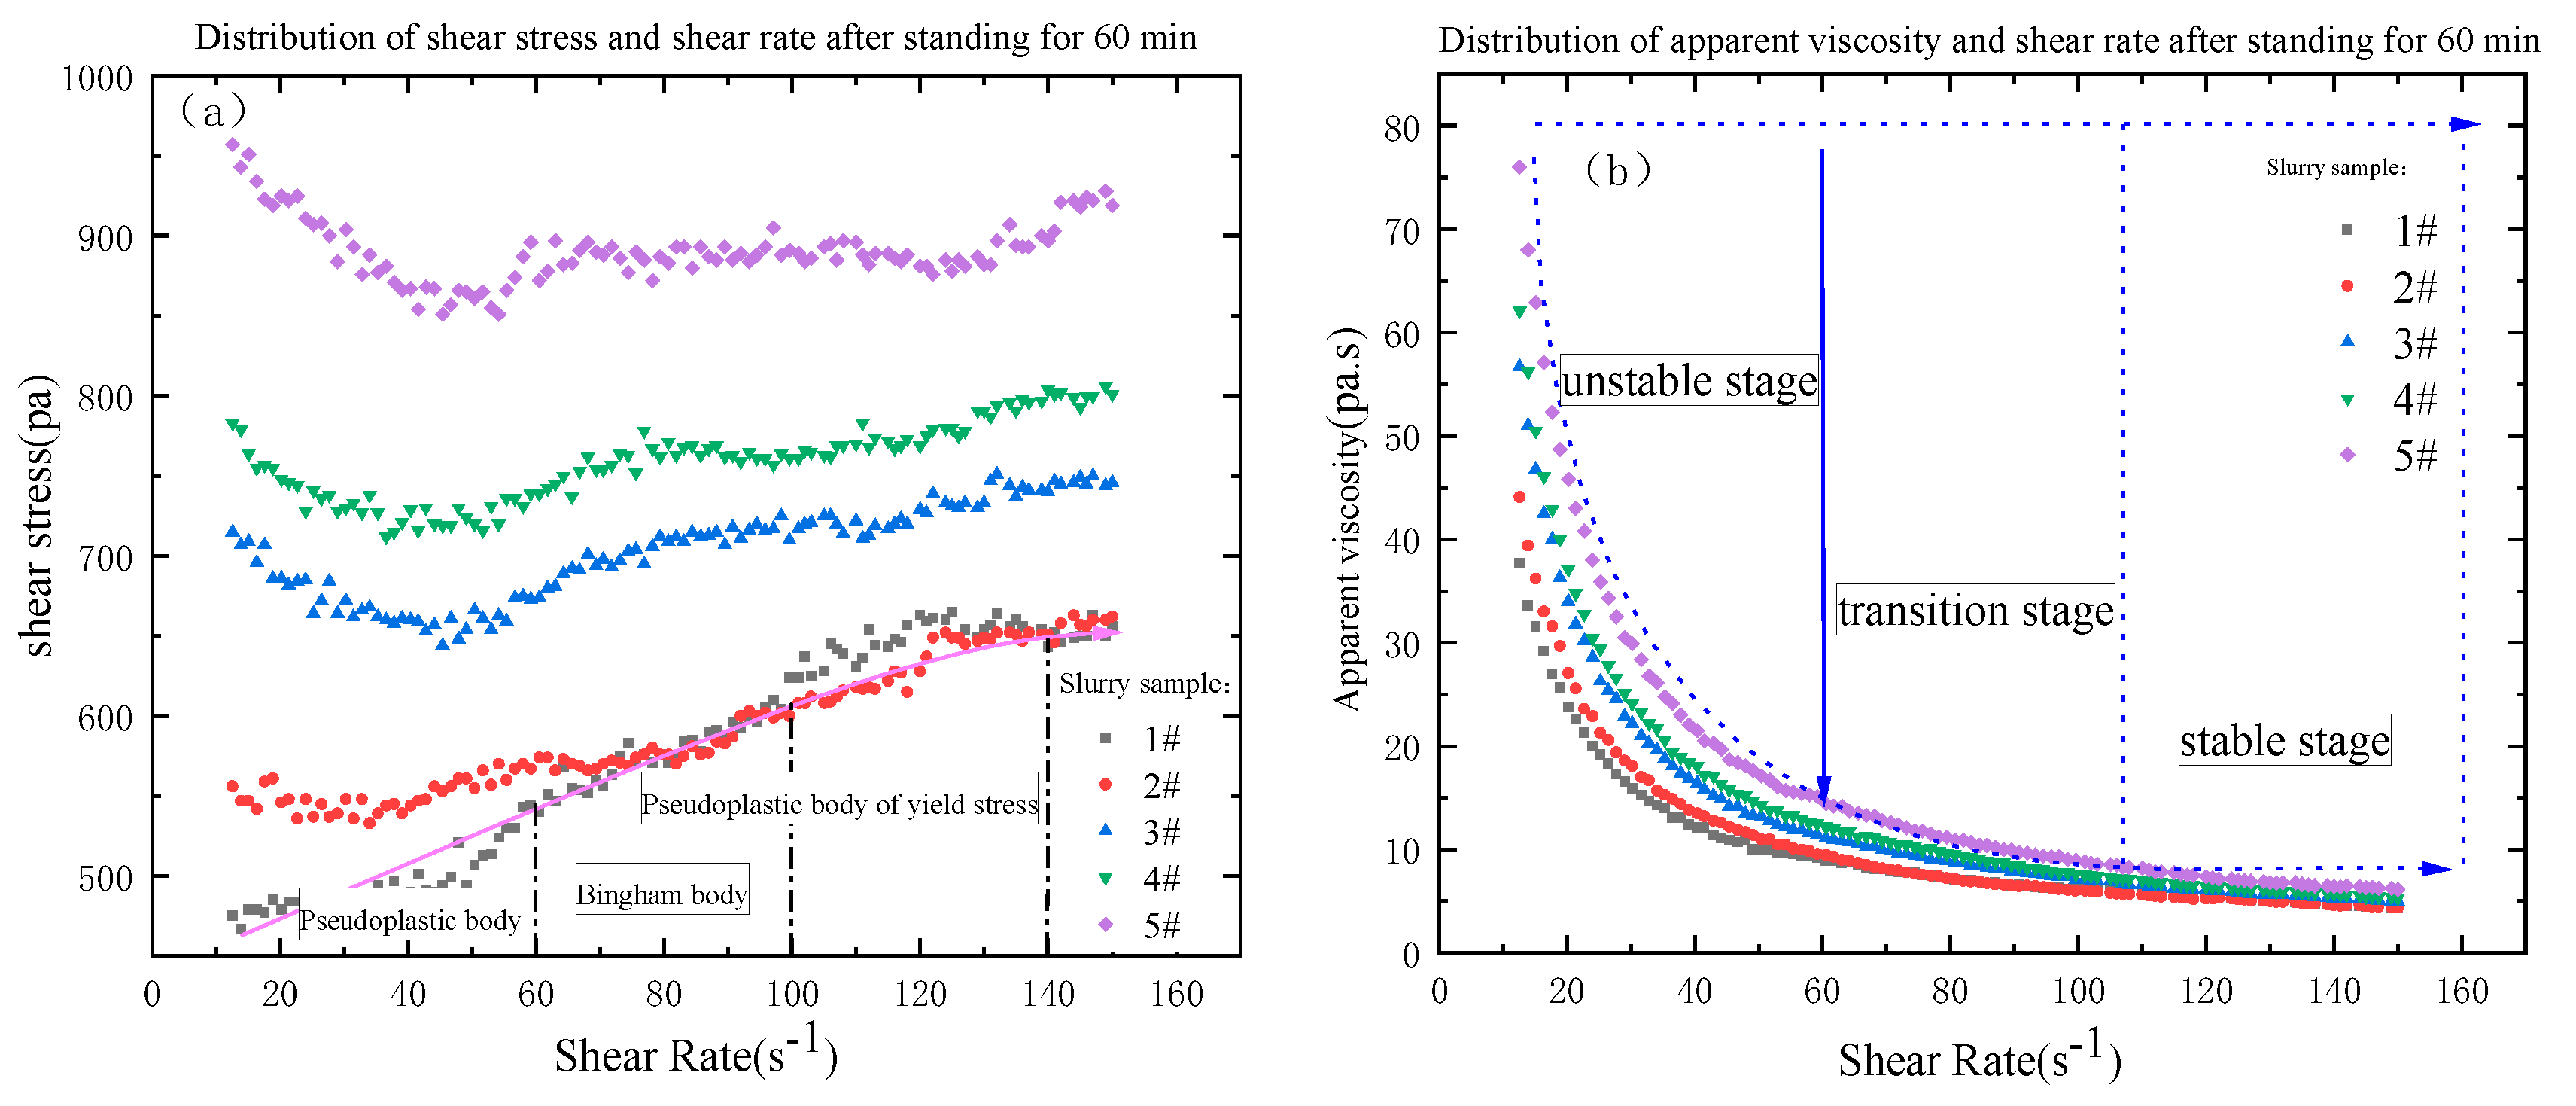
From Figure 11, the relationship between shear stress and shear rate is different from different grades of slurry at different shear rate. The rheological characteristic curves of 3#, 4# and 5 # of slurry are basically the same, and the rheological characteristic curves of 1# and 2# of slurry are basically the same with similar basic laws. With shear rate from 10 to 60, the rheological curves of slurry are pseudoplastic body; with shear rate from 60 to 100, the rheological curves of slurry are Bingham body; with shear rate from 100 to 150, the rheological curves of slurry are pseudoplastic body with a certain yield stress; with the increasing shear rate, the shear stress is also increasing, but the particle gradation of the slurry is not consistent, resulting in the increase of the shear stress of the slurry from 1# to 5# is not the same degree, and the initial shear stress is not the same with the increase of the mass fraction of the unit volume in the slurry, and the initial shear stress of the slurry is also increasing with the increase of the unit volume mass fraction in the slurry, which is basically consistent with the particle size gradation. From 1# to 5# slurry, the viscosity is in the unstable stage, transition stage, stable stage, and the value is decreasing, and the stable stage is basically below 10 Pa·s. From Table 6, the median particle size of 1# to 5# slurry are 138.018 μm, 151.538 μm, 165.059 μm, 178.579 μm and 192.149 μm respectively, and the distribution of the particle size of coal gangue can be seen that 50% of the coal gangue is below 500 μm, and the particle size of the aeolian sand is mainly between 100 and 300 μm, from the slurry Proportional distribution, it can be seen that from 1# to 5# slurry, the proportion of aeolian sand is in the decline, but the proportion of coal gangue is in the rise. The mass fraction of unit volume is in the increase, so the median particle size of 1# slurry to 5# slurry is also increasing, and D10 particle size value is in becoming smaller, and D90 particle size value is in becoming larger, which indicates that the particle size distribution of the material is more uniform, but, with the increase of coal gangue the initial shear stress of the slurry is getting bigger and bigger, the reasonable particle gradation should not only ensure that the slurry has good rheology, but also make the yield stress of slurry to be in a reasonable range, so that the pipeline’s conveying resistance runs in a reasonable range and reduce the energy loss[30,40].
Figure 11. Distribution diagram of shear stress, viscosity and shear rate after standing for 60 minutes.
Preprints 78731 g011
Figure 12. Distribution diagram of shear stress, viscosity and shear rate after standing for 30 minutes.
Preprints 78731 g012
Figure 13. Distribution diagram of shear stress, viscosity and shear rate after standing for 3 minutes.
Preprints 78731 g013

3.3. Correlation between rheological parameters and gradation

If there is a certain correlation between the rheological parameter X1 and the particle gradation parameter X2 for different slurries, the correlation is expressed by the following equation.
x 1 = a + b x 2
From the principle of least squares, the correlation coefficient r between the parameters X1 and X2 can be derived. In general, when r< 0.4, there is no or weak correlation between the variables; when 0.4< r < 0.6, there is moderate correlation between the variables; when 0.6 < r < 0.8, there is strong correlation (significant correlation) between the variables; and when 0.8 < r < 1.0, there is very strong correlation between the variables.
The linear regression results between the different parameters were obtained by least squares calculation of the parameters in Table 6 and Table 7 according to the correlation equation. The correlations between the viscosity and yield stress of the slurry at 3, 30 and 60 min of standing are shown in Table 6 and the particle grading parameters are shown in Table 7, respectively. From Table 8, it can be concluded that the correlation coefficients of yield stress and D10, D30, D50, D60 and D90 of particle size after 3 min of standing are of above 0.98, which indicates that there is a strong correlation between them, because the mass fraction of the slurry with yield stress is related to the content of fine particles, and the smaller the particle size or the higher the content, the lower the mass fraction of the slurry with yield stress. with the growth of coal gangue particle content, 1#, 2#, 3#, 4# and 5# of mixed slurry fine particles are increasing, and the proportion of coarse particles is also increasing, which shows that there is a strong correlation between the yield stress of the slurry and the slurry particle size. with the slurry in the rest 3min, the correlation coefficient of viscosity and D10, D30, D50, D60 and D90 of particle size is of above 0.75. This shows that there is a strong correlation between the two, which indicates that there is also a strong correlation between the particle gradation and the viscosity of the slurry.
From Table 9, it can be derived from the slurry after 30 min resting, the correlation coefficients of yield stress and D10, D30, D50, D60 and D90 of particle size is of above 0.86 or more, which indicates that there is a strong correlation between the two, because the mass fraction of the slurry with yield stress is related to the content of fine particles, the smaller the particle size or the higher the content, the slurry mass fraction of yield stress is lower. with the growth of coal gangue particle content, 1#, 2#, 3#, 4# and 5# of mixed slurry fine particles are increasing, the proportion of coarse particles is also increasing, which shows that there is a strong correlation between the yield stress of the slurry and the slurry particle size. With the slurry in the resting 30 min, the coefficient of correlation between viscosity and D10, D30, D50, D60 and D90 of particle size reached 0.20, indicating that there is no correlation between them.
From Table 10, it can be derived from the slurry in the rest 60min, the correlation coefficient of initial yield stress and D10, D30, D50, D60 and D90 of particle size are about 0.93 or more, indicating that there is a strong correlation between the two, because the mass fraction of the slurry with yield stress is related to the content of fine particles, the smaller the particle size or the higher the content, the slurry mass fraction of yield stress is lower. with the growth of coal gangue particle content, 1#, 2#, 3#, 4# and 5# of mixed slurry, fine particles are increasing, the proportion of coarse particles is also increasing, which shows that there is a strong correlation between the yield stress of the slurry and the slurry particle size. with the slurry in the resting 60min, the correlation coefficient of viscosity and D10, D30, D50, D60 and D90 of particle size are of 0.39 or more, indicating a weak correlation between the two.
From Table 8, Table 9 and Table 10, it can be concluded that the initial shear stress of the slurry basically follows a very strong correlation (3min-30min-60min) with the slurry resting time, and on the contrary, the viscosity of the slurry basically follows a strong correlation (3min)- no correlation (30min)-weak correlation (60 min). Under the same conditions, the particle sizes of D10, D30, D50, D60 and D90 have a great influence on the relationship with the initial shear stress of the slurry, and at 3min, the viscosity of each particle size with the slurry has a greater influence.

3.4. Time-dependent evolution of the rheological properties of CAFB with the ratio of aeolian sand / coal gangue

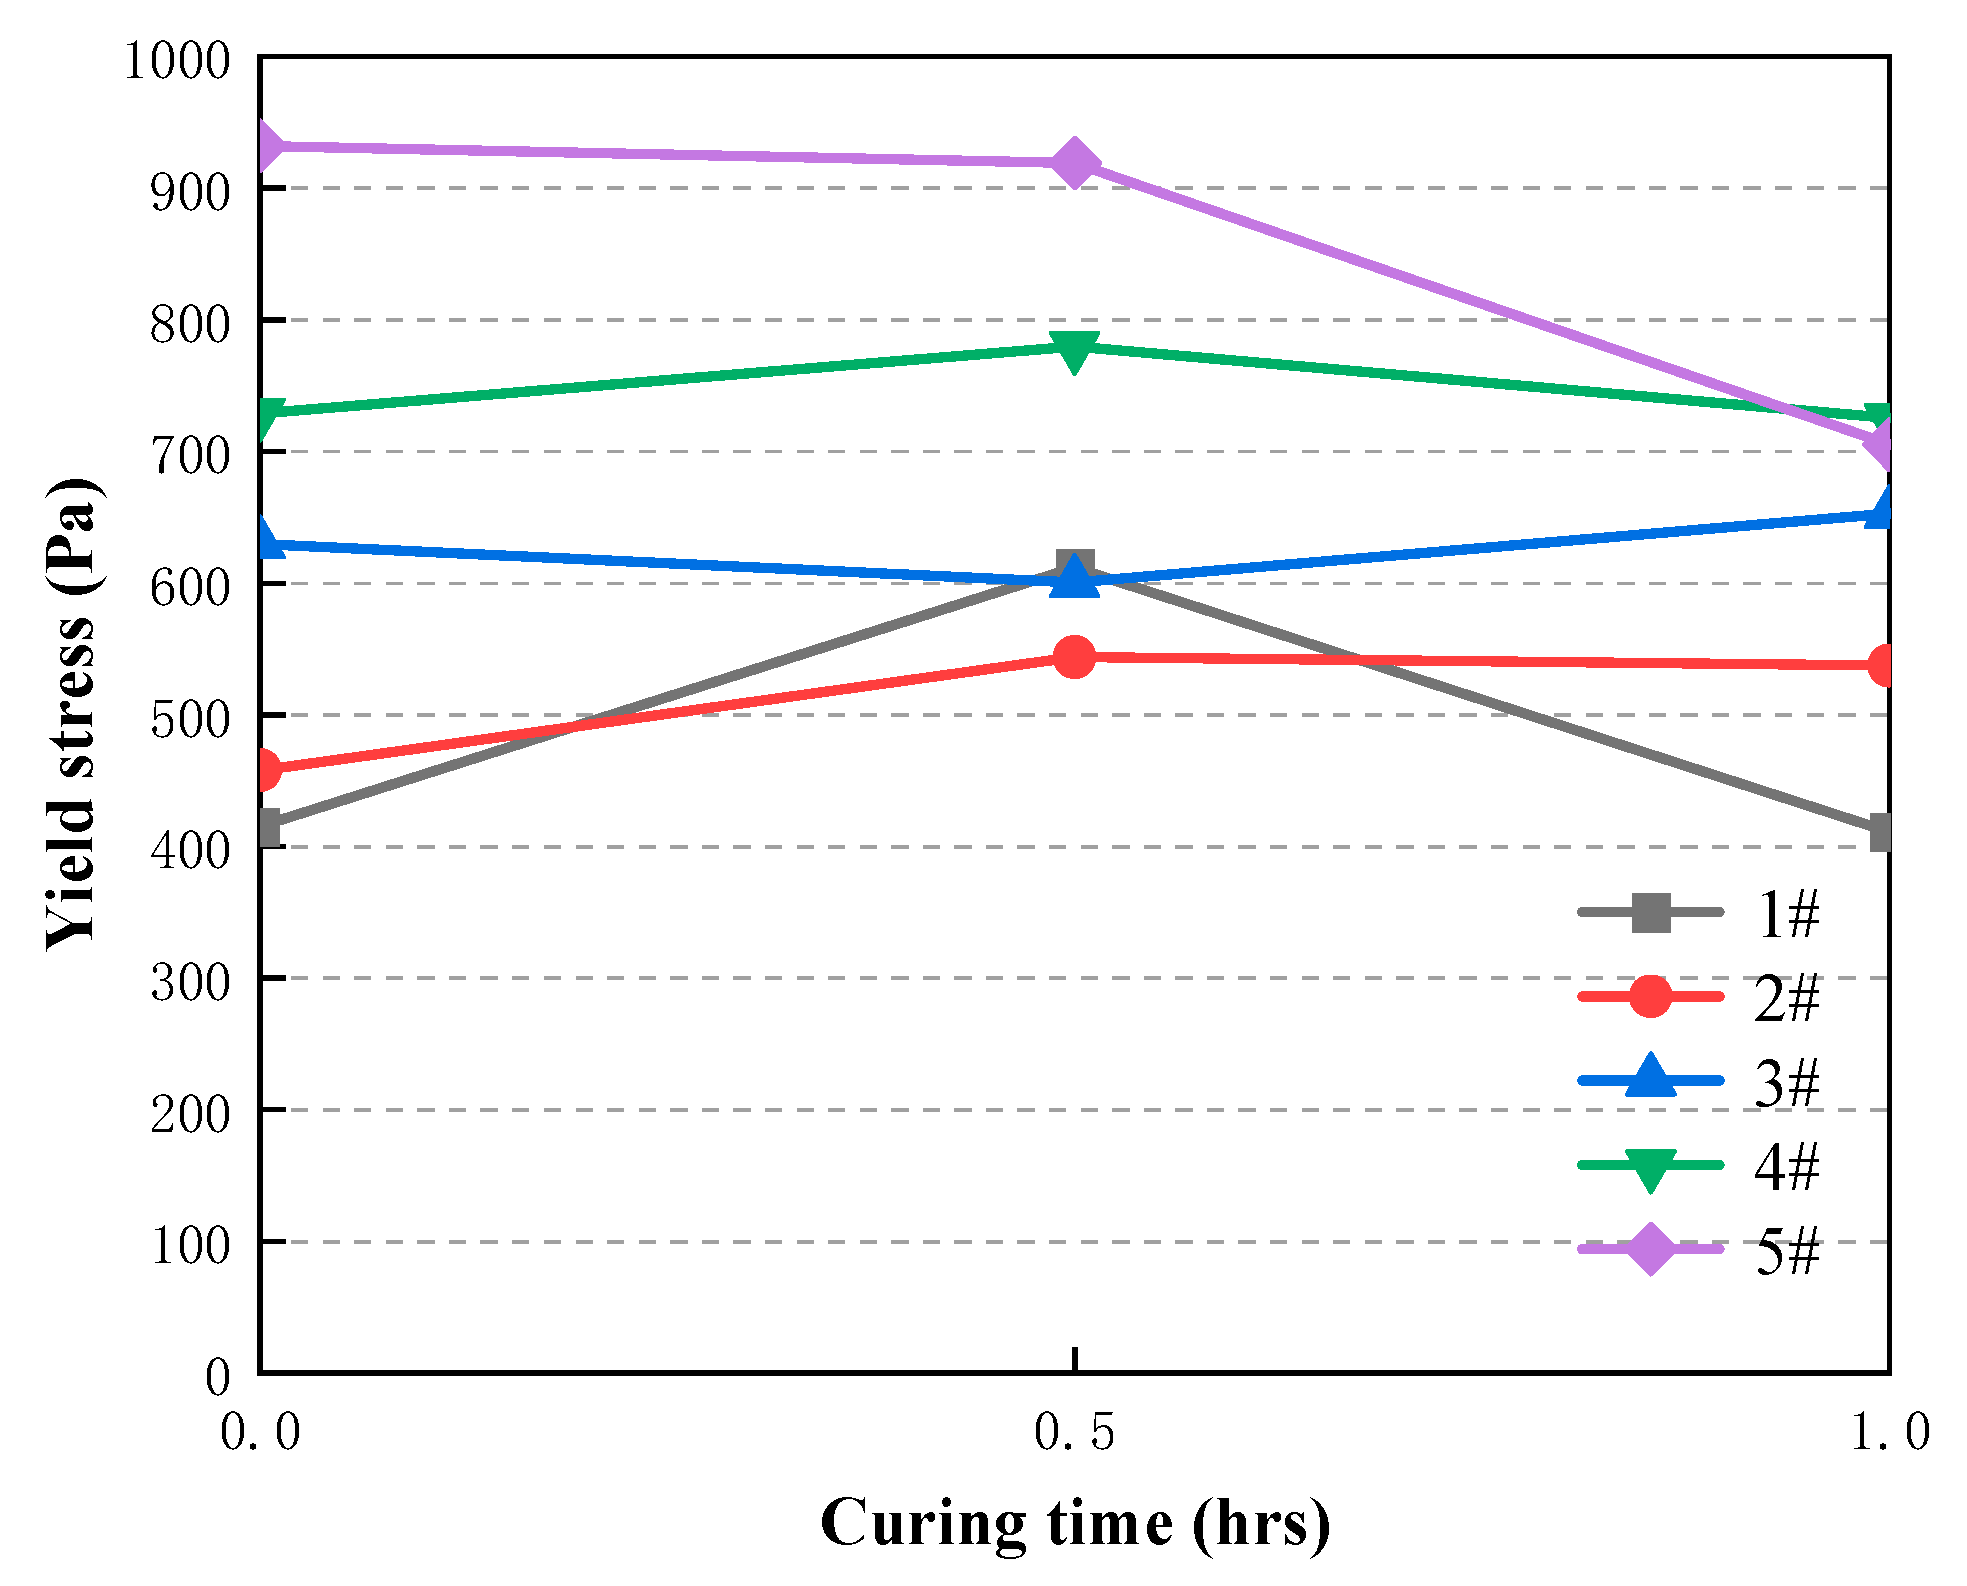
The variation of the yield stress between 0h and 1h for different types of slurry 1#-5# is shown in Figure 14.
It shows that the age of maintenance has a great influence on the yield stress value of 1#-5# slurry in Fig 14, in which the yield stress value of 1# slurry increases from 415.16 Pa at 0h to 611.65 Pa at 0.5h; this is mainly because the hydration reaction of cement in the slurry increases with time and the hydration products keep increasing, which causes the yield stress value of the slurry to become largely. It leads to an increase in the frictional resistance between the fly ash particles and gangue particles of CAFB, which enlargements the yield stress[41]. Furthermore, more hydration products will greatly increase the cohesion among cement particles, fly ash particles and gangue particles, resulting in an increase in yield stress[40,42].During the period of 0.5h-1h, the yield stress values of 1#, 4# and 5# slurry were significantly reduced from 611.65 Pa, 779.76 Pa and 919.08 Pa to 410.89 Pa, 725.24 Pa and 705.04 Pa. The reason for this is that the increase of cement hydration products C-S-H, CH, ettringite wrapped in aeolian sand and coal gangue surface, and fill the pores therein, greatly reducing the yield stress of CAFB.
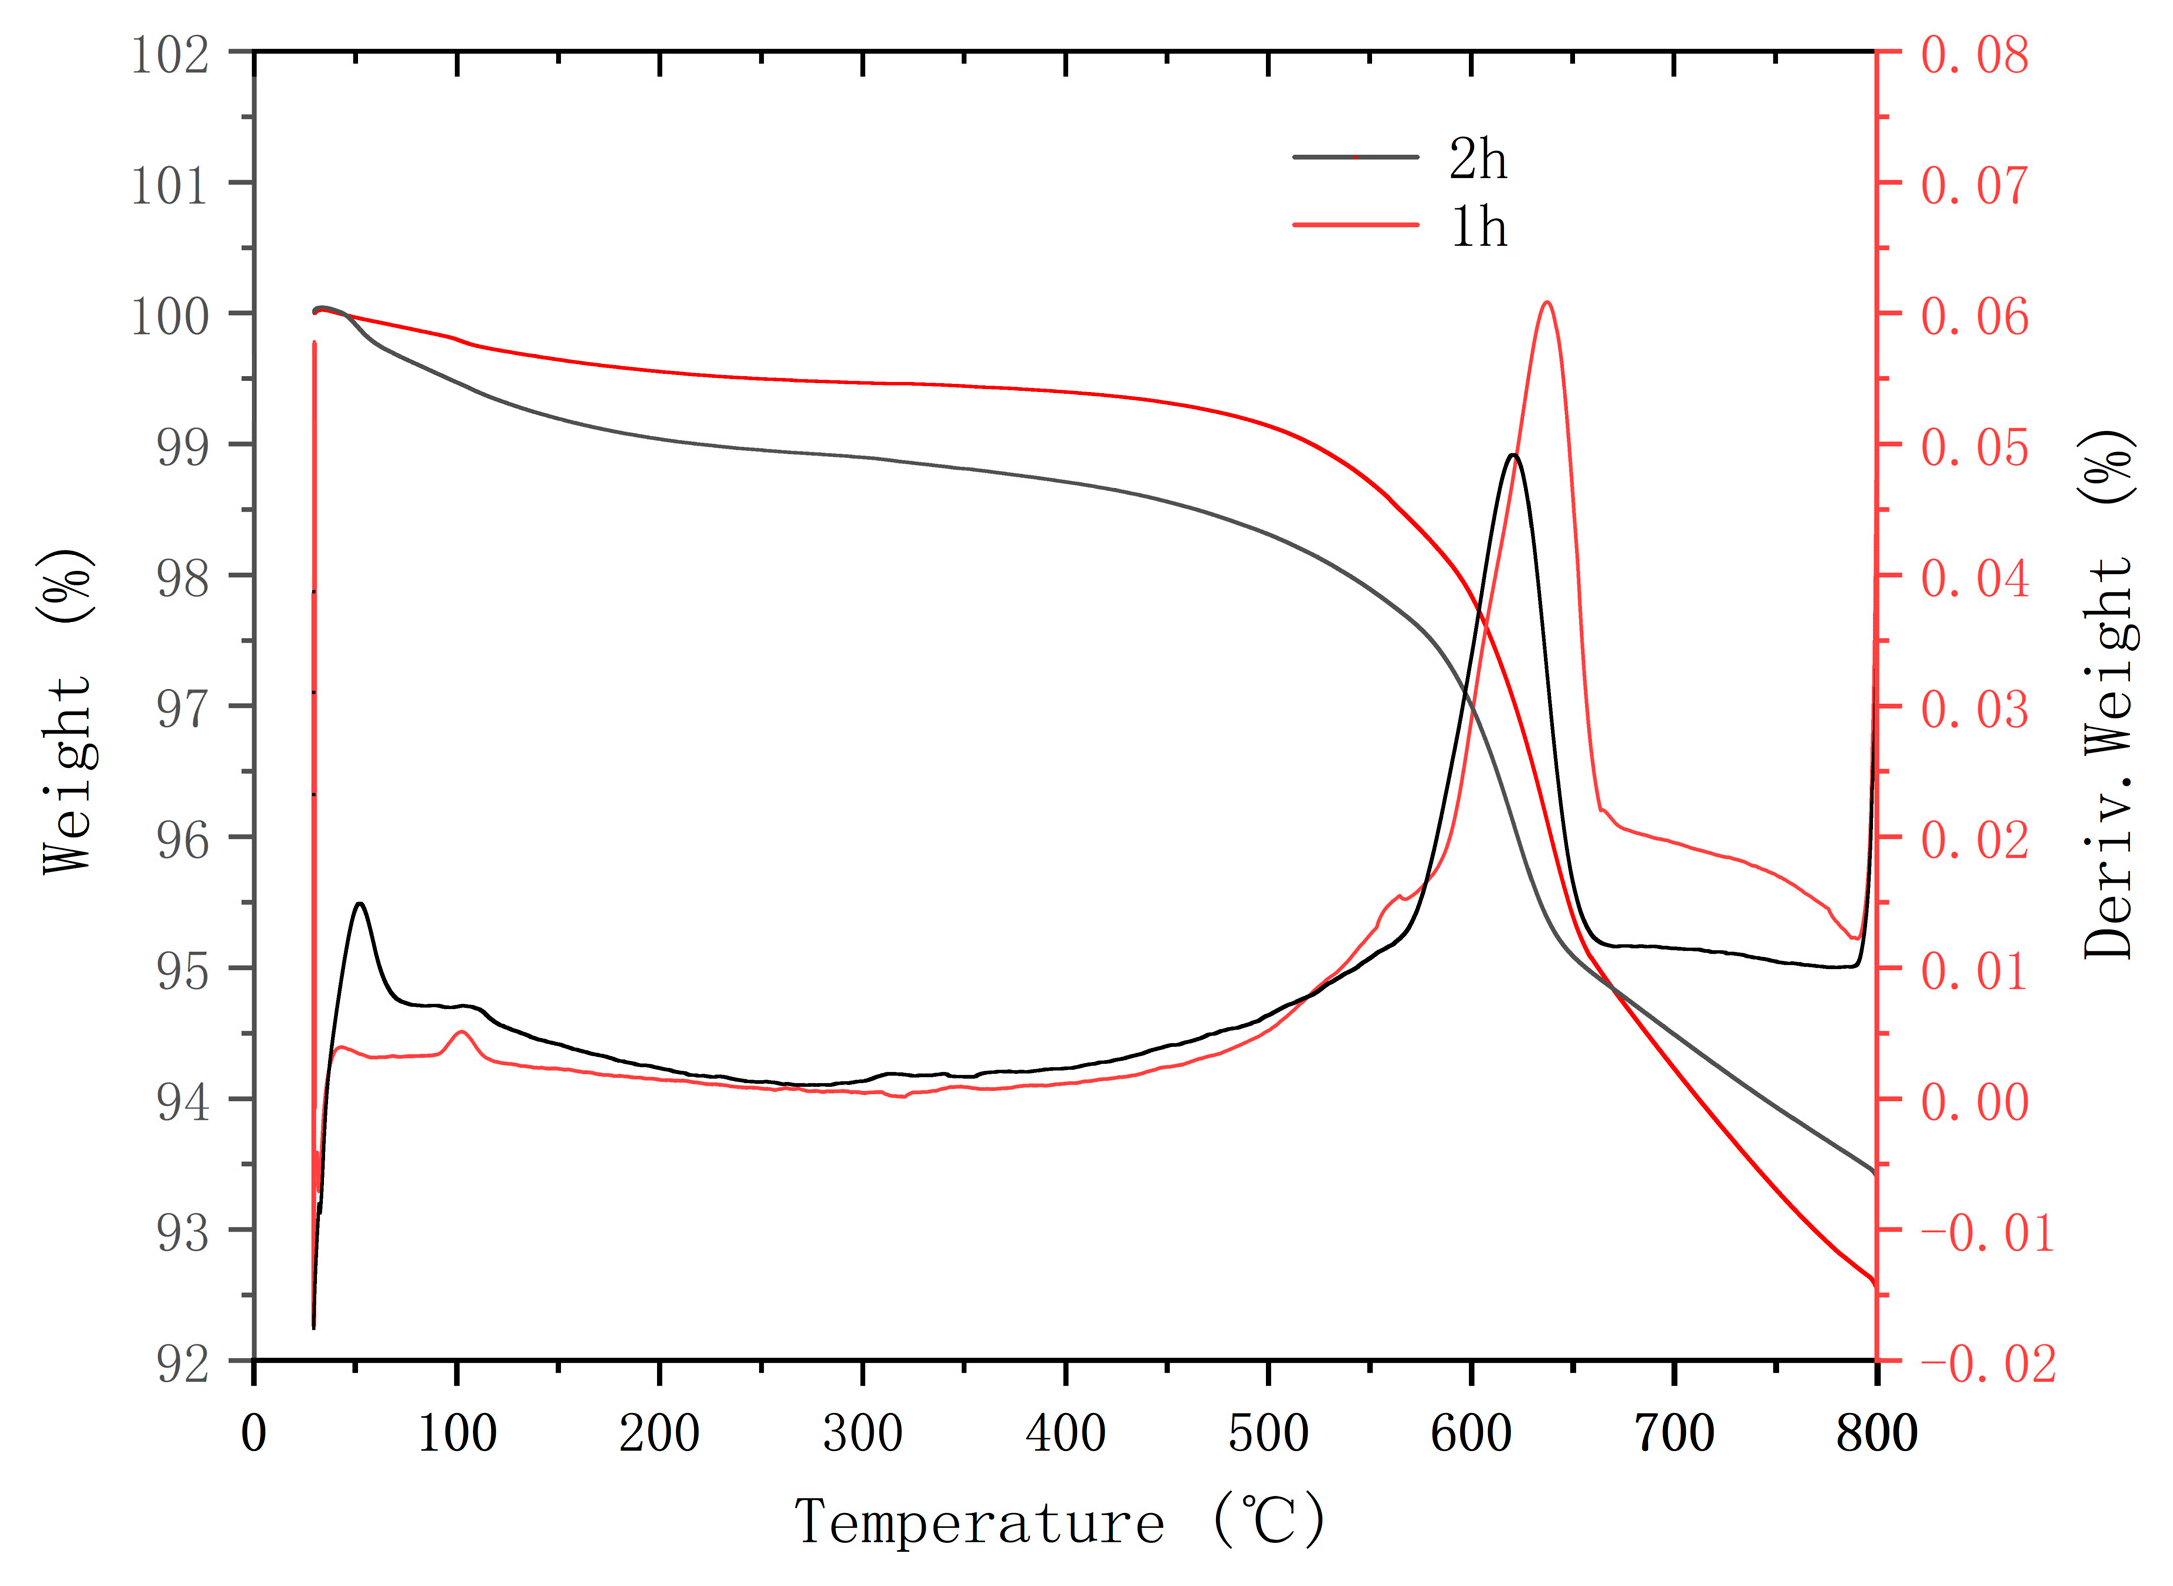
The TG/DTG analysis results experimentally support the increase in hydration products due to longer maintenance period in Figure 15. It shows the results of TG/DTG analysis of the slurry of CAFB samples for 1 hour and 2 hours. The DTG curve shows two main internal heat peaks, which are related to the rapid weight loss and the main phase transition. The first internal heat peak appeared at 102.92 °C, which the weight loss appeared between 114 °C and 116 °C, and the weight change was 0.430 % within 1 hour. However, the first internal heat peak appeared at 51.36 °C, which the weight loss appeared between 48.13 °C and 81.91 °C, and the weight change was 0.997 % within 2 hours, which was reasons for the dehydration of hydration products, such as C-S-H, carbo aluminates, ettringite, and gypsum[43]. In fact, previous studies have also concluded that the decomposition of gypsum and ettringite and the dehydration of some carbo aluminate hydrates occur in the temperature range of 60-200 °C. Two internal heat peaks were found at 637.09 °C, which the weight loss was found between 585.76 °C and 658.12 °C, and the weight change was 6.552 % within 1 hour. However, two internal heat peaks were found at 620.26 °C, which the weight loss was found between 575.44 °C and 639 °C. Comparing the TG/DTG diagrams of the slurry cured for 1 hour and 2 hours, the latter has more weight loss or higher peaks in the temperature range of 60-200 °C. It indicates that the CAFB maintained for a long time will have more cement hydration products (C-S-H, ettringite, etc.) than the samples maintained for a shorter time. It is obtained that the maintenance period on cement hydration process is consistent with the previous conclusion[44].

3.5. Time-dependent evolution of the rheological properties of CAFB with plasticizer

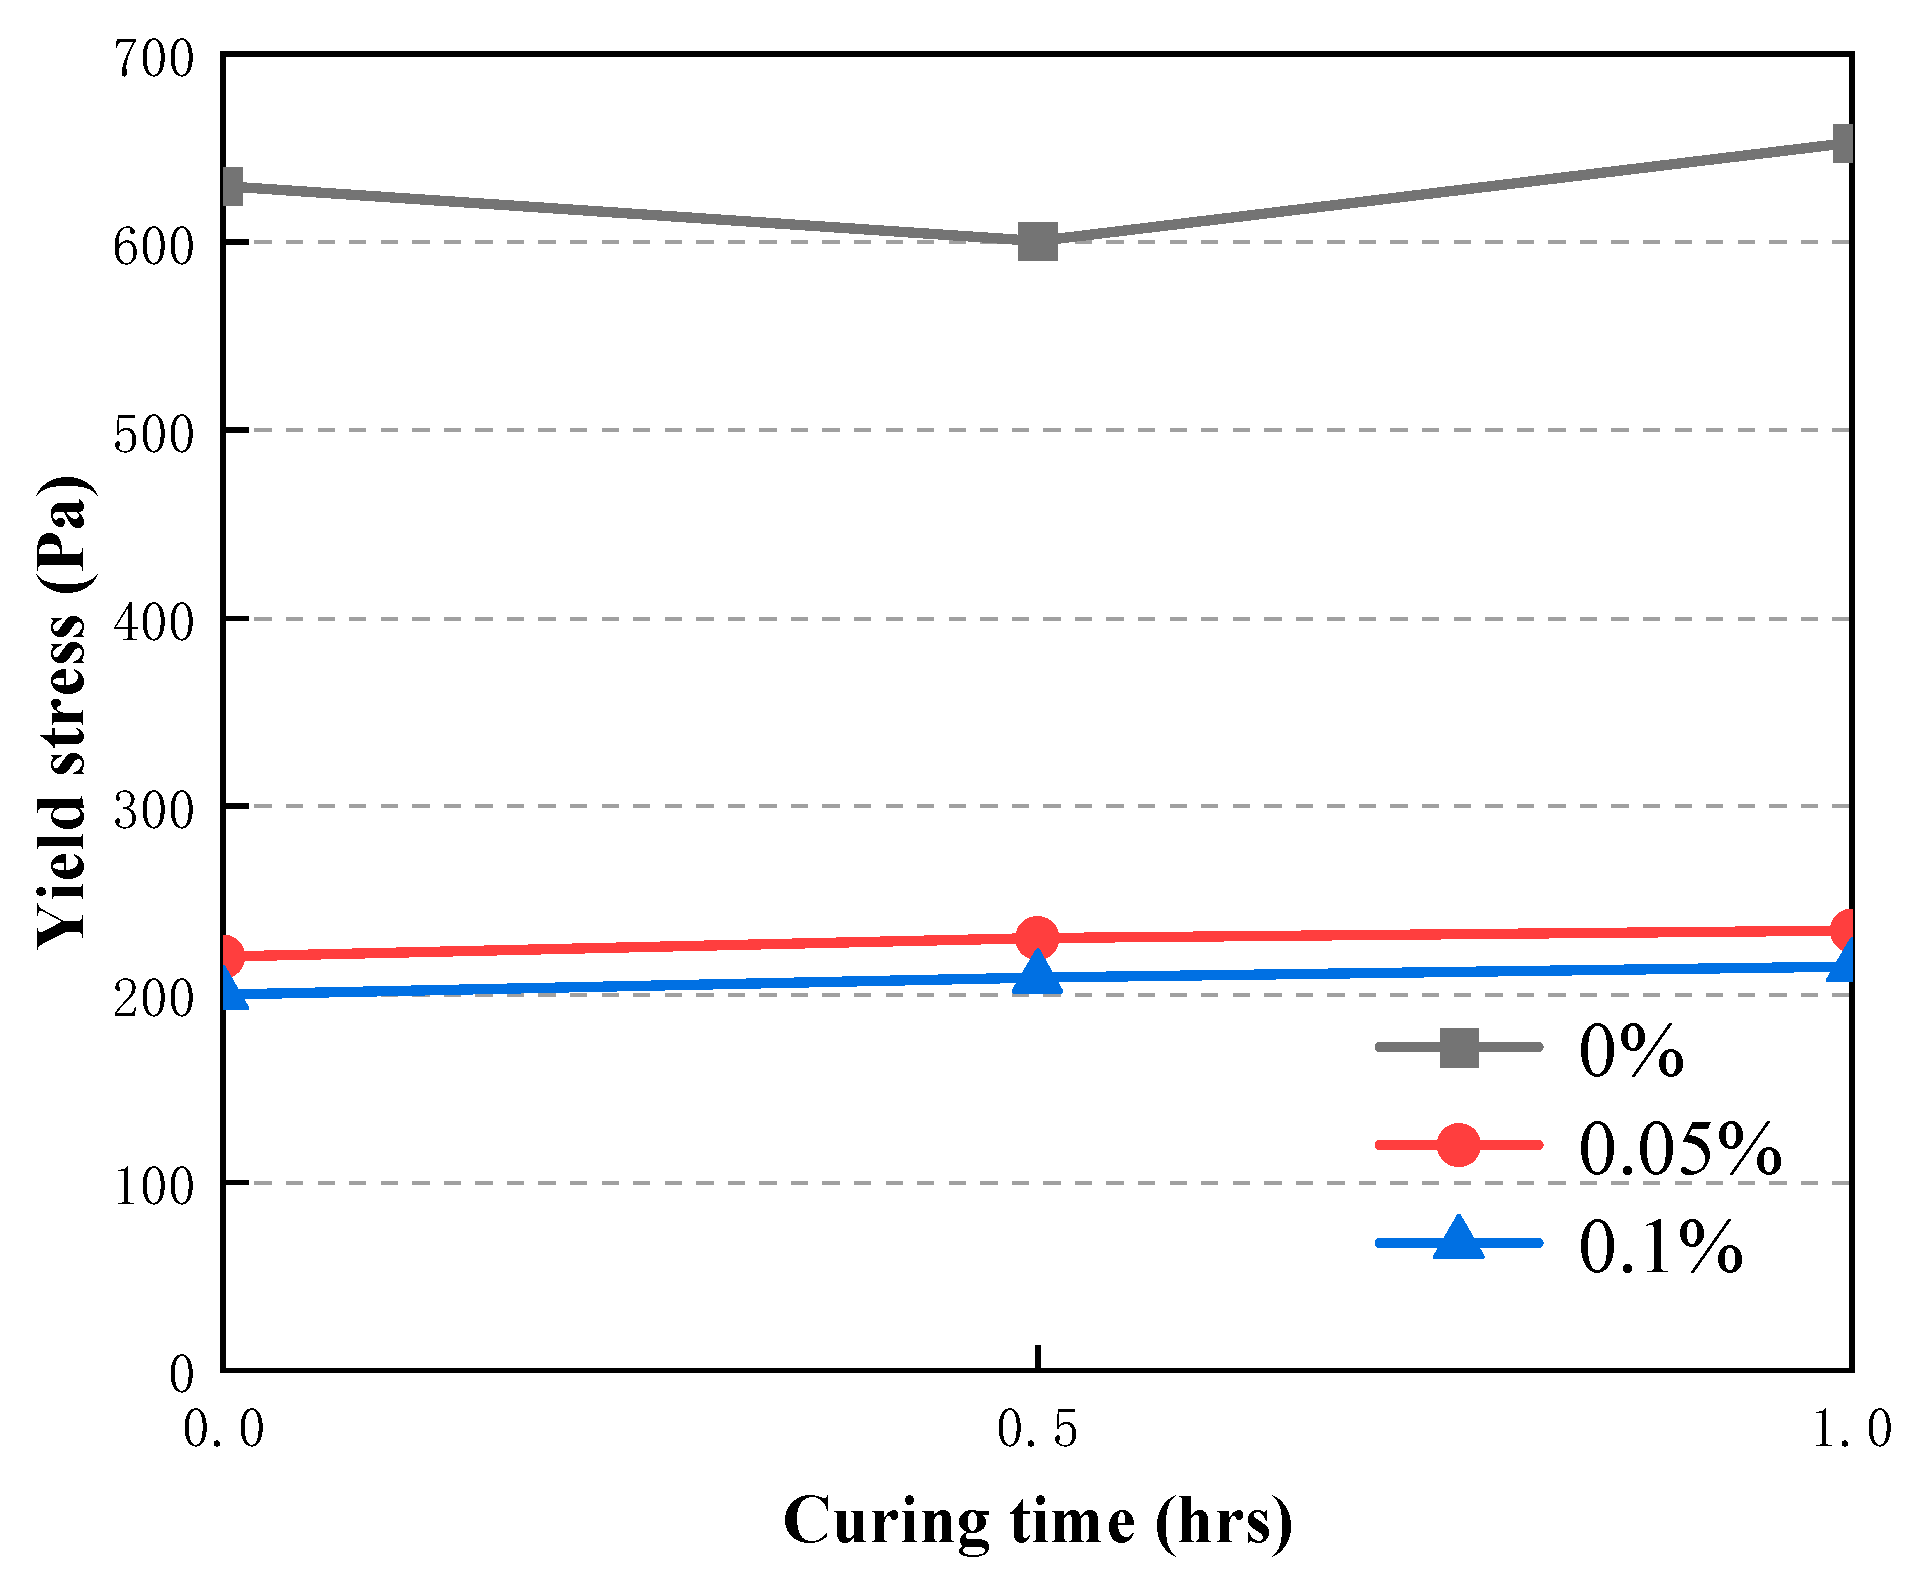
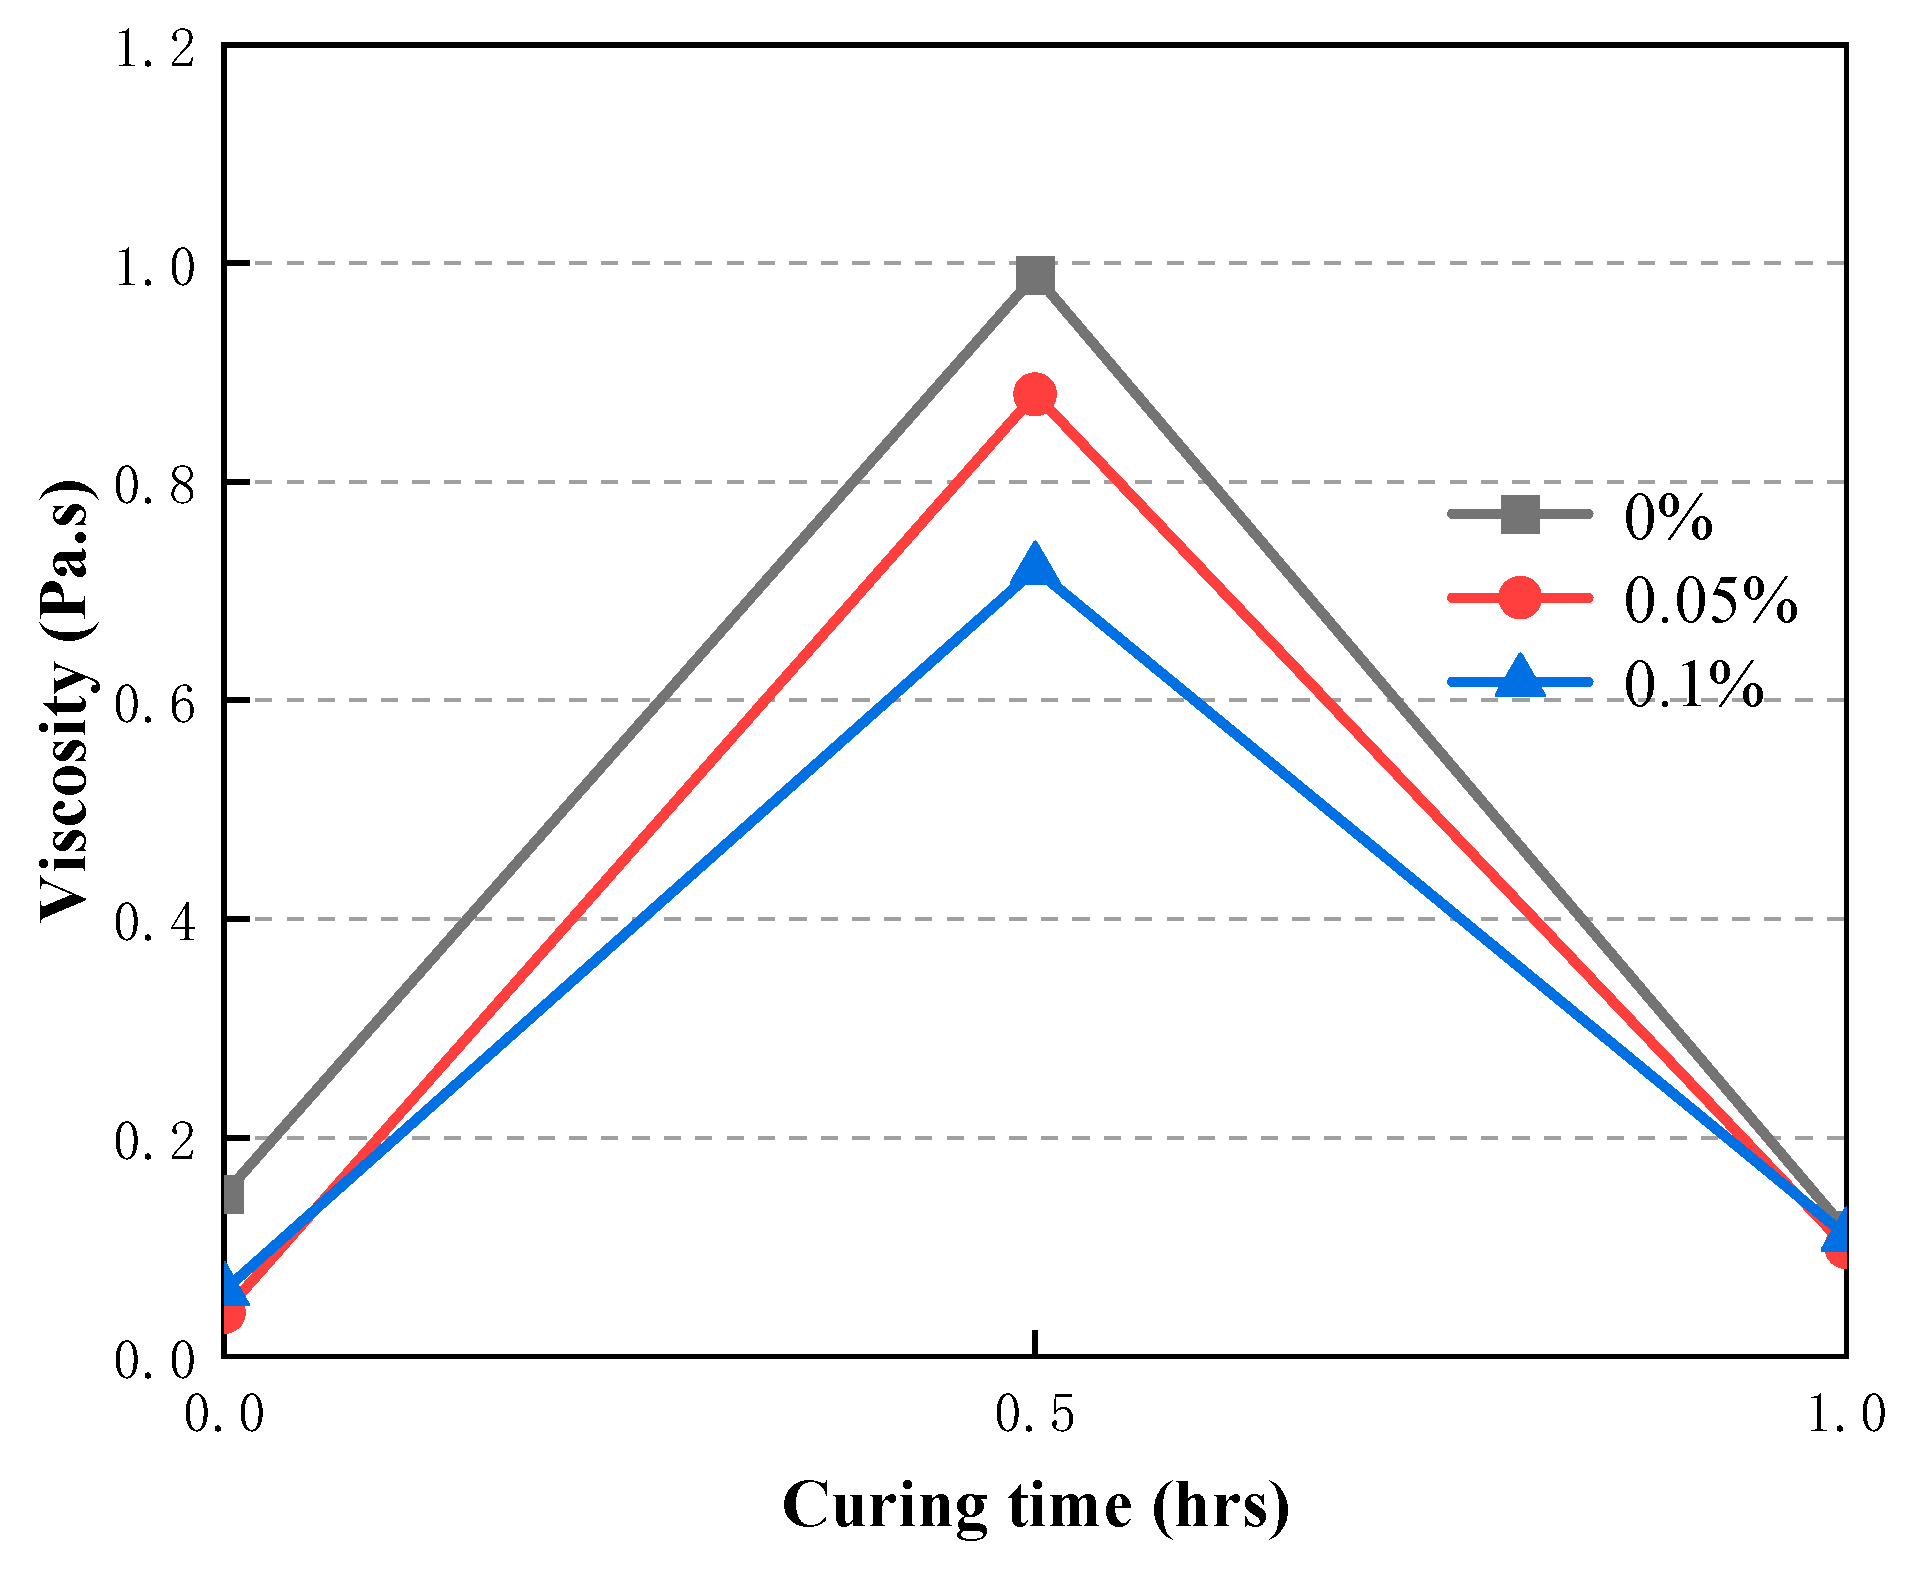
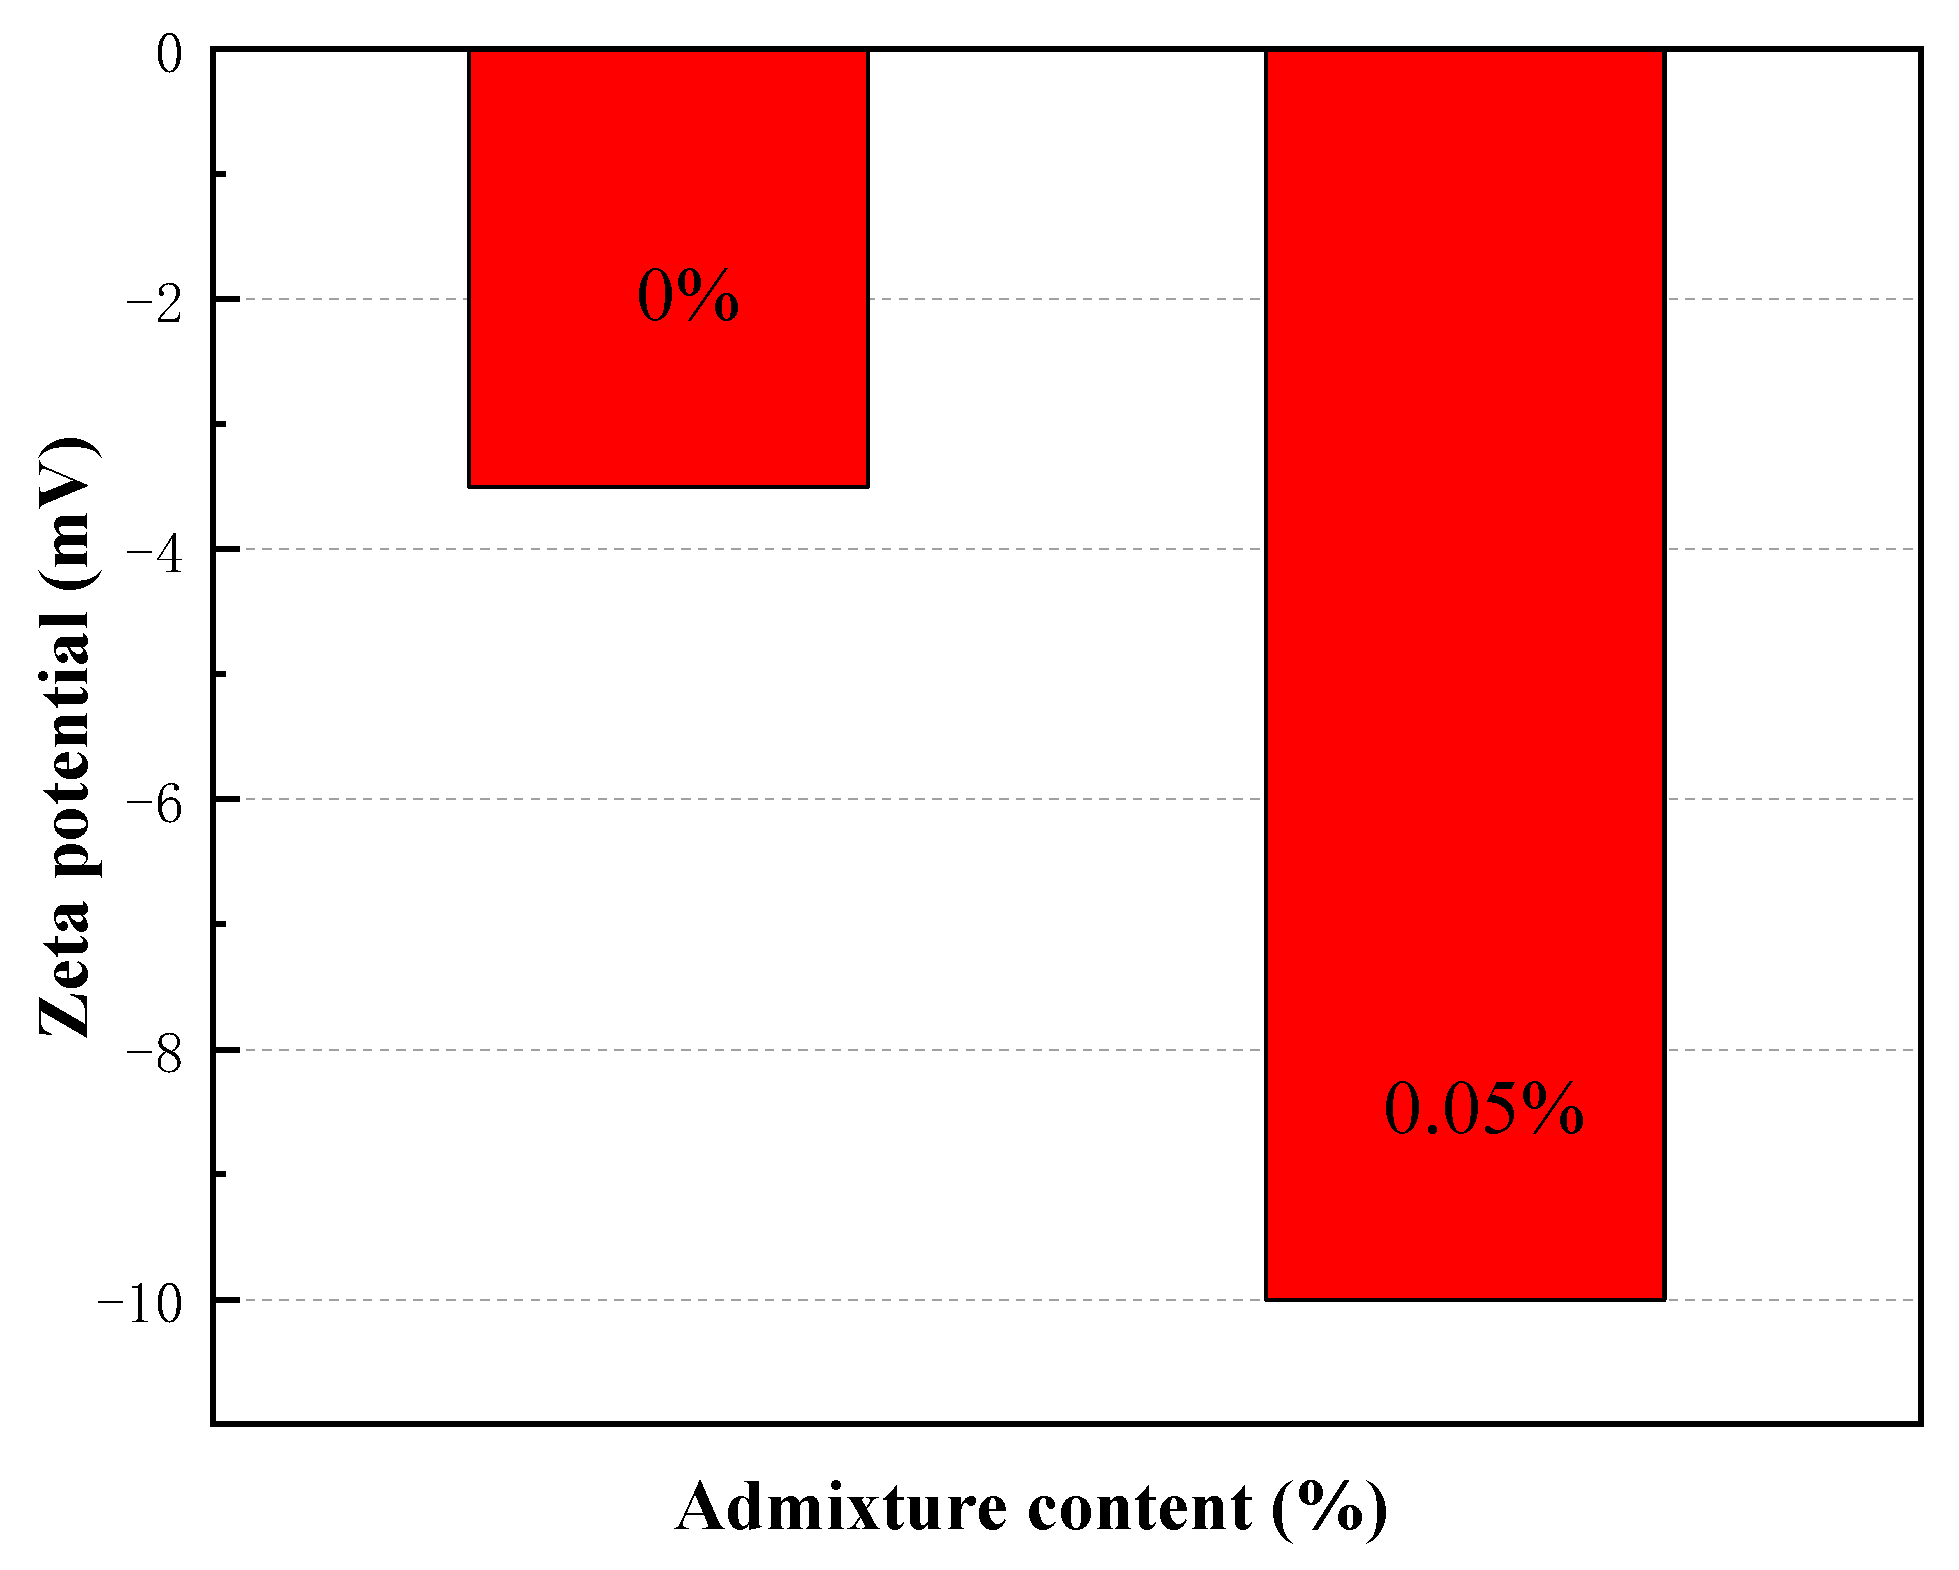
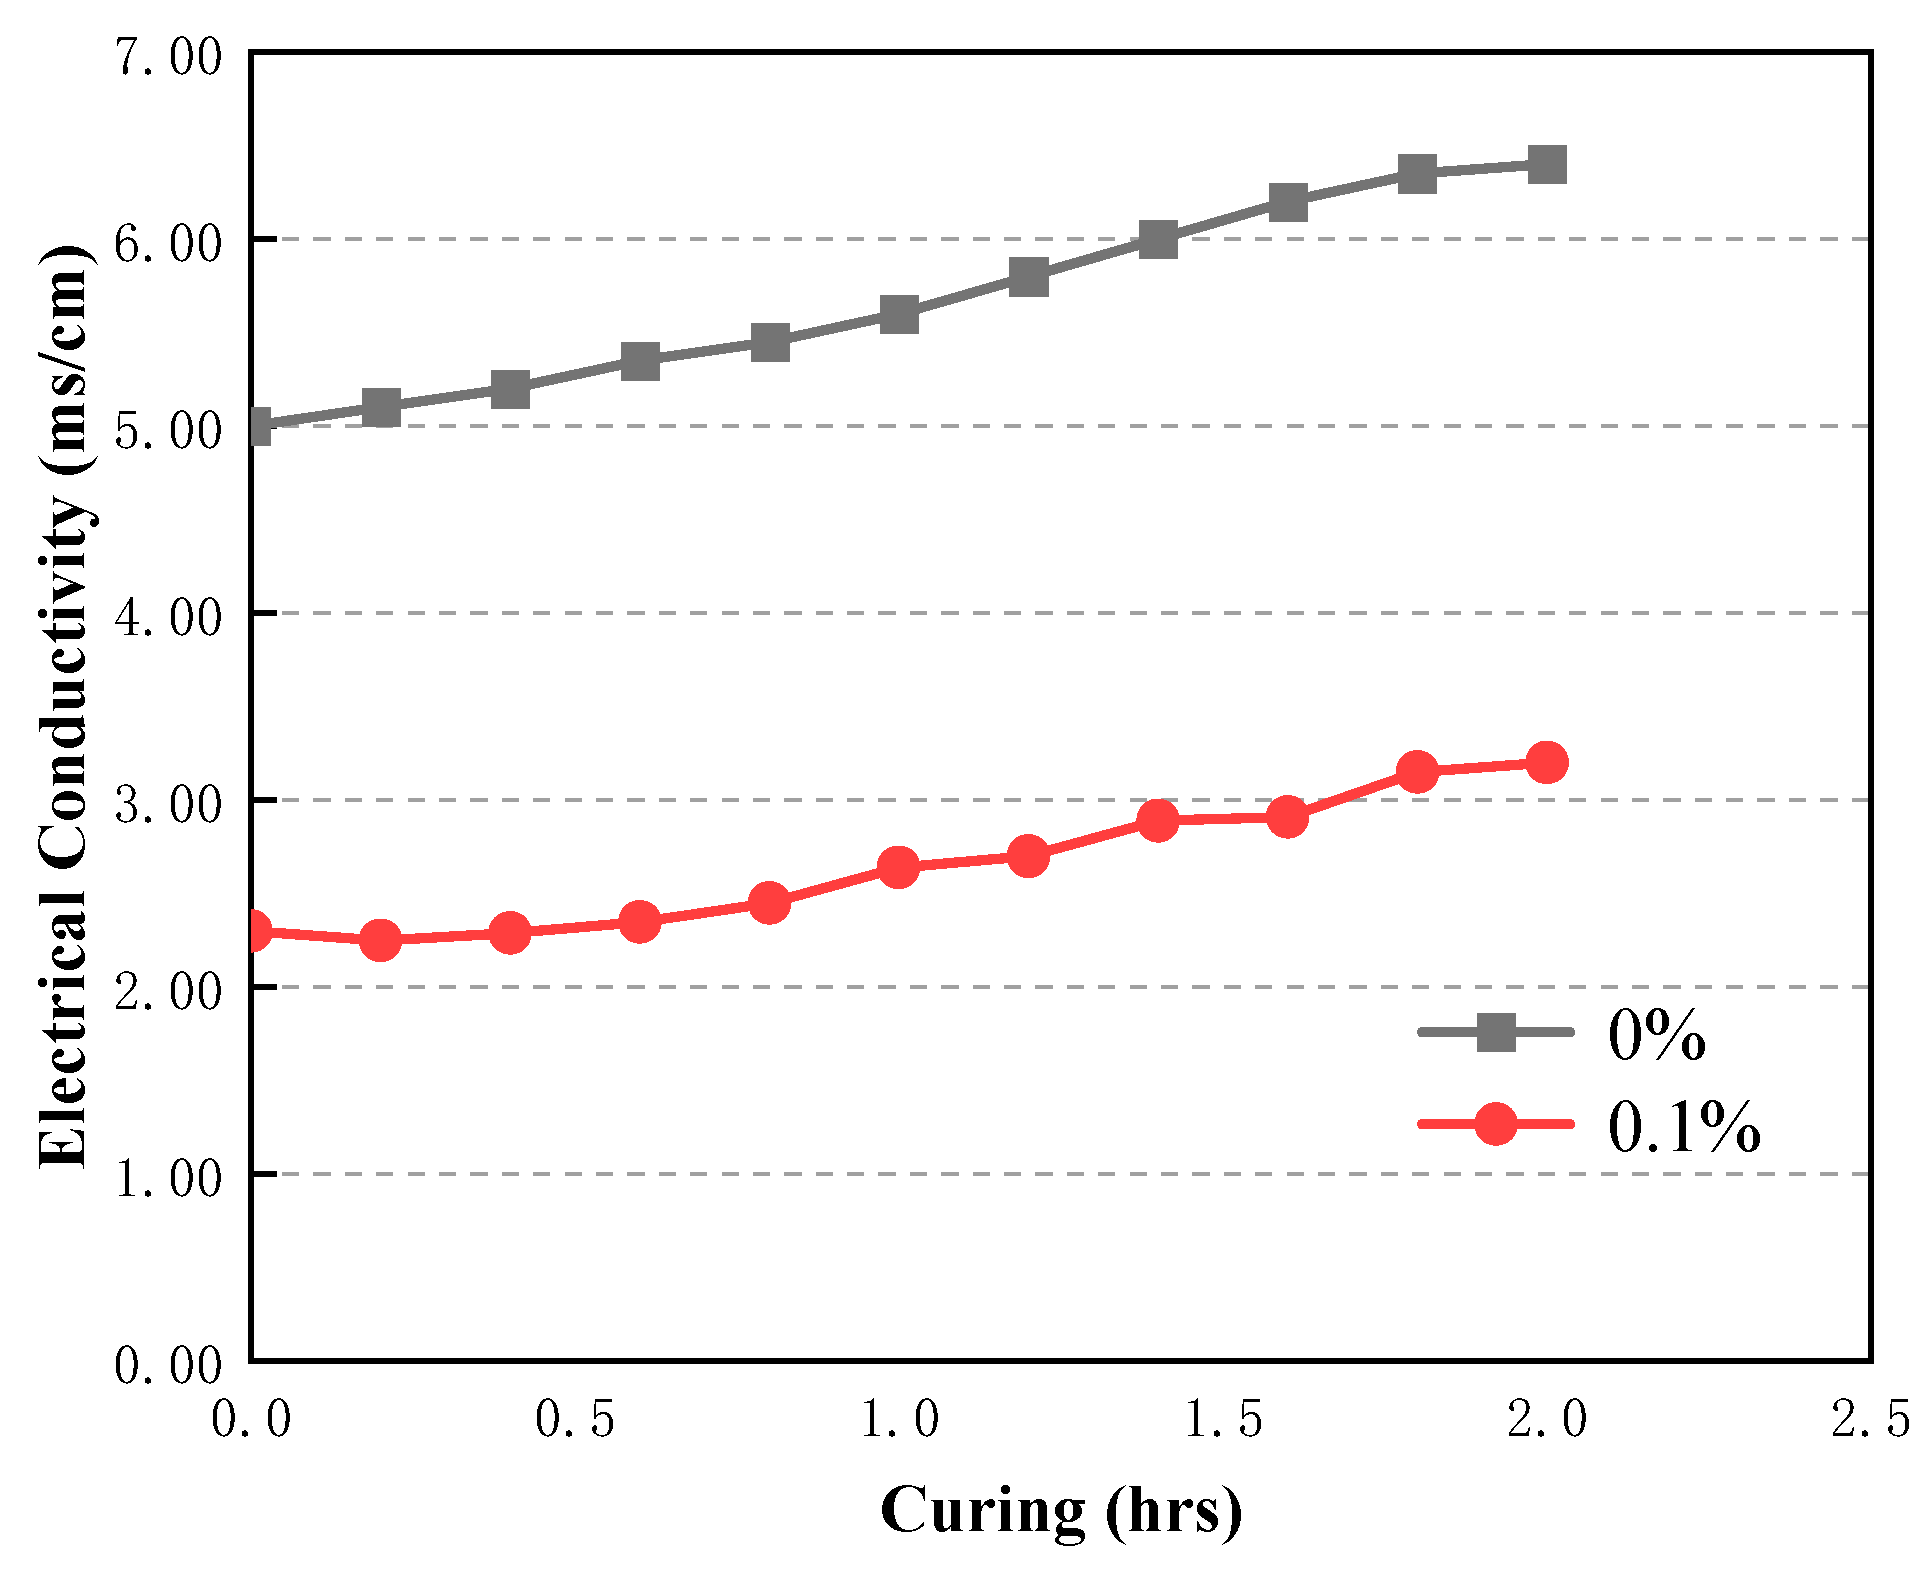
Viscosity and yield stress were used to study the rheology of fresh CAFB made with different ratios of plasticizer. At the early stages of preparation, the viscosity of CAFB without addition was a lot higher than that with addition of 0.05 % and 0.1 % as shown in Figure 17. With moderate additions of 0.05 %, the viscosity decreased from 0.148 Pa·s to about 0.04 Pa·s at 0 h, and this tendency continued for the rest of the maintenance period. Similarly, it shows the development of yield stress in the first 1 hour of mixing in Figure 16. Likewise, the adding of the plasticizer led to a proportionate reduction in the yield stress of CAFB[8,20]. In the maintenance period of 1 hour, the yield stress decreased more obviously. The yield stress of 0.05 % admixture content decreased from 652 Pa to 234 Pa, and the yield stress of 0.1 % admixture content decreased to 215 Pa. The increased fluidity observed from the 0.05 % and 0.1 % admixture content may be related to the dispersion effect of plasticizer. It can be seen from that the Zeta potential of CAFB with and without the mixture supports this point in Figure 18. The zeta potential of CAFB containing 0.05 % mixture was about −10 mV, while the untreated sample was −3.5 mV. This indicates that the repulsion between particles is much higher in the presence of plasticizers[42]. Another explanation for the change in CAFB fluidity caused by the adding of plasticizers is its effect on cement hydration. Due to the increase of repulsive force among cement particles, fly ash particles and gangue particles, less hydration by-products are produced, and the viscosity of CAFB decreases with the decrease of solid content[45,46,47,48]. In addition, the EC monitoring results support the conclusion that the plasticizer postpones the hydration reaction in Figure 19. The EC of CAFB containing 0.1 % plasticizer was obviously lower than that containing 0 % CAFB. Therefore, the mobility of ions is higher in CAFB without dopants[38,39].
Figure 16. Time-dependent evolution of yield stress of CAFB containing different dosages of plasticizer.
Preprints 78731 g016
Figure 17. Time-dependent evolution of viscosity of CAFB containing different dosages of plasticizer.
Preprints 78731 g017
Figure 18. Effect of the plasticizer on the zeta potential of fresh CAFB made with different admixture content.
Preprints 78731 g018
Figure 19. Development of electrical conductivity in CAFB containing different dosages of plasticizer.
Preprints 78731 g019
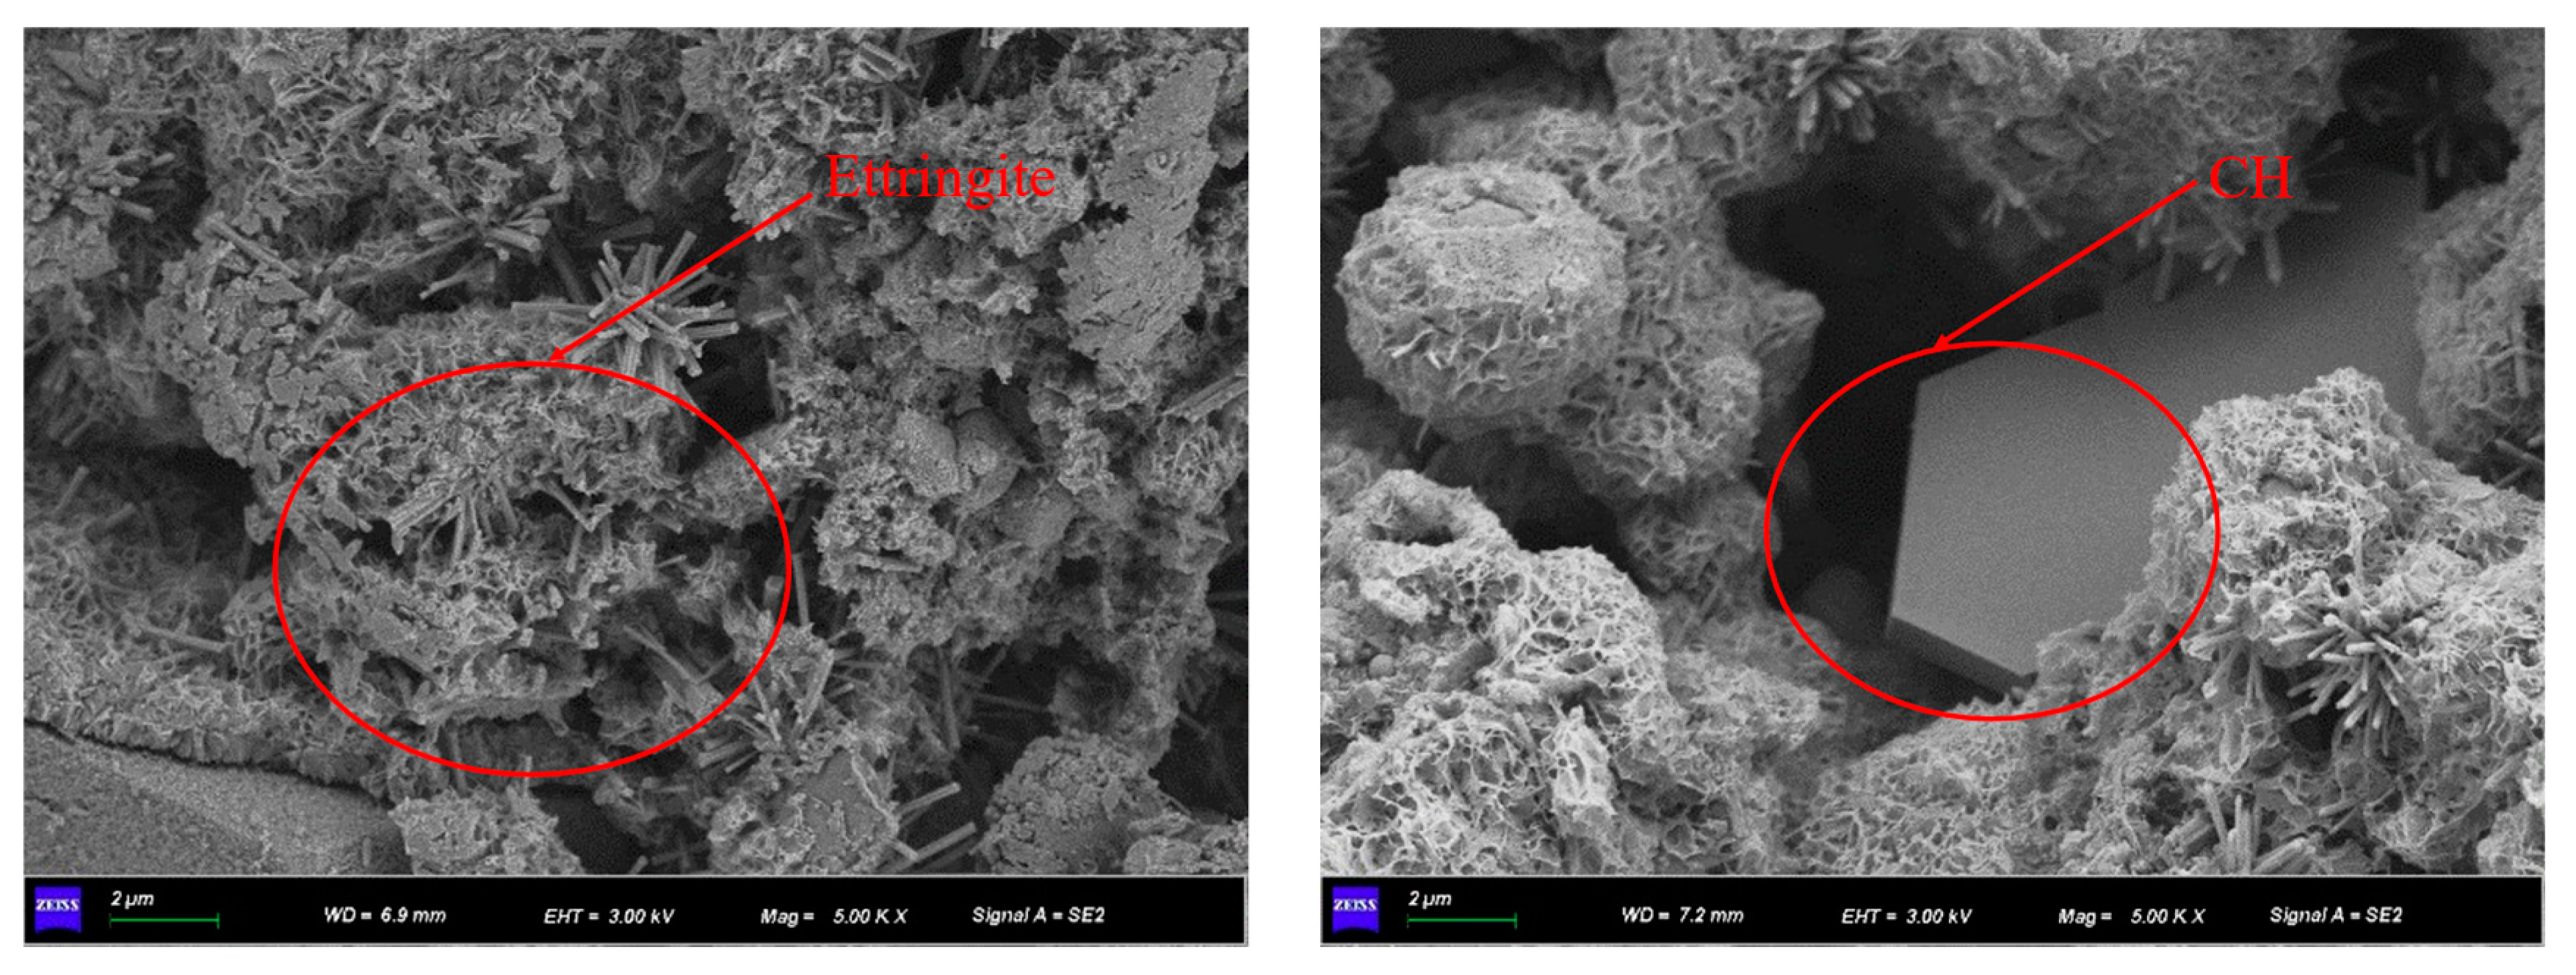
It can also be seen that the yield stress of CAFB samples increase smoothly with the maintenance period owing to the hydration process of cement and the surface absorption of poorly crystalline C-S-H gels in Figure 16. Once the cement is in contact with water, the chemical reaction usually begins[24]. In addition, it can be seen by electron microscope scan that CAFB with maintenance age of 3 d can clearly see C-S-H, CH, ettringite filling around the aeolian sand and coal gangue, which affects the fluidity of CAFB slurry, as shown in Figure 20[20,46,48,49,50,51,52].

5. Conclusions

The time-dependent rheological properties of fresh CAFB treated with the Master Glenium plasticizer and cured under different ratio of aeolian sand / coal gangue were studied in this paper. Plasticizer dosages of 0, 0.05, and 0.1% of the total CAFB weight were used. Additional tests such as thermal analysis and zeta potential analysis were conducted to understand the reasons behind the nature of the results observed. The major conclusions based on the results obtained are summarized below.
  • 3#, 4# and 5# slurry flow index change pattern is basically the same, the index n which characterizes the flow property is greater than 1 after 3 min resting, belongs to swelling body; n is close to 1 after 30min resting, belongs to Bingham body; n is less than 1 after 60 min resting, belongs to pseudoplastic body; 1# and 2# slurry in 3-30min flow index is greater than 1, belongs to swelling body, After 60min of resting, the flow pattern of slurry changes n is less than 1, which belongs to pseudoplastic body.
  • With the increase of shear rate and shear time, the viscosity first gradually decreases and then stabilizes, i.e., the rheological properties of the slurry have the characteristic of “shear thinning”; the rheological properties of the slurry process is the comprehensive embodiment of a variety of model composite properties, with the increase of shear rate, the rheological curve of the slurry shows an upward convex shape, showing a pseudoplastic body-Bingham body-Pseudoplastic body(swelling body).
  • According to 2# and 3# mixed material, it will be grading configuration aeolian sand, coal gangue, fly ash filling slurry, to ensure long-distance pipeline conveying process slurry flow stability, to ensure smooth pipeline transport.
  • Curing time (0h-0.5h) results in a higher yield stress of the CAFB. It is because a longer curing time is associated with greater degree of cement hydration products. Curing time (0.5h-1h) results in a lower yield stress of the CAFB. Is is because more hydration products is associated with an decrease in the aeolian sand inter particle frictional resistance of the CAFB.
  • Addition of plasticizer to the CAFB significantly reduces the yield stress and viscosity of CAFB. An addition of 0.05% of the admixture results in over 65% reduction in yield stress at the time of preparation as well as after 1 h. A similar reduction was observed in the improvement of viscosity. The marginal reduction upon increasing the admixture to 0.1% is much less, indicating that an optimum percentage is around 0.05.

Author Contributions

Conceptualization, Z.Z.; data curation, J.J. and X.W.; funding acquisition, B.Y , Z.Z.; investigation, X.W. and C.G.; methodology, B.Y. and Z.Z.; project administration, Z.Z., J.J. and X.W.; resources, B.Y., Z.Z. and X.W.; supervision, X.W. and J.J.; validation, X.W.; visualization, Z.Z.; writing—original draft, Z.Z.; writing—review and editing, B.Y., Z.Z. and X.W. All authors have read and agreed to the published version of the manuscript.

Funding

This research received no external funding.

Data Availability Statement

Not applicable.

Conflicts of Interest

The authors declare no conflict of interest.

References

  1. Nasir, O.; Fall, M. Coupling Binder Hydration, Temperature and Compressive Strength Development of Underground Cemented Paste Backfill at Early Ages. Tunnelling and Underground Space Technology 2010, 25, 9–20. [Google Scholar] [CrossRef]
  2. Hu, J.; Wang, K. Effect of Coarse Aggregate Characteristics on Concrete Rheology. Construction and Building Materials 2011, 25, 1196–1204. [Google Scholar] [CrossRef]
  3. Deng, X.; Zhang, J.; Klein, B.; Zhou, N.; deWit, B. Experimental Characterization of the Influence of Solid Components on the Rheological and Mechanical Properties of Cemented Paste Backfill. International Journal of Mineral Processing 2017, 168, 116–125. [Google Scholar] [CrossRef]
  4. Nikbin, I.M.; Rahimi R, S.; Allahyari, H.; Fallah, F. Feasibility Study of Waste Poly Ethylene Terephthalate (PET) Particles as Aggregate Replacement for Acid Erosion of Sustainable Structural Normal and Lightweight Concrete. Journal of Cleaner Production 2016, 126, 108–117. [Google Scholar] [CrossRef]
  5. Zhou, N.; Ma, H.; Ouyang, S.; Germain, D.; Hou, T. Influential Factors in Transportation and Mechanical Properties of Aeolian Sand-Based Cemented Filling Material. Minerals 2019, 9, 116. [Google Scholar] [CrossRef]
  6. Minerals | Free Full-Text | Influential Factors in Transportation and Mechanical Properties of Aeolian Sand-Based Cemented Filling Material. Available online: https://www.mdpi.com/2075-163X/9/2/116 (accessed on 5 July 2023).
  7. Mining Developments and Social Impacts on Communities: Bowen Basin Case Studies: Rural Society: Vol 19, No 3. Available online: https://www.tandfonline.com/doi/abs/10.5172/rsj.19.3.211 (accessed on 5 July 2023).
  8. Chen, Q.; Zhang, Q.; Qi, C.; Fourie, A.; Xiao, C. Recycling Phosphogypsum and Construction Demolition Waste for Cemented Paste Backfill and Its Environmental Impact. Journal of Cleaner Production 2018, 186, 418–429. [Google Scholar] [CrossRef]
  9. The Effect of Superplasticisers on the Workability and Compressive Strength of Concrete Made with Fine Recycled Concrete Aggregates - ScienceDirect. Available online: https://www.sciencedirect.com/science/article/abs/pii/S095006181100599X (accessed on 5 July 2023).
  10. Saleh, S.; Mahmood, A.H.; Hamed, E.; Zhao, X.-L. The Mechanical, Transport and Chloride Binding Characteristics of Ultra-High-Performance Concrete Utilising Seawater, Sea Sand and SCMs. Construction and Building Materials 2023, 372, 130815. [Google Scholar] [CrossRef]
  11. Yılmaz, T.; Ercikdi, B.; Deveci, H. Utilisation of Construction and Demolition Waste as Cemented Paste Backfill Material for Underground Mine Openings. Journal of Environmental Management 2018, 222, 250–259. [Google Scholar] [CrossRef]
  12. Ercikdi, B.; Külekci, G.; Yılmaz, T. Utilization of Granulated Marble Wastes and Waste Bricks as Mineral Admixture in Cemented Paste Backfill of Sulphide-Rich Tailings. Construction and Building Materials 2015, 93, 573–583. [Google Scholar] [CrossRef]
  13. Ercikdi, B.; Cihangir, F.; Kesimal, A.; Deveci, H.; Alp, İ. Utilization of Industrial Waste Products as Pozzolanic Material in Cemented Paste Backfill of High Sulphide Mill Tailings. Journal of Hazardous Materials 2009, 168, 848–856. [Google Scholar] [CrossRef]
  14. Şahmaran, M.; Christianto, H.A.; Yaman, İ.Ö. The Effect of Chemical Admixtures and Mineral Additives on the Properties of Self-Compacting Mortars. Cement and Concrete Composites 2006, 28, 432–440. [Google Scholar] [CrossRef]
  15. Yin, S.; Wu, A.; Hu, K.; Wang, Y.; Zhang, Y. The Effect of Solid Components on the Rheological and Mechanical Properties of Cemented Paste Backfill. Minerals Engineering 2012, 35, 61–66. [Google Scholar] [CrossRef]
  16. Liu, Q.; Liu, D.; Liu, X.; Gao, F.; Li, S. Research and Application of Surface Paste Disposal for Clay-Sized Tailings in Tropical Rainy Climate. International Journal of Mineral Processing 2016, 157, 227–235. [Google Scholar] [CrossRef]
  17. Simon, D.; Grabinsky, M. Apparent Yield Stress Measurement in Cemented Paste Backfill. International Journal of Mining, Reclamation and Environment 2013, 27, 231–256. [Google Scholar] [CrossRef]
  18. Creber, K.J.; McGuinness, M.; Kermani, M.F.; Hassani, F.P. Investigation into Changes in Pastefill Properties during Pipeline Transport. International Journal of Mineral Processing 2017, 163, 35–44. [Google Scholar] [CrossRef]
  19. Mizani, S.; Simms, P. Method-Dependent Variation of Yield Stress in a Thickened Gold Tailings Explained Using a Structure Based Viscosity Model. Minerals Engineering 2016, 98, 40–48. [Google Scholar] [CrossRef]
  20. Panchal, S.; Deb, D.; Sreenivas, T. Variability in Rheology of Cemented Paste Backfill with Hydration Age, Binder and Superplasticizer Dosages. Advanced Powder Technology 2018, 29, 2211–2220. [Google Scholar] [CrossRef]
  21. Yield Stress and Thixotropy: On the Difficulty of Measuring Yield Stresses in Practice - Soft Matter (RSC Publishing). Available online: https://pubs.rsc.org/en/content/articlelanding/2006/SM/b517840a (accessed on 5 July 2023).
  22. Haiqiang, J.; Fall, M.; Cui, L. Yield Stress of Cemented Paste Backfill in Sub-Zero Environments: Experimental Results. Minerals Engineering 2016, 92, 141–150. [Google Scholar] [CrossRef]
  23. Fall, M.; Célestin, J.C.; Pokharel, M.; Touré, M. A Contribution to Understanding the Effects of Curing Temperature on the Mechanical Properties of Mine Cemented Tailings Backfill. Engineering Geology 2010, 114, 397–413. [Google Scholar] [CrossRef]
  24. Cui, L.; Fall, M. A Coupled Thermo–Hydro-Mechanical–Chemical Model for Underground Cemented Tailings Backfill. Tunnelling and Underground Space Technology 2015, 50, 396–414. [Google Scholar] [CrossRef]
  25. Wu, D.; Deng, T.; Zhao, R. A Coupled THMC Modeling Application of Cemented Coal Gangue-Fly Ash Backfill. Construction and Building Materials 2018, 158, 326–336. [Google Scholar] [CrossRef]
  26. Duan, G.; Huang, G.; Li, A.; Zhu, Y.; Gong, Y. A Study of Supermolecular Polarization of Comb-like Polycarboxylate Admixtures Synthesized with Polyoxyethylene Macromolecules. Journal of Molecular Liquids 2012, 174, 129–134. [Google Scholar] [CrossRef]
  27. Yang, L.; Yilmaz, E.; Li, J.; Liu, H.; Jiang, H. Effect of Superplasticizer Type and Dosage on Fluidity and Strength Behavior of Cemented Tailings Backfill with Different Solid Contents. Construction and Building Materials 2018, 187, 290–298. [Google Scholar] [CrossRef]
  28. Shi, C.; He, T.; Zhang, G.; Wang, X.; Hu, Y. Effects of Superplasticizers on Carbonation Resistance of Concrete. Construction and Building Materials 2016, 108, 48–55. [Google Scholar] [CrossRef]
  29. Prince, W.; Espagne, M.; Aı̈tcin, P.-C. Ettringite Formation: A Crucial Step in Cement Superplasticizer Compatibility. Cement and Concrete Research 2003, 33, 635–641. [Google Scholar] [CrossRef]
  30. Park, C.K.; Noh, M.H.; Park, T.H. Rheological Properties of Cementitious Materials Containing Mineral Admixtures. Cement and Concrete Research 2005, 35, 842–849. [Google Scholar] [CrossRef]
  31. Clayton, S.; Grice, T.G.; Boger, D.V. Analysis of the Slump Test for On-Site Yield Stress Measurement of Mineral Suspensions. International Journal of Mineral Processing 2003, 70, 3–21. [Google Scholar] [CrossRef]
  32. Jiang, H.; Fall, M.; Cui, L. Freezing Behaviour of Cemented Paste Backfill Material in Column Experiments. Construction and Building Materials 2017, 147, 837–846. [Google Scholar] [CrossRef]
  33. Conte, T.; Chaouche, M. Parallel Superposition Rheology of Cement Pastes. Cement and Concrete Composites 2019, 104, 103393. [Google Scholar] [CrossRef]
  34. Rubio-Hernández, F.-J. Rheological Behavior of Fresh Cement Pastes. Fluids 2018, 3, 106. [Google Scholar] [CrossRef]
  35. Ercikdi, B.; Cihangir, F.; Kesimal, A.; Deveci, H.; Alp, İ. Utilization of Water-Reducing Admixtures in Cemented Paste Backfill of Sulphide-Rich Mill Tailings. Journal of Hazardous Materials 2010, 179, 940–946. [Google Scholar] [CrossRef] [PubMed]
  36. Dzuy, N.Q.; Boger, D.V. Direct Yield Stress Measurement with the Vane Method. Journal of Rheology 1985, 29, 335–347. [Google Scholar] [CrossRef]
  37. Liu, M.; Lei, J.; Guo, L.; Du, X.; Li, J. The Application of Thermal Analysis, XRD and SEM to Study the Hydration Behavior of Tricalcium Silicate in the Presence of a Polycarboxylate Superplasticizer. Thermochimica Acta 2015, 613, 54–60. [Google Scholar] [CrossRef]
  38. Zeta Potential Measurement | SpringerLink. Available online: https://link.springer.com/protocol/10.1007/978-1-60327-198-1_6 (accessed on 5 July 2023).
  39. Elakneswaran, Y.; Nawa, T.; Kurumisawa, K. Zeta Potential Study of Paste Blends with Slag. Cement and Concrete Composites 2009, 31, 72–76. [Google Scholar] [CrossRef]
  40. Yahia, A.; Tanimura, M.; Shimoyama, Y. Rheological Properties of Highly Flowable Mortar Containing Limestone Filler-Effect of Powder Content and W/C Ratio. Cement and Concrete Research 2005, 35, 532–539. [Google Scholar] [CrossRef]
  41. Haiqiang, J.; Fall, M.; Cui, L. Yield Stress of Cemented Paste Backfill in Sub-Zero Environments: Experimental Results. Minerals Engineering 2016, 92, 141–150. [Google Scholar] [CrossRef]
  42. Ferrari, L.; Kaufmann, J.; Winnefeld, F.; Plank, J. Impact of Particle Size on Interaction Forces between Ettringite and Dispersing Comb-Polymers in Various Electrolyte Solutions. Journal of Colloid and Interface Science 2014, 419, 17–24. [Google Scholar] [CrossRef]
  43. Zhou, Q.; Glasser, F.P. Thermal Stability and Decomposition Mechanisms of Ettringite at <120°C. Cement and Concrete Research 2001, 31, 1333–1339. [Google Scholar] [CrossRef]
  44. Phan, T.H.; Chaouche, M.; Moranville, M. Influence of Organic Admixtures on the Rheological Behaviour of Cement Pastes. Cement and Concrete Research 2006, 36, 1807–1813. [Google Scholar] [CrossRef]
  45. Sun, Q.; Zhang, J.; Zhou, N. Early-Age Strength of Aeolian Sand-Based Cemented Backfilling Materials: Experimental Results. Arab J Sci Eng 2018, 43, 1697–1708. [Google Scholar] [CrossRef]
  46. Gong, Y.; Yang, J.; Sun, H.; Xu, F. Effect of Fly Ash Belite Cement on Hydration Performance of Portland Cement. Crystals 2021, 11, 740. [Google Scholar] [CrossRef]
  47. Dweck, J.; Buchler, P.M.; Coelho, A.C.V.; Cartledge, F.K. Hydration of a Portland Cement Blended with Calcium Carbonate. Thermochimica Acta 2000, 346, 105–113. [Google Scholar] [CrossRef]
  48. Hou, J.; Guo, Z.; Liu, W.; Zhang, Y. Mechanical Properties and Meso-Structure Response of Cemented Gangue-Fly Ash Backfill with Cracks under Seepage- Stress Coupling. Construction and Building Materials 2020, 250, 118863. [Google Scholar] [CrossRef]
  49. Zhou, N.; Zhang, J.; Ouyang, S.; Deng, X.; Dong, C.; Du, E. Feasibility Study and Performance Optimization of Sand-Based Cemented Paste Backfill Materials. Journal of Cleaner Production 2020, 259, 120798. [Google Scholar] [CrossRef]
  50. Li, M.; Zhang, J.; Li, A.; Zhou, N. Reutilisation of Coal Gangue and Fly Ash as Underground Backfill Materials for Surface Subsidence Control. Journal of Cleaner Production 2020, 254, 120113. [Google Scholar] [CrossRef]
  51. Haruna, S.; Fall, M. Time- and Temperature-Dependent Rheological Properties of Cemented Paste Backfill That Contains Superplasticizer. Powder Technology 2020, 360, 731–740. [Google Scholar] [CrossRef]
  52. Wu, D.; Yang, B.; Liu, Y. Transportability and Pressure Drop of Fresh Cemented Coal Gangue-Fly Ash Backfill (CGFB) Slurry in Pipe Loop. Powder Technology 2015, 284, 218–224. [Google Scholar] [CrossRef]
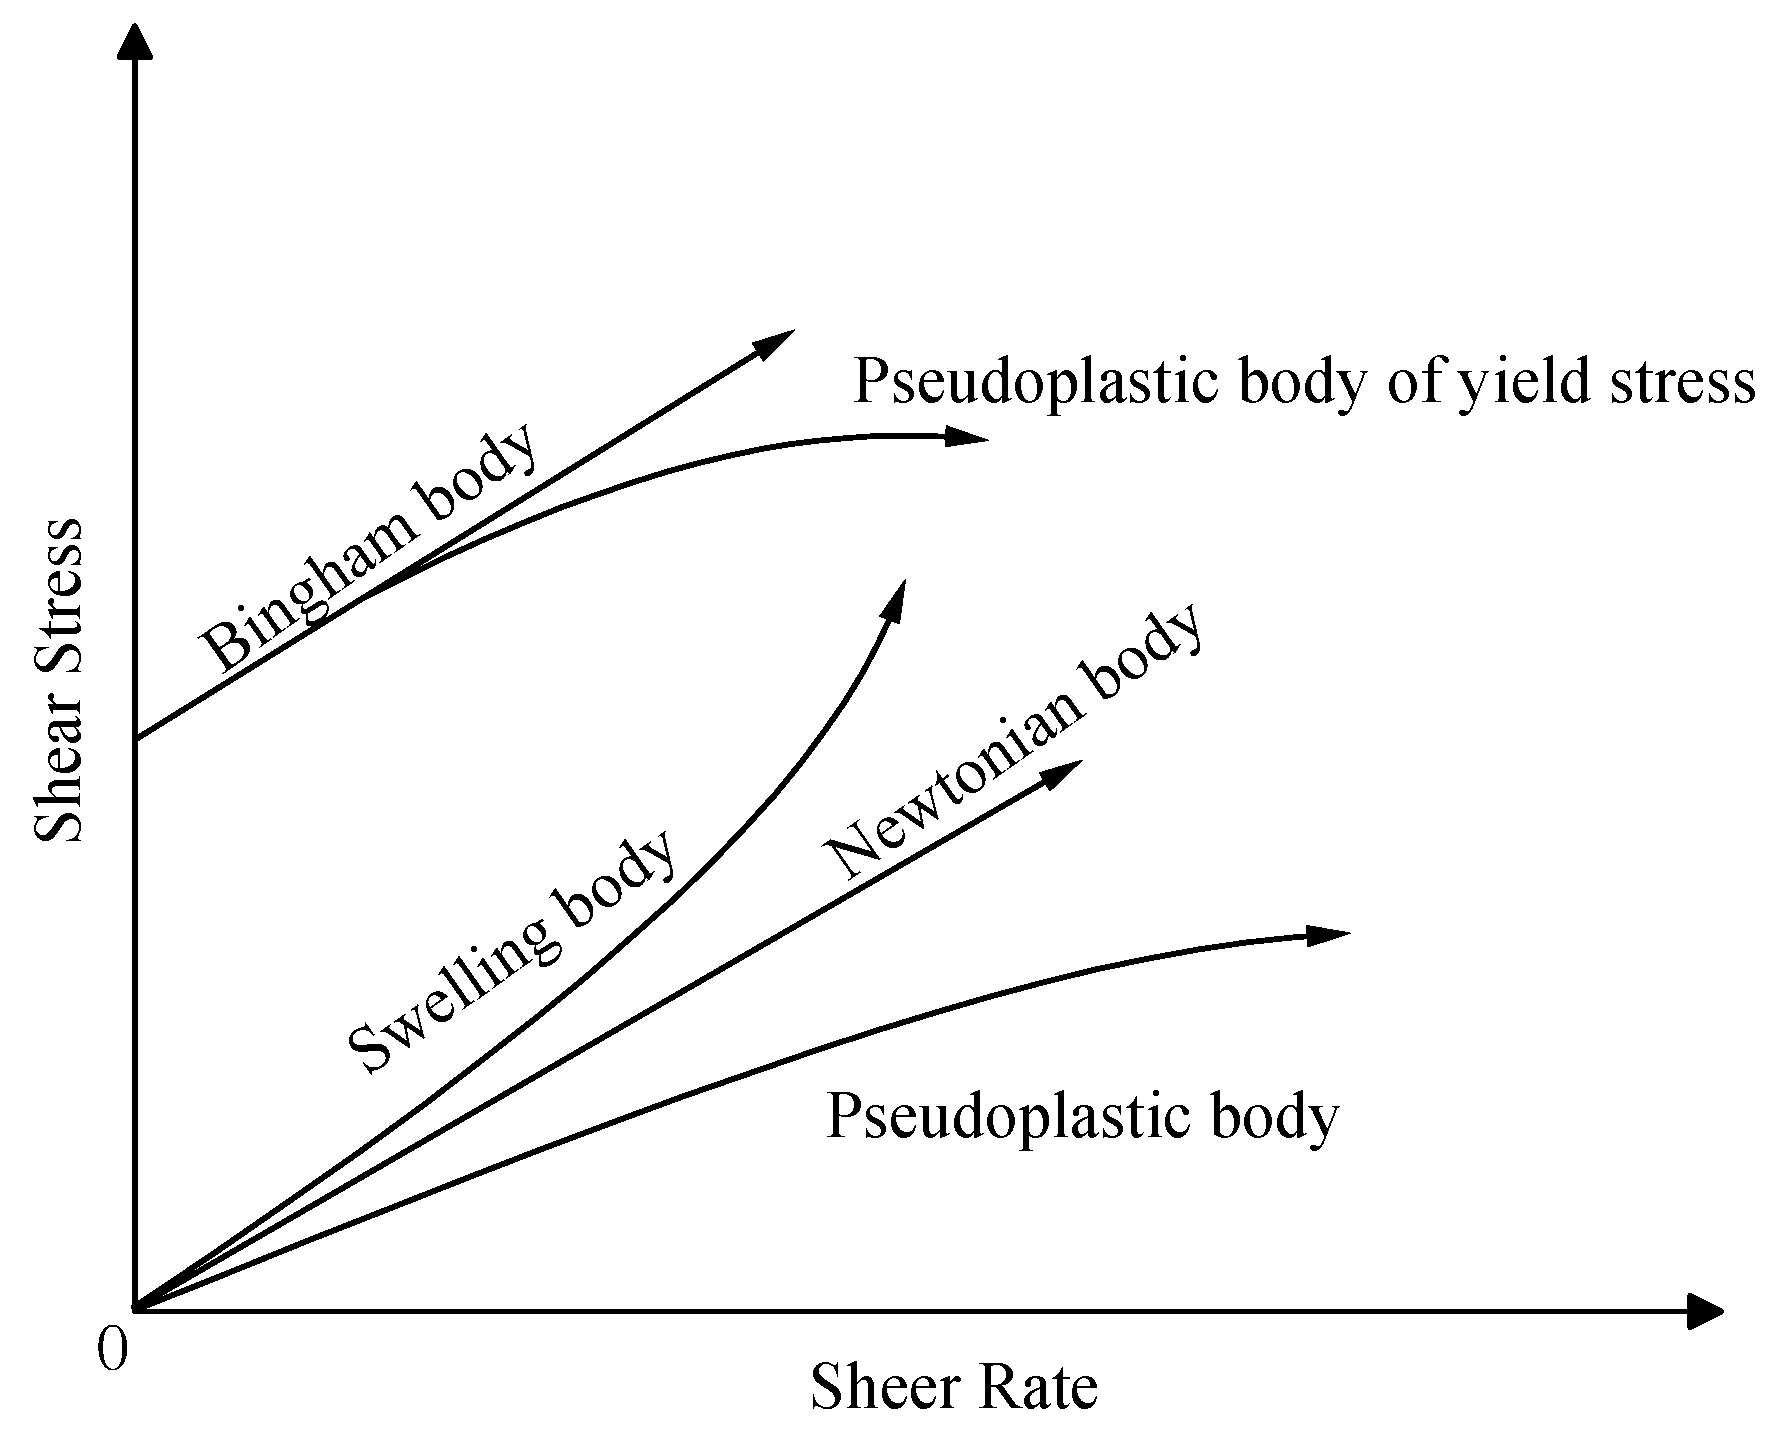
Figure 1. Slurry rheological characteristic curve.
Preprints 78731 g001
Figure 10. Dimensions of four bladed vane and sample container.
Preprints 78731 g010
Figure 14. Time dependent evolution of the yield stress of fresh CAFB.
Preprints 78731 g014
Figure 15. plotted TG/DTG for cement paste of CAFB cured for 1h and 2h.
Preprints 78731 g015
Figure 20. ESEM micrographs of 3d CAFB.
Preprints 78731 g020aPreprints 78731 g020b
Table 1. Results of semi-quantitative analysis aeolian sand energy spectrum.
Chemical composition Al2O3 SiO2 Na2O CaO K2O4 Fe2O3 other Total
Mass percentage (%) 9.78 68.94 2.34 6.65 2.13 2.24 7.92 100
Table 2. Results of semi-quantitative analysis coal gangue energy spectrum.
Chemical composition Al2O3 SiO2 P2O5 K2O CaO TiO2 Fe2O3 Total
Mass percentage (%) 22.23 62.06 0.65 2.95 3.11 0.99 8.01 100
Table 3. Results of semi-quantitative analysis fly ash energy spectrum.
Chemical composition Al2O3 SiO2 S K2O CaO TiO2 Fe2O3 Total
Mass percentage(%) 31.89 56.89 0.66 1.39 1.84 1.95 5.38 100
Table 4. Results of semi-quantitative analysis cement energy spectrum.
Chemical composition CaO SiO2 Al2O3 Fe2O3 MgO Other Total
Mass percentage(%) 65.08 22.36 5.53 3.46 1.27 2.30 100
Note: Carbon and water are not analyzed in the semi-quantitative analysis results of the energy spectrum. If carbon and water are analyzed, the analysis results of other elements should be reduced accordingly.
Table 7. Rheological parameters of filling slurry under different conditions.
Time/min rheology index 1# 2# 3# 4# 5#
60 μ(pa·s) 0.052 0.038 0.115 0.017 0.0104
τ0/pa 410.891 537.44 652.84 725.24 705.04
n 0.788 1.636 1.359 1.682 0.121
R2 0.954 0.972 0.852 0.831 0.409
30 μ(pa·s) 1.12 0.385 0.989 1.781 0.384
τ0/pa 611.650 543.827 600.575 779.76 919.08
n 3.048 1.452 1.024 0.997 1.085
R2 0.956 0.989 0.964 0.953 0.626
3 μ(pa·s) 1.166 1.763 0.148 0.563 0.041
τ0/pa 415.16 457.91 629.84 728.86 931.98
n 1.210 1.080 1.496 1.269 1.621
R2 0.982 0.978 0.981 0.961 0.802
Table 8. The correlation between the rheological parameters of the slurry and the particle size gradation after standing for 3 min.
Correlation model a b r r 2
μ = a + b d 10 -5.971 0.138 0.753 0.423
μ = a + b d 30 -12.486 0.173 0.753 0.423
μ = a + b d 50 4.945 -0.026 0.753 0.423
μ = a + b d 60 3.637 -0.012 0.753 0.423
μ = a + b d 90 2.890 -0.004 0.750 0.417
τ = a + b d 10 3169.028 -52.021 0.981 0.951
τ = a + b d 30 5632.278 -65.278 0.981 0.951
τ = a + b d 50 -959.012 9.643 0.981 0.951
τ = a + b d 60 -464.177 4.659 0.981 0.951
τ = a + b d 90 -183.410 1.532 0.980 0.947
Table 9. The correlation between the rheological parameters of the slurry and the particle size gradation after standing for 30 min.
Correlation model a b r r 2
μ = a + b d 10 0.784 0.003 0.021 0.333
μ = a + b d 30 0.647 0.004 0.020 0.333
μ = a + b d 50 1.027 -0.0005 0.021 0.333
μ = a + b d 60 0.997 -0.0002 0.021 0.333
μ = a + b d 90 0.985 -0.0001 0.023 0.333
τ = a + b d 10 2344.996 -33.924 0.868 0.672
τ = a + b d 30 3951.053 -42.566 0.868 0.671
τ = a + b d 50 -347.240 6.290 0.868 0.672
τ = a + b d 60 -24.474 3.038 0.868 0.672
τ = a + b d 90 160.503 0.996 0.864 0.662
Table 10. The correlation between the rheological parameters of the slurry and the particle size gradation after standing for 60 min.
Correlation model a b r r 2
μ = a + b d 10 -0.156 0.004 0.395 0.126
μ = a + b d 30 -0.353 0.005 0.395 0.126
μ = a + b d 50 0.174 -0.0007 0.395 0.126
μ = a + b d 60 0.134 -0.0004 0.395 0.126
μ = a + b d 90 0.111 -0.0001 0.392 0.128
τ = a + b d 10 2115.179 -30.948 0.934 0.831
τ = a + b d 30 3581.505 -38.847 0.935 0.831
τ = a + b d 50 -340.291 5.734 0.934 0.830
τ = a + b d 60 -46.059 2.770 0.934 0.830
τ = a + b d 90 118.957 0.915 0.936 0.836
Disclaimer/Publisher’s Note: The statements, opinions and data contained in all publications are solely those of the individual author(s) and contributor(s) and not of MDPI and/or the editor(s). MDPI and/or the editor(s) disclaim responsibility for any injury to people or property resulting from any ideas, methods, instructions or products referred to in the content.
Copyright: This open access article is published under a Creative Commons CC BY 4.0 license, which permit the free download, distribution, and reuse, provided that the author and preprint are cited in any reuse.
Prerpints.org logo

Preprints.org is a free preprint server supported by MDPI in Basel, Switzerland.

Subscribe

© 2024 MDPI (Basel, Switzerland) unless otherwise stated