Submitted:
04 July 2023
Posted:
05 July 2023
You are already at the latest version
Abstract
Keywords:
1. Introduction
2. Materials and Methods
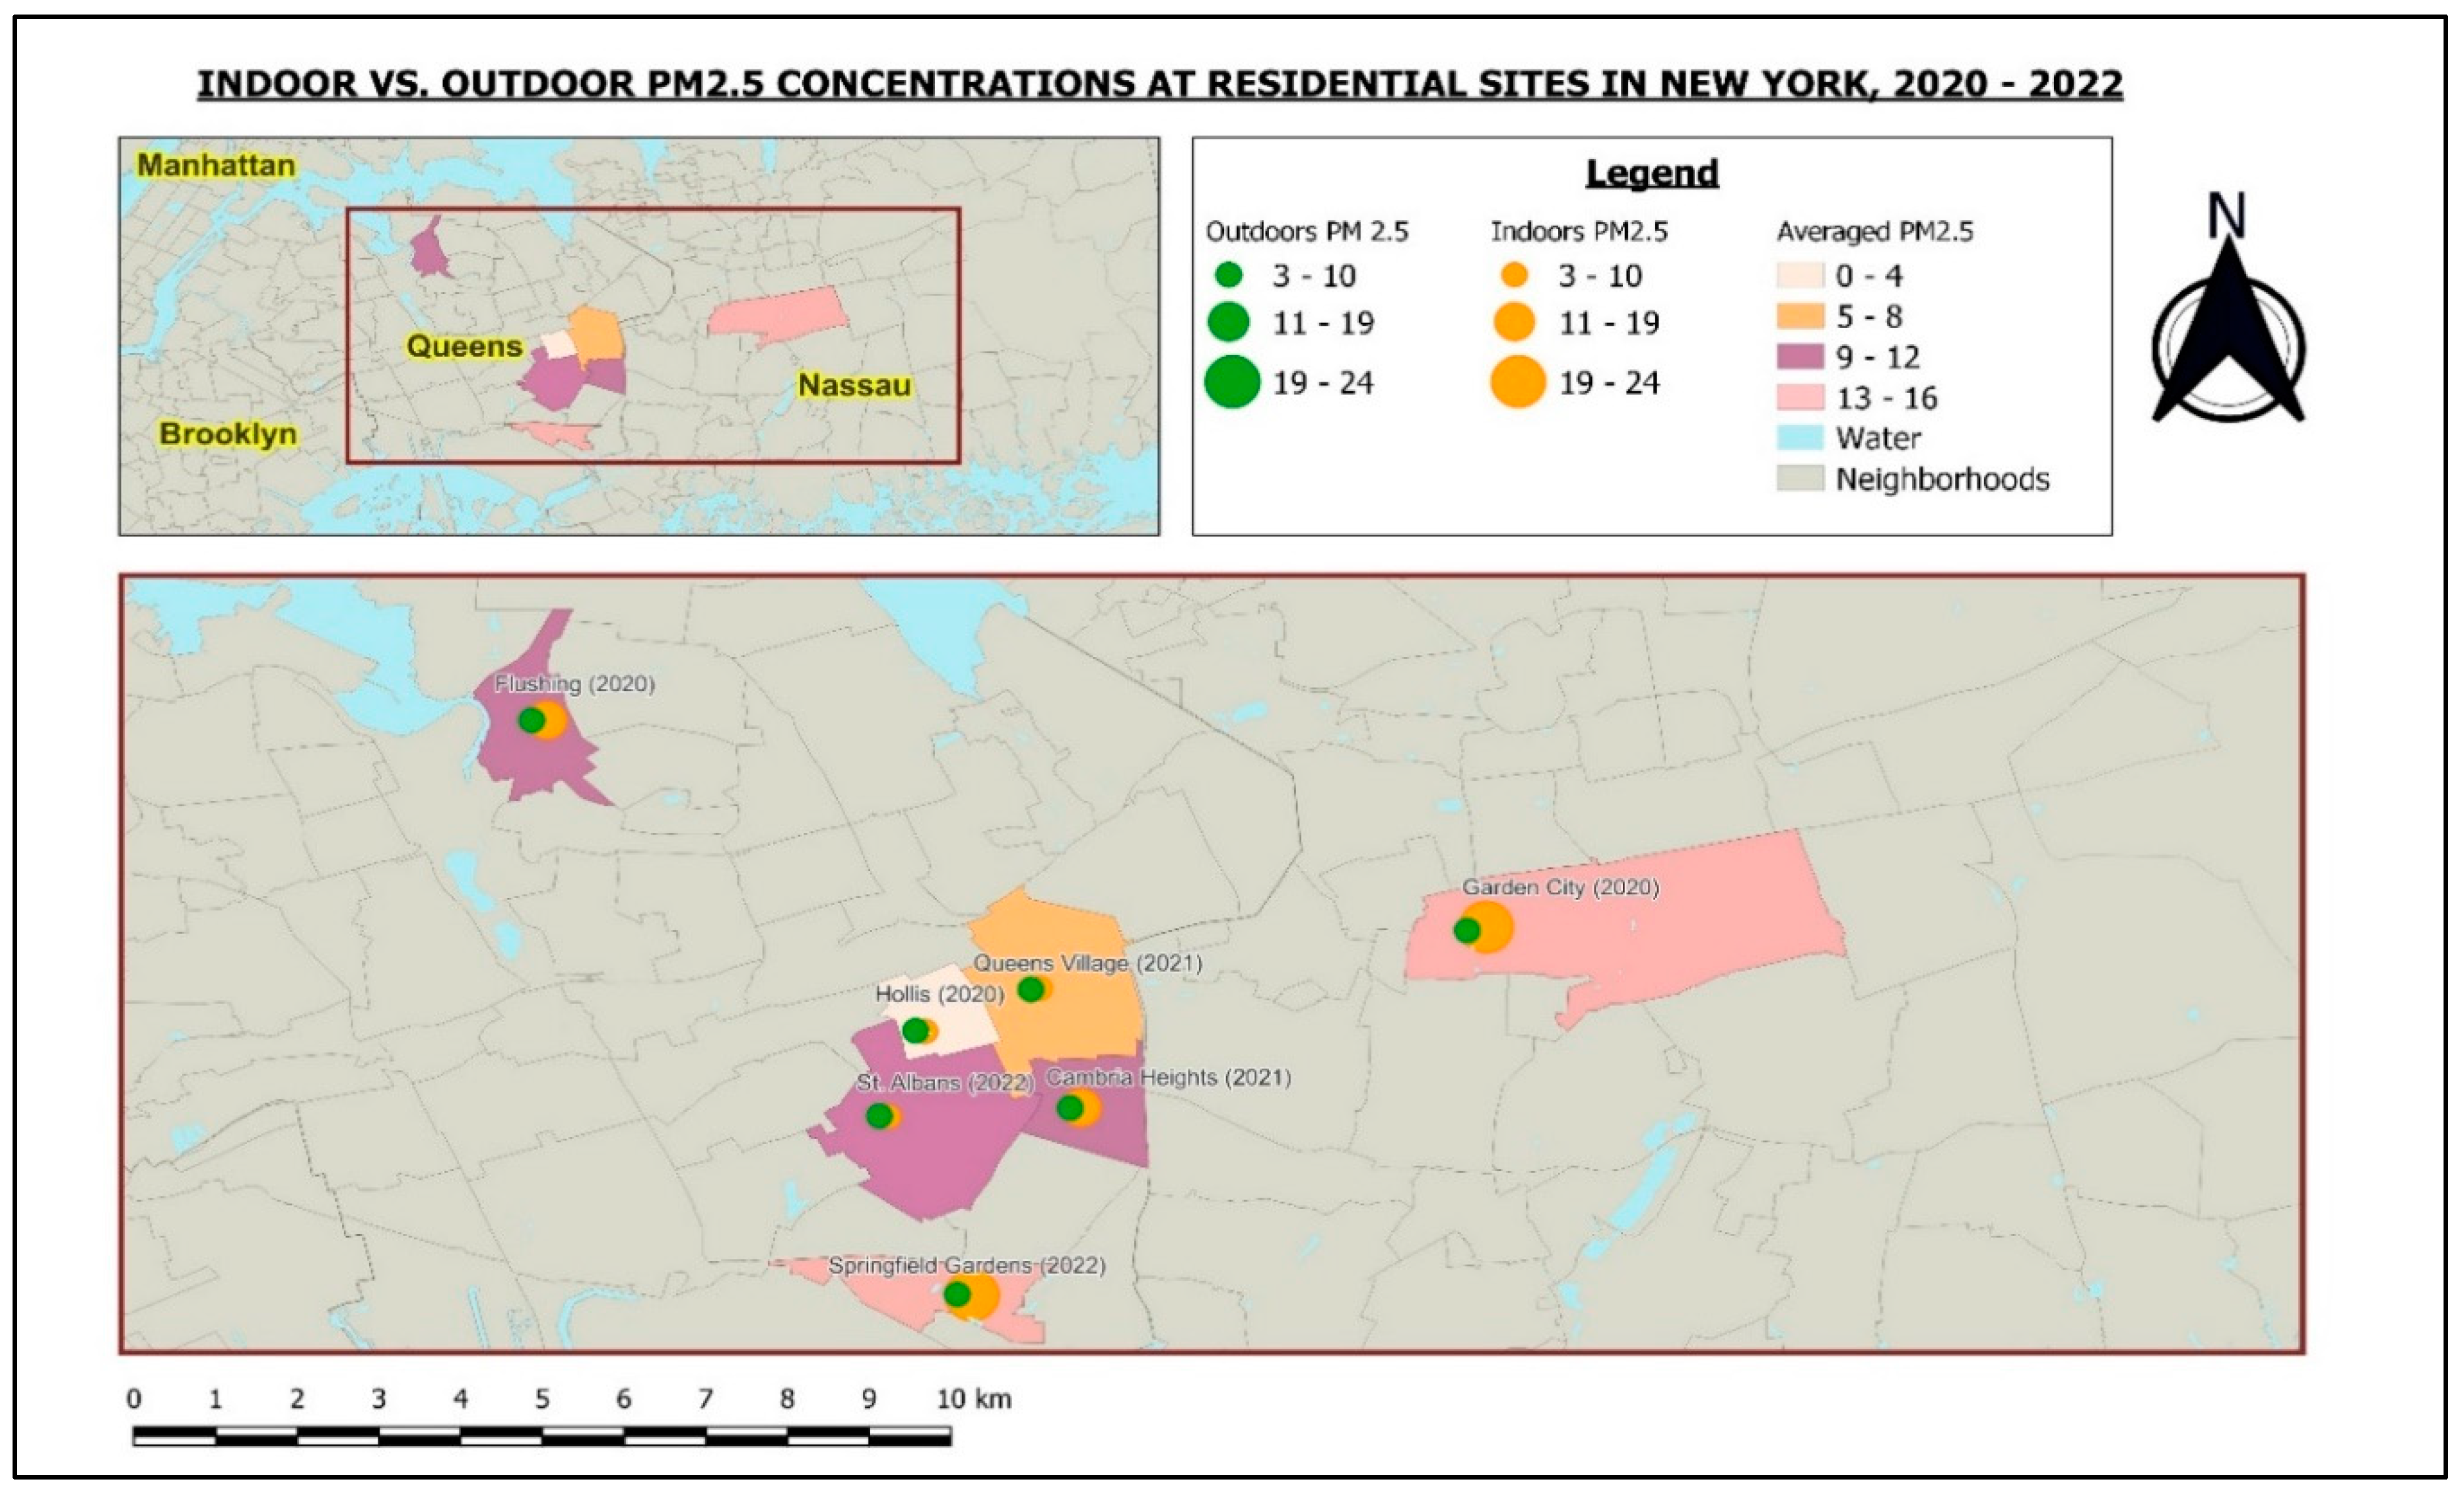
2.1. Study Sites
2.2. Suitability of AirBeam2 for PM2.5 Air Quality Monitoring
3. Results
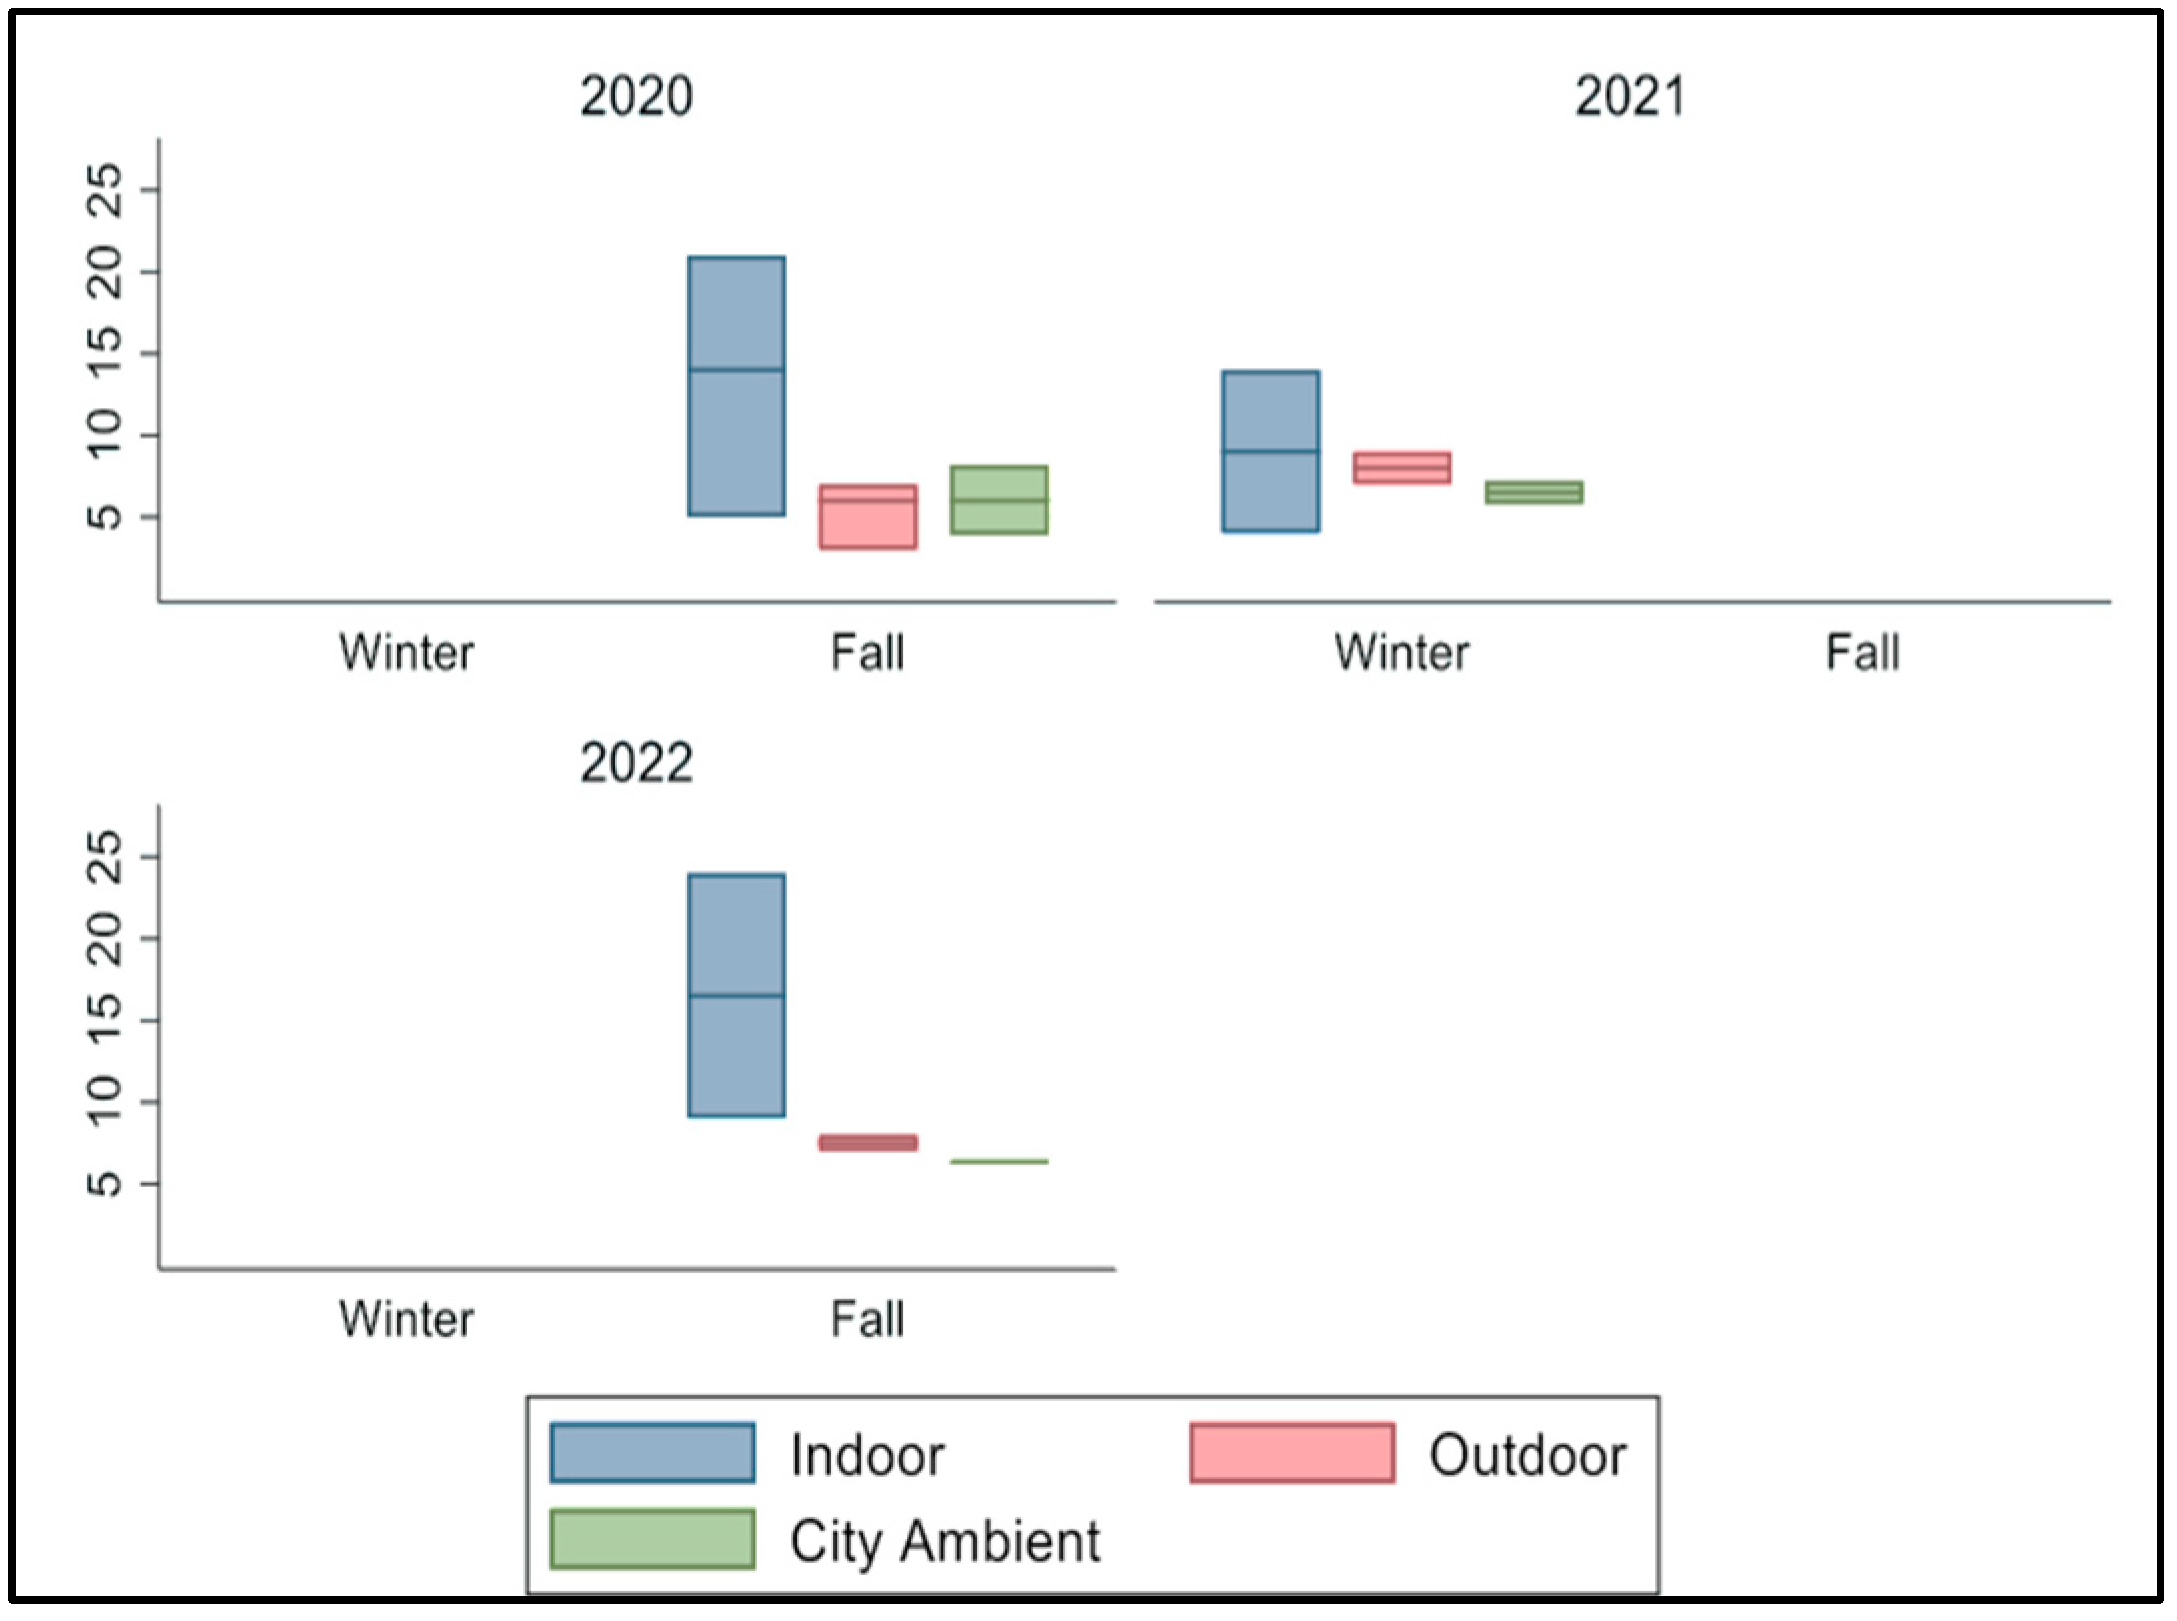
3.1. Comparison of PM2.5 Levels in 2020, 2021 and 2022
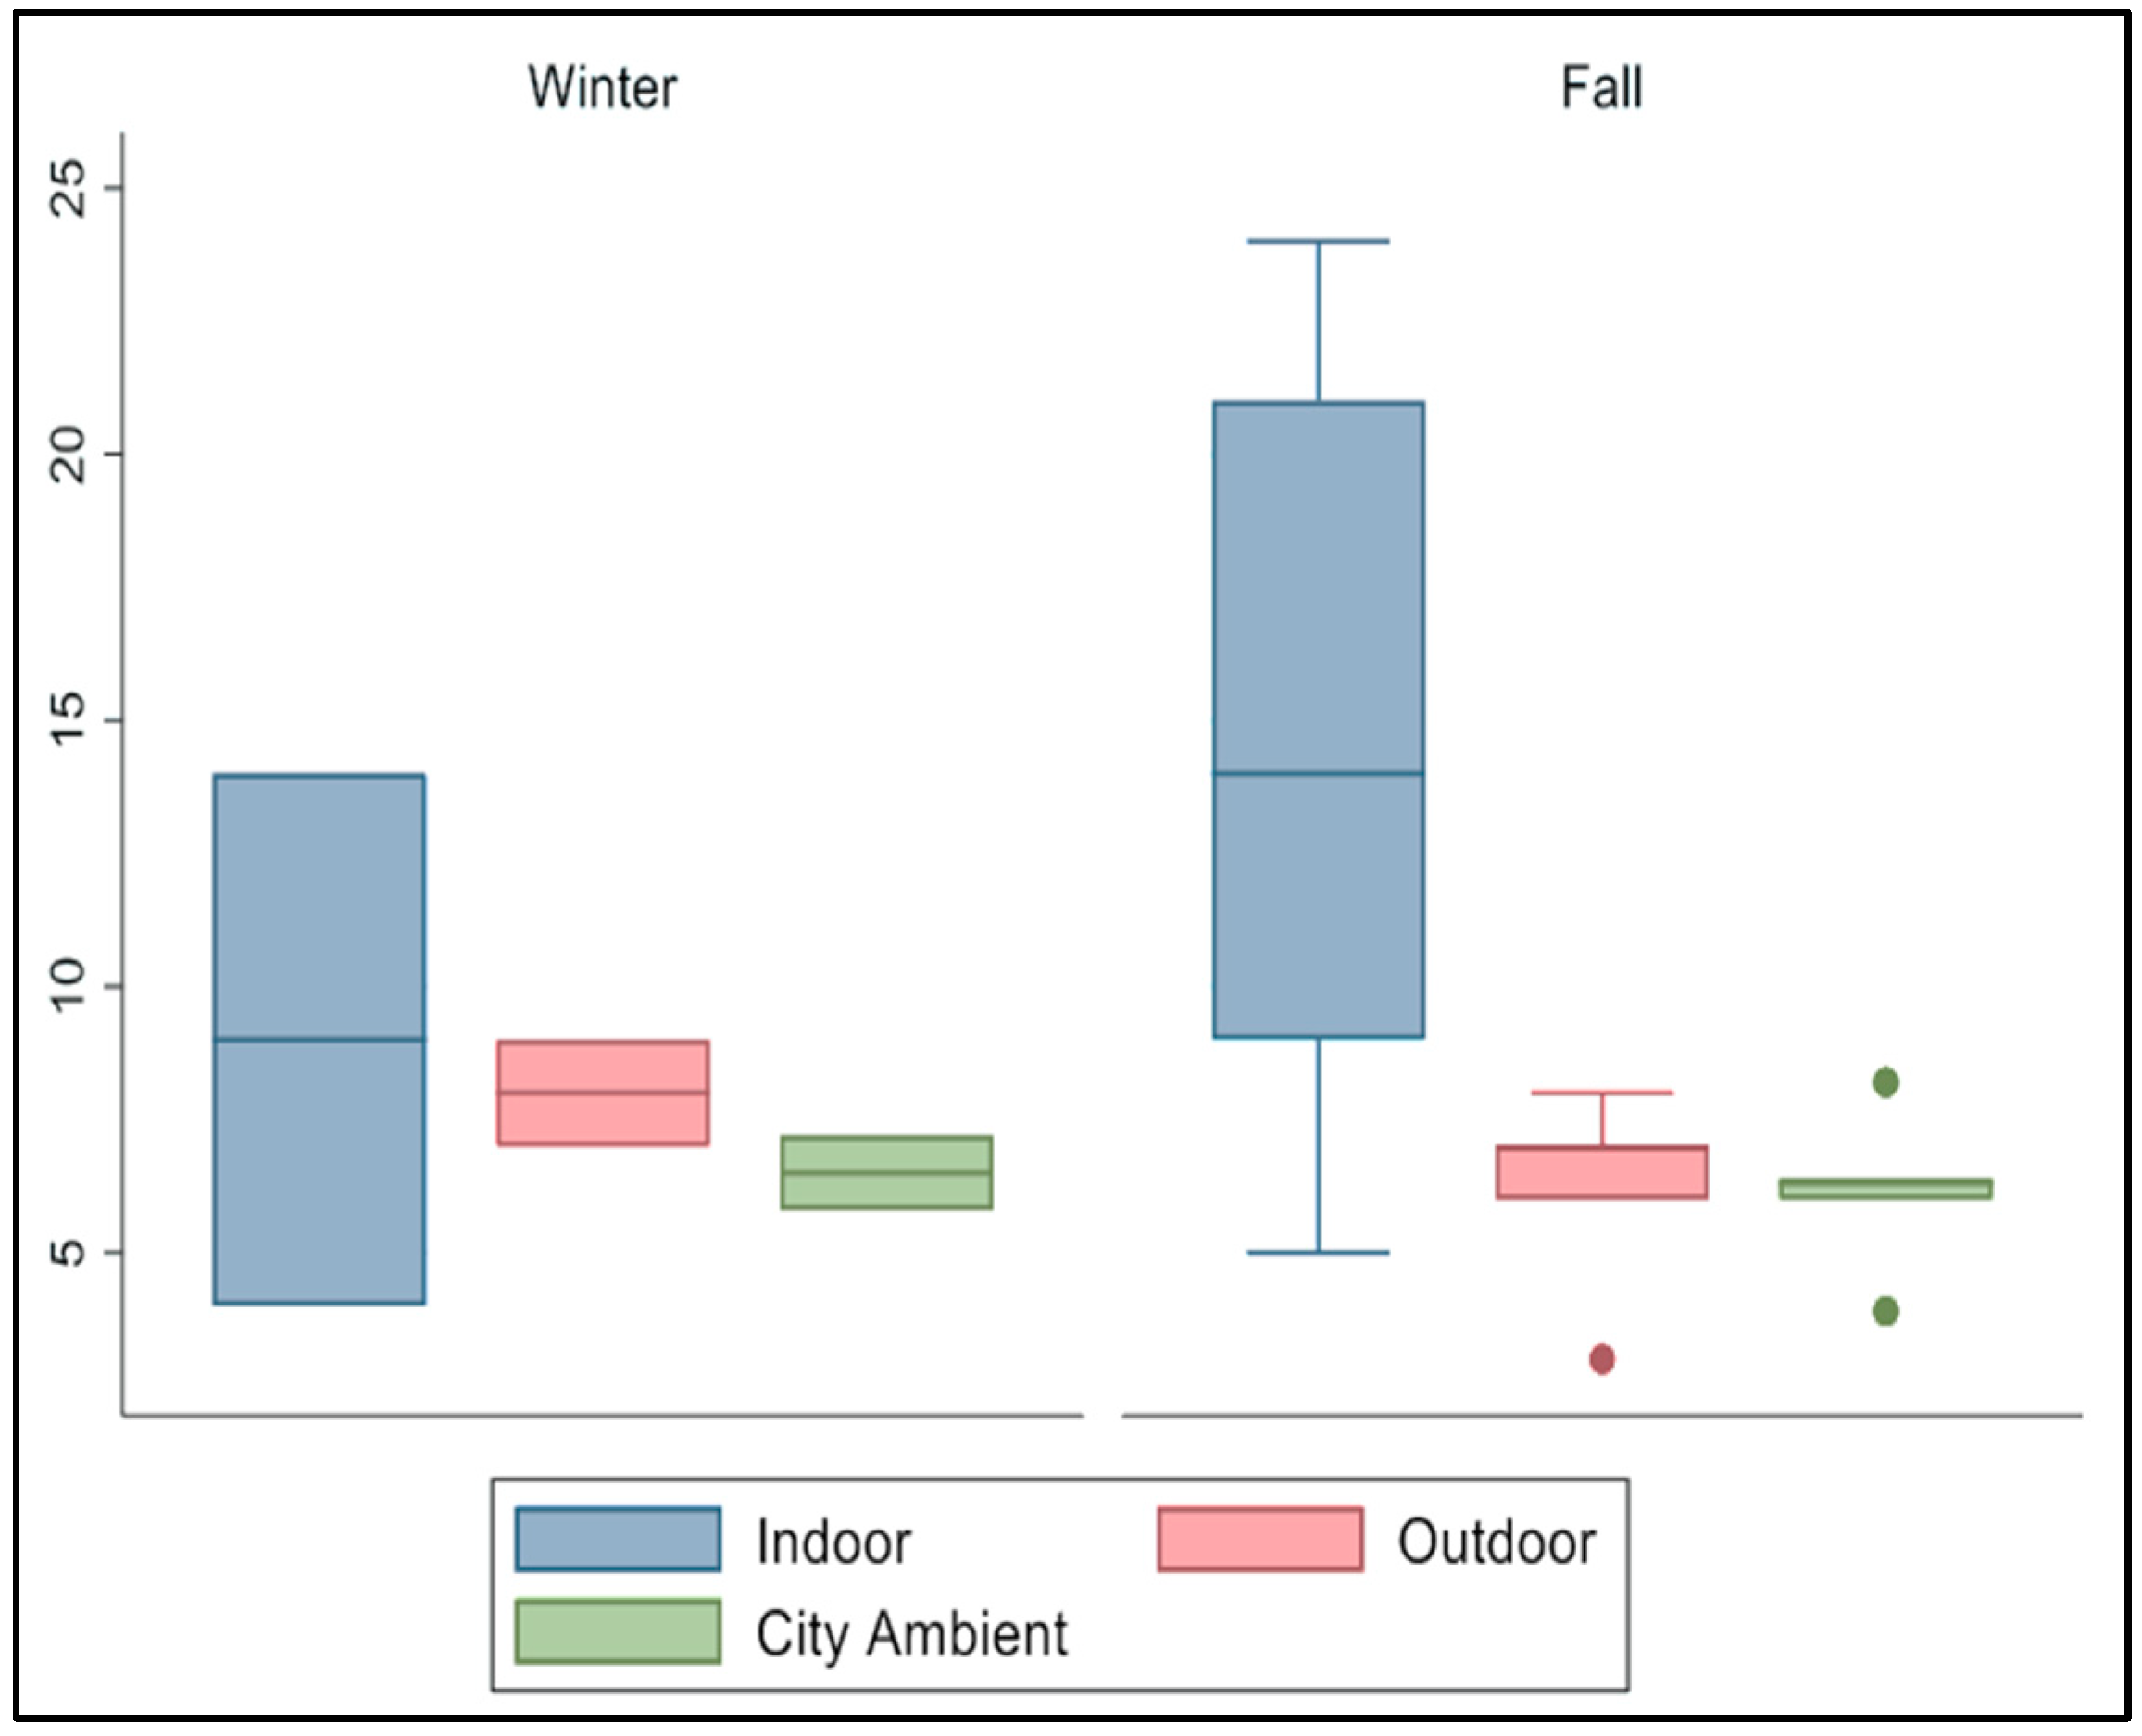
3.2. Comparison of PM2.5 Levels by Season

4. Discussion
4.1. Temporal Variations of Indoor PM2.5 Levels
4.2. Temporal Variation of Outdoor PM2.5
4.3. Seasonal Variations of Indoor PM2.5
4.4. Seasonal Variation of Outdoor PM2.5
4.5. Health Implications of Higher Indoor PM2.5 Levels during COVID-19
5. Conclusions
Author Contributions
Funding
Institutional Review Board Statement
Informed Consent Statement
Data Availability Statement
Acknowledgments
Conflicts of Interest
References
- Caiazzo F, Ashok A, Waitz IA, Dong GH, Barrett SF. Air pollution and early deaths in the United States. Part I: Quantifying the impact of major sectors in 2005. Atmospheric Environment. 2013;79:198-208. [CrossRef]
- NIEHS. Air Pollution. National Institute of Environmental Health Science. Published 2018. https://www.niehs.nih.gov/health/topics/agents/air-pollution/index.cfm.
- Manisalidis I, Stavropoulou E, Stavropoulos A, Bezirtzoglou E. Environmental and Health Impacts of Air Pollution: A Review. Frontiers in Public Health. 2020;8. [CrossRef]
- US EPA. Particulate Matter (PM). US EPA. Published 2022. https://www.epa.gov/pm-pollution/particulate-matter-pm-basics.
- Jones E, Laurent JGC, Young AM, et al. The effects of ventilation and filtration on indoor PM2.5 in office buildings in four countries. Building and Environment. 2021;200:107975. [CrossRef]
- Sohrabi C, Alsafi Z, O’Neill N, et al. World Health Organization declares global emergency: A review of the 2019 novel coronavirus (COVID-19). International Journal of Surgery. 2020;76:71-76. [CrossRef]
- Roh T, Moreno-Rangel A, Baek J, Obeng AB, Hasan NT, Carrillo G. Indoor Air Quality and Health Outcomes in Employees Working from Home during the COVID-19 Pandemic: A Pilot Study. Atmosphere. 2021;12(12):1665. [CrossRef]
- Ferreira A, Barros N. COVID-19 and Lockdown: The Potential Impact of Residential Indoor Air Quality on the Health of Teleworkers. International Journal of Environmental Research and Public Health. 2022;19(10):6079. [CrossRef]
- Indoor Air Quality. US EPA. Published 2021. https://www.epa.gov/report- environment/indoor-air-quality.
- Domínguez-Amarillo S, Fernández-Agüera J, García SC, González-Lezcano RA. Bad Air Can Also Kill: Residential Indoor Air Quality and Pollutant Exposure Risk during the COVID-19 Crisis. International Journal of Environmental Research and Public Health. 2020;17(19):7183. [CrossRef]
- Pala D, Casella V, Larizza C, Malovini A, Bellazzi R. Impact of COVID-19 lockdown on PM concentrations in an Italian Northern City: A year-by-year assessment. PLOS ONE. 2022;17(3):e0263265. [CrossRef]
- Kyung SY, Kim HS. Particulate-Matter Related Respiratory Diseases. Tuberculosis and Respiratory Diseases. 2020;83(2):116. [CrossRef]
- Roberts-Semple D, Gao Y. Evaluation of air pollution, local meteorology and urban public health. International Journal of Environmental Technology and Management. 2013;16(1/2):160. [CrossRef]
- Wu X, Nethery RC, Sabath MB, Braun D, Dominici F. Exposure to air pollution and COVID-19 mortality in the United States: A nationwide cross-sectional study. medRxiv (Cold Spring Harbor Laboratory). Published online April 7, 2020. [CrossRef]
- Akteruzzaman M, Rahman MdA, Rabbi FM, et al. The impacts of cooking and indoor air quality assessment in the southwestern region of Bangladesh. Heliyon. 2023;9(1):e12852. [CrossRef]
- World Health Organization: WHO. Household air pollution. www.who.int. Published online November 28, 2022. https://www.who.int/news-room/fact-sheets/detail/household-air-pollution-and-health.
- Bergmans B, Cattaneo A, Duarte RMBO, et al. Particulate matter indoors: a strategy to sample and monitor size-selective fractions. Applied Spectroscopy Reviews. 2022;57(8):675-704. [CrossRef]
- Begum BA, Paul SK, Hossain MS, Biswas SK, Hopke PK. Indoor air pollution from particulate matter emissions in different households in rural areas of Bangladesh. Building and Environment. 2009;44(5):898-903. [CrossRef]
- Hao J, Li X, Zhao YP. Indoor Air Pollution and Its Control in China. In: Springer EBooks; 2014:145-170. [CrossRef]
- Mansor AA, Hisham ANB, Abdullah S, Napi NNLM, Ahmed A, Ismail M. Indoor-Outdoor Air Quality Assessment in Nurseries. IOP Conference Series: Earth and Environmental Science. 2020;616(1):012001. [CrossRef]
- Us Epa O. Download daily data. Published online 2016. https://www.epa.gov/outdoor-air-quality-data/download-daily-data.
- HabitatMap. https://www.habitatmap.org/airbeam/how-it-works.
- Ryder O, Minor H, Brown S, Duvall R, Clements A, Freed R. AirBeam2 Quick Start Guide. Air Sensor Loan Programs. Published 2020.
- Gao SS, Hilts RW, Ross MK, Styler SA. Particulate matters: student-led air quality research in the third-year environmental chemistry classroom and the field. Analytical and Bioanalytical Chemistry. 2018;410(14):3223-3229. [CrossRef]
- Kortoçi P, Motlagh NH, Zaidan MA, et al. Air pollution exposure monitoring using portable low-cost air quality sensors. Smart Health. 2022;23:100241. [CrossRef]
- Hegde S, Min KT, Moore JE, et al. Indoor Household Particulate Matter Measurements Using a Network of Low-cost Sensors. Aerosol and Air Quality Research. 2020;20(2):381-394. [CrossRef]
- Weschler CJ. Changes in indoor pollutants since the 1950s. Atmospheric Environment. 2009;43(1):153-169. [CrossRef]
- Kaunelienė V, Prasauskas T, Krugly E, et al. Indoor air quality in low energy residential buildings in Lithuania. Building and Environment. 2016;108:63-72. [CrossRef]
- Xu R, Qi X, Dai G, et al. A Comparison Study of Indoor and Outdoor Air Quality in Nanjing, China. Aerosol and Air Quality Research. 2020;20(10):2128-2141. [CrossRef]
- Jiang J, Ding X, Isaacson KP, et al. Ethanol-based disinfectant sprays drive rapid changes in the chemical composition of indoor air in residential buildings. Journal of Hazardous Materials Letters. 2021;2:100042. [CrossRef]
- Cao Z, Wang Y, Wang M. A comparison of concentrated contaminant removal in enclosure by using mixing ventilation and vortex ventilation. In: Proceedings of the International Conference on Building Energy & Environment, 2018:139-143.
- Gruenwald T, Seals BA, Knibbs LD, Hosgood HD. Population Attributable Fraction of Gas Stoves and Childhood Asthma in the United States. International Journal of Environmental Research and Public Health. 2022;20(1):75. [CrossRef]
- Bo M, Salizzoni P, Clerico M, Buccolieri R. Assessment of Indoor-Outdoor Particulate Matter Air Pollution: A Review. Atmosphere. 2017;8(8):136. [CrossRef]
- Li J, Tartarini F. Changes in Air Quality during the COVID-19 Lockdown in Singapore and Associations with Human Mobility Trends. Aerosol and Air Quality Research. 2020;20(8):1748-1758. [CrossRef]
- Zhang Z, Arshad A, Zhang C, Hussain S, Li W. Unprecedented Temporary Reduction in Global Air Pollution Associated with COVID-19 Forced Confinement: A Continental and City Scale Analysis. Remote Sensing. 2020;12(15):2420. [CrossRef]
- Massey DB, Kulshrestha A, Masih J, Taneja A. Seasonal trends of PM10, PM5.0, PM2.5 & PM1.0 in indoor and outdoor environments of residential homes located in North-Central India. Building and Environment. 2012;47:223-231. [CrossRef]
- Bagley M, Dobrijevic D. Properties of Matter: Gases. livescience.com. Published online February 16, 2022. https://www.livescience.com/53304-gases.html.
- Hernandez G. Temperature and humidity effects on particulate matter concentrations in a sub-tropical climate during winter. Published 2017. https://www.semanticscholar.org/paper/Temperature-and-humidity-effects-on-particulate-in-Hernandez-Berry/e2d8748fa838f69fa8554ea6f3e0fcc3fbd13c9b.
- Li L, Li QX, Huang L, et al. Air quality changes during the COVID-19 lockdown over the Yangtze River Delta Region: An insight into the impact of human activity pattern changes on air pollution variation. Science of the Total Environment. 2020;732:139282. [CrossRef]
- Clements N, Keady P, Emerson J, Fierer N, Miller S. Seasonal variability of airborne particulate matter and bacterial concentrations in Colorado homes. Atmosphere (Basel). 2018;9(4):133. [CrossRef]
- Sarmadi M, Rahimi S, Rezaei M, Sanaei D, Dianatinasab M. Air quality index variation before and after the onset of COVID-19 pandemic: a comprehensive study on 87 capital, industrial and polluted cities of the world. Environmental Sciences Europe. 2021;33(1). [CrossRef]
- Jiang S, Kong S, Zheng H, Zeng X, Chen N, Qi S. [Real-time Source Apportionment of PM2.5 and Potential Geographic Origins of Each Source During Winter in Wuhan]. PubMed. 2022;43(1):61-73. [CrossRef]
- Comunian SO, Dongo D, Milani C, Palestini P. Air Pollution and COVID-19: The Role of Particulate Matter in the Spread and Increase of COVID-19’s Morbidity and Mortality. International Journal of Environmental Research and Public Health. 2020;17(12):4487. [CrossRef]
- Sharma AK, Balyan P. Air pollution and COVID-19: Is the connect worth its weight? Indian J Public Health. 2020;64(Supplement):S132-S134. [CrossRef]
- Shao L, Wang Y, Jones T, et al. COVID-19 mortality and exposure to airborne PM2.5: A lag time correlation. Science of the Total Environment. 2022;806:151286. [CrossRef]
- Tung NH, Cheng PW, Chi KH, et al. Particulate matter and SARS-CoV-2: A possible model of COVID-19 transmission. Science of the Total Environment. 2021;750:141532. [CrossRef]


| 2020 (Fall) | 2021 (Winter) | 2022 (Fall) | p-value | |
|---|---|---|---|---|
| Mean (SE) | Mean (SE) | Mean (SE) | ||
| Indoor | 13.33 (4.63) | 9.0 (5.0) | 16.5 (7.5) | 0.93 |
| Outdoor | 5.33 (1.20) | 8.0 (1.0) | 7.5 (0.5) | 0.65 |
| City Ambient | 6.03 (1.24) | 6.5 (0.69) | 6.35 (0.05) | 0.11 |
| Winter (n = 2) Mean (SE) |
Fall (n = 5) Mean (SE) |
p-Value | |
|---|---|---|---|
| Indoor | 9.0 (5) | 14.6 (3.5) | 0.42 |
| Outdoor | 8.0 (1.0) | 6.2 (0.69) | 0.29 |
| City Ambient | 6.5 (0.98) | 6.16 (0.68) | 0.78 |
| Homes | Season | InAv PM2.5 (µg/m³) |
OutAv PM2.5 (µg/m³) | City Ambient |
|---|---|---|---|---|
| 1 | 2021 (W) | 4 | 7 | 5.8 |
| 2 | 2021 (W) | 14 | 9 | 7.2 |
| 3 | 2020 (F) | 14 | 7 | 3.9 |
| 4 | 2020 (F) | 5 | 3 | 8.2 |
| 5 | 2020 (F) | 21 | 6 | 6.0 |
| 6 | 2022 (F) | 24 | 7 | 6.4 |
| 7 | 2022 (F) | 9 | 8 | 6.3 |
| Mean (Std Error) |
13.0 (2.87) | 6.71 (0.71) | 6.25 (0.50) |
Disclaimer/Publisher’s Note: The statements, opinions and data contained in all publications are solely those of the individual author(s) and contributor(s) and not of MDPI and/or the editor(s). MDPI and/or the editor(s) disclaim responsibility for any injury to people or property resulting from any ideas, methods, instructions or products referred to in the content. |
© 2023 by the authors. Licensee MDPI, Basel, Switzerland. This article is an open access article distributed under the terms and conditions of the Creative Commons Attribution (CC BY) license (http://creativecommons.org/licenses/by/4.0/).


