Submitted:
04 July 2023
Posted:
05 July 2023
You are already at the latest version
Abstract
Keywords:
1. Introduction
2. Materials and Methods
2.1. Cell and Culture Conditions
2.2. In Vitro Study
2.3. Eq_HPCs Clonogenic and Proliferation Potential
2.4. Eq_HPCs Morphology Evaluation
2.5. Microcapillary flow cytometric analysis of cell viability and apoptosis
2.6. Cellular glucose uptake analysis
2.7. Intracellular glucose measured by Gas chromatography–mass spectrometry (GC-MS) analysis
2.8. Mitochondrial network staining
2.9. Gene Expression Analysis
2.10. Western blot analysis
2.11. Statistical Analysis
3. Results
3.1. Evaluation of morphology, proliferation rate, and apoptosis in Eq_HPCs treated with PA or PA/MSI-1436
3.2. The effect of MSI-1436 inhibitor on glucose absorption in Eq_HPC cells
3.3. MSI-1436 enhances mitochondrial dynamics in Eq_HPCs
4. Discussion
5. Conclusions
Author Contributions
Funding
Data Availability Statement
Acknowledgments
Conflicts of Interest
References
- Li, Q.; Gong, Y.; Wang, Y.; Liu, B.; Chu, Y.; Gui, S.; Zheng, Y.; Chen, X. Sirt1 Promotes the Restoration of Hepatic Progenitor Cell (HPC)-Mediated Liver Fatty Injury in NAFLD Through Activating the Wnt/β-Catenin Signal Pathway. Frontiers in Nutrition 2021, 8. [Google Scholar] [CrossRef]
- So, J.; Kim, A.; Lee, S.-H.; Shin, D. Liver Progenitor Cell-Driven Liver Regeneration. Exp Mol Med 2020, 52, 1230–1238. [Google Scholar] [CrossRef] [PubMed]
- Watt, M.J.; Miotto, P.M.; De Nardo, W.; Montgomery, M.K. The Liver as an Endocrine Organ—Linking NAFLD and Insulin Resistance. Endocrine Reviews 2019, 40, 1367–1393. [Google Scholar] [CrossRef]
- Xu, Y.Q.; Liu, Z.C. Therapeutic Potential of Adult Bone Marrow Stem Cells in Liver Disease and Delivery Approaches. Stem Cell Rev 2008, 4, 101–112. [Google Scholar] [CrossRef]
- Bourebaba, L.; Komakula, S.S.B.; Weiss, C.; Adrar, N.; Marycz, K. The PTP1B Selective Inhibitor MSI-1436 Mitigates Tunicamycin-Induced ER Stress in Human Hepatocarcinoma Cell Line through XBP1 Splicing Modulation. PLOS ONE 2023, 18, e0278566. [Google Scholar] [CrossRef] [PubMed]
- Marycz, K.; Szłapka-Kosarzewska, J.; Geburek, F.; Kornicka-Garbowska, K. Systemic Administration of Rejuvenated Adipose-Derived Mesenchymal Stem Cells Improves Liver Metabolism in Equine Metabolic Syndrome (EMS)- New Approach in Veterinary Regenerative Medicine. Stem Cell Rev Rep 2019, 15, 842–850. [Google Scholar] [CrossRef]
- Marycz, K.; Bourebaba, N.; Serwotka-Suszczak, A.; Mularczyk, M.; Galuppo, L.; Bourebaba, L. In Vitro Generated Equine Hepatic-Like Progenitor Cells as a Novel Potent Cell Pool for Equine Metabolic Syndrome (EMS) Treatment. Stem Cell Rev and Rep 2023. [Google Scholar] [CrossRef] [PubMed]
- Alicka, M.; Kornicka-Garbowska, K.; Roecken, M.; Marycz, K. Inhibition of the Low Molecular Weight Protein Tyrosine Phosphatase (LMPTP) as a Potential Therapeutic Strategy for Hepatic Progenitor Cells Lipotoxicity—Short Communication. International Journal of Molecular Sciences 2019, 20, 5873. [Google Scholar] [CrossRef] [PubMed]
- Frank, N.; Geor, R. j.; Bailey, S. r.; Durham, A. e.; Johnson, P. j. Equine Metabolic Syndrome. Journal of Veterinary Internal Medicine 2010, 24, 467–475. [Google Scholar] [CrossRef] [PubMed]
- Johnson, T.O.; Ermolieff, J.; Jirousek, M.R. Protein Tyrosine Phosphatase 1B Inhibitors for Diabetes. Nat Rev Drug Discov 2002, 1, 696–709. [Google Scholar] [CrossRef] [PubMed]
- Roskams, T.; Yang, S.Q.; Koteish, A.; Durnez, A.; DeVos, R.; Huang, X.; Achten, R.; Verslype, C.; Diehl, A.M. Oxidative Stress and Oval Cell Accumulation in Mice and Humans with Alcoholic and Nonalcoholic Fatty Liver Disease. Am J Pathol 2003, 163, 1301–1311. [Google Scholar] [CrossRef] [PubMed]
- Bria, A.; Marda, J.; Zhou, J.; Sun, X.; Cao, Q.; Petersen, B.E.; Pi, L. Hepatic Progenitor Cell Activation in Liver Repair. Liver Res 2017, 1, 81–87. [Google Scholar] [CrossRef] [PubMed]
- Ozaki, M. Cellular and Molecular Mechanisms of Liver Regeneration: Proliferation, Growth, Death and Protection of Hepatocytes. Semin Cell Dev Biol 2020, 100, 62–73. [Google Scholar] [CrossRef] [PubMed]
- Ibrahim, S.H.; Kohli, R.; Gores, G.J. Mechanisms of Lipotoxicity in NAFLD and Clinical Implications. J Pediatr Gastroenterol Nutr 2011, 53, 131–140. [Google Scholar] [CrossRef] [PubMed]
- Boucher, J.; Kleinridders, A.; Kahn, C.R. Insulin Receptor Signaling in Normal and Insulin-Resistant States. Cold Spring Harb Perspect Biol 2014, 6, a009191. [Google Scholar] [CrossRef] [PubMed]
- Kaczmarek, K.; Janicki, B.; Głowska, M. Insulin Resistance in the Horse: A Review. Journal of Applied Animal Research 2016, 44, 424–430. [Google Scholar] [CrossRef]
- Alicka, M.; Marycz, K. The Effect of Chronic Inflammation and Oxidative and Endoplasmic Reticulum Stress in the Course of Metabolic Syndrome and Its Therapy. Stem Cells International 2018, 2018, e4274361. [Google Scholar] [CrossRef]
- Marycz, K.; Kornicka, K.; Szlapka-Kosarzewska, J.; Weiss, C. Excessive Endoplasmic Reticulum Stress Correlates with Impaired Mitochondrial Dynamics, Mitophagy and Apoptosis, in Liver and Adipose Tissue, but Not in Muscles in EMS Horses. International Journal of Molecular Sciences 2018, 19, 165. [Google Scholar] [CrossRef]
- Saltiel, A.R.; Kahn, C.R. Insulin Signalling and the Regulation of Glucose and Lipid Metabolism. Nature 2001, 414, 799–806. [Google Scholar] [CrossRef]
- Leturque, A.; Brot-Laroche, E.; le, L.; Stolarczyk, E.; Tobin, V. The Role of GLUT2 in Dietary Sugar Handling. Journal of physiology and biochemistry 2006, 61, 529–537. [Google Scholar] [CrossRef]
- Pilkis, S.J.; Granner, D.K. Molecular Physiology of the Regulation of Hepatic Gluconeogenesis and Glycolysis. Annual Review of Physiology 1992, 54, 885–909. [Google Scholar] [CrossRef] [PubMed]
- Yang, T.; Fu, M.; Pestell, R.; Sauve, A.A. SIRT1 and Endocrine Signaling. Trends in Endocrinology & Metabolism 2006, 17, 186–191. [Google Scholar] [CrossRef]
- Nie, Y.; Erion, D.M.; Yuan, Z.; Dietrich, M.; Shulman, G.I.; Horvath, T.L.; Gao, Q. STAT3 Inhibition of Gluconeogenesis Is Downregulated by SirT1. Nat Cell Biol 2009, 11, 492–500. [Google Scholar] [CrossRef] [PubMed]
- Kemper, J.K.; Choi, S.-E.; Kim, D.H. Chapter Sixteen - Sirtuin 1 Deacetylase: A Key Regulator of Hepatic Lipid Metabolism. In Vitamins & Hormones; Litwack, G., Ed.; Obesity; Academic Press, 2013; Vol. 91, pp. 385–404.
- Ponugoti, B.; Kim, D.-H.; Xiao, Z.; Smith, Z.; Miao, J.; Zang, M.; Wu, S.-Y.; Chiang, C.-M.; Veenstra, T.D.; Kemper, J.K. SIRT1 Deacetylates and Inhibits SREBP-1C Activity in Regulation of Hepatic Lipid Metabolism *. Journal of Biological Chemistry 2010, 285, 33959–33970. [Google Scholar] [CrossRef]
- Yamazaki, Y.; Usui, I.; Kanatani, Y.; Matsuya, Y.; Tsuneyama, K.; Fujisaka, S.; Bukhari, A.; Suzuki, H.; Senda, S.; Imanishi, S.; et al. Treatment with SRT1720, a SIRT1 Activator, Ameliorates Fatty Liver with Reduced Expression of Lipogenic Enzymes in MSG Mice. American Journal of Physiology-Endocrinology and Metabolism 2009, 297, E1179–E1186. [Google Scholar] [CrossRef] [PubMed]
- Li, Y.; Wong, K.; Giles, A.; Jiang, J.; Lee, J.W.; Adams, A.C.; Kharitonenkov, A.; Yang, Q.; Gao, B.; Guarente, L.; et al. Hepatic SIRT1 Attenuates Hepatic Steatosis and Controls Energy Balance in Mice by Inducing Fibroblast Growth Factor 21. Gastroenterology 2014, 146, 539–549. [Google Scholar] [CrossRef]
- Zhang, S.; Cai, G.; Fu, B.; Feng, Z.; Ding, R.; Bai, X.; Liu, W.; Zhuo, L.; Sun, L.; Liu, F.; et al. SIRT1 Is Required for the Effects of Rapamycin on High Glucose-Inducing Mesangial Cells Senescence. Mechanisms of Ageing and Development 2012, 133, 387–400. [Google Scholar] [CrossRef] [PubMed]
- Ghosh, H.S.; McBurney, M.; Robbins, P.D. SIRT1 Negatively Regulates the Mammalian Target of Rapamycin. PLOS ONE 2010, 5, e9199. [Google Scholar] [CrossRef]
- Bourebaba, L.; Łyczko, J.; Alicka, M.; Bourebaba, N.; Szumny, A.; Fal, A.M.; Marycz, K. Inhibition of Protein-Tyrosine Phosphatase PTP1B and LMPTP Promotes Palmitate/Oleate-Challenged HepG2 Cell Survival by Reducing Lipoapoptosis, Improving Mitochondrial Dynamics and Mitigating Oxidative and Endoplasmic Reticulum Stress. Journal of Clinical Medicine 2020, 9, 1294. [Google Scholar] [CrossRef] [PubMed]
- Chen, P.-J.; Cai, S.-P.; Yang, Y.; Li, W.-X.; Huang, C.; Meng, X.-M.; Li, J. PTP1B Confers Liver Fibrosis by Regulating the Activation of Hepatic Stellate Cells. Toxicology and Applied Pharmacology 2016, 292, 8–18. [Google Scholar] [CrossRef] [PubMed]
- Lantz, K.A.; Hart, S.G.E.; Planey, S.L.; Roitman, M.F.; Ruiz-White, I.A.; Wolfe, H.R.; McLane, M.P. Inhibition of PTP1B by Trodusquemine (MSI-1436) Causes Fat-Specific Weight Loss in Diet-Induced Obese Mice. Obesity (Silver Spring) 2010, 18, 1516–1523. [Google Scholar] [CrossRef]
- Bourebaba, L.; Kornicka-Garbowska, K.; Al Naem, M.; Röcken, M.; Łyczko, J.; Marycz, K. MSI-1436 Improves EMS Adipose Derived Progenitor Stem Cells in the Course of Adipogenic Differentiation through Modulation of ER Stress, Apoptosis, and Oxidative Stress. Stem Cell Research & Therapy 2021, 12, 97. [Google Scholar] [CrossRef]
- Arnold, I.; Langer, T. Membrane Protein Degradation by AAA Proteases in Mitochondria. Biochim Biophys Acta 2002, 1592, 89–96. [Google Scholar] [CrossRef] [PubMed]
- Chen, H.; Chan, D.C. Physiological Functions of Mitochondrial Fusion. Ann N Y Acad Sci 2010, 1201, 21–25. [Google Scholar] [CrossRef] [PubMed]
- Narendra, D.P.; Youle, R.J. Targeting Mitochondrial Dysfunction: Role for PINK1 and Parkin in Mitochondrial Quality Control. Antioxidants & Redox Signaling 2011, 14, 1929–1938. [Google Scholar] [CrossRef]
- Narendra, D.; Tanaka, A.; Suen, D.-F.; Youle, R.J. Parkin Is Recruited Selectively to Impaired Mitochondria and Promotes Their Autophagy. Journal of Cell Biology 2008, 183, 795–803. [Google Scholar] [CrossRef]
- Wu, W.; Xu, H.; Wang, Z.; Mao, Y.; Yuan, L.; Luo, W.; Cui, Z.; Cui, T.; Wang, X.L.; Shen, Y.H. PINK1-Parkin-Mediated Mitophagy Protects Mitochondrial Integrity and Prevents Metabolic Stress-Induced Endothelial Injury. PLOS ONE 2015, 10, e0132499. [Google Scholar] [CrossRef]
- Moreira, O.C.; Estébanez, B.; Martínez-Florez, S.; de Paz, J.A.; Cuevas, M.J.; González-Gallego, J. Mitochondrial Function and Mitophagy in the Elderly: Effects of Exercise. Oxid Med Cell Longev 2017, 2017, 2012798. [Google Scholar] [CrossRef]
- Ma, X.; McKeen, T.; Zhang, J.; Ding, W.-X. Role and Mechanisms of Mitophagy in Liver Diseases. Cells 2020, 9, 837. [Google Scholar] [CrossRef] [PubMed]
- Wang, R.; Zhu, Y.; Lin, X.; Ren, C.; Zhao, J.; Wang, F.; Gao, X.; Xiao, R.; Zhao, L.; Chen, H.; et al. Influenza M2 Protein Regulates MAVS-Mediated Signaling Pathway through Interacting with MAVS and Increasing ROS Production. Autophagy 2019, 15, 1163–1181. [Google Scholar] [CrossRef]
- Bradshaw, A.V.; Campbell, P.; Schapira, A.H.V.; Morris, H.R.; Taanman, J.-W. The PINK1 – Parkin Mitophagy Signalling Pathway Is Not Functional in Peripheral Blood Mononuclear Cells 2020, 2020. 02.12.94 5469.
- Taléns-Visconti, R. Hepatogenic Differentiation of Human Mesenchymal Stem Cells from Adipose Tissue in Comparison with Bone Marrow Mesenchymal Stem Cells. WJG 2006, 12, 5834. [Google Scholar] [CrossRef] [PubMed]
- Yang, M.; Wei, D.; Mo, C.; Zhang, J.; Wang, X.; Han, X.; Wang, Z.; Xiao, H. Saturated Fatty Acid Palmitate-Induced Insulin Resistance Is Accompanied with Myotube Loss and the Impaired Expression of Health Benefit Myokine Genes in C2C12 Myotubes. Lipids in Health and Disease 2013, 12, 104. [Google Scholar] [CrossRef] [PubMed]
- Marycz, K.; Śmieszek, A.; Grzesiak, J.; Donesz-Sikorska, A.; Krzak-Roś, J. Application of Bone Marrow and Adipose-Derived Mesenchymal Stem Cells for Testing the Biocompatibility of Metal-Based Biomaterials Functionalized with Ascorbic Acid. Biomed. Mater. 2013, 8, 065004. [Google Scholar] [CrossRef]
- Bourebaba, L.; Bedjou, F.; Röcken, M.; Marycz, K. Nortropane Alkaloids as Pharmacological Chaperones in the Rescue of Equine Adipose-Derived Mesenchymal Stromal Stem Cells Affected by Metabolic Syndrome through Mitochondrial Potentiation, Endoplasmic Reticulum Stress Mitigation and Insulin Resistance Alleviation. Stem Cell Res Ther 2019, 10, 178. [Google Scholar] [CrossRef] [PubMed]
- Bai, J.; Wang, M.X.; Chowbay, B.; Ching, C.B.; Chen, W.N. Metabolic Profiling of HepG2 Cells Incubated with S(−) and R(+) Enantiomers of Anti-Coagulating Drug Warfarin. Metabolomics 2011, 7, 353–362. [Google Scholar] [CrossRef] [PubMed]
- Peng, J.-Y.; Lin, C.-C.; Chen, Y.-J.; Kao, L.-S.; Liu, Y.-C.; Chou, C.-C.; Huang, Y.-H.; Chang, F.-R.; Wu, Y.-C.; Tsai, Y.-S.; et al. Automatic Morphological Subtyping Reveals New Roles of Caspases in Mitochondrial Dynamics. PLoS Comput Biol 2011, 7, e1002212. [Google Scholar] [CrossRef]
- Antonsson, B.; Conti, F.; Ciavatta, A.; Montessuit, S.; Lewis, S.; Martinou, I.; Bernasconi, L.; Bernard, A.; Mermod, J.-J.; Mazzei, G.; et al. Inhibition of Bax Channel-Forming Activity by Bcl-2. Science 1997, 277, 370–372. [Google Scholar] [CrossRef]
- Zhou, B.; Li, C.; Qi, W.; Zhang, Y.; Zhang, F.; Wu, J.X.; Hu, Y.N.; Wu, D.M.; Liu, Y.; Yan, T.T.; et al. Downregulation of MiR-181a Upregulates Sirtuin-1 (SIRT1) and Improves Hepatic Insulin Sensitivity. Diabetologia 2012, 55, 2032–2043. [Google Scholar] [CrossRef]
- Prabhakar, P.K.; Sivakumar, P.M. Protein Tyrosine Phosphatase 1B Inhibitors: A Novel Therapeutic Strategy for the Management of Type 2 Diabetes Mellitus. Curr Pharm Des 2019, 25, 2526–2539. [Google Scholar] [CrossRef]
- Chiarugi, P.; Buricchi, F. Protein Tyrosine Phosphorylation and Reversible Oxidation: Two Cross-Talking Posttranslation Modifications. Antioxid Redox Signal 2007, 9, 1–24. [Google Scholar] [CrossRef] [PubMed]
- Shimizu, S.; Ugi, S.; Maegawa, H.; Egawa, K.; Nishio, Y.; Yoshizaki, T.; Shi, K.; Nagai, Y.; Morino, K.; Nemoto, K.; et al. Protein-Tyrosine Phosphatase 1B as New Activator for Hepatic Lipogenesis via Sterol Regulatory Element-Binding Protein-1 Gene Expression. J Biol Chem 2003, 278, 43095–43101. [Google Scholar] [CrossRef]
- Taghibiglou, C.; Rashid-Kolvear, F.; Van Iderstine, S.C.; Le-Tien, H.; Fantus, I.G.; Lewis, G.F.; Adeli, K. Hepatic Very Low Density Lipoprotein-ApoB Overproduction Is Associated with Attenuated Hepatic Insulin Signaling and Overexpression of Protein-Tyrosine Phosphatase 1B in a Fructose-Fed Hamster Model of Insulin Resistance*. Journal of Biological Chemistry 2002, 277, 793–803. [Google Scholar] [CrossRef]
- Zabolotny, J.M.; Kim, Y.-B.; Welsh, L.A.; Kershaw, E.E.; Neel, B.G.; Kahn, B.B. Protein-Tyrosine Phosphatase 1B Expression Is Induced by Inflammation in Vivo. Journal of Biological Chemistry 2008, 283, 14230–14241. [Google Scholar] [CrossRef]
- Agouni, A.; Mody, N.; Owen, C.; Czopek, A.; Zimmer, D.; Bentires-Alj, M.; Bence, K.K.; Delibegović, M. Liver-Specific Deletion of Protein Tyrosine Phosphatase (PTP) 1B Improves Obesity- and Pharmacologically Induced Endoplasmic Reticulum Stress. Biochem J 2011, 438, 369–378. [Google Scholar] [CrossRef]
- Chen, P.-J.; Cai, S.-P.; Huang, C.; Meng, X.-M.; Li, J. Protein Tyrosine Phosphatase 1B (PTP1B): A Key Regulator and Therapeutic Target in Liver Diseases. Toxicology 2015, 337, 10–20. [Google Scholar] [CrossRef]
- Anderson, S.M.; Cheesman, H.K.; Peterson, N.D.; Salisbury, J.E.; Soukas, A.A.; Pukkila-Worley, R. The Fatty Acid Oleate Is Required for Innate Immune Activation and Pathogen Defense in Caenorhabditis Elegans. PLoS Pathog 2019, 15, e1007893. [Google Scholar] [CrossRef] [PubMed]
- Baylin, A.; Kabagambe, E.K.; Siles, X.; Campos, H. Adipose Tissue Biomarkers of Fatty Acid Intake. Am J Clin Nutr 2002, 76, 750–757. [Google Scholar] [CrossRef] [PubMed]
- Hirsova, P.; Ibrabim, S.H.; Gores, G.J.; Malhi, H. Lipotoxic Lethal and Sublethal Stress Signaling in Hepatocytes: Relevance to NASH Pathogenesis. J Lipid Res 2016, 57, 1758–1770. [Google Scholar] [CrossRef]
- Hanayama, M.; Yamamoto, Y.; Utsunomiya, H.; Yoshida, O.; Liu, S.; Mogi, M.; Matsuura, B.; Takeshita, E.; Ikeda, Y.; Hiasa, Y. The Mechanism of Increased Intestinal Palmitic Acid Absorption and Its Impact on Hepatic Stellate Cell Activation in Nonalcoholic Steatohepatitis. Sci Rep 2021, 11, 13380. [Google Scholar] [CrossRef] [PubMed]
- Chen, L.; Teng, H.; Cao, H. Chlorogenic Acid and Caffeic Acid from Sonchus Oleraceus Linn Synergistically Attenuate Insulin Resistance and Modulate Glucose Uptake in HepG2 Cells. Food Chem Toxicol 2019, 127, 182–187. [Google Scholar] [CrossRef]
- Charytoniuk, T.; Iłowska, N.; Berk, K.; Drygalski, K.; Chabowski, A.; Konstantynowicz-Nowicka, K. The Effect of Enterolactone on Sphingolipid Pathway and Hepatic Insulin Resistance Development in HepG2 Cells. Life Sci 2019, 217, 1–7. [Google Scholar] [CrossRef] [PubMed]
- Obanda, D.N.; Hernandez, A.; Ribnicky, D.; Yu, Y.; Zhang, X.H.; Wang, Z.Q.; Cefalu, W.T. Bioactives of Artemisia Dracunculus L. Mitigate the Role of Ceramides in Attenuating Insulin Signaling in Rat Skeletal Muscle Cells. Diabetes 2012, 61, 597–605. [Google Scholar] [CrossRef]
- Obanda, D.N.; Cefalu, W.T. Modulation of Cellular Insulin Signaling and PTP1B Effects by Lipid Metabolites in Skeletal Muscle Cells. J Nutr Biochem 2013, 24, 1529–1537. [Google Scholar] [CrossRef]
- Batista, T.M.; Haider, N.; Kahn, C.R. Defining the Underlying Defect in Insulin Action in Type 2 Diabetes. Diabetologia 2021, 64, 994–1006. [Google Scholar] [CrossRef] [PubMed]
- Sharma, B.R.; Kim, H.J.; Rhyu, D.Y. Caulerpa Lentillifera Extract Ameliorates Insulin Resistance and Regulates Glucose Metabolism in C57BL/KsJ-Db/Db Mice via PI3K/AKT Signaling Pathway in Myocytes. J Transl Med 2015, 13, 62. [Google Scholar] [CrossRef] [PubMed]
- Carr, R.M.; Correnti, J. Insulin Resistance in Clinical and Experimental Alcoholic Liver Disease. Ann N Y Acad Sci 2015, 1353, 1–20. [Google Scholar] [CrossRef] [PubMed]
- Beurel, E.; Grieco, S.F.; Jope, R.S. Glycogen Synthase Kinase-3 (GSK3): Regulation, Actions, and Diseases. Pharmacol Ther 2015, 148, 114–131. [Google Scholar] [CrossRef] [PubMed]
- Ghanem, A.; Kitanovic, A.; Holzwarth, J.; Wölfl, S. Mutational Analysis of Fructose-1,6-Bis-Phosphatase FBP1 Indicates Partially Independent Functions in Gluconeogenesis and Sensitivity to Genotoxic Stress. Microb Cell 2017, 4, 52–63. [Google Scholar] [CrossRef] [PubMed]
- Gross, D.N.; Wan, M.; Birnbaum, M.J. The Role of FOXO in the Regulation of Metabolism. Curr Diab Rep 2009, 9, 208–214. [Google Scholar] [CrossRef]
- Naowaboot, J.; Piyabhan, P.; Munkong, N.; Parklak, W.; Pannangpetch, P. Ferulic Acid Improves Lipid and Glucose Homeostasis in High-Fat Diet-Induced Obese Mice. Clin Exp Pharmacol Physiol 2016, 43, 242–250. [Google Scholar] [CrossRef]
- Shao, W.; Espenshade, P.J. Expanding Roles for SREBP in Metabolism. Cell Metab 2012, 16, 414–419. [Google Scholar] [CrossRef] [PubMed]
- Xuguang, H.; Aofei, T.; Tao, L.; Longyan, Z.; Weijian, B.; Jiao, G. Hesperidin Ameliorates Insulin Resistance by Regulating the IRS1-GLUT2 Pathway via TLR4 in HepG2 Cells. Phytother Res 2019, 33, 1697–1705. [Google Scholar] [CrossRef] [PubMed]
- Thorens, B. GLUT2, Glucose Sensing and Glucose Homeostasis. Diabetologia 2015, 58, 221–232. [Google Scholar] [CrossRef]
- Huang, F.; Chen, J.; Wang, J.; Zhu, P.; Lin, W. Palmitic Acid Induces MicroRNA-221 Expression to Decrease Glucose Uptake in HepG2 Cells via the PI3K/AKT/GLUT4 Pathway. Biomed Res Int 2019, 2019, 8171989. [Google Scholar] [CrossRef] [PubMed]
- Erion, D.M.; Yonemitsu, S.; Nie, Y.; Nagai, Y.; Gillum, M.P.; Hsiao, J.J.; Iwasaki, T.; Stark, R.; Weismann, D.; Yu, X.X.; et al. SirT1 Knockdown in Liver Decreases Basal Hepatic Glucose Production and Increases Hepatic Insulin Responsiveness in Diabetic Rats. Proceedings of the National Academy of Sciences 2009, 106, 11288–11293. [Google Scholar] [CrossRef]
- Gupte, R.S.; Floyd, B.C.; Kozicky, M.; George, S.; Ungvari, Z.I.; Neito, V.; Wolin, M.S.; Gupte, S.A. Synergistic Activation of Glucose-6-Phosphate Dehydrogenase and NAD(P)H Oxidase by Src Kinase Elevates Superoxide in Type 2 Diabetic, Zucker Fa/Fa, Rat Liver. Free Radic Biol Med 2009, 47, 219–228. [Google Scholar] [CrossRef] [PubMed]
- You, M.; Liang, X.; Ajmo, J.M.; Ness, G.C. Involvement of Mammalian Sirtuin 1 in the Action of Ethanol in the Liver. American Journal of Physiology-Gastrointestinal and Liver Physiology 2008, 294, G892–G898. [Google Scholar] [CrossRef] [PubMed]
- Walker, A.K.; Yang, F.; Jiang, K.; Ji, J.-Y.; Watts, J.L.; Purushotham, A.; Boss, O.; Hirsch, M.L.; Ribich, S.; Smith, J.J.; et al. Conserved Role of SIRT1 Orthologs in Fasting-Dependent Inhibition of the Lipid/Cholesterol Regulator SREBP. Genes Dev. 2010, 24, 1403–1417. [Google Scholar] [CrossRef]
- Morton, J.D.; Shimomura, L. Sterol Regulatory Element-Binding Proteins: Activators of Cholesterol and Fatty Acid Biosynthesis. Current Opinion in Lipidology 1999, 10, 143. [Google Scholar] [CrossRef]
- Osborne, T.F. Sterol Regulatory Element-Binding Proteins (SREBPs): Key Regulators of Nutritional Homeostasis and Insulin Action *. Journal of Biological Chemistry 2000, 275, 32379–32382. [Google Scholar] [CrossRef]
- Gulick, T.; Cresci, S.; Caira, T.; Moore, D.D.; Kelly, D.P. The Peroxisome Proliferator-Activated Receptor Regulates Mitochondrial Fatty Acid Oxidative Enzyme Gene Expression. Proceedings of the National Academy of Sciences 1994, 91, 11012–11016. [Google Scholar] [CrossRef] [PubMed]
- Rodgers, J.T.; Lerin, C.; Gerhart-Hines, Z.; Puigserver, P. Metabolic Adaptations through the PGC-1α and SIRT1 Pathways. FEBS Letters 2008, 582, 46–53. [Google Scholar] [CrossRef]
- Yu, G.-S.; Lu, Y.-C.; Gulick, T. Co-Regulation of Tissue-Specific Alternative Human Carnitine Palmitoyltransferase Iβ Gene Promoters by Fatty Acid Enzyme Substrate *. Journal of Biological Chemistry 1998, 273, 32901–32909. [Google Scholar] [CrossRef] [PubMed]
- Lan, F.; Cacicedo, J.M.; Ruderman, N.; Ido, Y. SIRT1 Modulation of the Acetylation Status, Cytosolic Localization, and Activity of LKB1: POSSIBLE ROLE IN AMP-ACTIVATED PROTEIN KINASE ACTIVATION *. Journal of Biological Chemistry 2008, 283, 27628–27635. [Google Scholar] [CrossRef]
- Rachek, L.I.; Musiyenko, S.I.; LeDoux, S.P.; Wilson, G.L. Palmitate Induced Mitochondrial Deoxyribonucleic Acid Damage and Apoptosis in L6 Rat Skeletal Muscle Cells. Endocrinology 2007, 148, 293–299. [Google Scholar] [CrossRef] [PubMed]
- Yuzefovych, L.V.; Solodushko, V.A.; Wilson, G.L.; Rachek, L.I. Protection from Palmitate-Induced Mitochondrial DNA Damage Prevents from Mitochondrial Oxidative Stress, Mitochondrial Dysfunction, Apoptosis, and Impaired Insulin Signaling in Rat L6 Skeletal Muscle Cells. Endocrinology 2012, 153, 92–100. [Google Scholar] [CrossRef]
- Gao, X.; Zhao, X.; Zhu, Y.; Li, X.; Xu, Q.; Lin, H.; Wang, M. Tetramethylpyrazine Protects Palmitate-Induced Oxidative Damage and Mitochondrial Dysfunction in C2C12 Myotubes. Life Sci 2011, 88, 803–809. [Google Scholar] [CrossRef] [PubMed]
- Wang, Z.; Hou, L.; Huang, L.; Guo, J.; Zhou, X. Exenatide Improves Liver Mitochondrial Dysfunction and Insulin Resistance by Reducing Oxidative Stress in High Fat Diet-Induced Obese Mice. Biochem Biophys Res Commun 2017, 486, 116–123. [Google Scholar] [CrossRef]
- Wang, J.; Zou, Q.; Suo, Y.; Tan, X.; Yuan, T.; Liu, Z.; Liu, X. Lycopene Ameliorates Systemic Inflammation-Induced Synaptic Dysfunction via Improving Insulin Resistance and Mitochondrial Dysfunction in the Liver-Brain Axis. Food Funct 2019, 10, 2125–2137. [Google Scholar] [CrossRef]
- Li, G.; Yang, J.; Yang, C.; Zhu, M.; Jin, Y.; McNutt, M.A.; Yin, Y. PTENα Regulates Mitophagy and Maintains Mitochondrial Quality Control. Autophagy 2018, 14, 1742–1760. [Google Scholar] [CrossRef] [PubMed]
- Redmann, M.; Benavides, G.A.; Wani, W.Y.; Berryhill, T.F.; Ouyang, X.; Johnson, M.S.; Ravi, S.; Mitra, K.; Barnes, S.; Darley-Usmar, V.M.; et al. Methods for Assessing Mitochondrial Quality Control Mechanisms and Cellular Consequences in Cell Culture. Redox Biol 2018, 17, 59–69. [Google Scholar] [CrossRef] [PubMed]
- Wang, N.; Liu, Y.; Ma, Y.; Wen, D. Hydroxytyrosol Ameliorates Insulin Resistance by Modulating Endoplasmic Reticulum Stress and Prevents Hepatic Steatosis in Diet-Induced Obesity Mice. J Nutr Biochem 2018, 57, 180–188. [Google Scholar] [CrossRef] [PubMed]
- Su, Z.; Nie, Y.; Huang, X.; Zhu, Y.; Feng, B.; Tang, L.; Zheng, G. Mitophagy in Hepatic Insulin Resistance: Therapeutic Potential and Concerns. Front Pharmacol 2019, 10, 1193. [Google Scholar] [CrossRef] [PubMed]
- Wang, S.; Chen, X.; Nair, S.; Sun, D.; Wang, X.; Ren, J. Deletion of Protein Tyrosine Phosphatase 1B Obliterates Endoplasmic Reticulum Stress-Induced Myocardial Dysfunction through Regulation of Autophagy. Biochimica et Biophysica Acta (BBA) - Molecular Basis of Disease 2017, 1863, 3060–3074. [Google Scholar] [CrossRef] [PubMed]
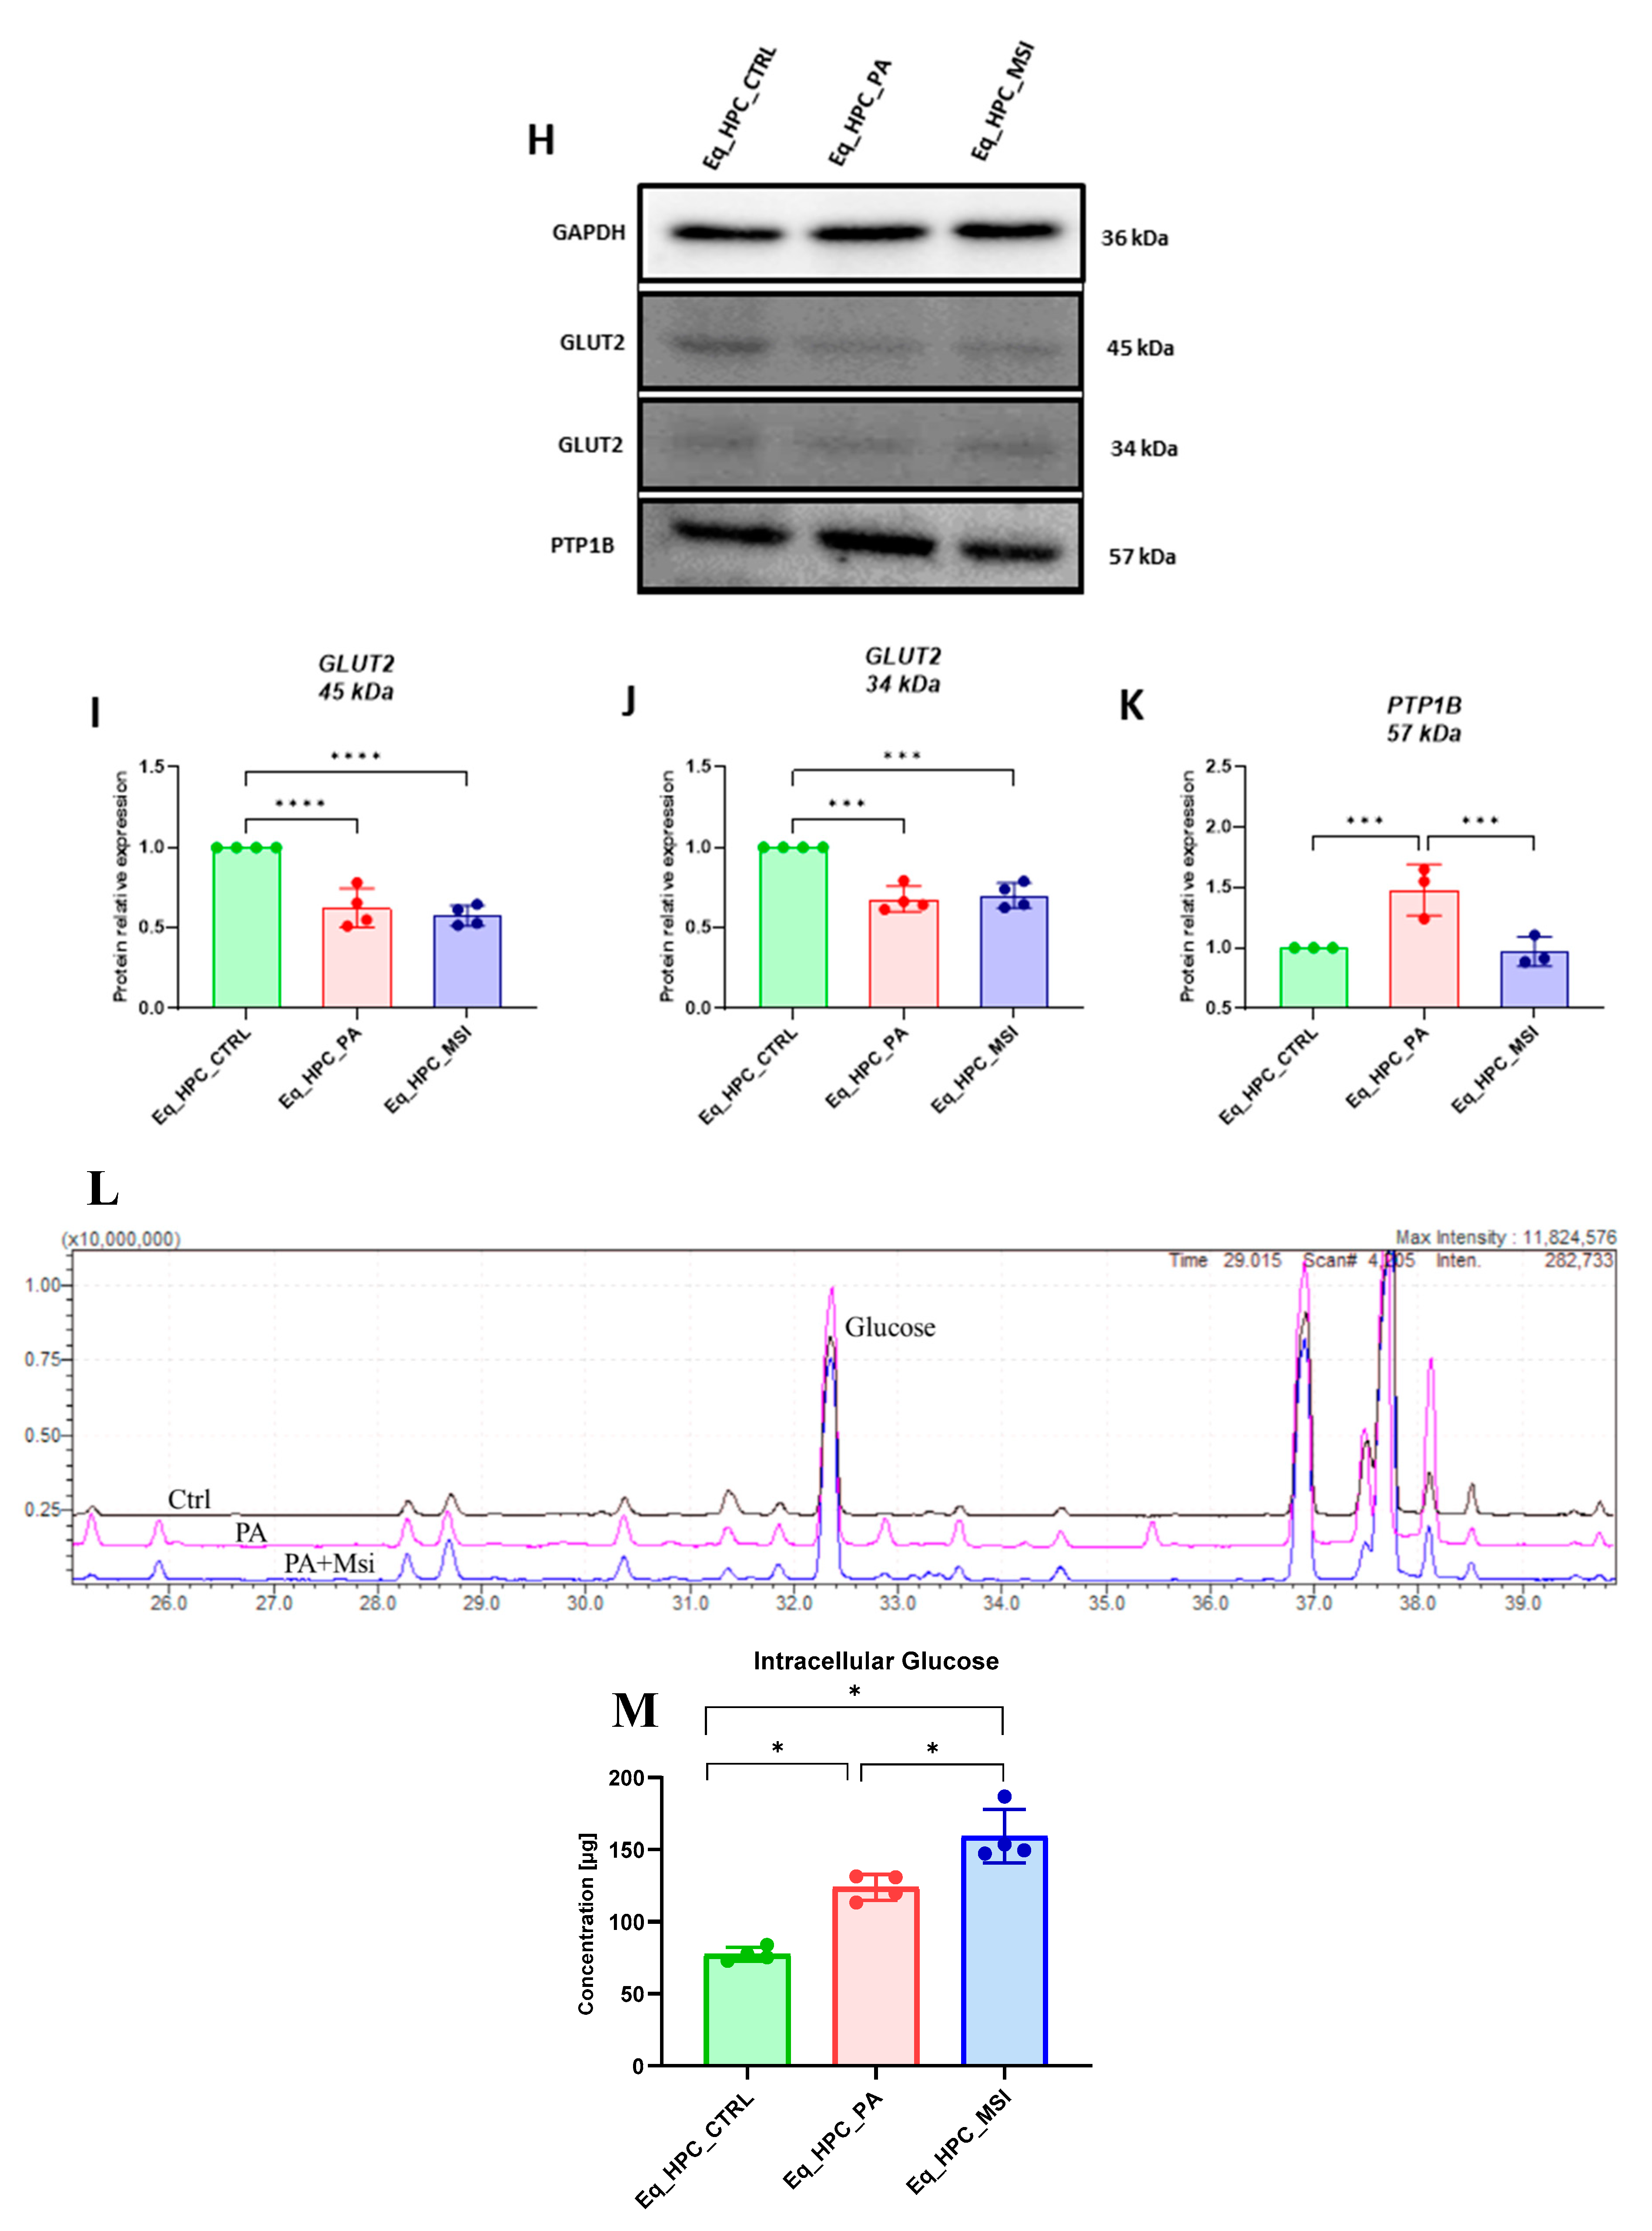
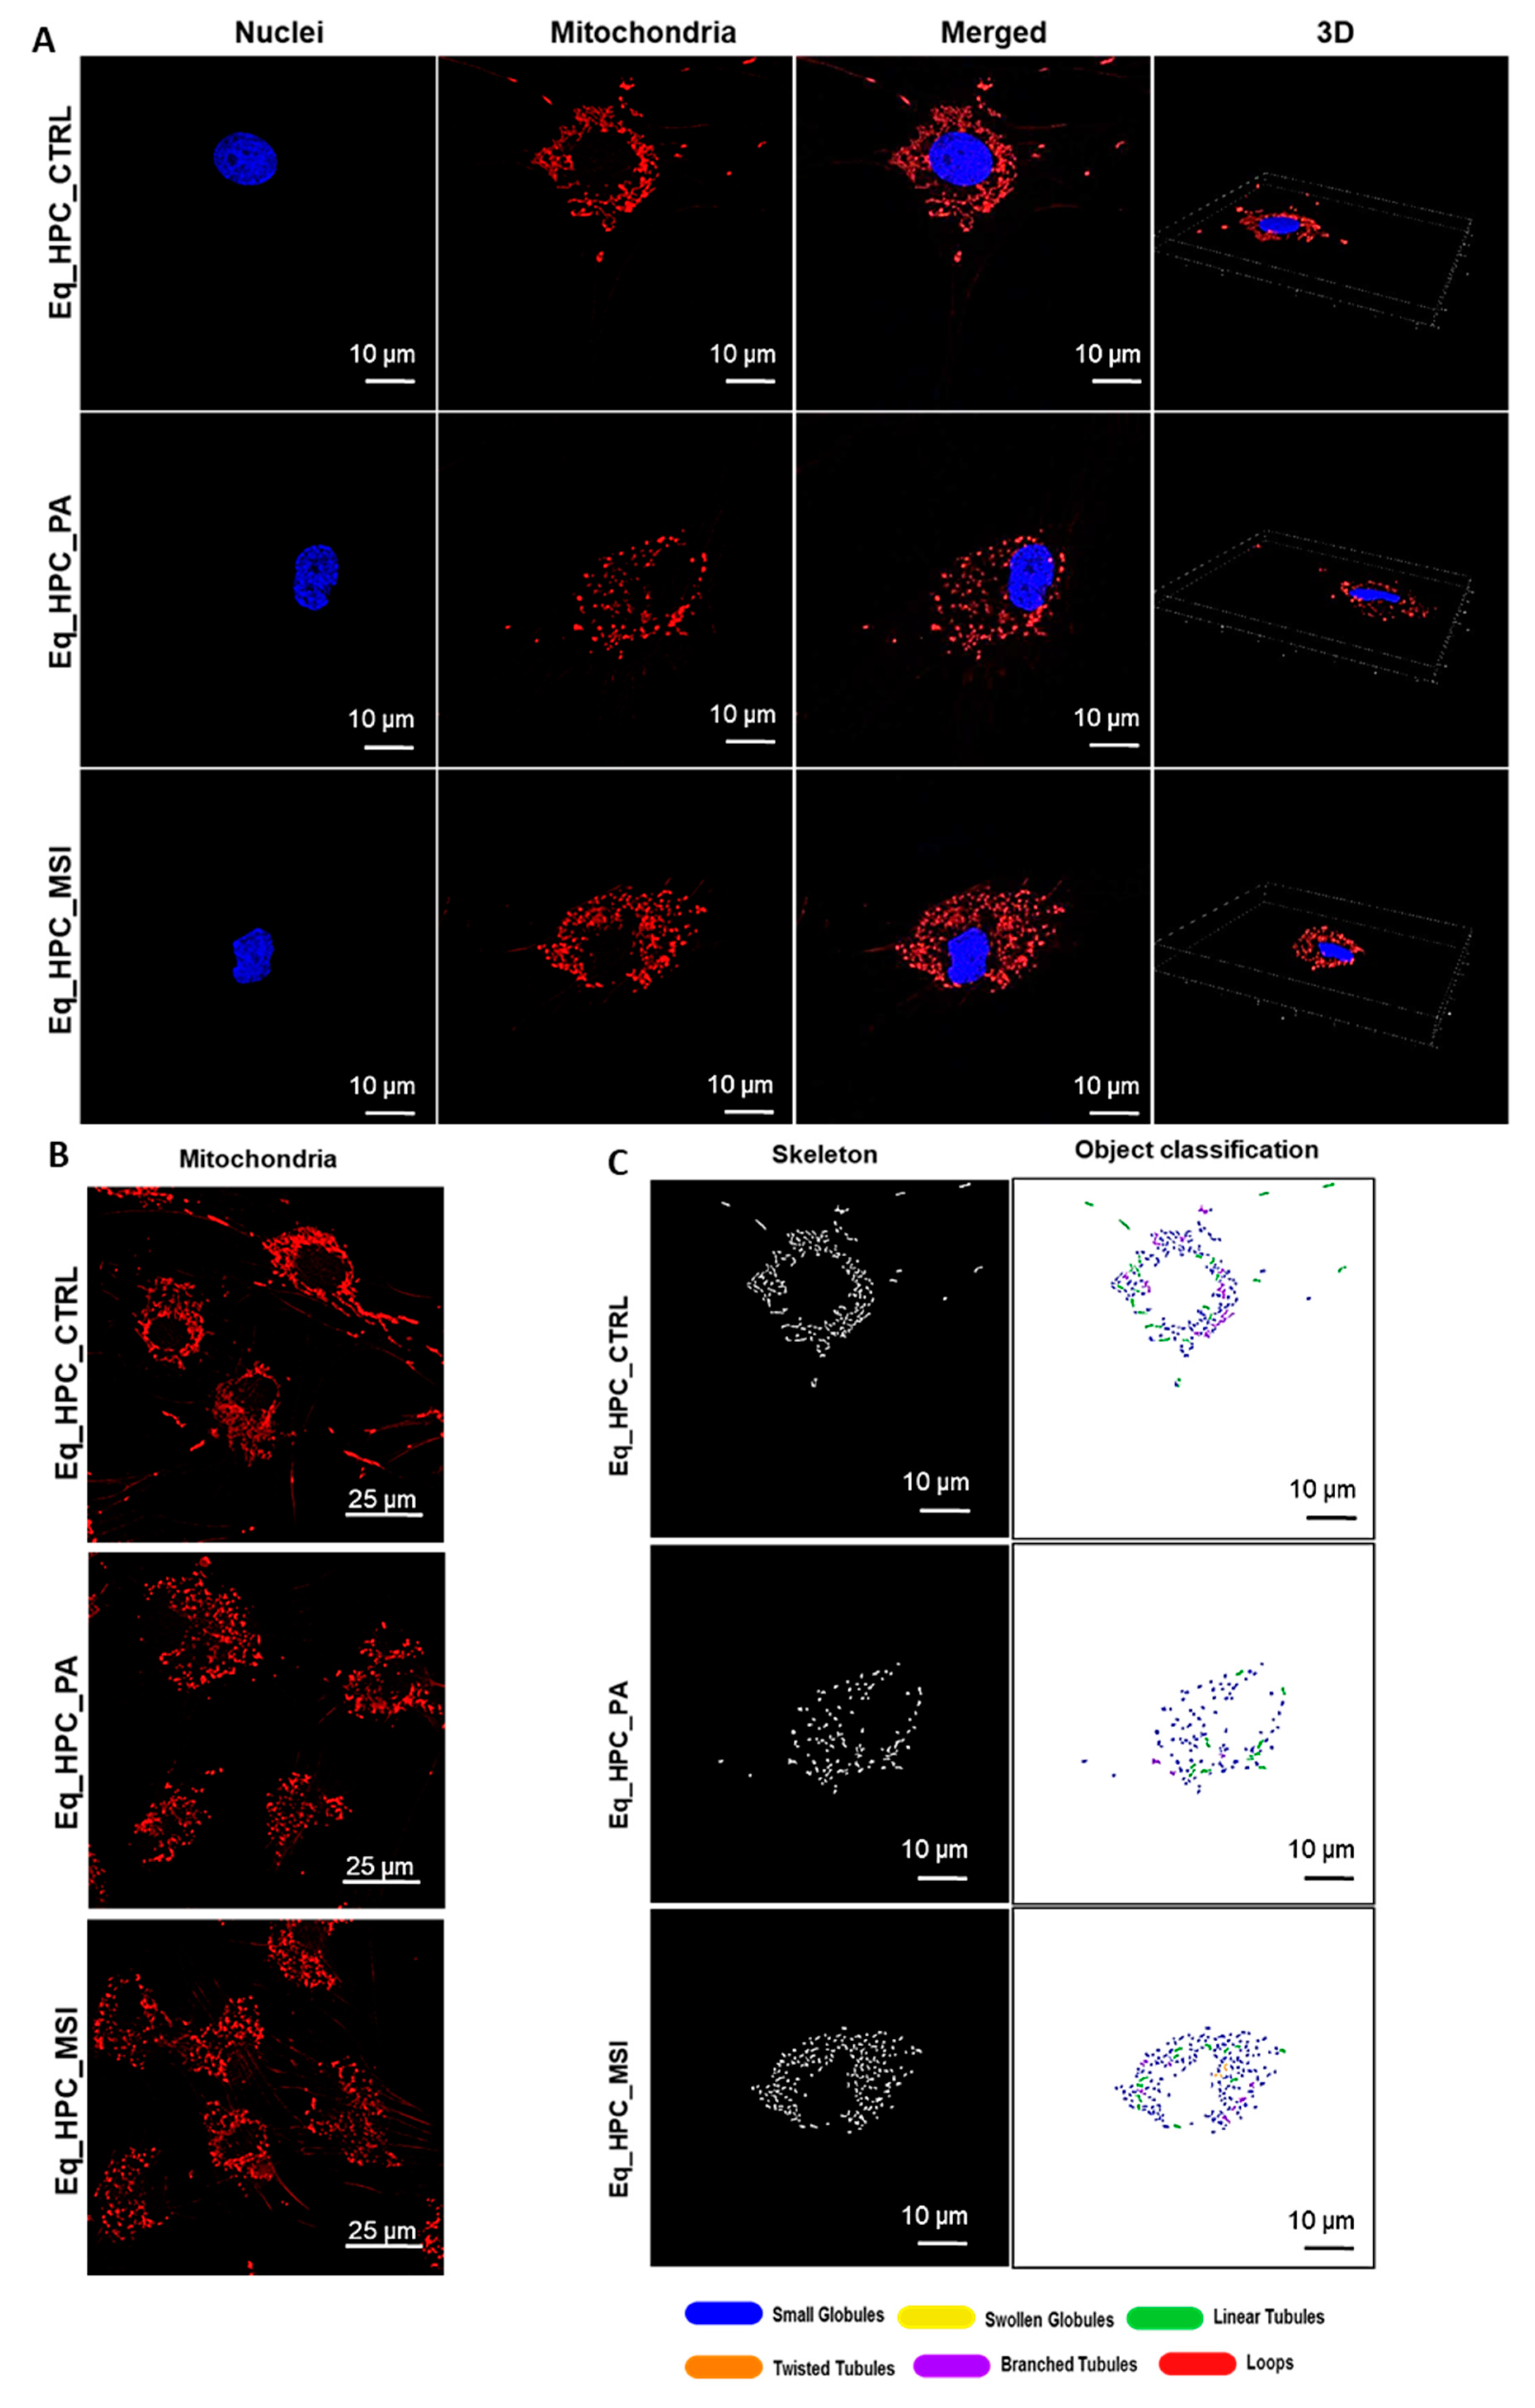
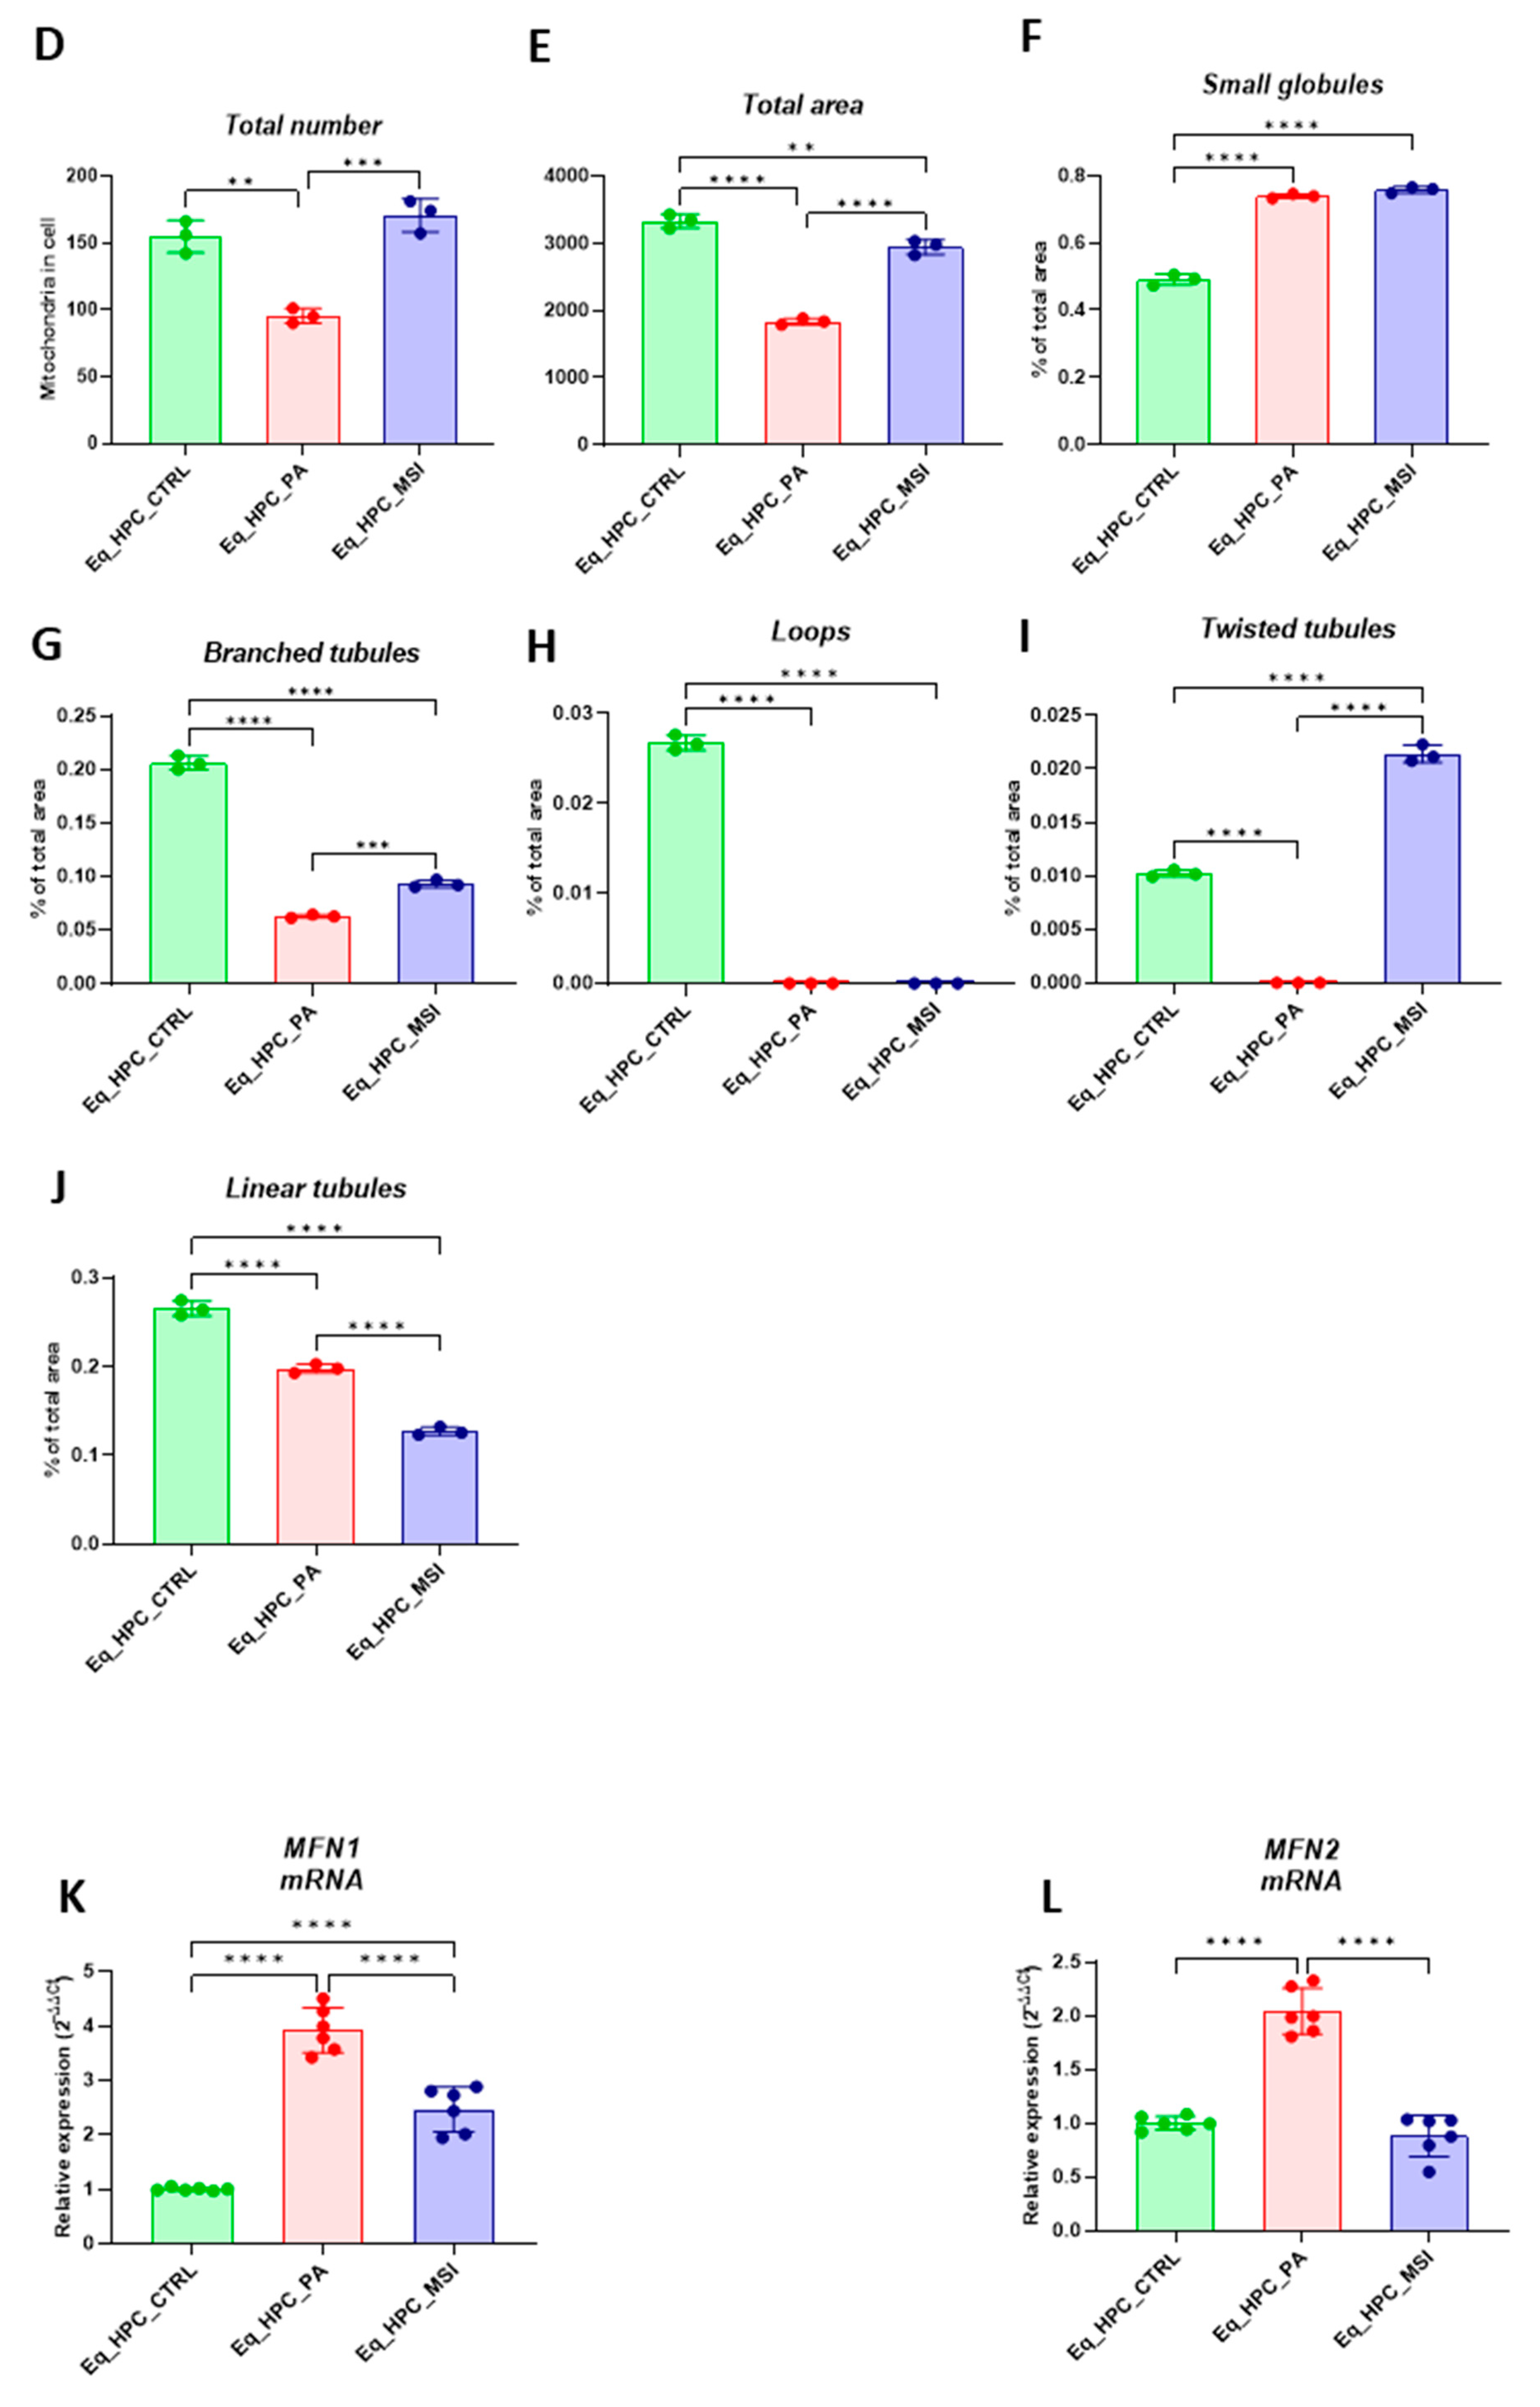
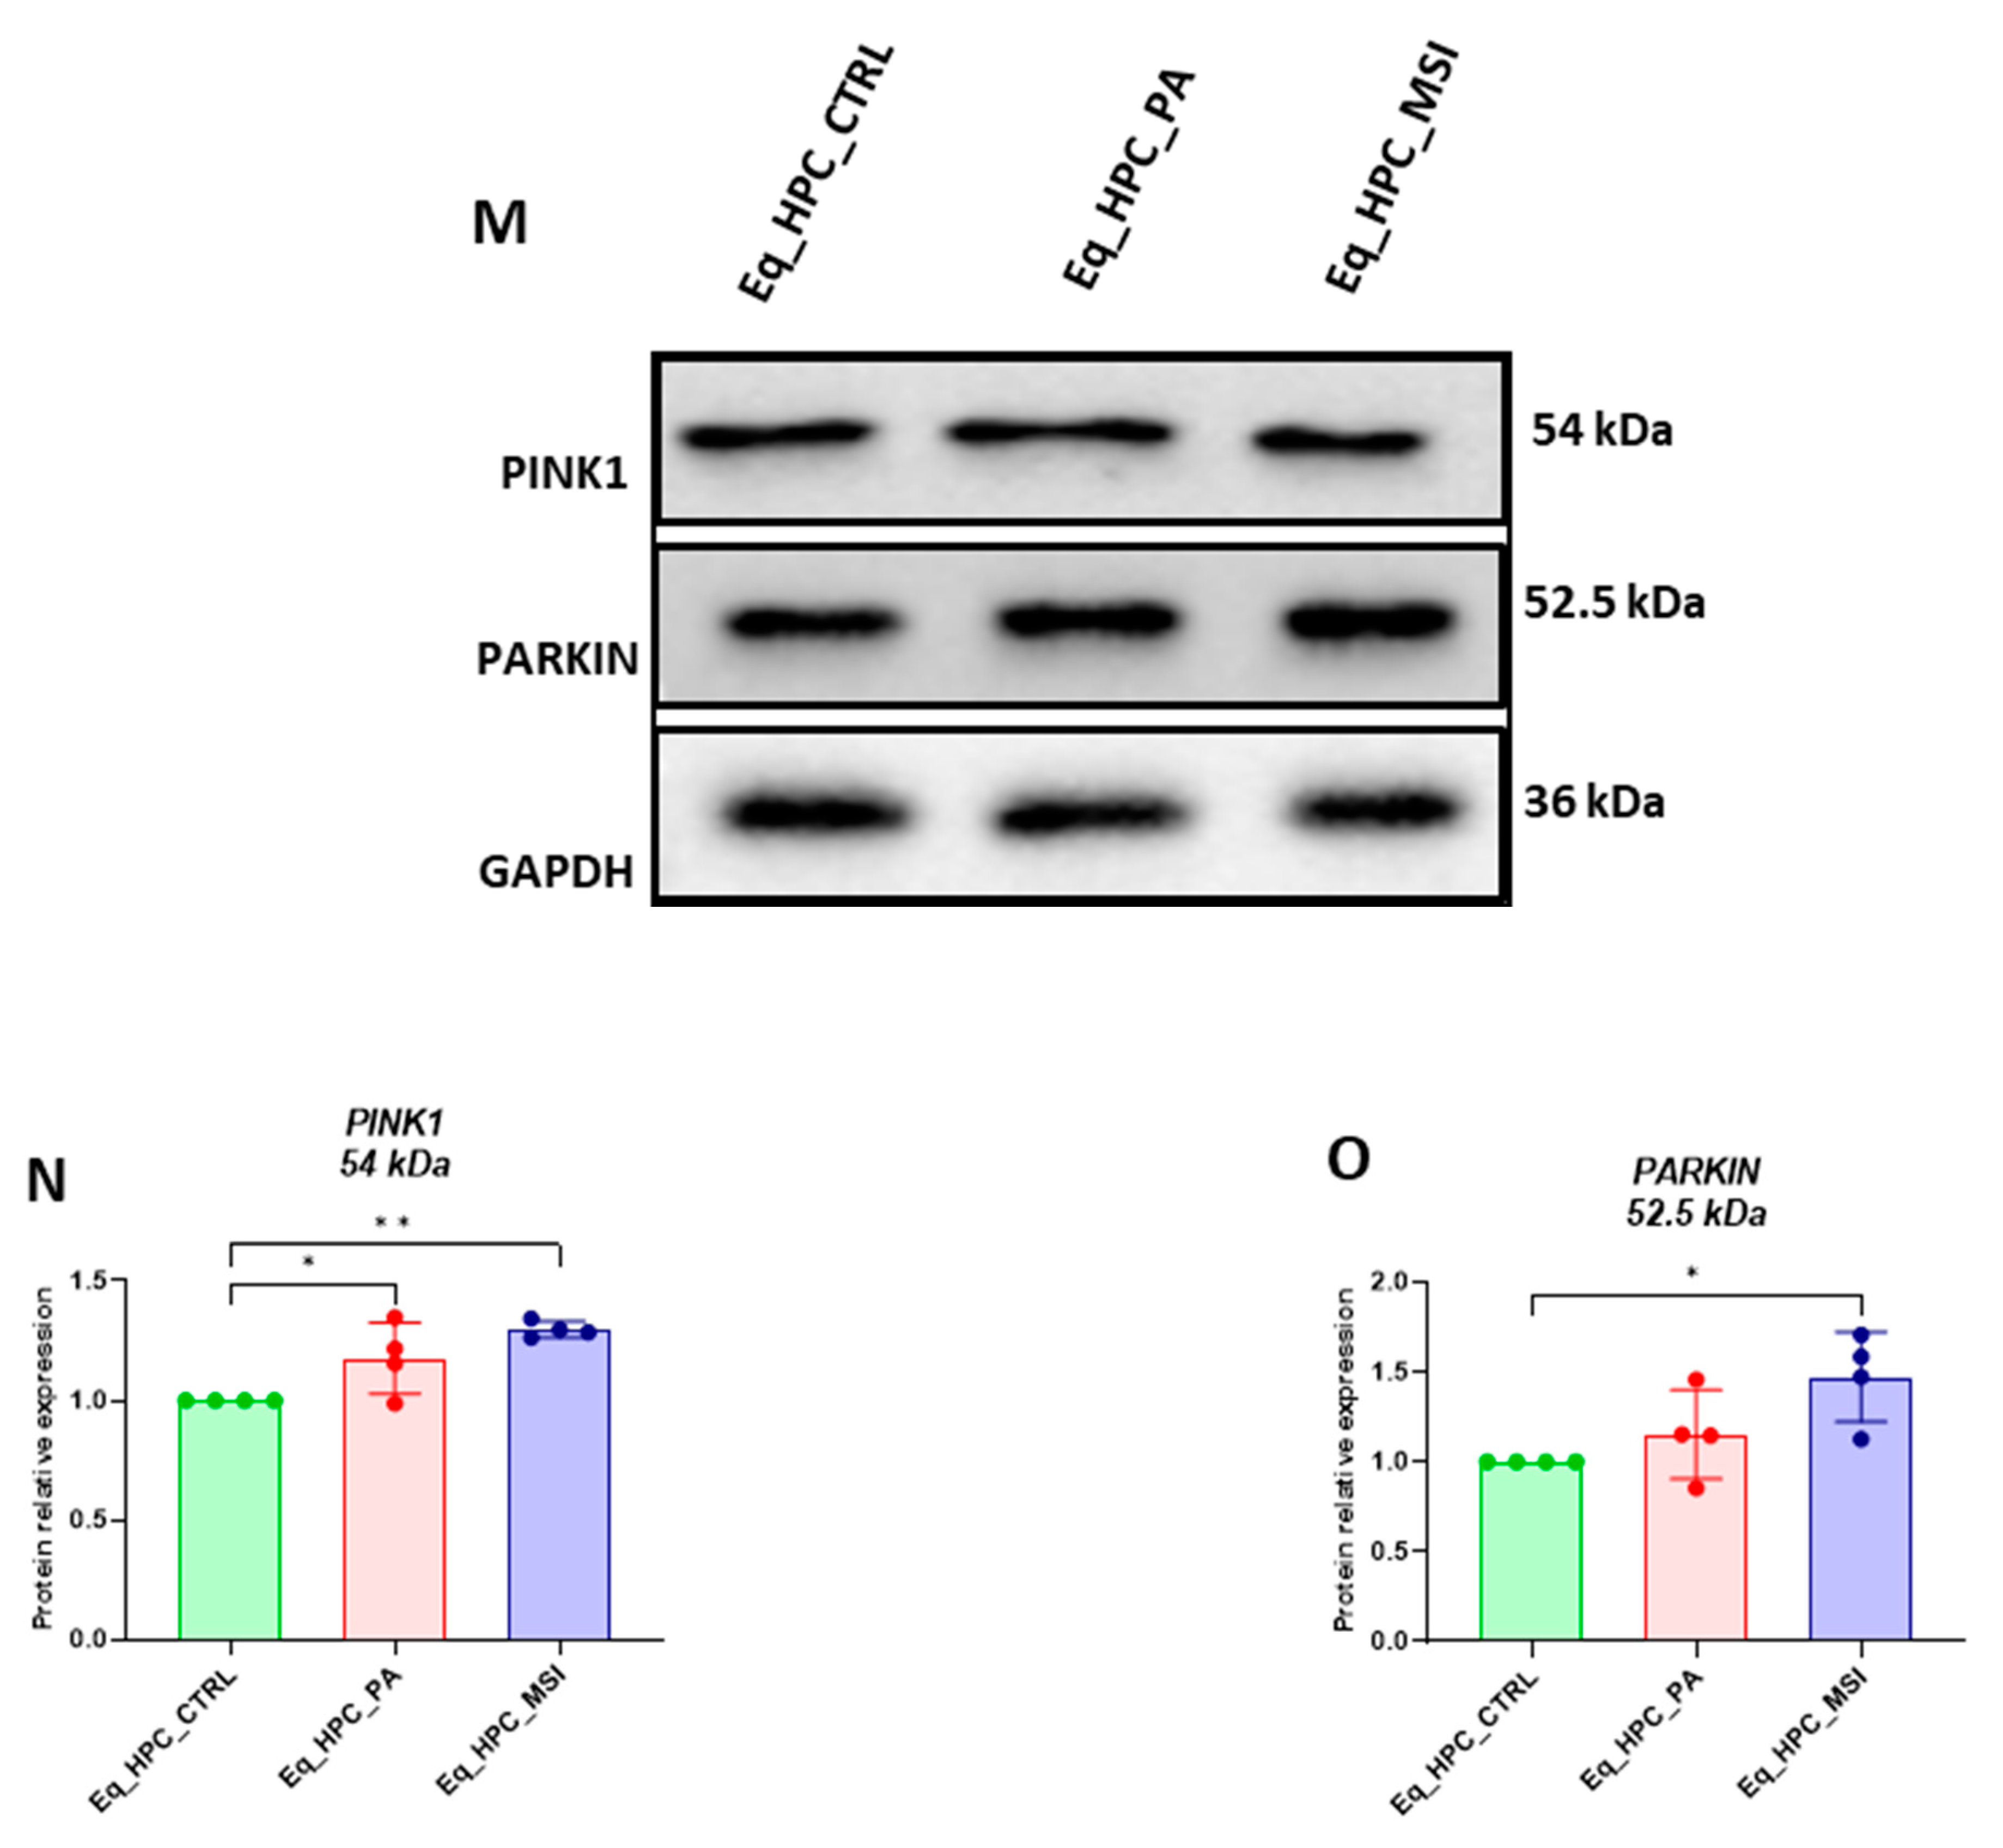
| Gene | Primer | Sequence 5′–3′ | Amplicon Length (bp) |
Accession No. | |
|---|---|---|---|---|---|
| MFN1 | F: R: |
AAGTGGCATTTTTCGGCAGG TCCATATGAAGGGCATGGGC |
217 | XM_005601821.3 | |
| MFN2 | F: R: |
AATGCCATGCTCTGGGACAA CATCAGCGTCCAGGCAAAAC |
325 | XM_023635773.1 | |
| BAX | F: R: |
CGAGTGGCAGCTGAGATGTT AAGGAAGTCCAGTGTCCAGC |
153 | XM_023650076.1 | |
| BCL2 | F: R: |
TTCTTTGAGTTCGGTGGGGT GGGCCGTACAGTTCCACAA |
164 | XM_001490436.4 | |
| SIRT1 | F: R: |
ACCAACGGTTTTCATTCTTGTG ATTCGAGGATCTGTGCCAATCA |
139 | XM_023643979.1 | |
| AKT1 | F: R: |
AAGGAGATCATGCAGCACC GCTCCATCGTGTCGTCTTGGT |
180 | XM_023628568.1 | |
| PI3K | F: R: |
GACTTGCACTTGGGTGACATA TAAGTTCCCGGAAAGTCCCC |
152 | XM_023625590.1 | |
| mTOR | F: R: |
GGGCAGCATTAGAGACGGTG ATGGTTGATTCGGTGTCGCA |
221 | XM_023635800.1 | |
| G6PD | F: R: |
CAGAGCGAGCCCTTCTTCAA CAGGTAGTGGTCAATGCGGT | 363 | XM_023634095.1 | |
| GAPDH | F: R: |
GATGCCCCAATGTTTGTGA AAGCAGGGATGATGTTCTGG | 250 | NM_001163856.1 |
| Antibodies | Concentrations | CAT Numbers | Company |
|---|---|---|---|
| GAPDH | 1:2500 | ab9485 | Abcam |
| SIRT1 | 1:5000 | ARP32386 | Aviva |
| PINK 1 | 1:250 | orb331223 | Biorbyt |
| GLUT2 | 1:500 | orb10726 | Biorbyt |
| PTP1B | 1:1000 | ARP45360 | Aviva |
| PARKIN | 1:250 | NB100-91921 | Novus |
Disclaimer/Publisher’s Note: The statements, opinions and data contained in all publications are solely those of the individual author(s) and contributor(s) and not of MDPI and/or the editor(s). MDPI and/or the editor(s) disclaim responsibility for any injury to people or property resulting from any ideas, methods, instructions or products referred to in the content. |
© 2023 by the authors. Licensee MDPI, Basel, Switzerland. This article is an open access article distributed under the terms and conditions of the Creative Commons Attribution (CC BY) license (http://creativecommons.org/licenses/by/4.0/).


