1. Introduction
Rapeseed is one of the most important oil crops related to the national economy and people’s livelihood [
1]. The Yangtze River basin where adopt rice-rape rotation plating pattern is the main production area of winter rapeseed [
2]. In this area, rapeseed is sown in autumn after rice harvested. In order to provide better growing conditions for rapeseed, rice straws should be buried in the soil, and furrows (width:250~350mm, depth:150~200mm) are required on both sides of the seedbed to prevent rapeseed from waterlogging [
3,
4,
5,
6]. Therefore, the effect of ditching furrow is the key factor affecting the yield of rapeseed. Traditional manual ditching method costs a lot of labor and time. With the development of mechanized tillage technology, plows were widely integrated with rotary tiller to complete tillage and ditching operation in rice-rape rotation field. Qin et.al [
7,
8] designed a plowing and rotary tillage combined machine, having good stability in rice stubble field. Bao et.al [
9] proposed a plow-rotary style ditching method, providing technical support for high yield cultivation of rapeseed ridge planting. Liu et.al [
10] designed a combined ship type plow of rapeseed direct seeder, realizing the operation stability of plow in high moisture content condition. Wei et.al [
11] designed a plowing and rotary tillage buckle device for rapeseed direct seeder, which could efficiently complete burying straw and ditching furrows operation.
Although plow is suitable for ditching furrow in rice-rape rotation field, but due to the more rainy weather in Yangtze River basin, the soil in this area have the characteristics of heavy viscosity and hardening [
12,
13]. Plow will bear great drag resistance from the soil [
14,
15]. The early studies have mainly carried out soil trough test to explore drag-reduce characteristics of plow [
16,
17,
18,
19,
20,
21]. However, manufacturing different type plows will consume a lot of time and cost, and this approach is difficult to simulate actual physical state of soil for rice-rape rotation field. To solve this problem, DEM method have widely used in establishing soil simulation model to analyze the drag-reduce characteristics of plow. Sun et.al [
23] established EDEM simulation model of the bear-claw bionic ditcher based on the properties of red soil, obtaining the optimization structure parameters by response surface experiment. Zhang et.al [
23,
24] proposed soil prediction model, analyzing the effect of blade angle, width of guide curve, angle of straight-line on drag resistance of plow based on EDEM simulation. Ding et.al [
25] established soil model based on bonding contact theory, analyzing crushing effect of tillage tools on soil of rice-rape rotation field. Zhu et.al [
26] proposed the power consumption model of soil for rice-rape rotation field, analyzing the interaction mechanism between tillage tools and soil. So far, studies have focused on the influence of macro structural parameters on drag resistance for plow, but few studies had proposed reasonable drag-reduce design method.
The plow surface is a complex space structure, which shape and drag resistance characteristics are determined by its geometry properties. To clarify the relationship between geometry properties of plow and drag resistance is the key to investigate reasonable drag-reduce design method. Differential geometry studies the geometric properties of space curves and surfaces by calculus method, have widely used in the field of mechanical engineering [
27]. The geometric properties of space surfaces, such as arc length, curvature, area and so on, can be determined by fundamental quantity
E,
F,
G,
L,
M and
N [
28]. In this work, the drag resistance of ditching furrow system for ditching-rotary tiller was investigated. The machine was widely used in tillage and ditching furrows in rice-rape rotation field. The structure of ditching furrow system was shown in
Figure 1a. It was consisted of four identical ditching plows. The furrow was preliminary formed by front ditching plow, and the residual soil in the furrow was cleaned by rear ditching plow. A number of structural parameters, such as
θ (angle between straight-line and yoz plane),
w (width of ditching plow),
h (height of ditching plow),
l (width of guide curve OA) and
T (type of guide curve OA), affect shape and drag resistance characteristics of the ditching plow, as shown in
Figure 1b. The parameter
θ was increased along with
h as parabolic variable regularity [
29]. The guide curve OA could be designed as linear type, parabolic type or exponential type. In order to seek drag-reduce design method and optimal structure parameters for ditching plow, the relationship between fundamental quantity and drag resistance were investigated, and its optimal structure parameters were obtained by differential geometry analysis and EDEM simulation. The operation effect of optimized ditching furrow system was tested by field experiment.
2. Materials and Methods
2.1. Differential Geometry Analysis
2.1.1. Parametric Equation
The parametric equation of ditching plows with different type guide curves both could be expressed as:
Where, κ is the variable parameter, 0≤κ≤θmax-θmin; τ is the variable constant, 0≤τ≤1; θ is the angle between straight line and yoz plane,°; θmin is the minimum angle between straight-line and yoz plane,°.
Coordinates of point B and B’ were as follows:
Where,
L(
κ) is the function of width for guide curve;
H(
κ) and
H(
L) is the function of height for guide curve;
w is the width of plow, mm. Among them, the function
H(
L),
H(
κ) and
L(
κ) of ditching plow with different guide curves were shown in
Table 1.
Combing Equation (1) and Equation (2), which resulted in:
2.1.2. Fundamental Quantity
Differential equation
I and
II were the fundamental form, which could determine the geometric properties of ditching plow [
30].
Where,
E,
F and
G are the first type fundamental quantity;
L,
M and
N are the second type fundamental quantity. The fundamental quantity
E,
F,
G,
L,
M,
N could be calculated by Equation (3) and Equation (5).
2.2. EDEM Simulation Method
2.2.1. Soil Simulation Model
According to the measurement of actual soil section (repeat for 5 times), the average depth of tillage layer was 0 ~ 152mm and average depth of bottom layer was 152 ~ 400mm, as shown in
Figure 2a. The soil model was established based on EDEM2018 software (Engineering discrete element method, DEM Solutions Ltd.), as shown in
Figure 2b. The tillage layer and bottom layer were consisted of spherical particles, which contacted by bonding model. The mechanical and geometric parameters of soil simulation model were shown in
Table 2.
2.2.2. Resistance-Velocity Simulation
To explore the optimal type of guide curve for ditching plow, the drag resistance characteristics of three type plows (linear type, parabolic type, exponential type) were investigated by resistance-velocity simulation test. The structure of three type plows were shown in
Figure 3, and their structure parameters both were as follows:
Δθ=
θmax-
θmin=10°,
θmin=40°,
w=170mm,
h=300mm,
l=150mm. Tillage depth of ditching plows were 200mm and forward velocity was set as 0.4m/s ~ 1.2m/s. Material parameters of ditching plows were defined as steel, as shown in
Table 2. The total simulation time was 5s. Among them, soil particles were formed in 0~2.5s and ditching plow moved forward in 2.5~5s. The grid element size was 3 times of particle radius. The variation regularity of average drag resistance for ditching plow could be obtain by EDEM analyst module.
2.2.3. Parameter Optimizing Simulation
To obtain the optimal structure parameters of ditching plow, the quadratic regression orthogonal rotation combination design was conducted, as shown in
Table 3. The optimal type of guide curve could be determined by resistance-velocity simulation. As the single side ditching furrow system could only formed half of the furrow between adjacent seedbeds. According to the size of furrow,
w was designed as 170mm. The forward velocity of ditching plow was set as 0.8m/s. Independent variables
Δθ,
θmin,
h and
l were denoted as A, B, C and D. The code levels of four independent variables were represented by -1.68, -1, 0, 1 and 1.68. Average drag resistance (
Fd) was taken as the response value, and the target expectation was to reach the minimum value.
2.3. Field Experiment Method
The field experiment was carried out in Dafu village, Xiaogan City, Hubei Province, China. The experimental field adopted rice-rape rotation planting pattern all the year round, which average compactness was 778.56MPa and average moisture content was 27.1%. The test instruments were resistance detection device and ditching-rotary tiller. The traction power of the device was LX954 type tractor (YTO Group Co., Ltd.).
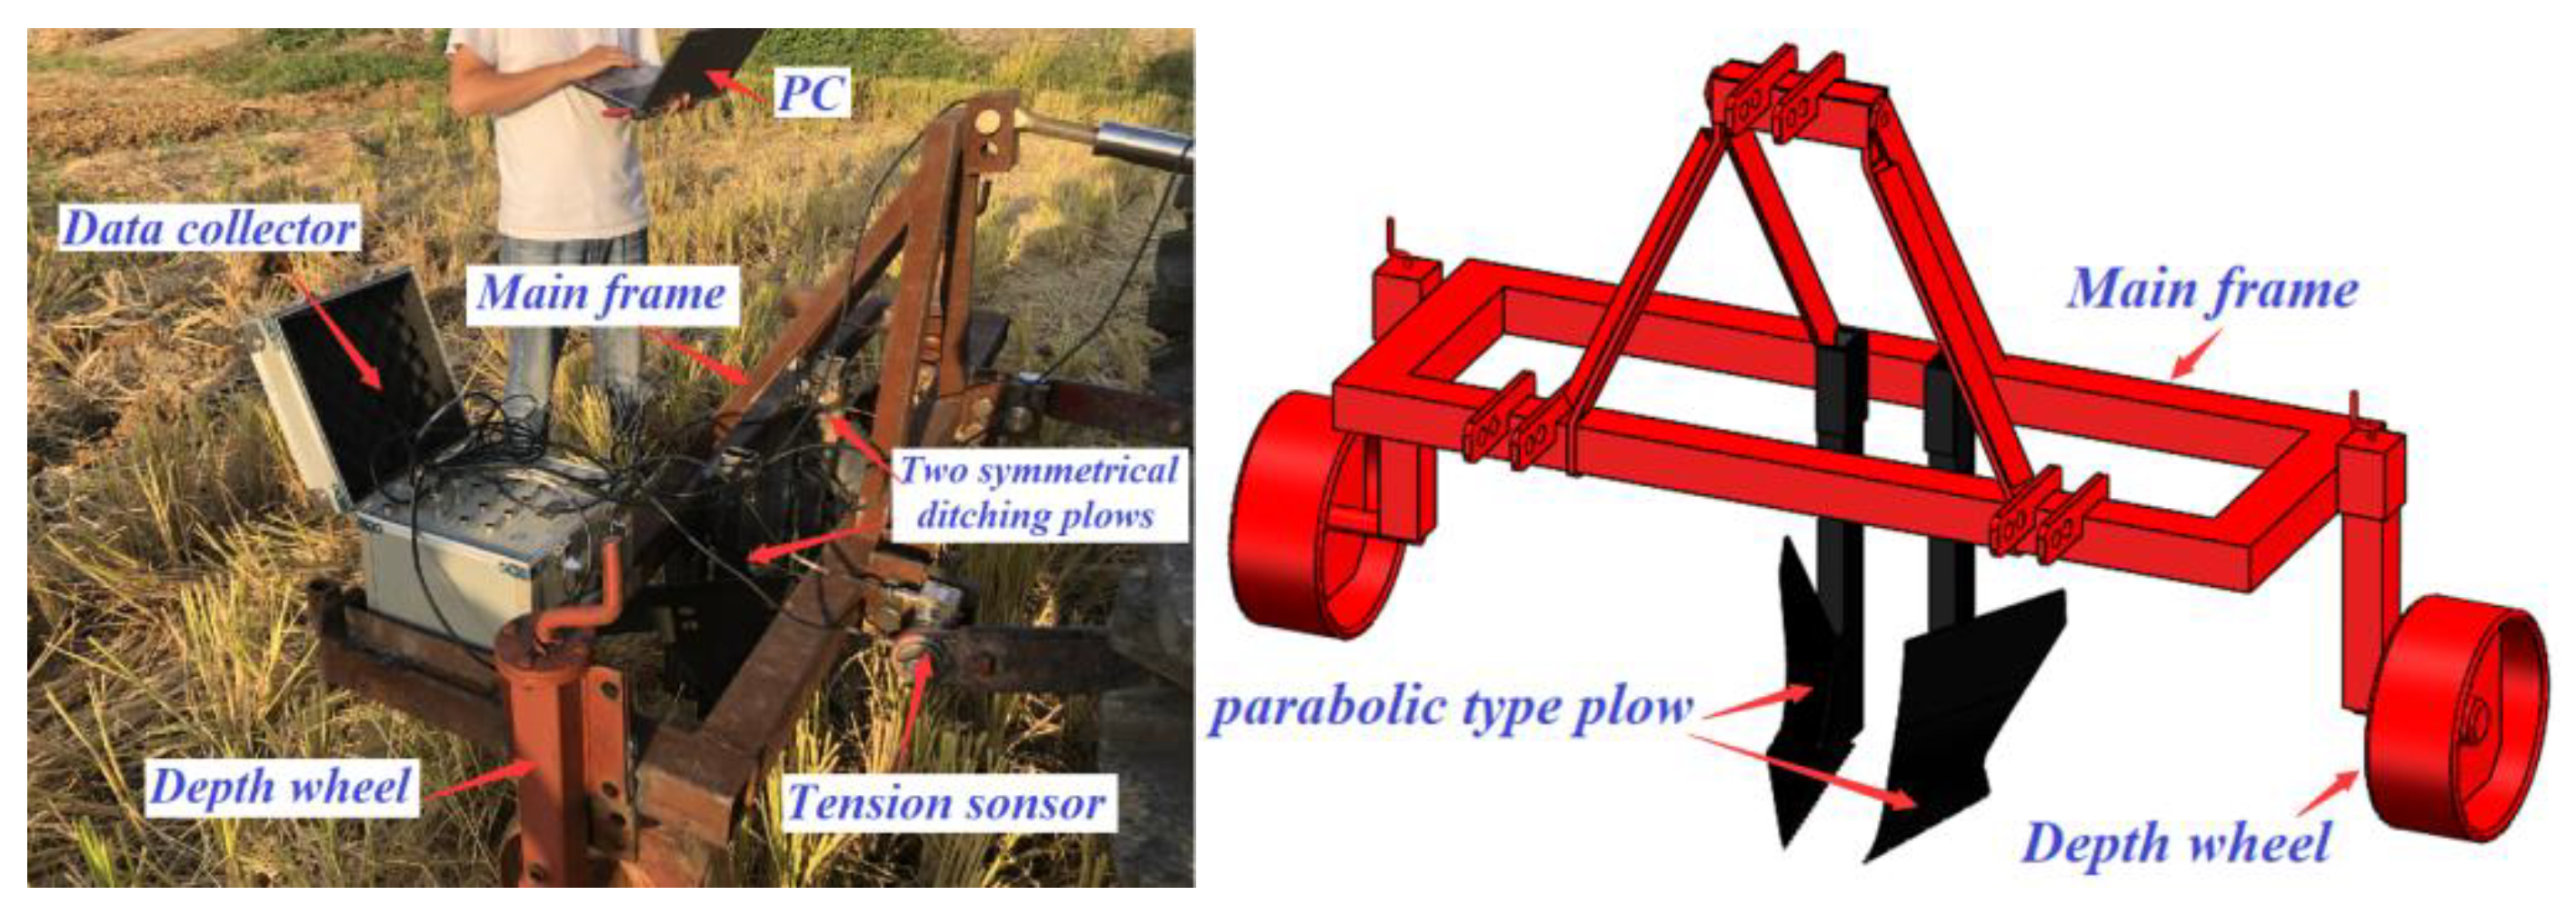
To verify the accuracy of simulation model, the resistance characteristics of soil was investigated by resistance detection device, as shown in
Figure 4. To ensure stress stability of the device, two symmetrical parabolic type ditching plows were detected. The structure parameters of parabolic type ditching plows were as follows:
Δθ=10°,
θmin=40°,
w=170mm,
h=300mm,
l=150mm. The tillage depth of plows could be adjusted by depth wheel, which were set as 200mm. According to repeatedly adjusted the speed of tractor, the forward velocity of tractor were set as five levels (0.4m/s, 0.6m/s, 0.8m/s, 1.0m/s, 1.2m/s). The drag resistance of plows were detected by Bk-5 tension-pressure sensor system (Beijing AVIC scientific instrument measurement and Control Technology Co., Ltd.). The test at each level was repeated 3 times, and the average value was taken as result.
The ditching-rotary tiller was regarded as test instrument to observe the effect of optimized ditching furrow system. The structure parameters of four ditching plows were the same as the result of optimizing simulation. The forward velocity of tractor were set as 0.8m/s. According to repeatedly adjusted the hitch position of tractor, the ditching depth of plows were set as 200mm.
3. Results and Discussion
3.1. Verification Results of Simulation Model
The average drag resistance of two symmetrical parabolic type ditching plows were simulated by EDEM and detected by resistance detection device respectively. The results of simulation and actual detected were shown in
Table 4. The errors of drag resistance at each level both were within 5%. It meat the soil simulation model established by EDEM could represent the actual physical properties of soil in rice-rape rotation field.
3.2. Optimal Type of Guide Curve
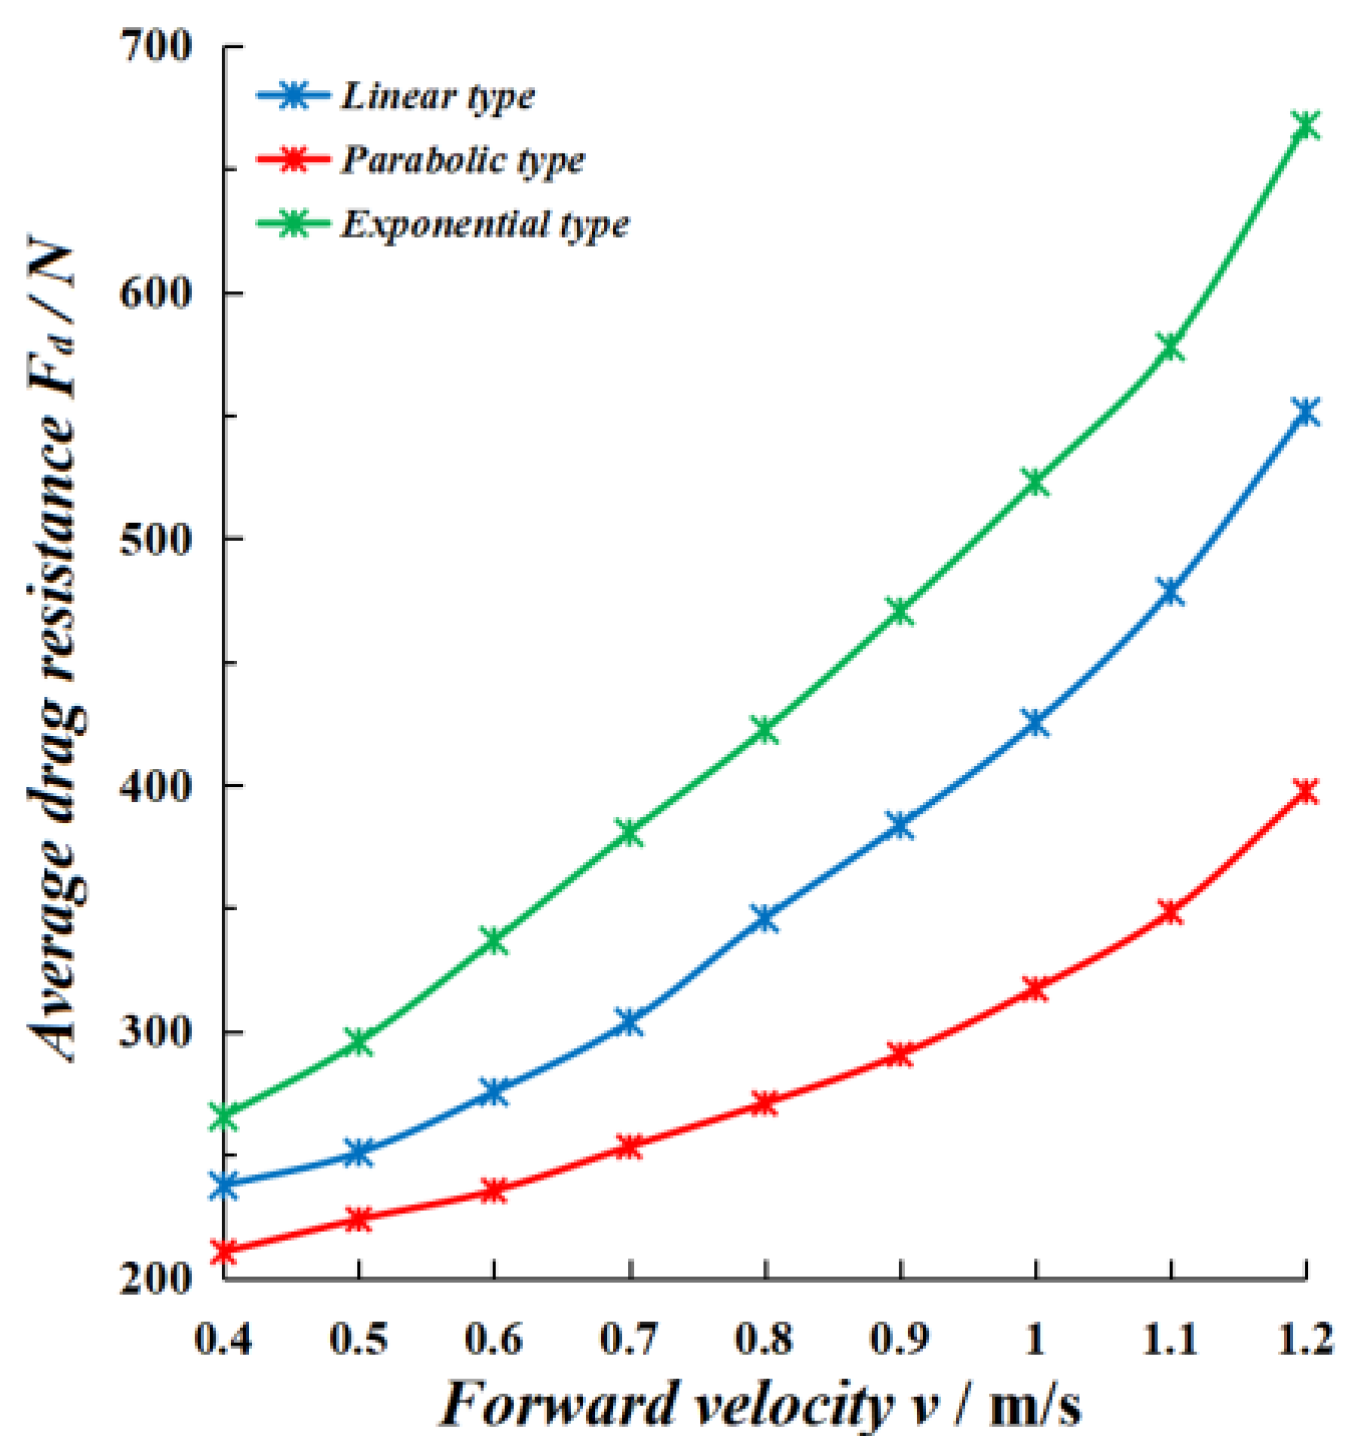
The result of resistance-velocity simulation test was shown in
Figure 5. Drag resistance of three ditching plows were both increased with the increase of velocity. Among them, the average drag resistance (
Fd) was: exponential type (265.4N ~ 667.6N)> linear type (237.4N ~ 551.3N) > parabolic type (210.5N ~ 397.3N). The
Fd value of parabolic type was 12.1% ~ 38.8% and 24.3% ~ 40.5% lesser than that of exponential type and linear type. When the simulation velocity was ranged from 0.4m/s to 1.2m/s, the growth rate of
Fd value was: exponential type > linear type > parabolic type. In general, it could be concluded that the ditching plow with parabolic type guide curve had better drag-reduce characteristics than other types ditching plows.
3.3. Relationship between Fundamental Quantity and Drag Resistance Characteristics
3.3.1. Calculation Results of Fundamental Quantity
The calculation results of fundamental quantity were shown in
Table 5. For three type plows, the fundamental quantity
F and
N were the same, but other fundamental quantities were different. It indicated the differential geometric properties of ditching plow were determined by
E,
G,
L,
M.
3.3.2. Results of Differential Geometry Analysis
The fundamental quantity
E,
G,
L and
M of different type plows were shown in
Figure 6,
Figure 7,
Figure 8 and
Figure 9. Variable constant
τ could represent fundamental quantity value of plow surface in different positions. For each type plows, fundamental quantity
E,
G,
L and
M had the same variation trend when
τ=0~1.
Figure 6 shown that
E value of each plows were monotone decreased with the increase of
κ. When variable parameter
κ= 0°~10°, the decay rate of
E was: exponential type > linear type > parabolic type. Decay rate of
E and growth rate of
Fd value had the same order regularity. It could be concluded that decay rate of
E could represent the variable regularity of average drag resistance (
Fd) along with velocity growth. The lower decay rate of
E, the better drag-reduce characteristics.
Figure 7 shown that
G value of each type plows were monotone increased with the increase of
κ. When variable parameter
κ= 0°~5°, the growth rate of
G was: exponential type > linear type > parabolic type. Growth rate of
G and growth rate of
Fd had the same order regularity. It could be concluded that growth rate of
G could represent the variable regularity of average drag resistance (
Fd) along with velocity growth. The lower growth rate of
G, the better drag-reduce characteristics.
Figure 8 indicated the value of
L was: exponential type > linear type > parabolic type, which was consistent with the order of average drag resistance (
Fd) for different type ditching plows. It could be concluded that
L could represent the magnitude of drag resistance. The smaller
L value, the better drag-reduce characteristics. It was notable that function
M of three types plows nearly coincide, which meant
M had no significant correlation with drag resistance.
3.4. Structure Optimization of Ditching Plow
3.4.1. Design and Result of Parameter Optimizing Simulation
Quadratic rotation orthogonal combination design was used to find the minimum drag resistance parameters. Experimental data including the design matrix and responses were shown in
Table 6. The independent variables used in the design were
Δθ =
θmax-
θmin,
θmin,
h and
l. Average drag resistance (
Fd) was the response. A quadratic regression fit analysis of drag resistance was performed in Design Expert 10.0.4 software to obtain the multiple quadratic regression equation:
Table 7 provides the analysis of variance (ANOVA). Four independent variables (
Δθ,
θmin,
h and
l) have significant effect on average drag resistance (
Fd). The R-squared (R
2) was 0.9969, indicating the high correlation between predicted data and experimental data. The obtained Adj R-squared 0.9912 shown a 99% correlation between selected independent variables on the variation of average drag resistance (
Fd). The coefficient of variation (CV) was 0.62%, indicating an acceptable degree of precision between actual and predicted experimental values. The significance analysis of various factors in
Table 7 was performed by F-test, and detailed results were referred to the “Prob>F” value. It is noticeable that the lower bound value of F-test was lesser than 0.05, indicating high significance of the model.
3.4.2. Analysis Results of Optimal Structure Parameters
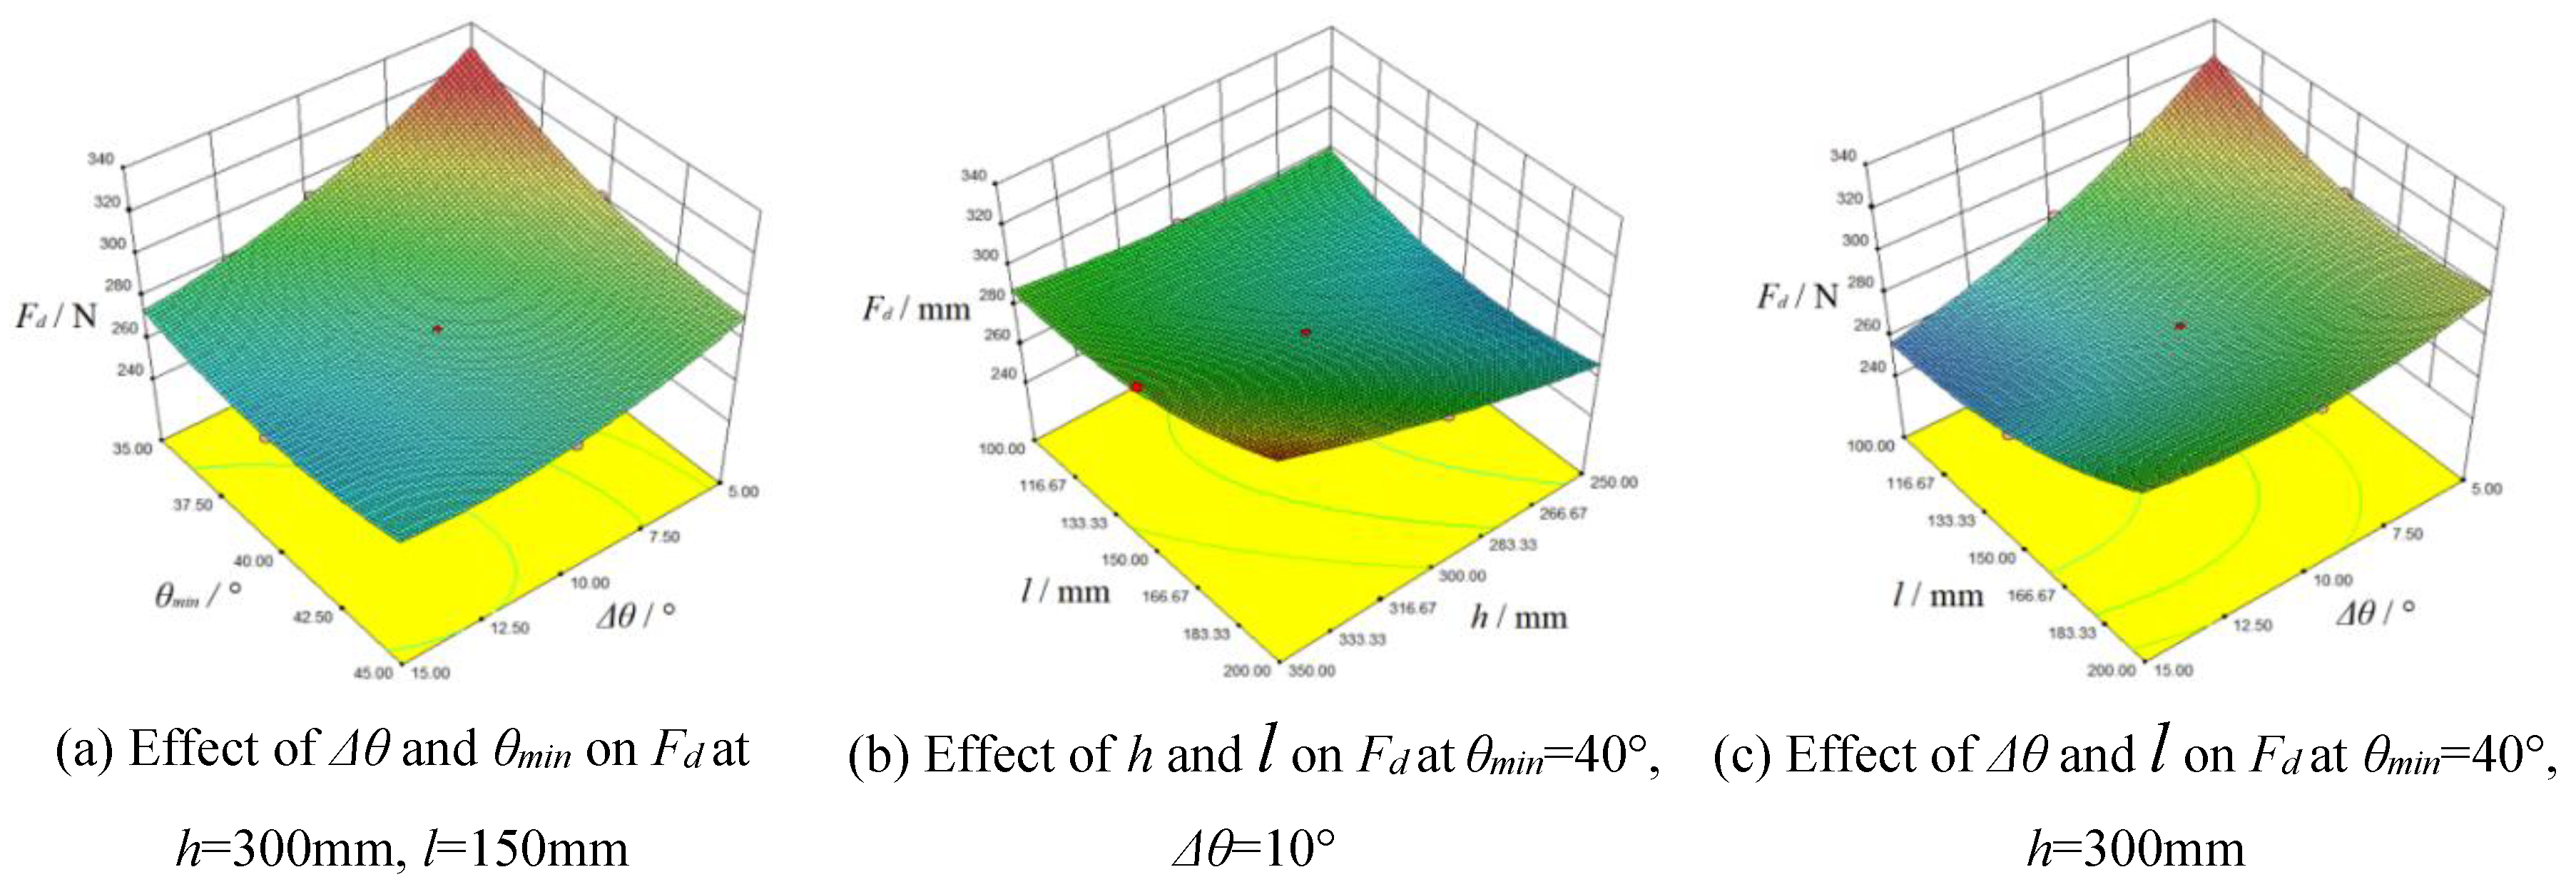
Response surface plots were made according to the regression Equation (6), as shown in
Figure 10.
Figure 10a shown
Fd decreased with the increase of
Δθ or
θmin when other factors were at 0 level. The growth of
Δθ and
θmin had contributed in turning over soil to prevent it blocking plow, which could reduce the drag resistance of plow.
Figure 10b shown
Fd increased with the increase of
h or
l when other factors were at 0 level. The stress area of plow surface was enlarged due to the growth of
h and
l, which would enhance drag resistance. In summary,
Δθ and
θmin had negative effect on drag resistance, but
h and
l were positively correlated with drag resistance.
Figure 10c indicated the negative effect of
Δθ on
Fd was greater than positive effect of
l.
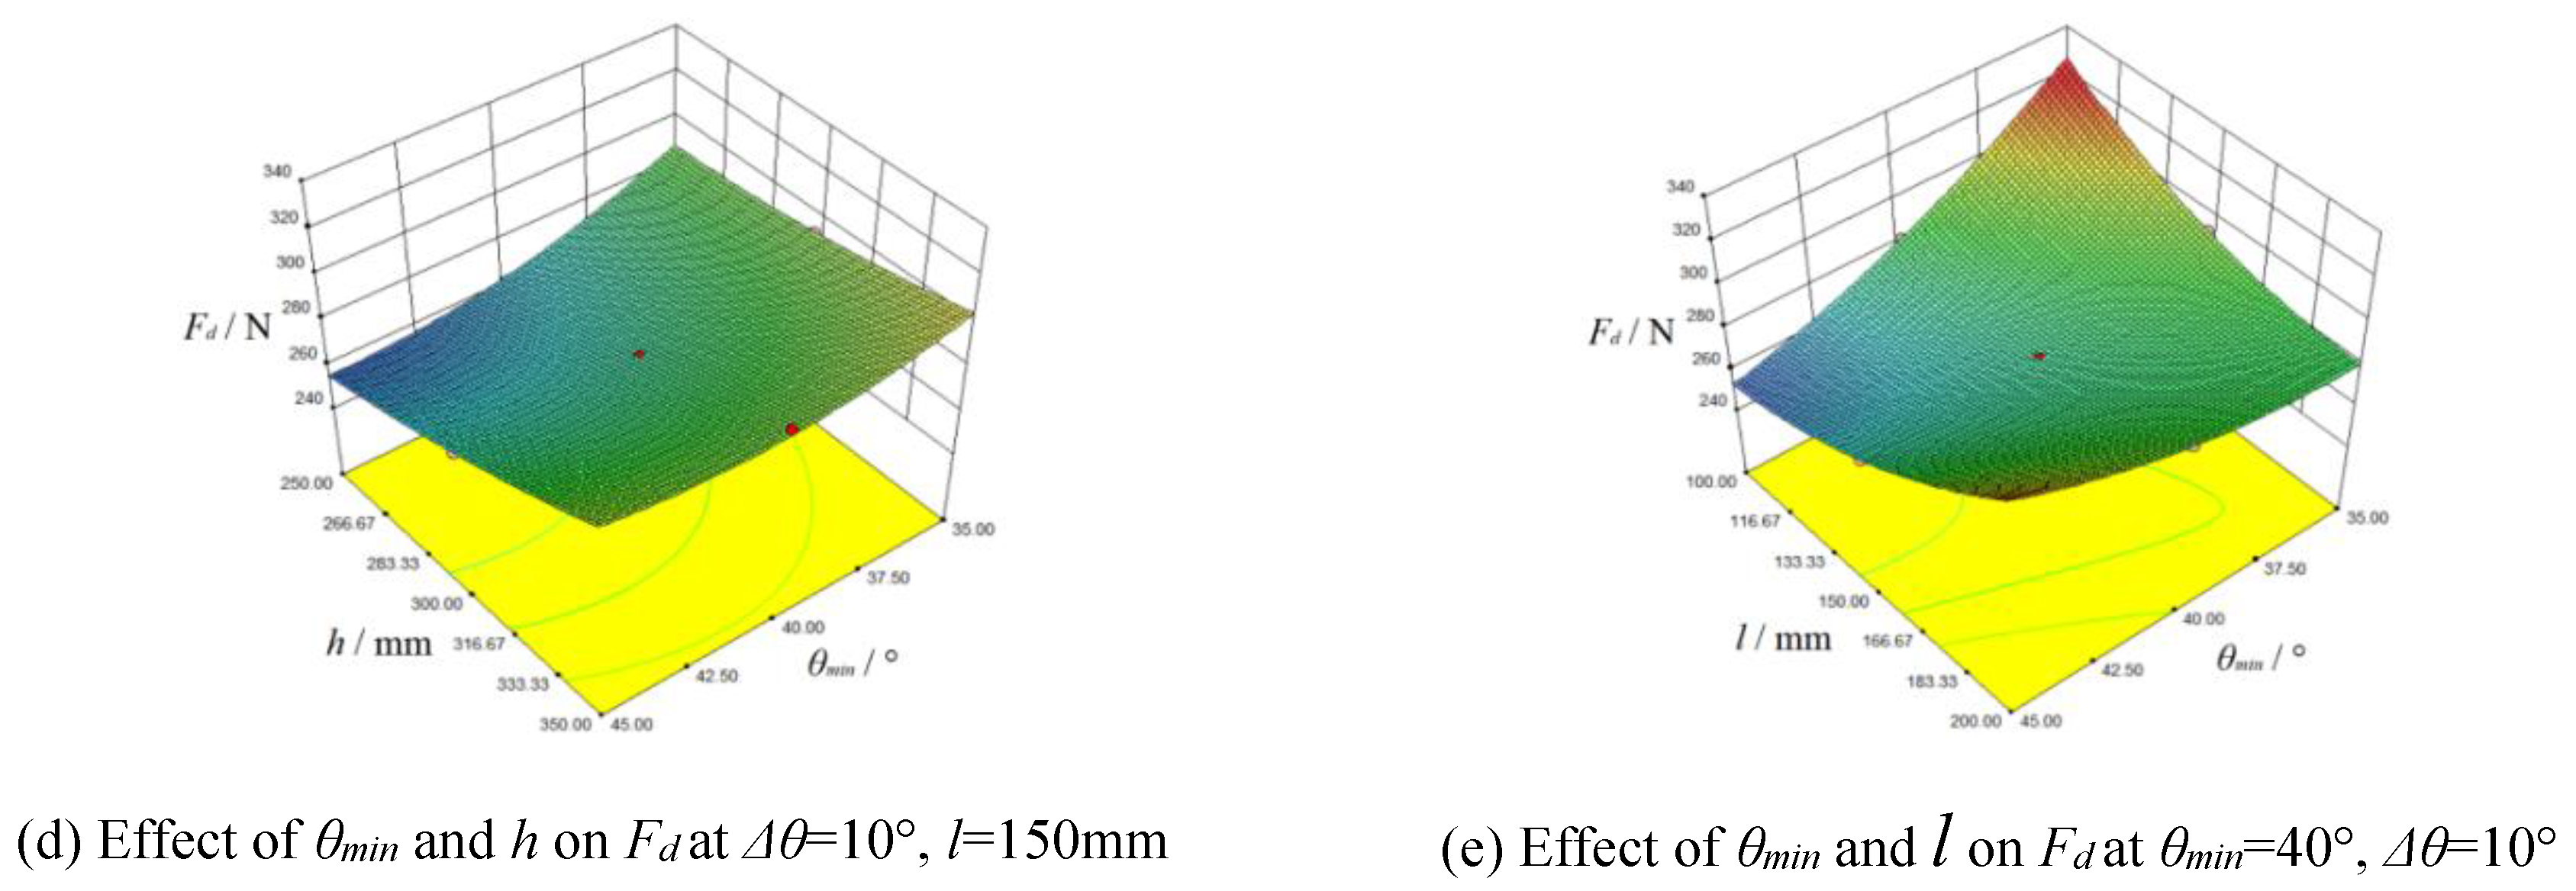
Figure 10e indicated the negative effect of
θmin was greater than positive effect of
l when
l was at lower level. But when
l was at higher level, negative effect of
θmin was lesser than positive effect of
l. It could be concluded the negative effect of
Δθ on
Fd was greater than negative effect of
θmin. Similarly,
Figure 10d,e indicated the positive effect of
h on
Fd was greater than positive effect of
l.
The minimum value of
Fd could be obtained by Equation (7):
The optimal structural parameter values were obtained by solving Equation (7), which resulted in: Δθ=15°, θmin=45°, h=250mm, l=100mm. The minimum average drag resistance was 230.1N.
3.5. Differential Geometric Properties of Optimal Plow
Response surface could obtain minimum
Fd value, but couldn’t investigate its variable regularity with the increase of velocity. According to the analysis of differential geometric properties for ditching plow surface, smaller
L value and lower variation rate of
E or
G was benefited to reduce drag resistance. |d
E/d
κ| and |d
G/d
κ| could represent variation rate of
E and
G. For parabolic type ditching plow, fundamental quantity
L, |d
E/d
κ|, |d
G/d
κ| could be expressed as:
Equation (8) shown that
l had positive effect on
L value.
Figure 11 shown the effect of
Δθ,
θmin and
h on
L value when other independent variables were at 0 level. When
τ was ranged from 0 to 1,
Δθ and
θmin had negative effect on
L value, but
h had positive effect on
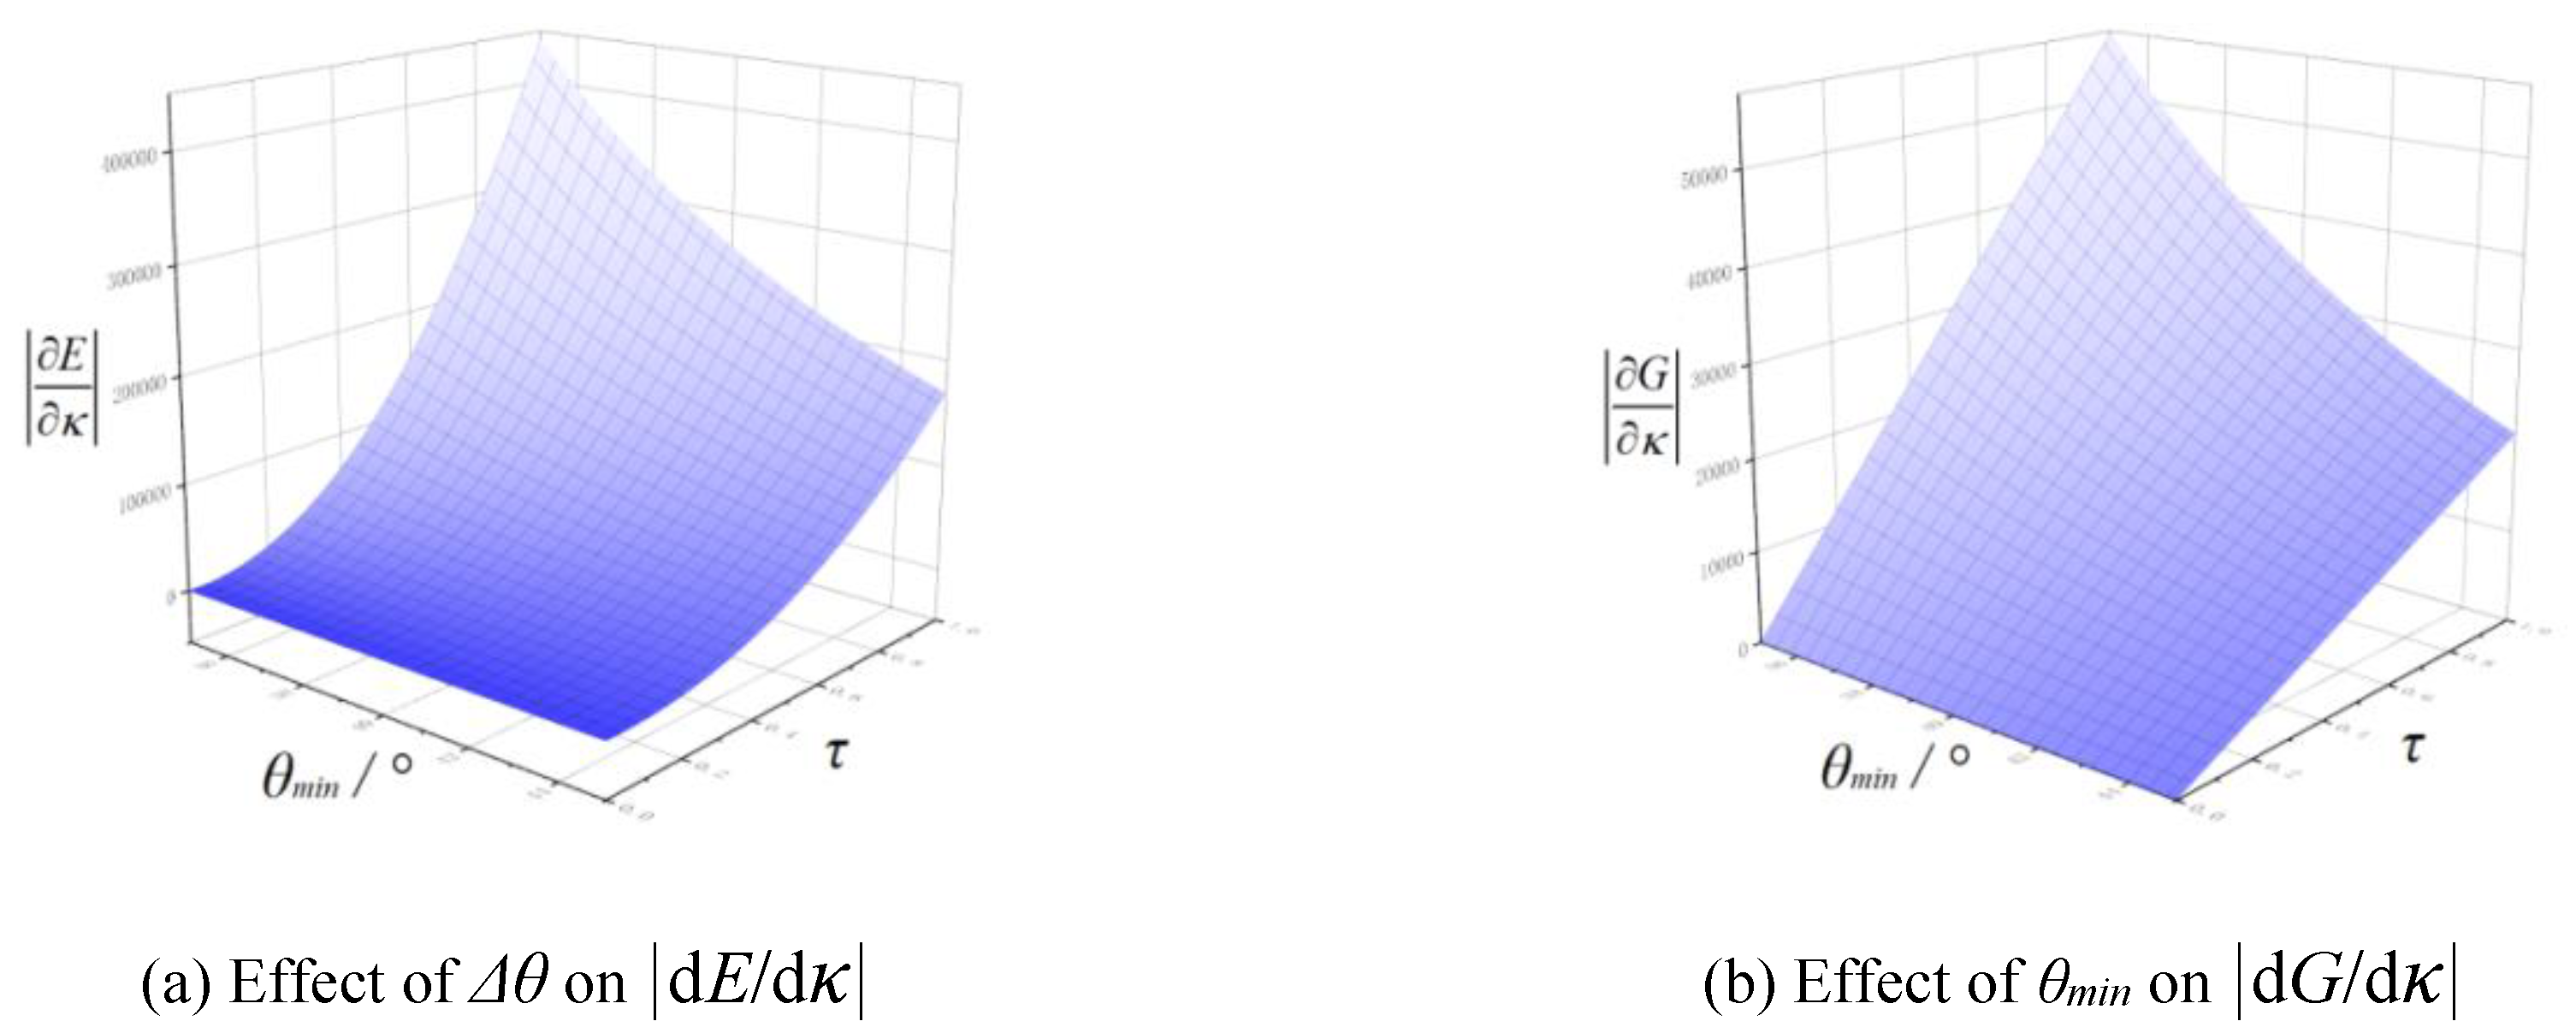
L value. Equation (9) and Equation (10) indicated
l had positive effect on |d
E/d
κ| and |d
G/d
κ|,
Δθ had negative effect on |d
E/d
κ| and |dG/dκ|.
Figure 12 shown
θmin had negative effect on |d
E/d
κ| and |d
G/d
κ|. In summary, Fundamental quantity
L was obtained minimum value when
Δθ=15°,
θmin=45°,
h=250mm,
l=100mm. It was consistent with the optimal structural parameter values obtained by quadratic rotation orthogonal combination design. The |d
E/d
κ| and |d
G/d
κ| of optimal plow also could obtain minimum value, indicating its growth rate of drag resistance was the lowest within the experimental level.
3.6. Operation Effect of Optimized Ditching Furrow System
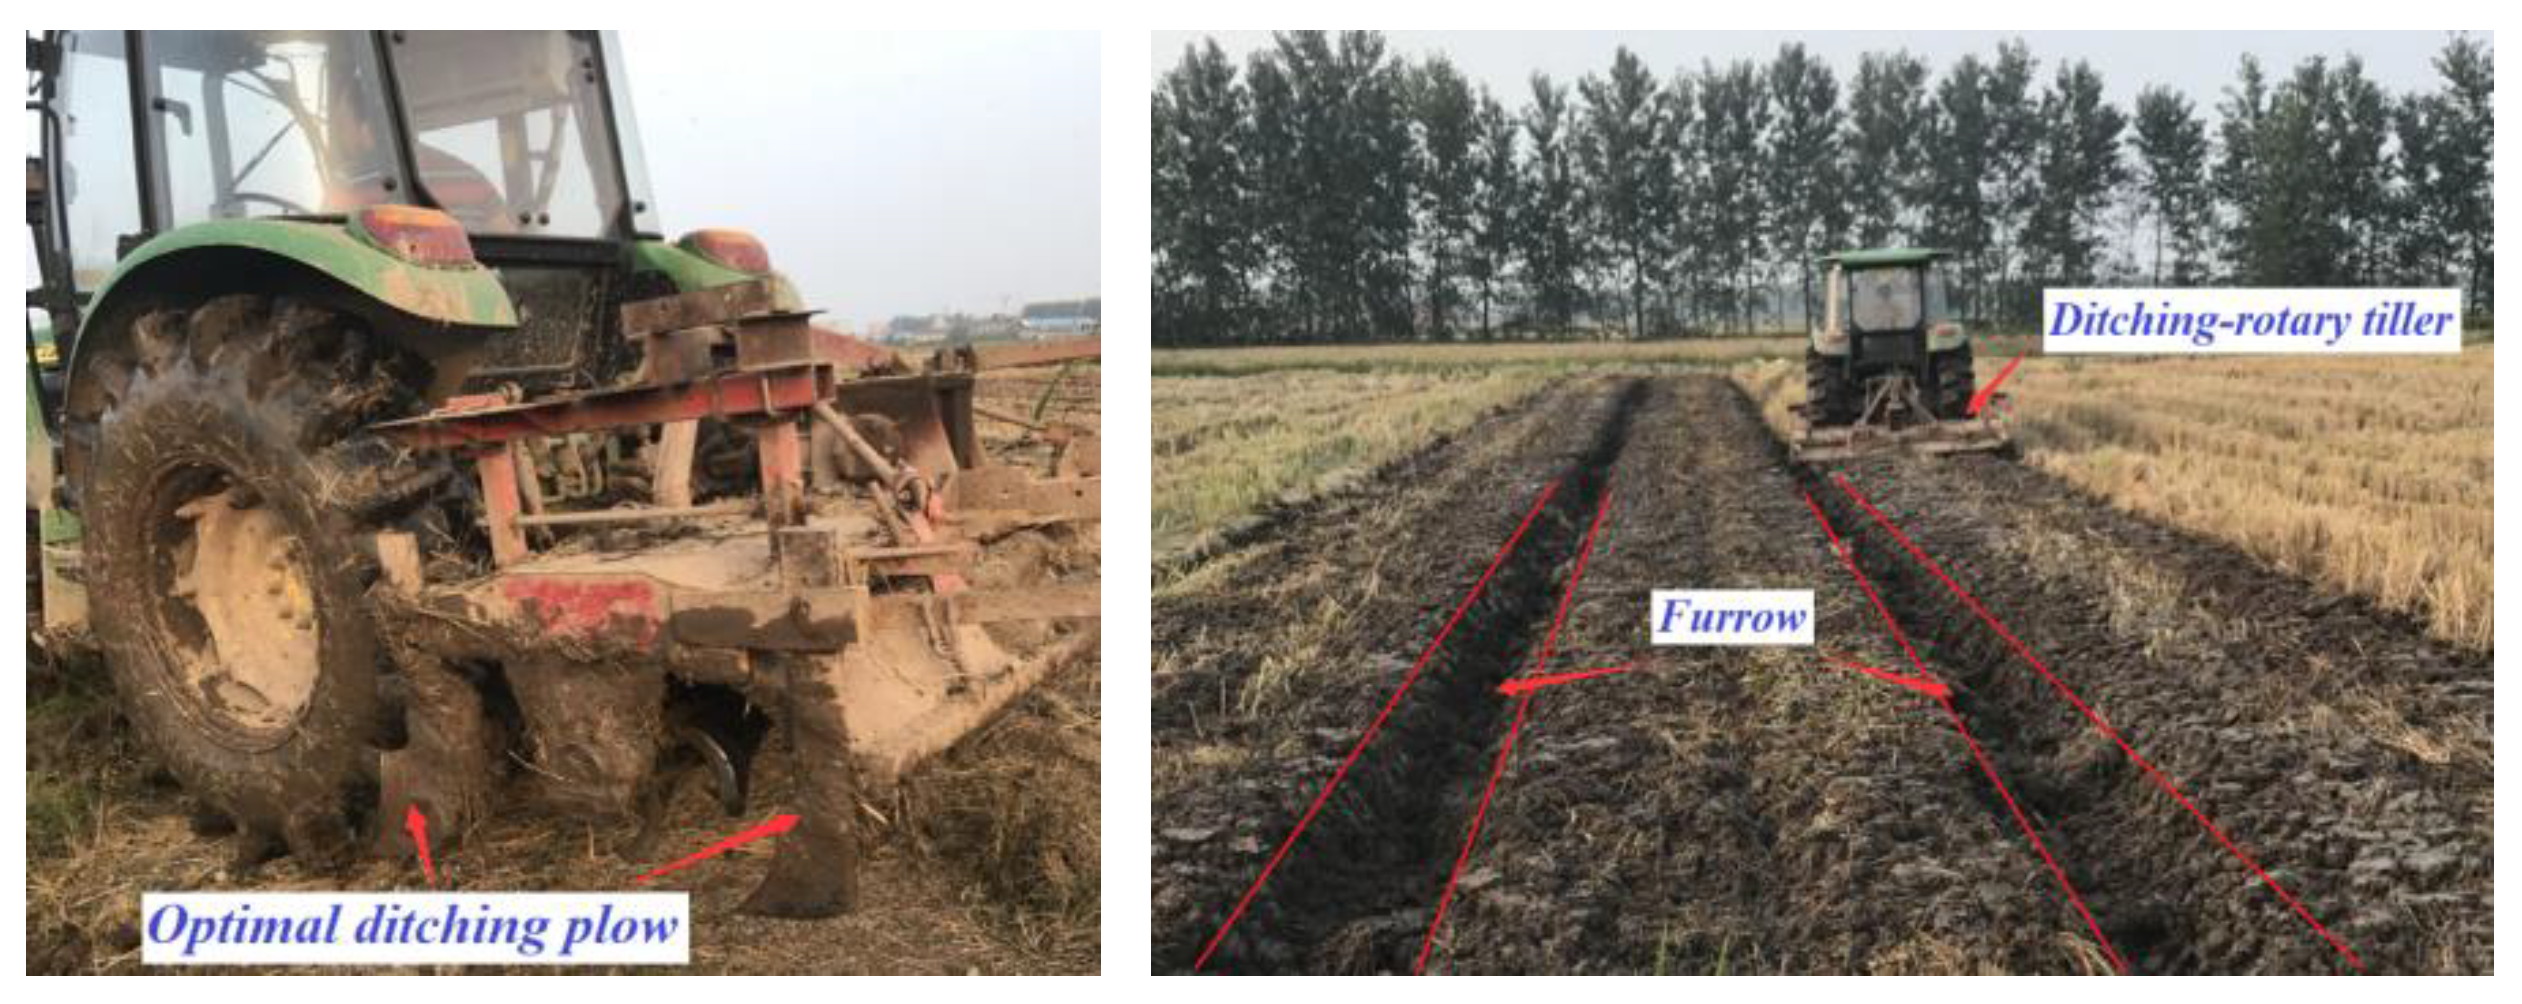
The operation effect of optimized ditching furrow system was shown in
Figure 13. The machine had well trafficability during operation, and the furrows between adjacent seedbeds could be clearly observed. The average width of furrow was 316.8mm, and coefficient of variation was 3.8%. The average depth of furrow was 192.4mm, and coefficient of variation was 2.6%. It indicated the operation effect of optimized ditching furrow system could met the requirements of rapeseed sowing.
4. Conclusions
In this study, the ditching furrow system of ditching-rotary tiller was optimized based on differential geometry analysis and EDEM simulation. The conclusions were as follows:
(a) Resistance-velocity Simulation indicated drag resistance of each plows (linear type, parabolic type, exponential type) were increased with the increase of velocity. The plow with parabolic type guide curve had better reduce-drag characteristics than other type plows.
(b) Differential geometry analysis indicated the geometric properties of ditching plow were determine by fundamental quantity E, G, L. decay rate of E and growth rate of G could represent the variable regularity of drag resistance with the increase of velocity. The L value could represent the magnitude of drag resistance. M had no significant correlation with drag resistance. The smaller L value, decay rate of E and growth rate of G, the better drag-reduce characteristics.
(c) Quadratic rotation orthogonal combination design shown Δθ and θmin had negative effect on drag resistance, but h and l were positively correlated with drag resistance. The optimal structural parameter values were: Δθ=15°, θmin=45°, h=250mm, l=100mm. The minimum average drag resistance was 230.1N. The analysis of the differential properties for optimal plow indicated L, |dE/dκ| and |dG/dκ| could obtain minimum value. The growth rate of drag resistance for optimal plow was the lowest within the experimental level.
(d) The field experiment shown the depth and width of furrow were 316.8mm and 192.4mm, and coefficient of variation were both with in 5%. The operation effect of optimized ditching furrow system could met the requirements of rapeseed sowing.
Differential geometry analysis and EDEM simulation would be helpful in design the plow. The analysis method used in this paper provided in-depth theoretical guidance for reduce-drag design of plow.
Author Contributions
X.L.: investigation, conceptualization and writing-original draft. G.L.: validation and software. Y.J.: Experimental. L.Y.:data curation. Y.Z.: writing—review and editing. All authors have read and agreed to the published version of the manuscript.
Funding
Youth Project of Natural Science Foundation of Hubei Province (No. 2020CFB436).
Institutional Review Board Statement
Not applicable.
Data Availability Statement
The datasets generated and analyzed during the current study are available from the corresponding author on reasonable request.
Acknowledgments
Thanks for the support of Hubei Cereals and Oils Machinery Engineering Technology Research Center in Wuhan Polytechnic University.
Conflicts of Interest
The authors declare no conflict of interest.
References
- Krzysztof Orzech, Maria Wanic, Dariusz Załuski. The Effects of Soil Compaction and Different Tillage Systems on the Bulk Density and Moisture Content of Soil and the Yields of Winter Oilseed Rape and Cereals. Agriculture 2021, 11, 666. [Google Scholar] [CrossRef]
- Liao,Q. X; Lei,X.L; Liao,Y.T; Ding,Y.C; Zhang,Q.S; Wang,L. Research Progress of Precision Seeding for Rapeseed. Trans. Chin. Soc. Agric. Mach. 2017, 48, 1–16. [Google Scholar]
- Kuai,J; L,X. Y; Xie,Y; Li,Z; Wang,B; Zhou,G.S.Leaf Characteristics at Recovery Stage Affect Seed Oil and Protein Content Under the Interactive Effects of Nitrogen and Waterlogging in Rapeseed. Agriculture 2020, 10, 207. [Google Scholar] [CrossRef]
- Boem, F.H.G.; Lavado, R.S.; Porcelli, C.A. Note on the effects of winter and spring waterlogging on growth, chemical composition and yield of rapeseed. Field Crops Res. 1996, 47, 175–179. [Google Scholar] [CrossRef]
- Zhou, W.J.; Lin, X.Q. Effects of waterlogging at different growth stages on physiological characteristics and seed yield of winter rape (Brassica napus L). Field Crops Res. 1995, 44, 103–110. [Google Scholar] [CrossRef]
- Zhang Qingsong, JiWen feng, Liao Yitao, Liao Qingxi. Surface Analysis and Resistance Characteristics Experiment on Ditch Plow Ahead of Direct Rapeseed Seeder. Trans. Chin. Soc. Agric. Mach. 2014, 45, 130–135. [Google Scholar]
- Qin,K; Ding,W. M; Fang,Z.C; Du,T.T; Zhao,S.Q; Wang,Z. Design and experiment of plowing and rotary tillage combined machine. Trans. CSAE 2016, 32, 7–16. [Google Scholar]
- Qin,K; Ding,W. M; Fang,Z.C; Du,T.T; Zhao,S.Q; Wang,Z. Analysis and experiment of tillage depth and width stability for plowing and rotary tillage combined machine. Trans. CSAE 2016, 32, 1–8. [Google Scholar]
- Bao,P.F; Wu Mingliang; Guan Chunyun; Luo Haifeng; He Yiming; Xiang Wei. Design of plow-rotary style ditching and ridging device for rapeseed seeding. Trans. CSAE 2017, 33, 23–31.
- Liu,X. P; Xiao,W.L; MA,L; Liu,L.C; Wan,G.W; Liao,Q.X. Design and Ditching Quality Experiment on Combined Ship Type Opener of Direct Rapeseed Seeder. Trans. Chin. Soc. Agric. Mach. 2017, 48, 79–87. [Google Scholar]
- Wei,G. L; Zhang,Q.S; Liu,L.C; Xiao,W.L; Sun,W.C; Liao,Q.X. Design and Experiment of Plowing and Rotary Tillage Buckle Device for Rapeseed Direct Seeder. Trans. Chin. Soc. Agric. Mach. 2020, 51, 38–46. [Google Scholar]
- Zhou,H; Zhang,C. L; Zhang,W.L; et al. Evaluation of straw spatial distribution after straw incorporation into soil for different tillage tools. Soil Tillage Res. 2020, 196, 104440. [Google Scholar] [CrossRef]
- Liu,X. P, Zhang,Q.S; Xiao,W.L; Ma,L; Liu,L.C; Liao,Q.X. Design and Experiment on Symmetrical Driven Disc Plows Combined Tillage Machine for Rice-Rapeseed Rotation Area. Trans. Chin. Soc. Agric. Mach. 2017, 48, 33–41. [Google Scholar]
- Li,C. F; Yue,L.X; Kou,Z.K; Zhang,Z.S; Wang,J.P; Cao,C.G. Short-term effects of conservation management practices on soil labile organic carbon fractions under a rape-rice rotation in central China. Soil Tillage Res. 2012, 116, 31–37. [Google Scholar]
- Li,J. F; Gan,G.Y; Chen,X; Zou,J.L. Effects of Long-Term Straw Management and Potassium Fertilization on Crop Yield, Soil Properties, and Microbial Community in a Rice-Oilseed Rape Rotation. Agriculture 2021, 11, 1233. [Google Scholar] [CrossRef]
- Zhang,Q. S; Xiao,W.L; Liao,Q.X; et al. Designing a deep-shallow rotary tillage device of direct rapeseed seeder. J. Huazhong Agric. Univ. 2016, 35, 121–128. [Google Scholar]
- A P. Tarverdyan, Sh. M. Grigoryan, A M. Esoyan. Investigation of the regularity of movement of furrow slice at tillage with a plough with ripping moldboard. Annals of Agrarian Science 2018, 16.
- JIA,H. L; Meng,F.H; Liu,L.J; Shi,S; Zhao,J.L; Zhuang,J. Biomimetic Design and Experiment of Core-share Furrow Opener. Trans. Chin. Soc. Agric. Mach. 2020, 51, 44–49,77. [Google Scholar]
- Volodymyr Bulgakov, Simone Pascuzzi, Valerii Adamchuk, Semjons Ivanovs, Serhiy Pylypakaa. A theoretical study of the limit path of the movement of a layer of soil along the plough mouldboard. Soil Tillage Res. 2019, 195, 104406. [Google Scholar] [CrossRef]
- Zhai,L. X; Ji,C.Y; Ding,Q.H; Yu,Y.M. Optimized Design of Plough Body Structural and Working Parameters. Trans. Chin. Soc. Agric. Mach. 2013, 44, 57–62. [Google Scholar]
- Zhai,L. X; Ji,C.Y; Ding,Q.H; Yu,Y.M. Arrayed Sensors Measurement for Load Distribution of Plow. Trans. Chin. Soc. Agric. Mach. 2011, 42, 50–53. [Google Scholar]
- Irshad Ali Mari; Changying Ji; Farman Ali Chandio; et al. Spatial distribution of soil forces on moldboard plough and draft requirement operated in silty-clay paddy field soil. J. Terramechanics 2015, 60.
- Zhang,Q. S; Liao,Q.X; Ji,W.F; Liu,H.B; Zhou,Y; Xiao,W.L. Surface Optimization and Experiment on Ditch Plow of Direct Rapeseed Seeder. Trans. Chin. Soc. Agric. Mach. 2015, 46, 53–59. [Google Scholar]
- Jianfeng Suna; Huaming Chena; Zaiman Wangb; Zhiwu Oua; Zhou Yanga; Zhu liuc; Jieli Duand. Study on plowing performance of EDEM low-resistance animal bionic device based on red soil. Soil Tillage Res. 2020, 196, 104336. [Google Scholar] [CrossRef]
- Zhang,Q.S; Shrini K. Upadhyaya; Liao,Q.X; Li.X. Determination of in-situ engineering properties of soil using an inverse solution technique and limited field tests. J. Terramechanics. 2018, 69–77.
- Ding,Q. H; Ren,J; Belal,E.A; Zhao,J.K; Ge,S.Y; Li,Y. DEM Analysis of Subsoiling Process in Wet Clayey Paddy Soil. Trans. Chin. Soc. Agric. Mach. 2017, 48, 38–48. [Google Scholar]
- Zhu,Y. H; Xia,J.F; Zeng,R; Zheng,K; Du,J.N, Liu,Z.Y. Prediction Model of Rotary Tillage Power Consumption in Paddy Stubble Field Based on Discrete Element Method. Trans. Chin. Soc. Agric. Mach. 2020, 51, 42–50. [Google Scholar]
- Guo,Z. J; Du,G; Zhou,Z.Li; Zhang,P; Li,Y.X. Actuality Analysis of Resistance-reducing Properties on Soil Cultivating Components with Different Macroscopic Soil-engaging Surfaces. Trans. Chin. Soc. Agric. Mach. 2011, 42, 47–52. [Google Scholar]
- Guo,Z. J; Du,G; Zhou,Z.Li; Li,X.P. Orthogonal Experiment on Resistance Reduction by Soil engaging Surfaces of Bulldozer Blade[J]. Trans. Chin. Soc. Agric. Mach. 2015, 46, 372–378. [Google Scholar]
- Chinese Academy of Agricultural Mechanization Sciences. Agricultural machinery design manual; China Agricultural Science and Technology Press: Beijing, 2007. [Google Scholar]
- Chen, W.H. Differential geometry. Peking University Press, 2017. [Google Scholar]
Figure 1.
Structure of ditching furrow system for ditching-rotary tiller.
Figure 1.
Structure of ditching furrow system for ditching-rotary tiller.
Figure 2.
Actual soil conditions and Simulation model.
Figure 2.
Actual soil conditions and Simulation model.
Figure 3.
Structure of ditching plow with different type curves
Figure 3.
Structure of ditching plow with different type curves
Figure 4.
Resistance detection device
Figure 4.
Resistance detection device
Figure 5.
Effect of velocity on drag resistance for ditching plow with different guide curve
Figure 5.
Effect of velocity on drag resistance for ditching plow with different guide curve
Figure 6.
Fundamental quantity E of ditching plow surface.
Figure 6.
Fundamental quantity E of ditching plow surface.
Figure 7.
Fundamental quantity G of ditching plow surface.
Figure 7.
Fundamental quantity G of ditching plow surface.
Figure 8.
Fundamental quantity L of ditching plow surface.
Figure 8.
Fundamental quantity L of ditching plow surface.
Figure 9.
Fundamental quantity M of ditching plow surface.
Figure 9.
Fundamental quantity M of ditching plow surface.
Figure 10.
Response surface plots
Figure 10.
Response surface plots
Figure 11.
Effect of Δθ, θmin and h on fundamental quantity L
Figure 11.
Effect of Δθ, θmin and h on fundamental quantity L
Figure 12.
Effect of Δθ, θmin and h on variation rate of E and G.
Figure 12.
Effect of Δθ, θmin and h on variation rate of E and G.
Figure 13.
Operation effect of optimized ditching furrow system.
Figure 13.
Operation effect of optimized ditching furrow system.
Table 1.
Expressions of functions in parametric equations.
Table 1.
Expressions of functions in parametric equations.
| Function |
Type of guide curve |
| Linear type |
Parabolic type |
Exponential type |
|
|
|
|
|
|
|
|
|
|
|
|
Table 2.
Mechanical and geometric parameters.
Table 2.
Mechanical and geometric parameters.
| Parameter |
Unit |
Value |
| Tillage layer soil |
Bottom layer soil |
Steel |
| Poisson’s rate |
— |
0.38 |
0.3 |
0.35 |
| Shear Modulus |
Pa |
6×10⁷ |
1×10⁸ |
7.9×10¹⁰ |
| Density |
kg/m3 |
1280 |
1500 |
7860 |
| Particle radius |
mm |
8 |
8 |
— |
| Restitution coefficient of soil-soil |
— |
0.6 |
0.6 |
— |
| Static friction coefficient of soil-soil |
— |
0.5 |
0.5 |
— |
| Rolling friction coefficient of soil-soil |
— |
0.6 |
0.24 |
— |
| Restitution coefficient of soil-steel |
— |
0.6 |
0.6 |
— |
| Static friction coefficient of soil-steel |
— |
0.6 |
0.6 |
— |
| Rolling friction coefficient of soil-steel |
— |
0.35 |
0.13 |
— |
| Normal stiffness per unit area |
N/m3 |
5×10⁷ |
5×10⁷ |
— |
| Shear stiffness per unit area |
N/m3 |
5×10⁷ |
5×10⁷ |
— |
| Critical normal stress |
Pa |
3×10⁵ |
5×10⁵ |
— |
| Critical shear stress |
Pa |
3×10⁵ |
5×10⁵ |
— |
| Bonded disk radius |
mm |
9.5 |
9.15 |
— |
Table 3.
Experimental factors and levels.
Table 3.
Experimental factors and levels.
| Independent Variables |
Unit |
Code Levels |
| -1.68 |
-1 |
0 |
1 |
1.68 |
| A (Δθ) |
° |
5 |
7 |
10 |
13 |
15 |
| B (θmin) |
° |
35 |
37 |
40 |
43 |
45 |
| C (h) |
mm |
250 |
270 |
300 |
330 |
350 |
| D (l) |
mm |
100 |
120 |
150 |
180 |
200 |
Table 4.
Average drag resistance of simulation and actual detected.
Table 4.
Average drag resistance of simulation and actual detected.
| Forward velocity / m/s |
Average drag resistance / N |
Error / % |
| Simulation |
Actual detected |
| 0.4 |
421 |
437.4 |
3.9 |
| 0.6 |
470.8 |
486.7 |
3.4 |
| 0.8 |
541.6 |
567.2 |
4.7 |
| 1.0 |
634.4 |
659.8 |
4.0 |
| 1.2 |
794.6 |
828.3 |
4.2 |
Table 5.
Fundamental quantity of plow surface with different guide curves.
Table 5.
Fundamental quantity of plow surface with different guide curves.
| Fundamental quantity |
Guide curve type |
| Linear |
Parabolic |
Exponential |
| E |
|
|
|
| F |
|
|
|
| G |
|
|
|
| L |
|
|
|
| M |
|
|
|
| N |
0 |
0 |
0 |
Table 6.
Quadratic rotation orthogonal combination design with coded values and results.
Table 6.
Quadratic rotation orthogonal combination design with coded values and results.
| Std |
A(Δθ) |
B(θmin) |
C(h) |
D(l) |
Fd(Average drag resistance / N)
|
| 1 |
1 |
1 |
1 |
-1 |
260.7 |
| 2 |
1 |
1 |
-1 |
-1 |
248.7 |
| 3 |
1 |
-1 |
1 |
1 |
284.3 |
| 4 |
-1 |
1 |
-1 |
1 |
280.7 |
| 5 |
1 |
-1 |
-1 |
1 |
266.8 |
| 6 |
-1 |
-1 |
1 |
-1 |
320.2 |
| 7 |
-1 |
1 |
1 |
1 |
307.9 |
| 8 |
-1 |
-1 |
-1 |
-1 |
316.6 |
| 9 |
-1.68 |
0 |
0 |
0 |
301.8 |
| 10 |
1.68 |
0 |
0 |
0 |
264.3 |
| 11 |
0 |
-1.68 |
0 |
0 |
292.6 |
| 12 |
0 |
1.68 |
0 |
0 |
272.5 |
| 13 |
0 |
0 |
-1.68 |
0 |
260.6 |
| 14 |
0 |
0 |
1.68 |
0 |
294.3 |
| 15 |
0 |
0 |
0 |
-1.68 |
281.2 |
| 16 |
0 |
0 |
0 |
1.68 |
288.8 |
| 17 |
0 |
0 |
0 |
0 |
274.4 |
| 18 |
0 |
0 |
0 |
0 |
274.4 |
| 19 |
0 |
0 |
0 |
0 |
274.4 |
| 20 |
0 |
0 |
0 |
0 |
274.4 |
| 21 |
0 |
0 |
0 |
0 |
274.4 |
Table 7.
Result of analysis for variance.
Table 7.
Result of analysis for variance.
| Source |
Sum of squares |
df |
Mean squares |
F value |
P-value Prob > F |
Remarks |
| Model |
6956.22 |
13 |
535.09 |
174.90 |
< 0.0001 |
Significant** |
| A |
703.13 |
1 |
703.13 |
229.82 |
< 0.0001 |
** |
| B |
202.01 |
1 |
202.01 |
66.03 |
< 0.0001 |
** |
| C |
1001.95 |
1 |
1001.95 |
327.49 |
< 0.0001 |
** |
| D |
28.88 |
1 |
28.88 |
9.44 |
0.0180 |
* |
| AB |
31.27 |
1 |
31.27 |
10.22 |
0.0151 |
* |
| AD |
91.74 |
1 |
91.74 |
29.99 |
0.0009 |
** |
| BC |
40.95 |
1 |
40.95 |
13.38 |
0.0081 |
** |
| BD |
296.78 |
1 |
296.78 |
97.00 |
< 0.0001 |
** |
| CD |
105.85 |
1 |
105.85 |
34.60 |
0.0006 |
** |
| A2 |
151.74 |
1 |
151.74 |
49.59 |
0.0002 |
** |
| B2 |
135.37 |
1 |
135.37 |
44.24 |
0.0003 |
** |
| C2 |
21.76 |
1 |
21.76 |
7.11 |
0.0322 |
* |
| D2 |
224.50 |
1 |
224.50 |
73.38 |
< 0.0001 |
** |
| Residual |
21.42 |
7 |
3.06 |
|
|
|
| Lack of fit |
21.42 |
3 |
7.14 |
|
|
|
| Pure error |
0.000 |
4 |
0.000 |
|
|
|
| Cor total |
6977.63 |
20 |
|
|
|
|
| R-squared |
0.9969 |
|
C.V. % |
0.62% |
|
|
| Pred R-squared |
0.9507 |
|
Adj R-squared |
0.9912 |
|
|
| Adeq Precisior |
51.504 |
|
|
|
|
|
|
Disclaimer/Publisher’s Note: The statements, opinions and data contained in all publications are solely those of the individual author(s) and contributor(s) and not of MDPI and/or the editor(s). MDPI and/or the editor(s) disclaim responsibility for any injury to people or property resulting from any ideas, methods, instructions or products referred to in the content. |
© 2023 by the authors. Licensee MDPI, Basel, Switzerland. This article is an open access article distributed under the terms and conditions of the Creative Commons Attribution (CC BY) license (http://creativecommons.org/licenses/by/4.0/).


