Preprint
Article

Seminal Oxidation–Reduction Potential Correlates with Not Only Seminal Oxidative But Also Nitrosative Stresses

Altmetrics

Downloads

96

Views

43

Comments

0

Submitted:

05 July 2023

Posted:

06 July 2023

You are already at the latest version

Alerts
Abstract
Reactive oxygen species and reactive nitrogen species in semen are both essential for fertilization process; however, they become harmful at excessive levels, causing oxidative stress and nitrosative stress, respectively. Recently, oxidation–reduction potential (ORP) has been used as a marker for measuring oxidative stress, and this study investigated the possibility of comprehensively evaluating nitrosative stress. The correlation between standardized ORP (sORP) and 8-hydroxy-2′-deoxyguanosine (8-OHdG) and NOx per unit sperm was tested. Based on the previously reported cutoff value, samples were classified into oxidative stress-positive and negative groups. Thereafter, a receiver operating characteristic curve was drawn on 8-OHdG and NOx, and each optimal cutoff value was determined. Both standardized 8-OHdG and NOx significantly correlated with sORP. Although both correlated significantly with sORP in the oxidative stress group, no correlation was found in the nonoxidative stress group. The optimal standardized 8-OHdG level to determine oxidative stress status was 0.52 ng/106 spermatozoa, and the standardized NOx was 0.17 µM/106 spermatozoa/mL. The ORP is a simpler and quicker assay that can comprehensively assess oxidative and nitrosative stresses. Optimal cutoff values for both stresses were established in this study.
Keywords: 
Subject: Medicine and Pharmacology  -   Urology and Nephrology

1. Introduction

Currently, approximately 1 in 5.5 couples are unable to have children after 1 year of regular and unprotected sexual intercourse, and male factors are involved in about half of these cases [1]. However, sperm are susceptible to lifestyle and environmental factors, and it is often difficult to provide a centralized explanation for the causes of male infertility. According to a 2015 survey of male infertility in Japan [2], 82.6% of male infertility causes are spermatogenesis dysfunction, and 42% of these are idiopathic, the most common cause. Although many studies have been reported to determine the cause of idiopathic male infertility, the majority of causes are still unknown. Among idiopathic spermatogenesis dysfunctions, oxidative stress (OS) is thought to be involved in approximately 80% of cases, and such conditions are called “male oxidative stress infertility (MOSI),” a concept that has recently been proposed [3]. Reactive oxygen species (ROS) are classified into free radicals (e.g., hydroxyl radicals [.OH]) and superoxide anion [.O2] and nonradicals (e.g., hydrogen peroxide [H2O2]). ROS are produced as a part of various oxidation–reduction processes in the body, and low levels of ROS are considered essential for the maintenance of biological functions as second messengers. In particular, ROS in semen is considered to facilitate processes such as capacitation, hyperactivation, and acrosome reaction during fertilization [4,5]. However, when ROS levels become high and out of balance with antioxidant capacity, the condition is called OS, leading to the loss of sperm cell membrane fluidity due to lipid peroxidation and arrest of embryogenesis progression caused by sperm DNA damage [6,7]. DNA damage can manifest in either single-stranded or double-stranded forms. These instances of DNA damage can occur during spermiogenesis, and the oocyte is responsible for repairing them. Unrepaired sperm DNA damage that exceeds a certain threshold can adversely affect embryogenesis and pregnancy outcomes. As the cleavage embryo develops, it transitions from relying on maternal factors to utilizing its own genome, a phenomenon referred to as the “late paternal effect” [8]. Therefore, sperm DNA damage has detrimental consequences for blastulation, implantation, and pregnancy outcomes. Previous meta-analyses have consistently shown a negative correlation between sperm DNA fragmentation and pregnancy outcomes [9], as well as a positive correlation with miscarriages [10]. On the contrary, reactive nitrogen species (RNS) such as peroxynitrite (ONOO-) and nitrogen monoxide (NO) exhibit similar behaviors to ROS. NO is produced by the enzyme nitric oxide synthase found in various cells, including sperm. At low levels, RNS plays a role in regulating the physiological functions of sperm during fertilization processes. However, when RNS levels become elevated, they negatively impact sperm motility and DNA integrity [11]. This imbalance is called nitrosative stress (NS), and it is clinically important and has been thought to negatively affect infertility treatment like OS. However, very few studies have focused on NS compared with OS. In the context of managing and treating MOSI, it is crucial to measure OS levels. Currently, there are over 30 different assays available for measuring seminal OS. These assays can be broadly classified as direct and indirect assays. Direct assays directly measure ROS levels, whereas indirect assays measure the adverse effects of OS, such as sperm DNA fragmentation and lipid peroxidation of the sperm membrane. In recent years, a novel and cost-effective method called oxidation–reduction potential (ORP) measurement has gained popularity as a direct assay for quantifying OS [12]. ORP measurements provide a simultaneous evaluation of the redox balance in semen. This approach offers a simpler and less expensive alternative to assessing OS compared to conventional methods. Previously, the balance between oxidation and reduction was measured using ROS-TAC, which involved complex procedures combining ROS measurement via chemiluminescence using luminol and assessing the total antioxidant capacity of seminal plasma samples to inhibit 2,2’-azino-di-[3-ethylbenzhiazoline sulfonate] (ABTS) oxidation to ABTS+. However, ORP measurement allows for a quick and easy assessment of the balance between ROS and antioxidant capacity simultaneously. The World Health Organization (WHO) laboratory manual, revised in 2021, also recognizes ORP measurement as an advanced examination. Additionally, several studies have investigated the relationship between ORP and the outcomes of assisted reproductive technologies (ART) [13,14]. However, for NS, evaluation is done by assays such as chemiluminescence, nitroblue tetrazolium test, cytochrome c reduction, flow cytometry, and electron spin resonance, which are all labor-intensive to measure [11]. In this study, we aimed to examine the correlation between ORP and OS levels and between ORP and NS levels to verify whether the ORP assay can easily measure not only OS but also NS and estimate the optimal cutoff values for 8-hydroxy-2′-deoxyguanosine (8-OHdG) and NOx from known ORP cutoff values. Our objective was to enhance the assessment of OS and NS in semen by investigating the correlation between ORP and these factors. By establishing this relationship, we aimed to contribute to the advancement of a more convenient and comprehensive method for evaluating OS and NS. Such a method would offer valuable insights into male infertility, leading to improved understanding and potential interventions for treatment.

2. Materials and Methods

2.1. Patients and Study Design

This cross-sectional study examined 100 male patients who visited the infertility outpatient clinic at the Reproduction Center of Yokohama City University Medical Center between December 2019 and October 2021. These patients were seeking medical assistance because of difficulties in conceiving a child.
Patient’s past and smoking history, height, and weight were collected through a medical interview, and a physical examination and endocrinological test were conducted to diagnose the cause of infertility.
The ORP of the neat semen was measured using the MiOXSYS® system, and the standardized ORP (sORP) was calculated by dividing by the concentration of sperm per million. Then, seminal plasma from the same specimens was extracted, and 8-OHdG, an indicator of OS, and NOx, an indicator of NS, were measured and divided by the number of spermatozoa per million. The correlation between sORP and 8-OHdG and NOx per unit sperm was tested. Based on the previously reported cutoff value of sORP, samples were classified into OS-positive and OS-negative groups. Thereafter, a receiver operating characteristic (ROC) curve was drawn on 8-OHdG and NOx, respectively, and each optimal cutoff value was determined from the Youden index.
Written informed consent was obtained from the patients. The study was approved by the Institutional Review Board of Yokohama City University Medical Center (B190500017).

2.2. Semen Analysis

Semen samples were collected from the study participants by masturbation following a recommended sexual abstinence period of 2–5 days. Semen analyses were performed using the Sperm Motility Analyzing System (SMAS™: DITECT Ltd., Tokyo, Japan), a computer-aided sperm analyzer, at room temperature after complete liquefaction at room temperature. Parameters were measured in accordance with the criteria outlined in the WHO Laboratory Manual of 2021 [15]. These parameters included semen volume, sperm concentration, sperm motility, and other relevant factors used to assess male fertility.

2.3. Measurement of ORP, 8-OHdG, and NOx

2.3.1. ORP Measurement

ORP of the neat semen was measured using a MiOXSYS® analyzer (Aytu Bioscience, CO). A small (30 µl) aliquot of the liquefied semen was dropped into the sensor pre-inserted into the analyzer at room temperature, and the measurement process began automatically. The ORP values were displayed in millivolts (mV) in 4 min. The sORP was the ORP divided by the sperm concentration per 106 spermatozoa/mL and was expressed in mV/106 spermatozoa/mL. The previously reported cutoff value was set at 1.36 mV/106 spermatozoa/mL [16], with values above and below that refer to an OS state and a reduction state, respectively.

2.3.2. 8-OHdG Measurement

To assess OS, the level of 8-OHdG, an indicator of oxidative DNA damage, was measured in the seminal plasma. 8-OHdG–bovine serum albumin (BSA) complex was diluted by phosphate-buffered saline (PBS) solution, dispensed in a microplate, shaken for 1 h at room temperature, washed with 0.01% PBS with Tween® 20 (TPBS), and subsequently incubated with a 1% BSA/PBS solution for 1 h at room temperature. After preparing the samples, 8-OHdG standard solution was added to them, and horseradish peroxidase (HRP)-conjugated anti-8-OHdG antibody solution was dispensed. The microplate was shaken, incubated, and washed with TPBS. Finally, tetramethylbenzidine was dispensed and allowed to emit color, and absorbance at 450 nm/570 nm was measured. A calibration curve was drawn from the absorbance data of the standard solution, and the 8-OHdG concentration of each sample was calculated.
To account for variations in sperm concentration, the standardized 8-OHdG was defined as the 8-OHdG concentration (ng/mL) divided by the sperm concentration per 106 spermatozoa/ml and was expressed in ng/106 spermatozoa.

2.3.3. NOx Measurement

RNS levels were assessed by measuring the concentration of NOx metabolites, specifically nitrate (NO3-) and nitrite (NO2-), in the seminal plasma. The measurement was performed using a Nitrate/Nitrite Colorimetric Assay Kit (Cayman Chemical, MI, USA). Enzyme coenzyme mixture and nitrate reductase were added to samples and controls on microplates and incubated at room temperature for 2 h. After incubation, Griess reagent R1 and immediately Griess reagent R2 were added and incubated for 10 min. The optical density was measured at 540 nm using a microplate reader, and the concentration was determined using appropriate standard curve. Similar to the s8-OHdG, the standardized NOx (sNOx) was calculated by dividing the NOx concentration (µM) by the sperm concentration per 106 spermatozoa/mL and was expressed in µM/106 spermatozoa/mL.

2.4. Statistical Analysis

Summary statistics were calculated for overall study population and each group. Data are presented as mean values and standard deviation or median values and interquartile range (IQR) for continuous variables. The background characteristics between the OS-positive and OS-negative groups were compared using t-test for continuous variables and Fisher’s exact test for categorical variables.
For s8-OHdG and sNOx, the Shapiro–Wilk test was performed for the normality test of the distribution, and since normality could not be assumed, the Wilcoxon signed rank-sum test, as a nonparametric test, was performed for group comparisons.
The correlation of s8-OHdG, sNOx, or sORP with semen analysis parameters and s8-OHdG or sNOx with sORP was estimated by the Spearman rank correlation coefficient “rho” as nonparametric tests. Then, after log-transforming those values and confirming that they were normally distributed, the correlation of s8-OHdG or sNOx with sORP was tested by Pearson’s product-moment correlation coefficient “r” with a 95% confidential interval (CI). To determine optimal cutoff values for classifying samples into OS-positive and OS-negative groups based on 8-OHdG and NOx concentrations, ROC curves were generated. The Youden index was employed to identify the optimal cutoff values. Statistical analysis was performed using RStudio version 1.2.5042 (The R Foundation for Statistical Computing, Vienna, Austria). A p-value of less than 0.05 was considered statistically significant, indicating the presence of a significant association or correlation.

3. Results

3.1. Baseline Characteristics

The mean age of the patients included in the study was 35.5 years, and the mean body mass index (BMI) was 23.6 kg/m2. The smoking status of the patients was current smokers at 20.0%, past smokers at 23.0%, and nonsmokers at 52.0%. The primary diseases, in descending order, were idiopathic spermatogenesis dysfunction (55.0 %), varicocele (26.0 %), and spermatogenesis dysfunction due to anticancer drugs (11.0 %). Based on the previously reported sORP cutoff values (1.36 mV/106 spermatozoa/mL), patients were divided into two groups: the OS group, consisting of individuals with aORP levels above the cutoff level (n = 53) and the non-OS group, comprising those with sORP levels below the cutoff (n = 47). There were no significant differences in age (p = 0.64), BMI (p = 0.95), smoking status (p = 0.77), primary diseases (p = 0.63), or endocrinological findings (T: p = 0.31, LH: p = 0.43, FSH: p = 0.58) between the two groups. However, both sperm concentration (22.8 vs. 59.8 million/mL, p < 0.01) and motility (25.8 vs. 36.0 %, p = 0.01) were significantly lower in the OS group than in the non-OS group (Table 1).

3.2. Differences in OS or NS markers in each group

The results presented in Table 2 demonstrate the values of OS or NS markers in each group. The sORP exhibited a significantly higher value in the OS group than in the non-OS group (2.99 vs. 0.37 mV/106 spermatozoa/mL, p < 0.001). Similarly, s8-OhdG (0.68 vs. 0.24 pg/106 spermatozoa, p < 0.001) and sNOx (0.39 vs. 0.14 µM/106 spermatozoa/mL, p < 0.001) were significantly elevated in the OS group than in the non-OS group.

3.3. Correlation of OS or NS Markers with Sperm Parameters

The Spearman rank correlation coefficient was employed to assess the relationship among s8-OHdG, sNOx, and sORP and various parameters of semen analysis. It was observed that none of the markers exhibited a significant correlation with semen volume (s8-OHdG: rho = −0.013, p = 0.897; sNOx: rho = −0.046, p = 0.649; sORP: rho = −0.030, p = 0.771). However, all markers demonstrated significant correlations with sperm concentrations (s8-OHdG: rho = −0.934, p < 0.001; sNOx: rho = −0.889, p < 0.001; sORP: rho = −0.514, p < 0.001) and sperm motility (s8-OHdG: rho = −0.376, p < 0.001; sNOx: rho = −0.494, p < 0.001; sORP: rho = −0.312, p = 0.002).

3.4. Correlation of OS or NS markers with ORP

The Spearman rank correlation coefficient analysis demonstrated significant correlations between the markers of OS (s8-OHdG) and sORP (rho = 0.41, p < 0.01), as well as between the markers of NS (sNOx) and sORP (rho = 0.54, p < 0.01) prior to any transformations. These correlations were visually represented in Figure 1 (a) and (b) through scatterplots and regression spline curves. After log transformation and normalization, the test also showed a significant correlation for both parameters (s8-OHdG: r = 0.38, 95% CI 0.20–0.54, p < 0.01; sNOx: r = 0.53, 95% CI 0.37–0.65, p < 0.01). In the subgroup analysis, sORP and log-transformed s8OHdG showed a moderate positive correlation in the OS group (r = 0.39, 95% CI 0.13–0.59, p < 0.01) but not in the non-OS group (r = 0.04, 95% CI −0.25 to 0.32, p = 0.79). sORP and log-transformed sNOx also showed positive correlation in the OS group (r = 0.55, 95% CI 0.32–0.71, p < 0.01) but not in the OS-negative group (r = −0.17, 95% CI −0.12–0.44, p = 0.25) (Table 3). Furthermore, there was a strong correlation between s8-OHdG and sNOx (r = 0.80, p < 0.01) (Figure 2).

3.5. Cutoff Levels of OS and NS

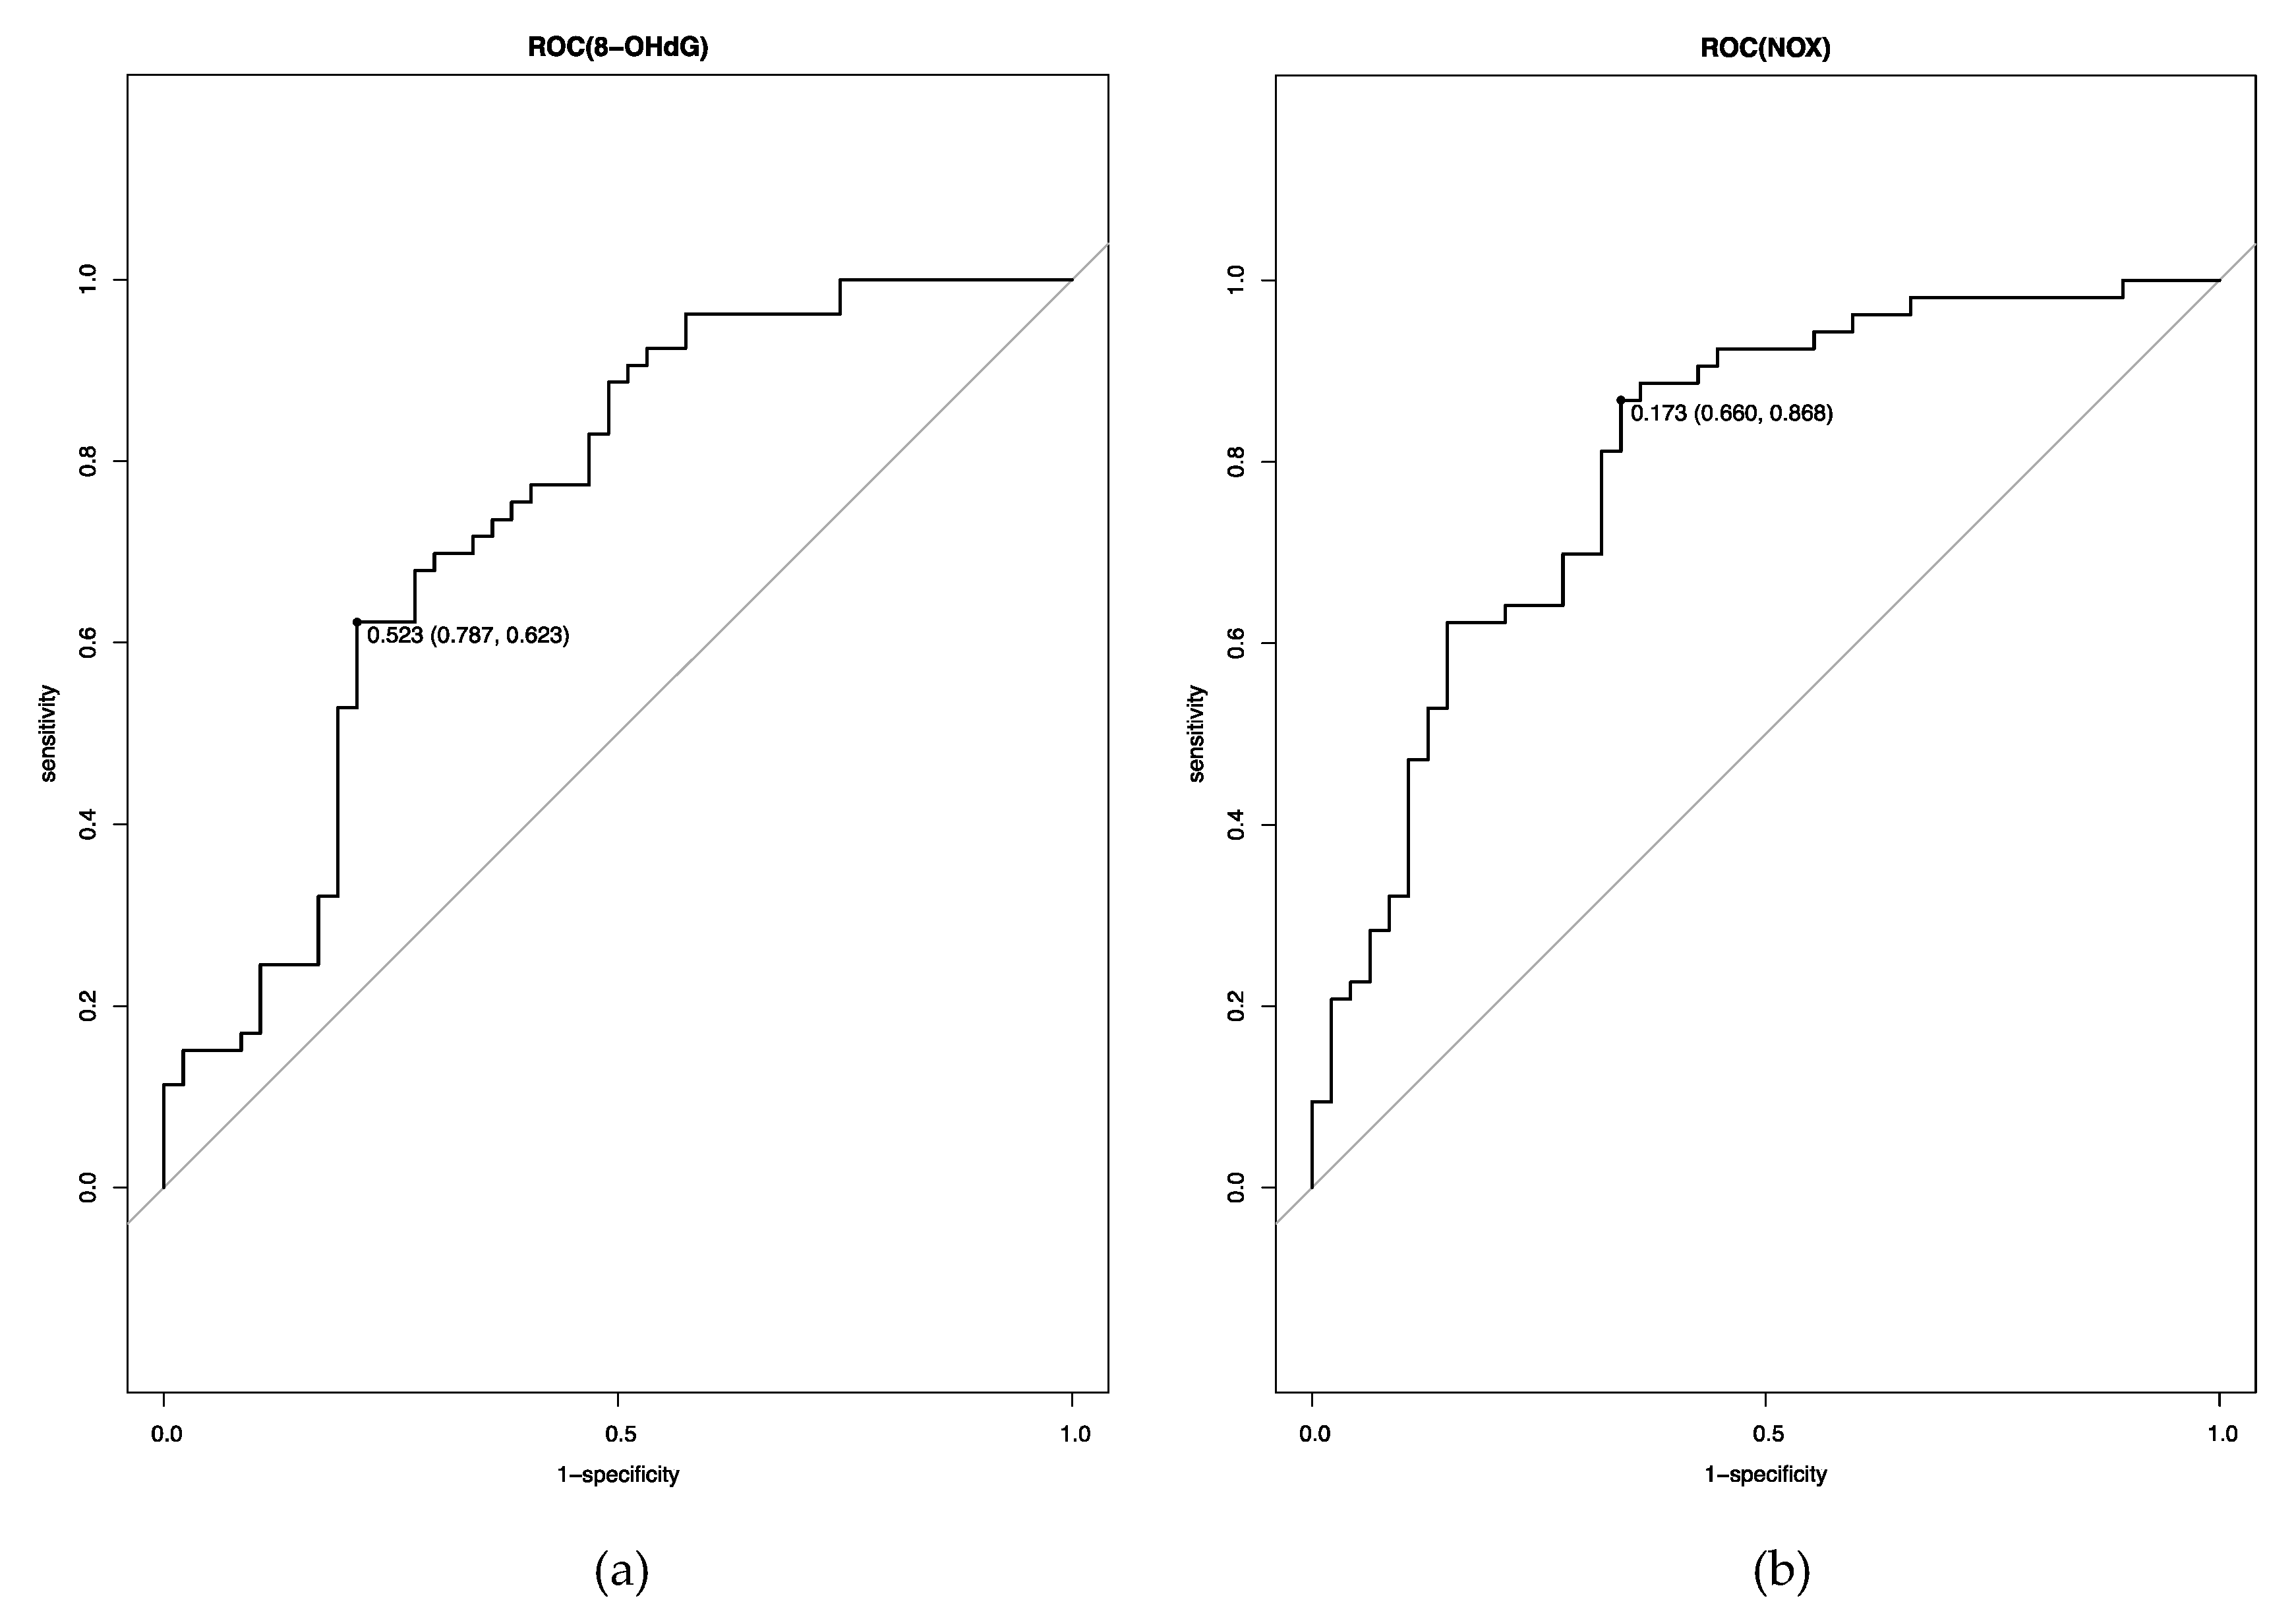
An ROC curve was drawn to predict OS-positive or OS-negative status based on the values of s8-OHdG and sNOx (Figure 3 (a) and (b)). By using the Youden index, the optimal cutoff levels for 8-OHdG and NOx levels were determined. For s8-OHdG, the area under curve (AUC) was 0.74 (95% CI 0.64–0.84), and the cutoff level was 0.52 ng/106spermatozoa (sensitivity, 0.62; specificity, 0.79). For sNOx, the AUC was 0.80 (95% CI 0.72–0.89), and the cutoff level was 0.17 µM/106spermatozoa/ml (sensitivity, 0.89; specificity, 0.66). These cutoff values allowed for the classification of individuals into OS and non-OS groups based on their s8-OHdG and sNOx levels.

4. Discussion

ROS, such as the superoxide anion, hydrogen peroxide, and hydroxyl radical, are naturally produced as byproducts of cellular metabolism. On the contrary, RNS, primarily consists of nitric oxide and peroxynitrite, which are formed through the reaction between NO and the superoxide anion.
Both ROS and RNS serve as crucial signaling molecules involved in maintaining biological functions across various physiological processes, including vasodilation, immune response, and sperm function [11]. Within controlled levels, ROS and RNS play essential roles in initiating fundamental events for fertilization in spermatozoa, such as capacitation, hyperactivation, acrosome reaction, and sperm-oocyte fusion [17]. However, when both exceed the capacity of endogenous antioxidant defense systems, OS and NS occur, respectively, and can be harmful to the organism. For sperm, excessive ROS and RNS levels could have detrimental effects on sperm function and viability. They cause lipid peroxidation, which damages the integrity of sperm membranes and compromises sperm motility. Moreover, they can cause DNA damage in sperm, which can arrest embryonic development and cause pregnancy loss. To assess the impact of ROS on sperm function, 8-OHdG has been commonly used as a biomarker of DNA damage caused by ROS [18]. Seminal 8-OHdG levels have been associated with sperm quality and fertility potential. However, 8-OHdG specifically reflects oxidative DNA damage and does not provide a comprehensive evaluation of NS, which is as important as OS. Therefore, a simpler and more comprehensive assay that can evaluate OS and NS simultaneously is needed.
To date, to evaluate NS levels, researchers have employed various techniques. For example, fluorescent probes targeted to the mitochondria by coupling a cation (TPP+) [19] and multiparameter flow cytometry analysis using fluorescein-boronate to detect peroxynitrite [20] have been utilized, which is still similarly complicated and time-consuming.
More recently, a simpler and more comprehensive assay called MiOXSYS™ has been developed that can measure OS easily [21]. This system provides an efficient and reproducible assessment of OS and is increasingly being used in clinical practice [13,14,22]. Because of its simplicity in measurement, it has been gradually replacing the conventional ROS-TAC assay. The sixth edition of the WHO Laboratory Manual, published in 2021 [15], also acknowledges ORP as an advanced examination, although sufficient evidence has yet to be established. The objective of this study was to investigate the relationship between seminal ORP and both 8-OHdG and NOx levels, two markers of OS and NS, respectively. Significant differences in s8-OHdG and NOx levels were observed between different groups. Furthermore, both s8-OHdG and sNOx were found to have negative correlations with sperm concentration and motility. As for sperm concentration, it is reasonable that they correlate because they are compared to the stress level per sperm concentration, but the result also showed that a negative correlation was observed for sperm motility, as observed in previous studies. Our results show that ORP can substitute not only for the OS marker 8-OHdG but also for the NS marker NOx. One reason for this was that 8-OHdG concentrations correlated well with NOx concentrations, as has been reported in the past [23]. However, few studies have examined the correlation between ORP and 8-OHdG or NOx [24], and this is the first study to calculate the equilibrium cutoff levels of these markers based on the previously reported ORP cutoff values. Despite previous studies comparing seminal 8-OHdG or NOx concentrations between fertile and infertile men [16,25], this study calculates each concentration standardized by dividing by the unit sperm concentration. The above unit conversion is appropriate because OS and NS must be standardized to correlate with sORP because occurrence varies with the sperm concentration. Interestingly, sORP did not correlate with log-transformed s8-OHdG and sNOx below the cutoff value, whereas significant correlations were observed above the cutoff value. This discrepancy suggested that the reliability of ORP measurements may be compromised at low values because the ORP tends to show negative values when the potential in seminal fluid shifts toward the reducing direction.
A strong correlation was found between 8-OHdG and NOx, which may be due to the common mechanism of ROS and RNS generation. RNS mainly include nitroxyl ions, peroxynitrite anion, and nitric oxide (NO). Seminal polymorphonuclear leukocytes have been identified as the source of both ROS and RNS [26]. L-arginine is converted to NO by NO synthase, which has various subclasses present in the testis and is involved in signal transduction and maintenance of the blood–testis barrier [27]. Excessive levels of NO induce OS and mitochondrial membrane damage in sperm, which causes cytochrome c release and apoptosis due to caspase activation. In short, excessive RNS causes lipid peroxidation, DNA damage, and apoptosis in sperm via OS generation [6,7]. OS and NS have the same pathway of development [28], which helps explain the results of this study. The results indicate that ORP can serve as a comprehensive surrogate marker for assessing both OS and NS. It offers a simpler and faster alternative to conventional, cumbersome assays. In this study, cutoff values for s8-OHdG and sNOx were estimated by drawing ROC curves, thereby classifying OS and non-OS groups based on established ORP cutoff values. To the best of our knowledge, there are no studies defining clear cutoff values for 8-OHdG or NOx standardized per unit sperm concentration. By multiplying the calculated cutoff values by the mean sperm concentration of 40.1 (106 spermatozoa), cutoff values of 20.9 (ng/mL) and 6.8 (µM) were obtained, respectively. These values tended to be higher than the cutoff values reported in previous studies [29]. As new assays like ORP emerge, the cutoff values for conventional assays will gradually be updated.
While this study provides valuable insights into the relationship between ORP and seminal markers of OS and NS, it is important to acknowledge its limitations. First, the validity of the binary classification of the OS conditions was based on the previously reported cutoff values of ORP [30]. Previous studies have set a cutoff value of 1.36 mV/106 spermatozoa/mL for abnormal and normal semen findings, which does not necessarily mean that for OS. However, since this value has been considered a cutoff value of OS in many studies [3], and it was used as well in the present study, and a binary classification was performed based on it. Further validation of this cutoff value may need to be verified in future research. Additionally, the values of 8-OHdG and NOx concentration were divided by the unit sperm concentration. sORP, which is standardized per million sperm, has been used for ORP; however, when we compared OS or NS levels in another assay, we must have the same conditions; therefore, the same sperm per million sperm should be compared. Endogenous ROS and RNS have traditionally been attributed to seminal leukocytes and immature spermatozoa. It is logical to assume that higher levels of immature spermatozoa would result in increased production of ROS and RNS. Consequently, it is common to normalize the concentration of ROS (RNS) generated by the sperm concentration. However, the cutoff values for each stress level calculated in this study could not simply be comparable with those in previous studies because past studies on seminal 8-OHdG and NOx have rarely been standardized in this way.

5. Conclusions

In conclusion, this study shed light on the relationship between seminal ORP and markers of OS and NS, such as 8-OHdG and NOx, highlighting the interconnectedness of ROS and RNS in sperm health. ORP measurement offers a simpler and faster alternative to conventional assays for assessing OS and NS in semen. It provides a quick evaluation of the overall oxidation–reduction balance within semen, making it a promising tool for evaluating male reproductive health. This study established optimal cutoff values for OS and NS, serving as crucial reference points for evaluating the oxidative and nitrosative status of semen. However, it is important to note that further research with larger sample sizes and diverse populations is necessary to validate these cutoff values and understand the clinical implications of ORP as a comprehensive surrogate marker for assessing OS and NS in semen. The incorporation of ORP measurement into routine semen analysis holds significant potential for evaluating male fertility. The simplicity and efficiency of ORP measurement make it a feasible and accessible option for laboratories and clinical settings, potentially facilitating its adoption as a diagnostic tool for male infertility, particularly for cases treatable with oral antioxidant supplementation.

Author Contributions

Conceptualization, T.T., K.Y., Y.A., and Y.Y.; methodology, T.T., T.S., K.Y., Y.A., Y.I., and Y.Y.; software, T.T.; validation, T.T., K.Y., Y.A., and Y.Y.; formal analysis, T.T.; investigation, K.Y., Y.A., and Y.I.; resources, T.T., T.S., and Y.Y.; data curation, T.T. and T.S.; writing—original draft preparation, T.T.; writing—review and editing, T.T., T.S., K.Y., Y.A., and Y.Y.; supervision, K.Y., Y.A., Y.T., Y.I., and Y.Y.; project administration, K.Y., Y.T., and Y.Y.; funding acquisition, Y.A. and Y.T. All authors have read and agreed to the published version of the manuscript.

Funding

This research was funded by Dantte Inc.

Institutional Review Board Statement

The study was conducted in accordance with the Declaration of Helsinki and was approved by the Institutional Review Board of Yokohama City University Medical Center (B190500017, 13 June 2019).

Informed Consent Statement

Informed consent was obtained from all subjects involved in the study.

Data Availability Statement

The data presented in this study are available on request from the corresponding author. The data are not publicly available to prevent the identification of individuals.

Acknowledgments

We thank Healthcare Systems Inc. for their support in this study.

Conflicts of Interest

The authors declare no conflict of interest. The funders had no role in the design of the study, in the collection, analyses, or interpretation of data, in the writing of the manuscript, or in the decision to publish the results.

References

  1. Vander Borght, M.; Wyns, C. Fertility and infertility: Definition and epidemiology. Clinical Biochemistry 2018, 62, 2–10. [Google Scholar] [CrossRef] [PubMed]
  2. Yumura, Y.; Tsujimura, A.; Imamoto, T.; Umemoto, Y.; Kobayashi, H.; Shiraishi, K.; Shin, T.; Taniguchi, H.; Chiba, K.; Miyagawa, Y.; et al. Nationwide survey of urological specialists regarding male infertility: results from a 2015 questionnaire in Japan. Reproductive Medicine and Biology 2018, 17, 44–51. [Google Scholar] [CrossRef] [PubMed]
  3. Agarwal, A.; Parekh, N.; Panner Selvam, M.K.; Henkel, R.; Shah, R.; Homa, S.T.; Ramasamy, R.; Ko, E.; Tremellen, K.; Esteves, S.; et al. Male Oxidative Stress Infertility (MOSI): Proposed Terminology and Clinical Practice Guidelines for Management of Idiopathic Male Infertility. The World Journal of Men's Health 2019, 37, 296–312. [Google Scholar] [CrossRef] [PubMed]
  4. de Lamirande, E.; Jiang, H.; Zini, A.; Kodama, H.; Gagnon, C. Reactive oxygen species and sperm physiology. Reviews of Reproduction 1997, 2, 48–54. [Google Scholar] [CrossRef]
  5. Du Plessis, S.S.; Agarwal, A.; Halabi, J.; Tvrda, E. Contemporary evidence on the physiological role of reactive oxygen species in human sperm function. Journal of Assisted Reproduction and Genetics 2015, 32, 509–520. [Google Scholar] [CrossRef] [PubMed]
  6. Takeshima, T.; Usui, K.; Mori, K.; Asai, T.; Yasuda, K.; Kuroda, S.; Yumura, Y. Oxidative stress and male infertility. Reproductive Medicine and Biology 2021, 20, 41–52. [Google Scholar] [CrossRef]
  7. Agarwal, A.; Saleh, R.A.; Bedaiwy, M.A. Role of reactive oxygen species in the pathophysiology of human reproduction. Fertility and Sterility 2003, 79, 829–843. [Google Scholar] [CrossRef]
  8. Tesarik, J.; Greco, E.; Mendoza, C. Late, but not early, paternal effect on human embryo development is related to sperm DNA fragmentation. Human Reproduction (Oxford, England) 2004, 19, 611–615. [Google Scholar] [CrossRef]
  9. Zhang, Z.; Zhu, L.; Jiang, H.; Chen, H.; Chen, Y.; Dai, Y. Sperm DNA fragmentation index and pregnancy outcome after IVF or ICSI: a meta-analysis. Journal of Assisted Reproduction and Genetics 2015, 32, 17–26. [Google Scholar] [CrossRef]
  10. Zhao, J.; Zhang, Q.; Wang, Y.; Li, Y. Whether sperm deoxyribonucleic acid fragmentation has an effect on pregnancy and miscarriage after in vitro fertilization/intracytoplasmic sperm injection: a systematic review and meta-analysis. Fertility and sterility 2014, 102, 998–1005. [Google Scholar] [CrossRef]
  11. Dutta, S.; Sengupta, P.; Das, S.; Slama, P.; Roychoudhury, S. Reactive Nitrogen Species and Male Reproduction: Physiological and Pathological Aspects. International Journal of Molecular Sciences 2022, 23. [Google Scholar] [CrossRef] [PubMed]
  12. Agarwal, A.; Sharma, R.; Roychoudhury, S.; Du Plessis, S.; Sabanegh, E. MiOXSYS: a novel method of measuring oxidation reduction potential in semen and seminal plasma. Fertility and Sterility 2016, 106, 566–573. [Google Scholar] [CrossRef]
  13. Henkel, R.; Morris, A.; Vogiatzi, P.; Saleh, R.; Sallam, H.; Boitrelle, F.; Garrido, N.; Arafa, M.; Gül, M.; Rambhatla, A.; et al. Predictive value of seminal oxidation-reduction potential analysis for reproductive outcomes of ICSI. Reproductive Biomedicine Online 2022, 45, 1007–1020. [Google Scholar] [CrossRef] [PubMed]
  14. Tomita, K.; Udayanga, K.G.S.; Satoh, M.; Hashimoto, S.; Morimoto, Y. Relation between semen oxidative reduction potential in initial semen examination and IVF outcomes. Reproductive Medicine and Biology 2023, 22, e12501. [Google Scholar] [CrossRef]
  15. WHO laboratory manual for the examination and processing of human semen 6th edition. 2021.
  16. Guz, J.; Gackowski, D.; Foksinski, M.; Rozalski, R.; Zarakowska, E.; Siomek, A.; Szpila, A.; Kotzbach, M.; Kotzbach, R.; Olinski, R. Comparison of oxidative stress/DNA damage in semen and blood of fertile and infertile men. PLoS One 2013, 8, e68490. [Google Scholar] [CrossRef] [PubMed]
  17. Gualtieri, R.; Kalthur, G.; Barbato, V.; Longobardi, S.; Di Rella, F.; Adiga, S.K.; Talevi, R. Sperm oxidative stress during in vitro manipulation and its effects on sperm function and embryo development. Antioxidants (Basel) 2021, 10. [Google Scholar] [CrossRef]
  18. Gholinezhad, M.; Aliarab, A.; Abbaszadeh-Goudarzi, G.; Yousefnia-Pasha, Y.; Samadaian, N.; Rasolpour-Roshan, K.; Aghagolzadeh-Haji, H.; Mohammadoo-Khorasani, M. Nitric oxide, 8-hydroxydeoxyguanosine, and total antioxidant capacity in human seminal plasma of infertile men and their relationship with sperm parameters. Clinical and Experimental Reproductive Medicine 2020, 47, 54–60. [Google Scholar] [CrossRef]
  19. Escada-Rebelo, S.; Ramalho-Santos, J. Oxidative and nitrosative stress detection in human sperm using fluorescent probes. Methods in molecular Biology (Clifton, N.J.) 2023, 2566, 45–52. [Google Scholar] [CrossRef]
  20. Uribe, P.; Meriño, J.; Manquemilla, E.; Villagrán, C.; Vega, E.; Zambrano, F.; Schulz, M.; Pezo, F.; Villegas, J.V.; Boguen, R.; et al. Multiparameter flow cytometry assay for analysis of nitrosative stress status in human spermatozoa. Cytometry A 2020, 97, 1238–1247. [Google Scholar] [CrossRef]
  21. Panner Selvam, M.K.; Baskaran, S.; O'Connell, S.; Almajed, W.; Hellstrom, W.J.G.; Sikka, S.C. Association between Seminal Oxidation-Reduction Potential and Sperm DNA Fragmentation-A Meta-Analysis. Antioxidants (Basel) 2022, 11. [Google Scholar] [CrossRef]
  22. Arafa, M.; Agarwal, A.; Majzoub, A.; Panner Selvam, M.K.; Baskaran, S.; Henkel, R.; Elbardisi, H. Efficacy of Antioxidant Supplementation on Conventional and Advanced Sperm Function Tests in Patients with Idiopathic Male Infertility. Antioxidants (Basel) 2020, 9. [Google Scholar] [CrossRef]
  23. Amiri, I.; Karimi, J.; Piri, H.; Goodarzi, M.T.; Tavilani, H.; Khodadadi, I.; Ghorbani, M. Association between nitric oxide and 8-hydroxydeoxyguanosine levels in semen of diabetic men. Systems Biology in Reproductive Medicine 2011, 57, 292–295. [Google Scholar] [CrossRef]
  24. Yamasaki, K.; Uchida, M.; Watanabe, N.; Ihana, T.; Ishiguro, Y.; Kuroda, S.; Takeshima, T.; Yumura, Y.; Mieno, M.; Yoshida, K.; et al. Effects of antioxidant co-supplementation therapy on spermatogenesis dysfunction in relation to the basal oxidation-reduction potential levels in spermatozoa: A pilot study. Reproductive Medicine and Biology 2022, 21, e12450. [Google Scholar] [CrossRef] [PubMed]
  25. Ranganathan, P.; Rao, K.A.; Thalaivarasai Balasundaram, S. Deterioration of semen quality and sperm-DNA integrity as influenced by cigarette smoking in fertile and infertile human male smokers-A prospective study. Free Radical Research 2019, 120, 11784–11793. [Google Scholar] [CrossRef] [PubMed]
  26. Homa, S.T.; Vessey, W.; Perez-Miranda, A.; Riyait, T.; Agarwal, A. Reactive Oxygen Species (ROS) in human semen: determination of a reference range. Journal of Assisted Reproduction and Genetics 2015, 32, 757–764. [Google Scholar] [CrossRef]
  27. Zhang, H.; Zheng, R.L. Possible role of nitric oxide on fertile and asthenozoospermic infertile human sperm functions. Free Radical Research 1996, 25, 347–354. [Google Scholar] [CrossRef]
  28. Lee, N.P.; Cheng, C.Y. Nitric oxide/nitric oxide synthase, spermatogenesis, and tight junction dynamics. Biology of Reproduction 2004, 70, 267–276. [Google Scholar] [CrossRef]
  29. Shen, H.M.; Chia, S.E.; Ni, Z.Y.; New, A.L.; Lee, B.L.; Ong, C.N. Detection of oxidative DNA damage in human sperm and the association with cigarette smoking. Reproductive Toxicology 1997, 11, 675–680. [Google Scholar] [CrossRef] [PubMed]
  30. Agarwal, A.; Roychoudhury, S.; Sharma, R.; Gupta, S.; Majzoub, A.; Sabanegh, E. Diagnostic application of oxidation-reduction potential assay for measurement of oxidative stress: clinical utility in male factor infertility. Reproductive Biomedicine Online 2017, 34, 48–57. [Google Scholar] [CrossRef]
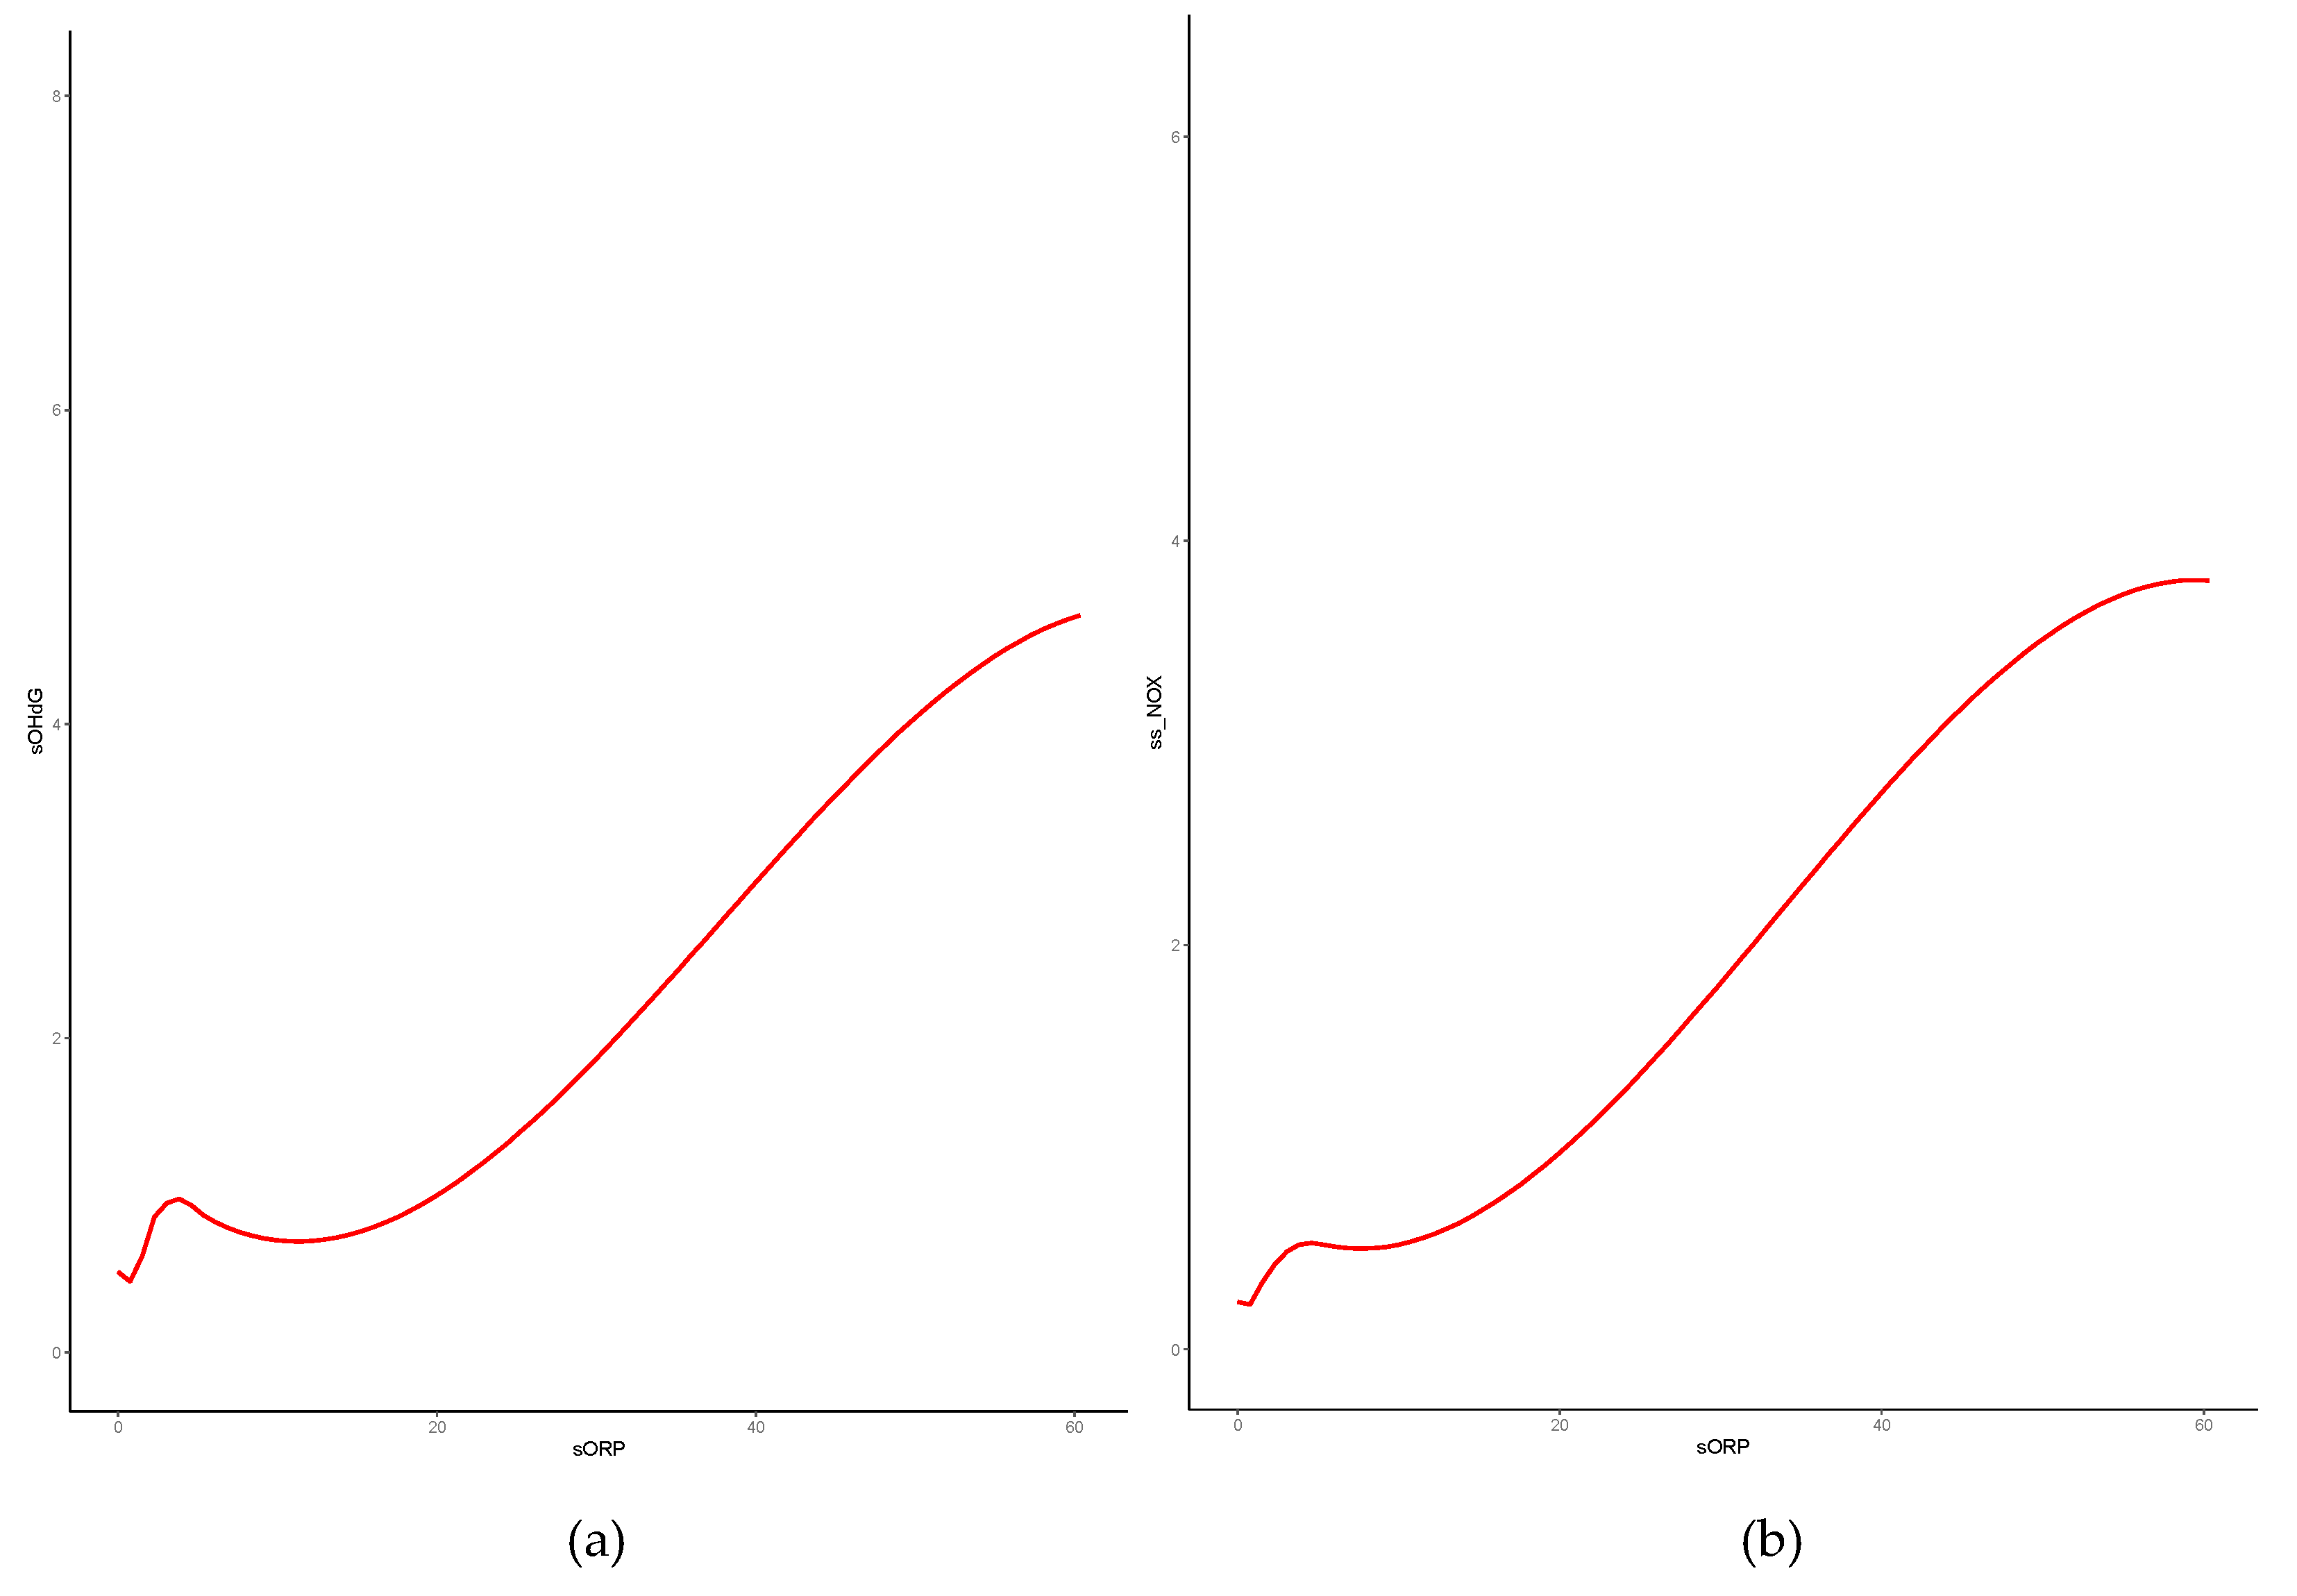
Figure 1. Correlation between sORP and each marker. (a) Correlation and regression spline curve between sORP and s8-OHdG (r = 0.41, p < 0.01). (b) Correlation and regression spline curve between sORP and sNOx (r = 0.54, p < 0.01).
Preprints 78672 g001
Figure 2. Correlation between s8-OHdG and sNOx. Strong correlation was observed between s8-OHdG and sNOx (r = 0.80, p < 0.01).
Preprints 78672 g002
Figure 3. ROC to determine OS-positive cutoff value for each marker. (a) ROC to determine the OS-positive cutoff value for s8-OHdG (AUC, 0.74; threshold, 0.52 ng/106 spermatozoa). (b) ROC to determine the OS-positive cutoff value for sNOx (AUC, 0.80; threshold, 0.17 µM/106 spermatozoa/mL).
Preprints 78672 g003
Table 1. Baseline characteristics of patients.
Overall OS non-OS p value
n 100 53 47
Age, years (SD) 35.5 (6.6) 35.8 (6.9) 35.1 (6.5) 0.64
BMI, kg/m2 (SD) 23.6 (3.2) 23.6 (3.2) 23.6 (3.2) 0.95
smoking, n (%) 0.77
current smoker 20 (20.0) 9 (17.0) 11 (23.4)
past smoker 23 (23.0) 13 (24.5) 10 (21.3)
non-smoker 52 (52.0) 29 (54.7) 23 (48.9)
unknown 5 (5.0) 2 (3.8) 3 (6.4)
disease, n (%) 0.63
idiopathic 55 (55.0) 32 (60.4) 23 (48.9)
varicocele 26 (26.0) 13 (24.5) 13 (27.7)
post anticancer drug 11 (11.0) 5 (9.4) 6 (12.8)
other 8 (8.0) 3 (5.7) 5 (10.6)
T, ng/ml (SD) 4.9 (1.7) 5.1 (1.7) 4.7 (1.7) 0.31
LH, mIU/ml (SD) 4.9 (1.8) 4.7 (1.7) 5.0 (1.8) 0.43
FSH, mIU/ml (SD) 5.6 (3.4) 5.8 (2.7) 5.4 (4.2) 0.58
semen volume, ml (SD) 2.7 (1.4) 2.7 (1.6) 2.7 (1.2) 0.86
concentration, million/ml (SD) 40.1 (43.9) 22.8 (21.3) 59.6 (53.9) <0.01
motility, % (SD) 30.6 (19.8) 25.8 (15.8) 36.0 (22.5) 0.01
Table 2. Differences of OS or NS markers in each group.
OS non-OS p
sORP [IQR], mV/106
spermataozoa/mL
2.99
[2.11, 5.30]
0.37
[0.14, 0.88]
< 0.001
s8-OHdG [IQR],
mol/dL/106 spermatozoa/mL
0.68
[0.30, 1.22]
0.24
[0.12, 0.47]
< 0.001
sNOx [IQR], µM/106
spermatozoa/mL
0.39
[0.20, 0.62]
0.14
[0.09, 0.25]
< 0.001
Table 3. Correlation coefficient with sORP of both markers before and after transformation.
correlation coefficient overall OS non-OS
s8-OHdG 0.41* 0.17 0.02
log-transformed 0.38* 0.39* 0.04
sNOx 0.54* 0.26 0.17
log-transformed 0.53* 0.55* 0.17
*: p < 0.01
Disclaimer/Publisher’s Note: The statements, opinions and data contained in all publications are solely those of the individual author(s) and contributor(s) and not of MDPI and/or the editor(s). MDPI and/or the editor(s) disclaim responsibility for any injury to people or property resulting from any ideas, methods, instructions or products referred to in the content.
Copyright: This open access article is published under a Creative Commons CC BY 4.0 license, which permit the free download, distribution, and reuse, provided that the author and preprint are cited in any reuse.
Prerpints.org logo

Preprints.org is a free preprint server supported by MDPI in Basel, Switzerland.

Subscribe

© 2024 MDPI (Basel, Switzerland) unless otherwise stated