Preprint
Article

Nitrogen and Phosphorus Co-Doped Carbon Dots for the Growth Promotion of Water Spinach

Altmetrics

Downloads

102

Views

42

Comments

0

A peer-reviewed article of this preprint also exists.

Submitted:

05 July 2023

Posted:

06 July 2023

You are already at the latest version

Alerts
Abstract
Carbon dots have received much attention due to their unique physicochemical properties and diverse applications in bioimaging, optoelectronic devices, catalysis, and agriculture. Here in this work, we report a simple hydrothermal synthesis of nitrogen and phosphorus-doped carbon dots (N, P-CDs). The optical and physical properties of the synthesized N, P-CDs were analyzed using systematical spectroscopy and electrical characterization. The synthesized N, P-CDs show strong photoluminescence at 626 nm and demonstrate high stability under UV light and other conditions. Moreover, we incorporate the synthesized N, P-CDs into water spinach by root spraying and leaf spraying. It was found that N, P-CDs could effectively promote the growth of water spinach by increasing the photosynthetic rate, and the content of total phenols and anthocyanins in water spinach
Keywords: 
Subject: Engineering  -   Chemical Engineering

1. Introduction

Vegetables are an important source of natural dietary fiber that can regulate the human intestinal microbiota and ensure human health for humans [1]. Vegetables also contain a large number of trace elements and vitamins required by the human body [2]. In recent years, with the long-term heavy use of pesticides and chemical fertilizers, the heavy metals in vegetables have increased substantially. The high level of heavy metals in vegetables not only reduces their nutritional quality but also threatens human health [3]. In addition, many of the crops produced today, while meeting the caloric requirements of the human diet, are unable to meet the corresponding micronutrient requirements, resulting in nutritional deficiencies [4]. It is therefore important to enhance the nutritional quality of vegetables considering that they are one of the main sources of nutrition besides the crops. Therefore, we need a fertilizer that is environmentally friendly and can improve plant-related nutritional fertilizers.
Carbon dots are nanomaterials less than 10 nm in size [5], its synthesis method is divided into a top-down approach and a bottom-up approach. Carbon dots have the advantages of simple synthesis, good biocompatibility, and low toxicity [6,7]. In recent years, carbon dots have achieved excellent results in plant applications [8]. For example, Zhang et al. synthesized chiral carbon dots from citric acid and L-cysteine or D-cysteine for the growth phase of mung bean sprouts and found that the carbon dots were effective in enhancing plant growth. [9]. The carbon dots also have the function of enhancing crop stress tolerance. Sun et al. used peanuts as an experimental sample and applied CDs to peanut plants and examined the whole life cycle of peanut plants. It was found that CDs can improve peanut growth and also improve peanut stress resistance. [10]. In addition, carbon dots can be used as a fluorescence for tracing the transport mechanism in plants [11]. For example, Chen et al. used citric acid and urea to synthesize water-soluble CDs, which can be found by fluorescence microscopy in root crown cells, root cortex, vascular bundles, and leaf pulp cells of treated maize seedlings. This suggests that carbon dots can be absorbed and transported in the plant.
In this work, we have synthesized N, P-CDs using o-phenylenediamine and phosphoric acid as raw materials by a one-step hydrothermal method. We used N, P-CDs in water spinach to promote its growth and enhance its nutritional quality. N, P-CDs with a gradient of concentrations were applied to the vegetables using leaf spraying and root spraying. The overall indicators such as fresh/dry weight as well as photosynthetic parameters were systematically evaluated, revealing that N, P-CDs can effectively improve the nutritional quality and growth status of water spinach.

2. Materials and methods

2.1. Preparation of N, P-CDs

The N, P-CDs were prepared by a one-pot hydrothermal method using o-phenylenediamine and phosphoric acid. 0.5407 g of o-phenylenediamine and 1 ml of phosphoric acid were mixed and dissolved in 25 ml of deionized water. The mixed solution was transferred to a PTFE-lined reactor and heated at 160 °C. After cooling to ambient temperature, the obtained solution is transferred to a centrifuge tube, and the crude product is filtered by centrifugation, followed by the removal of large particle residues using a 0.22 μm filter membrane. After dialysis and lyophilization, a solid powder was obtained.

2.2. Characterization of N, P-CDs

The morphology of N, P-CDs was observed using a JEM 2100f electron microscope. The fractions of N, P-CDs were determined using a Fourier Transform infrared spectroscopy(FT-IR) and an EXCLAB 250Xi X-ray photoelectron spectrometer (XPS). UV-Vis absorption spectra and fluorescence spectra (PL) was measured using a UV-vis 1800 UV spectrophotometer and an RF-6000 fluorescence spectrometer, respectively.

2.3. Selection and cultivation of water spinach

Full, evenly sized seeds are sown in small polyurethane foam cubes, which are placed in a foam seedling tray and germinated in the dark at 29 °C. The seeds are then planted in the dark. After two days the seeds show their whiteness and the seedlings are planted when the cotyledons have spread. The plants were exposed to light in an artificial climate chamber with LED white light at an intensity of 200 μmol-m-2-s-1 and a photoperiod of 12 h/12 h.
The roots and leaves of water spinach were treated separately, with the two treatment groups experimentally independent and not interfering with each other. Seedlings with flattened leaves and uniform growth were selected for transplanting, and a blank group of five treatment groups was set up. N, P-CDs powder was dissolved in water and the solution was prepared in different concentration gradients (0, 25 mg/L, 50 mg/L, 100 mg/L, 200 mg/L, 400 mg/L). The roots of water spinach were treated with this solution. When carrying out the leaf treatment, plastic sheets were used to shade the treatment to prevent the carbon point solution sprayed on the leaves of the plants from entering the hydroponic solution. Treatments were carried out every four days for 20 days.

2.4. Morphology determination of water spinach

The yield of the plant is the sum of the total amount of stems, leaves, and roots, and the dried fresh matter mass is sampled at the end of that measurement. Plants were washed and dried on absorbent paper and the fresh matter mass of individual stems, leaves, and roots was measured separately. The plants were also killed in an oven at 105 °C for 30 min, kept at 75 °C until constant weight, and the dry matter mass of stems, leaves, and roots was measured.

2.5. Determination of nutritional quality and photosynthetic pigments

The content of total phenols, flavonoids, and flavonoids was determined according to the method of Cao Jiankang [12].
Chlorophyll was extracted with 95 % ethanol and its absorbance was measured with a UV-vis spectrophotometer. Plant photosynthetic parameters were measured using a portable LI-6400XT photosynthesizer, and photosynthetic rate (Pn), stomatal conductance (Gs), intercellular CO2 concentration (Ci), and transpiration rate (Tr) were recorded.

2.6. Statistical analysis

Data were analyzed by ANOVA (P < 0.05) using SPSS 23 statistical analysis software, and hypothetical ANOVA tests were performed using the S-N-K method. Plots were drawn using Origin 2019 software. Morphological indicators were repeated six times, and physiological indicators were repeated three times, and the results were expressed as mean ± standard deviation.

3. Results

3.1. Spectroscopic characterization of N, P-CDs

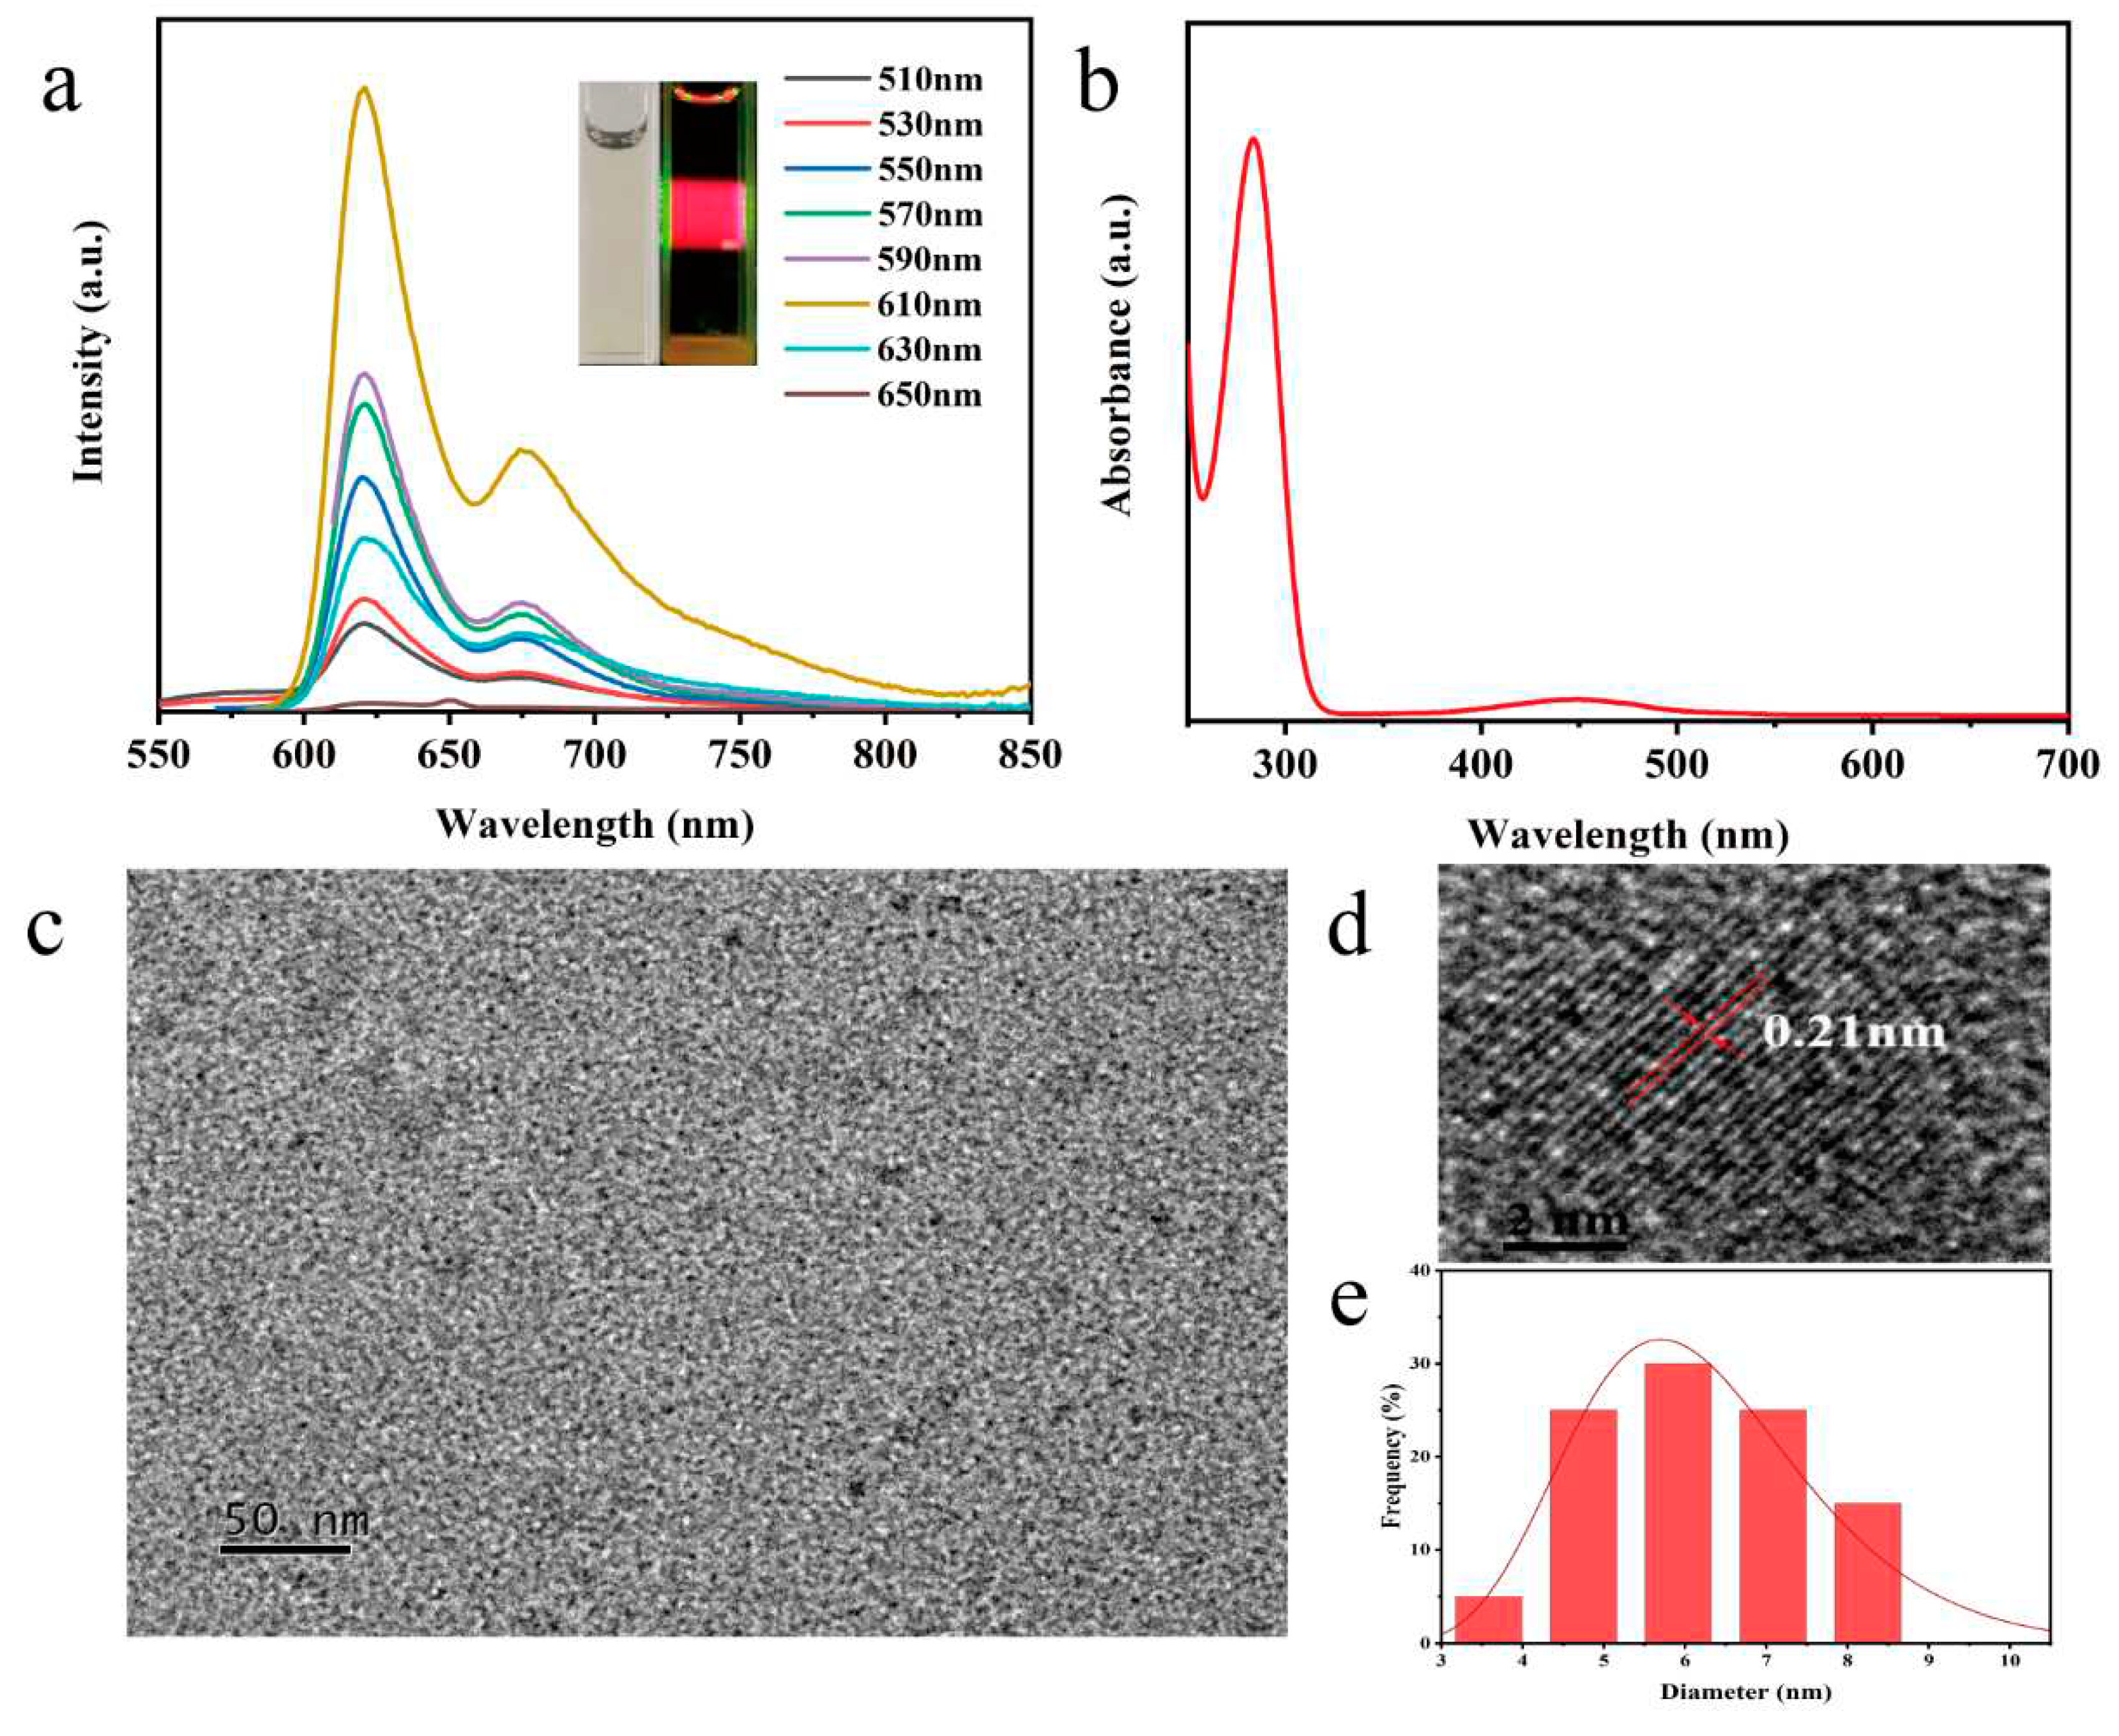
N, P-CDs show significant fluorescence emission at 510 nm-650 nm excitation (Figure 1a). With increasing excitation wavelengths, N, P-CDs show excellent red light emission at different excitation wavelengths. The maximum fluorescence intensity is at an excitation of 610 nm, corresponding to an emission wavelength of 626 nm, with a shoulder peak at around 675 nm. The N, P-CDs solution appears pale yellow under daily light and bright red fluorescence under UV (530 nm) irradiation. N, P-CDs have two peaks at 282 nm and 450 nm (Figure 1b), where the absorption peak at 282 nm is a π-π* leap in the C=C bond in the aromatic ring, and the absorption peak at 450 nm may be attributed to the n-π* leap in the C=O bond and the π-π* leap in the aromatic fluorophore structure [13].
Figure 1c–d shows the nearly spherical shape and good dispersion of the N, P-CDs, and the HRTEM test results illustrate the distinct lattice striations of the N, P-CDs. The calculated crystal plane spacing is 0.21 nm, which is consistent with the (100) crystal plane of graphene [14]. The particle size of the N, P-CDs ranged from 4.3 nm to 7.5 nm with an average particle size of about 6.21 nm.
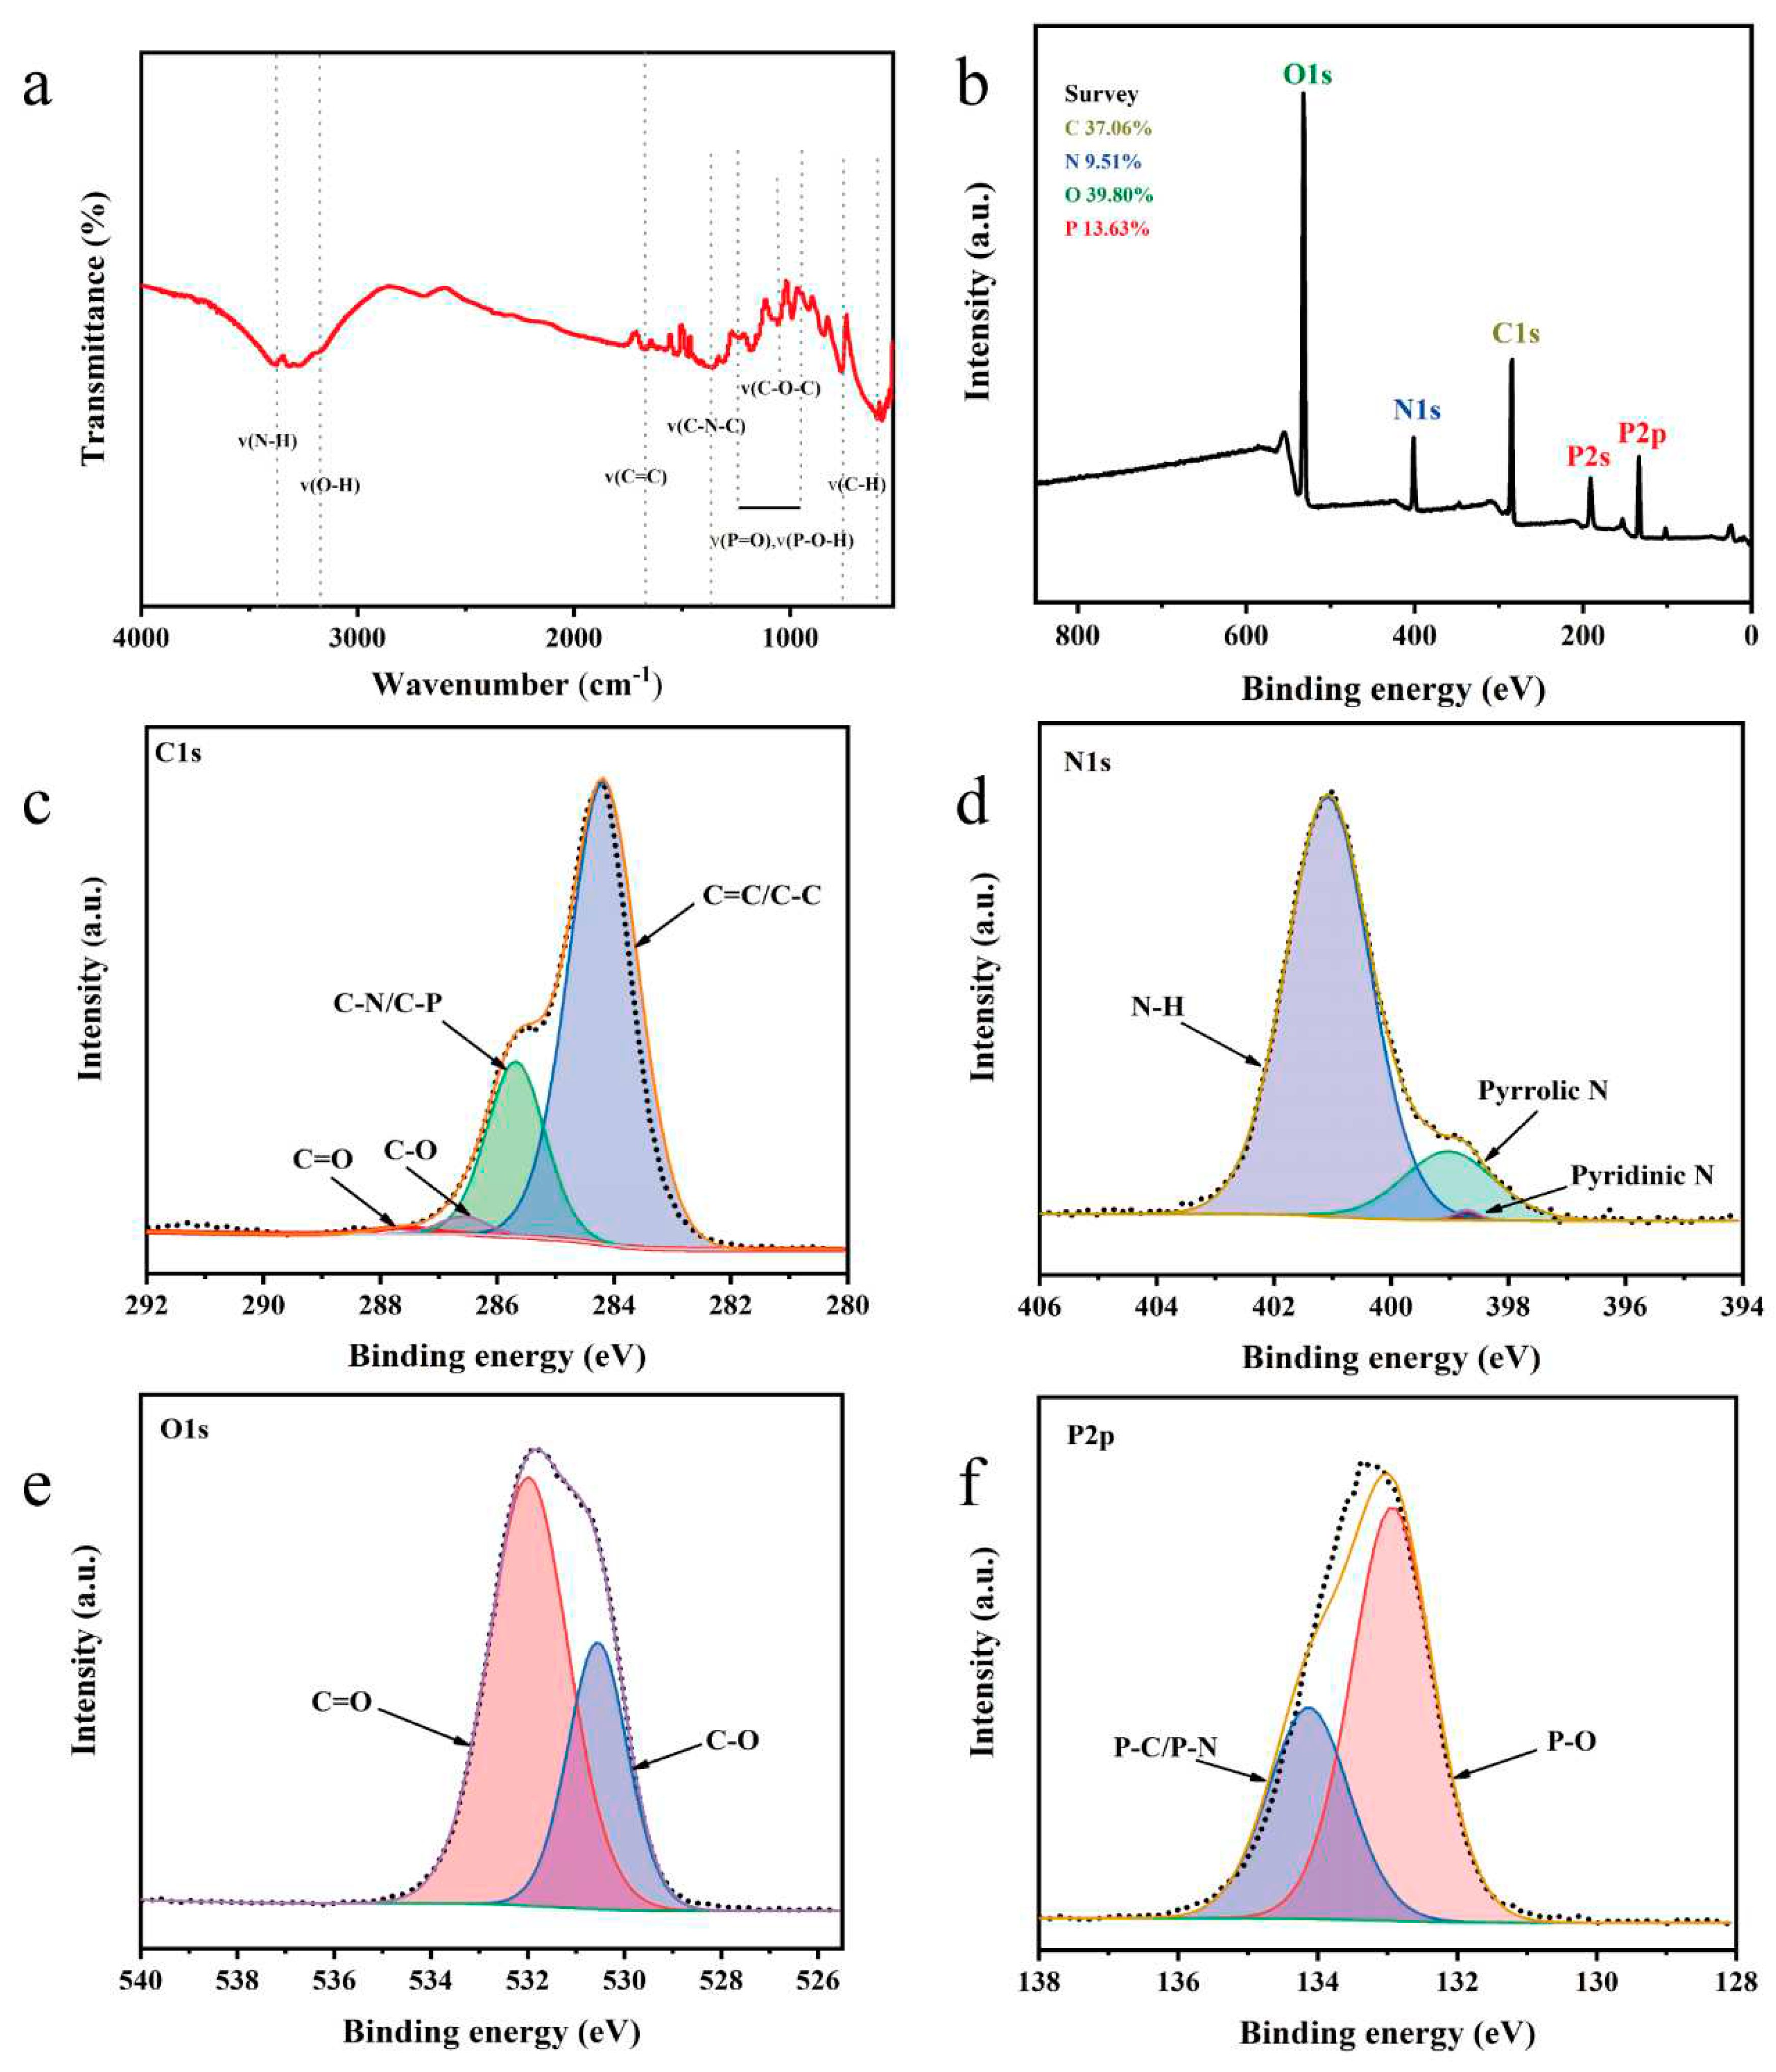
Figure 2a shows the FTIR spectra of the N, P-CDs. The stretching vibrations of the N-H and O-H bonds are observed at 3390 cm-1 and 3170 cm-1. The peak at 1670 cm-1 indicates the presence of stretching vibrations of the C=O or C=N and C=C structures in the carbon core skeleton of N, P-CDs [15]. 1370 cm-1 corresponds to the C-N-C stretching vibration in the benzene ring, suggesting the possible presence of imine and piperazine structures in N, P-CDs [16]. The absorption peaks at 940 cm-1-1260 cm-1 correspond to the P=O and P-O-R (R=alkyl) stretching vibrations [17]. The absorption peaks at 771 cm-1 and 607 cm-1 correspond to the bending vibration of C-H, which coincides with the out-of-plane bending vibration of the benzene ring C-H [18].
The chemical composition of the N, P-CDs was characterized using X-ray photoelectron spectroscopy. As shown in Figure 2b, the N, P-CDs show four peaks at 286.8 eV, 401.1 eV, 531.81 eV, and 133.39 eV. The atomic percentages of C, N, O, and P were 37.06 %, 9.51 %, 39.80 %, and 16.63 %, respectively. From the high-resolution spectra of C1s (Figure 2c), it can be seen that there are four chemical bonds in N, P-CDs, i.e., C=C/C-C (284.2 eV), C-N/C-P (285.7 eV), C-O (286.6 eV), and C=O (287.7 eV) [19,20]. High-resolution XPS spectra of N1s have three peaks at 399.2 eV, 400.1 eV, and 401.4 eV (Figure 2d), which are corresponding to pyridine N, pyrrole N, and graphite N, respectively [21]. The high-resolution spectra of O1s are at 530.4 eV and 531.9 Ev (Figure 2e), corresponding to the presence of both C-O and C=O forms of O [22]. The high-resolution XPS energy spectrum of P2p has two peaks at 132.9 eV and 134.1 eV (Figure 2f), indicating the presence of P=O and P-C/P-N chemical bonds [13].
To investigate the environmental stability of N, P-CDs, the effects of ionic strength, UV irradiation, and different pH on the fluorescence intensity of N, P-CDs were investigated separately. As shown in Figure 3a, after 120 min of UV irradiation, the fluorescence intensity of N, P-CDs remained at 86.54 % of its initial value, indicating that the optimized carbon dots have strong resistance to photobleaching and are suitable for large-scale preparation and storage. The fluorescence intensity of N, P-CDs under different salt concentration solutions (from 0 mol/L to 2 mol/L) was nearly the same, proving that the carbon dots have good salt tolerance, and carbon dots have greater potential for biological applications. When N, P-CDs were dispersed in solutions with different pH values, the fluorescence intensity of the carbon dots remained almost unchanged at a pH of 1-12, showing excellent fluorescence stability. The intensity decreased at a PH of 13 and 14, this is probably due to the presence of more carboxyl groups on the surface of the carbon dots, which led to a chemical reaction on the surface of the carbon dots under strongly alkaline conditions, resulting in a weakening of their fluorescence intensity [23].

3.2. Effect of N, P-CDs on the growth of water spinach

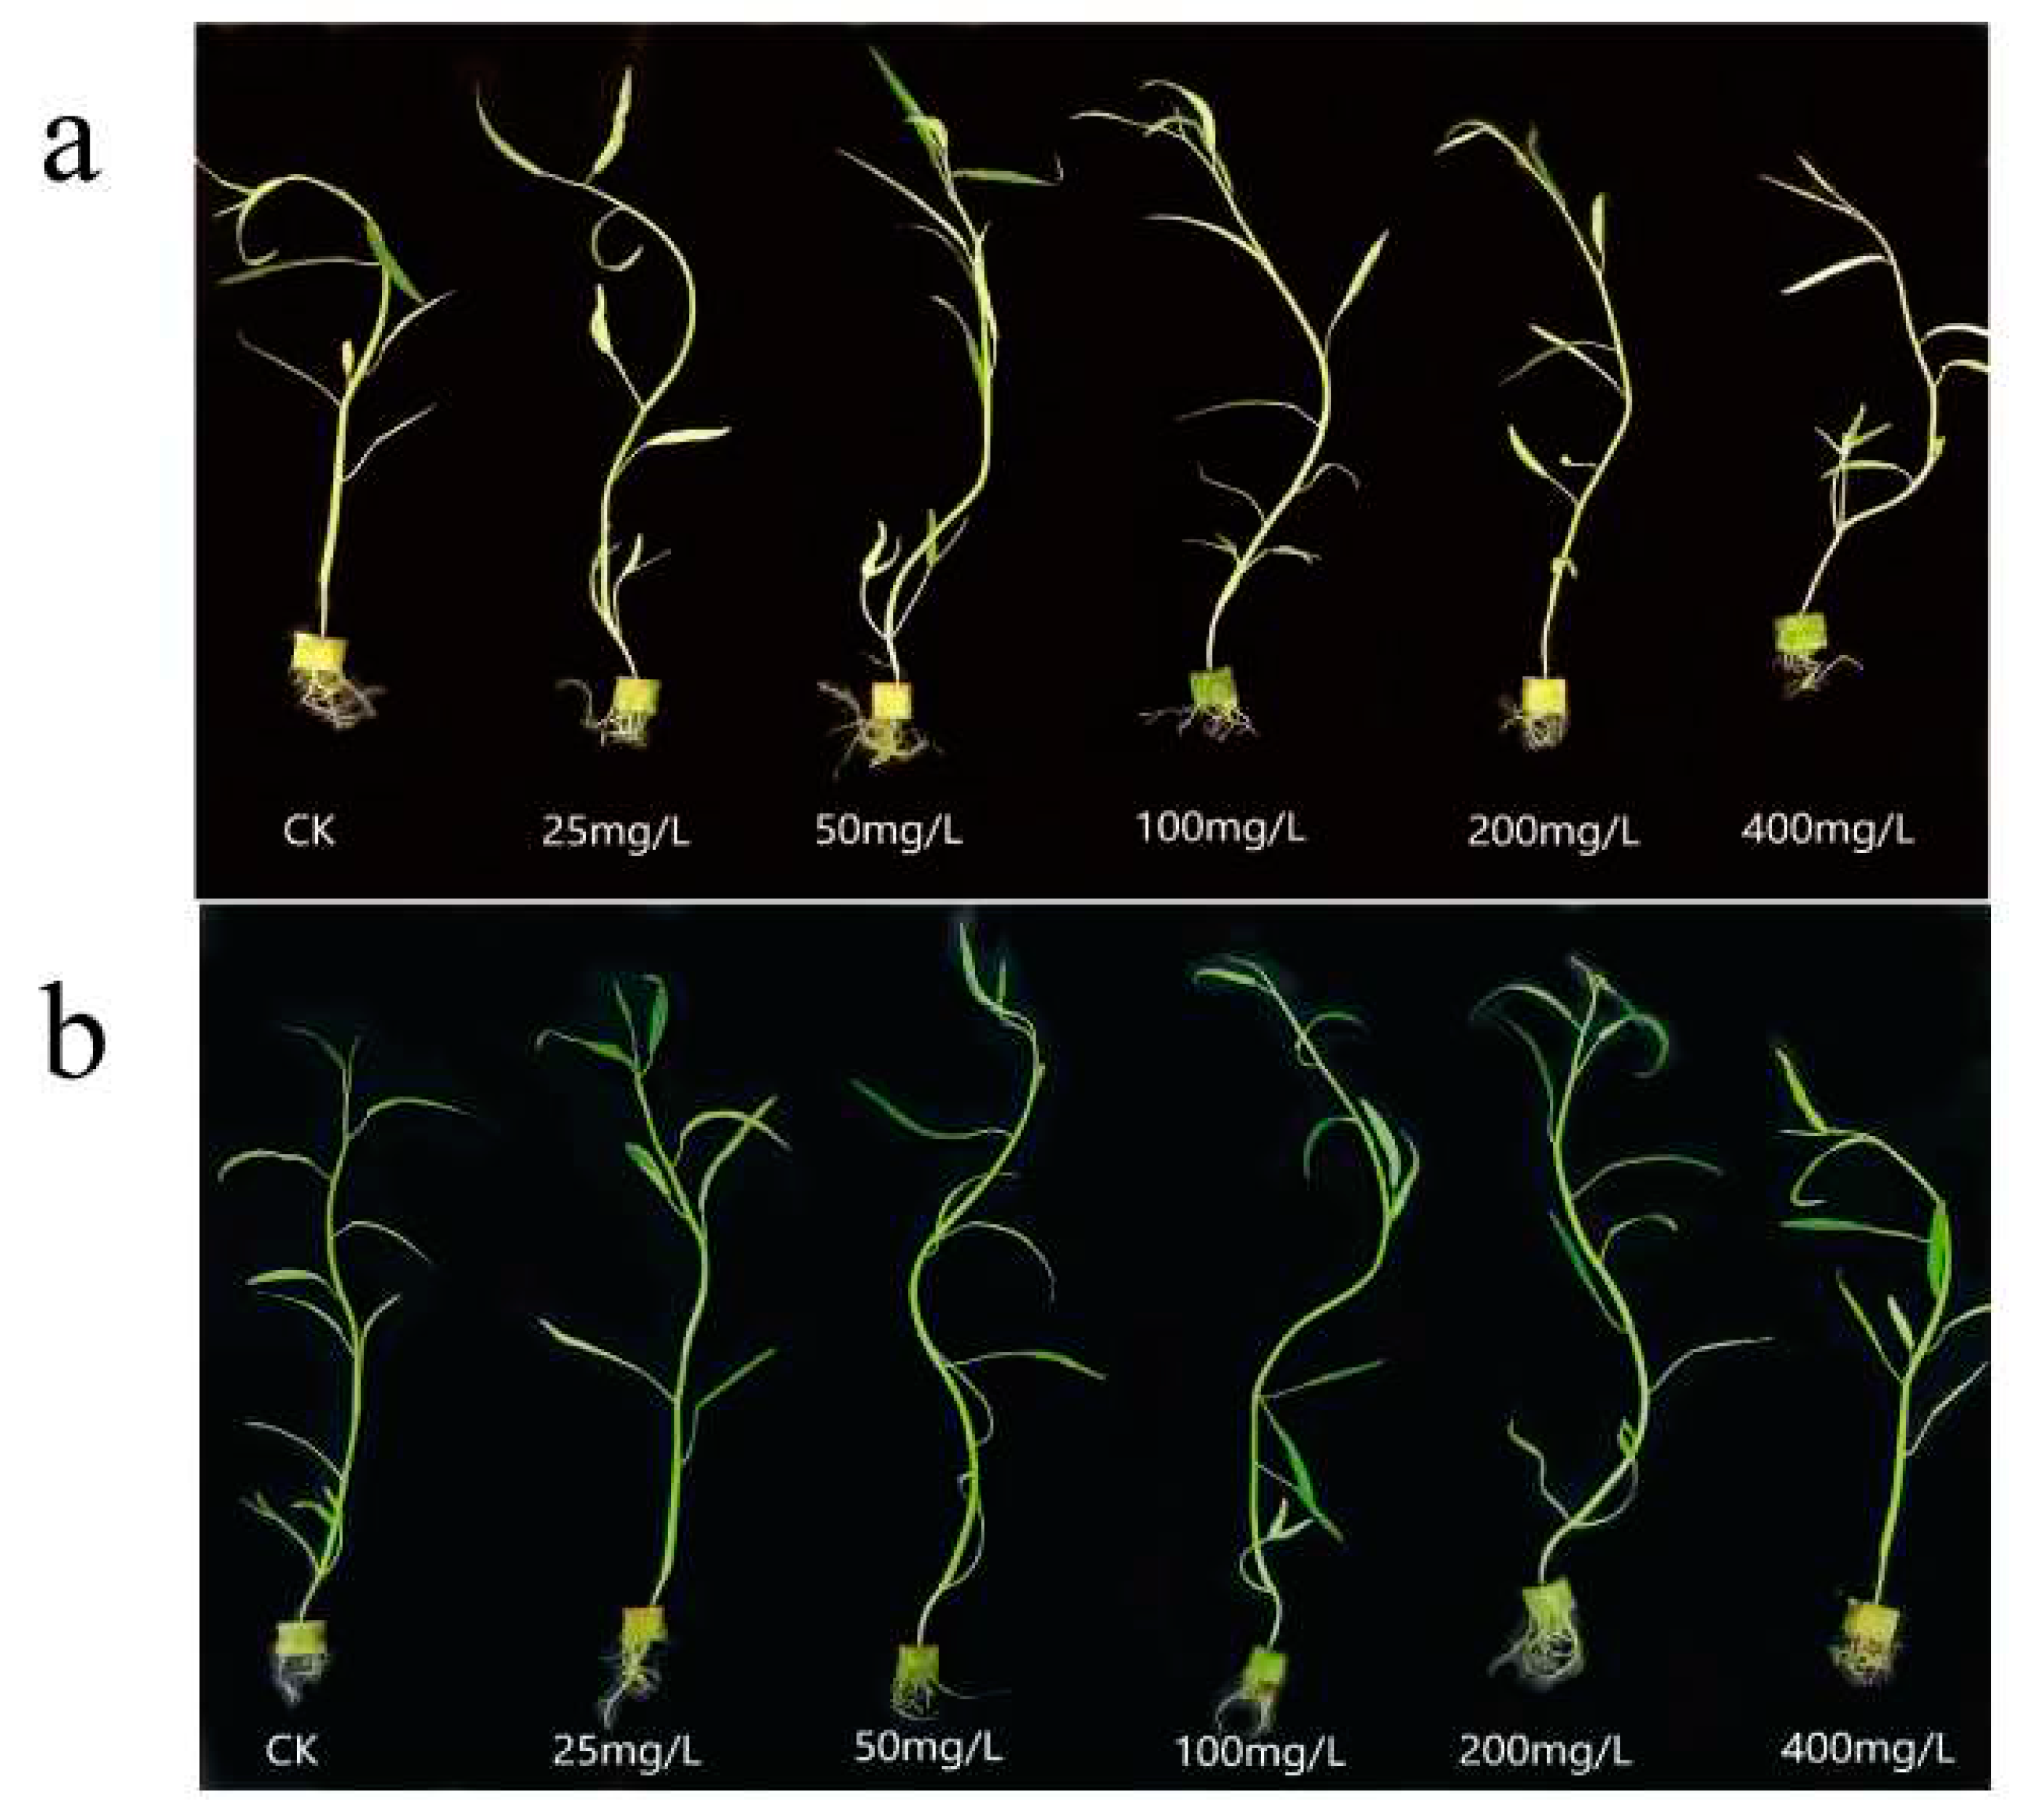
Figure 4 reflects the growth of water spinach at different N, P-CDs concentrations. We can see that at low concentrations of N, P-CDs, both treatments have a growth promoting effect on water spinach, while at a concentration of 200 mg/L, growth inhibition is shown.
As an edible vegetable, the leaves and stems of water spinach are the main part of the food, so it is particularly important to measure the parameters related to the thickness of the leaves and stems. Table S1 shows the values of the morphological indicators of water spinach after the leaf spraying treatment. It can be observed that the mean values of plant height, stem thickness, maximum functional leaf area, and the number of leaves of water spinach increase first and then decrease when further increase the concentration of N, P-CDs is. Water spinach treated with 50 mg/L N, P-CDs solution showed the best performance, with significantly higher mean values of stem thickness and the number of leaves than the blank group (P < 0.05). Table S2 shows the values of each morphological index of water spinach after the root spraying treatment. Similar to the results of the leaf spraying method, all indicators of water spinach improved at low concentrations of N, P-CDs solution, while most of the indicators of water spinach treated at high concentrations were lower than those of the blank group.
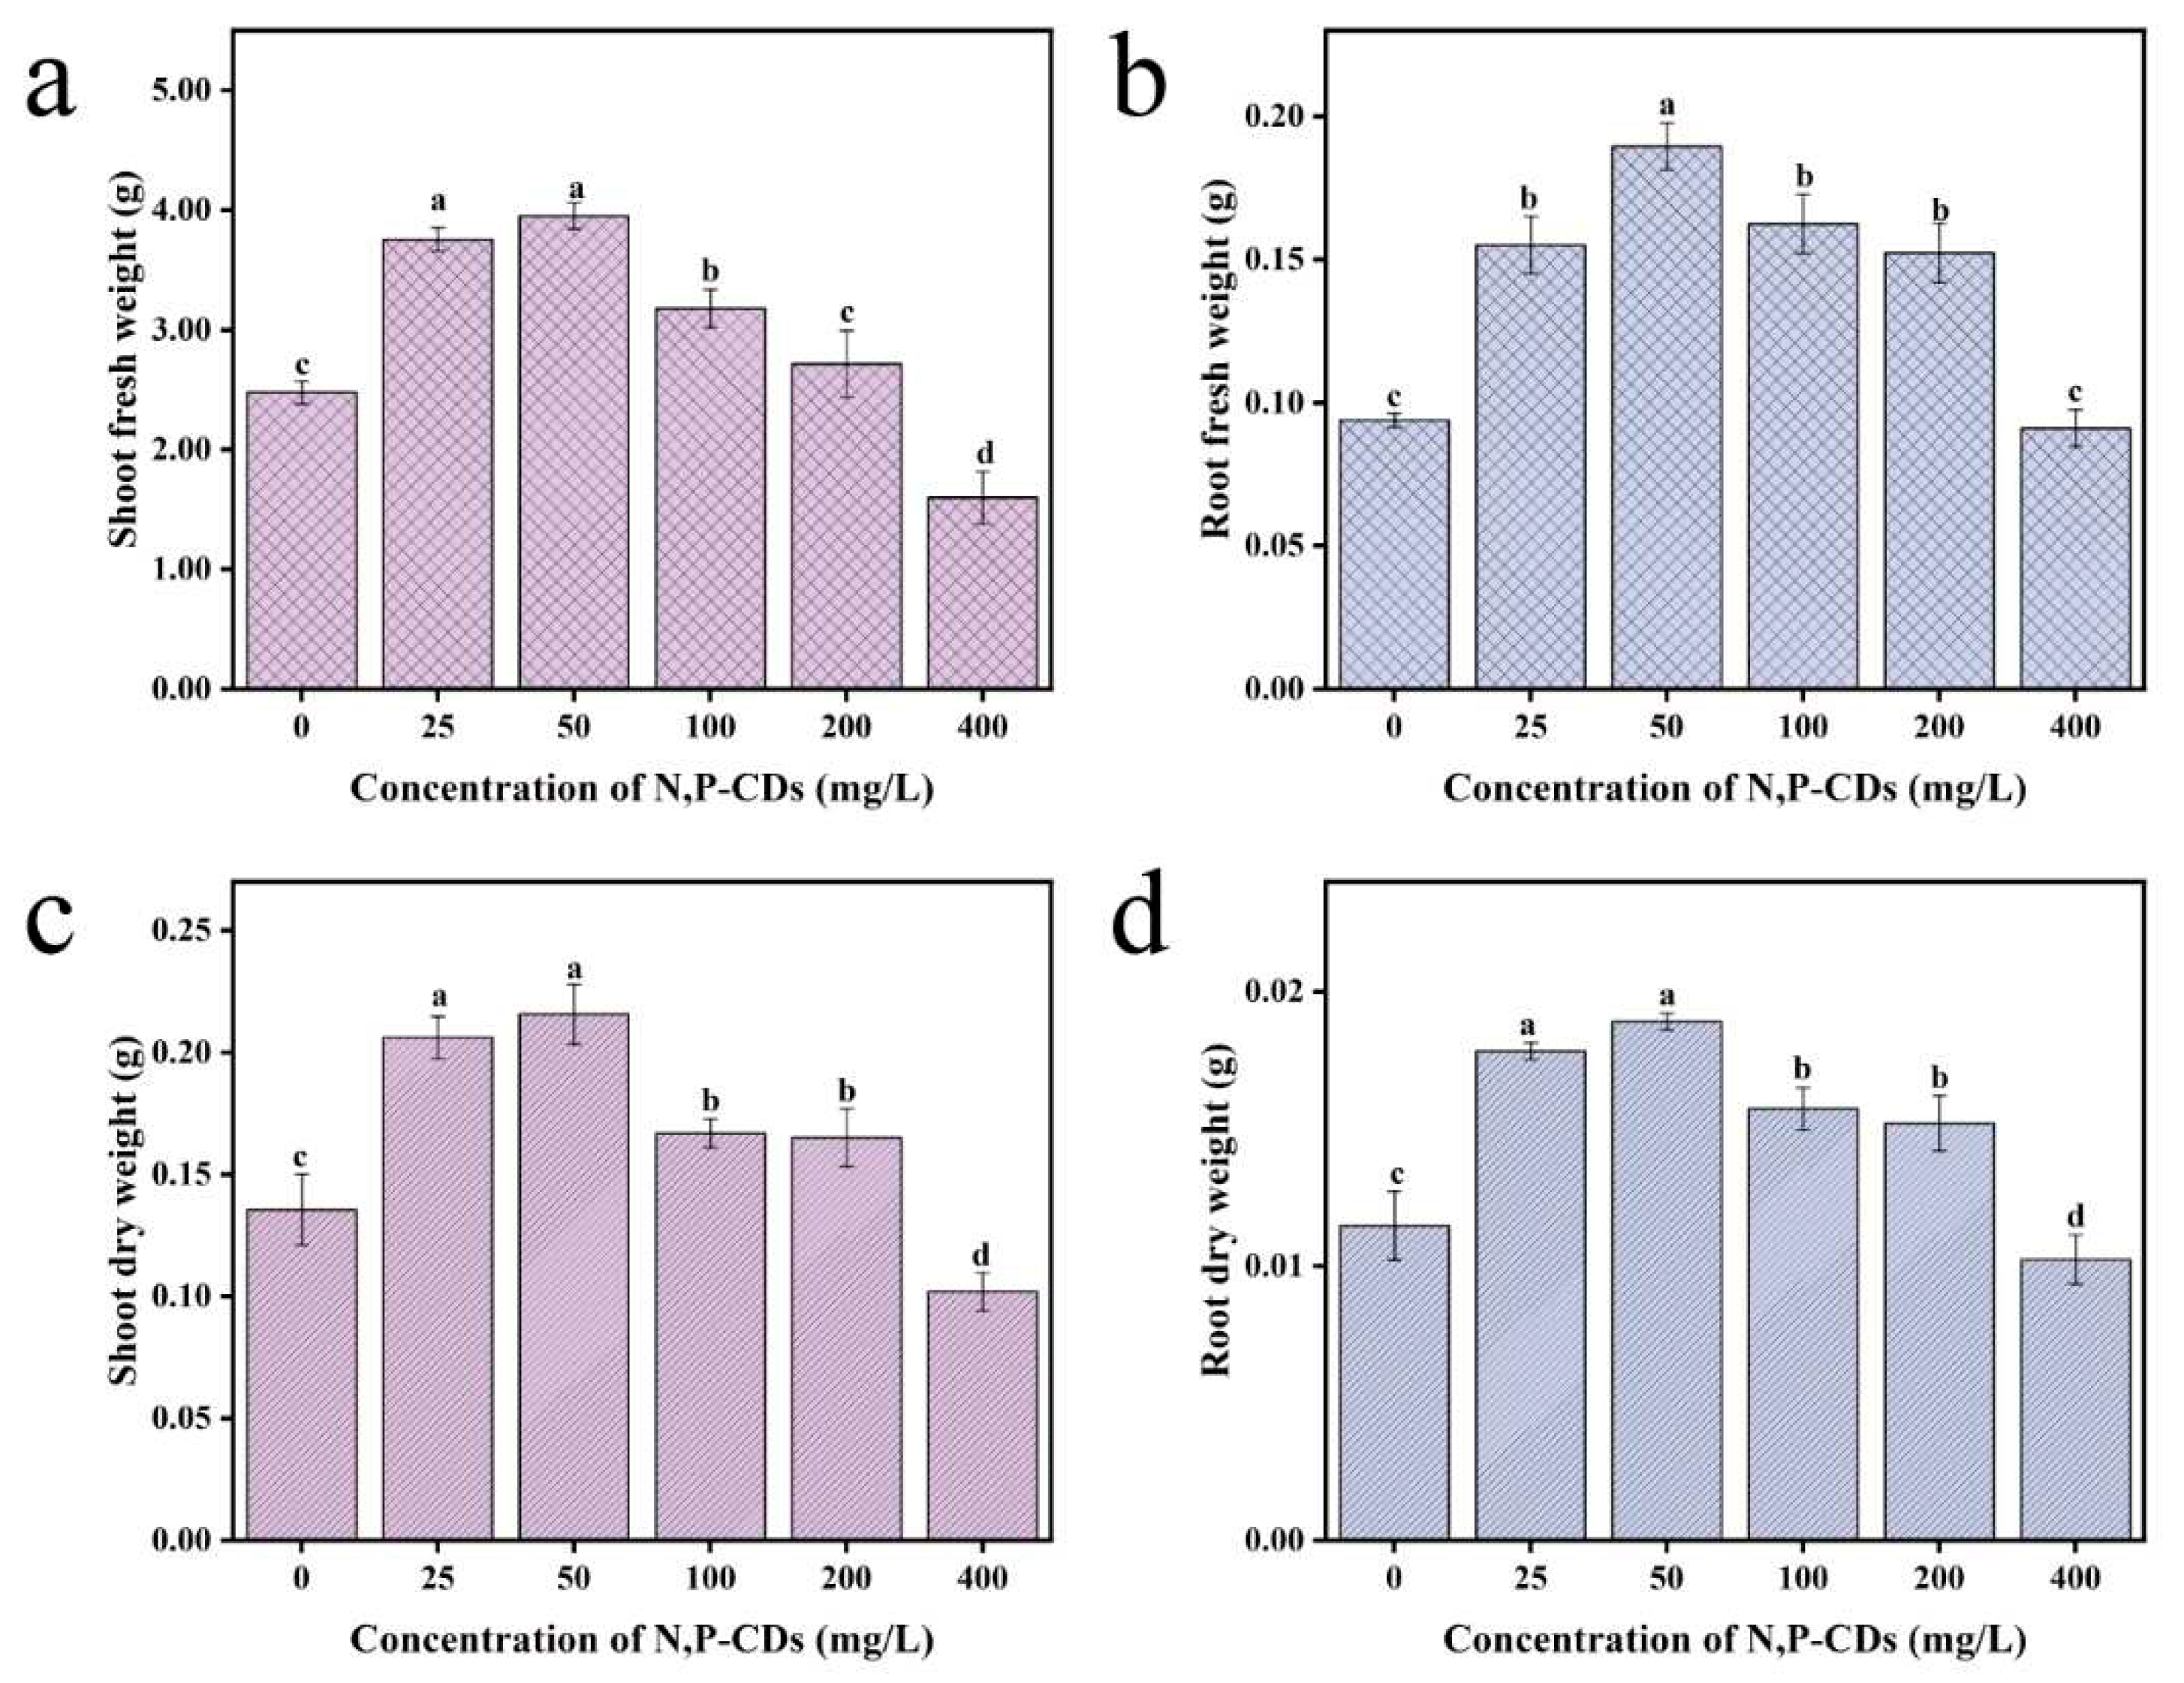
Usually, the amount of plant growth is the main indicator to evaluate the growth status of a plant and the plant's dry weight reflects the accumulation of organic matter in the plant. To investigate whether N, P-CDs can influence the extent of organic matter accumulation in water spinach. The results of the leaf spraying of N, P-CDs are shown in Figure 5. At 50 mg/L treatment, the fresh weight of the stem and leaf parts of water spinach increased by 59.50 % compared to the blank group. The fresh weight of the root part, dry weight of the stem and leaf part, and dry weight of the root part of water spinach were improved by 101.71 %, 59.03 %, and 64. 78 %, respectively, under the treatment of 50 mg/L (P < 0.05). The results of N, P-CDs applied to the root system are shown in Figure 6. At 100 mg/L, the fresh weight of stems and leaves of water spinach increased by 90.37 % compared to the blank group, and the difference was particularly significant (P < 0.05). The fresh weight of the root part, dry weight of the stem and leaf part, and dry weight of the root part of water spinach were elevated by 104.91 %, 67.32 %, and 68.88 %, respectively, under the treatment of 100 mg/L compared with the blank group. Taken together, the above experiments showed that the different cultivation methods were able to increase the dry weight of water spinach at low concentrations of N, P-CDs. The increase in fresh weight of the stem and leaf parts of water spinach was much greater with the root spraying method than with the leaf spraying method. The difference in dry weight increase between the two cultivation methods was not significant.
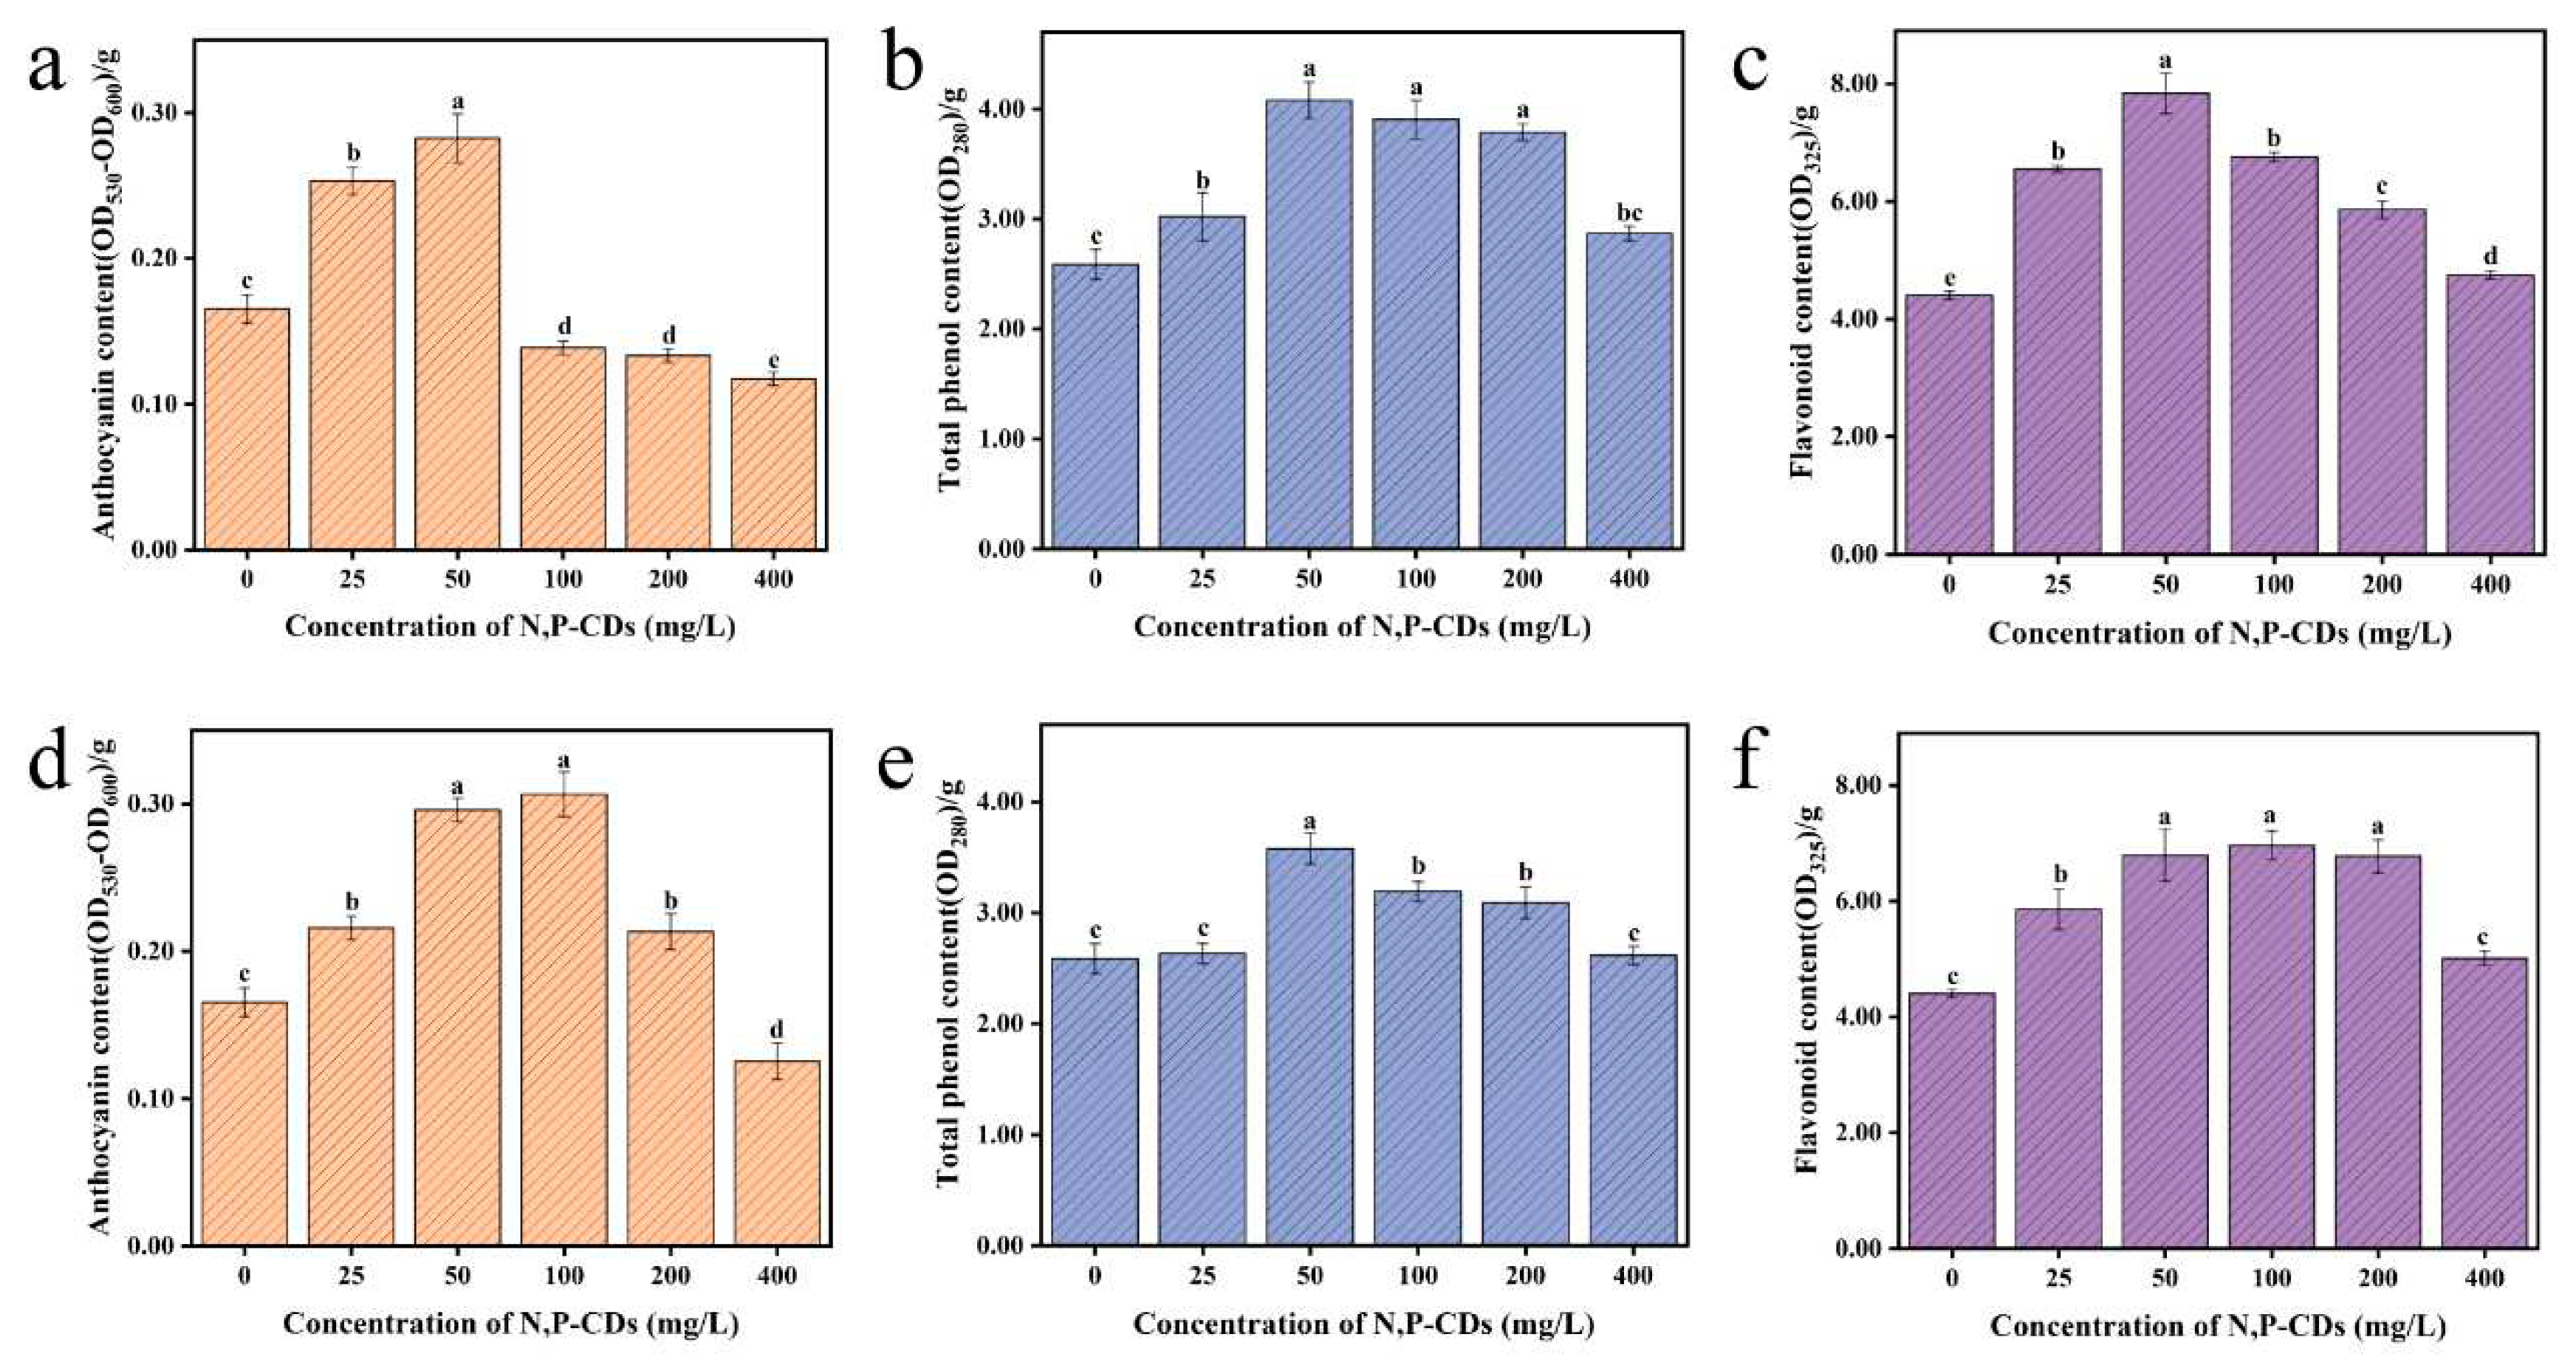
The anthocyanins, flavonoids, and total phenols in plants have free radical scavenging, antioxidant, and detoxifying properties. Therefore, measuring the content of anthocyanins, flavonoids and total phenols in a plant can evaluate the nutritional quality of the plant. Figure 7a–c show the anthocyanin, total phenol, and flavonoid content of water spinach after leaf spraying. At 50 mg/L treatment, the anthocyanin content increased by 70.97 %, with significant variability between each treatment group (P < 0.05). It was observed that the anthocyanin content gradually decreased with increasing concentration of the carbon dots solution. The maximum value of total phenols was reached at 50 mg/L treatment, with an increase of 57.78 % compared to the blank group, with a significant difference between the blank groups (P < 0.05). The content of flavonoids reached a maximum of 50 mg/L, with an increase of 77.95 % compared to the blank group and a significant difference compared to the other treatment groups (P < 0.05). Figure 7d–f show the anthocyanin, total phenol, and flavonoid content of water spinach after root spraying. The maximum anthocyanin content was reached under the 100 mg/L treatment with an increase of 85.49 % compared to the blank group, with significant differences from the blank group (P < 0.05). Total phenolic content reached a maximum at 50 mg/L treatment with an increase of 38.40 % compared to the blank group, with significant differences in each treatment group (P < 0.05). Flavonoid content reached a maximum at 100 mg/L treatment, with an increase of 58.08 % compared to the blank group, which was significantly different from the blank group (P < 0.05).
Combined with the above experiments, we found that N, P-CDs were effective in enhancing the anthocyanin, total phenol, and flavonoid content of water spinach. It is known that phenylalanine can be converted into other metabolites such as phenols, anthocyanins, flavonoids, and isoflavones through various enzymatic reactions [24]. Phenylalanine ammonia-lyase (PAL) as a key enzyme in the phenylalanine metabolic pathway can influence the number of phenolic compounds produced from phenylalanine [25]. Anthocyanins are a type of flavonoid and have several reactions in common with flavonoids in their synthetic pathway [26]. The synthesis of flavonoids in plants is regulated by a combination of enzymes. However, the enzymes that mainly affect the reaction rate are chalcone synthase (CHS) and chalcone isomerase (CHI). The two enzymes affect the content of chalcone and naringenin and other substances, respectively, and the synthesis of anthocyanins in plants requires naringenin and other substances as precursors to synthesize [27]. The flavonoid and anthocyanin contents of water spinach showed approximately the same trend in the experiment, and thus we propose the following mechanism: N, P-CDs can affect the activity of PAL and CHS, and the enhanced activity of PAL and CHS increases the flavonoid and total phenolic contents of water spinach. In addition, we found that the experimental results obtained with water spinach cultivated by leaf spraying and root spraying were not the same, which was attributed to the different ways carbon dots were transported in the plant. When treated with root spraying, the presence of a large number of groups on the surface of the carbon dots causes a positive charge to be attached to their surface, creating an electrostatic attraction with the negative charge on the surface of the plant roots [28]. This promotes a large uptake of carbon dots at the root surface. The carbon dots that enter the plant's interior pass through the vascular system through the plant's roots, stems, and leaves and eventually reach the leaf veins [11]. During this transport process some of the carbon dots are broken down by the roots, stems, and leaves of the plant, and the decomposition produces phytohormone analogs which have a growth-promoting effect on the plant[19]. However, when treated by leaf spraying, the carbon dots can enter the plant's leaf veins directly, avoiding the loss of carbon dots during transport.

3.3. Effect of N, P-CDs on photosynthetic properties of water spinach

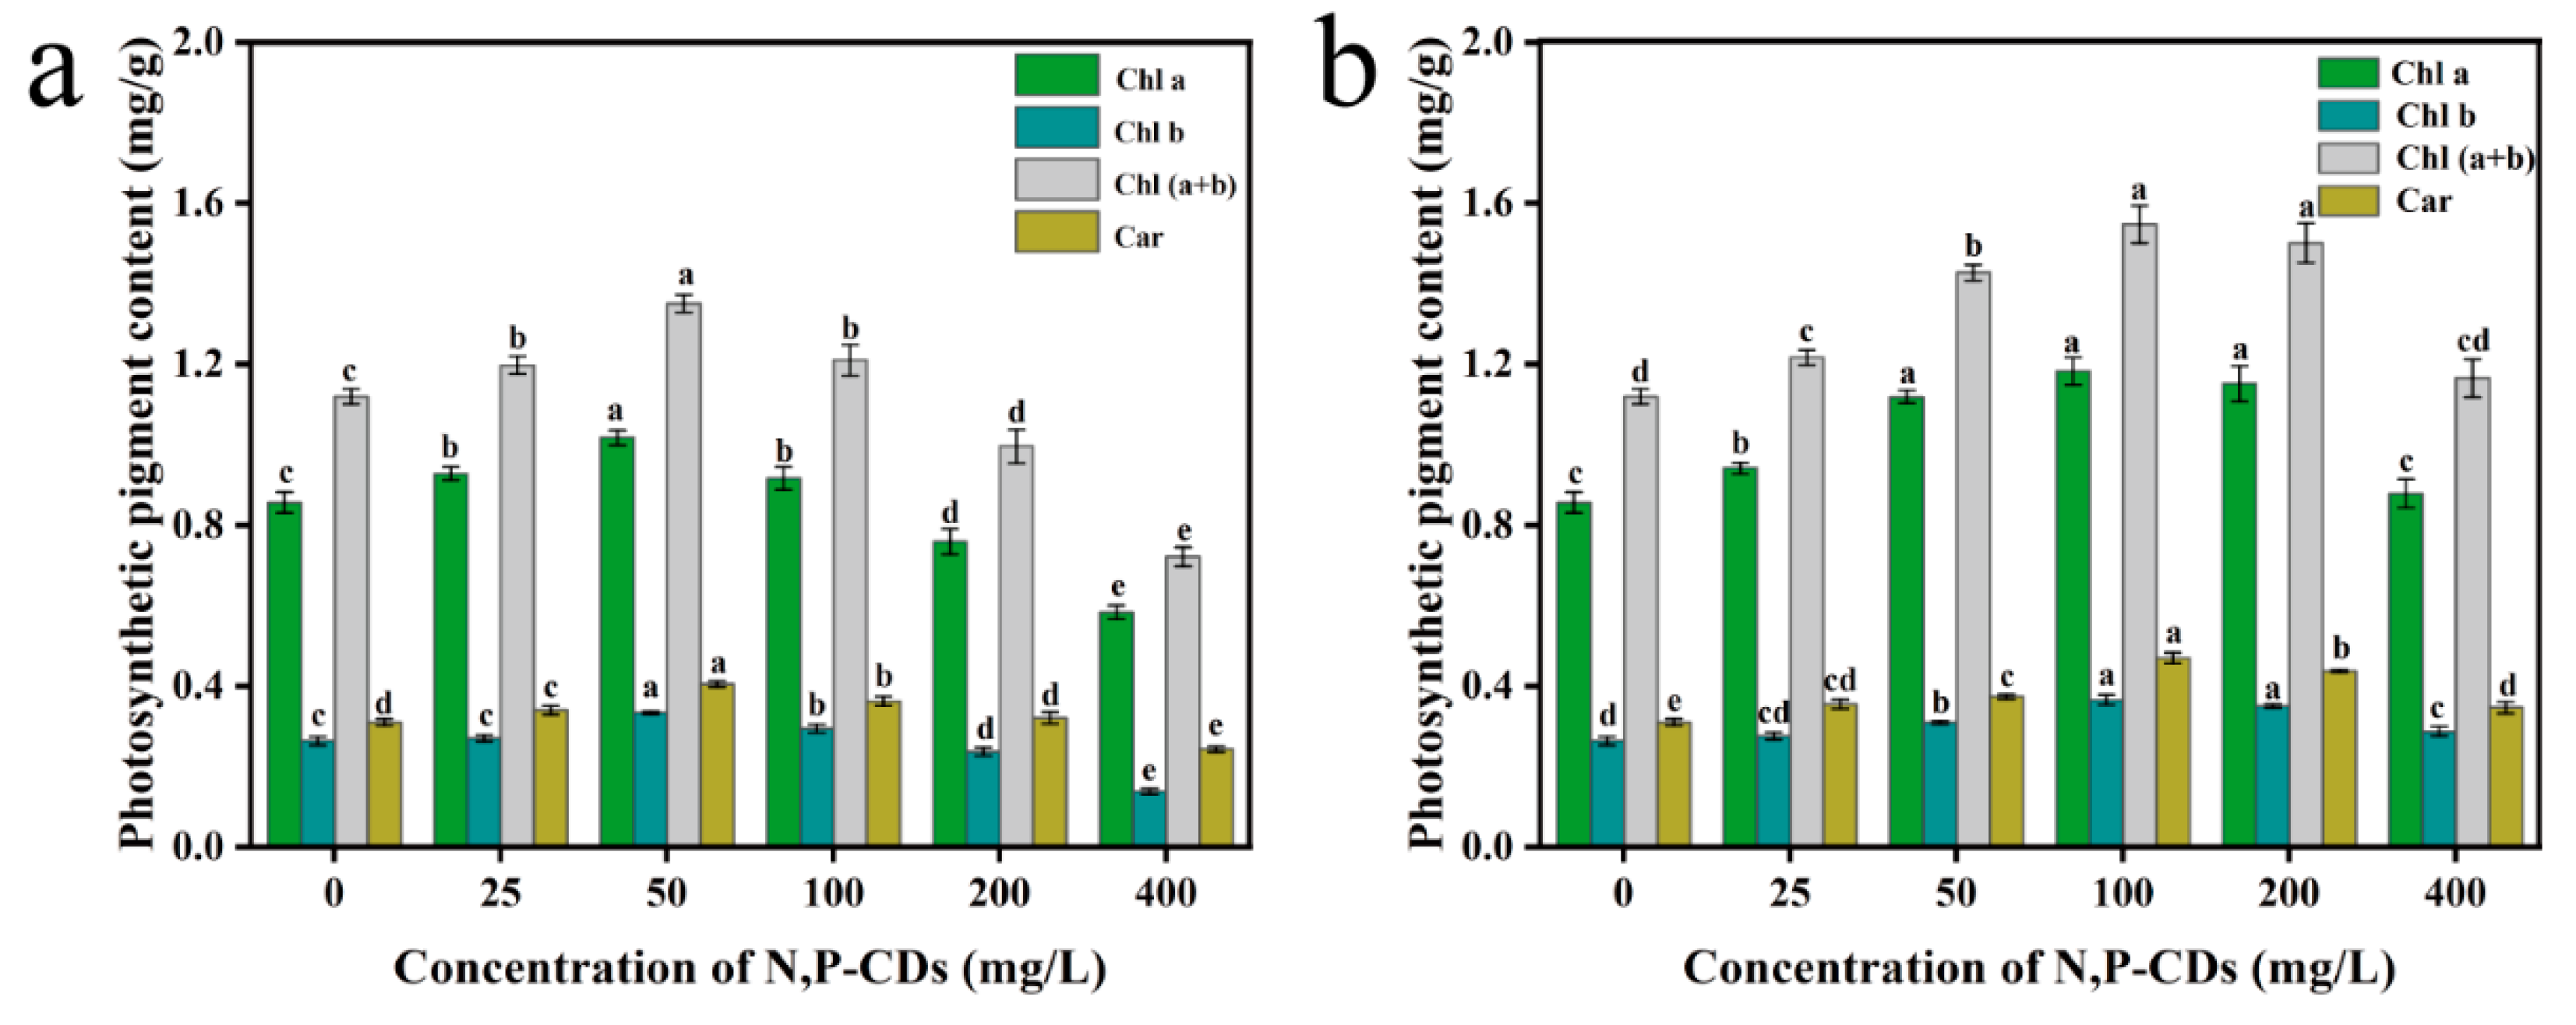
Photosynthetic pigments absorb and transmit light energy during photosynthesis in plants. The number of photosynthetic pigments greatly influences the photosynthetic rate of plants [29]. We measured the chlorophyll a, chlorophyll b, chlorophyll (a+b), and carotenoid contents in water spinach. Figure 8a shows the photosynthetic pigment content of the leaves after the application of the modal treatment. Compared to the blank group, chlorophyll a, chlorophyll b, chlorophyll (a+b) and carotenoids content were the most effective under the 50 mg/L treatment, with an increase of 18.84 %, 26.61 %, 20.67 %, and 30.62 %, respectively, with significant differences with the other treatment groups (P < 0.05). Figure 8b shows the content of each photosynthetic pigment in the root spraying method treatment. Compared to the blank group, chlorophyll a, chlorophyll b, chlorophyll (a+b) and carotenoid content were the most effective in the 100 mg/L treatment, with an increase of 38.17 %, 38.67 %, 38.29 %, and 51.54 %, respectively. We found that N, P-CDs increased the photosynthetic pigment content in water spinach under different spraying methods. The leaf spraying method was generally less effective than the root spraying method in enhancing photosynthetic pigment content.
Plants convert solar energy into chemical energy through photosynthesis and use it to synthesize organic matter for their growth, so the rate of photosynthesis reflects the extent of plant growth. To understand the effect of different culture methods on the photosynthetic parameters of water spinach, we measured the values of net photosynthetic rate Pn, Gs, Ci, and Tr, as shown in Figure S1 and Figure 2 in supporting information. The experimental results showed that the Pn value of water spinach treated with the leaf spraying method increased by 108.27 % at 50 mg/L compared to the blank group, which was a considerable increase. Compared to the blank group, Gs, Ci, and Tr values increased by 46.61 %, 40.99 %, and 71.52 % at 50 mg/L, respectively, and all four data were different from the blank group (P < 0.05). Compared to the blank group, water spinach treated with the root spraying method increased 131.96 %, 53.93 %, 50.50 %, and 88.66 % in Pn, Gs, Ci, and Tr values at 100 mg/L, respectively. All four data of this group were different from the blank group (P < 0.05).
Photosynthesis is usually divided into two parts: the light reaction and the dark reaction. During the dark reaction, CO2 is reduced to organic matter through the Calvin cycle, a process that requires the consumption of adenosine triphosphate (ATP). The light reaction produces 2.57 ATP and 2 nicotinamide adenine dinucleotide phosphate ‘NADPH’ through electron transfer, while CO2 fixation requires 3 ATP and 2 NADPH, indicating an imbalance in the supply of substances for this light and dark reactions [30]. Combined with the above experiments, it was believed that N, P-CDs increased the content of photosynthetic pigments in water spinach, generating more photons for the chloroplast and thus increasing the light reaction rate. With the increase of the light reaction rate, a large amount of ATP and NADPH were produced to break this imbalance of supply and demand. In addition, the increase in net photosynthetic rate led to a corresponding increase in the stomatal conductance of water spinach. The increase in Ci values in water spinach can be attributed to the entry of carbon dots into the plant, some of which are degraded by horseradish peroxidase ‘HRP’ and H2O2 in the plant to produce CO2[19]. Studies have shown that plant water channel proteins can affect plant transpiration by regulating internal plant water [31]. Considering that the carbon dots can activate the expression of genes encoding water channel proteins, we speculate that the increased Tr value of water spinach is related to the expression of genes encoding water channel proteins [15].

4. Conclusion

In summary, we have successfully synthesized novel kinds of N, P-CDs. The average particle size of this carbon dot is about 6.21 nm, and it can maintain high stability for a long time under UV light and other conditions. FT-IR spectroscopy and XPS confirmed that it contains a large number of amino and hydroxyl structures, which give it excellent water solubility properties. The N, P-CDs were applied in the growth process of water spinach by root and leaf spraying. It was demonstrated that N, P-CDs were effectively absorbed by water spinach, enhanced the photosynthesis process by increasing the photosynthetic pigment content in the plant, and eventually promoted the growth of the plant. Also, we found that leaf spraying has a similar promotion effect with root spraying yet it is more effective because of the more efficient transport of N, P-CDs into the plant by leaf spraying.. This work suggests that N, P-CDs provide a new avenue for future agricultural production applications.

Disclosure statement

No potential conflict of interest was reported by the author(s).

Author Contributions

Fan Yu, Mengqi She, and Xia Cai experimented. Fan Yu wrote the manuscript. Xiaoyan Li contributed to the revision of the draft; Yuan Huang, Zuojun Tan, and Hongwei Lei reviewed and edited the manuscript.. All authors have read and agreed to the published version of the manuscript.

Data availability statement

The data presented in this study are available on request from the corresponding author.

Acknowledgment

This work was supported by Huazhong Agricultural University/Agricultural Genomics Institute of Shenzhen Chinese Academy of Agricultural Sciences Cooperation Fund (SZYJY2022006), The Fundamental Research Funds for the Central Universities (Grant No. 2662020LXPY008, 2662022YLYJ010, 2662023LXPY006) and the Open Foundation of Hubei Key Laboratory of Optical Information and Pattern Recognition of Wuhan Institute of Technology (Grant No. 202103).

References

  1. Kalala, G., et al., Characterization of fructans and dietary fiber profiles in raw and steamed vegetables. International Journal of Food Sciences and Nutrition, 2017. 69(6): p. 682-689.
  2. Calatayud, M., et al., Comparative Effect of 22 Dietary Sources of Fiber on Gut Microbiota of Healthy Humans in vitro. Frontiers in Nutrition, 2021. 8.
  3. Manzoor, J., M. Sharma, and K.A. Wani, Heavy metals in vegetables and their impact on the nutrient quality of vegetables: A review. Journal of Plant Nutrition, 2018. 41(13): p. 1744-1763.
  4. Scharff, L.B.; Saltenis, VLR; Jensen, PE; Baekelandt, A; Burgess, AJ; Burow, M; Ceriotti, A; Cohan, JP; Geu-Flores, F; Halkier, BA; Haslam, RP; Inze, D; Lankhorst, RK; Murchie, EH; Napier, JA; Nacry, P; Parry, MAJ; Santino, A; Scarano, A; Sparvoli, F; Wilhelm, R; Pribil, M., Prospects to improve the nutritional quality of crops. Food and Energy Security, 2021. 11(1).
  5. Li, S., et al., The development of carbon dots: From the perspective of materials chemistry. Materials Today, 2021. 51: p. 188-207.
  6. Khayal, A., et al., Advances in the Methods for the Synthesis of Carbon Dots and Their Emerging Applications. Polymers (Basel), 2021. 13(18).
  7. Xia, C., et al., Evolution and Synthesis of Carbon Dots: From Carbon Dots to Carbonized Polymer Dots. Adv Sci (Weinh), 2019. 6(23): p. 1901316.
  8. Hallaji, Z., et al., Fluorescent carbon dot as an optical amplifier in modern agriculture. Sustainable Materials and Technologies, 2022. 34.
  9. Zhang, M., et al., One-step hydrothermal synthesis of chiral carbon dots and their effects on mung bean plant growth. Nanoscale, 2018. 10(26): p. 12734-12742.
  10. Su, L.-X., et al., Carbon Nanodots for Enhancing the Stress Resistance of Peanut Plants. ACS Omega, 2018. 3(12): p. 17770-17777.
  11. Li, W., et al., Phytotoxicity, Uptake, and Translocation of Fluorescent Carbon Dots in Mung Bean Plants. ACS Appl Mater Interfaces, 2016. 8(31): p. 19939-45.
  12. Cao, J., W. Jiang, and Y. Zhao, Postharvest physiological and biochemical experimental guidance for fruits and vegetables. 2007: Postharvest physiological and biochemical experimental guidance for fruits and vegetables.
  13. Yu, S.-j., et al., Nitrogen and phosphorus co-doped carbon dots for developing highly flame retardant poly (vinyl alcohol) composite films. European Polymer Journal, 2022. 164.
  14. Perikala, M. and A. Bhardwaj, Engineering Photo-Luminescent Centers of Carbon Dots to Achieve Higher Quantum Yields. ACS Applied Electronic Materials, 2020. 2(8): p. 2470-2478.
  15. Kou, E., et al., Regulation Mechanisms of Carbon Dots in the Development of Lettuce and Tomato. ACS Sustainable Chemistry & Engineering, 2021. 9(2): p. 944-953.
  16. Ju, Y.J., et al., Proton-controlled synthesis of red-emitting carbon dots and application for hematin detection in human erythrocytes. Anal Bioanal Chem, 2019. 411(6): p. 1159-1167.
  17. Zhao, D., et al., Rapid and low-temperature synthesis of N, P co-doped yellow emitting carbon dots and their applications as antibacterial agent and detection probe to Sudan Red I. Mater Sci Eng C Mater Biol Appl, 2021. 119: p. 111468.
  18. Li, Y. , et al., Carbon dots as light converter for plant photosynthesis: Augmenting light coverage and quantum yield effect. J Hazard Mater, 2021. 410: p. 124534.
  19. Shao, D., et al., Inorganic vacancy-ordered perovskite Cs2SnCl6:Bi/GaN heterojunction photodiode for narrowband, visible-blind UV detection. Applied Physics Letters, 2019. 115(12).
  20. Fan H, Y.H., Lv J, Chen W, Dong X, Bian W., Preparation of nitrogen and phosphorus co-doped carbon dots and its application for morin detection. Chemical Research and Application, 2018. 30(4): 577-582.
  21. Chen, J., et al., Red-Emissive Carbon Dots for Fingerprints Detection by Spray Method: Coffee Ring Effect and Unquenched Fluorescence in Drying Process. ACS Appl Mater Interfaces, 2017. 9(22): p. 18429-18433.
  22. Li, L. and T. Dong, Photoluminescence tuning in carbon dots: surface passivation or/and functionalization, heteroatom doping. Journal of Materials Chemistry C, 2018. 6(30): p. 7944-7970.
  23. Fan, H.-J., et al., One-step Synthesis of Specific pH-responsive Carbon Quantum Dots and Their Luminescence Mechanism. Journal of Inorganic Materials, 2019. 34(12).
  24. Hu, W., et al., Biosynthesis of Phenolic Compounds and Antioxidant Activity in Fresh-Cut Fruits and Vegetables. Front Microbiol, 2022. 13: p. 906069.
  25. Christopoulos, M.V. and E. Tsantili, Participation of phenylalanine ammonia-lyase (PAL) in increased phenolic compounds in fresh cold stressed walnut (Juglans regia L.) kernels. Postharvest Biology and Technology, 2015. 104: p. 17-25.
  26. Sunil, L. and N.P. Shetty, Biosynthesis and regulation of anthocyanin pathway genes. Appl Microbiol Biotechnol, 2022. 106(5-6): p. 1783-1798.
  27. Liu, W., et al., The Flavonoid Biosynthesis Network in Plants. Int J Mol Sci, 2021. 22(23).
  28. Lu, H.-l. , et al., Plants alter surface charge and functional groups of their roots to adapt to acidic soil conditions. Environmental Pollution, 2020. 267.
  29. Simkin, A.J., et al., The role of photosynthesis related pigments in light harvesting, photoprotection and enhancement of photosynthetic yield in planta. Photosynth Res, 2022. 152(1): p. 23-42.
  30. Zhou, J., et al., Introducing extra NADPH consumption ability significantly increases the photosynthetic efficiency and biomass production of cyanobacteria. Metab Eng, 2016. 38: p. 217-227.
  31. Maurel, C., L. Verdoucq, and O. Rodrigues, Aquaporins and plant transpiration. Plant Cell Environ, 2016. 39(11): p. 2580-2587.
Figure 1. (a)Fluorescence spectra of N, P-CDs at different wavelengths Images under daylight and 530 nm UV light.(b)UV absorption spectra of N, P-CDs. (c)TEM images of N, P-CDs. (d)HRTEM picture of N, P-CDs. (e)Histogram of the size distribution of N, P-CDs.
Preprints 78689 g001
Figure 2. (a)Infrared spectra of N, P-CDs .(b)Full XPS spectrum of N, P-CDs. (c)C 1s scan. (d)N 1s scan. (e)O 1s scan. (f)P 2p scan.
Preprints 78689 g002
Figure 3. Stability of N, P-CDs. (a)Under UV light irradiation. (b)Under different concentrations of NaCl. (c)At different pH.
Preprints 78689 g003
Figure 4. (a)Water spinach with carbon dots applied to the leaves. (b)Water spinach with carbon dots applied to the root system.
Preprints 78689 g004
Figure 5. After treatment with leaf spraying(a)Fresh weight chart of water spinach stems and leaves. (b)Fresh weight chart of water spinach root. (c)Dry weight chart of water spinach stems and leaves. (d)Dry weight chart of water spinach roots.
Preprints 78689 g005
Figure 6. After root spraying treatment(a)Fresh weight chart of water spinach stems and leaves. (b)Dry weight chart of water spinach stems and leaves. (c)Fresh weight chart of water spinach root. (d)Dry weight chart of water spinach roots.
Preprints 78689 g006
Figure 7. After leaves spraying treatment(a)Graph of anthocyanin content in water spinach. (b)Graph of total phenolic content in water spinach. (c)Graph of flavonoid content in water spinach After root spraying treatment. (d)Graph of anthocyanin content in water spinach. (e)Graph of total phenolic content in water spinach. (f)Graph of flavonoid content in water spinach.
Preprints 78689 g007
Figure 8. (a)Photosynthetic pigment content of water spinach under leaf spraying treatment. (b)Photosynthetic pigment content of water spinach under root spraying treatment.
Preprints 78689 g008
Disclaimer/Publisher’s Note: The statements, opinions and data contained in all publications are solely those of the individual author(s) and contributor(s) and not of MDPI and/or the editor(s). MDPI and/or the editor(s) disclaim responsibility for any injury to people or property resulting from any ideas, methods, instructions or products referred to in the content.
Copyright: This open access article is published under a Creative Commons CC BY 4.0 license, which permit the free download, distribution, and reuse, provided that the author and preprint are cited in any reuse.
Prerpints.org logo

Preprints.org is a free preprint server supported by MDPI in Basel, Switzerland.

Subscribe

© 2024 MDPI (Basel, Switzerland) unless otherwise stated