1. Introduction
Porcine epidemic diarrhea virus (PEDV), is an intestinal coronavirus that targets the small intestinal epithelial cells of pigs. It causes damage to the small intestinal epithelial tissue, inducing intestinal congestion, swelling, and watery diarrhea in pigs, which leads to anorexia and body wasting in fattening pigs and high mortality rate in suckling piglets [
1]. In recent years, with the emergence of new PEDV variant strains, PED broke out again globally, especially in Asian countries, causing great economic loss [
2,
3].
As a porcine enteric virus, PEDV belongs to α coronavirus and is a positive-sense single-stranded RNA virus [
4]. The total length of the virus genome is 28 kb, containing ORF1a, ORF1b, spike protein (S), accessory protein ORF3, envelope protein (E), membrane protein (M) and nucleocapsid protein (N) genes [
4]. The S protein encoded by S gene consists of two domains S1 and S2, with the interaction between S1 and host cell receptors as the first step of infection and the main determinant of viral anisotropy [
5]. Besides, PEDV encodes two large polyproteins pp1a and pp1ab. By the protease activity of Nsp3 and Nsp5, these two large polyproteins are further processed into 16 non-structural proteins, Nsp1 to Nsp16 [
6]. In addition to its genetic diversity, PEDV has also evolved a variety of strategies to antagonize host innate antiviral defense for successful infections [
7].
The innate immune system is known to be the first line of defense against infection caused by pathogens [
8]. Pathogenic microorganisms produce conserved molecules called pathogen associated molecular patterns (PAMPs) when they invade the organism or replicate in the host organism [
8]. Host cells express receptors for these molecules, named pattern recognition receptors (PRRs) which are composed of Toll-like receptors (TLRs), RIG-I-like receptors (RLRs), NOD-like receptors (NLRs), C-type lectin receptors (CLRs) and cytosolic DNA receptors (CDRs) [
9]. These receptors recognize PAMPs and activate intracellular cascade signaling pathways comprising of adaptors, kinases and transcription factors, ultimately initiating intracellular gene transcription or protease cleavage of cytokine precursors [
9]. Thus the produced antiviral interferons (IFNs), inflammatory factors and chemokines play an anti-infection role while profoundly influencing subsequent adaptive immune responses [
9,
10].
The mutual evolution of virus and innate immune response of host leads to significant viral diversification and enhanced host antiviral response [
11]. In the competition between viruses and host cells, many viruses, including coronaviruses, have evolved various strategies to evade or disrupt antiviral immunity, such as type I and type III interferons [
12]. There is increasing evidence that several PEDV proteins such as nsp1, nsp3, nsp5, nsp8, nsp14, nsp15, nsp16, E, M, and N can resist host IFN signaling [
13]. In addition, PEDV has been reported to inhibit IFN induction via different mechanisms [
13,
14]. As for the innate immunity for recognition and defense against PEDV, it has not been totally understood till now. In this study, we demonstrated that PEDV can activate multiple PRR mediated signaling pathways to induce the anti-PEDV activity. This study provides new insight into host innate immune responses against PEDV infection.
2. Materials and methods
PEDV permissive Vero cells, and HEK293T cells were cultured in Dulbecco’s Modified Eagle’s Medium (DMEM; Thermo Fisher Scientific, Waltham, MA USA) supplemented with 10% fetal bovine serum (FBS, Thermo Fisher Scientific) and 100 U/ml of penicillin plus 100 g/ml streptomycin. IPEC-DQ cells were cultured in Roswell Park Memorial Institute (RPMI) medium (Hyclone Laboratories, Logan, UT, USA) containing 10% FBS with penicillin/streptomycin. All cells were maintained at 37°C with 5% CO2 in a humidified incubator. The PEDV strain used in this study was a mutant strain of PEDV AJ1102 (GenBank: JX188454.1). The poly(I:C)-LMW, poly(I:C)-HMW, 2’3’-cGAMP and poly(dA:dT) were all obtained from InvivoGen (Hongkong, China). The mouse anti-GAPDH mAb, mouse anti-GFP mAb and mouse anti-β-Actin mAb were all brought from TransGen (Beijing, China). The mouse anti-MAVS mAb was from Santa Cruz Biotechnology (Dallas, Texas USA), rabbit anti-TRIF pAb was from Biodargon (Beijing, China) and rabbit anti-STING pAb was brought from Proteintech (Wuhan, China).
PEDV N gene amplified by PCR from PEDV cDNA using the primers shown in
Table 1 was inserted into the
EcoR V and
Sal I sites of pENTR4-2HA vector. The resultant recombinant pENTR4 vector was subjected for LR recombination with pDEST527 (Thermo Fisher Scientific) to construct the pDEST527-N prokaryotic expression vector. After induction at 25℃ for 12 h with 1 mM IPTG, the soluble N protein was expressed in transformed
E. coli (DE3/BL21). The expressed N protein was purified by nickel column according to the instructions of His-tag protein Purification Kit (Beyotime, China). The 6-week-old female BALB/c mice were immunized four times with each 30 μg purified N protein plus 1:1 immune adjuvant (QuickAntique-Mouse5w, Biodragon, China), by multiple injections subcutaneously in the back. The monoclonal antibody (mAb) of N protein was obtained by regular hybridoma technology from the immunized mice.
Total RNA of Vero cells after PEDV infection or agonist stimulation was extracted with TRIzol reagent (Thermo Fisher Scientific). The extracted RNA was reverse-transcribed into cDNA by HiScript®1st Strand cDNA Synthesis Kit (Vazyme, China). The qPCR were performed in 20 μL reaction with Cham Q Universal SYBR qPCR Master Mix (Vazyme, China) using StepOne Plus real-time PCR system (Applied Biosystems, Foster City, CA, USA). The qPCR primers were as shown in
Table 2. Results of the relative mRNA expression was calculated by 2
-ΔΔCt method, with β-Actin used as the internal reference control.
The treated cells were collected and lyzed in a RIPA buffer (50mM Tris pH 7.2, 150 mM NaCl, 1% sodium deoxycholate, 1% Triton X-100). The extracted whole cell protein was separated via SDS-PAGE, and then the protein in gel was transferred to PVDF membrane. The membrane was blocked with TBST solution containing 5% skim milk at room temperature for 1 h and incubated overnight at 4°C with mouse PEDV N mAb (1:1000) as specific primary antibody or other primary antibodies. Next, the membrane was washed with TBST 3 times with each 3-5 min, and then incubated with HRP-labeled goat anti-mouse or rabbit IgG (1:10000, Transgen Biotech, China) as the secondary antibody. The protein signals were visualized by using the imaging system (Tanon, China) with the ECL chemiluminescence detection system (Tanon, China) according to the manufacturer's instructions.
Vero cells cultured in 96-well plates were infected with PEDV in 10-fold continuous dilutions at 37 ℃ for 2 h, and the supernatants were replaced with fresh DMEM containing 2% FBS. After 4 to 5 days of infection, Vero cells showed significant cytopathic effect (CPE), manifested as cell shedding. The virus titer was calculated according to the Reed-Muench method and expressed as 50% tissue culture infection dose (TCID50).
A suitable number of Vero cells were seeded into the different cell plates (1.5×10⁶ cells/well in 6-well plate and 3-4×10⁵ cells/well in 24-well plate). The PEDV sample to be tested was diluted 10-1-10-4 times to infect cells in the plate wells. After 2 h of viral infection, the monolayer cells were immediately and slowly covered with 1:1 mixed 1.6-2 % low melting agarose solution with DMEM medium containing 4 % FBS. About 3-5 days after infection, cells were fixed and stained with crystal violet dye containing 4% polyformaldehyde. After staining, the cells were rinsed gently and directly with tap water till the clear plaque appearance, followed by photo taking.
All siRNAs targeting monkey and porcine TRIF, MAVS and STING were designed and synthesized by Thermo Fisher Scientific. The knockdown efficiency of individual siRNAs for monkey cells has already been tested in our previous work [
15]. To determine the knockdown efficiency of designed porcine siRNA sequences (
Table 3). IPEC-DQ cells were transfected with the 50-150 nM individual siRNAs by Lipofectamine 2000 (Thermo Fisher Scientific) and the expression of corresponding proteins were measured by Western blotting using the anti-TRIF antibody (1:1,000), anti-MAVS antibody (1:1,000) and anti-STING antibody (1:2,000), respectively. For the validated siRNA duplexes, Vero cells or IPEC-DQ cells in 12-well plates with 70-80% monolayers were transfected with 100 nM siRNAs using Lipofectamine 2000 and used for subsequent experiments.
The CRISPR gRNAs were designed based on the first exons of monkey STING (GenBank: CM014354.1), TRIF (GenBank: CM014354.1) and MAVS (GenBank: CM014354.1). For each gene, 2-3 gRNAs were selected (
Table 4), and the annealed gRNA encoding DNA pairs were ligated with the
BbsI digested vector pSpCas9(BB)-2A-GFP (pX458, Addgene, Watertown, NY, USA). Subsequently, each gRNA expressing pX458 was transfected into Vero cells using Lipofectamine 2000 and the GFP-positive cells were sorted out from transfected cells using a BD FACSAria III Sorter. The individual Vero cell clones obtained by limited dilution from the sorted GFP expressing cells were screened by PCR using the designed primers (
Table 4). The PCR products were cloned into T vector using pClone007 Versatile Simple Vector Kit (TsingKe Biological Technology, China). The inserted fragments were multiply sequenced and the sequences were analyzed for base insertion and deletion (indel) mutations, based on which, two TRIF
-/-, three MAVS
-/- and four STING
-/- Vero cell clones were obtained (Supplementary
Figure 1).
The software Image J 5.0 was used to measure the gray values of Western blot protein bands. The data were represented by Mean ± SD and analyzed using GraphPad Prism 7.0. The t test was used to determine whether there was any significant difference between the results: p < 0.05 (*) and p < 0.01 (**). The p < 0.05 indicated statistical significance.
3. Results
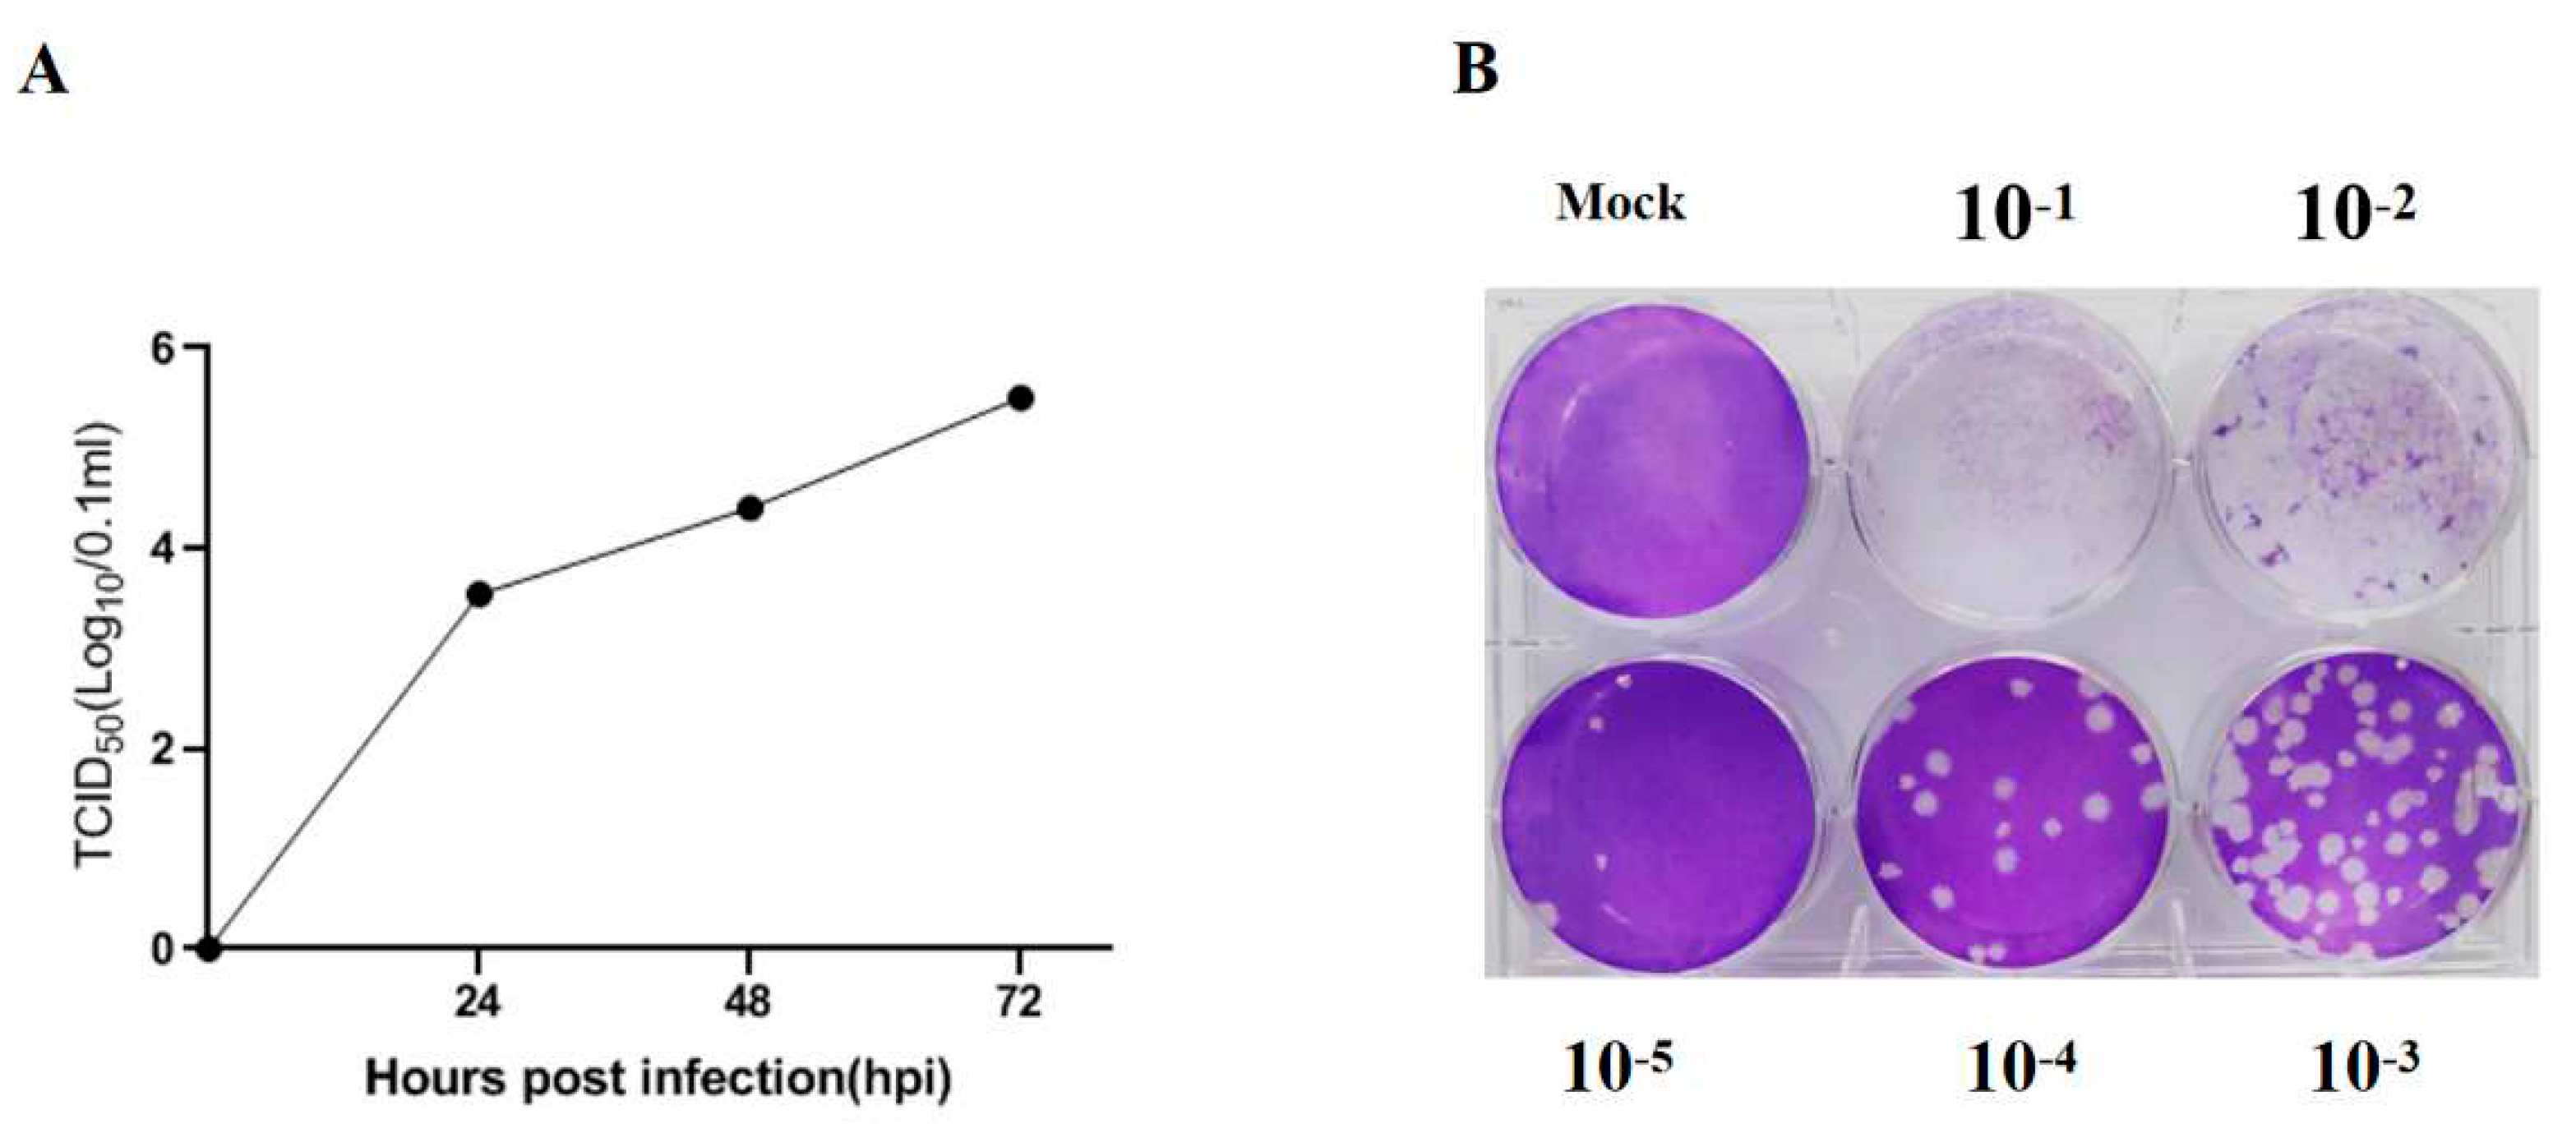
The PEDV strain used in the study was able to effectively infect Vero cells and cause significant cytopathic effect (CPE). Both TCID50 and plaque assays were performed in Vero cells to determine the virus titer. As shown in
Figure 1A and B, the titers measured by TCID50 assay and plaque assay were 10
4.75/0.1 mL and 4×10
5 PFU/0.1 mL at 72 h post infection, respectively.
Some studies have reported that interferon (IFN) defect exists in Vero cells [
16], whereas others implicated that Vero cells were able to produce IFN [
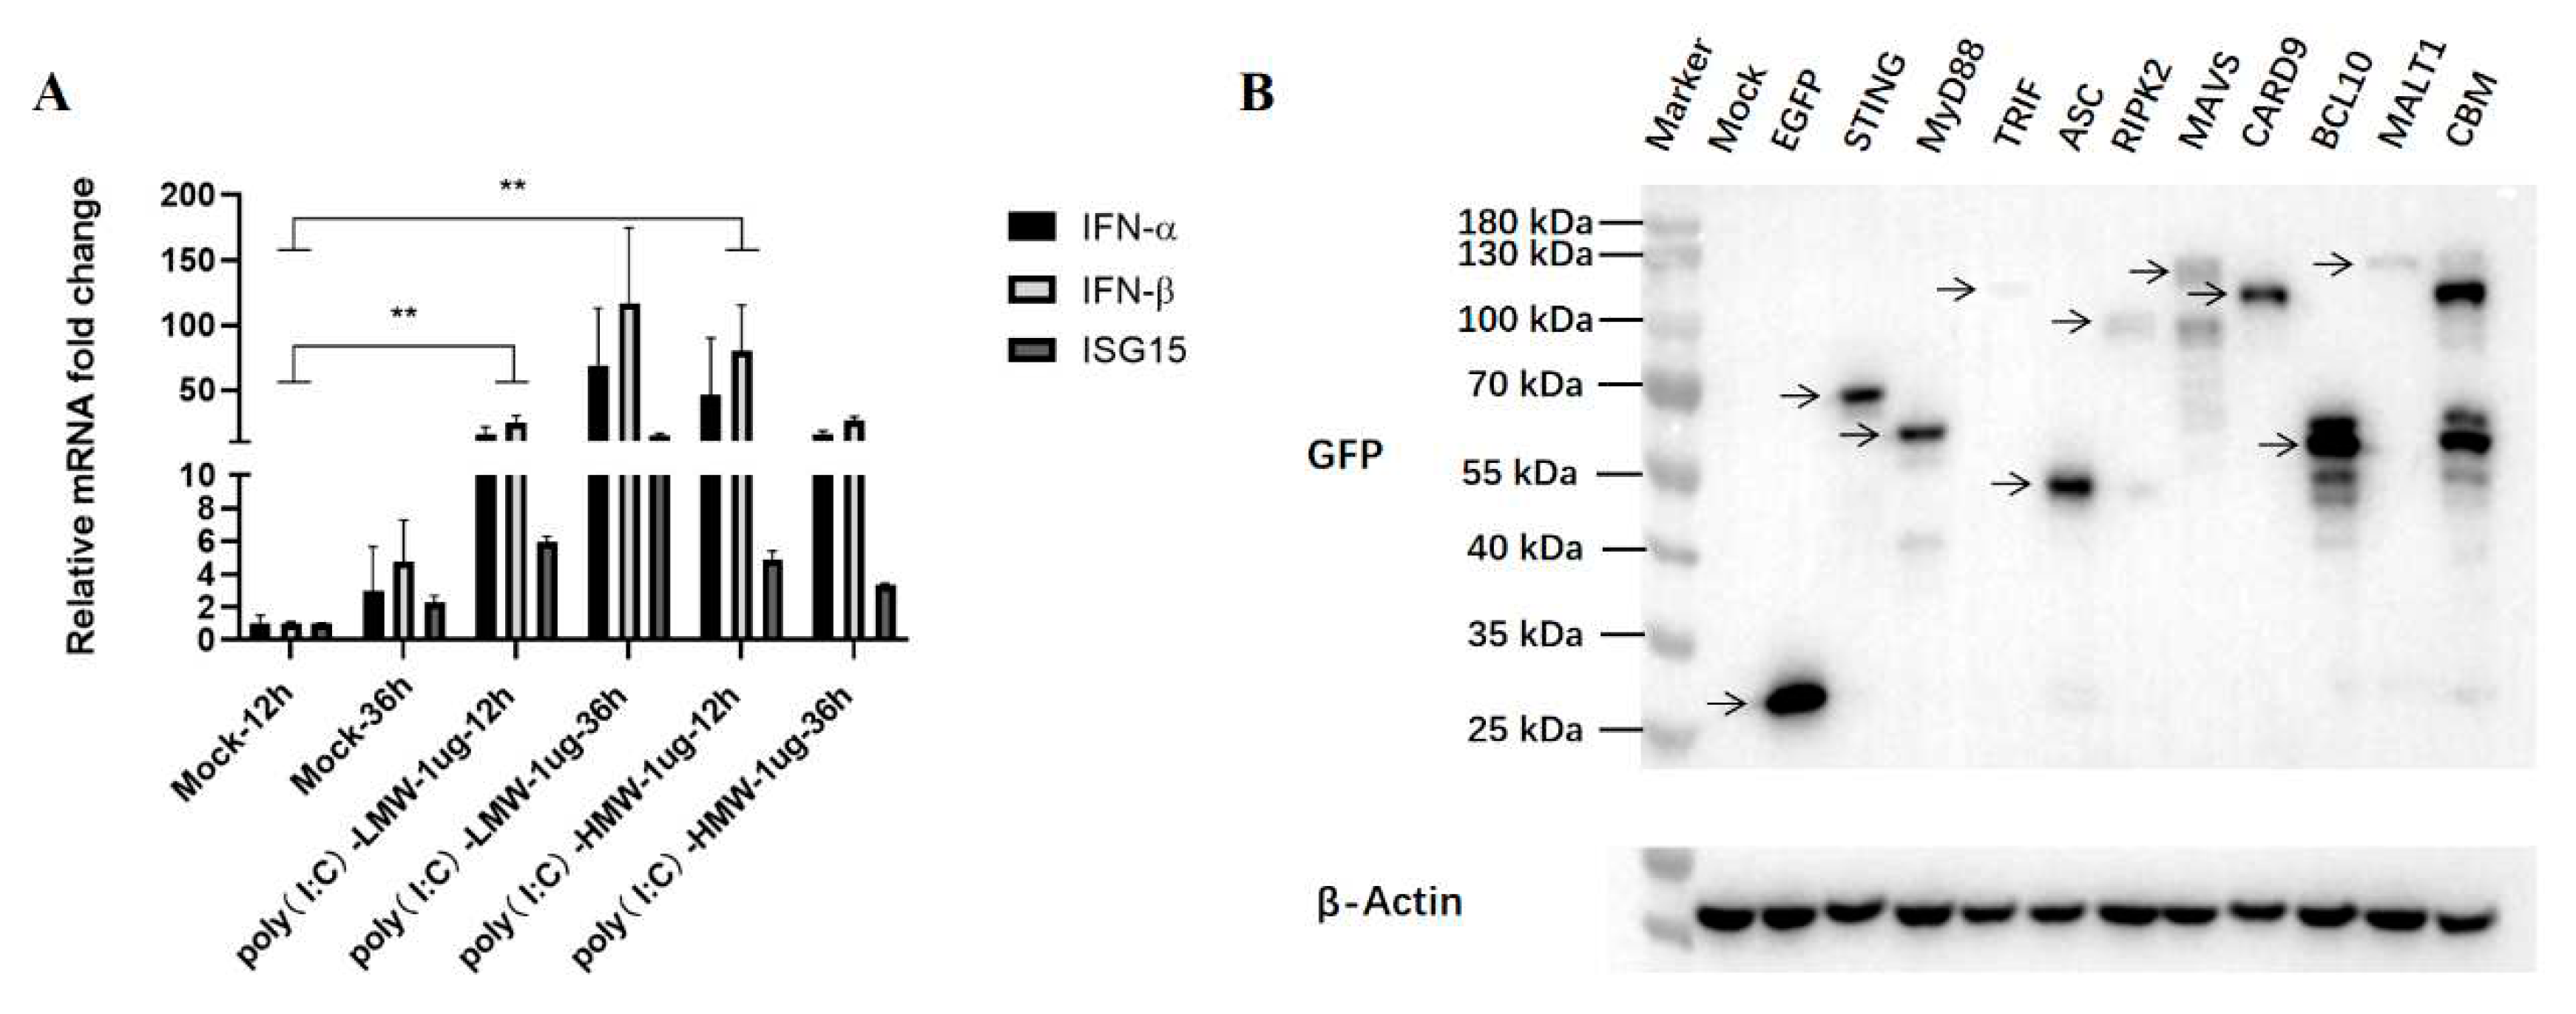
17]. In this article, the anti-PEDV activity mediated by innate immune signaling adaptor proteins was studied mainly in Vero cells, and the IFN is an important effector affecting the antiviral results. To overcome this potential issue, we treated Vero cells with RLRs RIG-I/MDA5 agonist poly (I:C)-LMW and TLR3 agonist poly (I:C)-HMW, respectively, for 12 h and 36 h, and then the collected cells were analyzed for IFN and IFN stimulated gene (ISG) gene expressions by RT-qPCR. As shown in
Figure 2A, the expression levels of IFN-α, IFN-β and ISG15 genes were significantly upregulated upon both stimulations, indicating that the downstream IFN and ISG genes could be normally expressed in our Vero cells.
We previously cloned and characterized the nine porcine innate immune signaling adaptors which represent and reflect all currently known innate immune signaling pathway [
18,
19]. The recombinant pEGFP plasmids encoding MAVS, TRIF, STING, MyD88, RIPK2, ASC, CARD9, BCL10, MALT1 and control vector pEGFP-N1 were transferred into Vero cells for 24 h, and the expressions of transfected adaptor proteins were determined by Western blotting (WB). As shown in
Figure 2B, all the adaptor proteins could be correctly expressed in the transfected Vero cells, despite that the expression level of TRIF was poor.
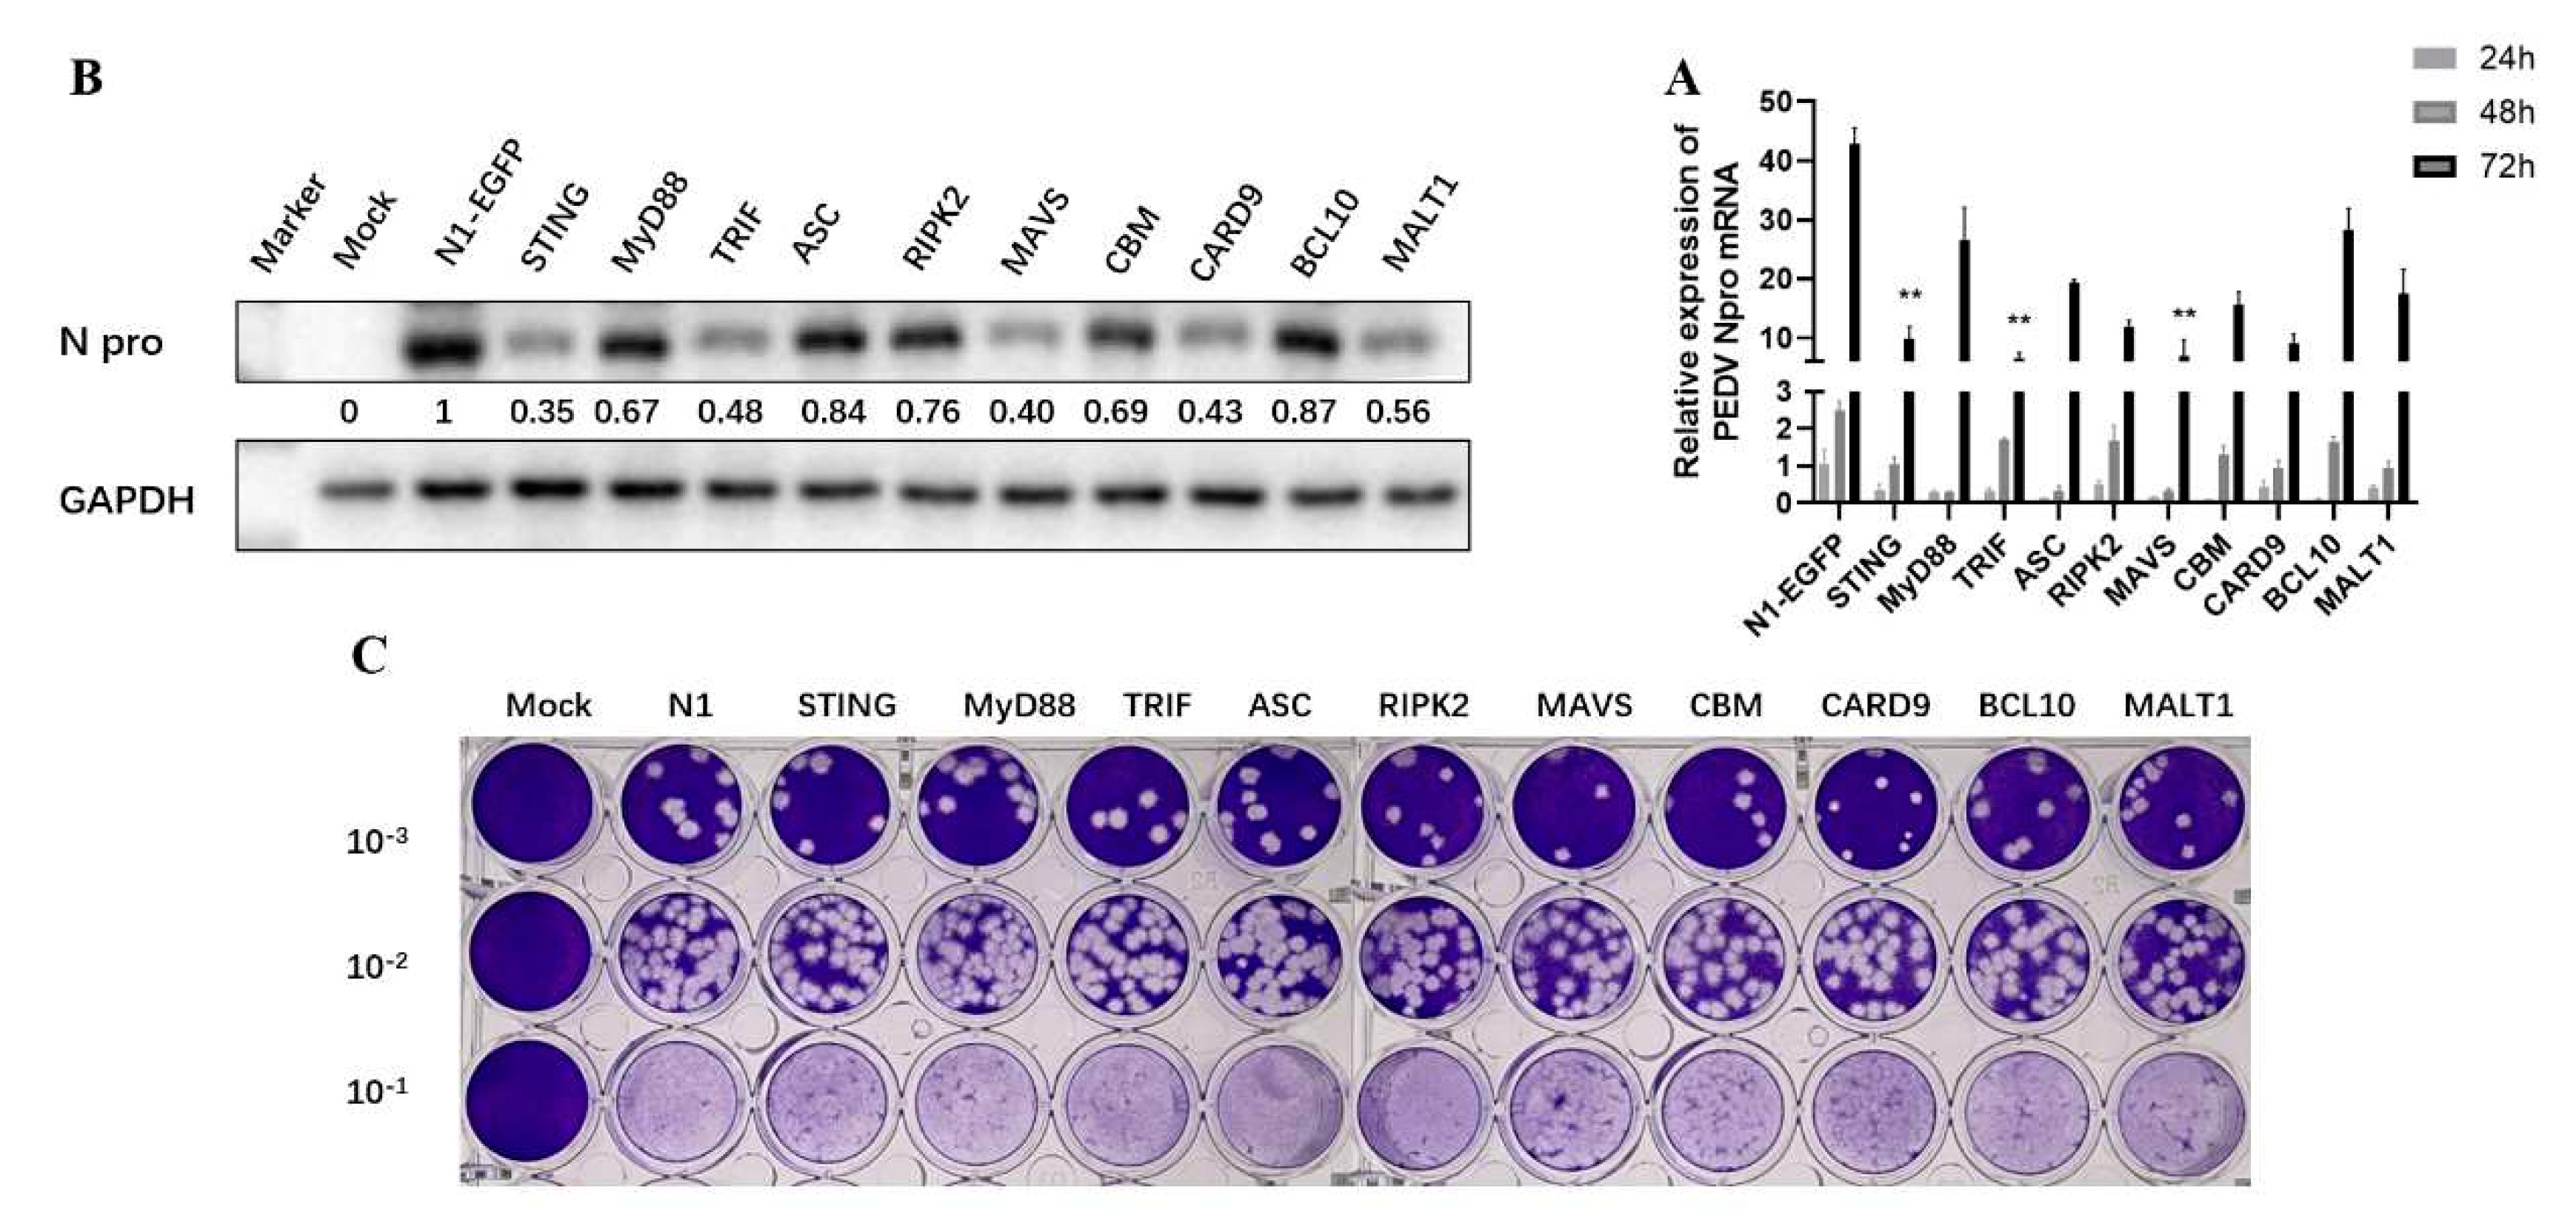
To explore the impacts of nine adaptor proteins on PEDV replication, the adaptor transfected Vero cells were infected with PEDV and the PEDV replication was examined by measuring the viral N gene transcription by RT-qPCR and protein expression by Western blotting, respectively. The RT-qPCR results showed that all the signaling adaptors decreased the expressions of PRRSV N mRNA at various levels at 48 h and 72 h post infection, with the TRIF, MAVS, STING very significant in inhibition of PEDV at 72 h post infection (
Figure 3A). The Western blotting results showed that TRIF, MAVS and STING were most effective in inhibition, while MyD88, RIPK2, ASC and CARD9-BCL10-MALT1 (CBM) were less effective in inhibition of N protein expression at 72 h post infection (
Figure 3B). The collected cell supernatants were measured for PEDV titer by plaque assay, which further confirmed the above results (
Figure 3C).
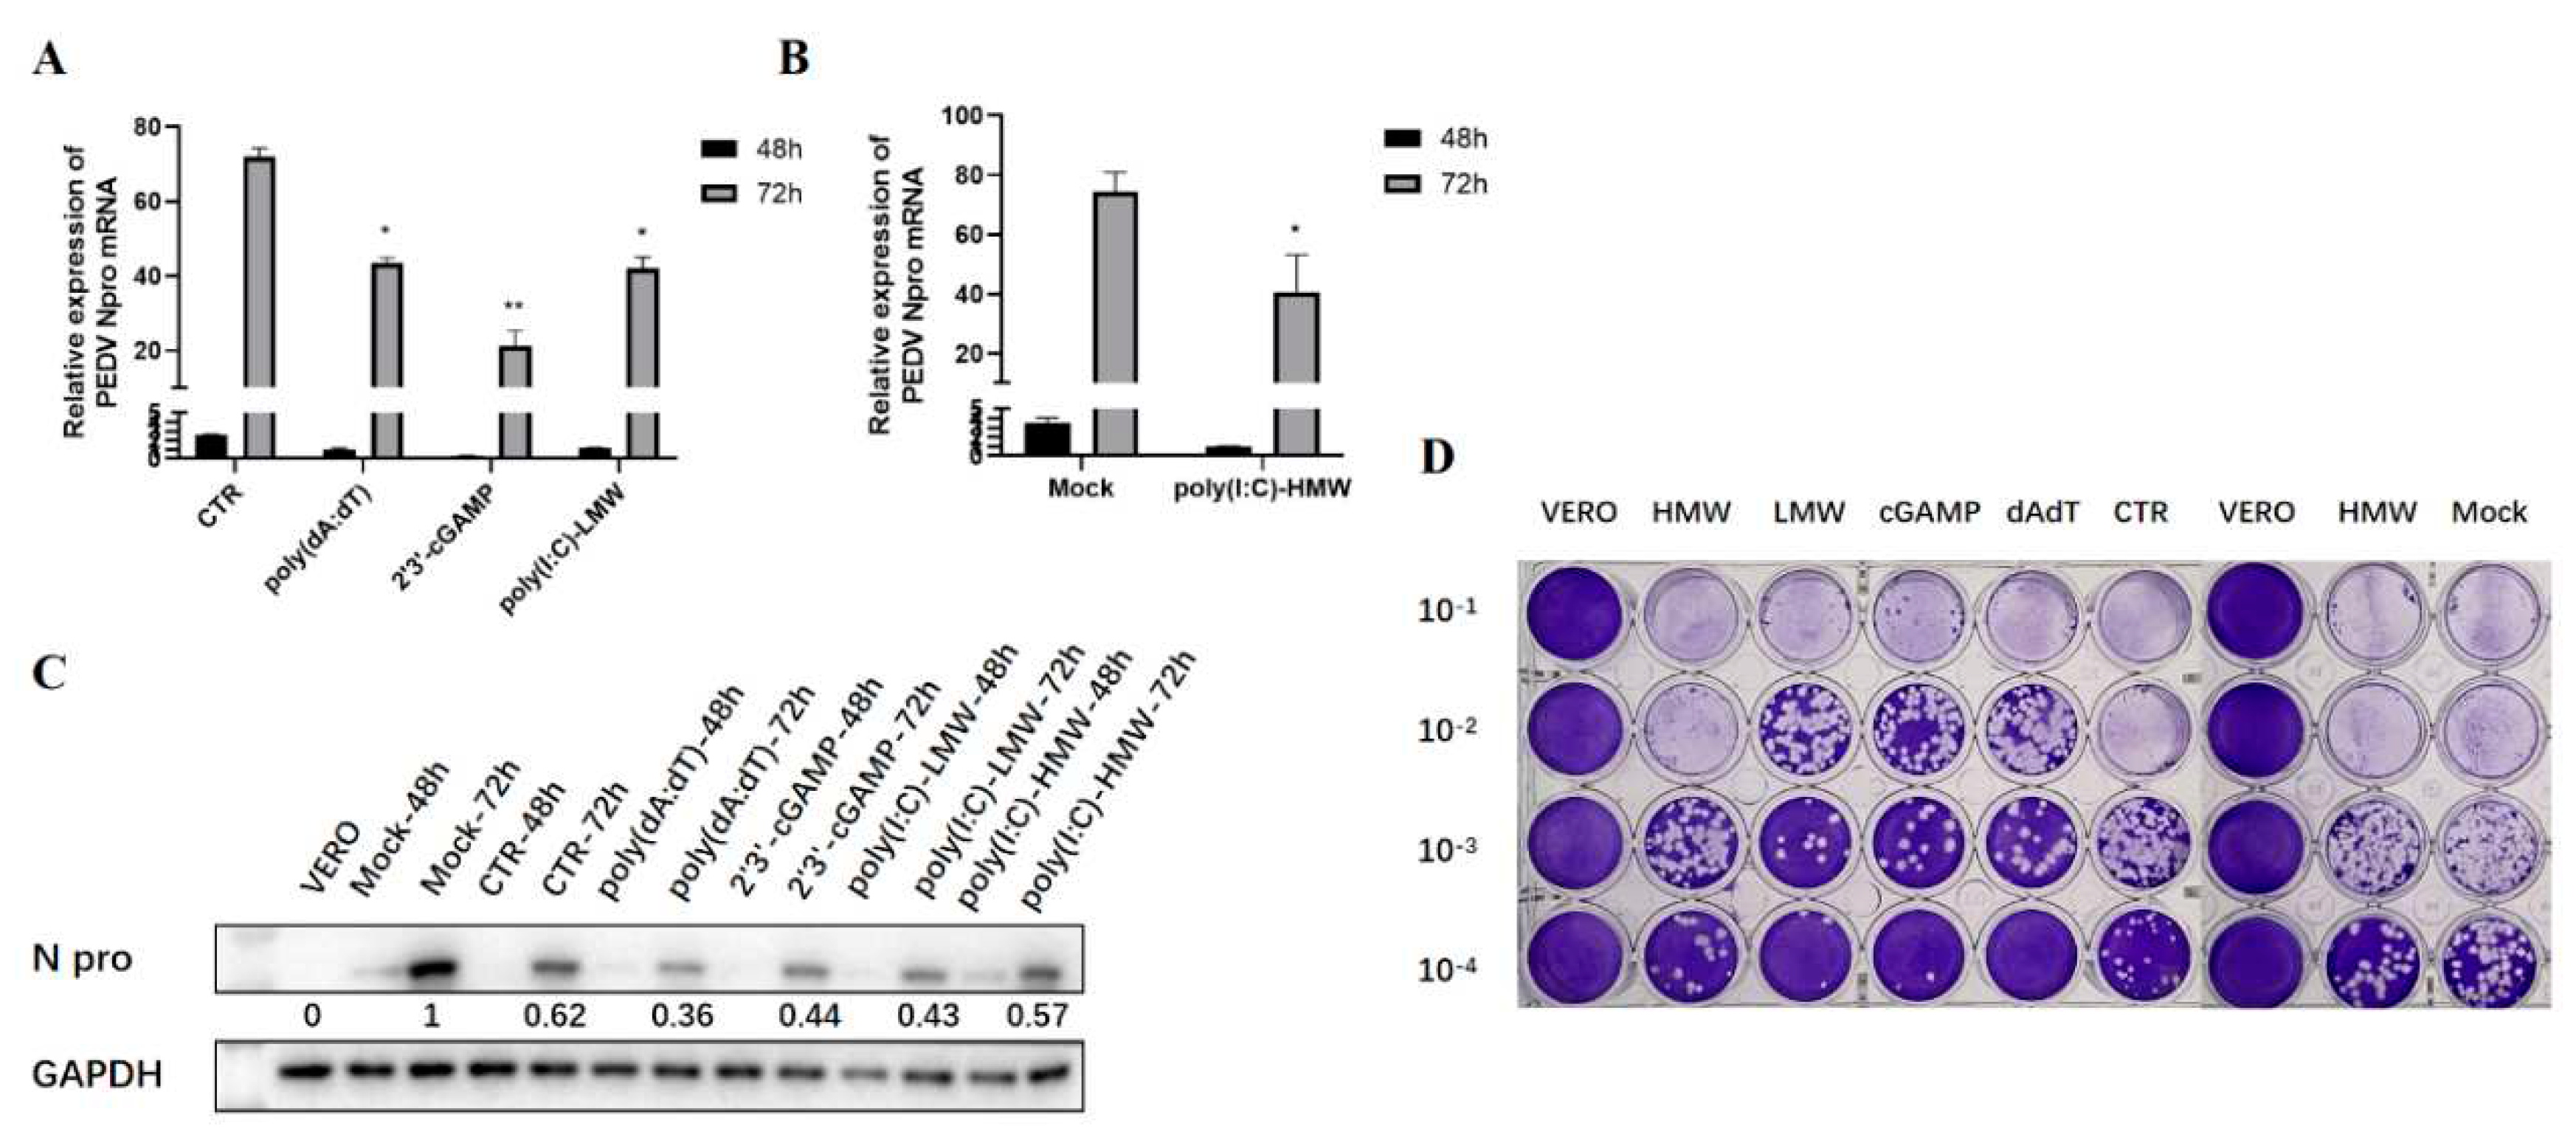
Based on the above screening results and considering the significance of nucleic acid sensing signal in the antiviral activity, TRIF, MAVS and STING were chosen and their endogenous signaling were investigated for the antiviral roles in PEDV infection. Several agonists were used to trigger the endogenous innate signaling, including the poly(I:C)-HMW for TLR3-TRIF signaling, poly(I:C)-LMW for RIG-I/MDA5-MAVS signaling, 2’3’-cGAMP for STING signaling, and poly(dA:dT) for cGAS-STING signaling. As is shown in
Figure 4, RT-qPCR (A and B), WB detection (C) and plaque assay (D) all demonstrated that the poly(I:C)-HMW induced TRIF signaling, poly(I:C)-LMV induced MAVS signaling, 2'-3'-cGAMP and poly(dA:dT) activated STING signaling possess obvious anti-PEDV activity. The anti-PEDV effect in Vero cells was more obvious at 72 h post infection than that at 48 h post infection (
Figure 4A-C).
To further explore the roles of endogenous TRIF, MAVS and STING in the PEDV replication, the previous validated siRNAs were used to knockdown the TRIF, MAVS and STING in Vero cells before PEDV infection [
15]. In the TRIF, MAVS and STING siRNA treated Vero cells, the PEDV N mRNA and N protein expressions were obviously increased at 72 h post infection relative to control siRNA treated cells (
Figure 5 A and B). Similarly, compared with control siRNA treated cells, the PEDV titers were obviously heightened in TRIF, MAVS and STING siRNA treated cells at 72 h post infection (
Figure 4C). These results suggested that endogenous TRIF, MAVS and STING are all part of the host defense mechanism, necessary for inhibition of PEDV replication.
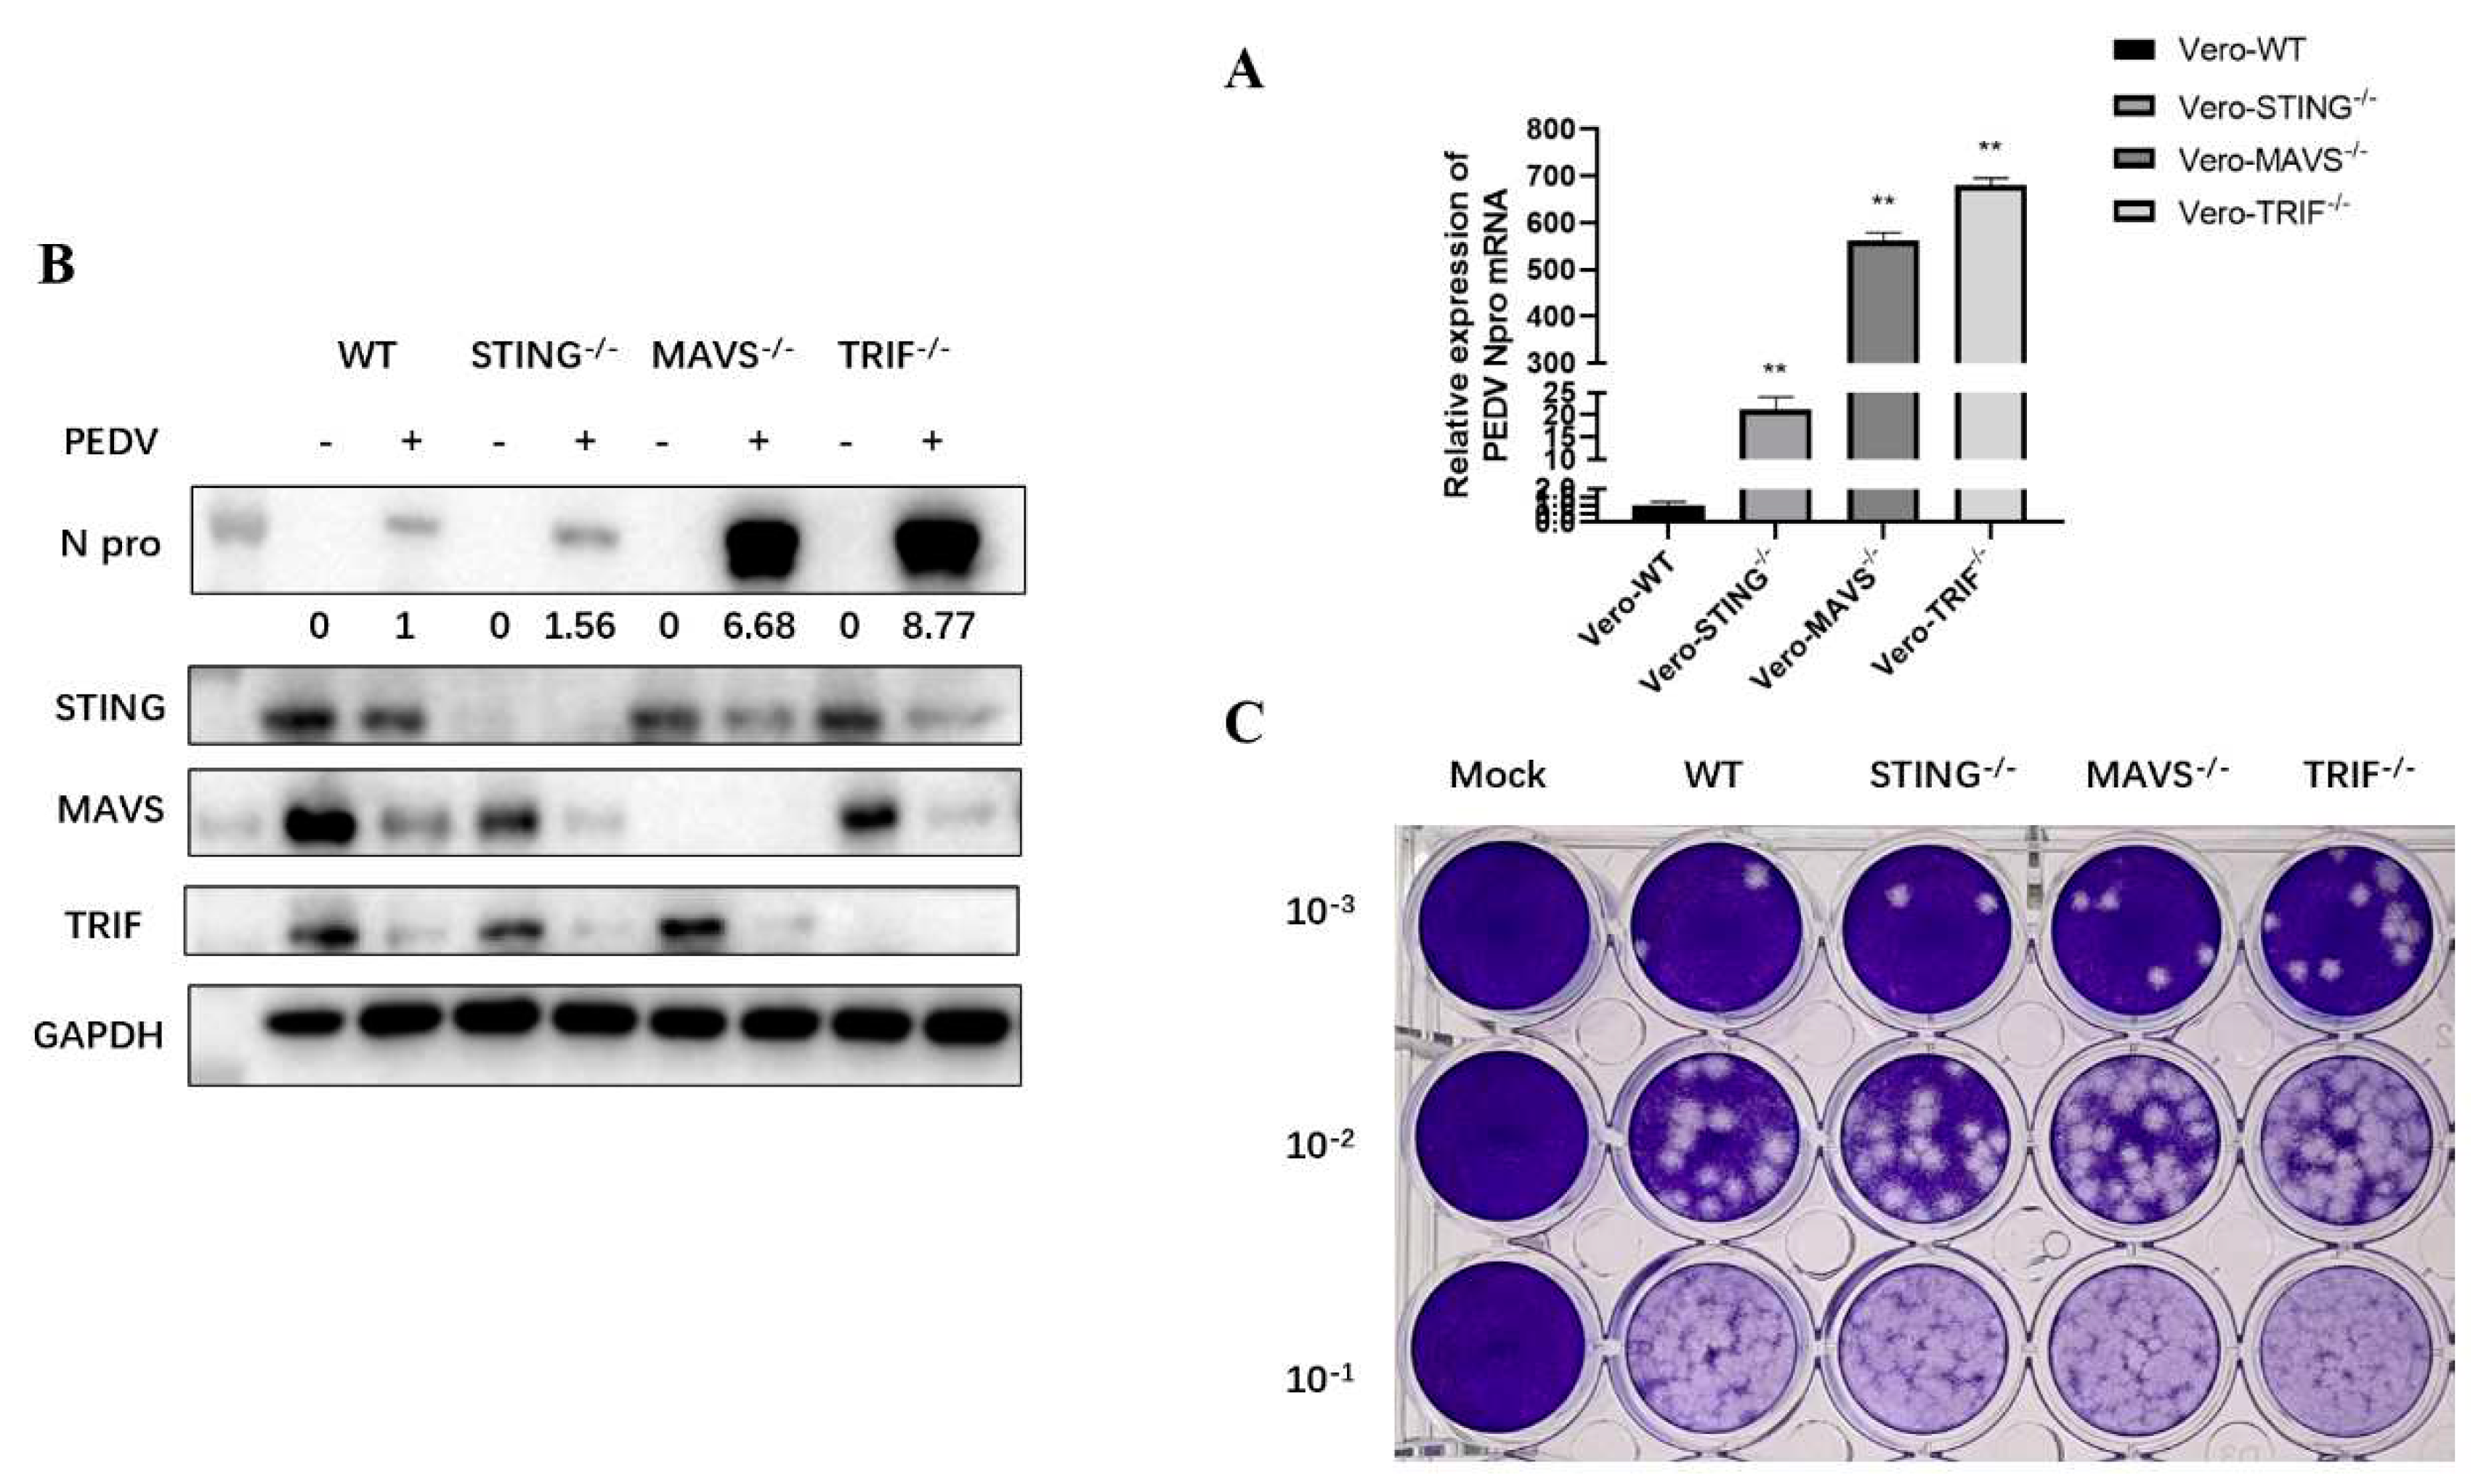
In order to further verify the anti-PEDV infection effects of STING, TRIF and MAVS in Vero cells, we used CRISPR/Cas9 gene editing technology to construct STING, TRIF and MAVS knockout Vero cell lines, respectively. The clones of TRIF
-/-, MAVS
-/- and STING
-/- Vero cells were obtained and used for PEDV infection together with control normal Vero cells. Compared with the control Vero cells (WT), the expression of N gene mRNA and N protein in TRIF
-/-, MAVS
-/- and STING
-/- Vero cells after PEDV infection and the virus content in culture supernatant were significantly increased (
Figure 6A-C). Besides, WB again confirmed that the adaptor protein expression in the corresponding knockout cells disappeared as expected (
Figure 6B). These results further proved the important roles of TRIF, MAVS and STING in the host defense against PEDV infection, especially the important influence of TRIF and MAVS in the infection of PEDV.
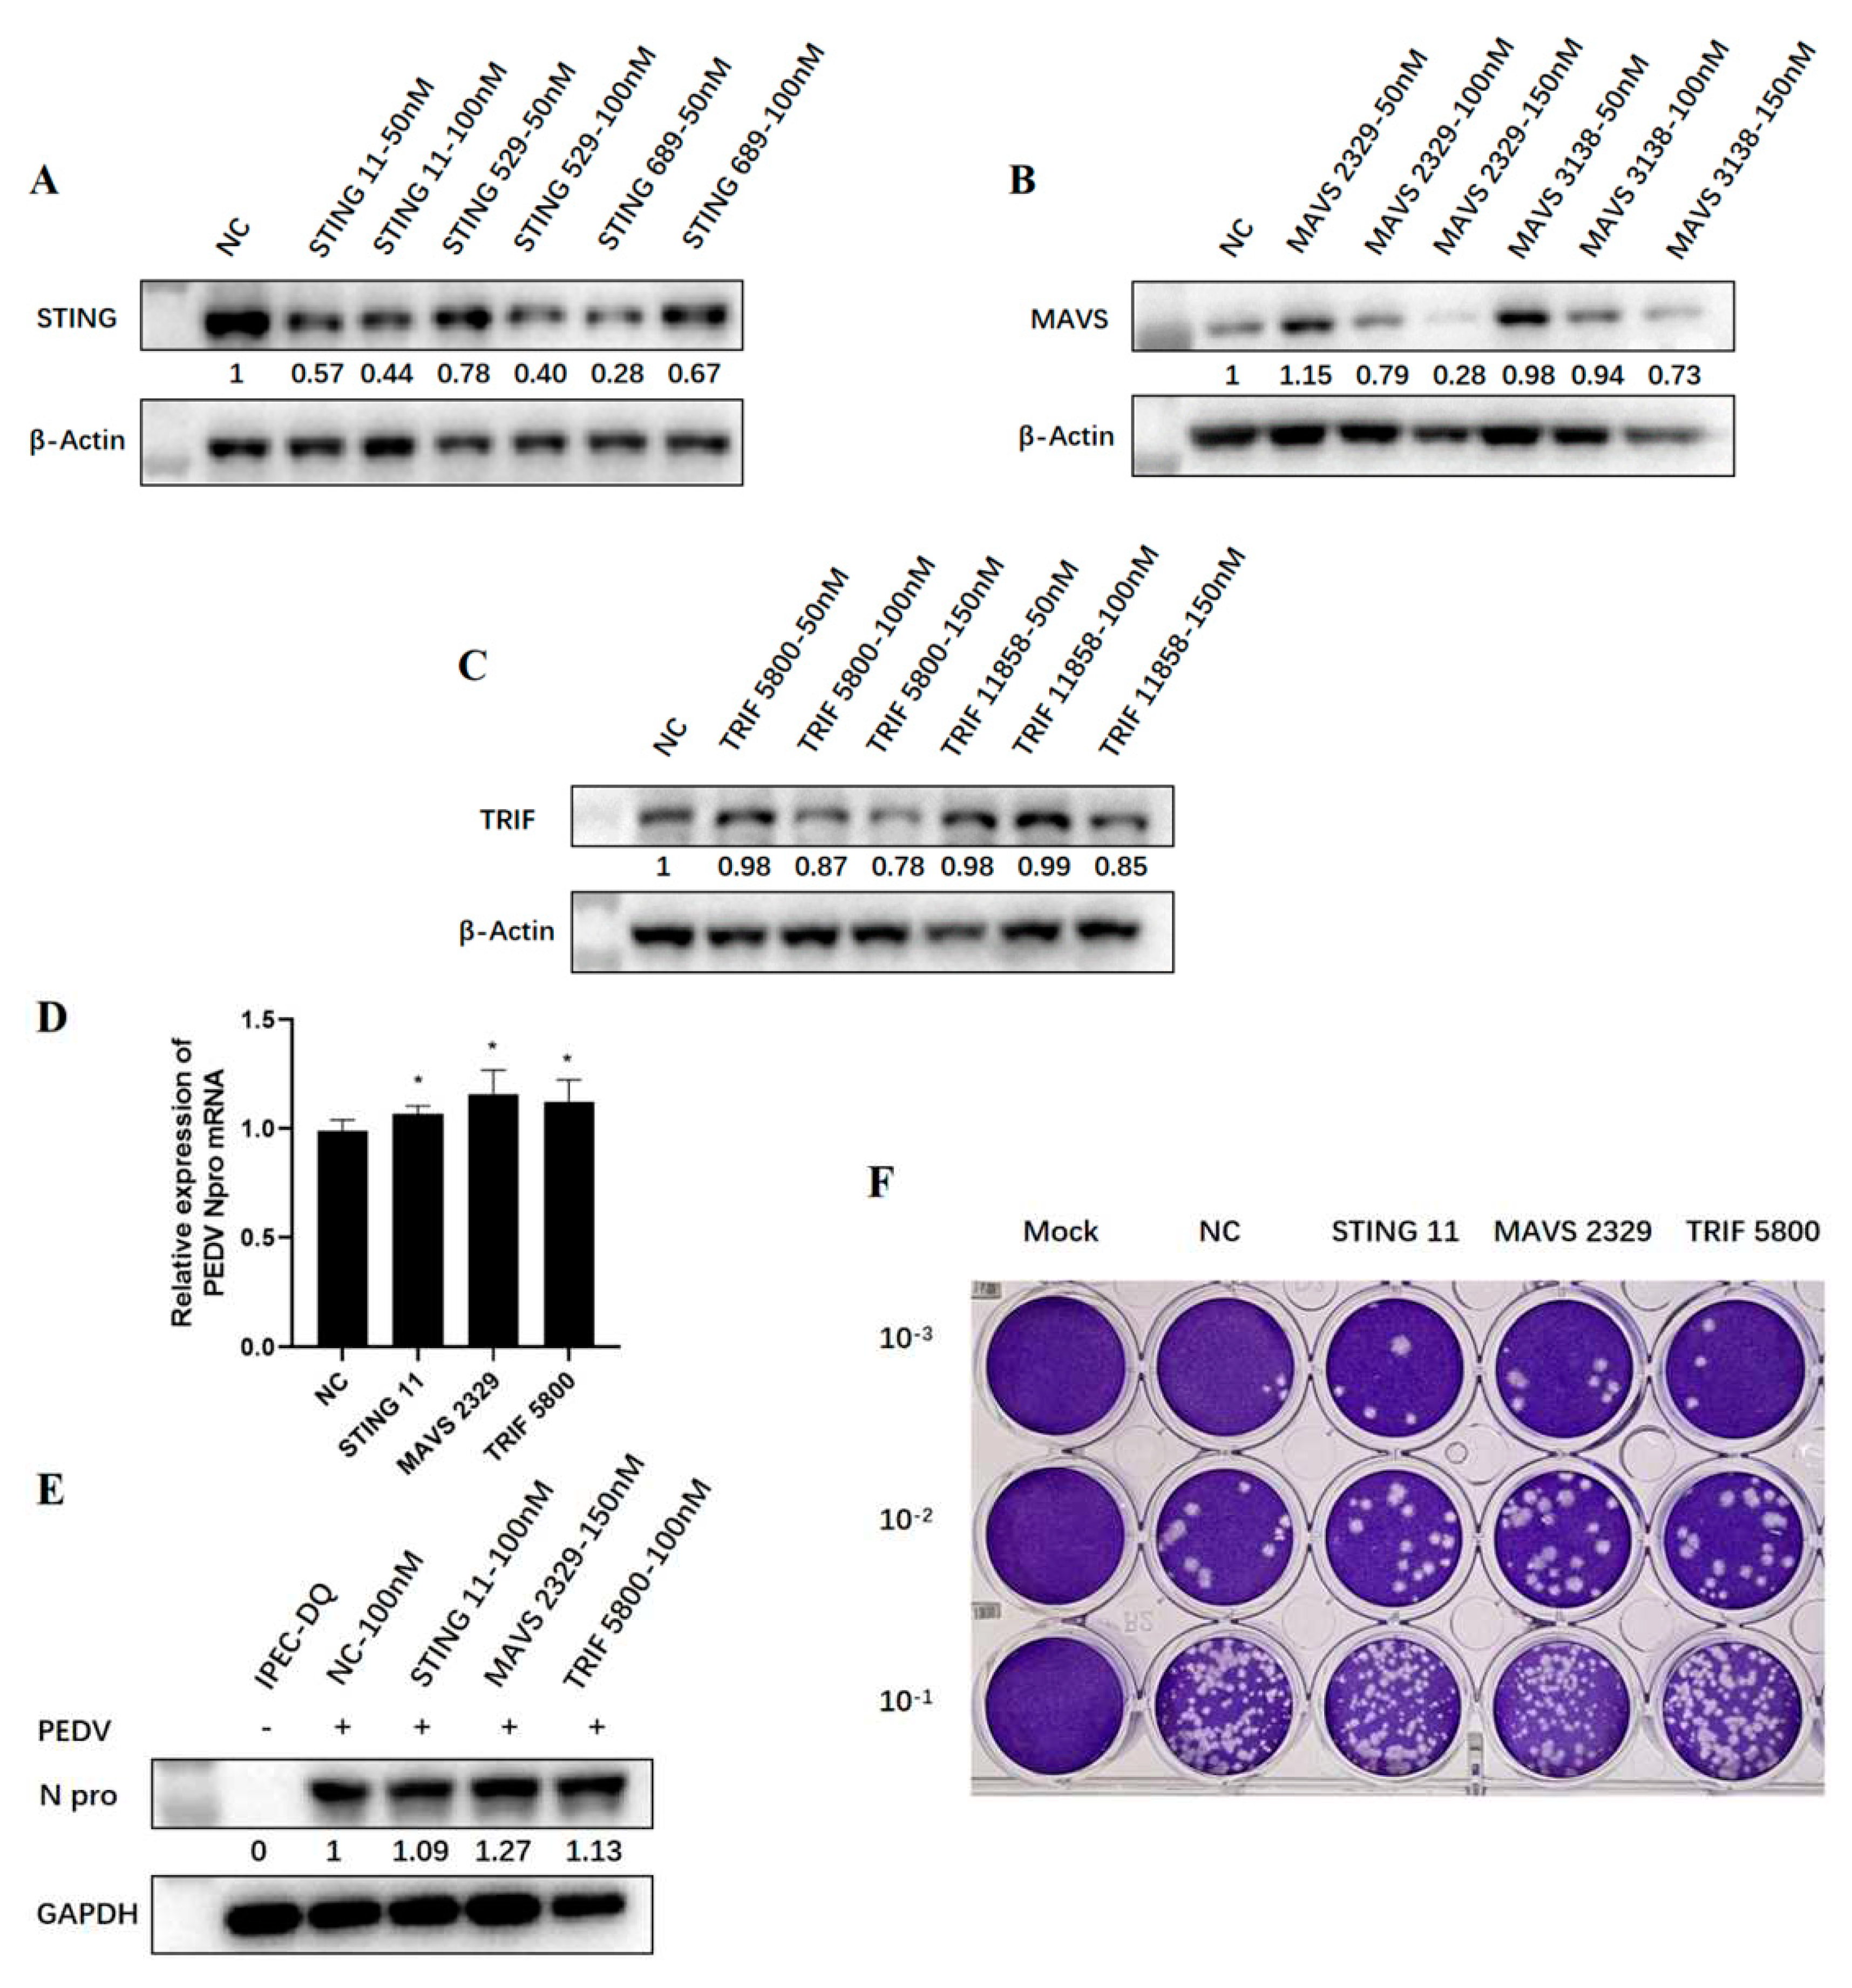
PEDV is a diarrhea virus prevalent in pigs. So as to further detect the effects of endogenous TRIF, MAVS and STING on the replication of PEDV, we used relevant IPEC-DQ cell line of piglet jejunal epithelium for PEDV infection. Firstly, different individual siRNA sequences of porcine TRIF, MAVS and STING were transfected into IPEC-DQ cells at a concentration of 50-150 nM, respectively, and cells were collected 24 h later for detection to determine the siRNA knockdown efficiency. According to the knockdown effect on protein level detected by WB (
Figure 7 A-C), STING 11 siRNA, MAVS 2329 siRNA and TRIF 5800 siRNA were finally selected for subsequent experiments at a working concentration of 100 nM.
The three siRNA duplexes and negative control siRNA duplex were transfected into IPEC-DQ cells by using Lipofectamine 2000 for 24 h, followed by PEDV infection. After 72 h infection, the RT-qPCR, WB and plaque assay showed that when TRIF, MAVS and STING in IPEC cells were silenced by corresponding siRNA, the N gene transcription, N protein expression and virus replication levels of PEDV were slightly increased compared with the control group (
Figure 7 D-E), These results further indicated that a variety of porcine innate immune signaling pathways exert the anti-PEDV function.
Porcine epidemic diarrhea (PED) is a worldwide swine viral disease with important economic significance, posing a huge threat to swine industry. At present, PEDV variants have emerged and evolved persistently [
20]. Although there are several PED vaccines available on the market, the protective immunity by vaccination depends on both effective innate immunity and adaptive immunity [
21]. Innate immune response is the first line of host defense during infection and plays a crucial role in early recognition and immune protection against virus infection. However, the PEDV does not elicit a robust antiviral IFN response; the interaction between PEDV and host immunity is complex and its mechanism has not been fully understood [
22]. To understand and maximize the potential of PEDV innate immunity, we examined the anti-PEDV innate immune response globally and completely by investigating the signaling adaptors which represent and reflect all currently known innate immune signaling pathways. Our results and findings implicated that multiple innate immune signaling pathways are involved in the recognition and defense against PEDV infection.
Among different PRR families, three types of PRRs have been identified in recognition of viral nucleic acids, including RLR detection of viral RNA in the cytoplasm [
23], TLR recognition of viral RNA or DNA in the endosome [
24], and CDR detection of viral DNA in the cytoplasm [
25]. Here, we found and confirmed the significant roles of RLR adaptor MAVS, TLR3 adaptor TRIF and CDR adaptor STING in the anti-PEDV response. Additionally, other innate signaling adaptors MyD88, RIPK2, ASC and CARD9-BCL10-MALT1 (CBM complex) also appeared to play a role in the anti-PEDV response. MyD88 is the common signaling adaptor for all TLRs except TLR3 [
26]. RIPK2 is the signaling adaptor for NLRs NOD1 and NOD2 whereas ASC is the adaptor for other NLRs [
27]. The signaling adaptor complex of CBM is for all CLRs [
28]. Among these various PRRs, the roles of some PRRs such as NLRs and CLRs have never been investigated and need to be validated and investigated during PEDV infection.
We previously showed that multiple innate immune signaling pathways are involved in the recognition of and defense against porcine reproductive and respiratory syndrome virus (PRRSV), a member of
Arteriviridae family [
15]. Both PRRSV and PEDV harbor positive-sense single-stranded genomic RNA, which may confer similarities in the induced innate immune responses. Furthermore, the phenotype may be general to other viruses, that is, many virus infections are recognized and counteracted by several innate immune PRR mediated signaling pathways. Subsequently, several attractive questions arise: 1, what is the relative contribution of each PRR signaling pathways in the anti-PEDV innate immune response? 2, what is the relationship between different PRR signaling pathways in PEDV infection? 3, how does the PEDV evade each of these PRR signaling pathways? Answering these questions will reveal an intricate and delicate interaction network between PEDV and host, which deserves further researches in the future.
In summary, our results suggest that multiple porcine PRR mediated signaling pathways are involved in PEDV recognition and defense. These results deepen our understanding of PEDV innate immunity and help maximize the potential of innate immunity to control PEDV infection.
Figure 1.
Titration of PEDV by TCID50 assay (A) and plaque assay (B), respectively.
Figure 1.
Titration of PEDV by TCID50 assay (A) and plaque assay (B), respectively.
Figure 2.
Detection of IFN levels and the adaptor expressions in Vero cells. (A) RT-qPCR detection of interferons (IFNs) and related genes in Vero cells. ** p < 0.01. (B) Expressions of 9 signaling adaptor proteins in transfected Vero cells, which are fused with GFP and marked with arrows.
Figure 2.
Detection of IFN levels and the adaptor expressions in Vero cells. (A) RT-qPCR detection of interferons (IFNs) and related genes in Vero cells. ** p < 0.01. (B) Expressions of 9 signaling adaptor proteins in transfected Vero cells, which are fused with GFP and marked with arrows.
Figure 3.
Detection of the anti-PEDV activity of exogenous adaptor proteins in Vero cells. (A) The effect of 9 adaptor protein on PEDV N gene transcription at different time points was detected by RT-qPCR. ** p < 0.01. (B) The effect of 9 adaptor proteins on N protein expression of PEDV at 72 h post infection was detected by WB. The gray values of each N protein bands after normalized by GAPDH were shown below the corresponding protein bands. (C) The effect of 9 adaptors proteins on virus amount in cell supernatant after 72 h infection was detected by plaque assay.
Figure 4.
The effects of endogenous TRIF, MAVS and STING signaling on PEDV replication in Vero cells. (A and B) The effect of different stimulants on PEDV replication at both 48 h and 72 h post infection was detected by RT-qPCR. The CTR denotes the transfection control and the Mock is the non-treatment control. * p < 0.05, ** p < 0.01. (C) The effect of stimulation on PEDV replication at both 48 h and 72 h post infection was detected by WB. The gray values of each N protein bands after normalization by GAPDH were shown below the corresponding protein bands. (D) The effect of stimulants on the amount of virus in the supernatant after 72 h infection was detected by plaque assay.
Figure 5.
The effects of knockdown of endogenous TRIF, MAVS and STING on PEDV replication in Vero cells. (A) The effect of signaling adaptor knockdown on PEDV N gene expression was detected by RT-qPCR. NC denotes the negative control siRNA. * p < 0.05, ** p < 0.01. (B) The effect of signaling adaptor knockdown on PEDV N protein expression. The gray values of each N protein bands after normalized by GAPDH were shown below the corresponding protein bands. (C) The effect of signaling adaptor knockdown on PEDV replication after 72 h infection in Vero cell was detected by plaque assay.
Figure 6.
PEDV replication was increased in TRIF-/-, MAVS-/- and STING-/- Vero cells. (A) RT-qPCR was used to detect PEDV N gene mRNA expression in knockout (KO) cells and wild type (WT) normal Vero cells. ** p < 0.01. (B) The expression of PEDV N protein in knockout cells was detected by WB. The gray values of each N protein bands after normalization by GAPDH were shown below the corresponding protein bands. (C) The PEDV content in the knockout cell supernatants was detected by plaque assay.
Figure 7.
Effects of siRNA knockdown of endogenous TRIF, MAVS and STING on PEDV replication in IPEC-DQ cells. (A-C) WB detection of TRIF, MAVS and STING siRNA knockdown efficiency by different siRNAs. The gray values of each adaptor protein bands after normalization by -Actin were shown below the corresponding protein bands. (D) The effect of signaling adaptor knockdown on PEDV replication was detected by RT-qPCR. * p < 0.05. (E) The impact of signaling adaptor knockdown on PEDV replication was detected by WB. The gray values of each N protein bands after normalization by GAPDH were shown below the corresponding protein bands. (F) The effect of adaptor knockdown on the level of supernatant PEDV at 72 h post infection was detected by plaque assay.
Table 1.
PCR primers used for PEDV N gene amplification.
Table 1.
PCR primers used for PEDV N gene amplification.
| Prime names |
Sequences(5’-3’) |
| PEDV-N-F |
GGGCCGTCGACATGGCTTCTGTCAGTTTTCAGGATCG |
| PEDV-N-R |
GGGCCGATATCATTTCCTGTATCGAAGATCTCGTTGATAATTTCAAC |
Table 2.
The qPCR primers used for the detection of mRNA expression.
Table 2.
The qPCR primers used for the detection of mRNA expression.
| Prime names |
Sequences(5’-3’) |
| PEDV-N-f |
CAAGAACAGAAACCAGTCAAATGACC |
| PEDV-N-R |
AGAGTGGAGGAGAATTCCCAAGG |
| M-IFN-α-F |
ATCTGCTCTCTGGGCTGTGATCT |
| M-IFN-α-R |
TTCAGACAGGAGAAAGGAGAGATTCT |
| M-IFN-β-F |
AAATTGCTCTCCTGTTGTGCTTCT |
| M-IFN-β-R |
AAGCCTTCCATTCAATTGCCA |
| M-ISG15-F |
CTCTGAGCATCCTGGTGAGGAA |
| M-ISG15-R |
CGAAGGTCAGCCAGAACAGGT |
| M-β-Actin-F |
AGAAGATGACCCAGATCATGTTTG |
| M-β-Actin- R |
A TCCATCACGATGCCAGTGGTA |
Table 3.
The designed siRNA sequences for porcine TRIF, MAVS and STING genes.
Table 3.
The designed siRNA sequences for porcine TRIF, MAVS and STING genes.
| siRNA names |
Sequences(5’-3’) |
| P-STING-11-F/R |
CCAGCCUGCAUCCAUCCAUTT AUGGAUGGAUGCAGGCUGGTT |
| P-STING-689-F/R |
CCGACCGUGCUGGCAUCAATT UUGAUGCCAGCACGGUCGGTT |
| P-STING-529-F/R |
GCUCGGAUCCAAGCUUAUATT UAUAAGCUUGGAUCCGAGCTT |
| P-MAVS2329-F/R |
CCACCACAGAGAUCUUUAATTUUAAAGAUCUCUGUGGUGGTT |
| P-MAVS3138-F/R |
GGCUGCACUACUGUAUUAUTTAUAAUACAGUAGUGCAGCCTT |
| P-TRIF5800-F/R |
GCCUGUCCUUUACCCUUUATTUAAAGGGUAAACGACACCCTT |
| P-TRIF11858-F/R |
GGGUUCAUCACAUUAAUAATTUUAUUAAUGUGAUGAACCCTT |
| siNC-F/R |
UUCUCCGAACGUGUCACGUTT ACGUGACACGUUCGGAGAATT |
Table 4.
The CRISPR gRNA encoding DNA sequences and PCR primers for monkey TRIF, MAVS and STING genes.
Table 4.
The CRISPR gRNA encoding DNA sequences and PCR primers for monkey TRIF, MAVS and STING genes.
| Prime names |
Sequences(5’-3’) |
| M-STING gRNA1-F/R |
CACCGTGGATGGATGCAGACTGGAG
AAACCTCCAGTCTGCATCCATCCAC |
| M-STING gRNA2-F/R |
CACCGCCATCCATCCCGTGTCCCAG
AAACCTGGGACACGGGATGGATGGC |
| M-STING gRNA3-F/R |
CACCGCTGGGACAGCTGTTAAATG
AAACCATTTAACAGCTGTCCCAGC |
| M-TRIF gRNA1-F/R |
CACCGTAGGCCACGTCCCGCAGCG
AAACCGCTGCGGGACGTGGCCTAC |
| M-TRIF gRNA2-F/R |
CACCGATGAGGCCCGAAACCGGTGT
AAACACACCGGTTTCGGGCCTCATC |
| M-MAVS gRNA1-F/R |
CACCGTCTTCAGTACCCTTCAGCGG
AAACCCGCTGAAGGGTACTGAAGAC |
| M-MAVS gRNA2-F/R |
CACCGCTGGTAGCTCTGGTAGACAC
AAACGTGTCTACCAGAGCTACCAGC |
| M-STING-F/R |
TCGCAGAGACAGGAGCTTTG
GGCTGCAGACCCCATTTAAC |
| M-TRIF-F/R |
ACTGAAGGCTGATGCAGCG
TTTCCAAGTTGCTGGCCAGG |
| M-MAVS-F/R |
GCTCTTCTGGCTTTCTTGGCG
GCTCAGCCTGGATCTACACCC |
