3.2. Specific heat
The zero-field specific heat
Cp(
T) data for the
(
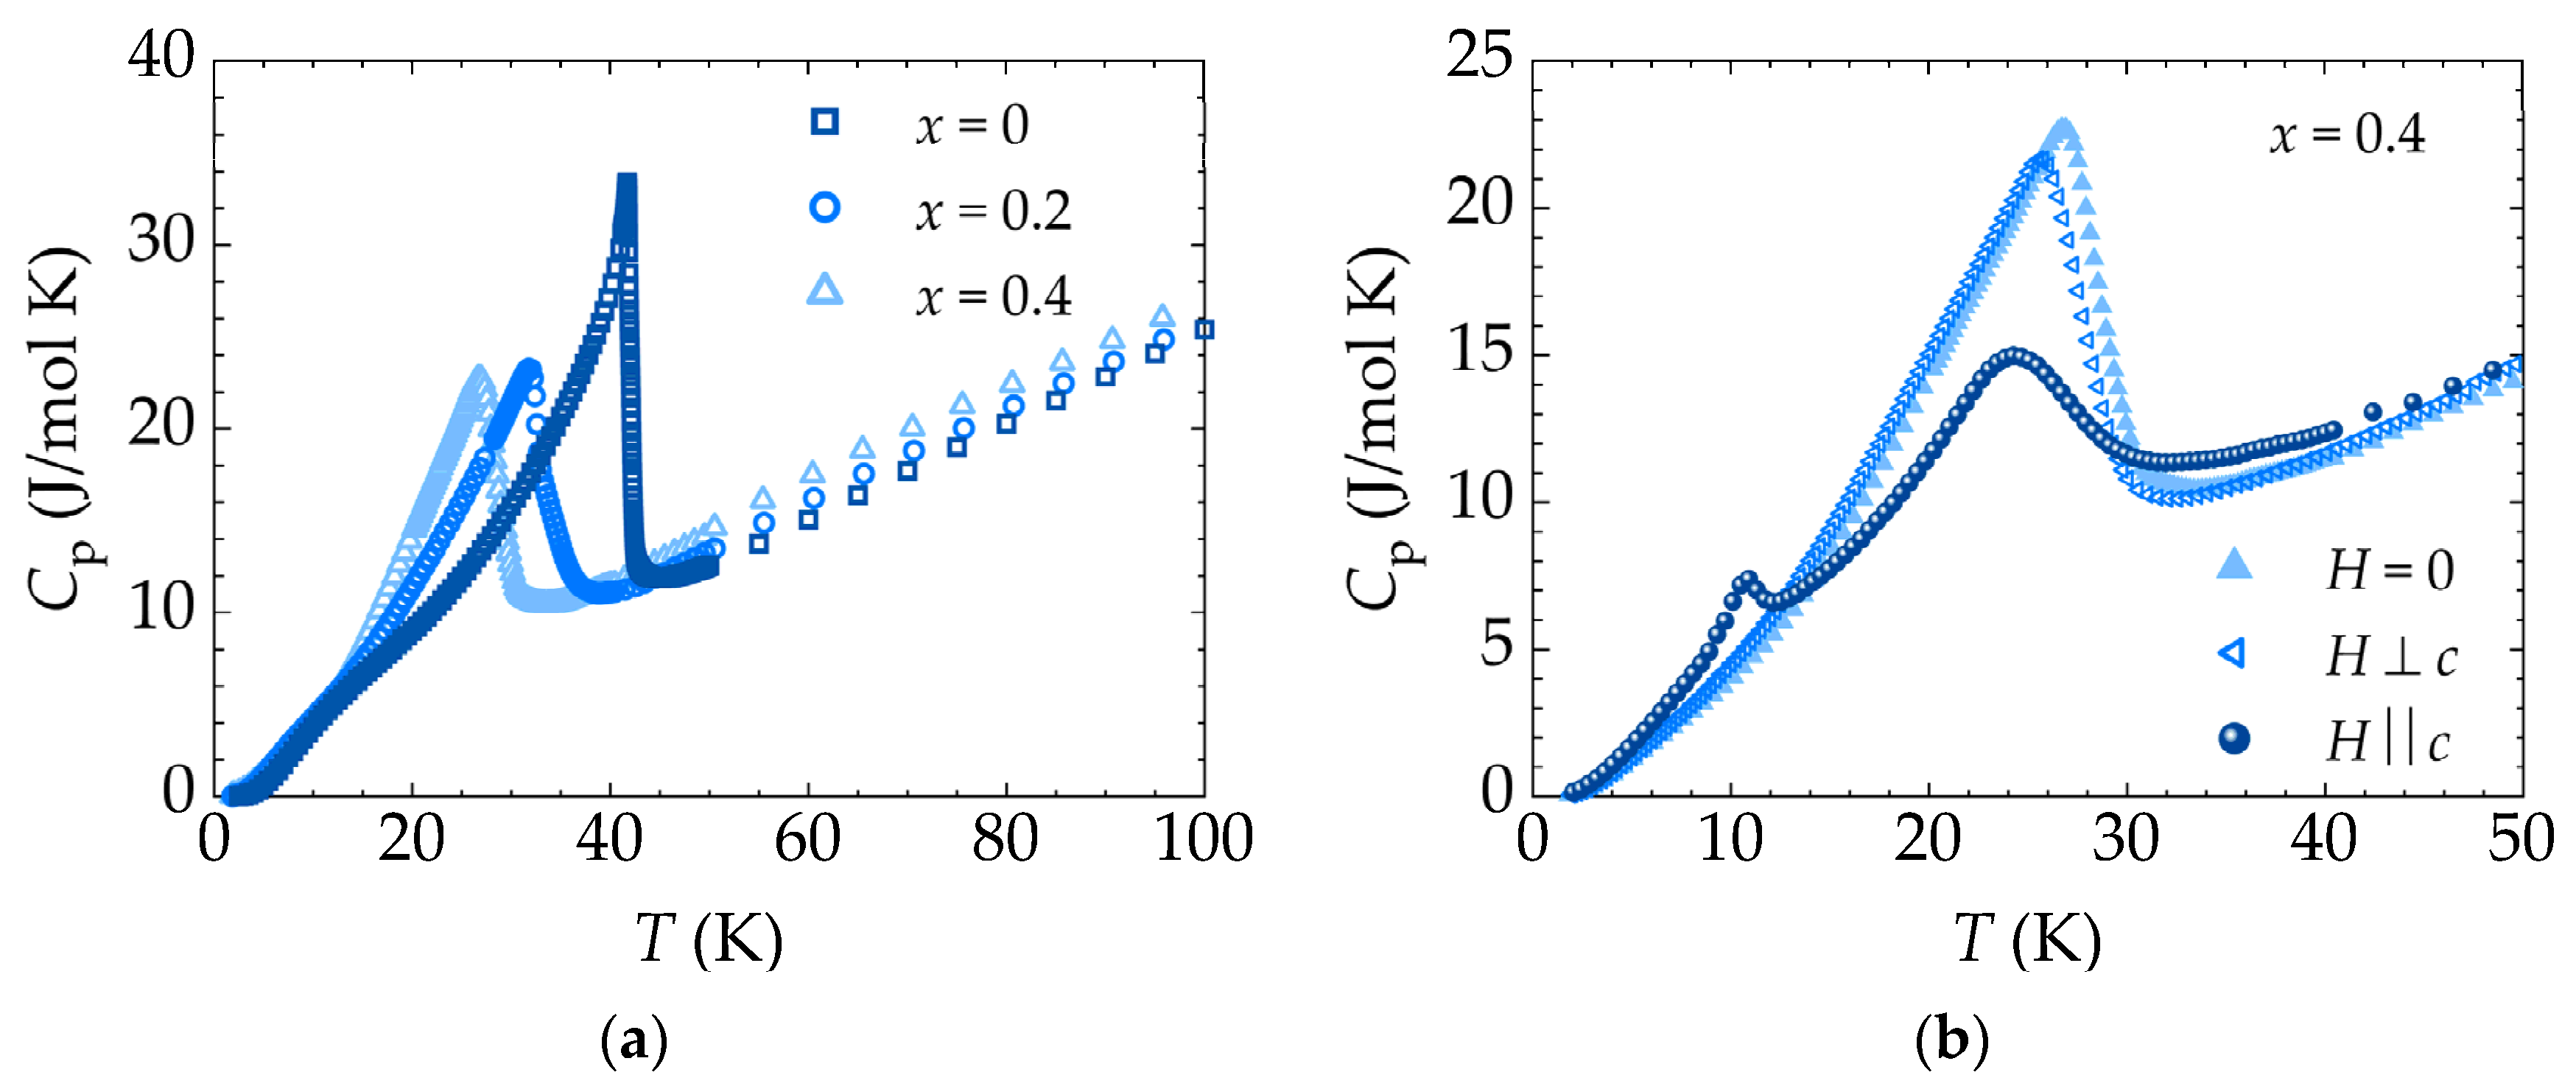
x = 0, 0.2, and 0.4) crystals are shown in
Figure 6a. The
Cp(
T) curve for the undoped GdB
4 clearly shows a pronounced peak at the Néel temperature
TN = 41.8 K, indicating a transition from a paramagnetic (PM) to an antiferromagnetic (AFM) phase. Upon the partial substitution of Er for Gd, the magnetic ordering feature shifts to lower temperatures, reaching 31.8 and 26.8 K for Gd
0.8Er
0.2B
4 and Gd
0.6Er
0.4B
4, respectively. A small bump centered near
T ≈ 10 K is observed in GdB
4, a feature frequently observed in other lanthanide compounds and attributed to the Schottky contribution to the heat capacity [
18]. The occurrence of this feature remains in the
x = 0.2 sample but is much more suppressed in
x = 0.4 crystal. Previous studies have shown that the Schottky contribution to the heat capacity in ErB
4 occurs at higher temperatures [
19].
At low temperatures, the heat capacity can be approximated by the relation
Cp =
Cel +
Clatt +
CSch +
Cm, where
Cel,
Clatt,
CSch, and
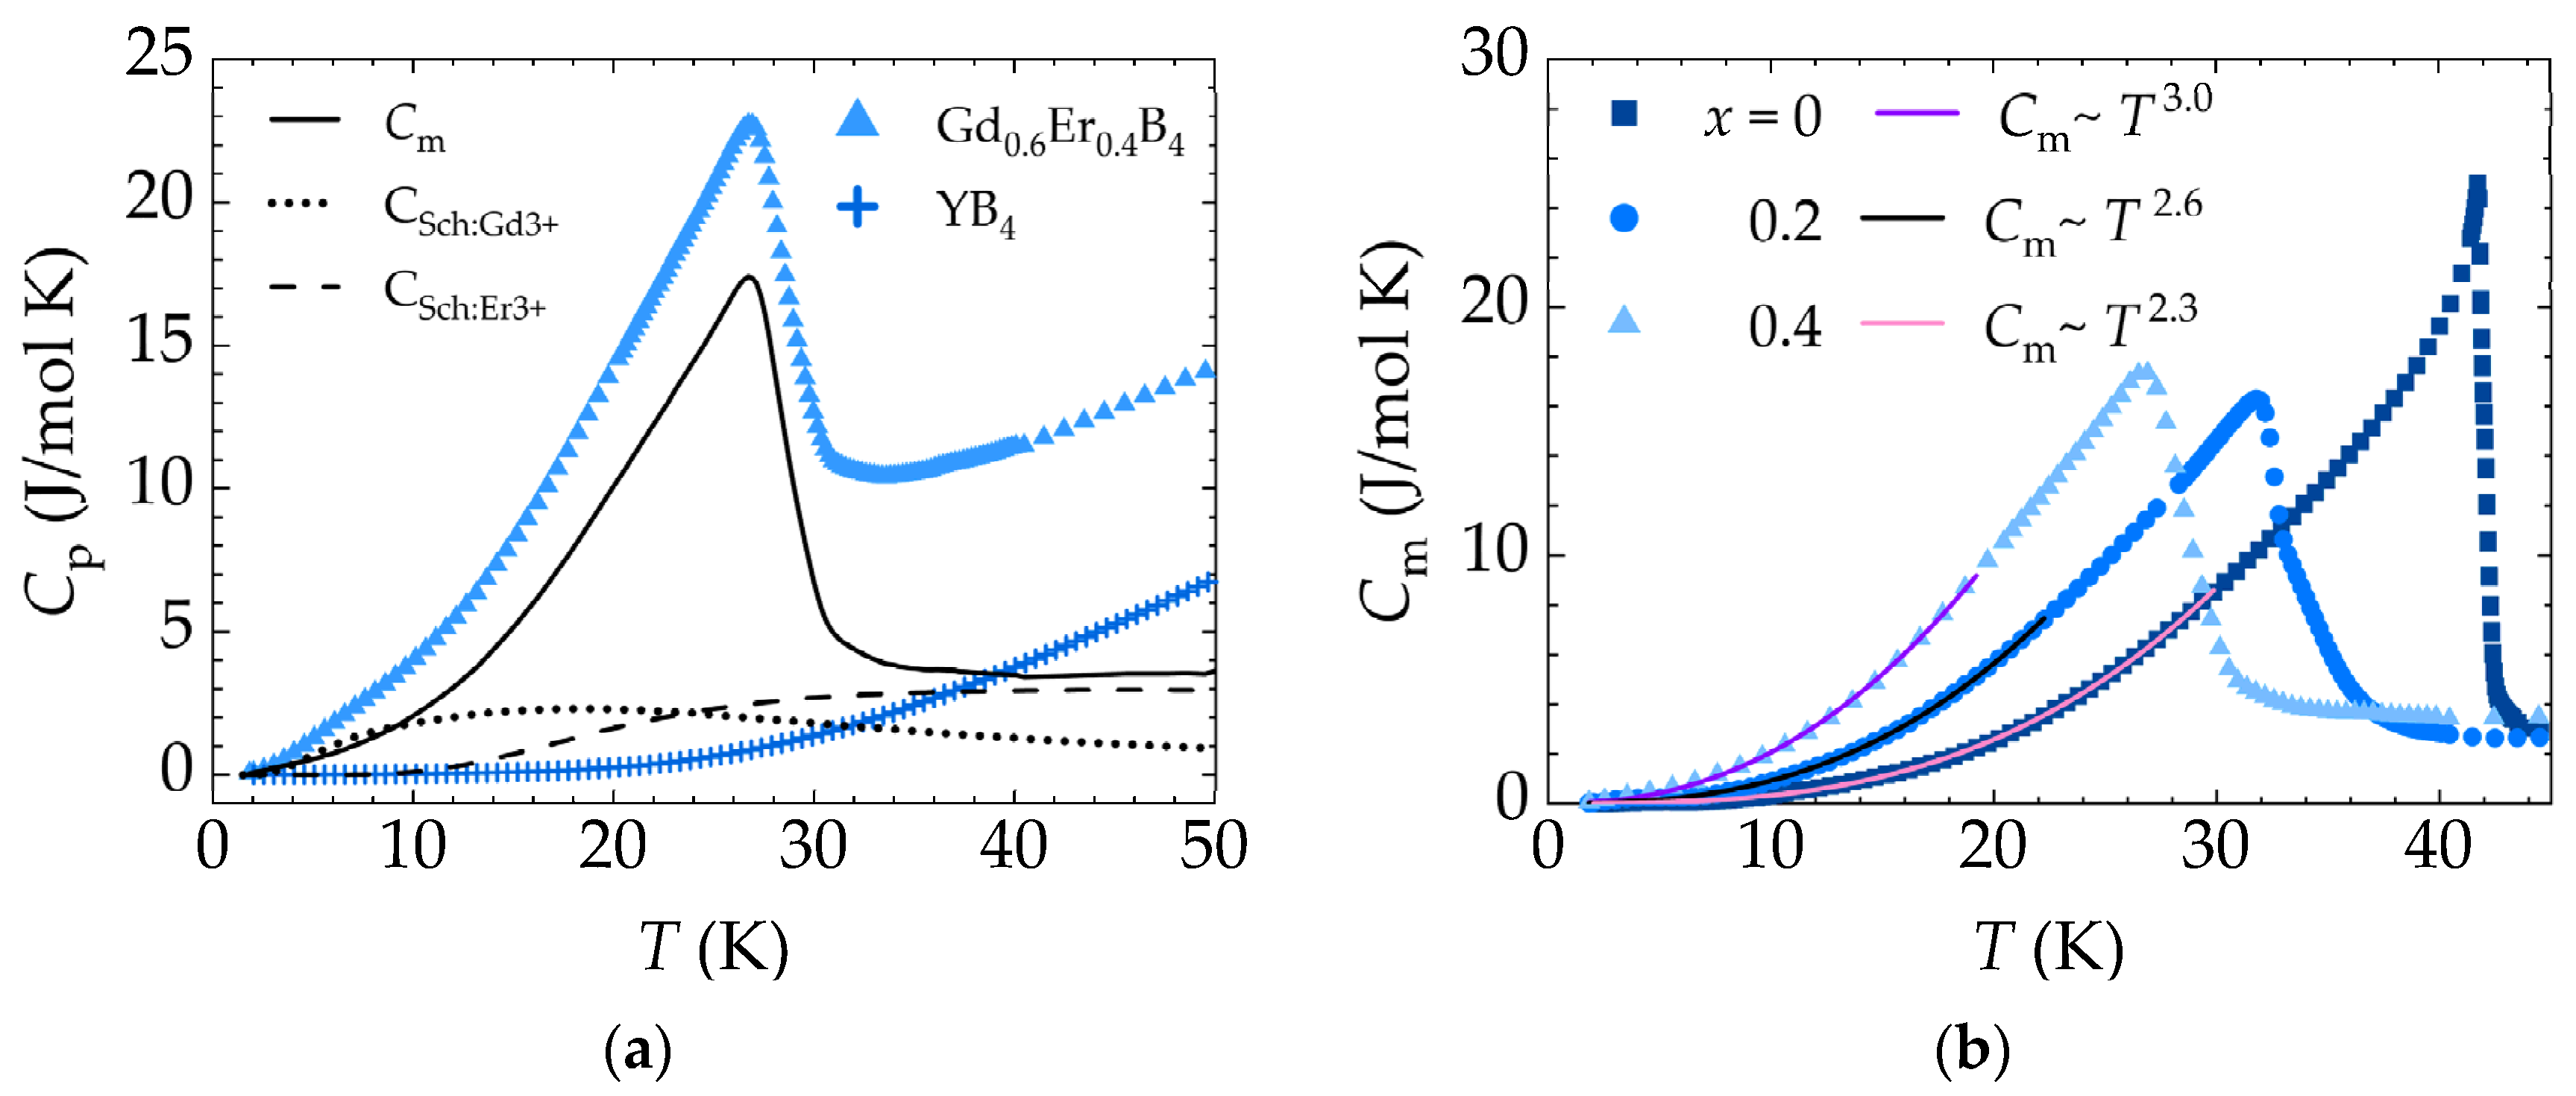
Cm are the contributions due to the electron system, phonon, Schottky anomaly, and magnetic subsystem, respectively. To probe the effect of the partial change of Er for Gd in the sample magnetism, the magnetic contribution
Cm for each composition was estimated, as depicted in
Figure 7b. The phonon contribution
Clatt was estimated using the method described by Stout and Catalano [
20], which relies on measuring the heat capacity
Cp of a nonmagnetic isomorph, which in this case was YB
4.
The heat capacity of YB
4 at low temperatures can be expressed as
Cp:YB4 =
Cel +
Clatt =
aT +
bT3, where
a = 12⋅10
-4 J/mol K
2 and
b = 2.1⋅10
-5 J/mol K
4, values obtained by fitting. Comparable values of
a and
b have been reported for GdB
4 (
a = 5.96⋅10
-4 J/mol K
2 and
b = 4.89⋅10
-5 J/mol K
4) and ErB
4 (
a = 8.46⋅10
-4 J/mol K
2 and
b = 6.82⋅10
-5 J/mol K
4) in previous studies [
18,
19]. Therefore, it is reasonable to assume that the contributions of
Cel and
Clatt to the heat capacity of the
series are like those of YB
4. Consequently, the specific heat of YB
4 was subtracted from the specific heat of the
series, enabling the determination of the specific heat associated with the Schottky and magnetic anomalies.
The contribution to the specific heat due to the Schottky anomaly
CSch for a system with
n levels, separated by energies
and with degeneracy
, is given by
where
R is the ideal gas constant and
is given in kelvin. The
CSch curve for all samples was obtained by fitting the data below
TN using the equation
C =
AT α +
CSch, where
AT α represents the magnetic specific heat contribution, with α = 3 for AFM systems. As initial parameters for the Schottky anomaly, the data from Ref. [
18] for Gd
3+ were used, where
,
,
,
, and
. For Er
3+, the data from Ref. [
19] are
,
,
,
,
,
, and
. For the fitting procedure, only
and
for Gd
3+ were free parameters. The parameters for Er
3+ were kept fixed since initial fits indicated their values did not vary significantly. Thus,
Cm was obtained by subtracting the fitted
CSch, considering the proportional contribution due to the Gd
3+ and Er
3+.
The different contributions to the total specific heat is exemplified in
Figure 7a, for the
x = 0.4 sample. After isolating the
Cm curve, its temperature dependence was investigated by fitting to the equation
for temperatures up to 0.7
TN, as shown in
Figure 7b. For GdB
4, α = 3, as expected for antiferromagnetic systems. The exponent α decreases to 2.6 and 2.3 for the samples with
x = 0.2 and 0.4, respectively, approaching the 1.5 value, expected for ferromagnetic systems. This is an indication of a change in the system's ordering, due to the possible competition between magnetic anisotropies.
In order to probe the competition between magnetic anisotropies, we have performed measurements of
Cp(
T) in magnetic fields
H up to 9 T. Shown in
Figure 6b is the effect of a magnetic field
H = 5 T applied along the two different crystallographic directions in Gd
0.6Er
0.4B
4, resulting in a drop in the temperature of the
Cp peak at
TN, and a significant change in morphology for
H//
c. In general, for fields in the -9 T ≤
H ≤ +9 T range, the value of
TN drops by ~ 15% and ~7% for fields applied parallel and perpendicular to the
c-axis, respectively. In contrast,
Cp(
T) for the Gd
0.8Er
0.2B
4 is nearly insensitive to the magnetic field (data not shown), with the value of
TN dropping but staying within 3% of the zero-field value, for both orientations.
In addition to the main feature at
TN, the
Cp(
T) data for Gd
0.6Er
0.4B
4, shown in
Figure 6b, presents a second feature at low temperatures, centered near 10 K, when a 5 T magnetic field is applied parallel to the
c-axis. This peak, observed only in Gd
0.6Er
0.4B
4, is possibly due to a metamagnetic transition, occurring exclusively along the
c-axis, as suggested by the magnetization data.
3.3. Magnetization
The temperature-dependent magnetic susceptibility curves
χ (=
Μ /
H) ×
T for
(
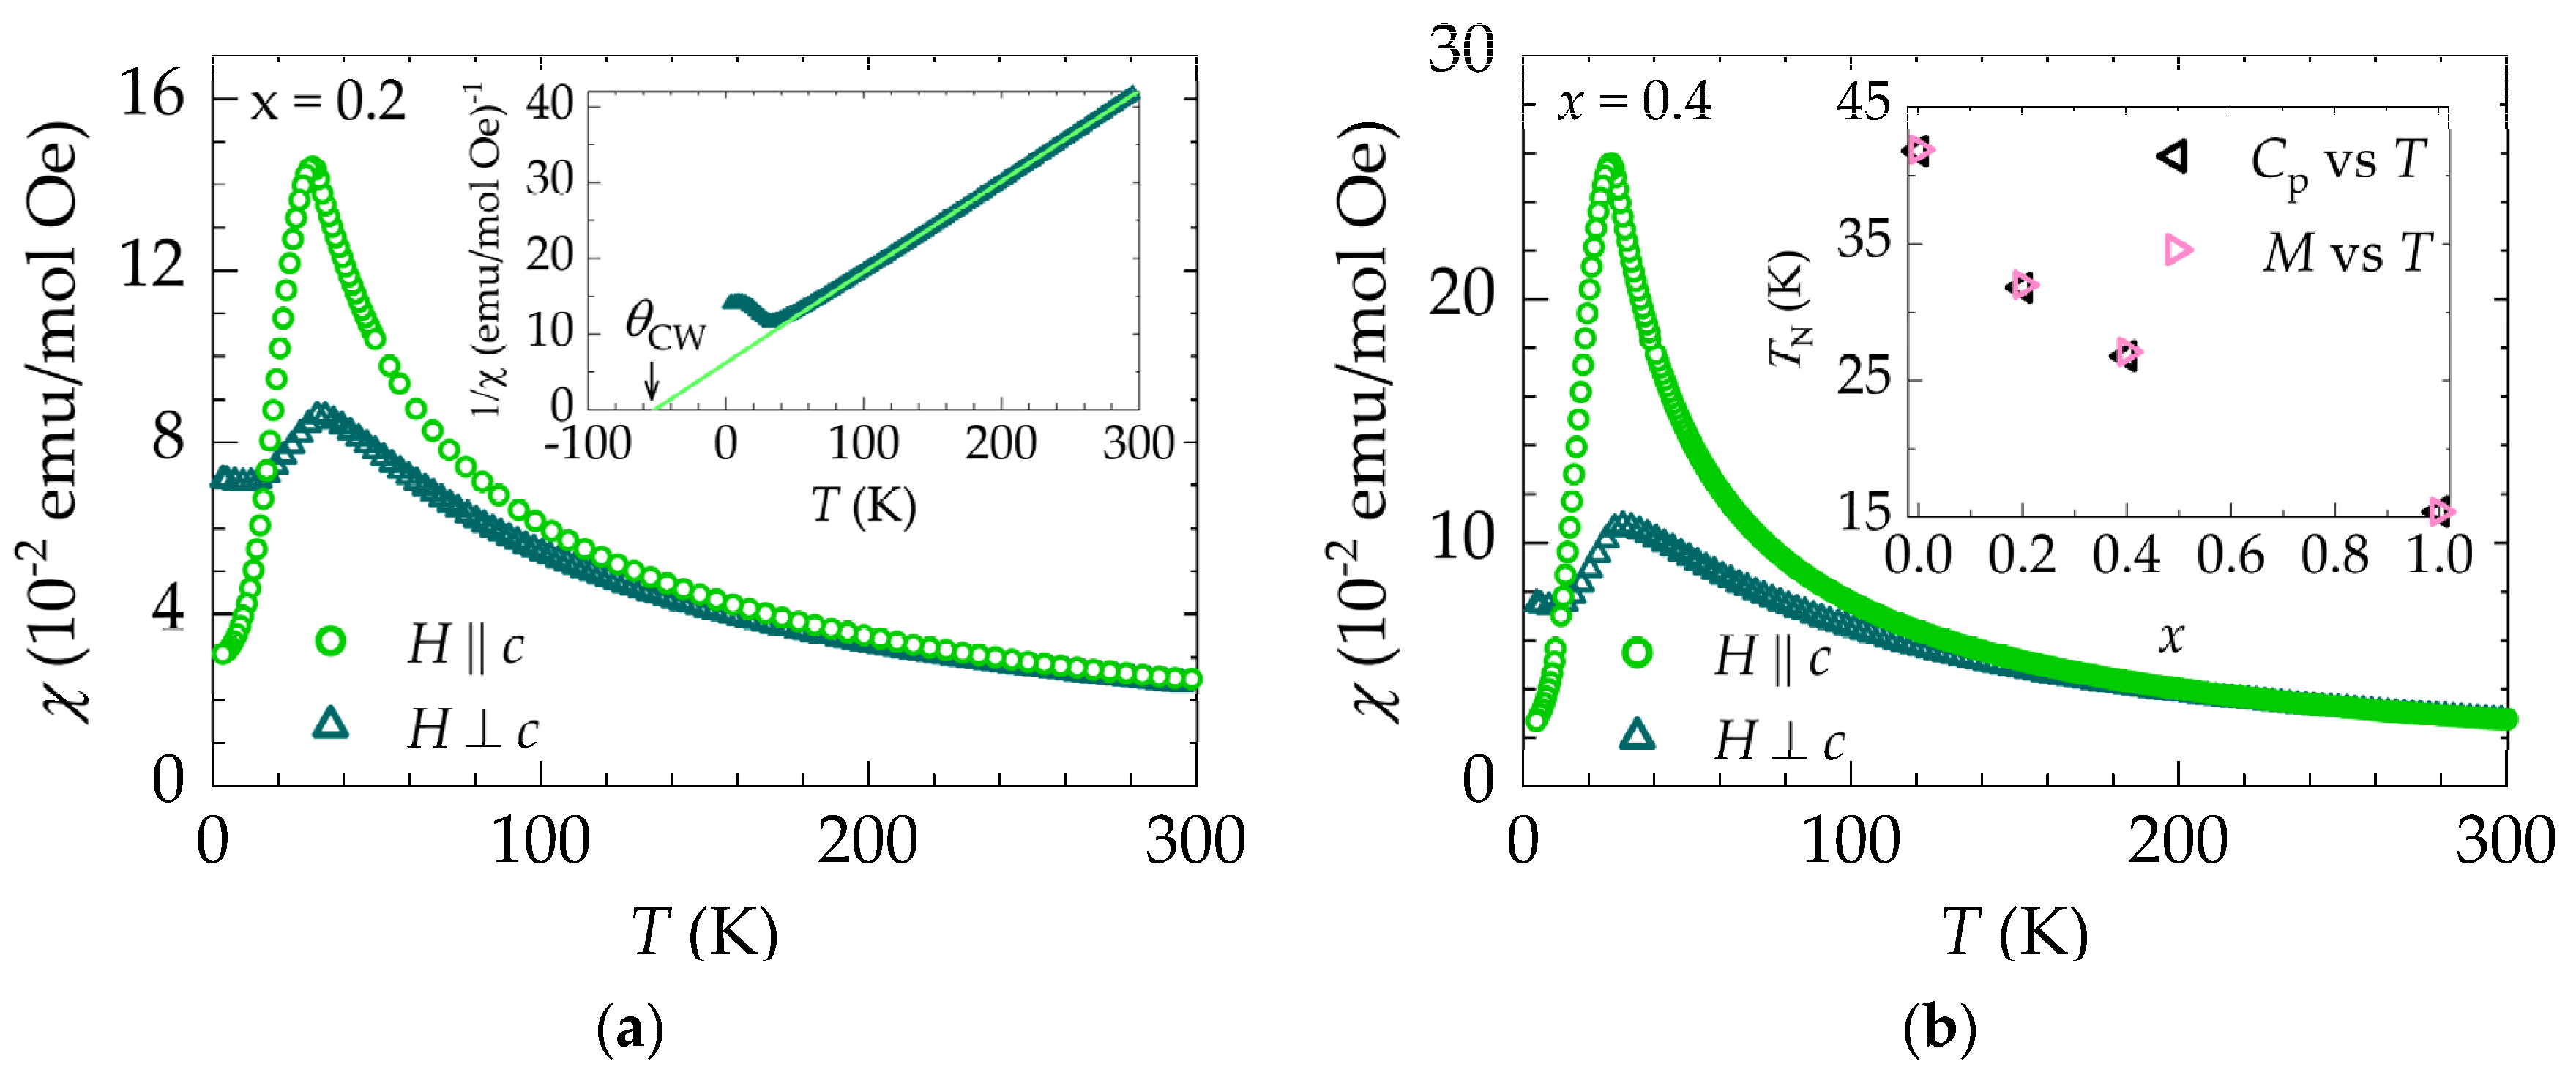
x = 0.2 and 0.4), taken in 0.5 T magnetic fields parallel or perpendicular to the
c-axis, are shown in
Figure 8. The maximum value of
χ occurs approximately at the same
TN determined from the
Cp(
T) measurements of
Figure 6. The value of
TN was taken from the minimum of the second derivatives
. Consistently with the
Cp(
T) data,
TN drops with the Er concentration, as shown in the inset of
Figure 8b.
For both
x = 0.2 and
x = 0.4 samples,
χ (
T) exhibits anisotropic behavior up to ~ 150 K, a temperature considerably higher than
TN. In contrast, the undoped GdB
4 displays anisotropic
χ (
T) behavior only below
TN. Notably, the partial substitution of 20% Er seems to be sufficient to induce this anisotropic behavior, reminiscent of the behavior in ErB
4 [
9]. To gauge the magnitude of the anisotropy at 4 K, we calculated the ratio of the susceptibilities perpendicular and parallel to the
c-axis and obtained 2.3 and 2.8 for
x = 0.2 and 0.4, respectively. On the other hand, the susceptibilities parallel to the
c-axis are higher near
TN, exhibiting a magnitude of 1.7 and 2.8 times greater than the perpendicular susceptibility for the
x = 0.2 and
x = 0.4 samples, respectively. The magnetic susceptibility data for Gd
0.8Er
0.2B
4 show that the substitution of 20% of Er favors the
c-axis for spins alignment, since
χ tends to lower values with decreasing temperature, while the perpendicular susceptibility shows a small temperature dependence.
As shown in the inset of
Figure 8a for Gd
0.8Er
0.2B
4, the magnetic susceptibility (
) in the PM region follows the Curie-Weiss law [
21]
where
is the Curie-Weiss constant, which is usually associated with the magnetic interactions between PM ions, expressed in units of temperature, and
is the Curie constant, given by
Here
is the Avogadro’s number,
the Boltzmann constant, and
the effective magnetic moment, calculated from
where
is the Landé
g-factor,
the total quantum number, and
the Bohr magneton. The theoretical values of
calculated for Gd
3+ and Er
3+ are 7.94 and 9.58
, respectively.
For the
solid solutions the theoretical values of
can be approximately obtained from
On the other hand, the experimental values of
can be obtained by fitting the
vs
data to the expression
resulting from combining Equations (2) and (3), with
= 6.022⋅10
23 mol
-1,
=
erg/K, and
= 9.274⋅10
-21 emu, as shown in the inset of
Figure 8a. The experimental values of
obtained from fits of the experimental data to Equation (6) at temperatures above 100 K, are displayed in
Table 2. The
values obtained from the
data with field along the two crystallographic directions are consistent with the calculated
values for the Gd
3+ and Er
3+ free ions, providing additional evidence for the effective partial substitution of Er for Gd within this series.
The data displayed in
Table 2 indicate that the effective magnetic moments
for GdB
4 and Gd
0.8Er
0.2B
4 are only slightly different for the two orientations of the magnetic field, suggesting that the magnetic anisotropy in these two compositions is very small. Upon normalization with respect to parameters associated with the
c-axis, the difference between these values amounts to 0.5% and 0.7% for
x = 0 and
x = 0.2, respectively. On the other hand, there is a marked difference of 4.6% between the two values for the x=0.4 composition, a value close to the increased magnetic anisotropy in the Gd
0.6Er
0.4B
4 crystal.
The magnetic anisotropic behavior of χ(T) is also noted in the Curie-Weiss constant for the x = 0.2 and 0.4 samples. The difference between values obtained along directions parallel and perpendicular to the c-axis also increases with x. These differences are 5.7%, 46%, and 220% for crystals with x = 0, 0.2, and 0.4, respectively.
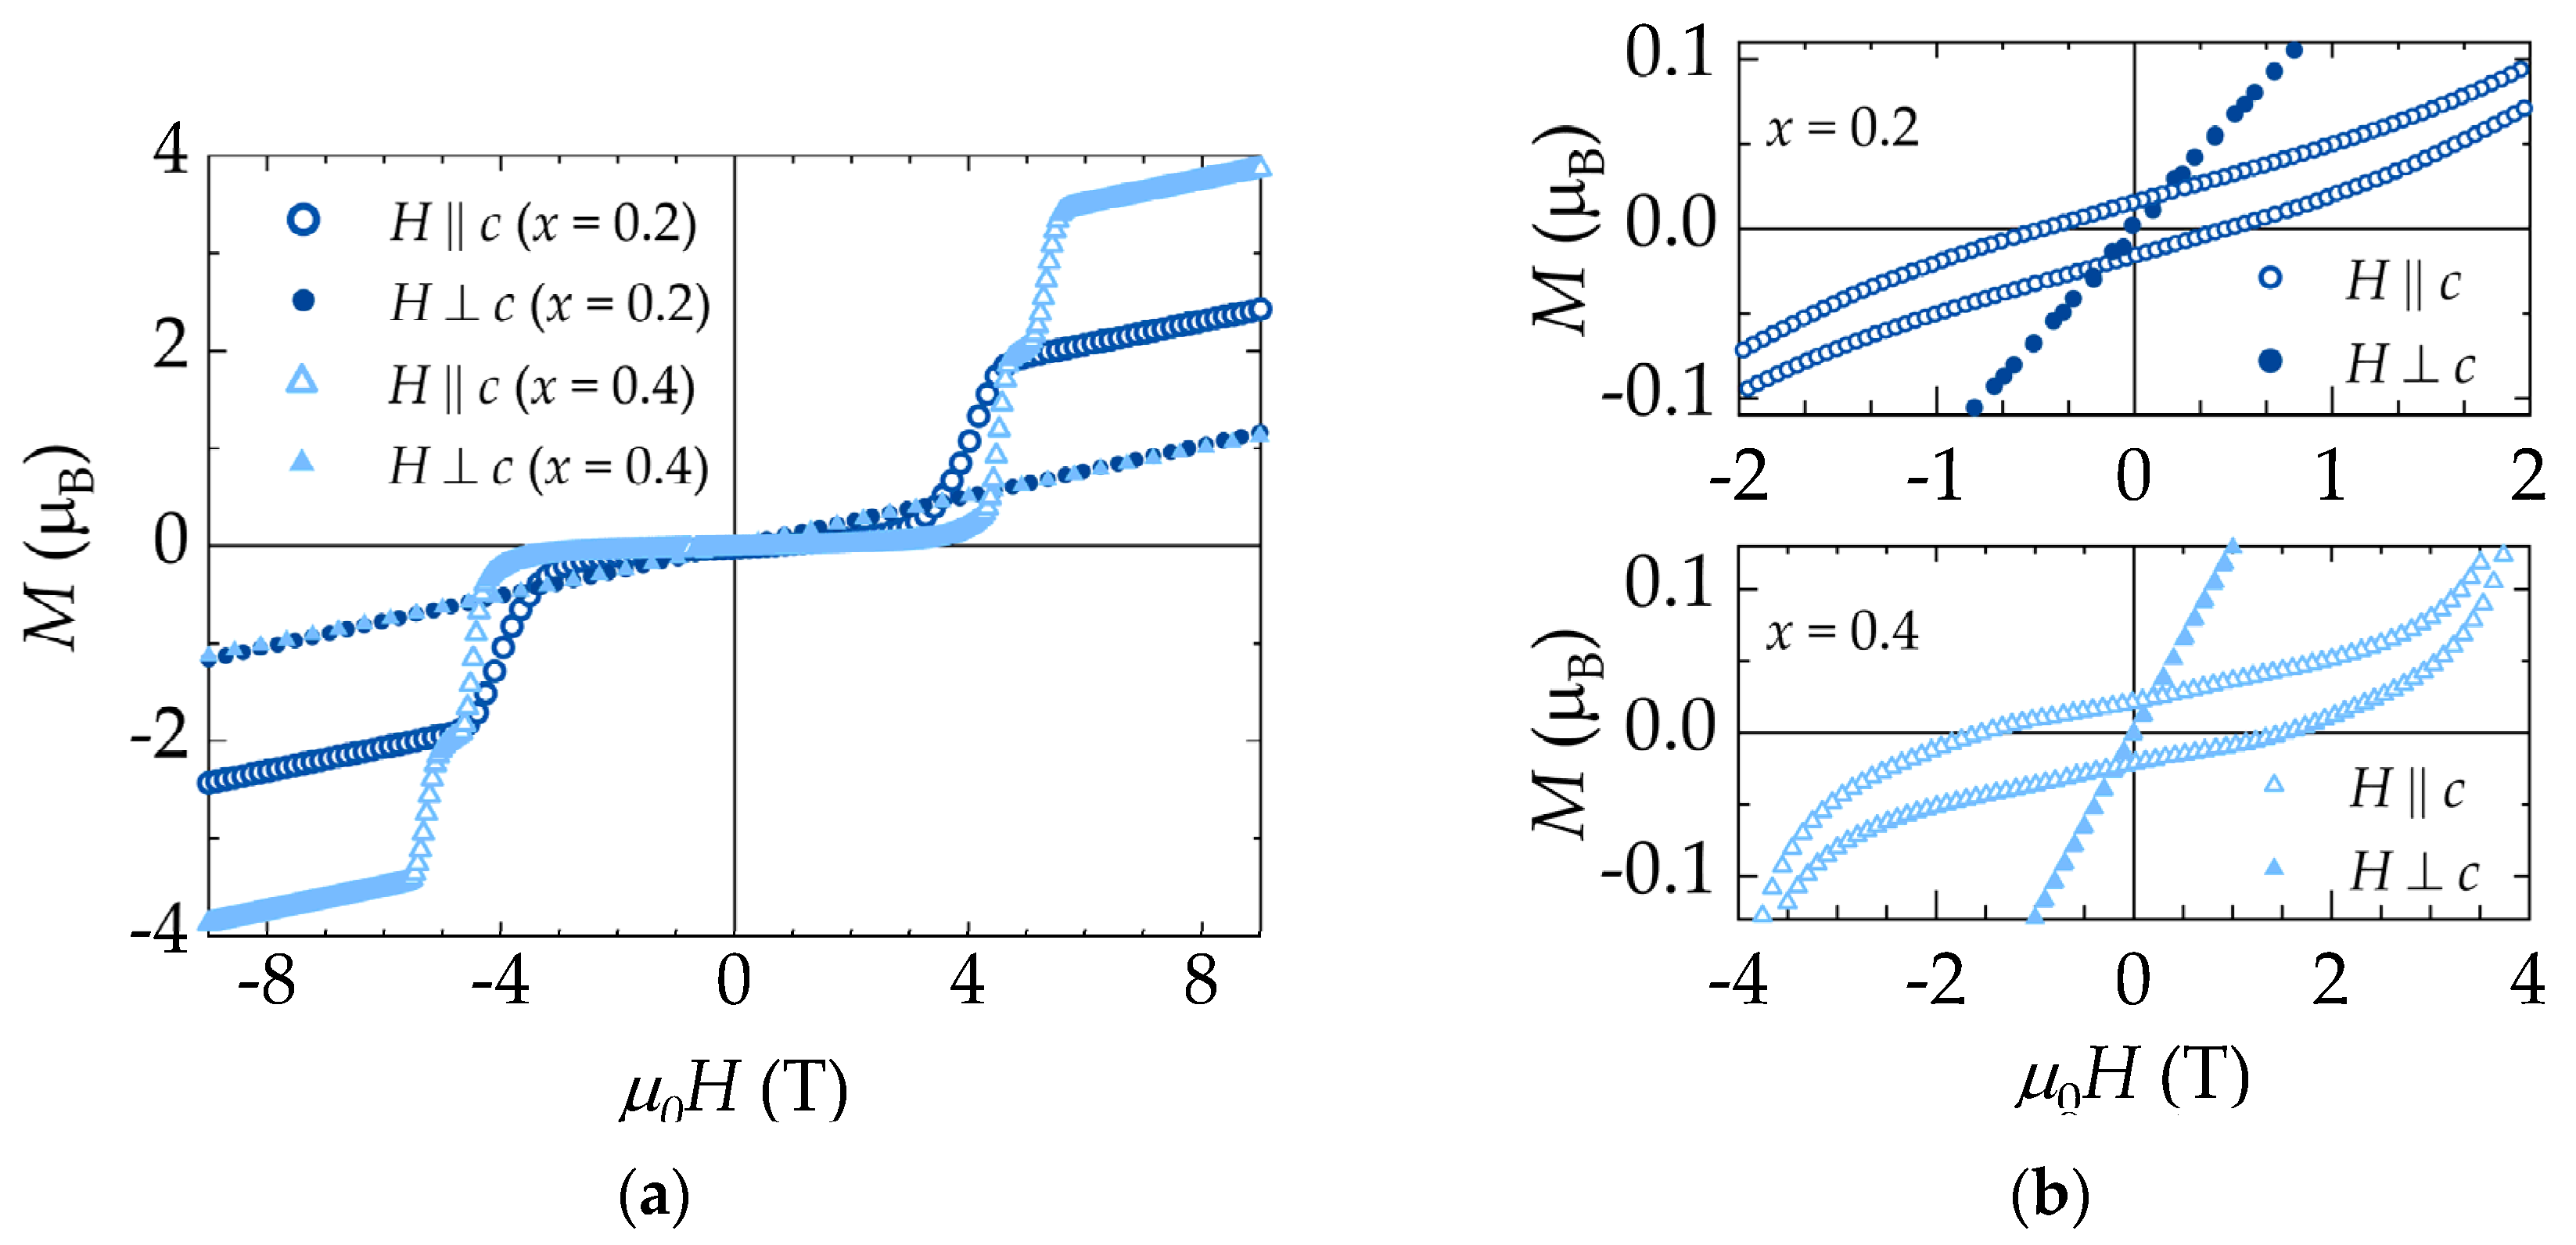
The occurrence of appreciable magnetic anisotropy in the
series is also noticeable in the isothermal magnetization curves for
x = 0.2 and 0.4 samples, as shown in
Figure 9, provided that the magnitudes of magnetization differ significantly when measured along two distinct crystallographic directions. Also, a careful examination of
Figure 9b clearly shows an increase in anisotropy with the Er content.
Although GdB
4 and ErB
4 are antiferromagnetic systems that exhibit magnetization curves without hysteresis, the
x = 0.2 and 0.4 composition show anomalous remnant magnetization behavior. As shown in
Figure 9b, these samples display an appreciable coercive field at 5 K, with
HC values of ~ 0.46 T and ~ 1.53 T for
x = 0.2 and 0.4, respectively. This anomaly is also significantly anisotropic, i.e., it is more pronounced for
H applied along the
c-axis. In the
x = 0.2 sample, a minor hysteresis is observed along the direction perpendicular to the
c-axis, with an
HC value of ~ 0.025 T. In addition, for the
x = 0.4 sample, the coercive field and remnant magnetization are negligibly small along the (001) plane.
As the applied magnetic field along the
c-axis increases, Gd
0.6Er
0.4B
4 displays two magnetic transitions for
H ≤ 9 T, as shown in
Figure 9a. The first (near 4.5 T) is suggestive of a metamagnetic transition, characterized by a magnetization plateau state occurring at
M/
MS = ½, where
MS is the saturation magnetization of the Er
3+ ions. The second transition corresponds to the full alignment of the Er
3+ ions along the
c-axis. The theoretical value of the saturation magnetization per Er
3+ ion is
. Based on this value, the saturation magnetization for the Er
3+ ions in the
x = 0.4 sample corresponds to 3.6
.
Immediately after a magnetic field of 5.6 T, the transition to the total magnetization of the system reaches a value close to 3.46 . By subtracting the contribution of the Gd3+ ions, the experimental saturation magnetization corresponding to the Er3+ ions is 94% of the theoretical value. In this procedure, as a first approximation, we assume that the Gd3+ ions contribute linearly to the system's magnetization with H, corresponding to the initial slope of the virgin magnetization curve up to the considered magnetic field of 5.6 T.
Only one field-induced transition is observed for the Gd
0.8Er
0.2B
4 composition, as shown in
Figure 9a. Using the same procedure applied for the x = 0.4 composition to subtract the contribution of the Gd
3+ ions, the magnetization attributed to the Er
3+ ions amount to 99% of the theoretical value of the expected saturation magnetization. These results reveal that the transition to the plateau state only takes place in the
x = 0.4 sample, while the transition to the field-induced paramagnetic state, corresponding to the full alignment of the magnetic moments of Er
3+, occurs for both
x = 0.2 and
x = 0.4 compositions.
In contrast,
M ×
H curves with field applied perpendicular to the
c-axis do not show field induced transitions in fields up to 9 T, as shown in
Figure 9. This finding is consistent with the specific heat data of
Figure 6b, where a metamagnetic transition is detected as a second peak occurring at low temperatures for a 5 T magnetic field also applied along the
c-axis. When the same magnitude of magnetic field is applied perpendicular to the
c-axis, only a single maximum is observed in the
Cp ×
T curve, corresponding to the transition to the AF state. Similar findings are observed for magnetic fields up to 9 T applied perpendicular to the
c-axis (data not shown). According to studies conducted in ErB
4 [
9], two field-induced transitions occur for fields applied parallel and perpendicular to the
c-axis. At 1.5 K, the plateau state is maintained between 2 and 4 T along the
c-axis and between 11.5 and 13.0 T along the
a-axis. Therefore, if these magnetic transitions exist along the direction perpendicular to the
c-axis, they were not observed in our lightly Er-doped materials, as our experimental measurements were conducted up to a maximum applied magnetic field of 9 T. When comparing the
M ×
H curves along the
c-axis for Gd
0.6Er
0.4B
4 with pure ErB
4, the transition to the plateau state in the
x = 0.4 sample occurs at relatively higher magnetic fields, and this state is maintained within a narrow range of 4.5 to 5.3 T.
It is interesting to note that GdB
4 and TbB
4 are the only members of the
RB
4 family that have the easy axis along the
ab-plane. In the case of GdB
4, Gd´s 4f shell is half filled, with
L = 0, so the ions are in the s-state, and the anisotropy in the ordered phase comes mainly from the exchange interaction [
23], which is small. It is suggested that this small magnetic anisotropy is the reason why no plateaus are observed in the
M ×
H curves [
24]. Therefore, the doping with Er seems to be a convenient way to induce anisotropy in the magnetic properties GdB
4. Our findings suggest that 40% of substitution of Er for Gd is already enough to provoke the appearance of a plateau phase in the
M ×
H curves.
