Key Points
Specific biogenic amine level changes are associated with surgery and concurrent chemoradiation.
Integrating metabolomics with machine learning approaches carries future potential in detecting glioblastoma and its recurrence.
Validation and mechanistic investigations are needed for clinical translation, benefiting patient management and outcomes.
Relevance of the Study
Metabolomic alteration is a characteristic of cancer. Biogenic amines can be used as diagnostic and prognostic biomarkers as well as to identify aberrant metabolic pathways, which could lead to new interventional strategies. In the present study, we show specific plasma biogenic amines changes associated with surgery and concurrent chemoradiation therapy in glioblastoma patients undergoing treatment. This could carry future diagnostic potential for early glioblastoma detection or recurrence of disease.
1. Introduction
Glioblastoma is the most common primary malignant brain tumor in adults, and universally carries a poor prognosis (Ostrom et al., 2019). First line treatments typically include maximal safe resection, radiation therapy (RT), and chemotherapy using temozolomide (TMZ). This treatment is associated with improvement in 2-year survival rates compared with previous treatments (Stupp et al., 2005). Despite these treatments, glioblastoma universally recurs, and the overall prognosis remains poor with 5 years relative survival rate of 6.6% (Low et al., 2022). These tumors acquire new mutations that result in resistance to treatment (Barthel et al., 2019). Further, these mutations will cause plasma metabolic changes that are detectable by metabolomic techniques at the time of diagnosis of brain tumors (Baranovicova et al., 2019). We have recently reported changes in metabolomic profiles in patients undergoing treatment (Aboud et al., 2023). However, little is known about the changes in the profiles of biogenic amines in patients after concurrent radiation and TMZ.
In this report, we prospectively enrolled a cohort of patients with isocitrate dehydrogenase (IDH) wildtype glioblastoma, as defined by the new World Health Organization (WHO) classification and performed untargeted metabolomics for biogenic amines before and after surgery, as well as before and after concurrent chemoradiation. Here, we propose a data-driven approach of integrating metabolomics with machine learning to categorize plasma levels of biogenic amines in glioblastoma patients undergoing standard of care treatment.
2. Materials and Methods
2.1. Patients
Thirty-six patients with histopathological confirmed diagnoses of IDH wildtype glioblastoma, WHO Grade 4 (Louis et al., 2021) were enrolled into this study. Institutional Review Board of The University of California Davis was obtained along with written informed consents from all patients. We obtained demographic and clinical data for the study subjects via medical record review. Patients received standard-of-care initial treatment with surgical resection, concurrent RT and chemotherapy. Blood samples were collected before surgery (BS), two days after surgery (S), prior to starting radiation therapy (RT), after completing radiation therapy (PRT), as well as after adjuvant chemotherapy treatment (PT).
2.2. Biogenic Amines profiling
Untargeted plasma metabolomics by hydrophilic interaction liquid chromatography triple time of flight TTOF mass spectrometry (HILIC-TTOF MS) was performed at the UC Davis West Coast Metabolomics Center. Plasma metabolites extraction has been previously described (Barupal et al., 2019). Metabolite profiling using HILIC-TTOF-MS was performed on the Agilent 1290 UHPLC/Sciex TripleTOF 6600 mass spectrometer under positive and negative ionization mode. Metabolites (injection volume 5 µL) were separated using Waters Acquity UPLC BEH Amide column (1.7µm, 2.1 x 150 mm) and a binary mobile phase consisted of 100% LC-MS grade H2O with10 mM Ammonium formate and 0.125% formic acid as solvent solvent A and 95:5 (v/v) ACN:H2O with 10 mM ammonium formate with 0.125% formic acid as solvent B. Mobile phase was running under gradient conditions with a flow rate of 0.8 mL/min. Column temperature was kept at 45 °C. Data were acquired in data-dependent acquisition mode with a mass range 50-1500 m/z for MS1 and 40-1000 m/z for MS2.
2.3. Raw data processing, metabolite, annotation, and statistical analysis
MS-Dial 4.6 was used for processing the acquired raw LC–MS data including peak-picking, peak alignment and annotation of related peaks (Barupal
et al., 2019). Simca P+14 (Sartorius Stedim Data Analytics AB, Umea, Sweden) was used to generate partial least square-discriminative analysis (PLS-DA) score plot. The imported datasets (identified metabolites (
Rt,
m/z) pairs with their normalized peak heights were mean centered and auto scaled. MetaboAnalyst 5.0 (McGill University, Montreal, QC, Canada) (
http://www.metaboanalyst.ca) (Pang
et al., 2021) was used to generate heat maps. GraphPad Prism 9 (version 9.5, San Diego, CA) was used to generate volcano plots. The processed peak heights with their annotation were imported to MetaboAnalyst, normalized to the total sample median and auto scaled. Unpaired Student’s
t-Test was used to identify significantly altered metabolites between the compared groups (
p-value < 0.05 was considered significant). Enrichment analysis was done using the freely available statistical tool ChemRICH (Chemrich.fiehnlab.ucdavis.edu). Individual metabolite abundance comparisons were performed using GraphPad Prism 9 (version 9.5, San Diego, CA).
3.2. Machine learning modeling: data pre-processing and machine learning models
3.2.1. Dataset
The full dataset consisted of 137 samples after removing one with more than 50% missing biogenic amines. Each sample was associated with one of the five treatment stage classes: pre-surgery, post-surgery, pre-radiation, post-radiation, and post-adjuvant treatment. While splitting the dataset into training and testing sets, we ensured each split was stratified, maintaining the original class distribution. In addition, since multiple samples could be associated with a single patient, we also ensured that samples from the same patient would not appear across different splits. Finally, we use an 80-to-20 split, resulting in 110 and 27 samples for the training and testing sets, respectively (Section 1.1.1 of Supplementary Information).
3.2.2. Model selection
We implemented a model selection with Scikit-learn (Pedregosa et al., 2011) to choose the optimal machine learning model for this dataset, where we considered five classifiers: Logistic Regression (LR) (Berkson, 1944), Support Vector Machine (SVM)(Boser et al., 1992), Random Forest (RF) (Breiman, 2001), AdaBoost (AB) (Freund and Schapire, 1995), and Multilayer Perceptron (MLP) (David and James, 1987). For each classifier, we performed a grid search with 5-fold cross-validation to tune the best hyperparameter (Supplementary Table 1). Note that while generating splits for the cross-validation, we ensured that each split was stratified and did not share the same patient, similar to training-testing splits (Section 1.1.2 of Supplementary Information). Finally, for the selected model with the best accuracy, we performed sequential feature selection implemented by MLxtend (Raschka, 2018) to select the most predictive subset of features.
3. Results
3.1. Patients
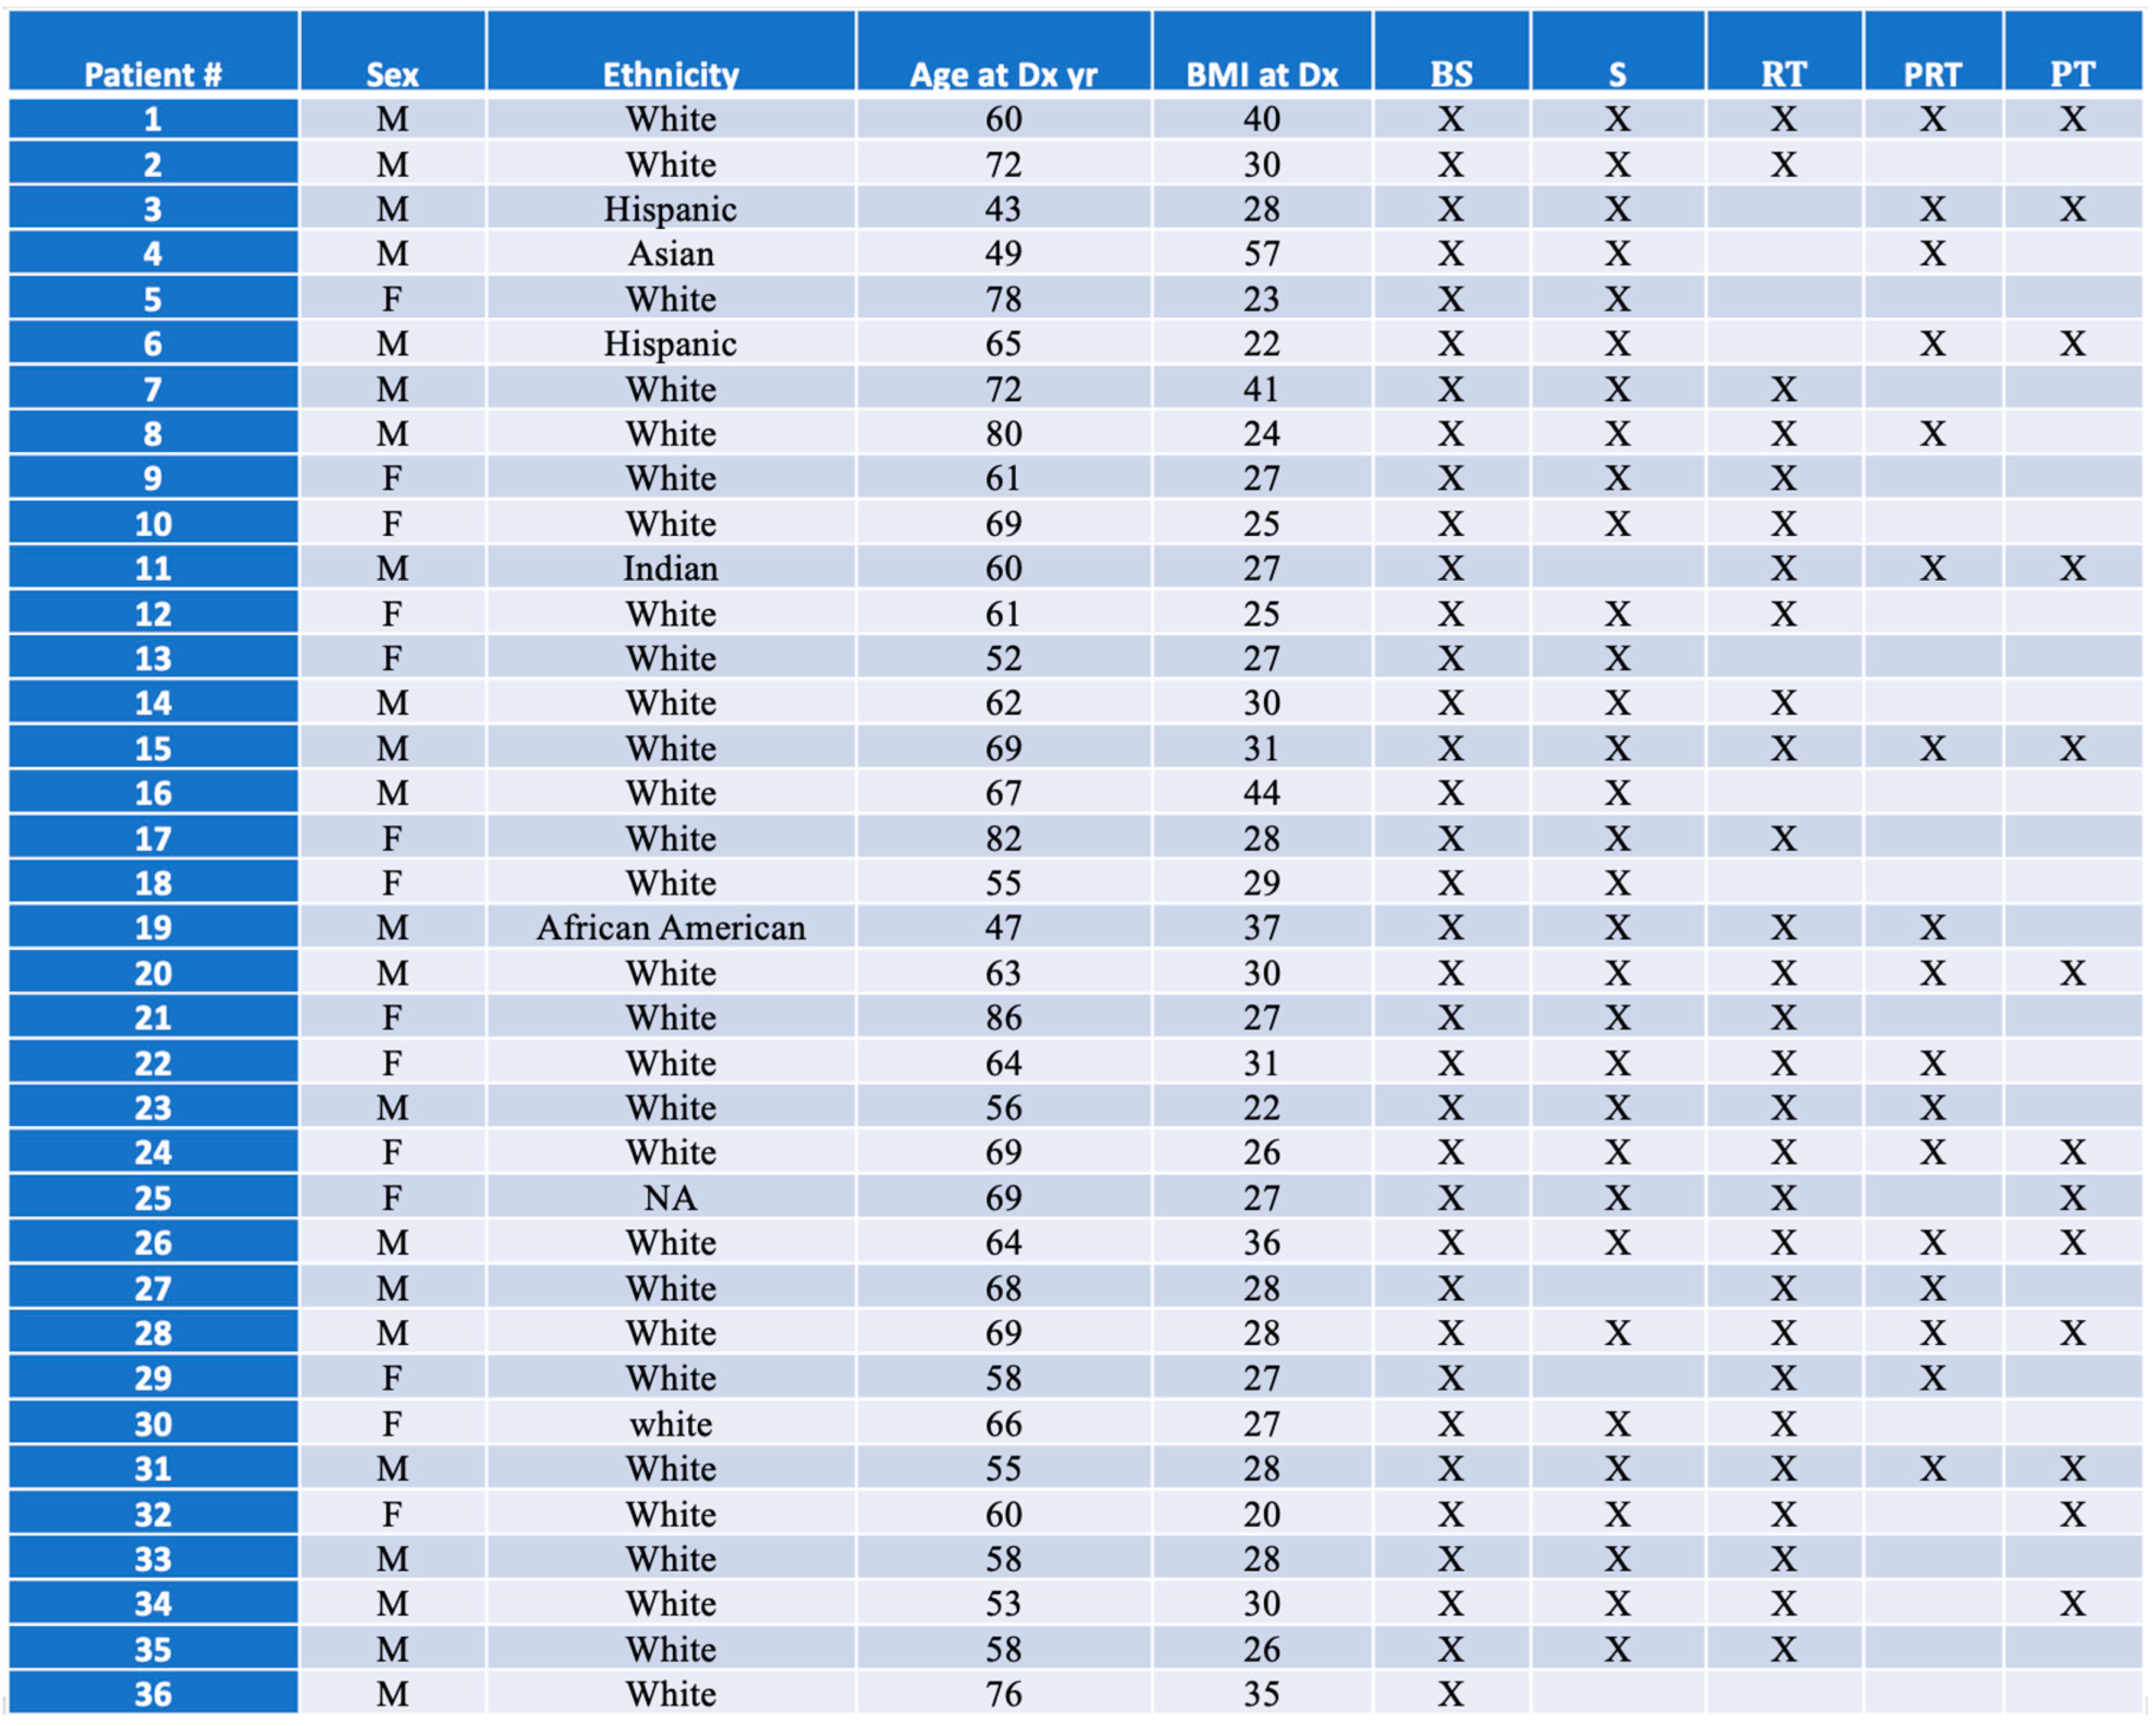
As we reported in our recent publication (Aboud et al., 2023), thirty-six patients with glioblastoma, IDH wildtype (determined by immunohistochemistry), WHO grade 4, were identified in the UC Davis Neuro-Oncology clinic. As MGMT methylation reflects a good prognostic factor (Hegi et al., 2005), we determined that of the 36 patients, 18 had MGMT promoter methylation, 16 were unmethylated, and 2 had unknown methylation status. The cohort consisted of 21 males and 15 females; median age at diagnosis was 63.5 years; median BMI at diagnosis was 28; and 30 patients were self-identified as white (
Table 1). All patients underwent surgical intervention at our institution. We collected 36 samples before surgery (BS), 32 samples 2 days after (S), 28 samples just before radiation therapy (RT), 17 samples after the radiation therapy had been completed (PRT), as well as 13 samples after completion of adjuvant chemotherapy (PT).
3.2. Biogenic Amines
We identified 340 unique biogenic amines by retention index and mass spectral matching (Fiehn, 2016). We compared samples at four points in patient’s treatment course as follows: the first time point is prior to surgery (BS), the second is post-surgery (S), the third is prior to starting concurrent chemoradiation therapy (RT), after finishing concurrent chemoradiation (PRT), and the last time point after completion of adjuvant chemotherapy (PT).
3.2.1. Post-Surgery versus Pre-Surgery
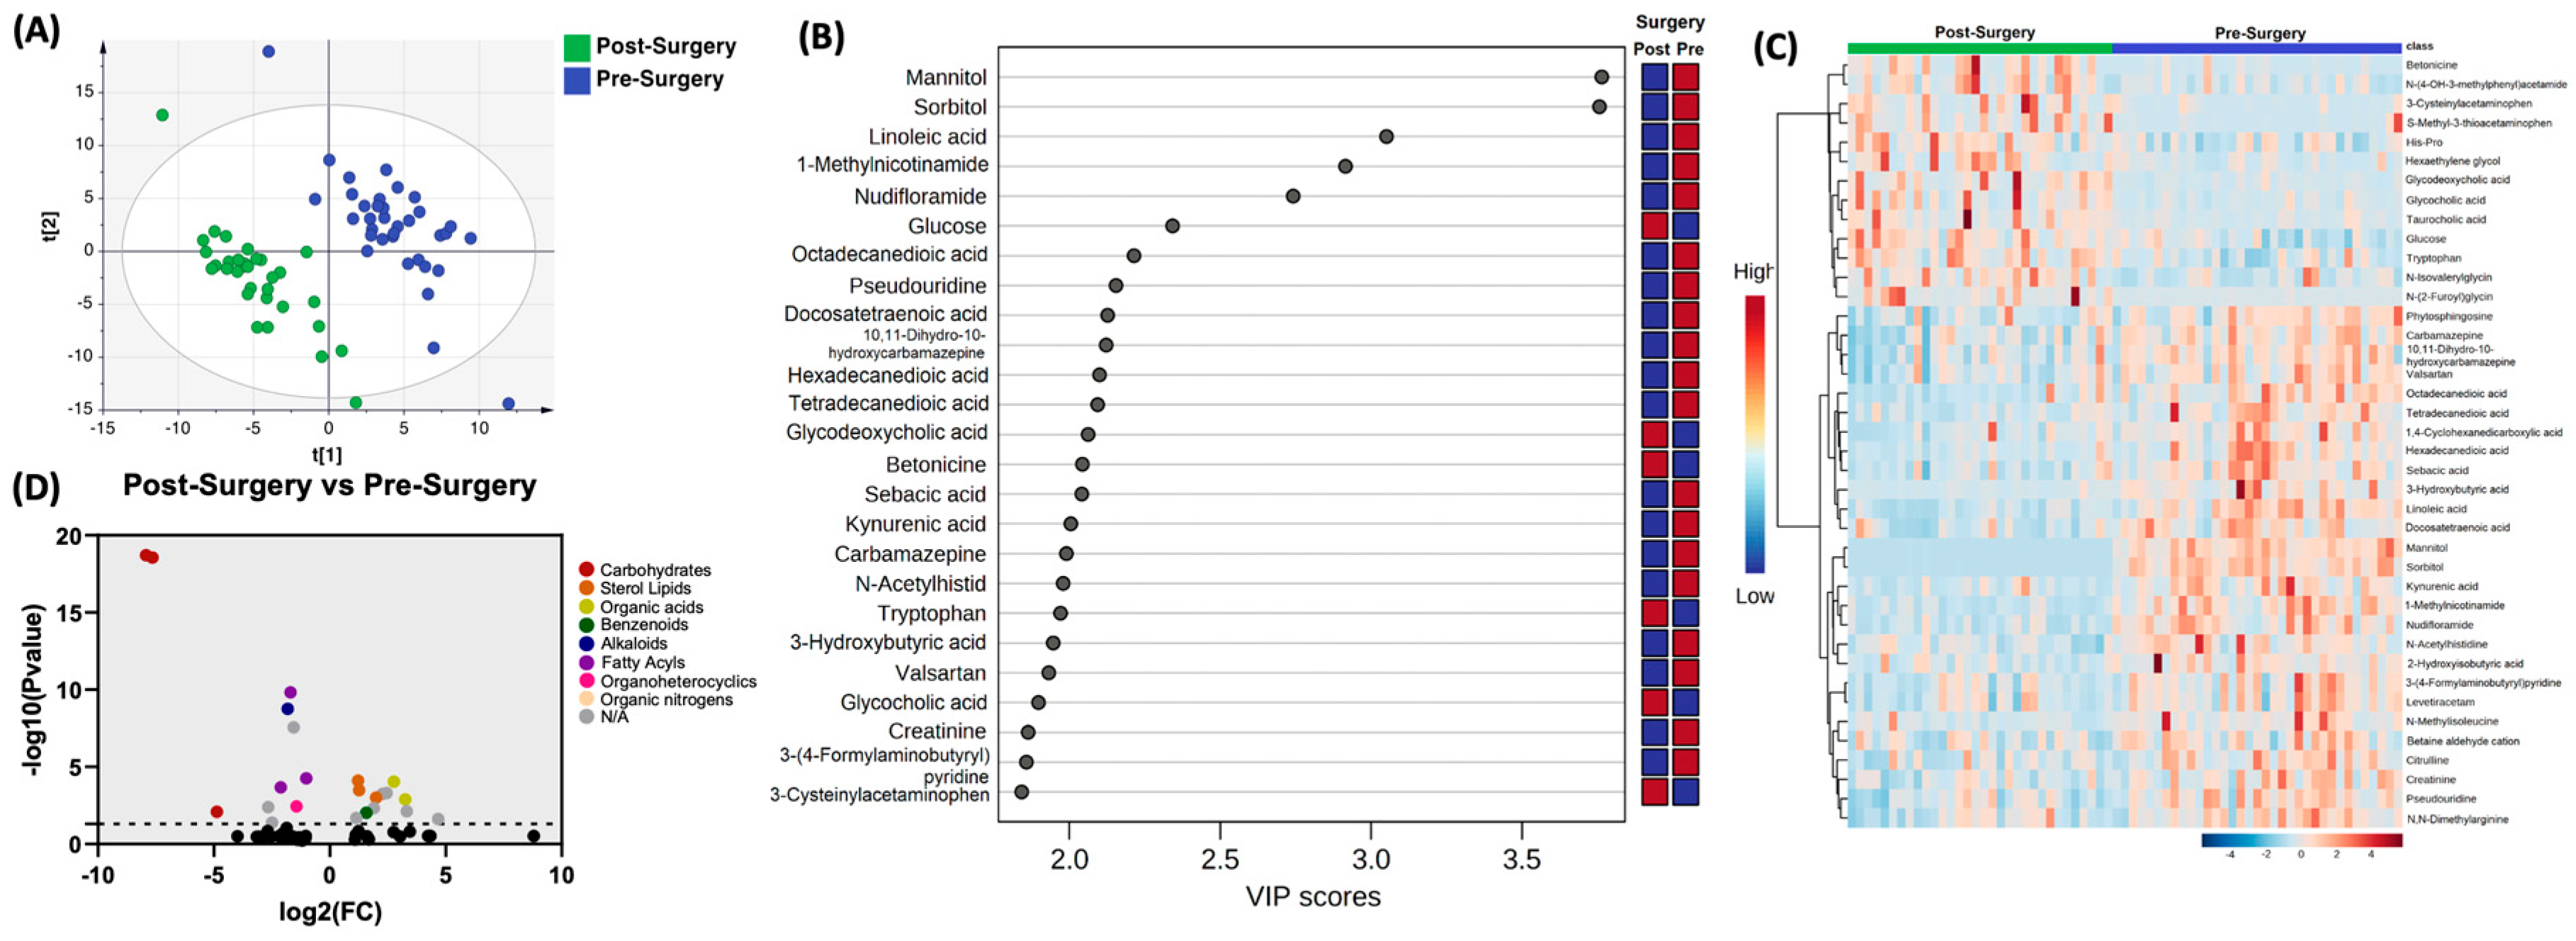
In comparing the profile of biogenic amines post-surgery with pre-surgery, partial least squares-discriminant analysis (PLS-DA) showed two grouped clustering with evidence of separation (
Figure 1A). Complete list of significantly altered biogenic amines is available (supplementary table 1).
Figure 1B illustrates the 25 metabolites with the highest VIP scores.
Figure 1C depicts a heat map of the top 40 significantly altered biogenic amines. Setting the fold change (FC) cutoff at 2 and P value at 0.05 (
Figure 1D), there were 12 compounds that were upregulated, which included Glycodeoxycholic acid (P=7.79E-05), Betonicine (P=9.23E-05), Glycocholic acid (P=3.18E-03), 3-Cysteinylaectaminophen (P=4.95E-03), S-Methyl-3-thioacetaminophen (P=5.77E-03), Taurocholic acid (P=9.97E-03), N-glycine (P=0.0013), p-acetamidophenyl.beta.-D-glucuronide (P=0.0048), 2-Hydroxy-5-sulfopyridine-3-carboxylic acid (P=0.0074), acetaminophen sulfate (P=0.0095), 2-Amino-3-methoxybenzoic acid (P=0.02), and Dehydrofelodipine (P=0.024). In contrast, there were 11 compounds that were downregulated, which included Mannitol (P=1.96E-19), Sorbitol (P=2.75E-019), Linoleic acid (P=1.51E-10), 1-Methylnicotinamide (P=1.78E-09), Nudifloramide (P=2.81E-08), Hexadecanedioic acid (P=5.49E-05), 3-Hydroxybutyric acid (P=0.0002), Riluzole (P=0.0036), Bupivacaine (P=0.0041), Lactitol (P=0.008), and 1-hydroxymidazolam.beta.-D-glucuronide (P=0.0414).
3.2.2. Post-Radiation versus Pre-Radiation
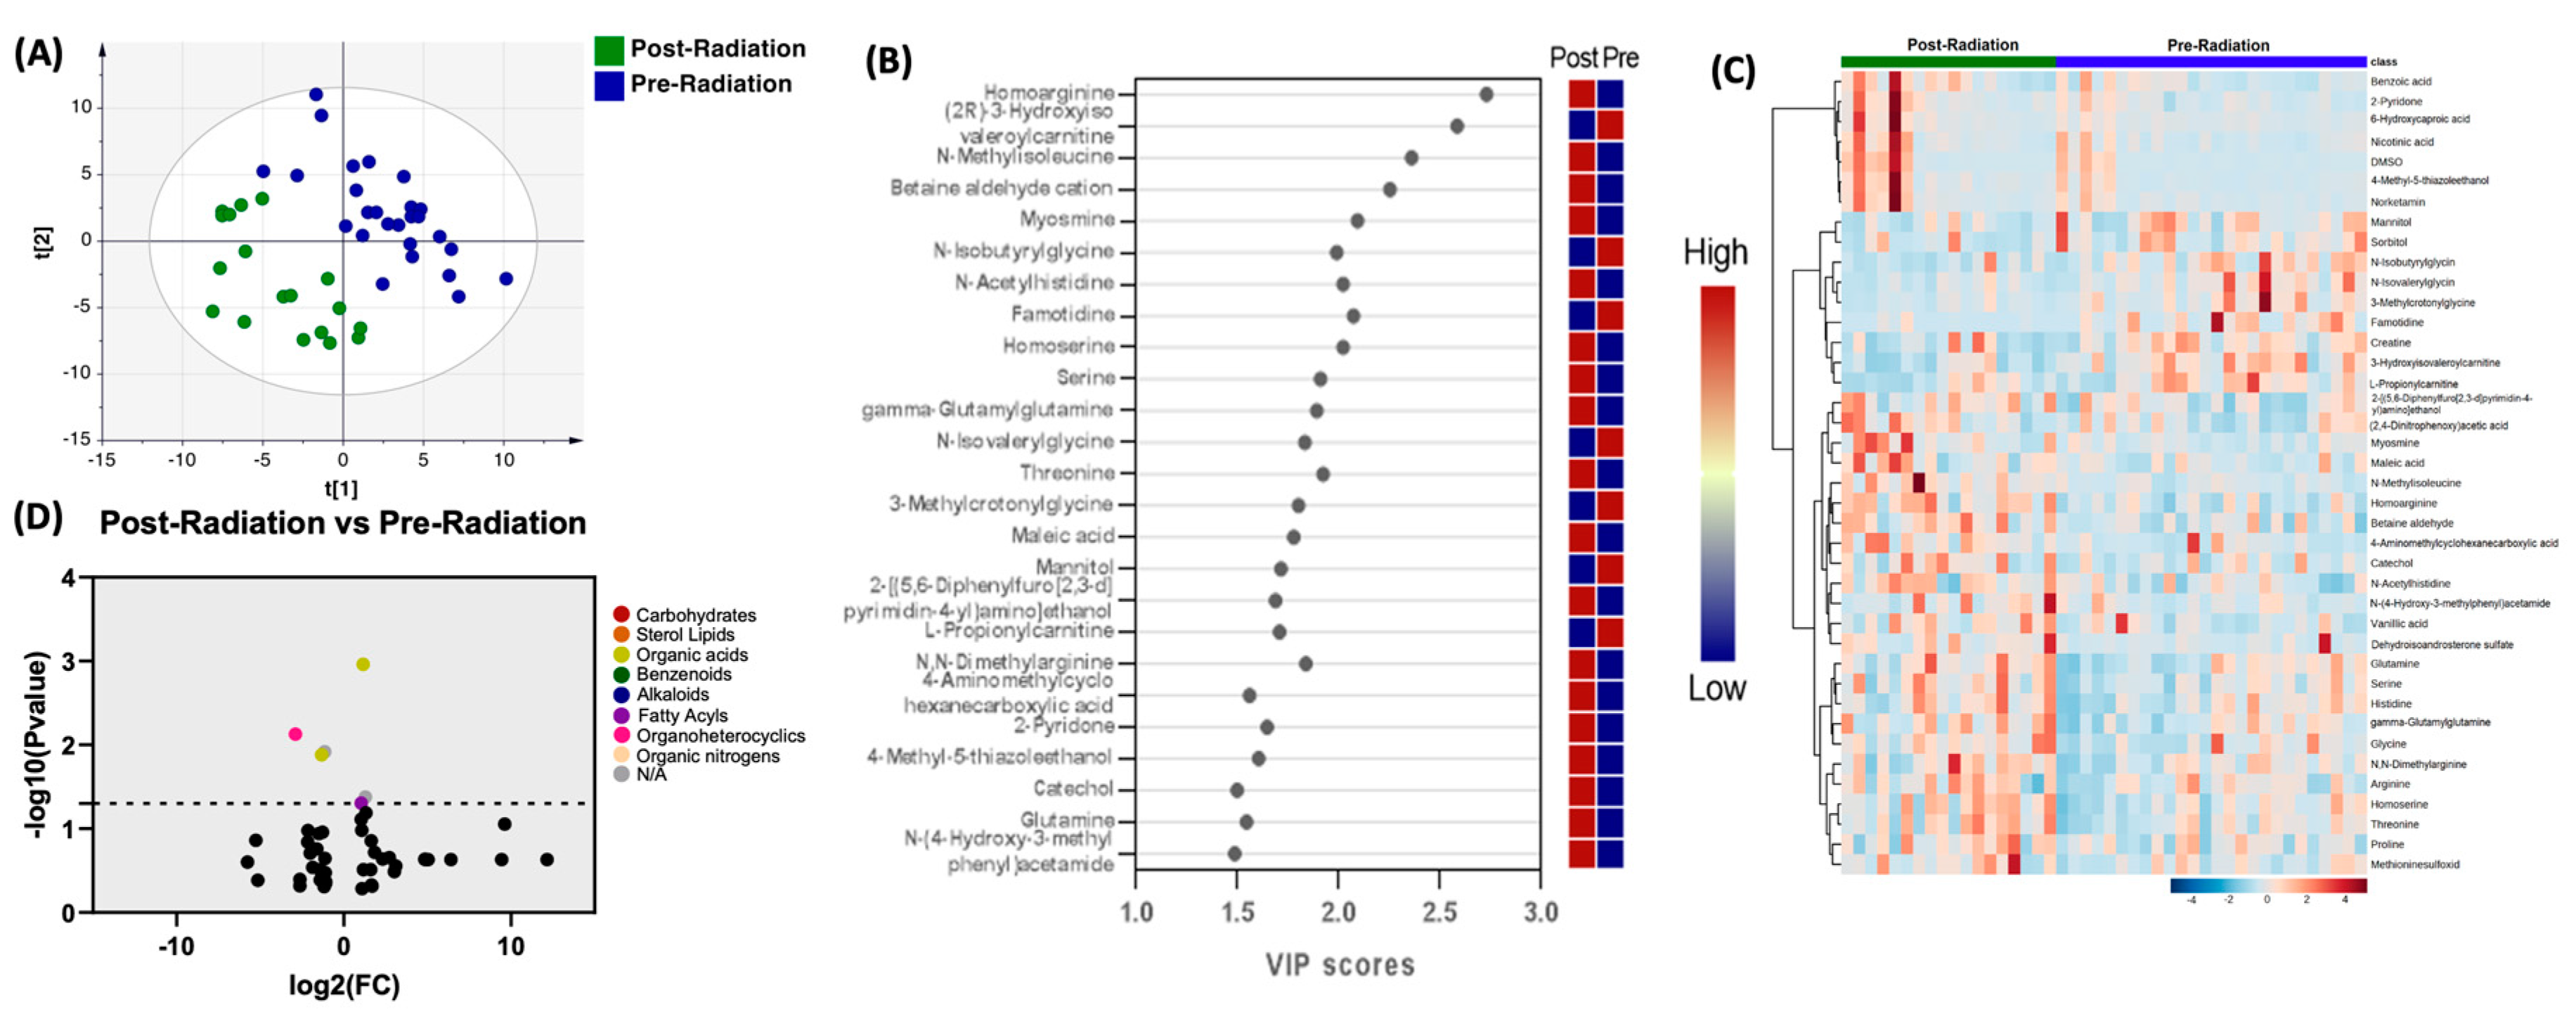
When comparing the profile of biogenic amines post-radiation with pre-radiation, PLS-DA showed two grouped clustering (
Figure 2A).
Figure 2B illustrates the 25 metabolites with the highest VIP scores.
Figure 1C depicts a heat map of the top 40 significantly altered biogenic amines. The complete list of significantly altered biogenic amines is available (supplementary table 2). Setting the FC cutoff at 2 and P value at 0.05 (
Figure 2D), Only 3 compounds were upregulated, which included N-Methylisoleucine (P=0.0011), 4-Methyl-5-thiazoleethanol (P=0.042), and 6-Hydroxycaproic acid (P=0.049). Similarly, there were 3 compounds that were downregulated, which included Famotidine (P=0.0074), N-Isovalerylglycine (P=0.012), and 3-Methylcrotonylglycine (P=0.0131).
Figure 2C depicts a heat map of the top 40 significantly altered biogenic amines (
Figure 2C).
3.2.2. Post-Treatment versus Pre-Radiation
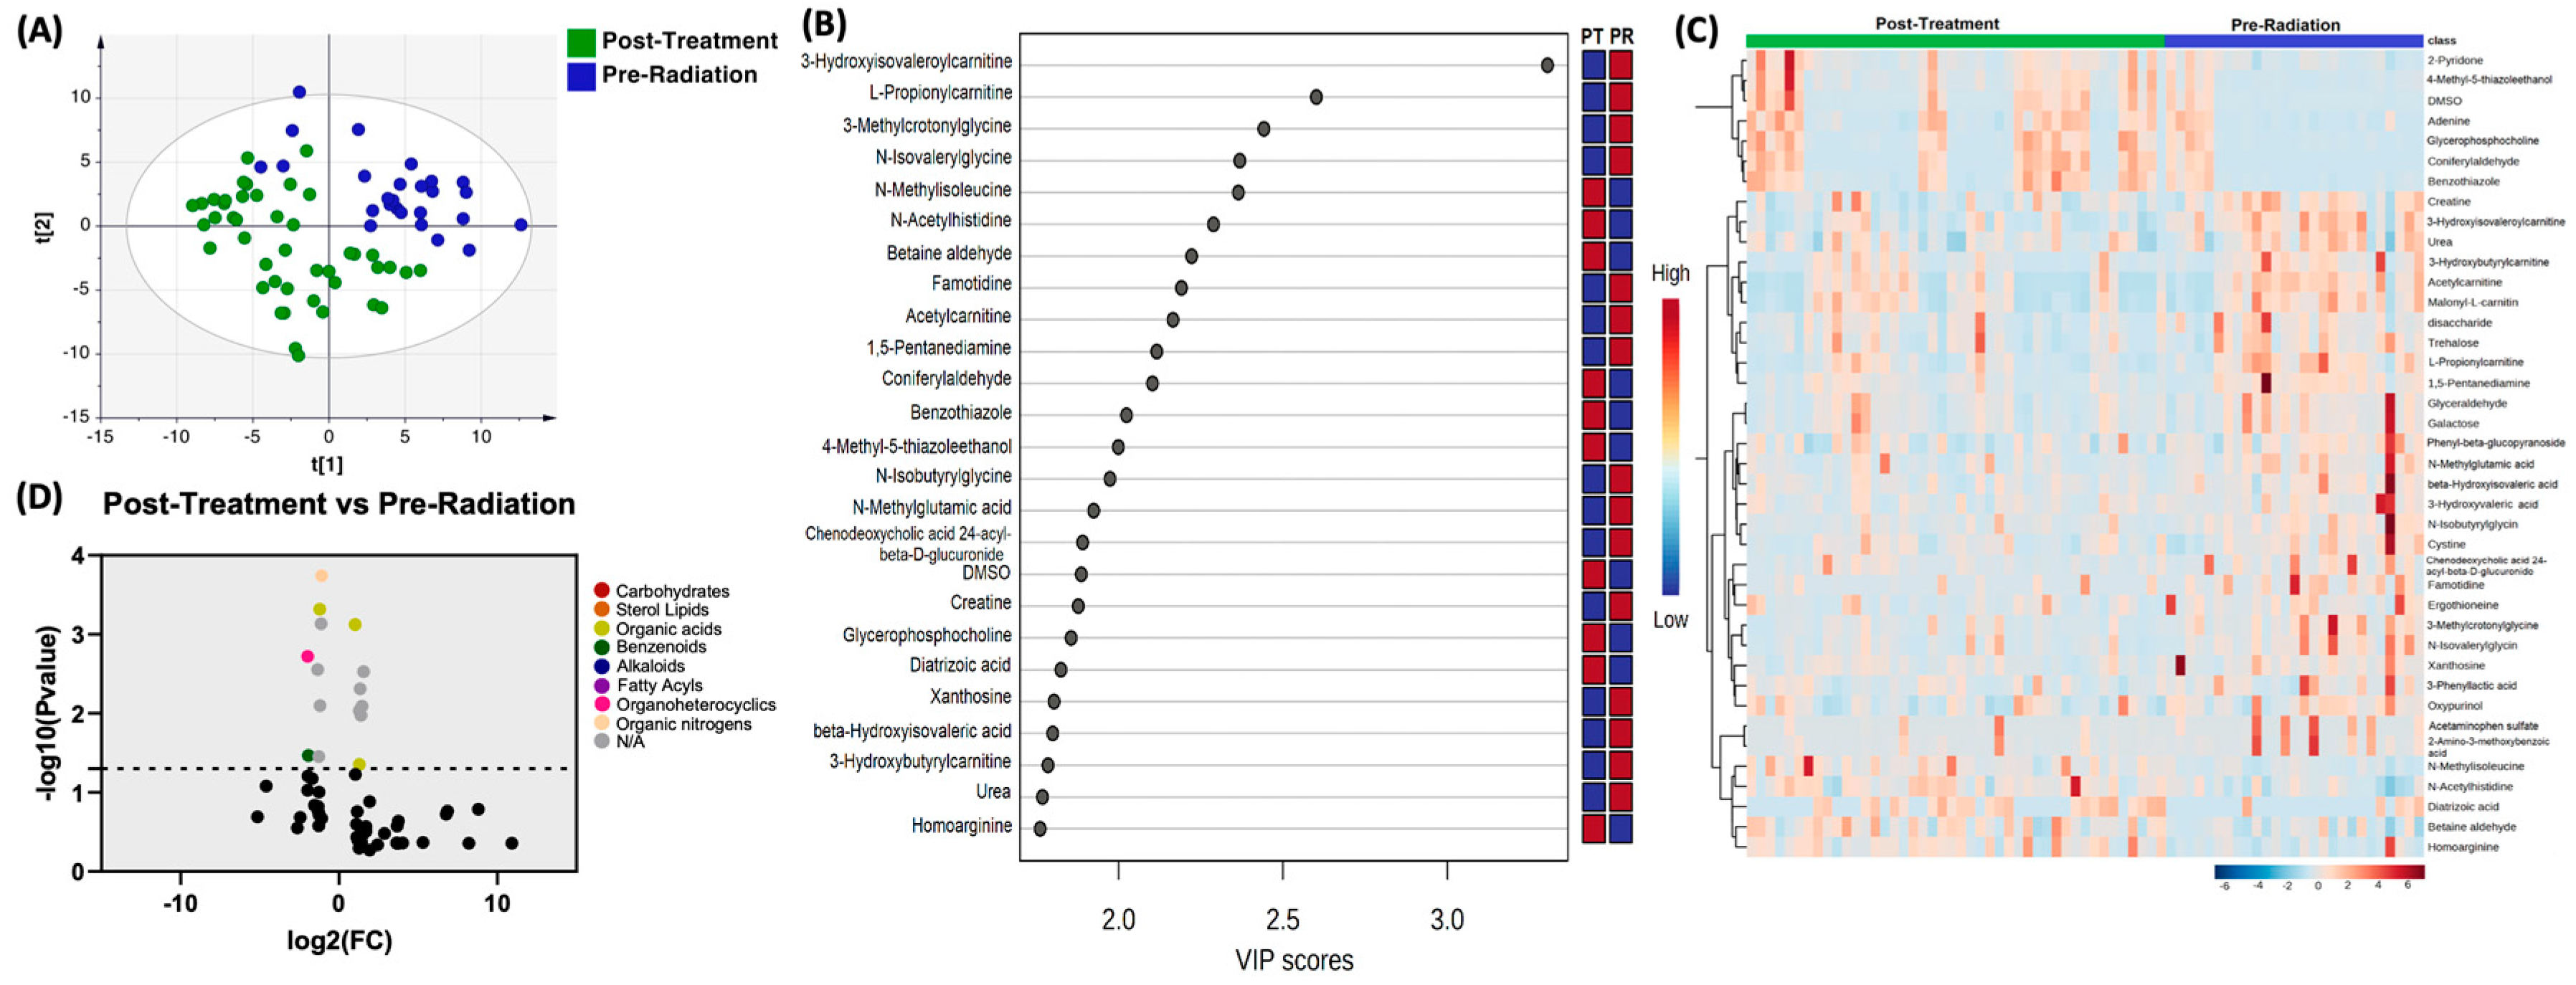
Moreover, the profile of biogenic amines post-treatment with pre-radiation were compared, PLS-DA showed two grouped clustering with separation noted (
Figure 3A). Complete list of significantly altered biogenic amines is available (supplementary table 3).
Figure 3B illustrates the 25 metabolites with the highest VIP scores.
Figure 3C depicts a heat map of the top 40 significantly altered biogenic amines. Using the same setting of the FC cutoff at 2 and P value at 0.05 (
Figure 3D), there were 7 compounds upregulated, which included N-Methylisoleucine (P=0.0008), Coniferylaldehyde (P=0.003), 4-Methyl-5-thiazoleethanol (P=0.0049), DMSO (P=0081), Glycerophophocholine (P=0.0093), Diatrizoic acid (P=0.011) and Bradykinin (P=0.044). There were 8 compounds that were downregulated, which included L-Propionylcarnitine (P=0.0002), 3-Methylcrotonylglycine (P=0.0005), N-Isovalerylglycine (P=0.0007), Famotidine (P=0.0019), 1,5-Pentanediamine (P=0.0028), Chenodeoxycholic acid 24-acyl-.beta.-D-glucuronide (P=0.008), Acetaminophen sulfate (P=0.035), and 2-Amino-3-methoxybenzoic acid (P=0.035).
3.3. Machine learning models for classifying treatment phases.
3.3.1. Ensemble learning accurately predicted patient treatment stages.
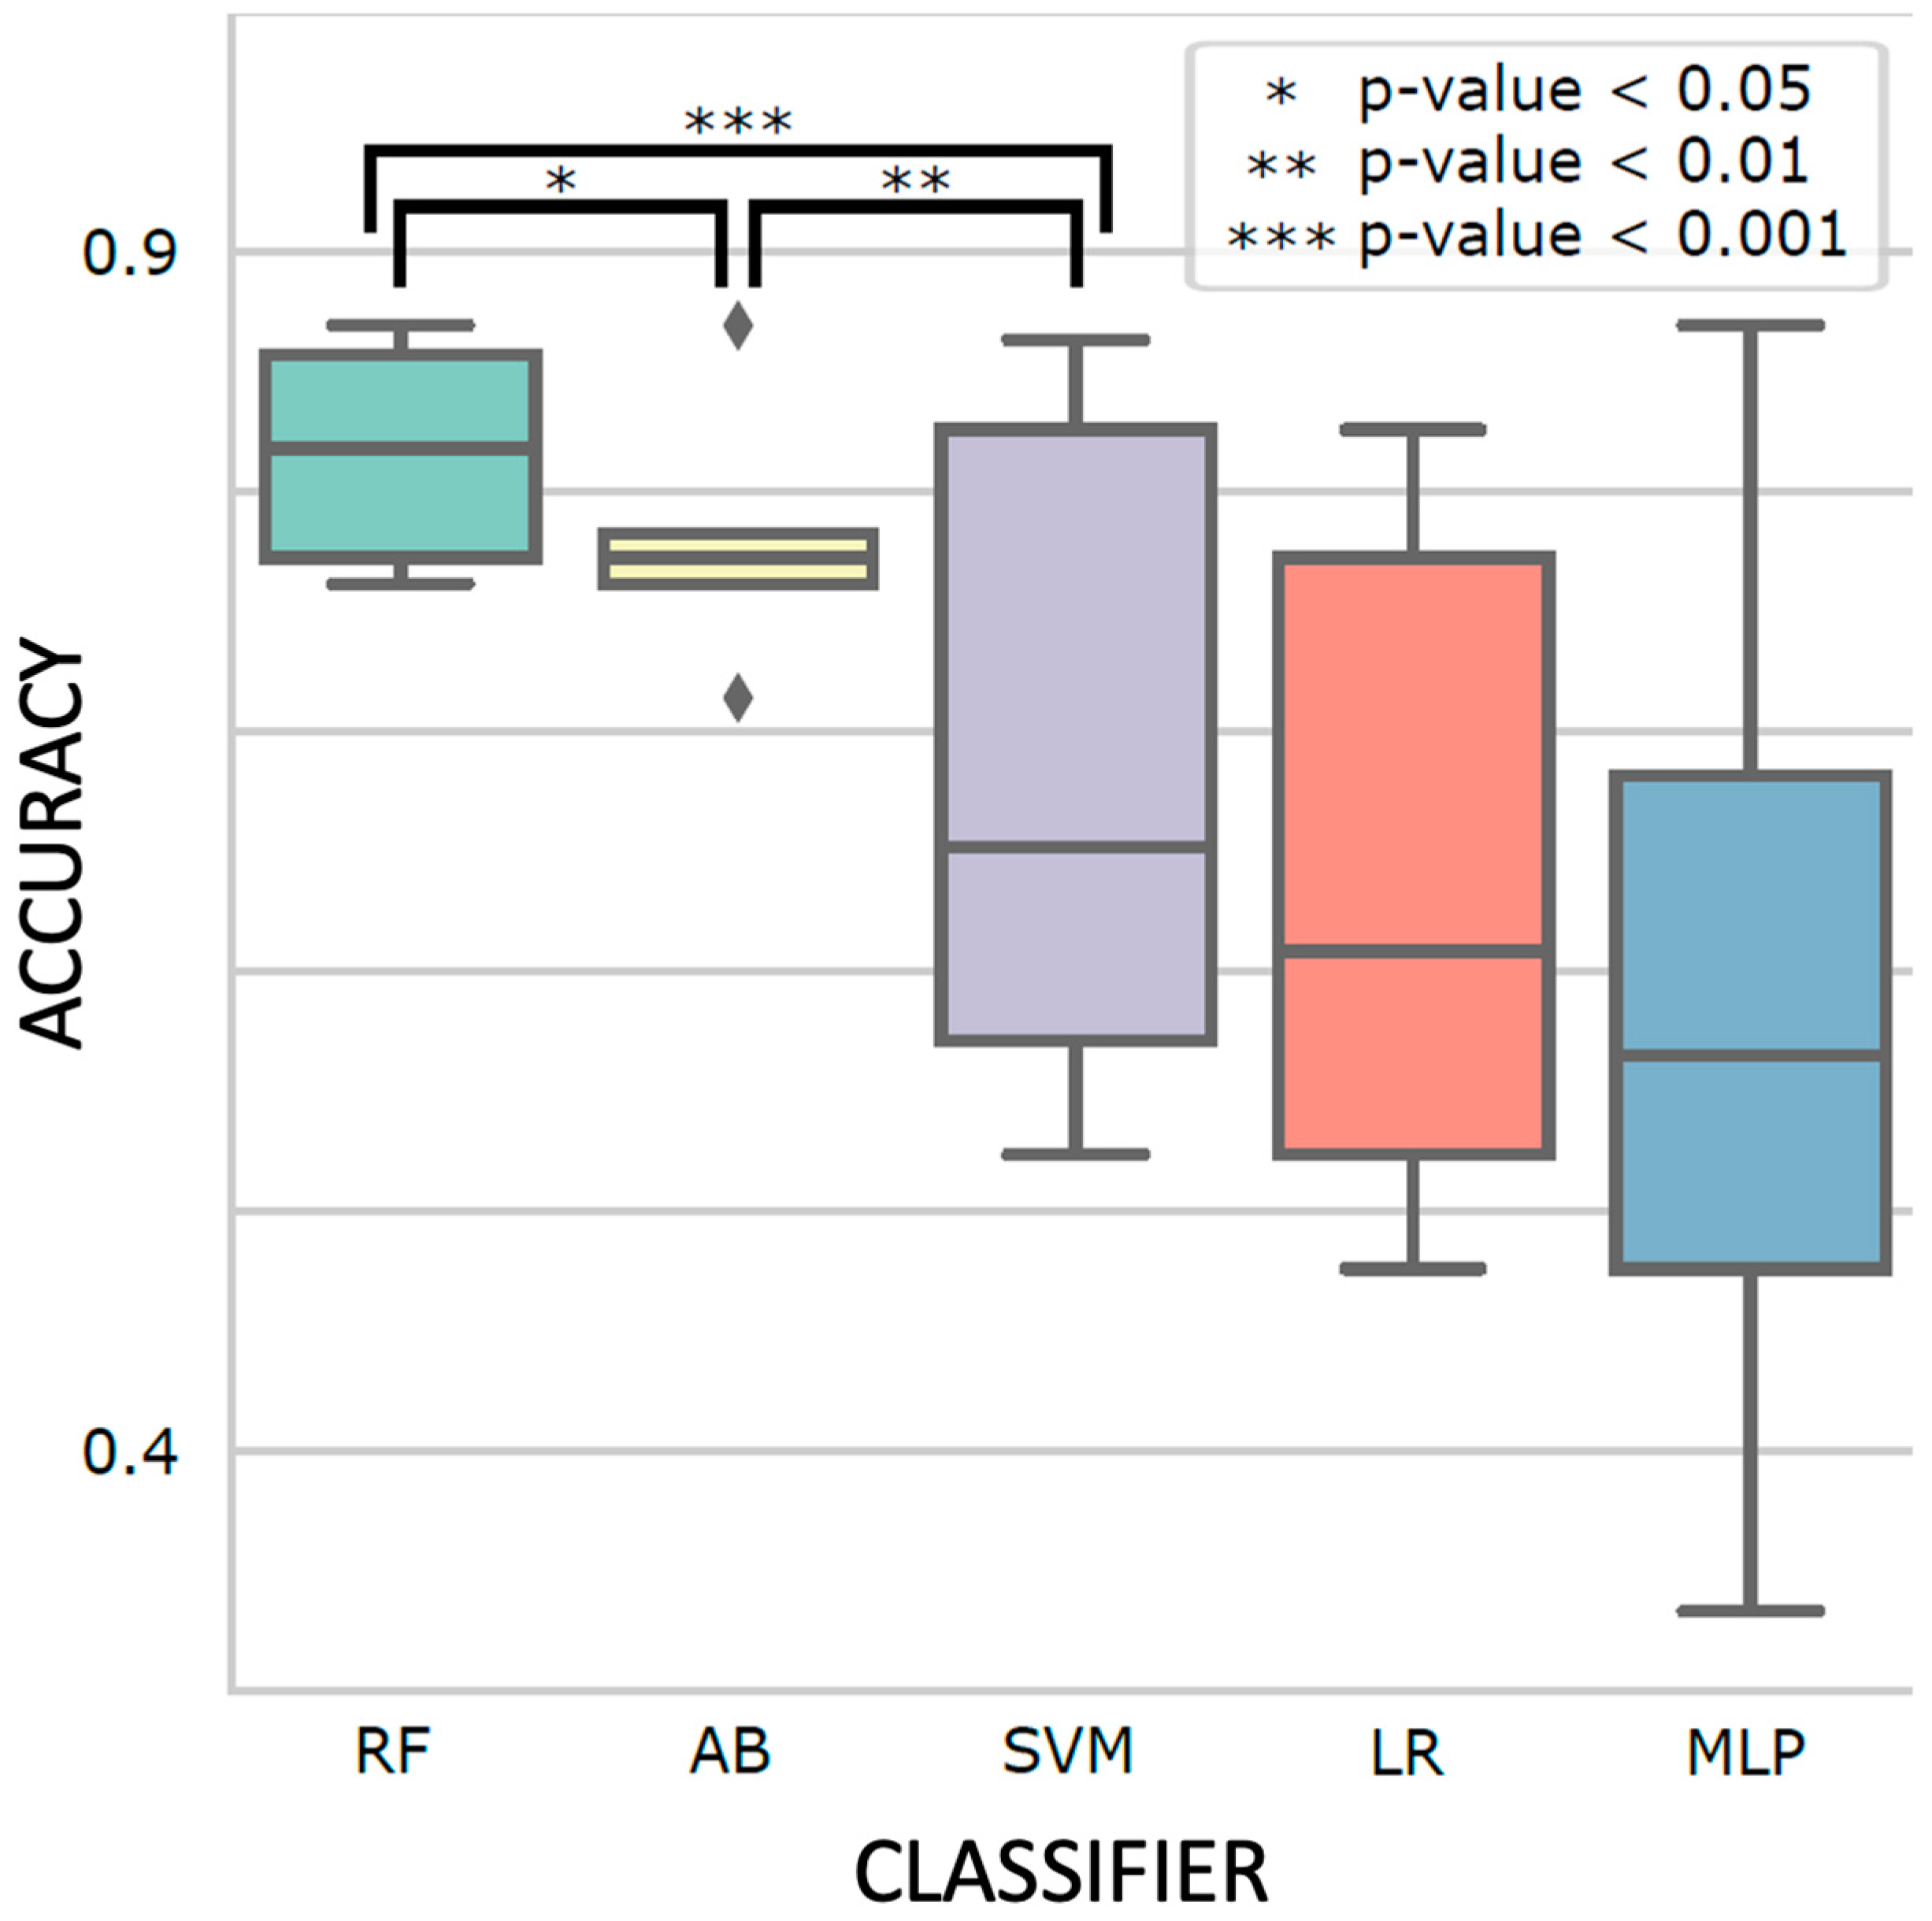
Different classifiers with the best-performing hyperparameters are shown in
Figure 4. Ensemble learning classifiers, RF and AB, achieved the highest accuracy (0.81 ± 0.04 and 0.78 ± 0.05) and were significantly more accurate than the third best model, SVM (0.69 ± 0.14;
p-value = 5.9 x 10
-5 and 2.9 x 10
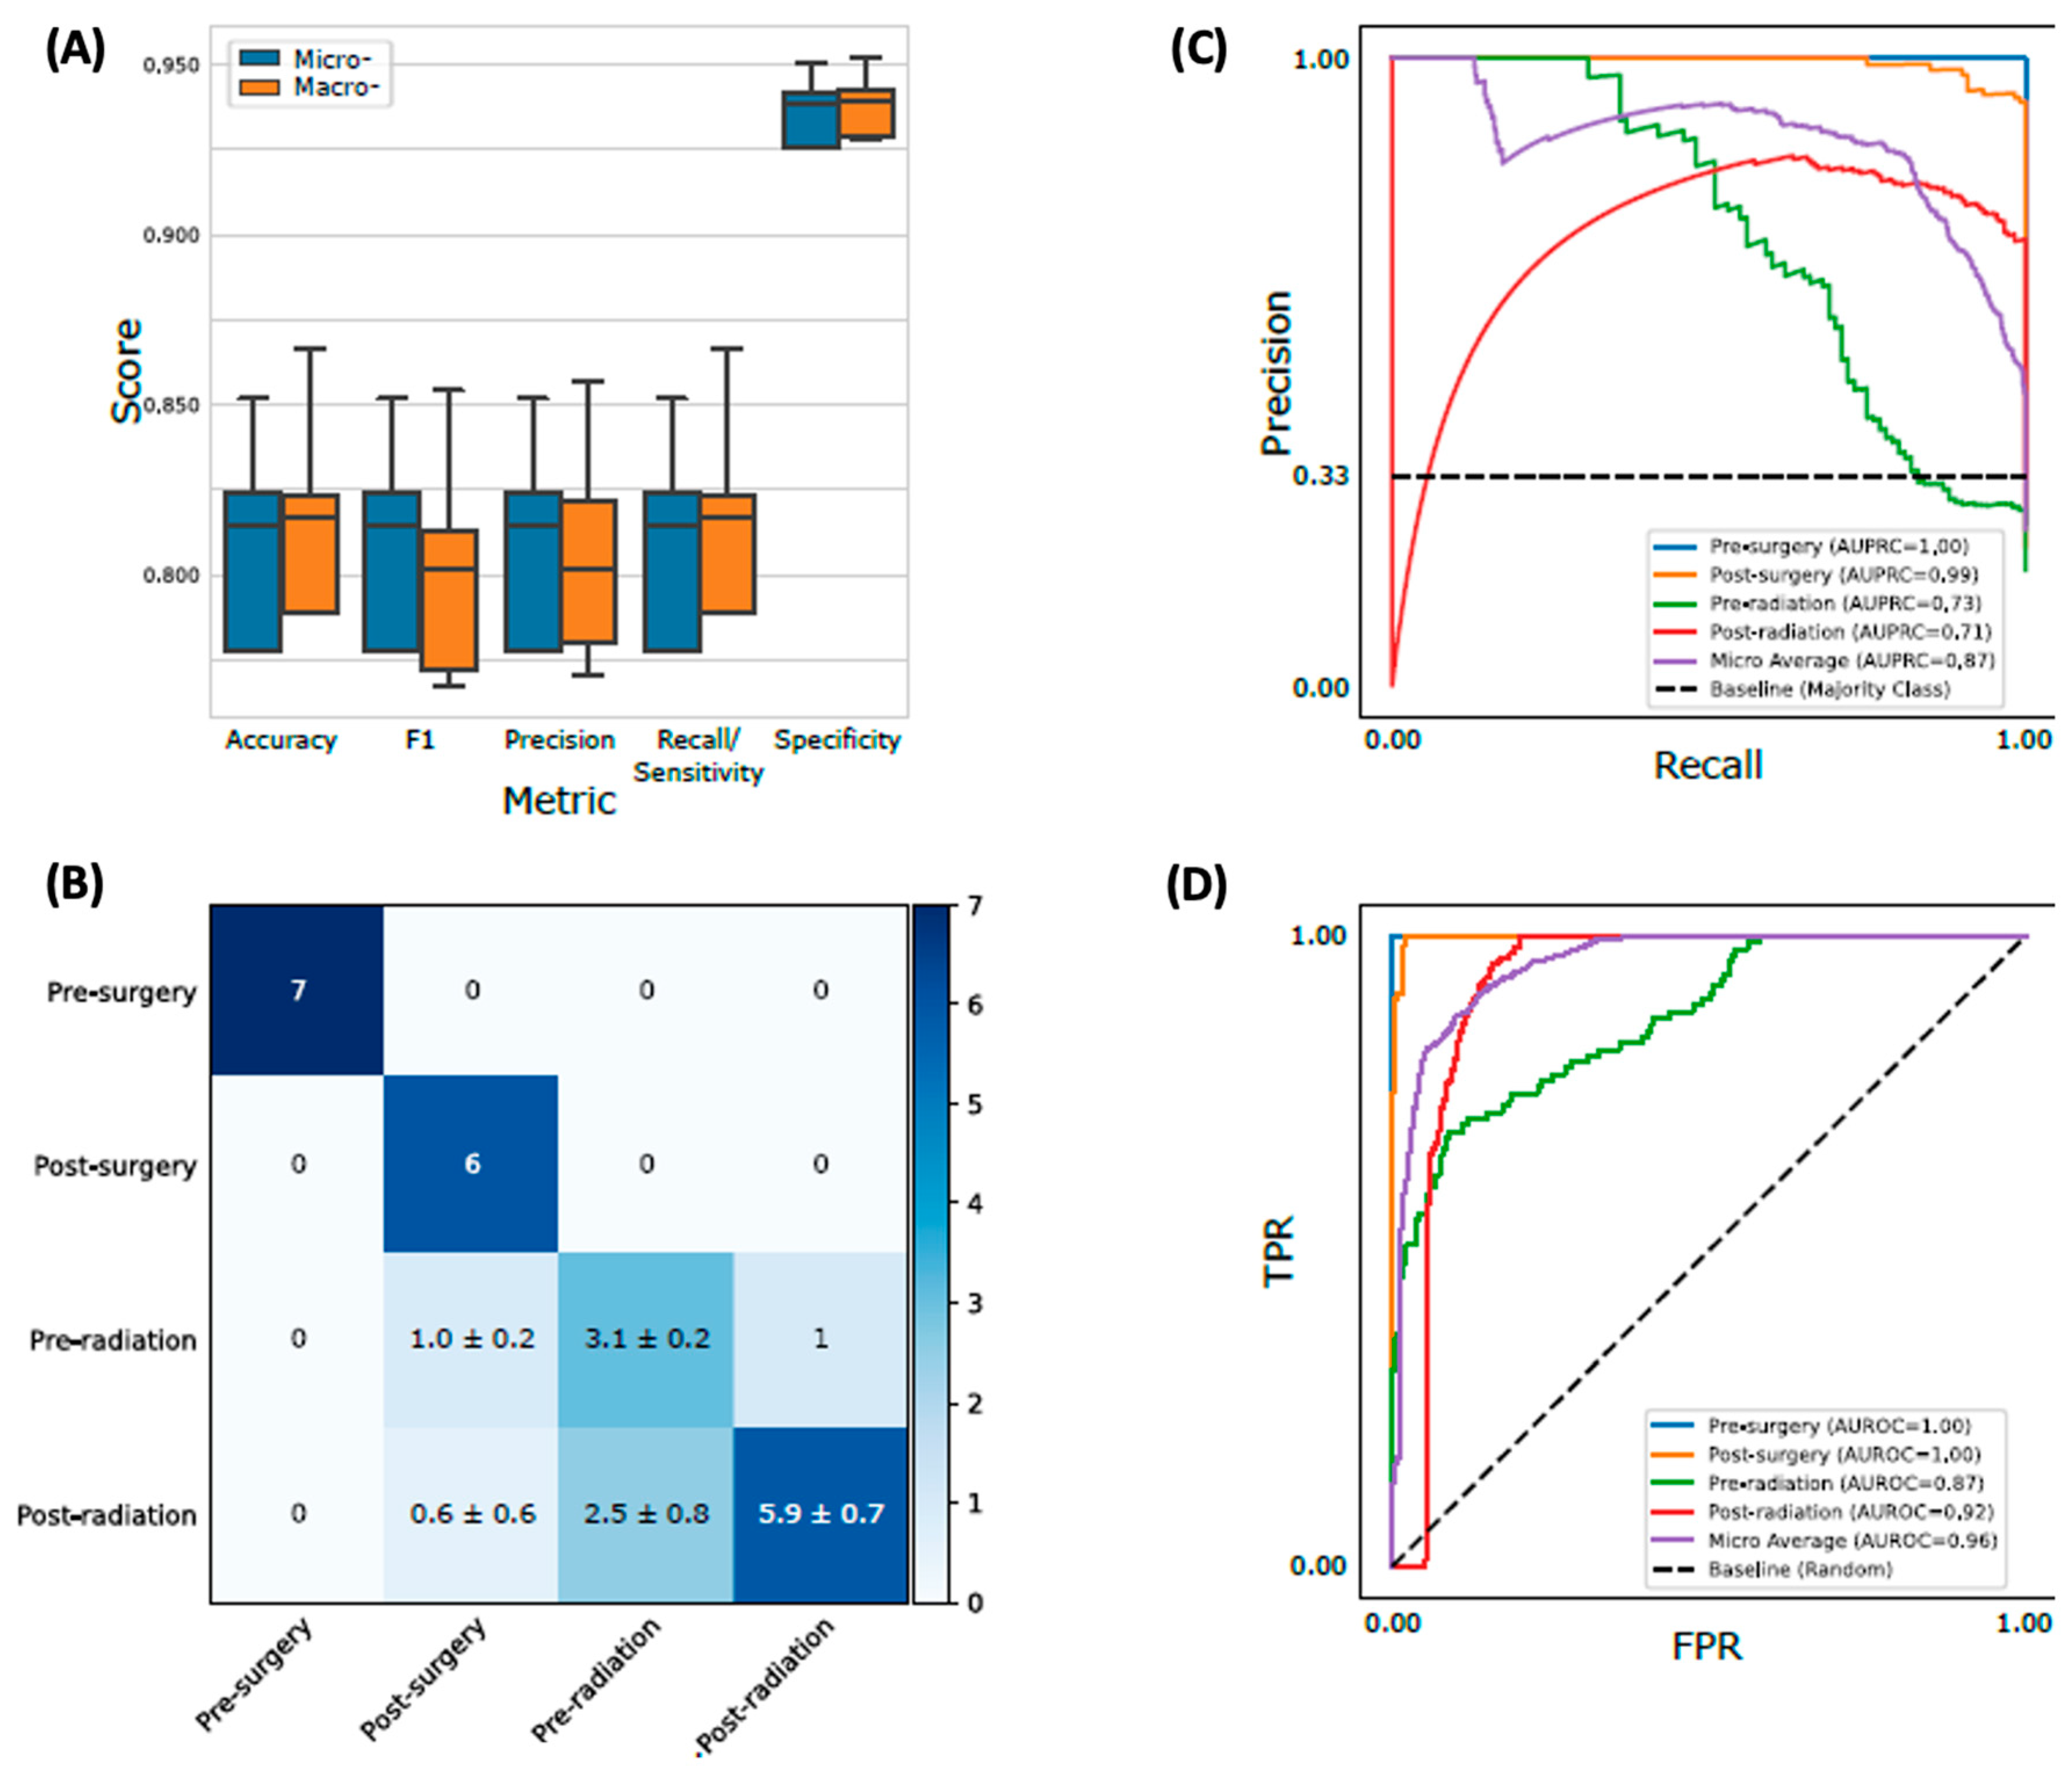
-3, respectively). Using RF with the optimal hyperparameters (supplementary table 4), we evaluated its performance using the holdout test set. The test accuracy and F1 score are both 0.81 ± 0.03 (
Figure 5a) and overall AUPRC and AUROC are 0.87 and 0.96, respectively (
Figure 5b-d). Specifically, the model could distinguish
pre-surgery (AUPRC = 1.0, AUROC = 1.0) and
post-surgery (AUPRC = 0.99, AUROC = 1.0) plasma samples nearly perfectly while relatively struggling to classify
pre-radiation (AUPRC = 0.73, AUROC = 0.87) and
post-radiation (AUPRC = 0.71, AUROC = 0.92) patients. Sequential feature selection selected the 25 (7%) most predictive biogenic amines from the original 340, slightly improving micro-averaged test accuracy and F1 scores (both 0.82 ± 0.02; supplementary table 5).
3.3.2. Sorbitol and n-methylisoleucine were among the most predictive biogenic amines.
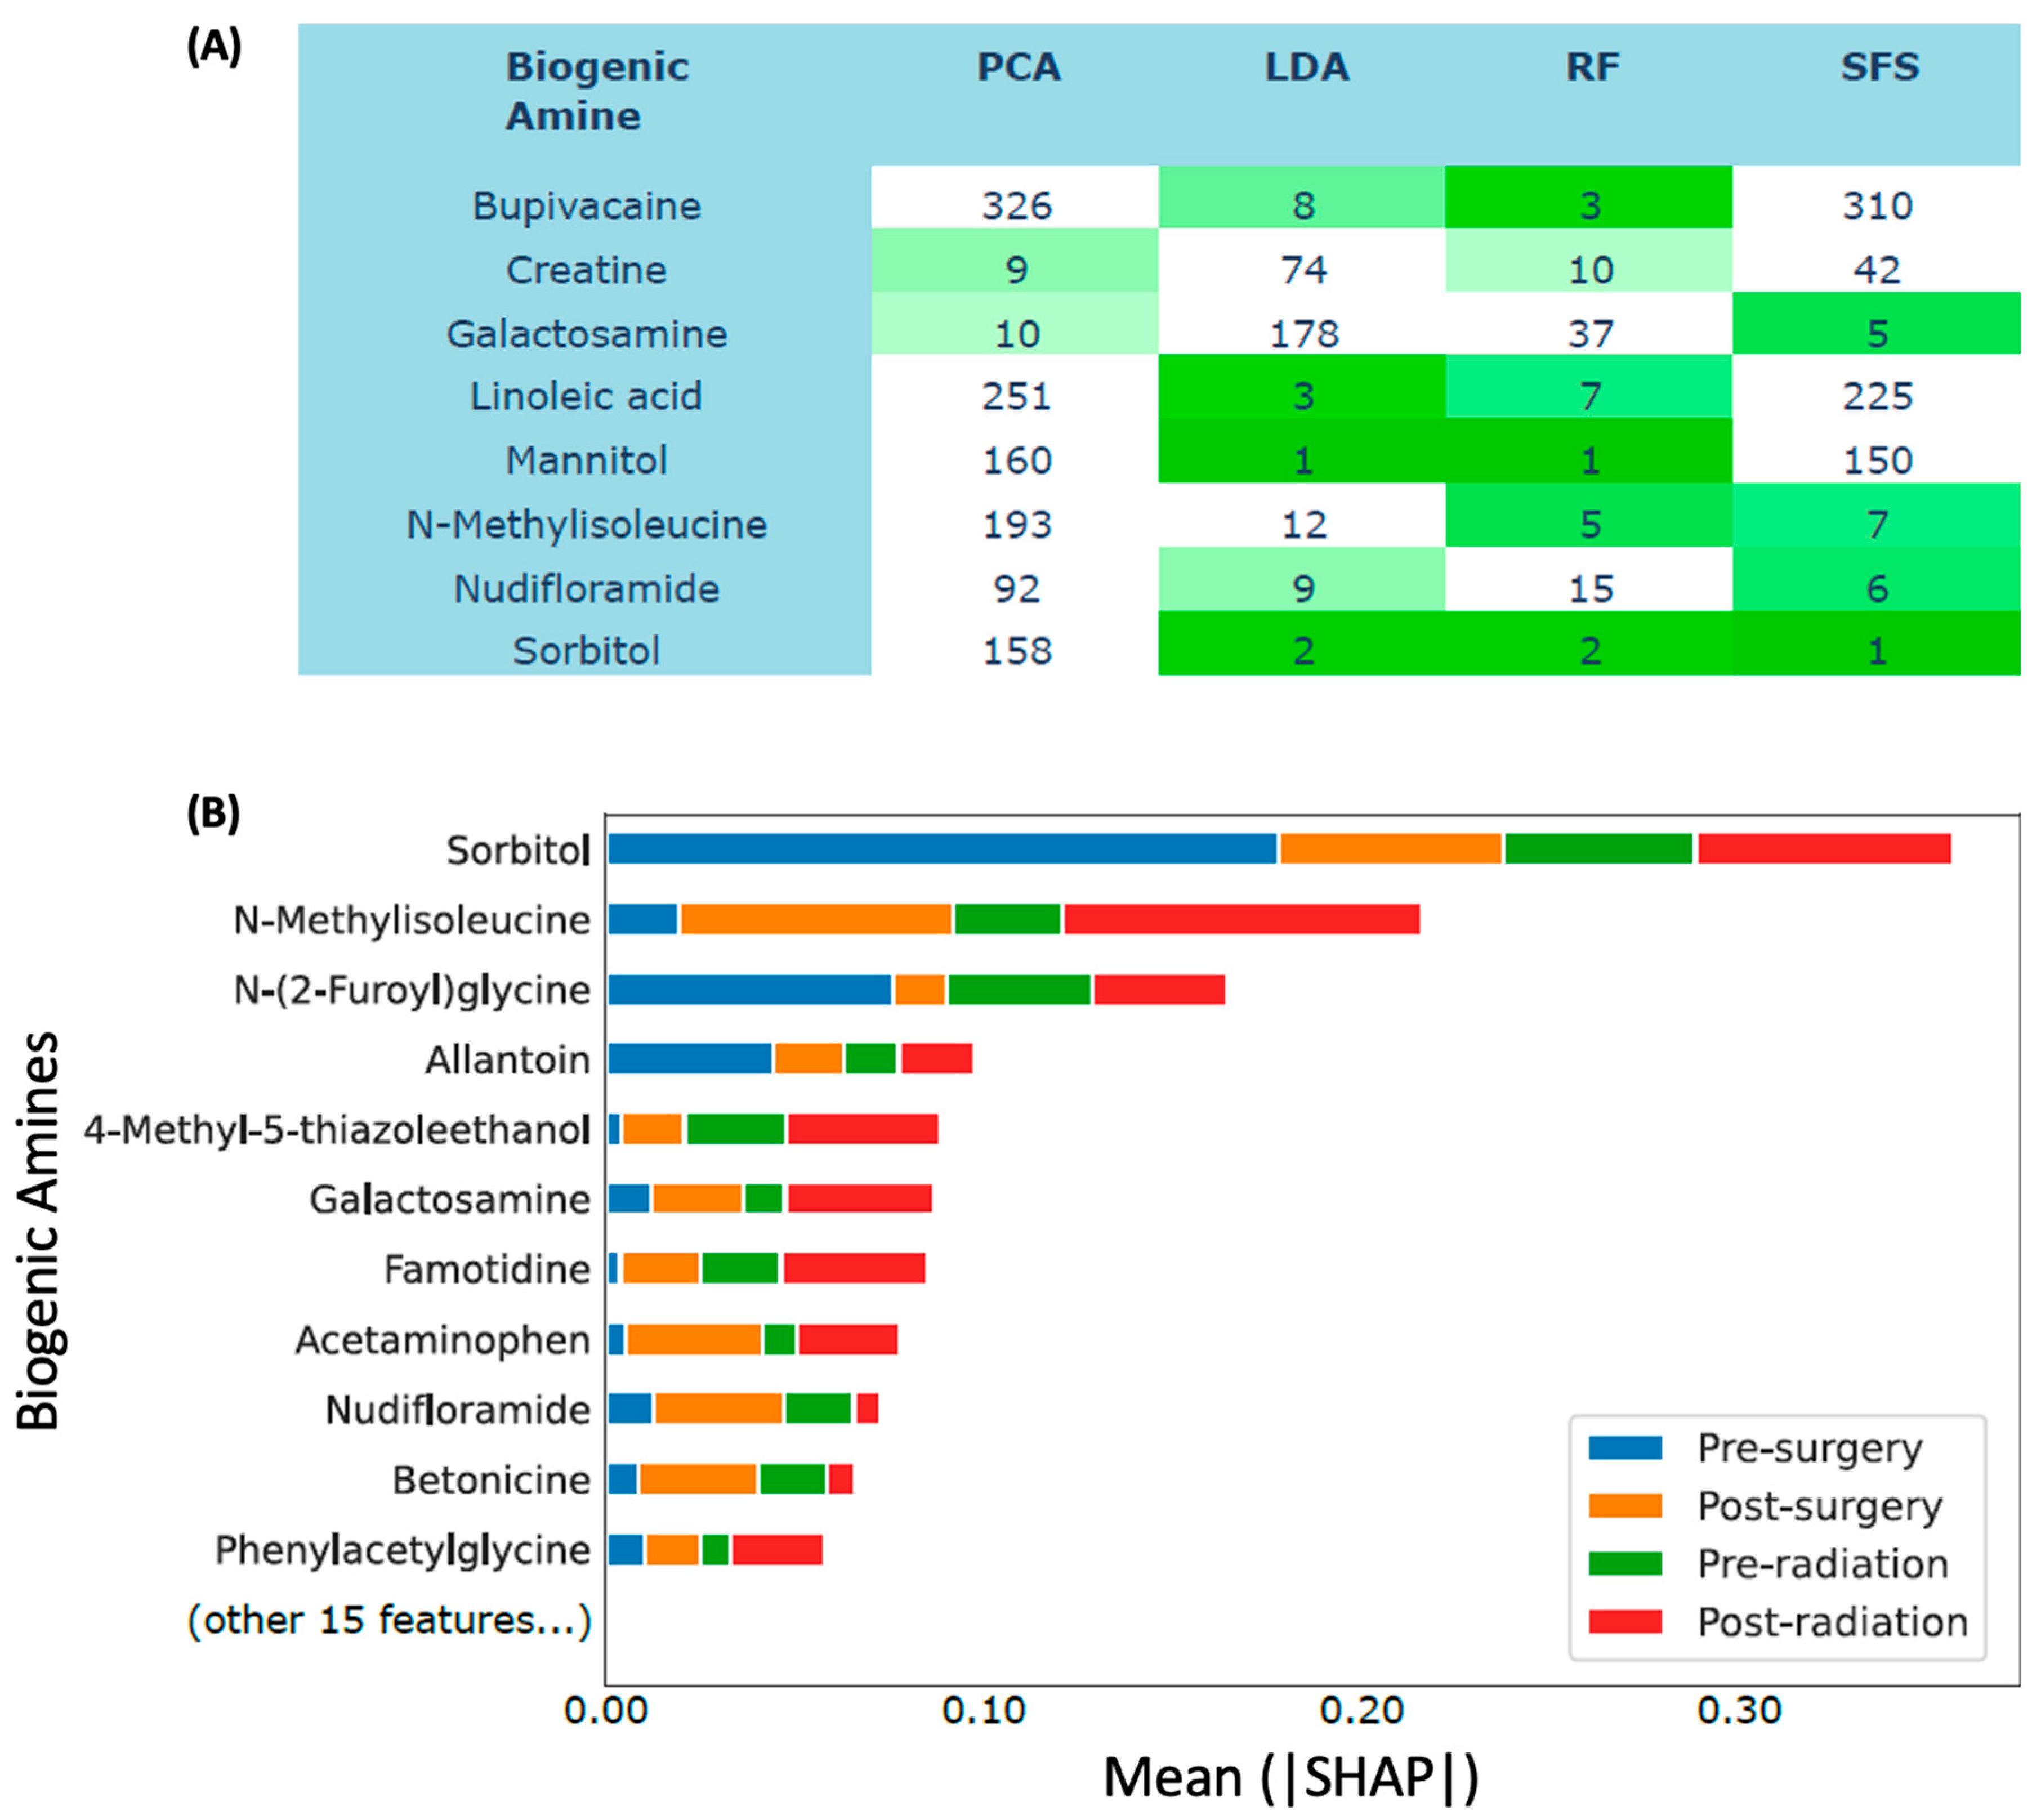
We applied multiple methods to rank the most predictive biogenic amines (supplementary Data 1). We identified eight biogenic amines ranked among the top 10 most important features simultaneously by at least two methods (
Figure 6a), which were bupivacaine, creatine, galactosamine, linoleic acid, mannitol, N-methylisoleucine, nudifloramide, and sorbitol. To better understand how biogenic amines affected the classification of patient treatment stages, we applied a model interpretability method called SHAP (Lundberg and Lee, 2017) to our random forest classifier trained with selected features. Again, sorbitol and N-methylisoleucine were the two most important features (mean|SHAP| = 0.36 and 0.22), whereas galactosamine and nudifloramide were sixth and ninth, respectively (
Figure 6b).
4. Discussion
In this study, we demonstrated specific plasma biogenic amines changes associated with treatment in patients with pathologically confirmed IDH wildtype glioblastoma. First line treatment for patients with glioblastoma is maximal safe resection, RT, and chemotherapy (Stupp et al., 2005). Patients presenting with tumors of the brain discovered on imaging are usually referred for surgical intervention to provide tumor tissue for histological diagnosis and molecular testing. Furthermore, the extent of resection is an important prognostic factor. While glioblastomas may vary between patients in their molecular features, similar treatment has been applied to the majority of these tumors due to the lack of effective and specific treatment options. Metabolomics provides us a powerful tool to examine plasma metabolites in patients with glioblastoma to potentially identify clinically relevant biomarkers. In particular, little is known about how biogenic amines levels change during early treatment stages like surgery and chemoradiation.
Our study compared prospectively collected blood metabolomics profiles obtained from glioblastoma IDH wildtype patients before and after surgical resection, before and after concurrent RT with TMZ chemotherapy, as well as also after their treatment with adjuvant TMZ chemotherapy as per standard of care protocol (Stupp et al., 2005). Obtaining a metabolomic profile for patients may help in improvement of treatment strategies, and several compound classes such as sugar alcohols were previously detected as markers in other cancers (Ismail et al., 2020).
N-glycine is a nonessential amino acid that belongs to the super class of organic acids. Glycine is biosynthesized in the body from amino acid serine and is involved in the body’s production of collagen, hemoglobin, and DNA with the principal function as a precursor to proteins. Glycine and serine both play a role in one carbon metabolism (Xia et al., 2019). Glycine is an inhibitory neurotransmitter in the central nervous system, and this might explain our observation of upregulation of Glycine after surgery. Some studies showed elevated glycine after severe traumatic brain injury, and such an upregulation is thought to be a compensatory mechanism to counteract the excitotoxic impacts of glutamate (Ruppel et al., 2001).
Of note, elevated serum levels of glycine and serine were linked to a protective role in pancreatic cancer (Luu et al., 2022). Kim et. al reported an important role for both serine and glycine in glioblastoma cells survival in the “ischemic zones” of gliomas (Kim et al., 2015). Betonicine was another amino acid that we noticed upregulation after surgery in our samples, though its relevance is unclear.
After surgery, certain external substances called exogenous metabolites can be detected. These include p-acetamidophenyl.beta.-D-glucuronide, which is a major urinary metabolite of Acetaminophen, and 3-(Cystein-S-yl) acetaminophen, an amino acid with organic acids. Another detected metabolite is acetaminophen sulfate, belonging to the phenylsulfates group of organic acids. Additionally, S-Methyl-3-thioacetaminophen, which is also a metabolite of acetaminophen, is found. These findings are likely linked to the direct administration of medication right after surgery. Similarly, the levels of 2-Hydroxy-5-sulfopyridine-3-carboxylic acid, Dehydrofelodipine, and 2-Amino-3-methoxybenzoic acid increased after surgery, and the last compound's levels decreased after treatment completion. This suggests that these compounds may originate from external sources.
Our results included downregulation of multiple metabolites after surgery, this included metabolites that are related to medications and/or supplements used during and shortly after surgery such as: sugar alcohols including (mannitol, sorbitol, and lactitol) with little significant energy value as they are largely eliminated from the body. Bupivacaine, a long-acting local anesthetic, is only found in individuals that have used or taken this drug. Lastly, 1-hydroxymidazolam-beta-D-glucuronide is the glucuronidated conjugate of a midazolam metabolite.
Lipid metabolism correlates with cell replication, so decreased levels of Linoleic acid may suggest altered cell replication. 1-Methylnicotinamide and Nudifloramide are Pyridine alkaloids with Alkaloids super class. 1-Methylnicotinamide was previously reported to be enriched in T cells infiltrating serous carcinoma (Kilgour et al., 2021). Fatty Acyls such as Hexadecanedioic acid and 3-Hydroxybutyric acid were also downregulated after surgery. The upregulation of sterol lipids including Glycodeoxycholic acid, Glycocholic acid, and Taurocholic acid after surgery could be related, at least in part, to the dysregulated lipid metabolism in glioma (Abdul Rashid et al., 2022). The downregulation of Riluzole, Benzothiazole with Organoheterocyclic compounds super class, is not fully clear as our patients were not on exogenous treatment with Riluzole.
Common metabolites were noted to be upregulated shortly after finishing concurrent chemoradiation therapy and later on after concluding treatment with adjuvant TMZ. One of these metabolites is N-Methylisoleucine which is an isoleucine derivative belonging to the organic acids super class, and there has not previously been reported an association between this metabolite and cancer. Another metabolite that was upregulated is 4-Methyl-5-thiazoleethanol that is a thiazole with Organoheterocyclic compounds super class, this is a natural product that is found outside the cells as well as in the cytoplasm. The hydroxy fatty acid 6-Hydroxycaproic acid was upregulated after concurrent chemoradiation.
Another set of metabolites were noted to be downregulated shortly after finishing concurrent chemoradiation therapy and later after concluding treatment with adjuvant TMZ. This was related to medication changes during treatment such as discontinuing Famotidine (thiazole with Organoheterocyclic super class) after treatment. N-Isovalerylglycine, an amino acid natural product of leucine catabolism (Kim et al., 2016), has been associated with multiple diseases including colorectal cancer although no association has been established with brain tumors. Further, there has not been any reported association of cancer with 3-Methylcrotonylglycine.
After concluding treatment, we noted an increase in Coniferyl aldehyde that is a cinnamic acid with the polyketides super class. This metabolite has been reported to promote re-proliferation of the intestinal epithelium by inhibiting cell death and promoting endothelial cell function (Jeong et al., 2015), though there has not been any reported association with brain tumors. DMSO is probably due to an exogenous source given that it has analgesic and anti-inflammatory properties.
Glycerophosphocholine is an organic phosphoric acid with the organic acids super class. It has a role in choline storage in the cytosol. Glycerophosphocholine has been linked to cancer, with lung cancer tissue having higher levels than adjacent normal tissues (Chen et al., 2011). Furthermore, Melanoma with brain metastasis has higher levels of Glycerophosphocholine (Sjøbakk et al., 2013).
The upregulation of Bradykinin after concluding treatment could be of clinical value as bradykinin was previously reported to promote glioma invasion and cell migration by acting on B2 receptors (Montana and Sontheimer, 2011). The authors of this report propose targeting B2 receptors as a treatment strategy in the future. Upregulation of Diatrizoic acid, which is an organic, iodinated radiopaque X-ray contrast medium used in diagnostic radiography, is likely due to imaging studies performed near sample collection times.
Treatment with temozolomide causes senescence in cancer cells (Mhaidat et al., 2007), which might explain our observation of increased levels of carnitine during treatment. Carnitines have previously been reported to lead to senescence (Yamada et al., 2012) wherein downregulation of L-Propionylcarnitine was seen after finishing treatment with chemotherapy. 1,5-Pentanediamine is a diamines that has previously been reported to inhibit ornithine decarboxylase, which results in the inhibition of neuroblastoma cells and glioma cells to a less extent (Chapman and Glant, 1980). Chenodeoxycholic acid 24-acyl-beta-D-glucuronide, mostly an exogenous metabolite, is a bile acid with the Sterol lipids super class.
Cancer treatment (surgery, radiation therapy, and chemotherapy) in our study samples altered levels in both endogenous and exogenous compounds. The endogenous changes can be rationalized as typical cancer-related compounds, including glycine and serine. This might be interpreted as overflow of oxidative pathways due to aberrant glycolysis, but a more likely explanation may be that these metabolites are likely hexoses. Thus, further confirmation on some of these metabolites is required. Having said that, the full implication of exogenous metabolites in treatment or treatment stage is not fully clear.
Furthermore, ML models, including random forest (RF) and AdaBoost (AB), accurately classified treatment phases, with RF showing the highest accuracy. The RF model successfully distinguished pre-surgery from post-surgery plasma samples, capturing treatment-related metabolic changes. Sorbitol and N-methylisoleucine emerged as important predictive features, consistently ranking highly across multiple methods. SHAP analysis confirmed their significance in treatment stage classification. Notably, sorbitol and N-methylisoleucine, previously unassociated with cancer, hold potential as novel glioblastoma biomarkers. The ML findings complemented statistical analyses, providing further insights into predictive biogenic amines. This integration enhances our understanding of glioblastoma metabolism.
The generalization of our findings is limited by the small sample size and the collection of the samples restricted to one center. An additional external dataset from a broader geographical area would be needed to confirm our results. Second, the study is missing control groups consisting of samples from normal donors. However, comparing metabolites pre-surgery, post-surgery, pre-concurrent chemoradiation, and post concurrent chemoradiation longitudinally in the same patient is considered using every patient as his/her own control in a prospective fashion. Lastly, due to the small sample size, the machine learning models suffer from some degree of overfitting despite our efforts of preventing this. With a larger sample size, however, we believe our machine learning models will be more generalizable. Furthermore, with longitudinal data, we can further apply more sophisticated deep learning models such as RNN, LSTM (Hochreiter and Schmidhuber, 1997), and transformer (Vaswani et al., 2017).
5. Conclusions
In our patient population with glioblastoma IDH wildtype, we identified several plasma metabolite changes that could be associated with surgery, radiation, and chemotherapy. Validation of these results in a larger cohort and further investigation of the underlying mechanism of these metabolites is still needed. Future validation may provide a guide for diagnosis and monitoring response to treatment.
Supplementary Materials
The following supporting information can be downloaded at the website of this paper posted on
Preprints.org. Supplementary table 1. Table details biogenic amines with significant changes post-surgery vs pre-surgery. Sub class information obtained using Metabolomics Workbench (
https://www.metabolomicsworkbench.org/databases/refmet/index.php ). “NA” lower match score or library match. Supplementary table 2. Table details biogenic amines with significant changes post-radiation vs pre-radiation. Sub class information obtained using Metabolomics Workbench (
https://www.metabolomicsworkbench.org/databases/refmet/index.php ). “NA” lower match score or library match. Supplementary table 3. Table details biogenic amines with significant changes post-treatment vs pre-radiation. Sub class information obtained using Metabolomics Workbench (
https://www.metabolomicsworkbench.org/databases/refmet/index.php ). “NA” lower match score or library match. Supplementary table 4. Model selection pipeline configuration. The pipeline was implemented with the Scikit-learn (Pedregosa
et al., 2011) Python library. LR, SVM, RF, AB, and MLP stand for Logistic Regression, Support Vector Machine, Random Forest, AdaBoost, and Multilayer Perceptron, respectively. Features were standardized, except for tree-based models, i.e., RF and AB. Supplementary table 5. Performance of classifiers with the best hyperparameters on the holdout testing set. All metrics were micro-averaged. Mean and standard deviation were computed based on 20 independent training runs with different random seeds. Supplementary Data 1. Feature importance by PCA, LDA, RF, and SFS.
Author Contributions
Conception and design of the study/experiments: OA, YAL, OB, OF; Experimental implementation/Data acquisition: OA, LAD, YAL, OF; Data analysis and interpretation: OA, LAD, YAL, JPA, OB, FL, RH, IT, OF; Drafting of manuscript: OA, YAL, LAD, RH, IT; Revision of the manuscript and approval of final version: OA, YAL, OB, JPA, LAD, AA, JR, FL, RH, IT, OF; All listed authors participated the writing of the manuscript and have read and approved the final version.
Funding
Drs. Aboud and Liu are supported in part by the UC Davis Paul Calabresi Career Development Award for Clinical Oncology as funded by the National Cancer Institute/National Institutes of Health through grant #2K12CA138464-11. Dr. Fiehn is supported by NIH U2C ES030158 funding related to study.
Institutional Review Board Statement
The study was conducted in accordance with the Declaration of Helsinki and approved by the Institutional Review Board of University of California, Davis, 95817. Date of approval 30 June 2021.
Informed Consent Statement
Informed consent was obtained from all subjects involved in the study.
Data Availability Statement
Data is not publicly available due to privacy.
Conflicts of Interest
The authors declare no conflict of interest.
References
- Rashid, Khairunnisa Abdul, Ibrahim, Kamariah, Wong, Jeannie Hsiu Ding, and Norlisah Mohd Ramli. 2022. Lipid Alterations in Glioma: A Systematic Review. Metabolites 12: 1280. [CrossRef]
- Aboud, Orwa, Liu, Yin Allison, Fiehn, Oliver, Brydges, Christopher, Fragoso, Ruben, Lee, Han Sung, Riess, Jonathan, Hodeify, Rawad, and Orin Bloch. 2023. Application of Machine Learning to Metabolomic Profile Characterization in Glioblastoma Patients Undergoing Concurrent Chemoradiation. Metabolites 13: 299. [CrossRef]
- Baranovičová, Eva, Galanda, Tomáš, Galanda, Miroslav, Hatok, Jozef, Kolarovszki, Branislav, Richterová, Romana, and Peter Račay. 2019. Metabolomic profiling of blood plasma in patients with primary brain tumours: Basal plasma metabolites correlated with tumour grade and plasma biomarker analysis predicts feasibility of the successful statistical discrimination from healthy subjects – a preliminary study. IUBMB Life 71: 1994–2002. [CrossRef]
- Barthel, Floris P., Johnson, Kevin C., Varn, Frederick S., Moskalik, Anzhela D., Tanner, Georgette, Kocakavuk, Emre, Anderson, Kevin J., Abiola, Olajide, Aldape, Kenneth, Alfaro, Kristin D., and et al. 2019. Longitudinal molecular trajectories of diffuse glioma in adults. Nature 576: 112–120. [CrossRef]
- Barupal, Dinesh K., Zhang, Ying, Shen, Tong, Fan, Sili, Roberts, Bryan S., Fitzgerald, Patrick, Wancewicz, Benjamin, Valdiviez, Luis, Wohlgemuth, Gert, Byram, Gregory, and et al. 2019. A Comprehensive Plasma Metabolomics Dataset for a Cohort of Mouse Knockouts within the International Mouse Phenotyping Consortium. Metabolites 9: 101. [CrossRef]
- Berkson, J. (1944) Application of the Logistic Function to Bio-Assay. Journal of the American Statistical Association 39, 357-365. [CrossRef]
- Boser, B.E., Guyon, I.M. and Vapnik, V.N. (1992) A training algorithm for optimal margin classifiers, Proceedings of the fifth annual workshop on Computational learning theory, Association for Computing Machinery, pp. 144–152.
- Breiman, L. (2001) Random Forests. 45, 5–32. http://doi.org/10.1023/A:1010933404324.
- Chapman, Sharon K., and Susan K. Glant. 1980. Antiproliferative effects of inhibitors of polyamine synthesis in tumors of neural origin. Journal of Pharmaceutical Sciences 69: 733–735. [CrossRef]
- Chen, Wenxue, Zu, Yukun, Huang, Qi, Chen, Fener, Wang, Guifang, Lan, Wenxian, Bai, Chunxue, Lu, Shaohua, Yue, Yong, and Feng Deng. 2011. Study on metabonomic characteristics of human lung cancer using high resolution magic-angle spinning 1 H NMR spectroscopy and multivariate data analysis. Magnetic Resonance in Medicine 66: 1531–1540. [CrossRef]
- David, E.R. and James, L.M. (1987) Learning Internal Representations by Error Propagation, Parallel Distributed Processing: Explorations in the Microstructure of Cognition: Foundations, MIT Press. pp. 318-362.
- Fiehn, Oliver. 2016. Metabolomics by Gas Chromatography–Mass Spectrometry: Combined Targeted and Untargeted Profiling. Current Protocols in Molecular Biology 114: 30.4.1–30.4.32. [CrossRef]
- Freund, Yoav, and Robert E. Schapire. 1995. A desicion-theoretic generalization of on-line learning and an application to boosting., 23–37. [CrossRef]
- Hegi, M.E., Diserens, A.C., Gorlia, T., Hamou, M.F., de Tribolet, N., Weller, M., Kros, J.M., Hainfellner, J.A., Mason, W., Mariani, L., Bromberg, J.E., Hau, P., Mirimanoff, R.O., Cairncross, J.G., Janzer, R.C. and Stupp, R. (2005) MGMT gene silencing and benefit from temozolomide in glioblastoma. N Engl J Med 352, 997-1003. [CrossRef]
- Hochreiter, S. and Schmidhuber, J. (1997) Long Short-Term Memory. Neural Computation 9, 1735-1780.
- Ismail, Israa T., Fiehn, Oliver, Elfert, Ashraf, Helal, Marwa, Salama, Ibrahim, and Hala El-Said. 2020. Sugar Alcohols Have a Key Role in Pathogenesis of Chronic Liver Disease and Hepatocellular Carcinoma in Whole Blood and Liver Tissues. Cancers 12: 484. [CrossRef]
- Jeong, Ye-Ji, Jung, Myung Gu, Son, Yeonghoon, Jang, Jun-Ho, Lee, Yoon-Jin, Kim, Sung-Ho, Ko, Young-Gyo, Lee, Yun-Sil, and Hae-June Lee. 2015. Coniferyl Aldehyde Attenuates Radiation Enteropathy by Inhibiting Cell Death and Promoting Endothelial Cell Function. PLoS ONE 10: e0128552. [CrossRef]
- Kilgour, Marisa K., MacPherson, Sarah, Zacharias, Lauren G., Ellis, Abigail E., Sheldon, Ryan D., Liu, Elaine Y., Keyes, Sarah, Pauly, Brenna, Carleton, Gillian, Allard, Bertrand, and et al. 2021. 1-Methylnicotinamide is an immune regulatory metabolite in human ovarian cancer. Science Advances, 7. [CrossRef]
- Kim, Dohoon, Fiske, Brian P., Birsoy, Kivanc, Freinkman, Elizaveta, Kami, Kenjiro, Possemato, Richard L., Chudnovsky, Yakov, Pacold, Michael E., Chen, Walter W., Cantor, Jason R., and et al. 2015. SHMT2 drives glioma cell survival in ischaemia but imposes a dependence on glycine clearance. Nature 520: 363–367. [CrossRef]
- Kim, Sunghwan, Thiessen, Paul A., Bolton, Evan E., Chen, Jie, Fu, Gang, Gindulyte, Asta, Han, Lianyi, He, Jane, He, Siqian, Shoemaker, Benjamin A., and et al. 2015. PubChem Substance and Compound databases. Nucleic Acids Research 44: D1202–D1213. [CrossRef]
- Louis, David N, Perry, Arie, Wesseling, Pieter, Brat, Daniel J, A Cree, Ian, Figarella-Branger, Dominique, Hawkins, Cynthia, Ng, H K, Pfister, Stefan M, Reifenberger, Guido, and et al. 2021. The 2021 WHO Classification of Tumors of the Central Nervous System: a summary. Neuro-Oncology 23: 1231–1251. [CrossRef]
- Low, Justin T, Ostrom, Quinn T, Cioffi, Gino, Neff, Corey, A Waite, Kristin, Kruchko, Carol, and Jill S Barnholtz-Sloan. 2022. Primary brain and other central nervous system tumors in the United States (2014-2018): A summary of the CBTRUS statistical report for clinicians. Neuro-Oncology Practice 9: 165–182. [CrossRef]
- Lundberg, S.M. and Lee, S.-I. (2017) A unified approach to interpreting model predictions, Proceedings of the 31st International Conference on Neural Information Processing Systems, Curran Associates Inc., pp. 4768–4777.
- Luu, Hung N., Paragomi, Pedram, Wang, Renwei, Huang, Joyce Y., Adams-Haduch, Jennifer, Midttun, Øivind, Ulvik, Arve, Nguyen, Tin C., Brand, Randall E., Gao, Yutang, and et al. 2022. The Association between Serum Serine and Glycine and Related-Metabolites with Pancreatic Cancer in a Prospective Cohort Study. Cancers 14: 2199. [CrossRef]
- Mhaidat, N M, Zhang, X D, Allen, J, A Avery-Kiejda, K, Scott, R J, and P Hersey. 2007. Temozolomide induces senescence but not apoptosis in human melanoma cells. British Journal of Cancer 97: 1225–1233. [CrossRef]
- Montana, Vedrana, and Harald Sontheimer. 2011. Bradykinin Promotes the Chemotactic Invasion of Primary Brain Tumors. Journal of Neuroscience 31: 4858–4867. [CrossRef]
- Ostrom, Quinn T, Cioffi, Gino, Gittleman, Haley, Patil, Nirav, Waite, Kristin, Kruchko, Carol, and Jill S Barnholtz-Sloan. 2019. CBTRUS Statistical Report: Primary Brain and Other Central Nervous System Tumors Diagnosed in the United States in 2012–2016. Neuro-Oncology 21: v1–v100. [CrossRef]
- Pang, Zhiqiang, Chong, Jasmine, Zhou, Guangyan, Morais, David Anderson de Lima, Chang, Le, Barrette, Michel, Gauthier, Carol, Jacques, Pierre-Étienne, Li, Shuzhao, and Jianguo Xia. 2021. MetaboAnalyst 5.0: narrowing the gap between raw spectra and functional insights. Nucleic Acids Research 49: W388–W396. [CrossRef]
- Pedregosa, F., Varoquaux, G., Gramfort, A., Michel, V., Thirion, B., Grisel, O., Blondel, M., Prettenhofer, P., Weiss, R., Dubourg, V., Vanderplas, J., Passos, A., Cournapeau, D., Brucher, M., Perrot, M. and Duchesnay, É. (2011) Scikit-learn: Machine Learning in Python. 12, 2825–2830.
- Raschka, Sebastian. 2018. MLxtend: Providing machine learning and data science utilities and extensions to Python’s scientific computing stack. The Journal of Open Source Software, 3. [CrossRef]
- Ruppel, Randall A., Kochanek, Patrick M., Adelson, P.David, Rose, Marie E., Wisniewski, Stephen R., Bell, Michael J., Clark, Robert S.B., Marion, Donald W., and Steven H. Graham. 2001. Excitatory amino acid concentrations in ventricular cerebrospinal fluid after severe traumatic brain injury in infants and children: The role of child abuse. The Journal of Pediatrics 138: 18–25. [CrossRef]
- Sjøbakk, Torill E., Vettukattil, Riyas, Gulati, Michel, Gulati, Sasha, Lundgren, Steinar, Gribbestad, Ingrid S., Torp, Sverre H., and Tone F. Bathen. 2013. Metabolic Profiles of Brain Metastases. International Journal of Molecular Sciences 14: 2104–2118. [CrossRef]
- Stupp, Roger, Mason, Warren P., Bent, Martin J. van Den, Weller, Michael, Fisher, Barbara, Taphoorn, Martin J.B., Belanger, Karl, Brandes, Alba A., Marosi, Christine, Bogdahn, Ulrich, and et al. 2005. Radiotherapy plus Concomitant and Adjuvant Temozolomide for Glioblastoma. The New England Journal of Medicine 352: 987–996. [CrossRef]
- Vaswani, A., Shazeer, N.M., Parmar, N., Uszkoreit, J., Jones, L., Gomez, A.N., Kaiser, L. and Polosukhin, I. (2017). Attention is All you Need. NIPS.
- Xia, Yingfeng, Ye, Bingwei, Ding, Jane, Yu, Yajie, Alptekin, Ahmet, Thangaraju, Muthusamy, Prasad, Puttur D., Ding, Zhi-Chun, Park, Eun Jeong, Choi, Jeong-Hyeon, and et al. 2019. Metabolic Reprogramming by MYCN Confers Dependence on the Serine-Glycine-One-Carbon Biosynthetic Pathway. Cancer Research 79: 3837–3850. [CrossRef]
- Yamada, Shuichi, Matsuda, Ryosuke, Nishimura, Fumihiko, Nakagawa, Ichiro, Motoyama, Yasushi, Park, Young-Su, Nakamura, Mitsutoshi, Nakase, Hiroyuki, Ouji, Yukiteru, and Masahide Yoshikawa. 2012. Carnitine-induced senescence in glioblastoma cells. Experimental and Therapeutic Medicine 4: 21–25. [CrossRef]
Figure 1.
Comparison of biogenic amines profile of post-surgery samples vs pre-surgery. (A) partial least squares-discriminant analysis (PLS-DA) showed two grouped clustering with evidence of separation between plasma at pre-surgery (purple) and post-surgery (green). (B) VIP score with the highest 25 metabolites. (C) Heatmap of the top 40 altered metabolites at pre-surgery and post-surgery. Blue indicates decreased peak value and maroon indicates increased peak value of each compound listed. (D) Volcano plot of up regulated biogenic amines (right side) and down regulated biogenic amines (left side) plasma specimens at post-surgery comparing to at pre-surgery using p-value of <0.05 and fold change cutoffs of 2.0, colors correlate with metabolite’s super class.
Figure 2.
Comparison of biogenic amines profile of post-radiation samples vs pre-radiation. (A) partial least squares-discriminant analysis (PLS-DA) showed two grouped clustering with evidence of separation between plasma at pre-radiation (purple) and post-radiation (green). (B) VIP score with the highest 25 metabolites. (C) Heatmap of the top 40 altered metabolites at pre-radiation and post-radiation. Blue indicates decreased peak value and maroon indicates increased peak value of each compound listed. (D) Volcano plot of up regulated biogenic amines (right side) and down regulated biogenic amines (left side) in plasma specimens at post-radiation comparing to at pre-radiation using p-value of <0.05 and fold change cutoffs of 2.0, colors correlate with metabolite’s super class.
Figure 3.
Comparison of biogenic amines profile of post-treatment samples vs pre-radiation. (A) partial least squares-discriminant analysis (PLS-DA) showed two grouped clustering with evidence of separation between plasma at pre-radiation (purple) and post-treatment (green). (B) VIP score with the highest 25 metabolites. (C) Heatmap of the top 40 altered metabolites at pre-radiation and post-radiation. Blue indicates decreased peak value and maroon indicates increased peak value of each compound listed. (D) Volcano plot of up regulated biogenic amines (right side) and down regulated biogenic amines (left side) in plasma specimens at post-treatment comparing to at pre-radiation using p-value of <0.05 and fold change cutoffs of 2.0, colors correlate with metabolite’s super class.
Figure 4.
Comparison between classifiers Random Forest (RF), AdaBoost (AB), Support Vector Machine (SVM), Logistic Regression (LR), and Multiplayer Perceptron (MLP) on 5-fold cross-validation results. Five independent grid searches were performed for robustness, and the hyperparameter set with the best mean validation accuracy was shown for each classifier (i.e., for each boxplot). The box indicates the interquartile range, the horizontal middle line indicates the median, the diamond indicates an outlier, and the whisker line indicates the range between minimum and maximum, excluding outliers. The p-values were computed with two-tailed t-tests.
Figure 5.
Performance evaluation on the testing set for the best model. Random Forest with the best hyperparameter trained with the entire training set was shown. a Micro- and macro-averaging of evaluation metrics. Macro-averaging is the average of a metric across different classes, while micro-averaging is the weighted average based on the size of each class. The boxplot consists of 20 points, where each point is a corresponding metric computed from an independent run with different random initialization. b Confusion matrix for the best model. The standard deviation was computed from the 20 independent runs. c, d Precision-recall (PR) and receiver operating characteristic (ROC) curves. Each curve was plotted by concatenating predictions from the 20 independent runs.
Figure 6.
Comparison of different feature importance methods. a Biogenic amine feature ranks of Principal Component Analysis (PCA), Linear Discriminant Analysis (LDA), Random Forest (RF), and Sequential Feature Selection (SFS). The table only shows the biogenic amines ranked top 10 by at least two methods. b SHAP values of Random Forest with features selected by SFS. The interpretation of a SHAP value for a tree-based model is that a feature satisfying a split criterion expects to change the output probability by the amount of SHAP value.
Table 1.
Demographics of patients. “BS” pre-surgery sample, “S” two days post-surgery sample, “RT” pre-radiation sample, and “PRT” immediate post-radiation sample “PT” post-treatment sample.
Table 1.
Demographics of patients. “BS” pre-surgery sample, “S” two days post-surgery sample, “RT” pre-radiation sample, and “PRT” immediate post-radiation sample “PT” post-treatment sample.
|
Disclaimer/Publisher’s Note: The statements, opinions and data contained in all publications are solely those of the individual author(s) and contributor(s) and not of MDPI and/or the editor(s). MDPI and/or the editor(s) disclaim responsibility for any injury to people or property resulting from any ideas, methods, instructions or products referred to in the content. |
© 2023 by the authors. Licensee MDPI, Basel, Switzerland. This article is an open access article distributed under the terms and conditions of the Creative Commons Attribution (CC BY) license (http://creativecommons.org/licenses/by/4.0/).
