2. Materials and Methods
Study design, population, and setting
This was a single-center (Kagoshima City Hospital) prospective, observational study. This study included adult OHCA patients aged ≥18 years to whom intravenous femoral arterial line and venous line were inserted, and a SctO2 monitor was attached. This study was approved by the institutional review board of Kagoshima City Hospital (Approval No. 2020-56).
Study procedure
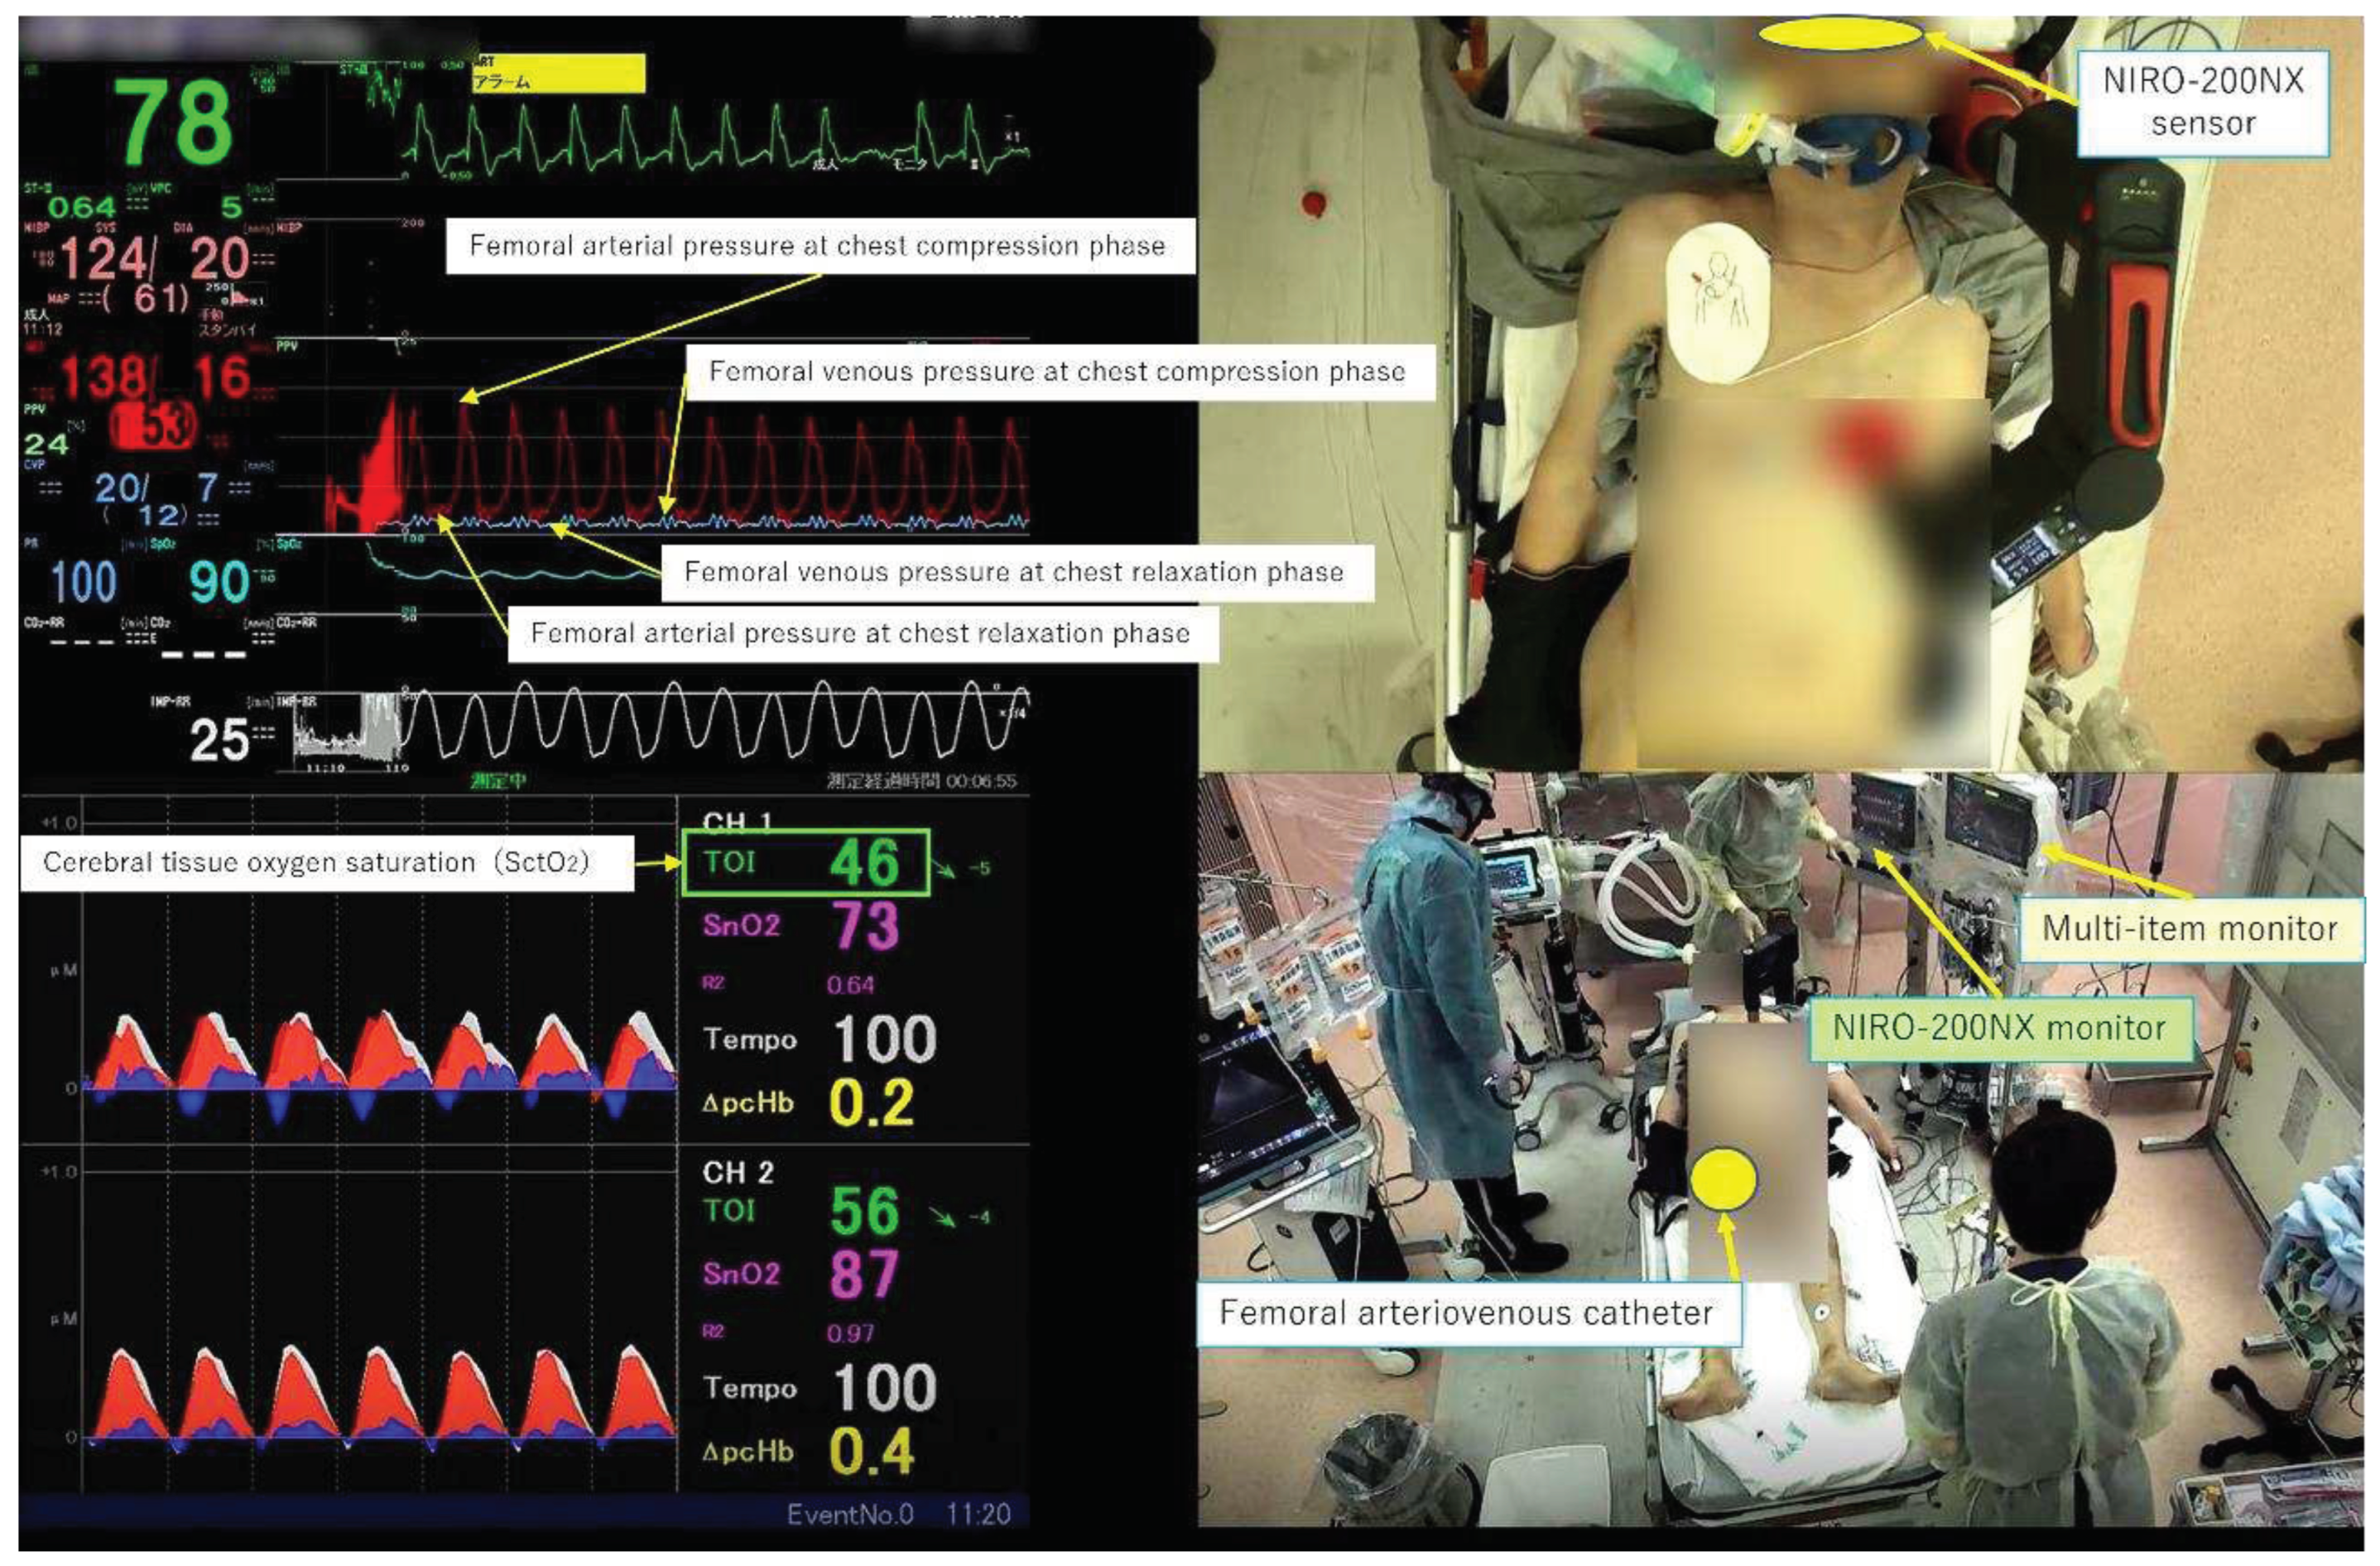
In our emergency department, we immediately insert catheters into the femoral artery and vein for potential candidates who require interventions such as extracorporeal cardiopulmonary resuscitation (ECPR) using extracorporeal membrane oxygenation to ensure prompt treatment after admission for cardiac arrest patients. In this study, we measured FAP and FVP invasively for patients who did not receive interventions such as ECPR and were not subjected to catheterization and used a near-infrared spectroscopy (NIRS) measurement probe on the forehead to measure SctO
2 using the NIRO-200NX
® device made by Hamamatsu Photonics, irrespective of the presence or absence of FAP and FVP measurements. These parameters were simultaneously displayed and recorded using a multi-screen recording system (Ciel View
®) (
Figure 1), which enabled the observation of both the external appearance of the resuscitation procedure and the physiological responses in real time. The highest blood pressure (BP) displayed on the multi-parameter monitor was defined as BP at the compression phase (CP), and the lowest blood pressure was defined as BP at the chest relaxation phase (RP). The mean arterial pressure (MAP), arterial pressure (AP) at CP, AP at RP, mean venous pressure (MVP), venous pressure (VP) at CP, VP at RP, and SctO
2 were extracted every ten seconds for each case. Herein, we present four representative cases where this monitoring system was utilized during CPR.
3. Results
Case 1: A patient with acute aortic dissection as the etiology of cardiac arrest
The patient was discovered collapsed at home, and the initial electrocardiogram (ECG) waveform upon contact with the emergency medical service indicated cardiac arrest. The patient was transported to our emergency department without return of spontaneous circulation (ROSC). Upon arrival, the patient remained in cardiac arrest, and echocardiography revealed a small amount of pericardial effusion, which subsequently increased. Therefore, pericardiocentesis and pericardiotomy were performed, and a total of 5 mg of adrenaline was administered, but ROSC could not be achieved, and resuscitation was discontinued.
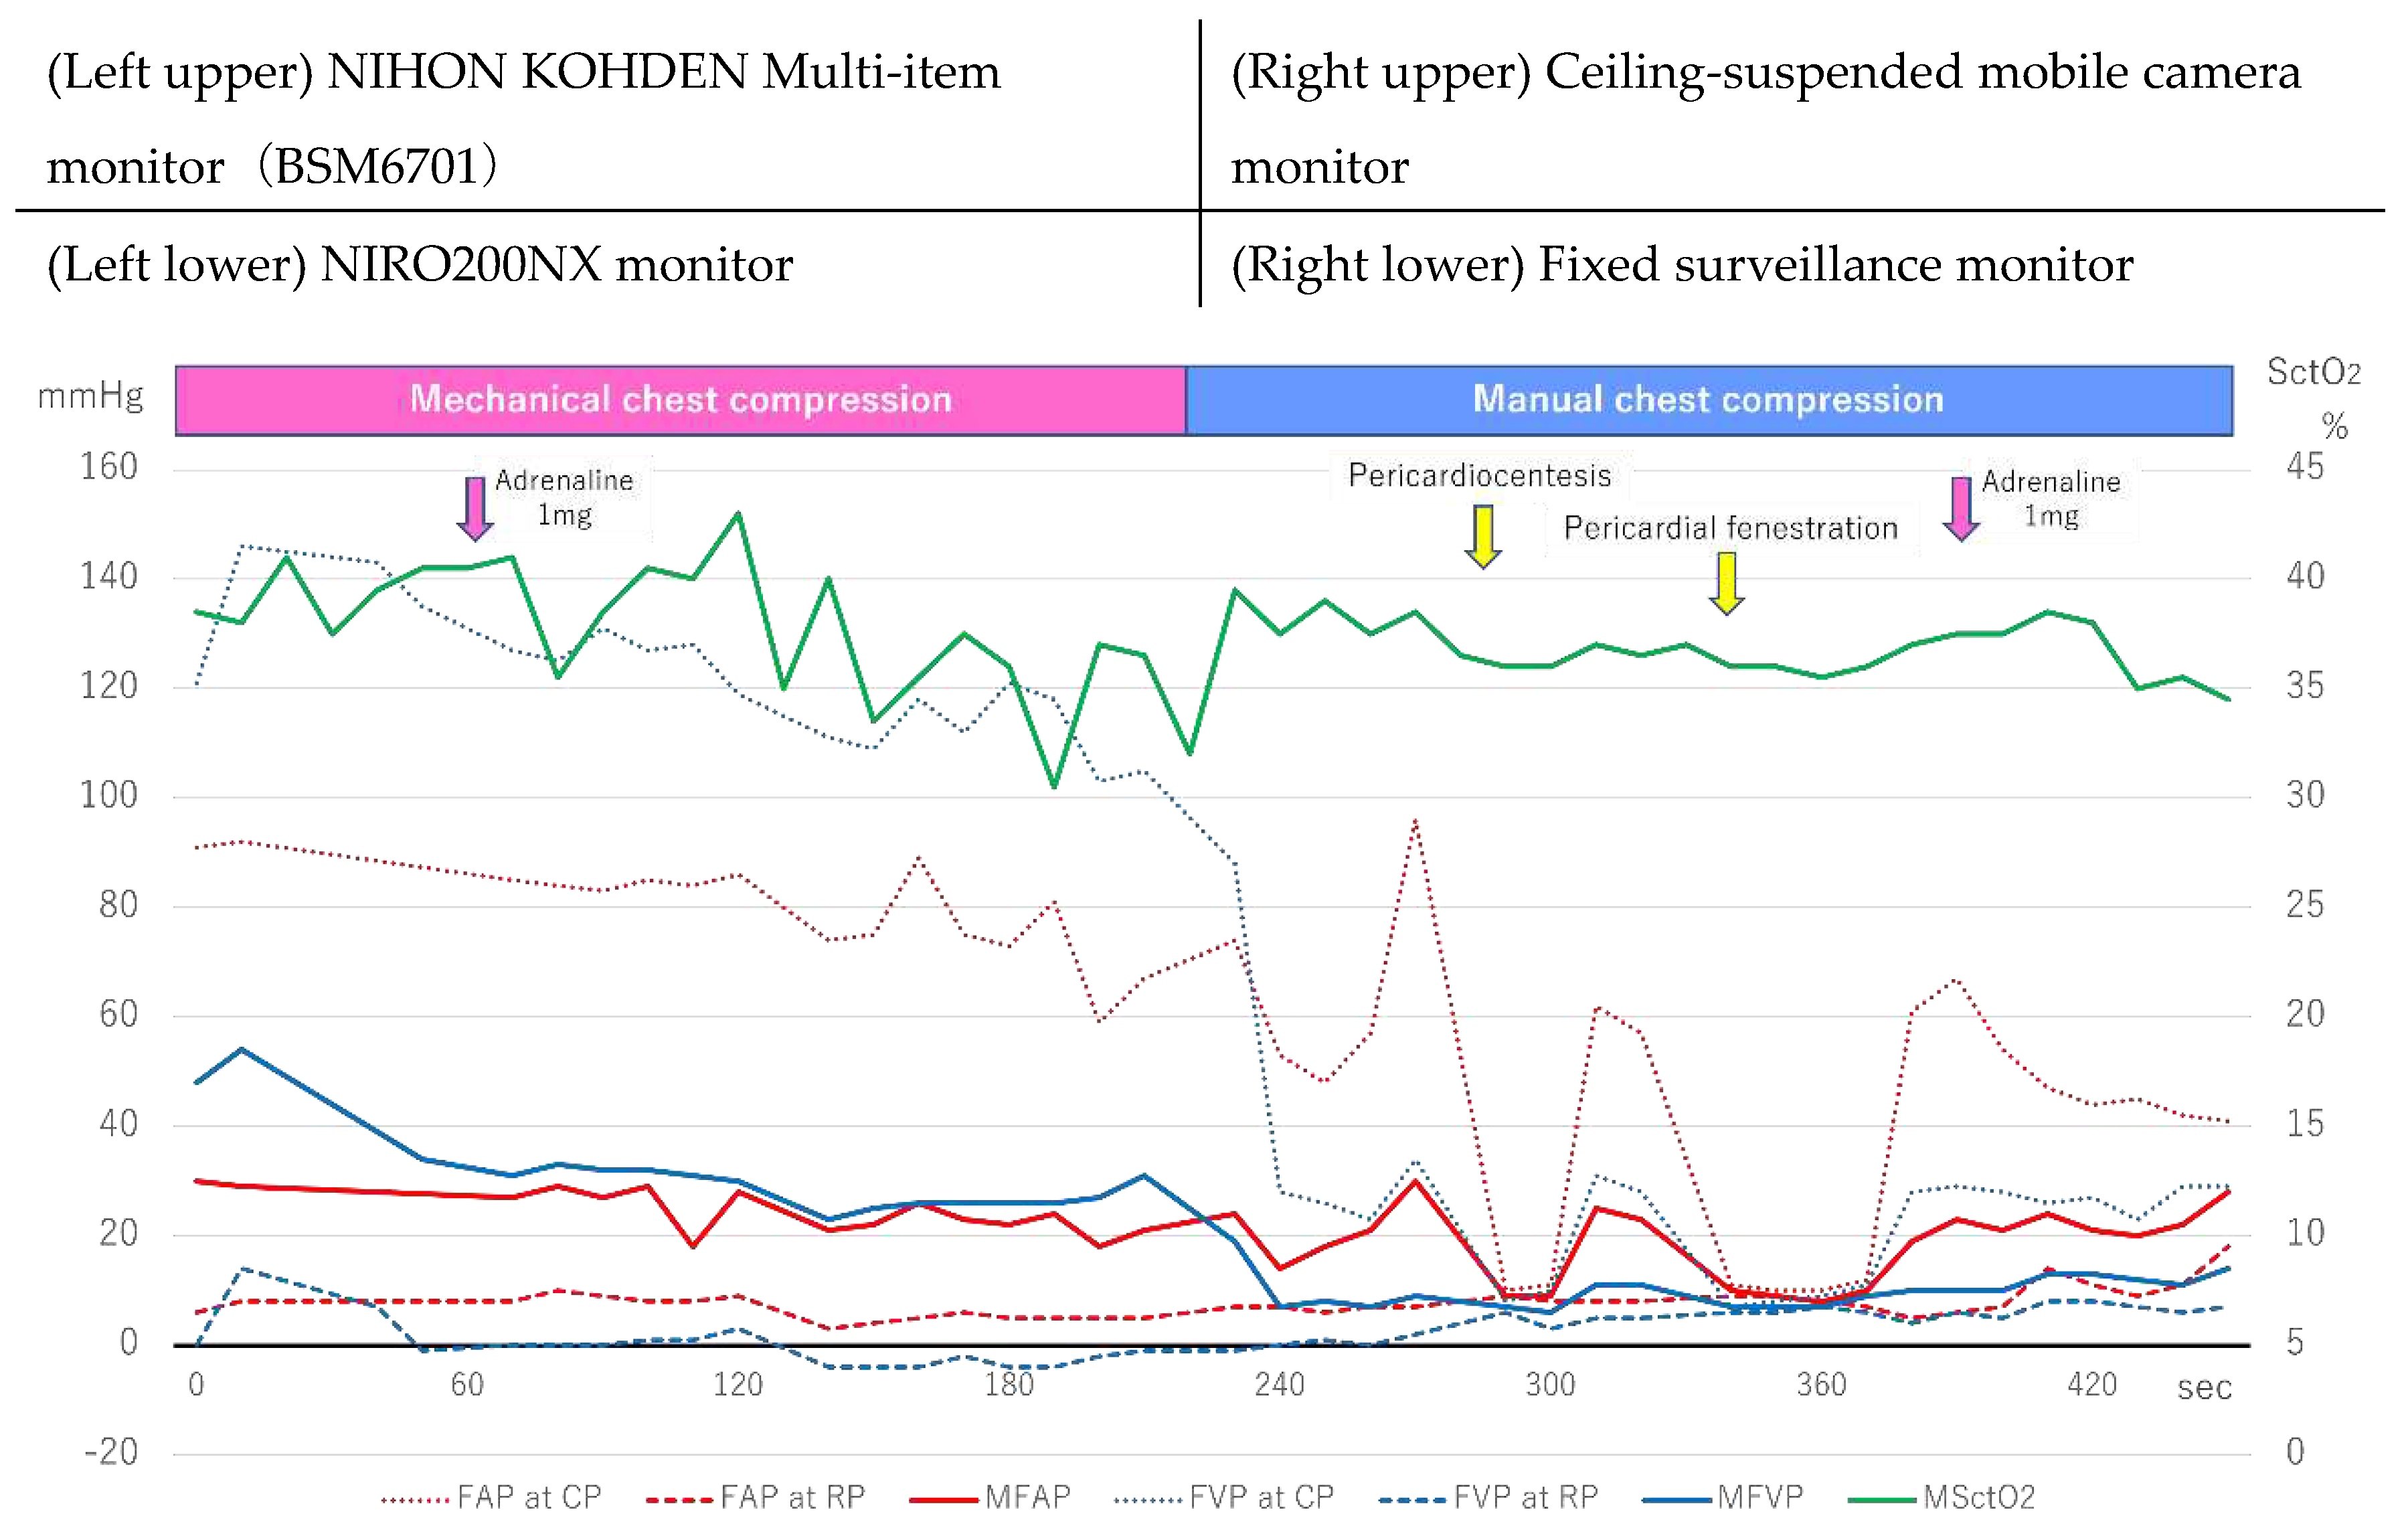
Figure 2 shows the changes in FAP, FVP, and SctO
2.
FAP and FVP measurement was initiated six minutes after arrival, during mechanical chest compressions, and the FVP was higher than the FAP during both the compression and mean phases. In particular, the FVP at CP exceeded 140 mmHg, and SctO2 ranged from 40% to the early 30s. Manual chest compressions were performed at approximately 240 seconds, the FVP at CP rapidly decreased, and the FAP and FVP reversed. During pericardiocentesis and pericardiotomy, chest compressions were temporarily suspended. Still upon resumption of chest compressions, both the AP at CP exceeded the VP at CP, and SctO2 slightly increased and ranged in the late 30s.
Case 2: A patient with presumed cardiac etiology of arrest
The patient was witnessed sinking while taking a bath in a public bathhouse, and emergency services were called. Upon initial contact with the ambulance team, the electrocardiogram showed asystole and remained so upon arrival at our emergency medical center. Although 5 mg of adrenaline was administered, resuscitation was discontinued due to lack of return of ROSC.
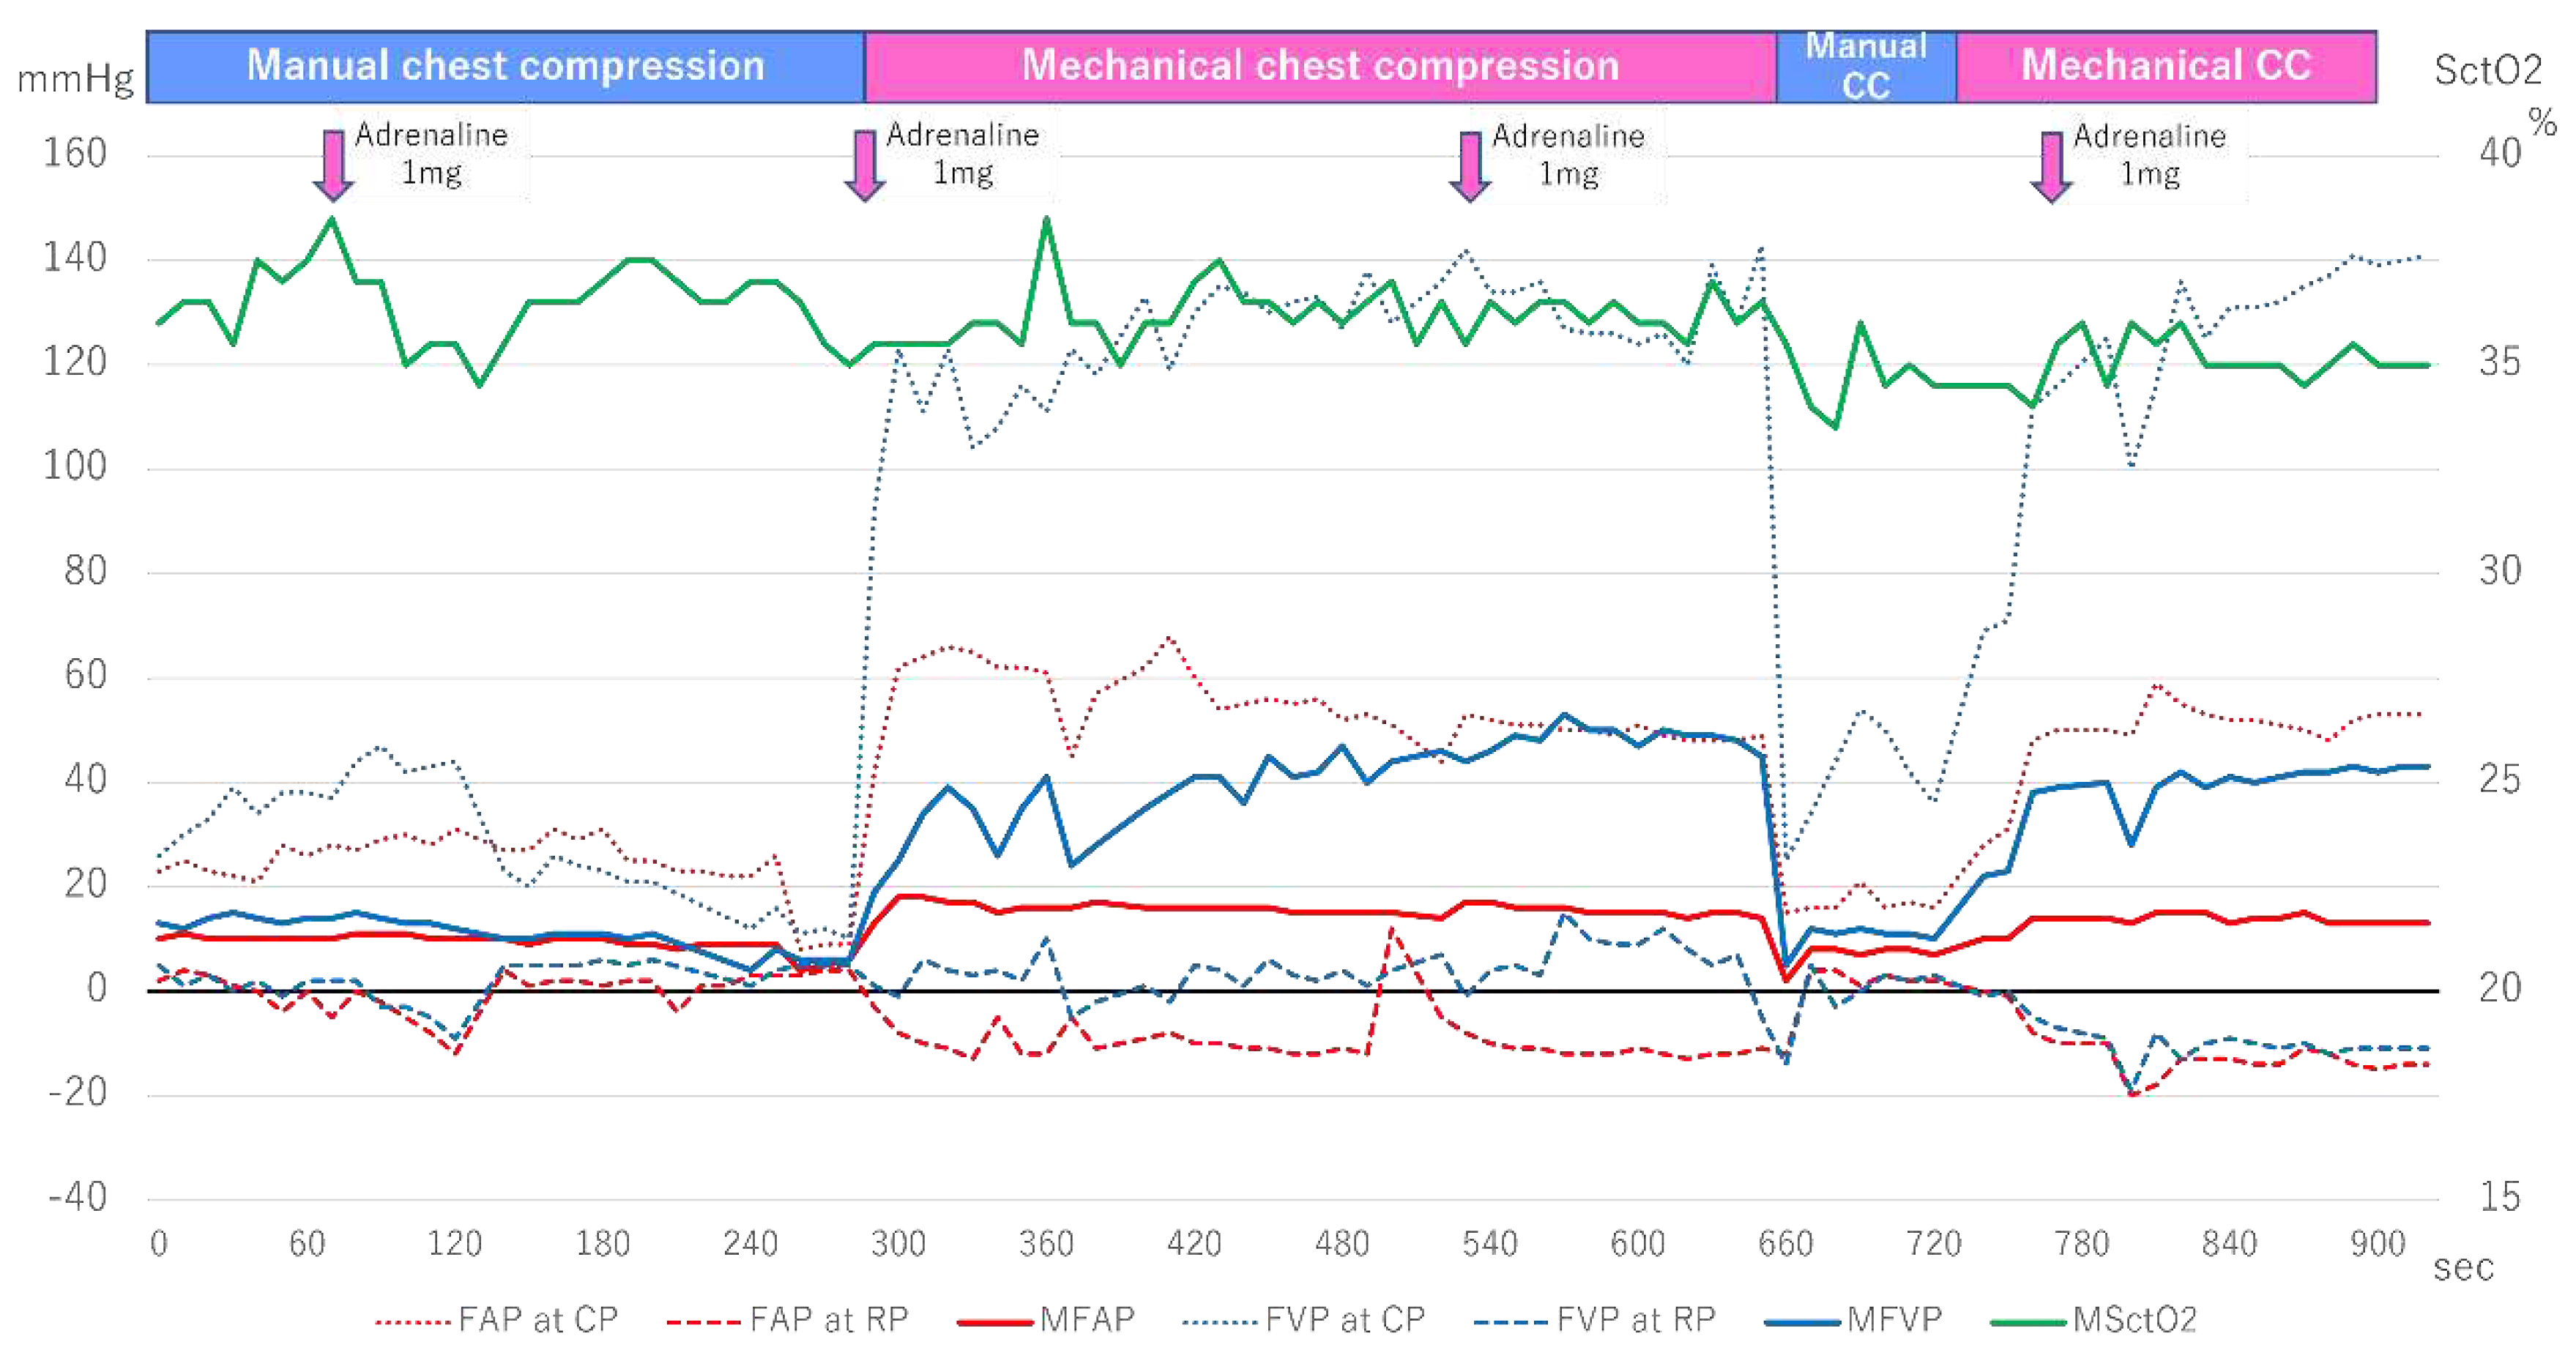
Figure 3 shows the changes in the FAP, FVP, and SctO
2. When the FAP and FVP measurement was started 6 minutes after arrival, the patient underwent manual cardiac massage, and the VP at CP was higher than the AP at CP, but this reversed around 150 seconds. The MAP and MVP were at the same level during this time, and SctO
2 fluctuated around 35-38%. Subsequently, mechanical cardiac massage was initiated around 270 seconds, and the FVP rose rapidly. In particular, the VP at CP increased to 120-140 mmHg, while the AP at CP remained at around 50-60 mmHg, with the VP always higher than the AP. Furthermore, when manual cardiac massage was resumed at around 660 seconds, both the FAP and FVP decreased rapidly. When the mechanical cardiac massage was resumed again around 750 seconds, the VP at CP quickly increased to 120-140 mmHg as before, but the AP at CP only rose to 50 mmHg, and SctO
2 fluctuated around 35%.
Case 3: A patient with acute coronary syndrome as the etiology of cardiac arrest
The patient collapsed and was subsequently transported to our hospital after experiencing chest pain and discomfort for two days. Initial ECG waveform upon contact with the emergency medical team showed cardiac arrest. Although the patient achieved ROSC after administering 2 mg of adrenaline, they experienced pulseless electrical activity (PEA) one minute later. Despite administering an additional 3 mg of adrenaline, the patient was still in PEA upon arrival at our hospital, as shown in
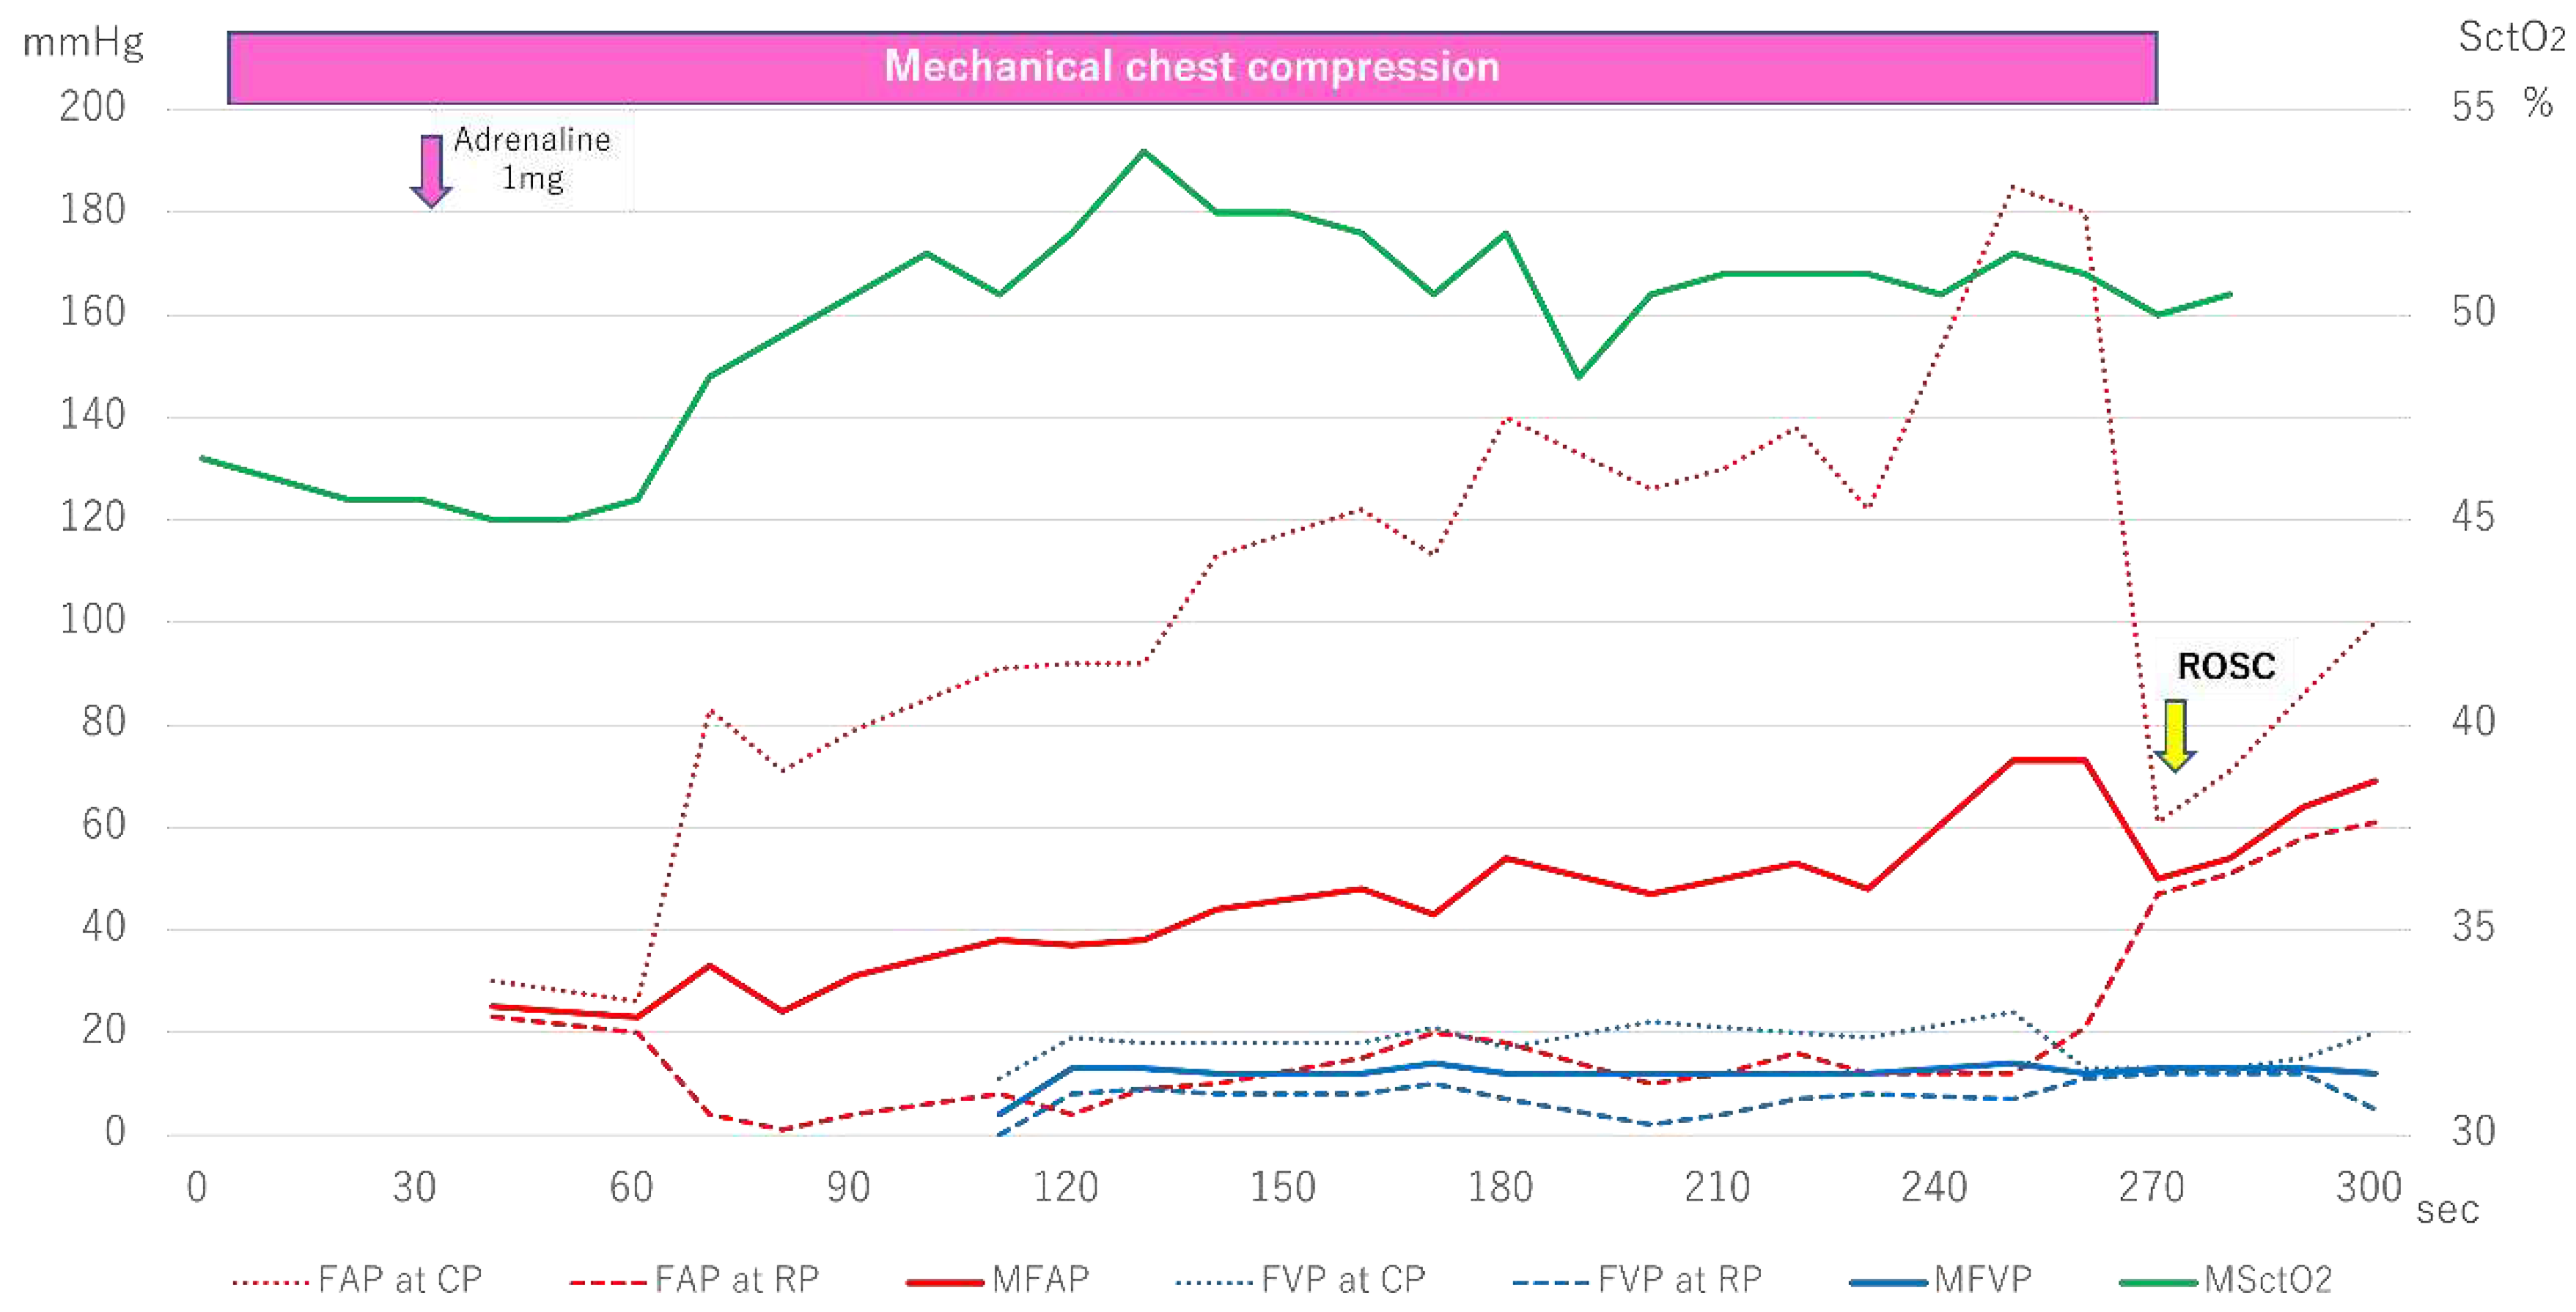
Figure 4, shows the progression of FAP, FVP, and SctO
2.
Mechanical chest compressions were performed from the time of hospital admission, and the initial SctO2 measurement was relatively high, ranging from 45-46%. However, the initial AP at CP and MAP measured from the femoral artery were 80mmHg and 30mmHg, respectively. Additionally, at approximately 120 seconds after the start of FVP measurement, the AP at CP and MAP had risen to 90mmHg and 40mmHg, respectively, higher than the FVP. Subsequently, while the FAP continued to grow, the FVP remained almost constant, and the VP at CP, the VP at RP, and the MVP never exceeded 25mmHg. During this period, the SctO2 value increased above 50%, and the patient achieved ROSC at approximately 270 seconds.
Case 4: A patient with asphyxia as the etiology of cardiac arrest
The patient had experienced a loss of appetite two weeks prior but was being monitored. After going to bed, the patient’s family found vomit next to the pillow, and the patient was found not breathing, prompting an emergency call. The initial ECG waveform taken by the ambulance crew showed asystole, and the patient was transported to our hospital while airway management and cardiopulmonary resuscitation were performed.
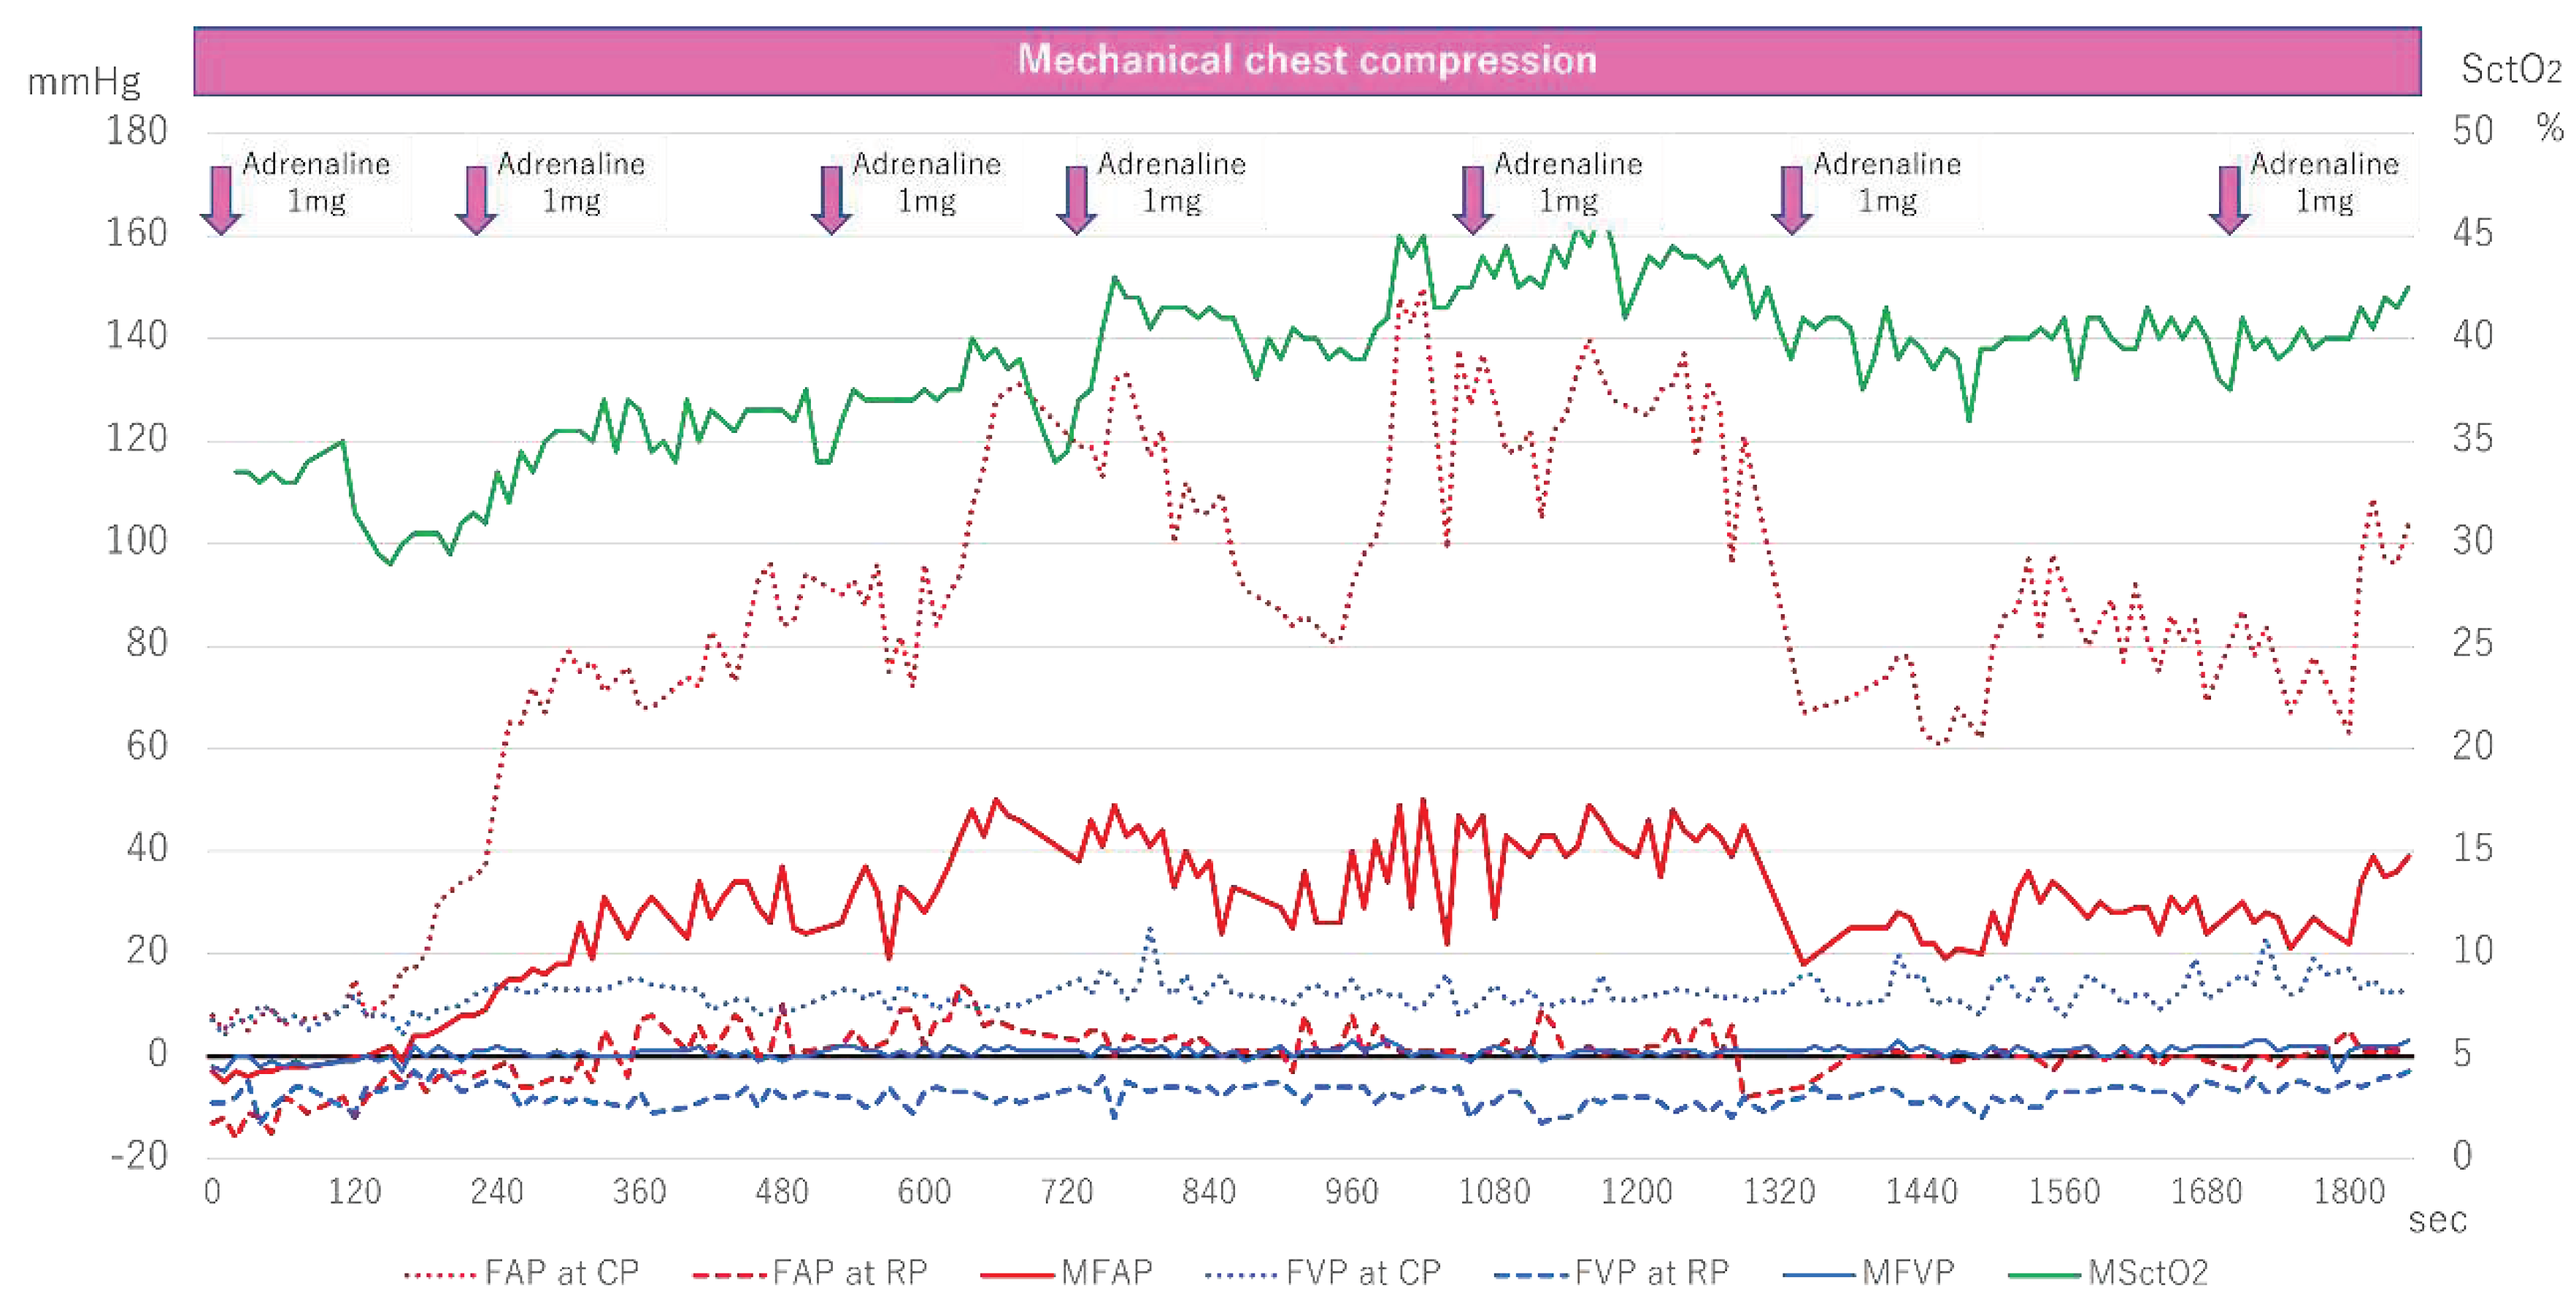
Figure 5 shows the changes in FAP, FVP, and SctO
2.
Measurement of FAP and FVP started six minutes after arrival, and both were initially low. Although FAP began to rise around 120 seconds after measurement began, FVP remained almost unchanged. With each administration of adrenaline, AP at CP gradually increased, exceeding 140mmHg at about 1000 seconds. In contrast, SctO2 increased with the rise in FAP, fluctuating between 40-45%, and ultimately ROSC was achieved.
Figure 2.
Femoral arteriovenous pressure and SctO2 in Case 1. FAP indicates Femoral arterial pressure; CP, compression phase; RP at chest relaxation phase. FVP, Femoral venous pressure; MSctO2, Mean cerebral tissue oxygen saturation.
Figure 2.
Femoral arteriovenous pressure and SctO2 in Case 1. FAP indicates Femoral arterial pressure; CP, compression phase; RP at chest relaxation phase. FVP, Femoral venous pressure; MSctO2, Mean cerebral tissue oxygen saturation.
Figure 3.
Femoral arteriovenous pressure and SctO2 in Case 2. FAP indicates Femoral arterial pressure; CP, compression phase; RP, relaxation phase. FVP, Femoral venous pressure; MSctO2, Mean cerebral tissue oxygen saturation.
Figure 3.
Femoral arteriovenous pressure and SctO2 in Case 2. FAP indicates Femoral arterial pressure; CP, compression phase; RP, relaxation phase. FVP, Femoral venous pressure; MSctO2, Mean cerebral tissue oxygen saturation.
Figure 4.
Femoral arteriovenous pressure and SctO2 in Case 3. FAP indicates Femoral arterial pressure; CP, compression phase; RP at chest relaxation phase; FVP, Femoral venous pressure; MSctO2, Mean cerebral tissue oxygen saturation; ROSC, return of spontaneous circulation.
Figure 4.
Femoral arteriovenous pressure and SctO2 in Case 3. FAP indicates Femoral arterial pressure; CP, compression phase; RP at chest relaxation phase; FVP, Femoral venous pressure; MSctO2, Mean cerebral tissue oxygen saturation; ROSC, return of spontaneous circulation.
Figure 5.
Femoral arteriovenous pressure and SctO2 in Case 4. FAP indicates Femoral arterial pressure; CP, compression phase; RP at chest relaxation phase; FVP, Femoral venous pressure; MSctO2, Mean cerebral tissue oxygen saturation; ROSC, return of spontaneous circulation.
Figure 5.
Femoral arteriovenous pressure and SctO2 in Case 4. FAP indicates Femoral arterial pressure; CP, compression phase; RP at chest relaxation phase; FVP, Femoral venous pressure; MSctO2, Mean cerebral tissue oxygen saturation; ROSC, return of spontaneous circulation.
4. Discussion
In this study, we presented a simultaneous physiological monitoring system capable of monitoring AP, VP, and SctO2. We also presented several cases, including two patients with significant increases in FVP and low SctO2 values. In contrast, we also showed two cases in which CPR resulted in higher FAP compared to FVP, and an upward trend in SctO2 values was observed.
Recently, there has been an increasing focus on measuring the quality of CPR. Notably, in the 2020 international CPR guideline, a single cut-off point for diastolic BP during the first ten minutes was introduced (at least 25 mmHg in infants and at least 30 mmHg in children) based on a retrospective analysis of arterial waveforms [
7,
8]. However, there is limited evidence to guide the target BP for adult and out-of-hospital cardiac arrests, which constitute most cardiac arrest cases. In contrast to the previous study, our protocol included the measurement of VP. It revealed that several out-of-hospital cardiac arrest patients exhibited predominantly retrograde flow during CPR, underscoring the importance of simultaneous measurement of AP and VP to monitor the quality of CPR.
There are two circulation mechanisms for closed-chest cardiac massage: the heart pump theory and the chest pump theory [
9]. The former posits that direct compression of the heart (particularly the ventricle) induces cardiac output, while the latter suggests that an increase in intrathoracic pressure resulting from compression of all tissues and organs in the thoracic cavity leads to cardiac output. Both mechanisms are currently believed to be at work, but compressing the sternum affects the ventricle, the atrium, and the superior vena cava in the thoracic cavity [
9]. Tokuda et al. reported that during the cardiac massage, both aortic and central venous pressures increased almost simultaneously, and the essential flaw of closed-chest cardiac massage is that it causes venous reflux due to the compression of not only the ventricle but also the atrium [
10]. Furthermore, Mackenzie et al. reported that during the cardiac massage, right atrial pressure increased to 88-116 mmHg [
11]. The discussion shifted to how to prevent venous reflux from maintaining circulation during resuscitation [
12], with proposals such as the early closure theory of intrathoracic veins (system) due to increased intrathoracic pressure, and the function of internal jugular vein valves, subclavian vein valves, or venous valve-like structures within the superior vena cava [
13]. These valves and systems can withstand up to approximately 60 mmHg pressures and prevent reflux from the heart [
13]. Still, to date, no reports have measured venous pressure outside the thoracic cavity, leaving it unclear whether reflux is indeed suppressed. While central venous pressure and right atrial pressure were not measured in the present study, the fact that the pressure in the femoral vein during the compression phase of cardiac massage exceeded 100 mmHg suggests that early closure due to increased intrathoracic pressure or venous valve structures in the superior vena cava may not have been able to prevent venous reflux. This might result in suboptimal perfusion of peripheral tissues during CPR.
SctO
2 by NIRS is a highly anticipated noninvasive physiological monitor for assessing the quality of CPR and predicting outcomes [
14]. Prior studies indicated that higher SctO
2 values are associated with a greater likelihood of achieving ROSC and favorable neurological outcomes [
14,
15,
16,
17]. Our investigation revealed that in Cases 1 and 2, where MVP exceeded AP, lower SctO
2 values were observed, and ROSC was not achieved. In contrast, in Cases 3 and 4, which had higher MAP, ROSC was reached after increased SctO
2 values. It should be noted, however, that this study does not establish any causal relationship between BP and SctO
2, let alone between BP and prognosis. Nevertheless, our findings have the potential to provide insight into the prediction of systemic and cerebral circulation during CPR, and further accumulation of cases is warranted to generate evidence regarding the relationship between AP, VP, and SctO
2 values, as well as their association with prognosis.
While we believe that our protocol for invasive BP monitoring in OHCA patients is feasible and that more cases can be accumulated in the future, it is impossible to perform invasive monitoring for all cardiac arrest patients. Therefore, a noninvasive and easy-to-use physiological monitor should be established based on our results. Additionally, since the optimal method of CPR may vary from person to person, future randomized controlled trials will be necessary to assess the impact of individually changing the CPR method based on real-time physiological feedback (i.e., physiologically-guided resuscitation) instead of the current uniform CPR method for all individuals.
