1. Introduction
Remote sensing has a large number of applications, among which the most common is to classify landcovers and to analyze the changes that occur therein along time. One of the most vital Earth resources is the surface water, which is undergoing changes in time and space as a consequence of land use and climate change [
1]. Analysis of surface water storage is important as a means to determine the predisposition to flooding in a given region [
2]. In this context, satellite imagery is a valuable tool for monitoring land and floods since it is the most cost and time effective method available to quantify and map flooded areas. For this reason, the optical sensors abroad the satellite constellations are designed to register specific spectral bands that allow the differentiation of flooded from non-flooded areas.
The variation in size of different water bodies that have been reduced due to various causes has been analyzed over several periods. The most cost-effective method is using remote sensing and GIS techniques together with field validation. In most cases, the Normalized Difference Water Index (NDWI) is used to rate changes in the water area [
3]. Furthermore, several studies have been conducted using remote sensing data to detect spatial and temporal changes in flooded areas, study their changes, and assess actual or potential flood damage in urban areas. The majority of the flood maps were developed from the surface reflectance using MODIS data, given the short revisit times and the wide area coverage of this mission [
4,
5]. The MODIS sensor is a scientific instrument launched into Earth orbit by NASA in 1999 on board the Terra satellite and in 2002 on board the Aqua satellite. These sensors provide images of the earth with high radiometric sensitivity and high temporal resolution (
i.e, short revisit times). The MODIS sensor provides twice daily near-global coverage at 250 m resolution data sources for flood products. Although other instruments provide higher resolution data, none provides global daily coverage [
6]. However, although MODIS sensor plays a very important role in the development of models for predicting global climate change, monitoring deforestation, forest fires, droughts and floods, it does not have an optimal spatial resolution for use in small areas [
7]. For instance, Pekel et al. [
8] developed an innovative method for detecting bodies of water by colorimetric analysis. The methodology is generic and thus can be applied to sensors with similar bands with adequate reliability, but has been devised to be applied on continental scales only.
On the other hand, probably the most widely used data source for remote sensing are Landsat images, which are available (in different constellations and thus different sensors) from 1972 to the present, offering the longest continuous global register of the Earth’s surface. This record has collected spectral information from Earth’s surface which gives scientists the ability to assess landcover changes that can be traced and evaluated along 50 years, providing sound statistical significance in several studies. Despite this valuable information, Landsat imagery have a moderate spatial-resolution and a long revisit time [
9]. This limits their applicability in various situations [
1]. For instance, the actual shape and size of relatively small water bodies is difficult to assess given the mixed pixel phenomenon that arise when the pixel footprint over the surface contains a varying proportion of actual superficial water [
10].
In this and other senses, the goal of the Sentinel program is to replace the current older Earth observation missions which have reached retirement or are currently nearing the end of their operational life span. The mission is specifically aimed at a more accurate land cover monitoring and associated applications in change-detection mapping. For instance, the shorter revisit time of the SENTINEL-2 mission helps the studies of deforestation by providing opportunities to acquire cloud-free image data, as well as to contribute to the monitoring and modelling of climate-induced changes, which can support the detection of flood events [
11].
Lakes and lagoons in particular are subject to different studies with the need to monitor water quality at different scales [
12]. Sentinel-2 multispectral sensor includes spectral bands that are adequate for mapping different water parameters. This, together with a higher spatial resolution, enabled new analysis tools for small water bodies monitoring, allowing even small lakes to be studied [
13]. However, although the images have a moderate spatial resolution, it is still difficult and inaccurate to detect small bodies of water by means of the Normalized Difference Water Index (NDWI) or similar indices [
14].
During the late 2018, infrequent high precipitation rates in the Buenos Aires province, Argentina, created an unusual raise in the size of lagoons, small water bodies, and a proportion of otherwise productive areas turned flooded. Even though in specific departments of this Province a large surfaces were flooded or moist, the NDWI indices provided by these satellite missions (especially MODIS) consistently overestimated the actual proportion of flooded areas, in some cases by gross percentages. An adequate assessment of the actual impact of the condition was frequently required by crop producers, governmental agencies, and other actors, but in this particular context the adequacy of remote sensing appeared to be of little use. For this reason, in this study we attempt to determine bias and variance in the determination of actual NDWI products using several indices (Xu, Gao, McFeeters) computed from Landsat-8 and Sentinel-2 imagery. We use airborne images as ground-truth, in which the very high resolution allows to determine the actual proportion of dry and wet surface in a satellite pixel footprint, and thus study the influence of the mixed pixel effect in different water indices. The results show that in shallow parts of small water bodies these indices have little correlation with the actual water landcover, especially in or near the shoreline.
2. Materials and Methods
2.1. Study areas and sample preparation
The
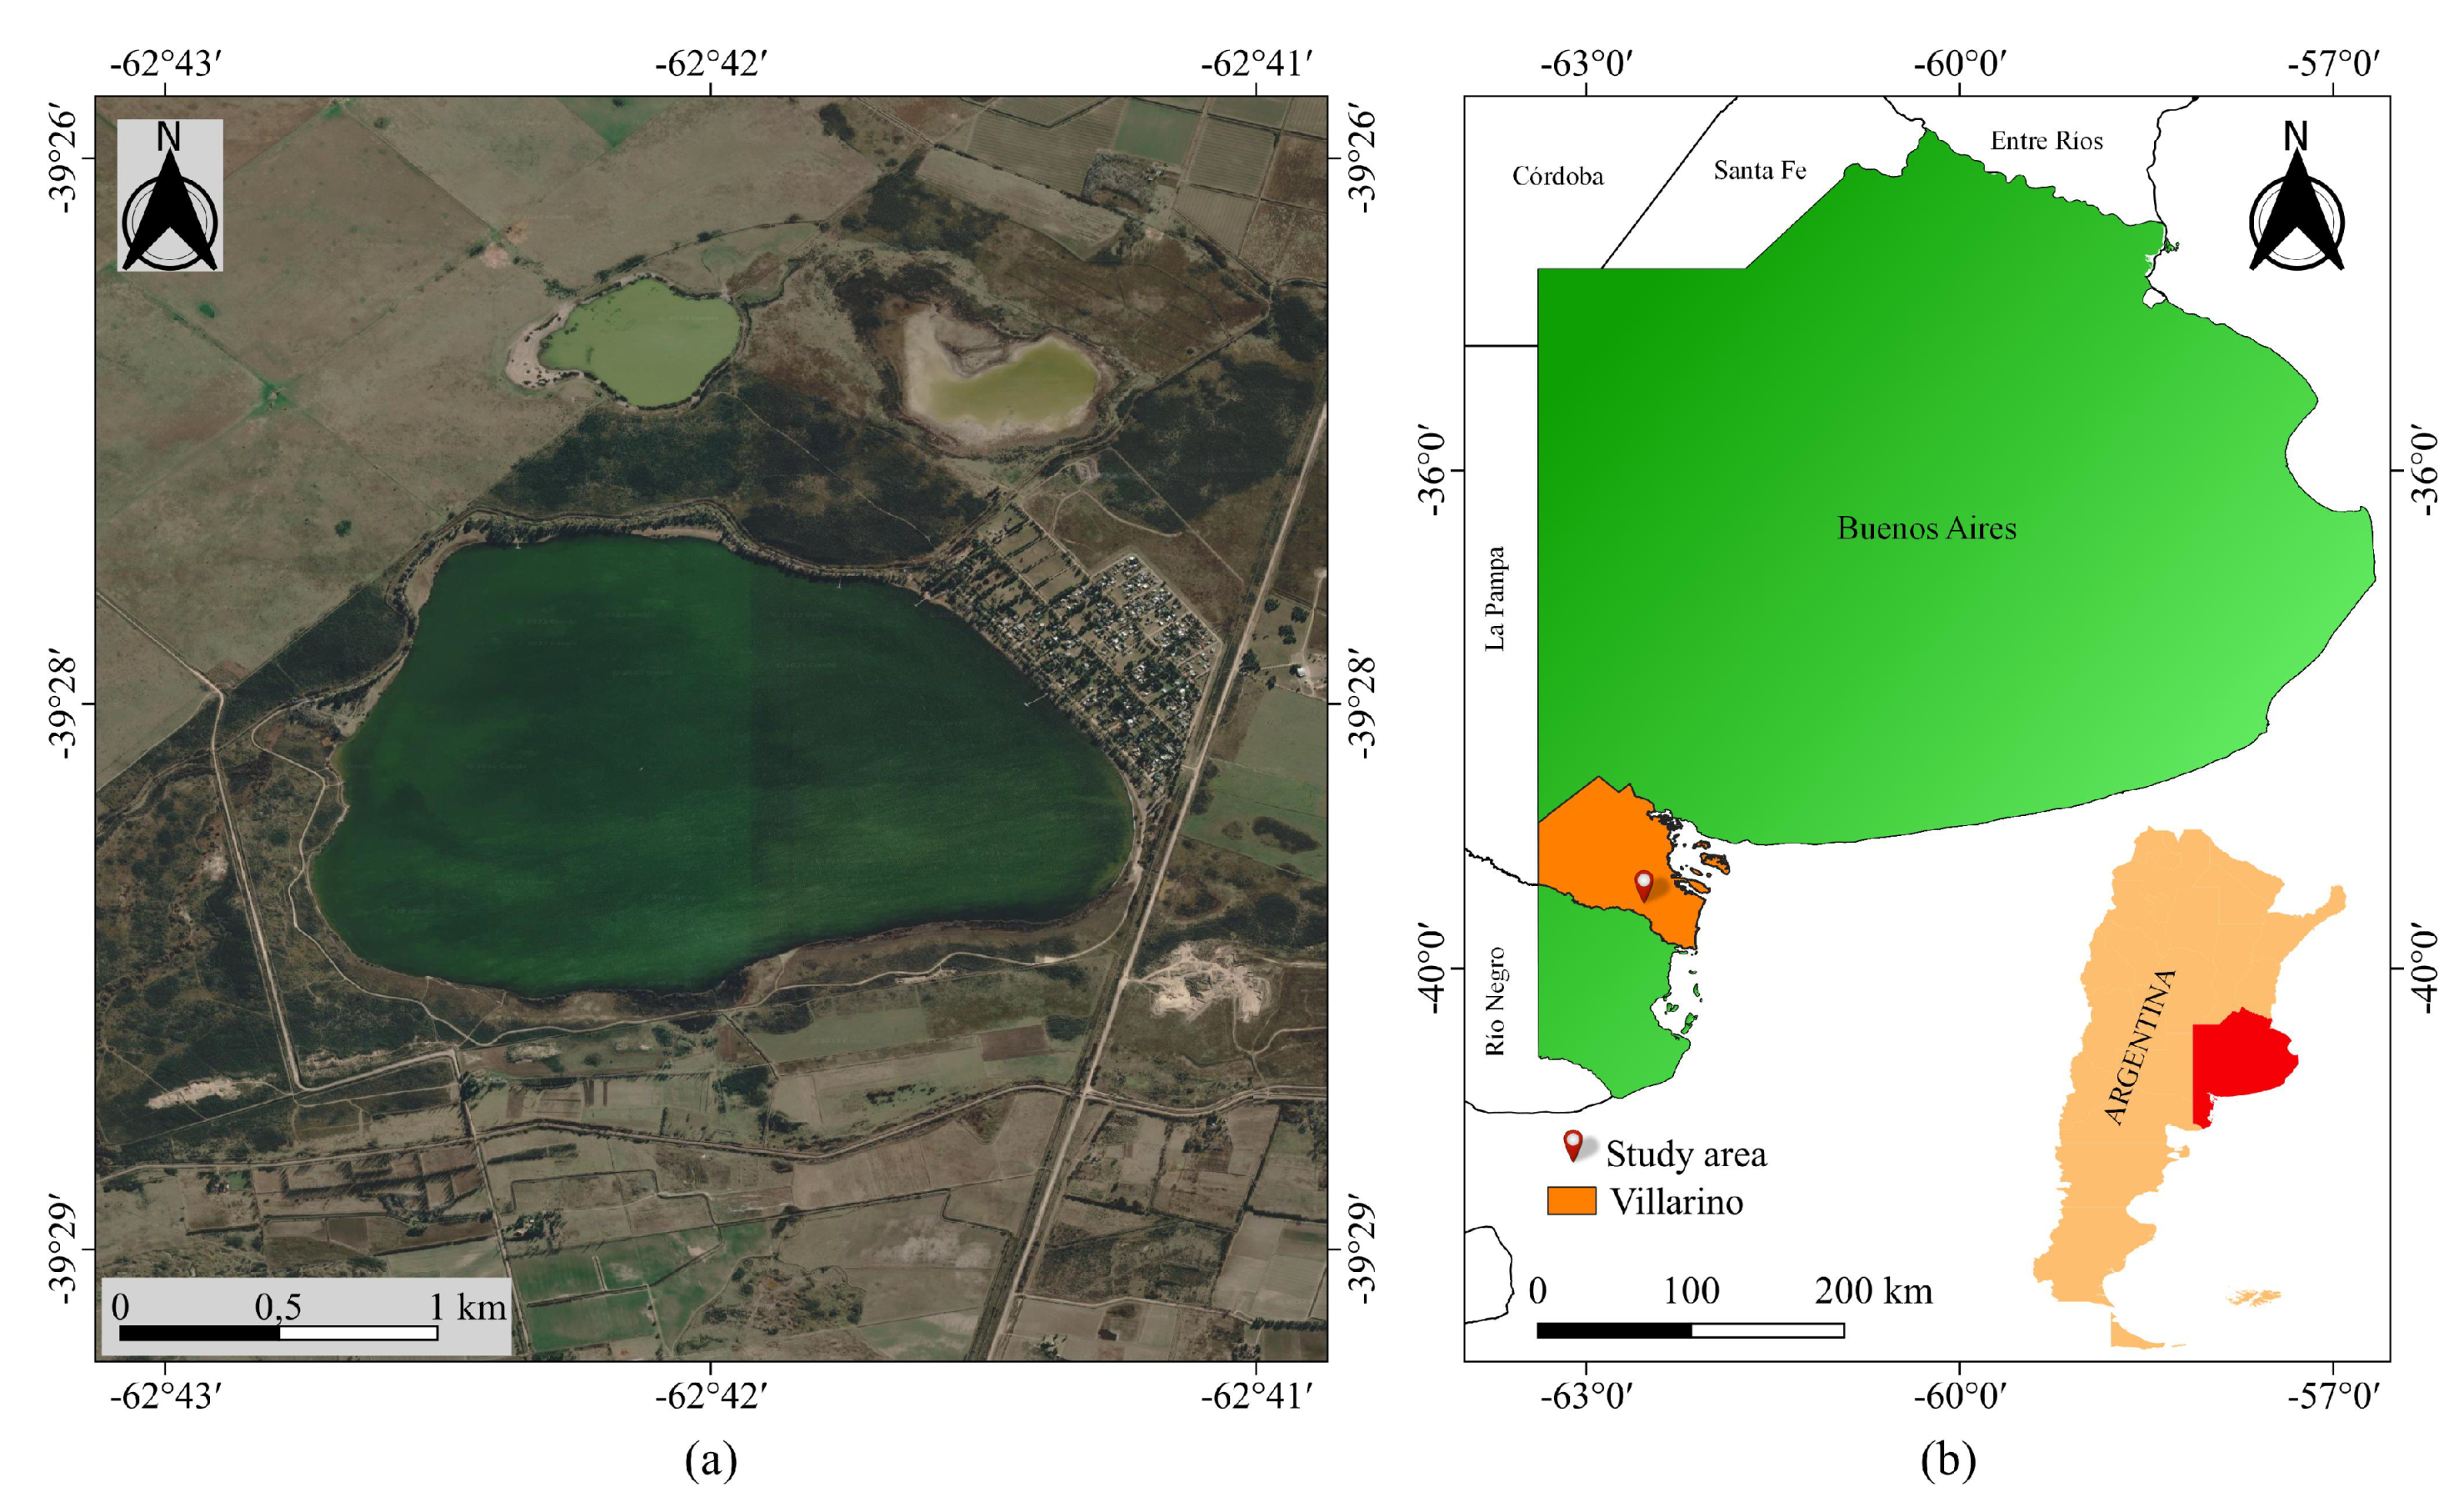
La Salada lagoon is located SW of the Buenos Aires Province in ARGENTINA (
), about 6 km from the city of Pedro Luro, Villarino district (
Figure 1). It is an typical endorheic lagoon where two water channels discharge the excess water from the agriculture usage of the Colorado River [
15]. It has approximately 400 hectares (4 km
) of extension and an average depth of 6 meters. In the NE shore of the lagoon a recreational environment is placed, forested but with urban characteristics, with touristic and other facilities. Among others, various nautical activities, fishing and also diving can be performed. It is also a very popular place for windsurfers. This type of lagoons is common in the SW of the Buenos Aires Province, of which the size and depth is dependent on rainfall, presenting periods whn they dry, and others with overflow conditions where flooding of the surrounding fields arise. This was extensively confirmed by [
16], where it is shown that the topography of the geographic region, the low permeability of the soil, and the shallow character of these lagoons, cause the water to evaporate in periods of drought, reducing its area, and, on the other hand, flooding in periods with more than average rainfall.
2.2. Data acquisition
For this study, we used airborne RGB imagery together with Landsat and Sentinel multispectral images, all taken within a very short time interval to have consistent measurements. Google Earth images were not a choice since the ones available didn’t reflect the actual size of the lagoon during the satellites’ takes. Due to regulations, it was not possible to fly all around the lagoon shore (a safe distance away the recreational section has to be respected). Then the takes cover only the SW portion of the lagoon. As ground-truth, we built a mosaic of georreferenced images taken from an unmanned aerial vehicle (UAV) Phantom III. The flight was carried out during April 11, 2019, at a height of 70 meters, which yield a spatial resolution of 15 cm/pixel. A Landsat 8 image was downloaded from the Earth explorer website (
https://earthexplorer.usgs.gov/). The image corresponding to the OLI sensor, is located in the path 226 and row 87. It has a processing level 2 and was taken on April 12, 2019. Landsat Level-2 products includes surface reflectance (Bottom Of Atmosphere - BOA), that measures the fraction of incoming solar radiation that is reflected from the Earth’s surface to the Landsat sensor, and the Land Surface Reflectance Code (LaSRC) corrected for the temporally, spatially and spectrally varying scattering and absorbing effects of atmospheric gases, aerosols, and water vapor, which is necessary to reliably characterize the Earth’s land surface. A Sentinel 2B satellite image was downloaded from the same website. This image was taken on April 12, 2019 with tile number 20HNB. The image corresponds to the MultiSpectral instrument (MSI) sensor and has a processing level 2A. Level-2A product provides, from algorithms of scene classification and atmospheric correction, Bottom Of Atmosphere (BOA) reflectance images derived from the associated Level-1C products.
2.3. Processing
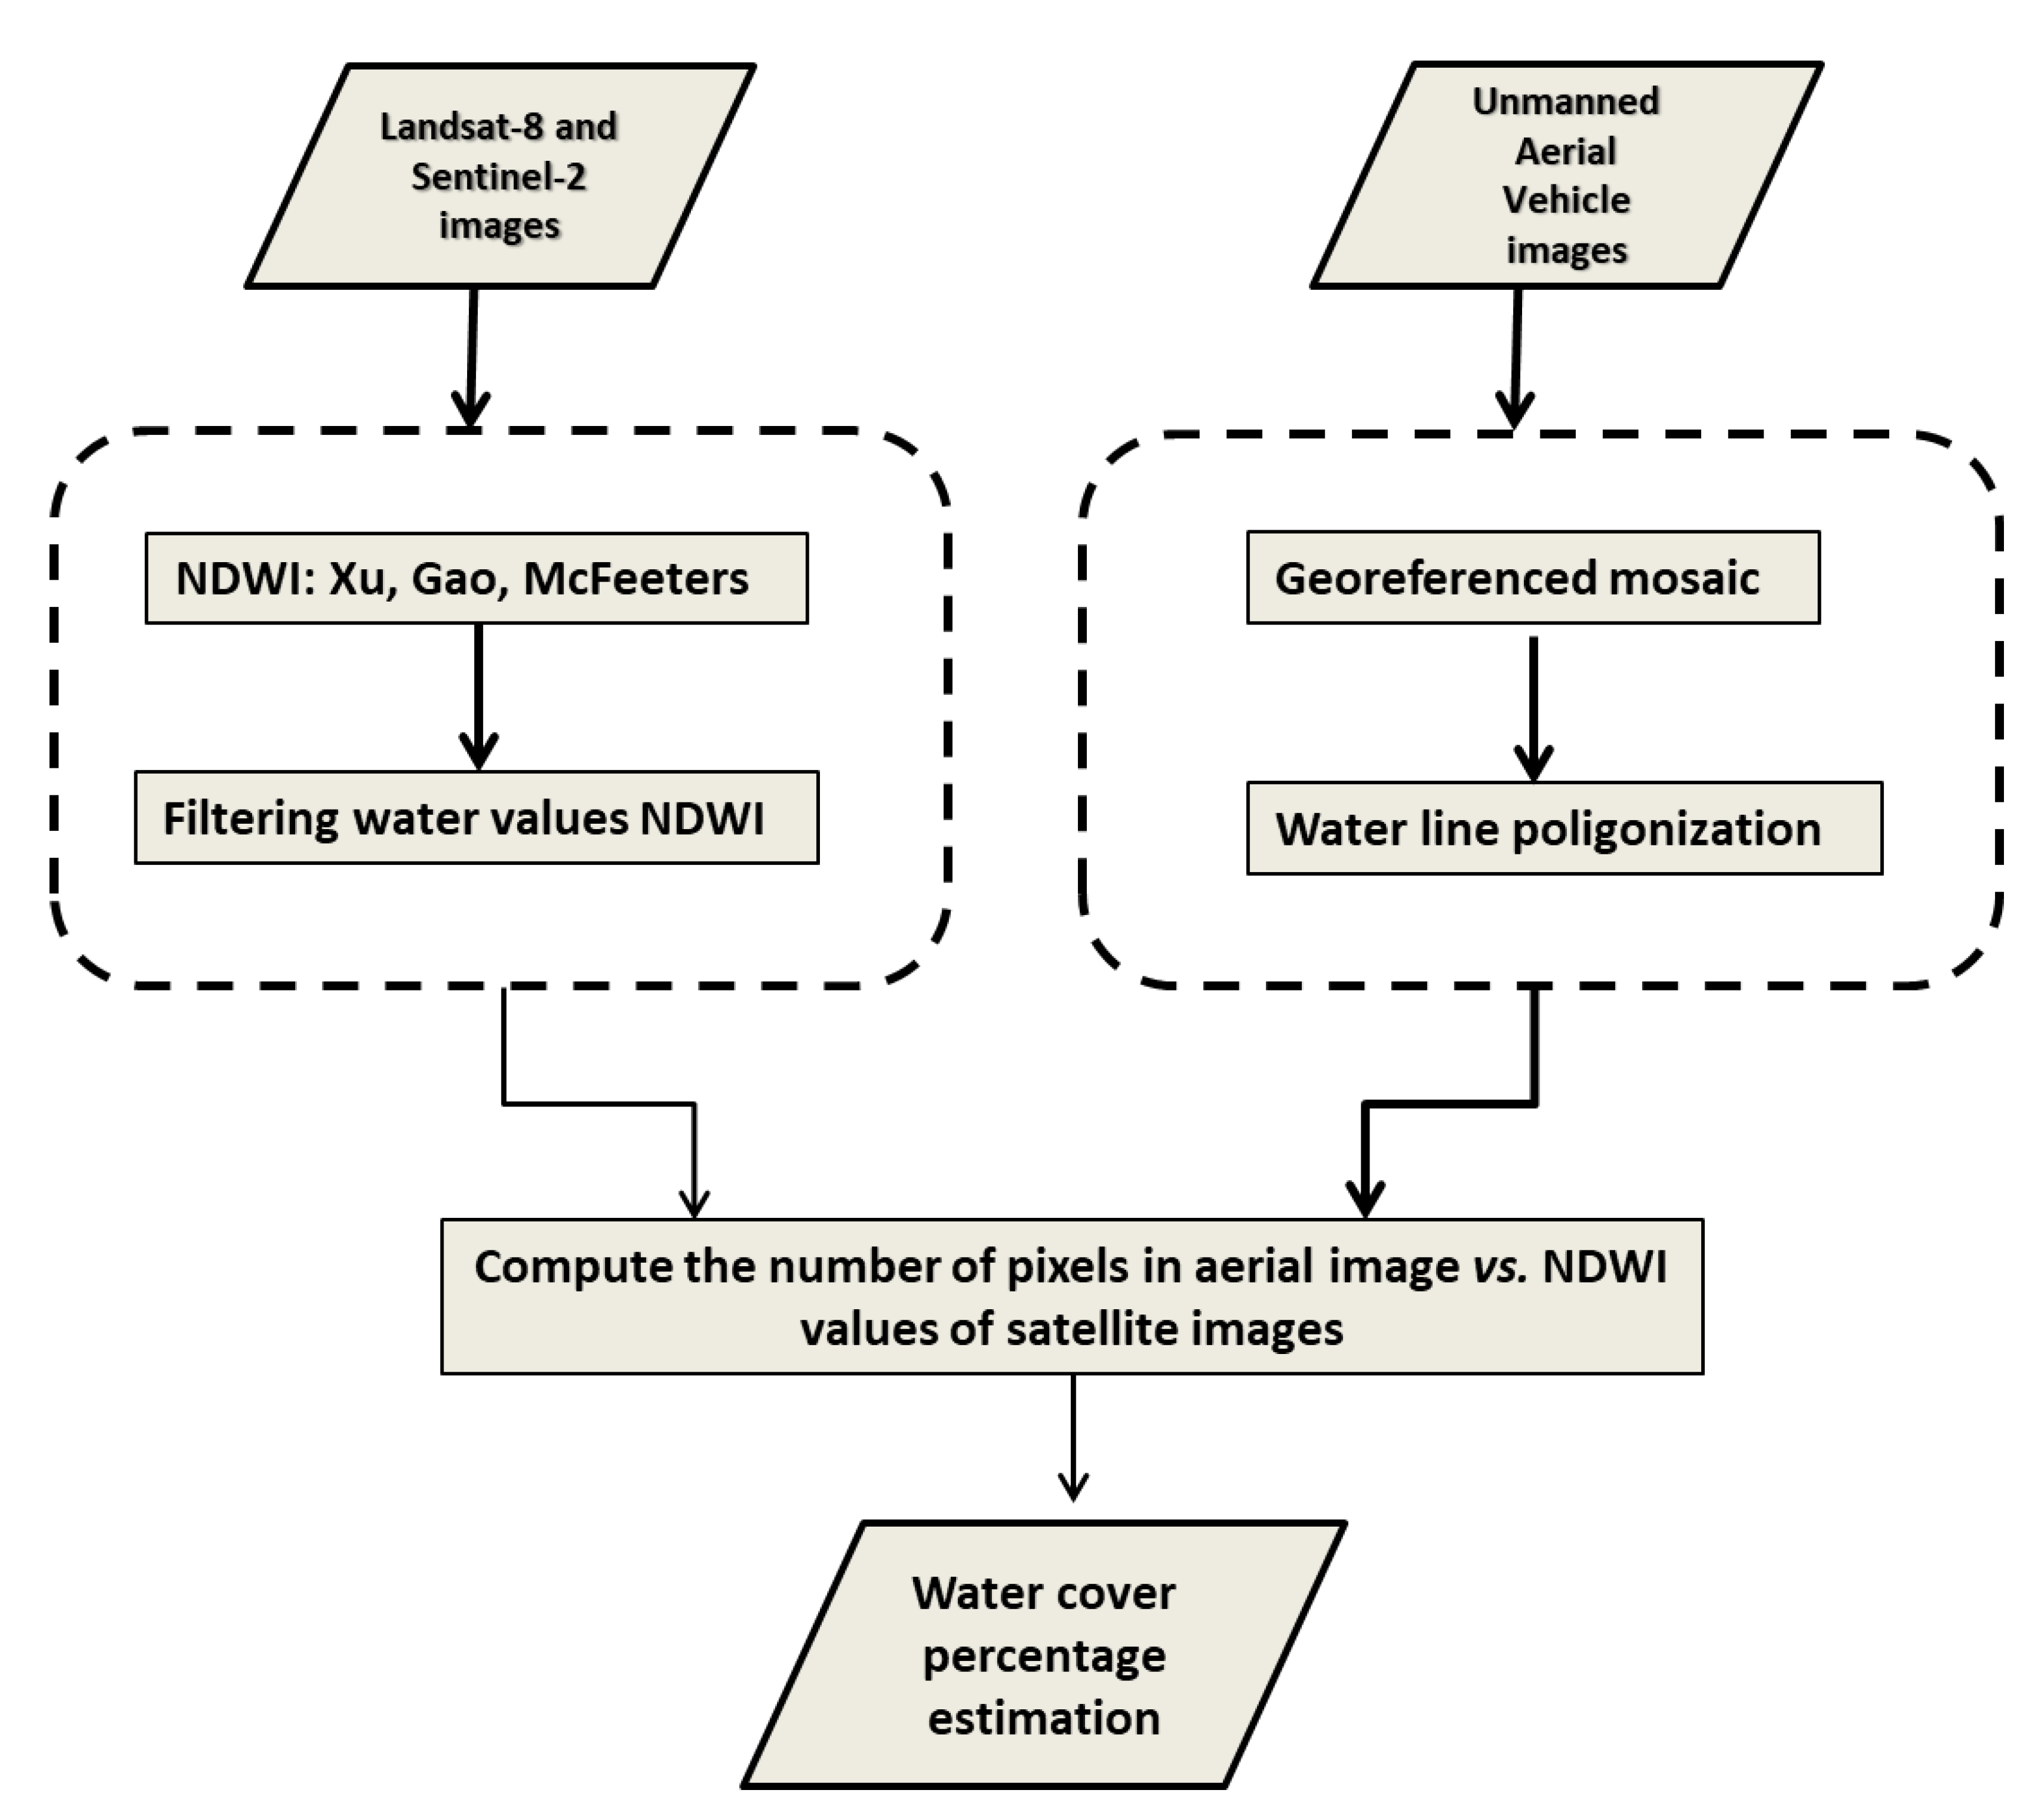
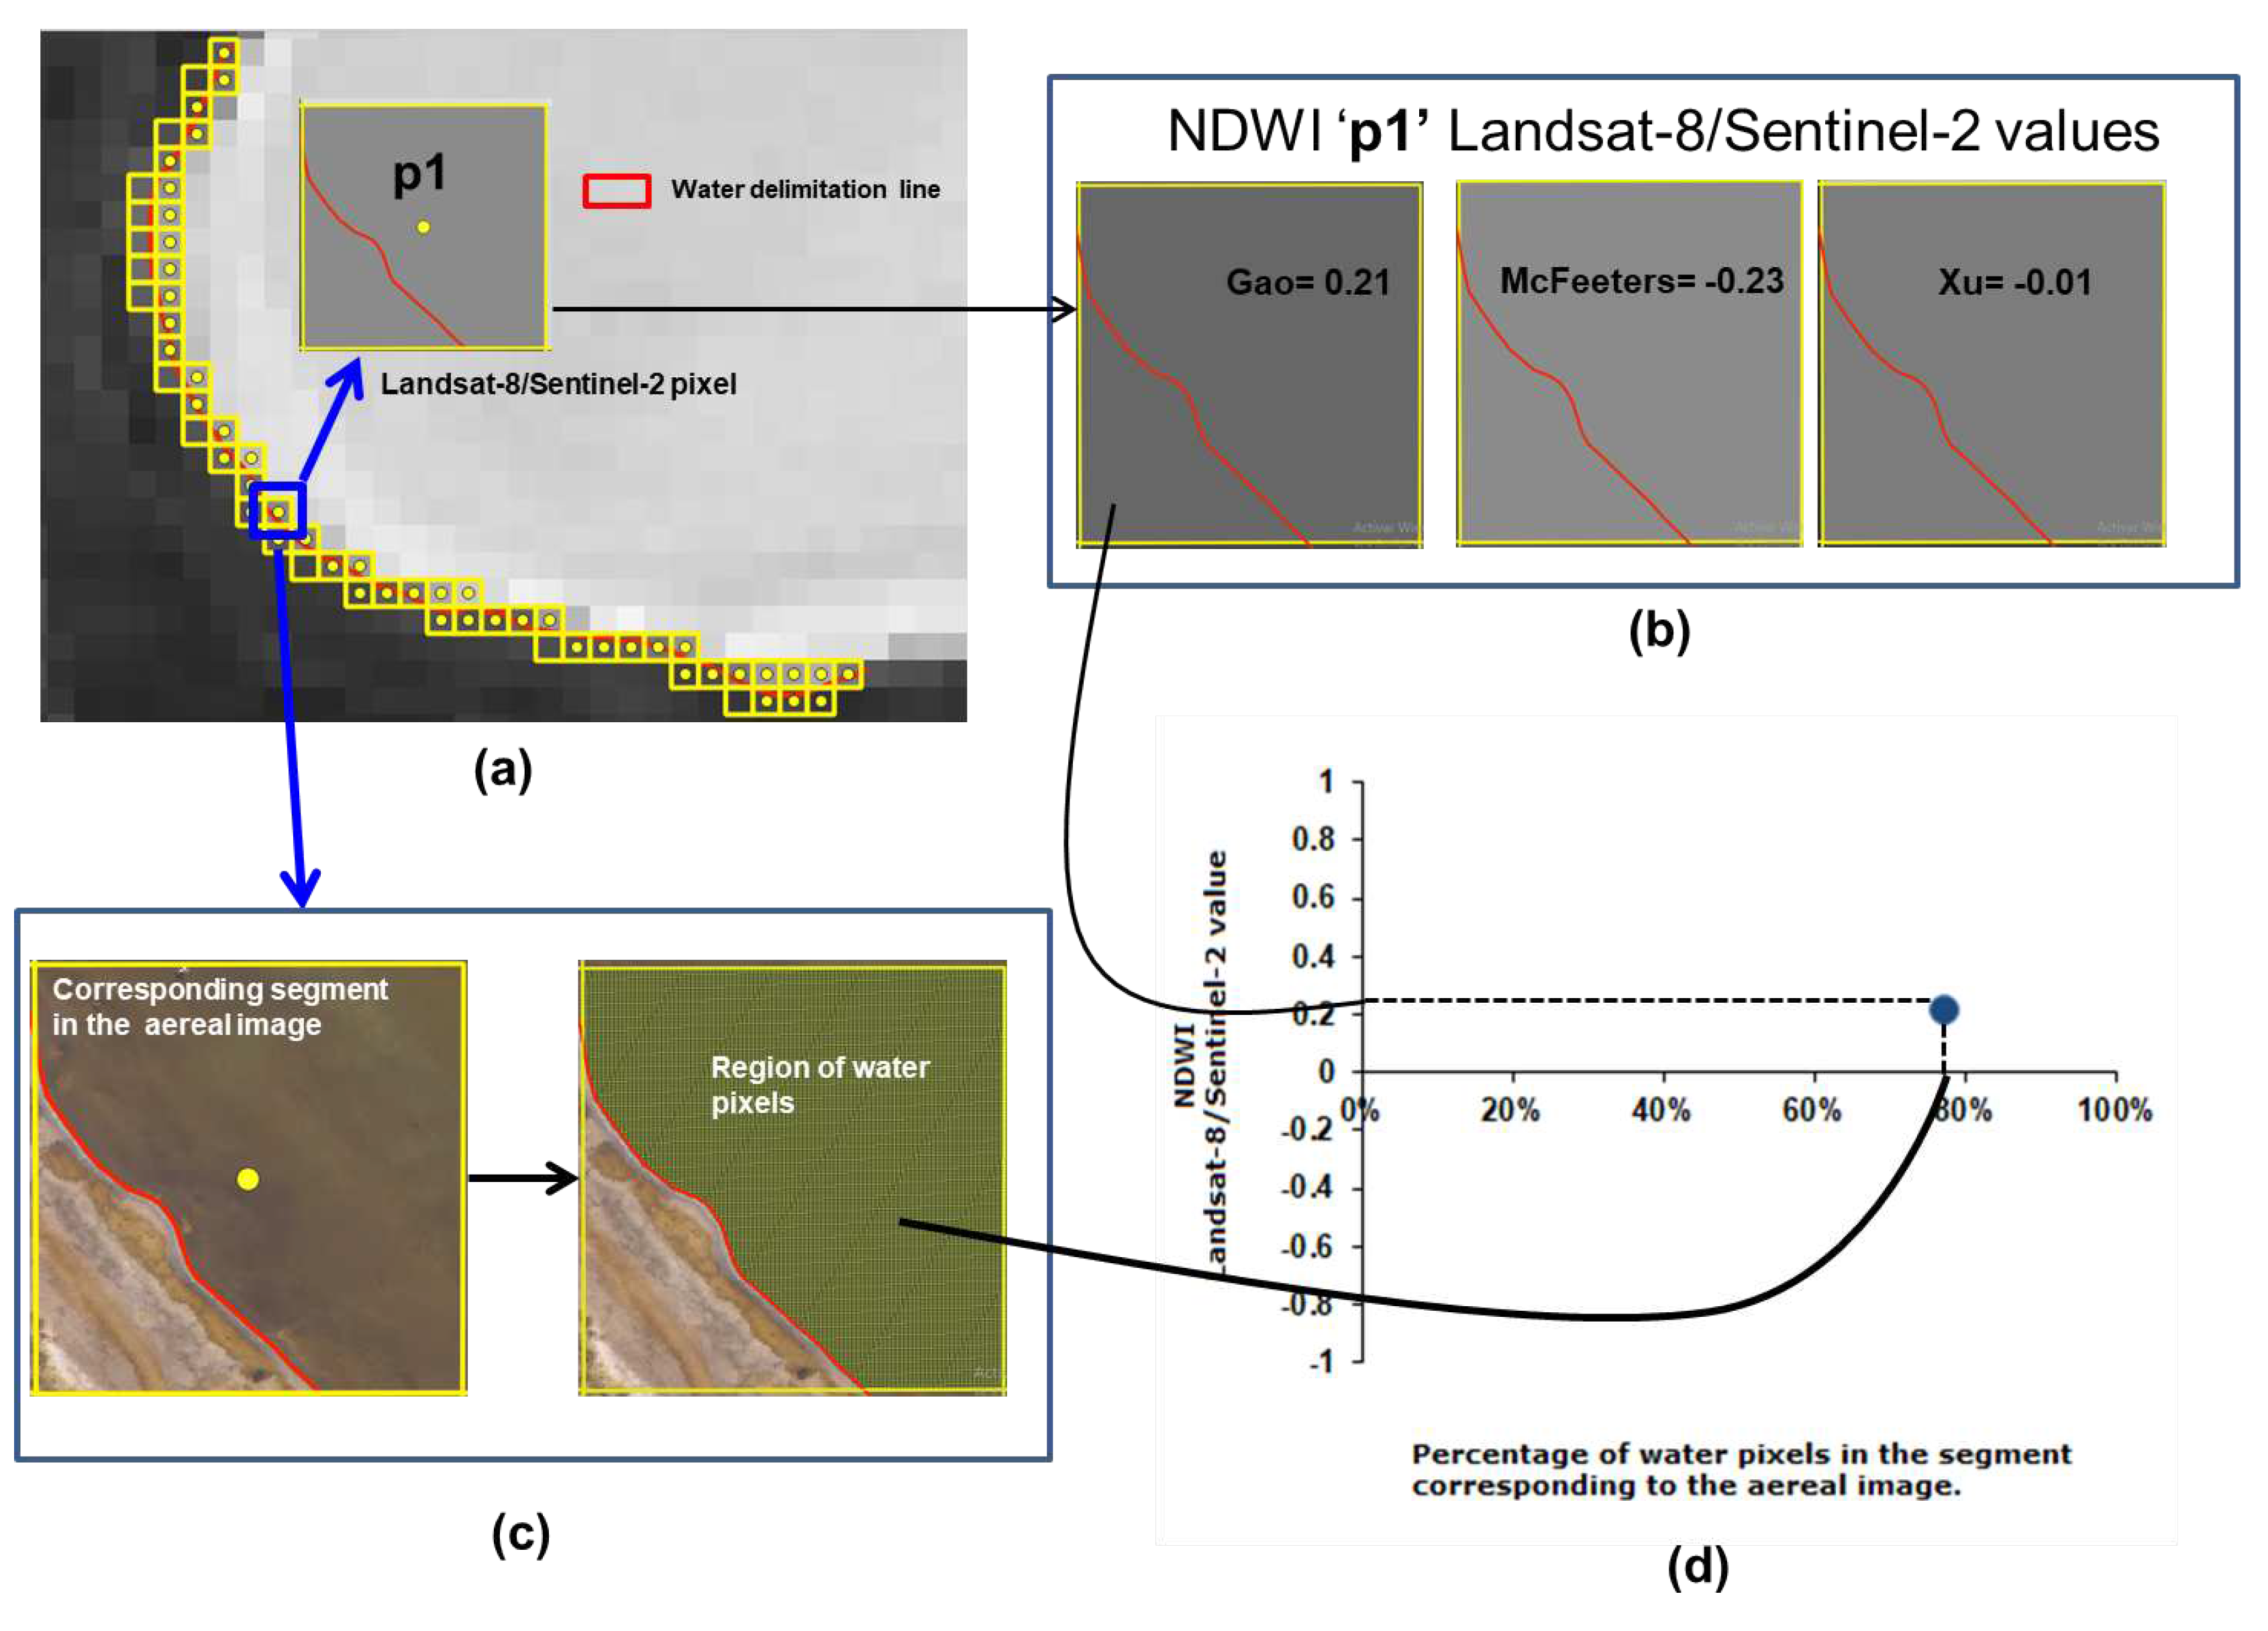
An overview of the whole processing steps is as follows. First, the georreferenced mosaic was computed with the images acquired from the UAV and saved as a layer in a QGIS project. The lagoon shoreline was segmented by specialist geographers over the mosaic, and saved as a shapefile in the same project. The aereal mosaic and the shapefile are considered ground truth. Then the georreferenced Landsat and Sentinel images of the same region were also stored as layers. The pixels corresponding to the lagoon shoreline in these images were determined using the previous shapefile using two different criteria: zeroth order (nearest neighbor) and first order (see below). These two criteria determine the actual mixed pixels present in the satellite images. For these pixels, two values were computed. First the NDVI was computed using several indices (Xu, Gao, McFeeters). Second, the footprint of the pixel was put into correspondence with the aereal mosaic, and the actual percentage of water pixels therein was computed. With these two values for each satellite pixel corresponding to the shoreline, a scatterplot was built to test the actual correlation between the NDVI and the actual percentage of water according to the ground truth. The complete pipeline can be seen in
Figure 2.
As mentioned above, three NDWI indexes were computed to assess their behavior in mixed pixels. McFeeters [
17] proposed the NDWI using green and NIR bands to maximize the reflectance of a water body in the green band while minimizing that in the NIR band (Equation
1). This index can effectively enhance the water information in most cases. It has the drawback that it is sensitive to built-up areas and can lead to an overestimation of the size of water masses.
The method proposed by Xu is analogous to that of McFeeters, but does not contemplate the NIR band and uses the SWIR band (Equation
2). The modified index can enhance open water features while efficiently removing built-up land noise as well as vegetation and soil noise [
18].
Gao proposed another index, sensitive to the change in water content of leaves [
19]. This is computed using the near infrared and the short wave infrared bands (Equation
3).
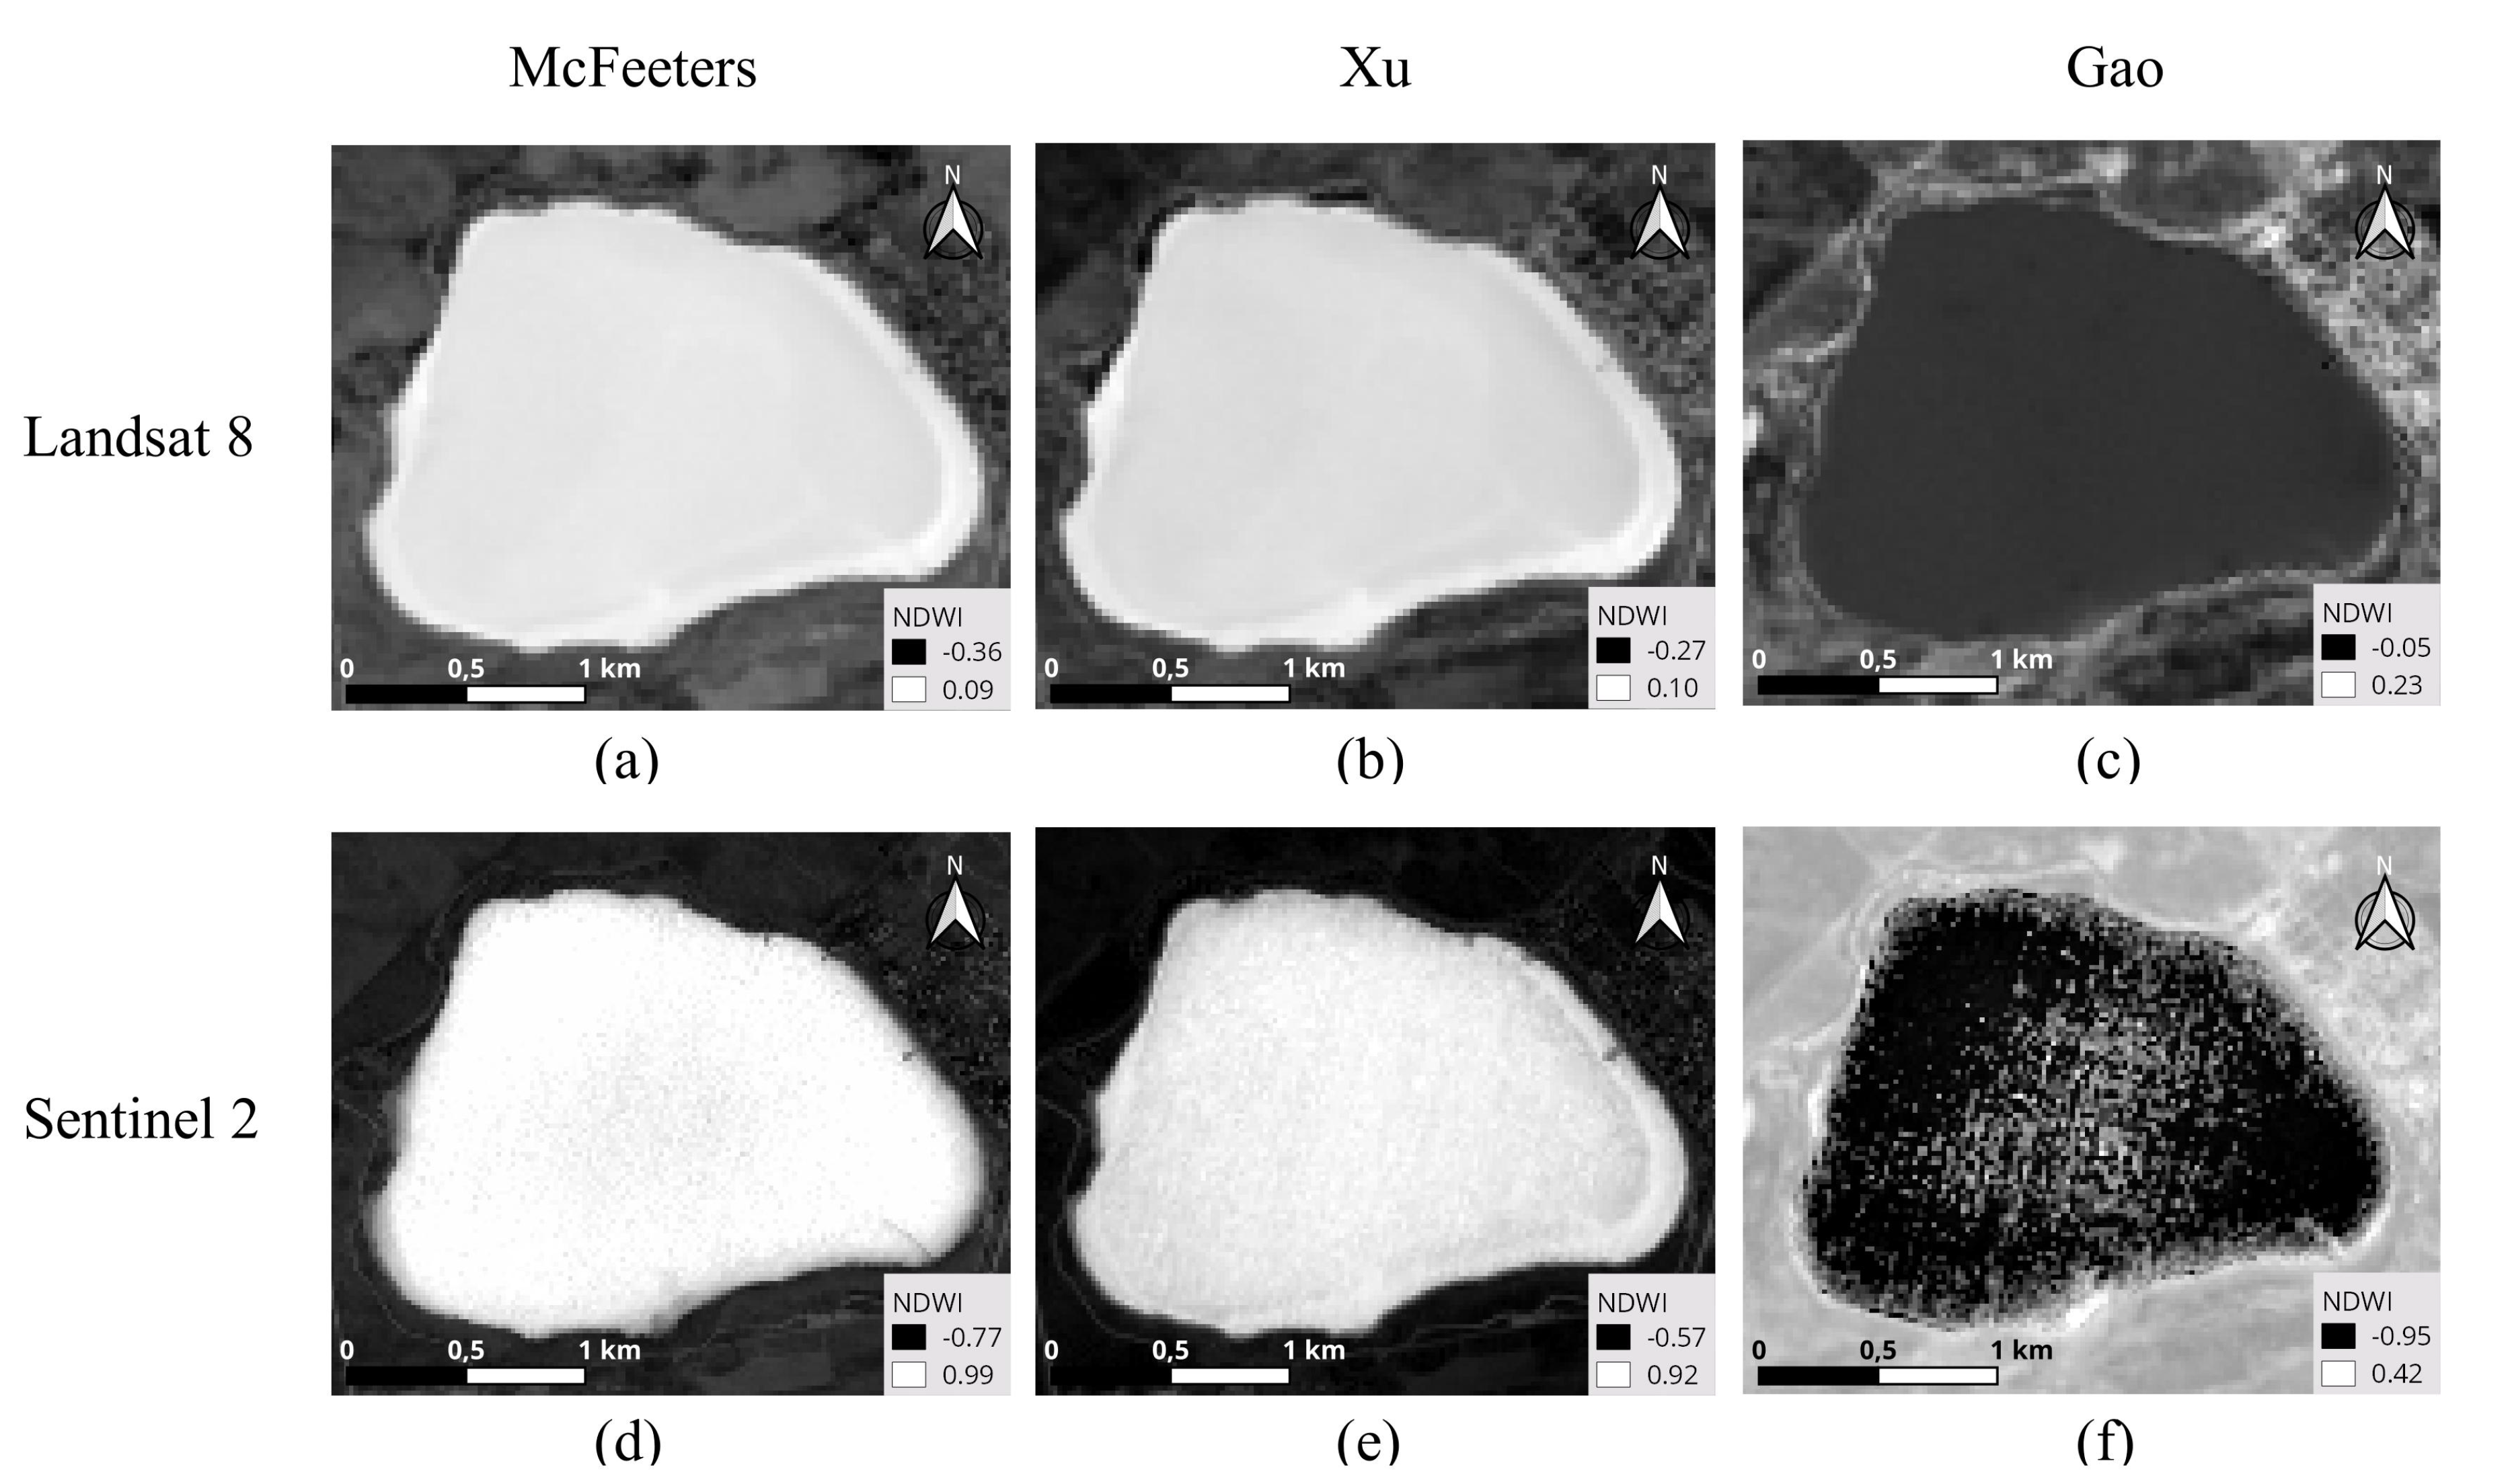
These NDWI indexes were computed using the raster calculator of QGIS. To process Landsat 8 satellite images, bands 3 and 6 were used in Xu NDWI, bands 5 and 6 for Gao’s NDWI, and bands 3 and 5 in McFeeters’s NDWI. In Sentinel 2 satellite images, bands 3 and 11 were used to compute Xu NDWI, but since band 3 has a spatial resolution of 10 meters and band 11 has a spatial resolution of 20 meters, band 3 was reclassified to have the same spatial resolution as band 11. For Gao’s NDWI bands 8A and 11 and for McFeeters’s NDWI bands 3 and 8 were used (
Figure 3).
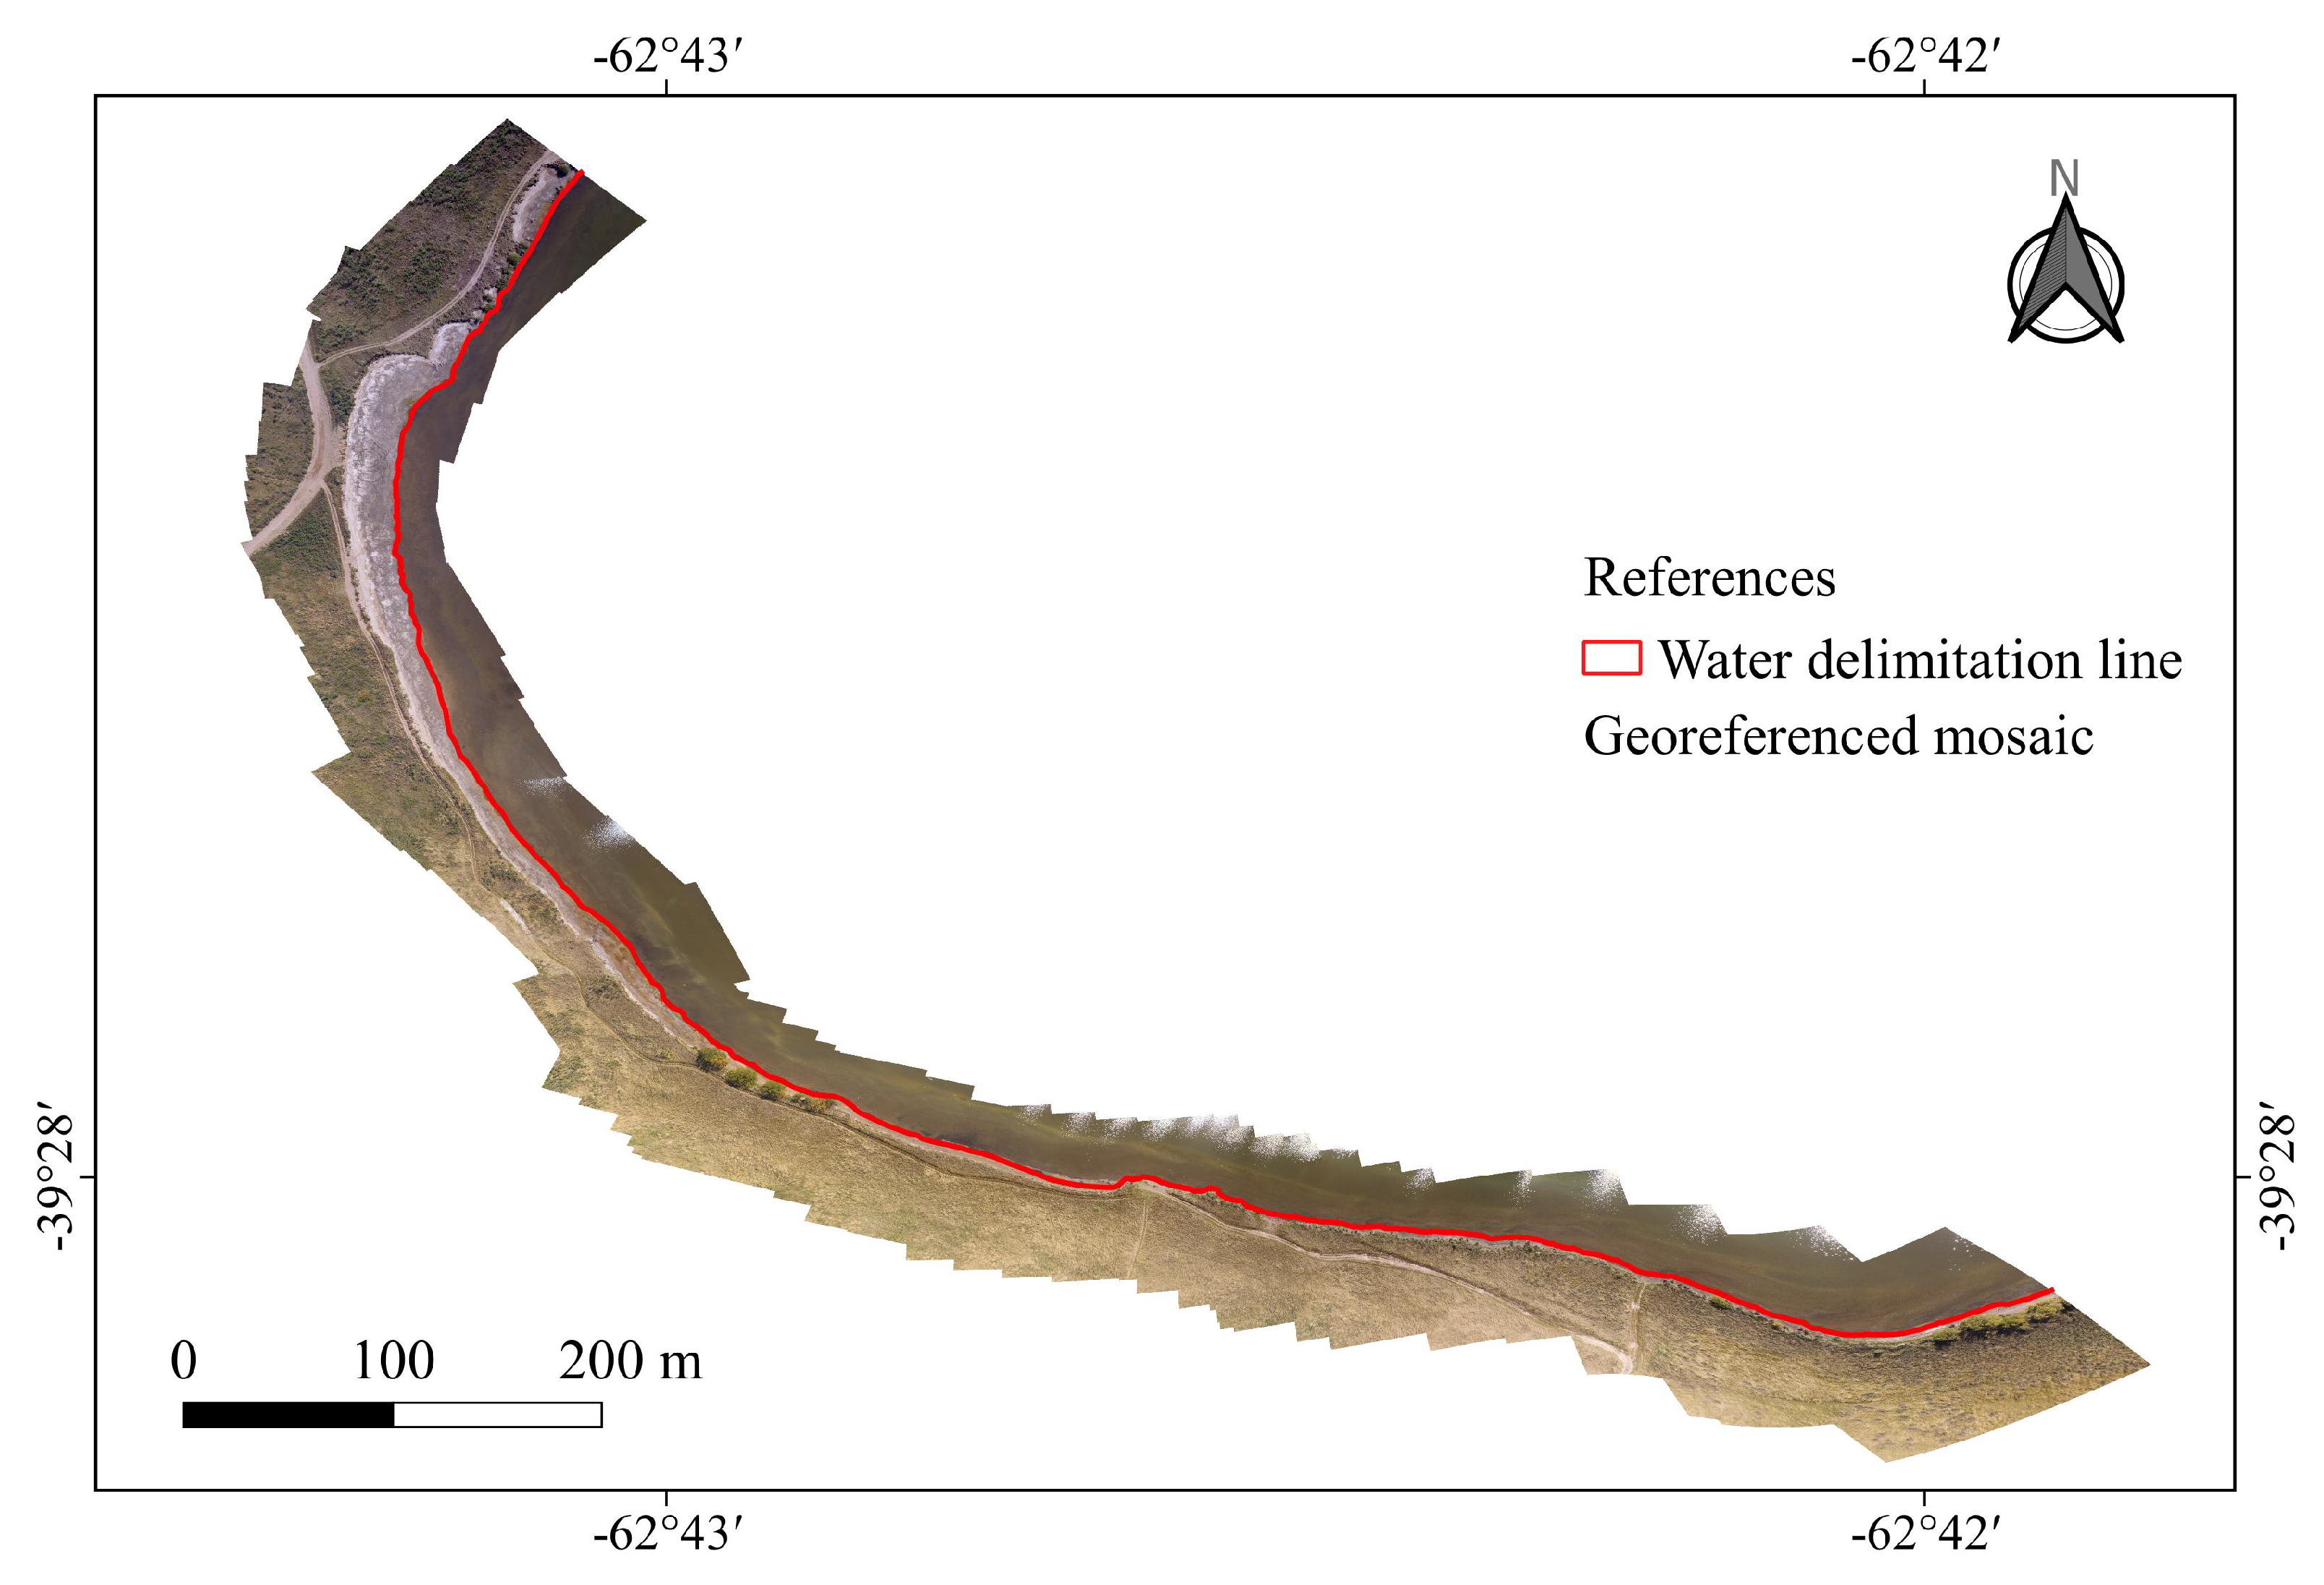
The lagoon shoreline segmentation was carried out over the mosaic, where the delimitation water vs. ground is selected through the experts’ evaluation (
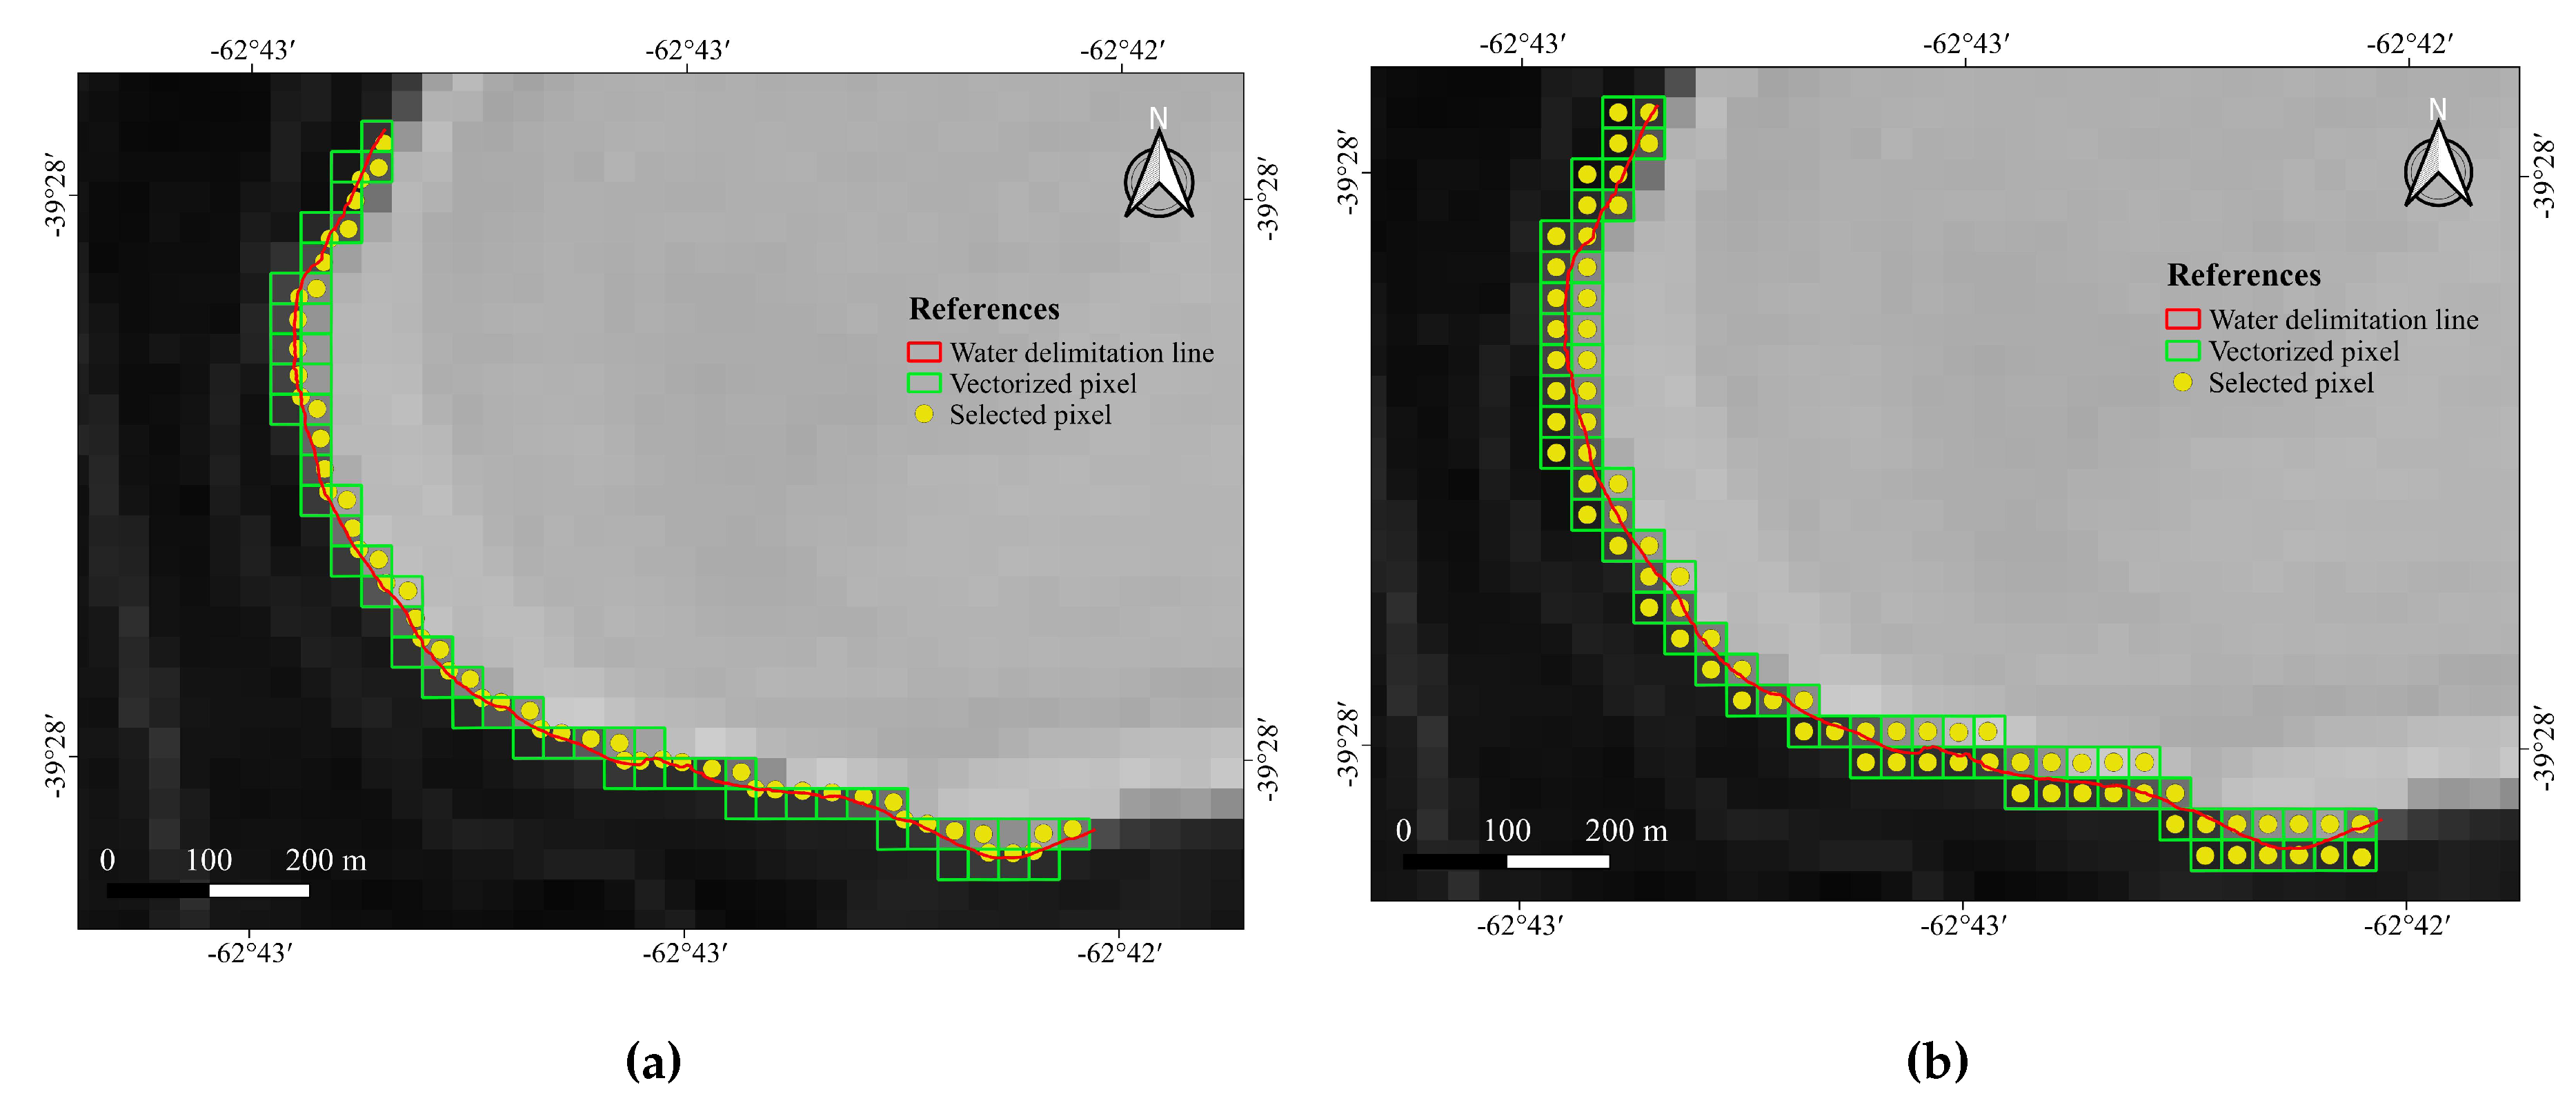
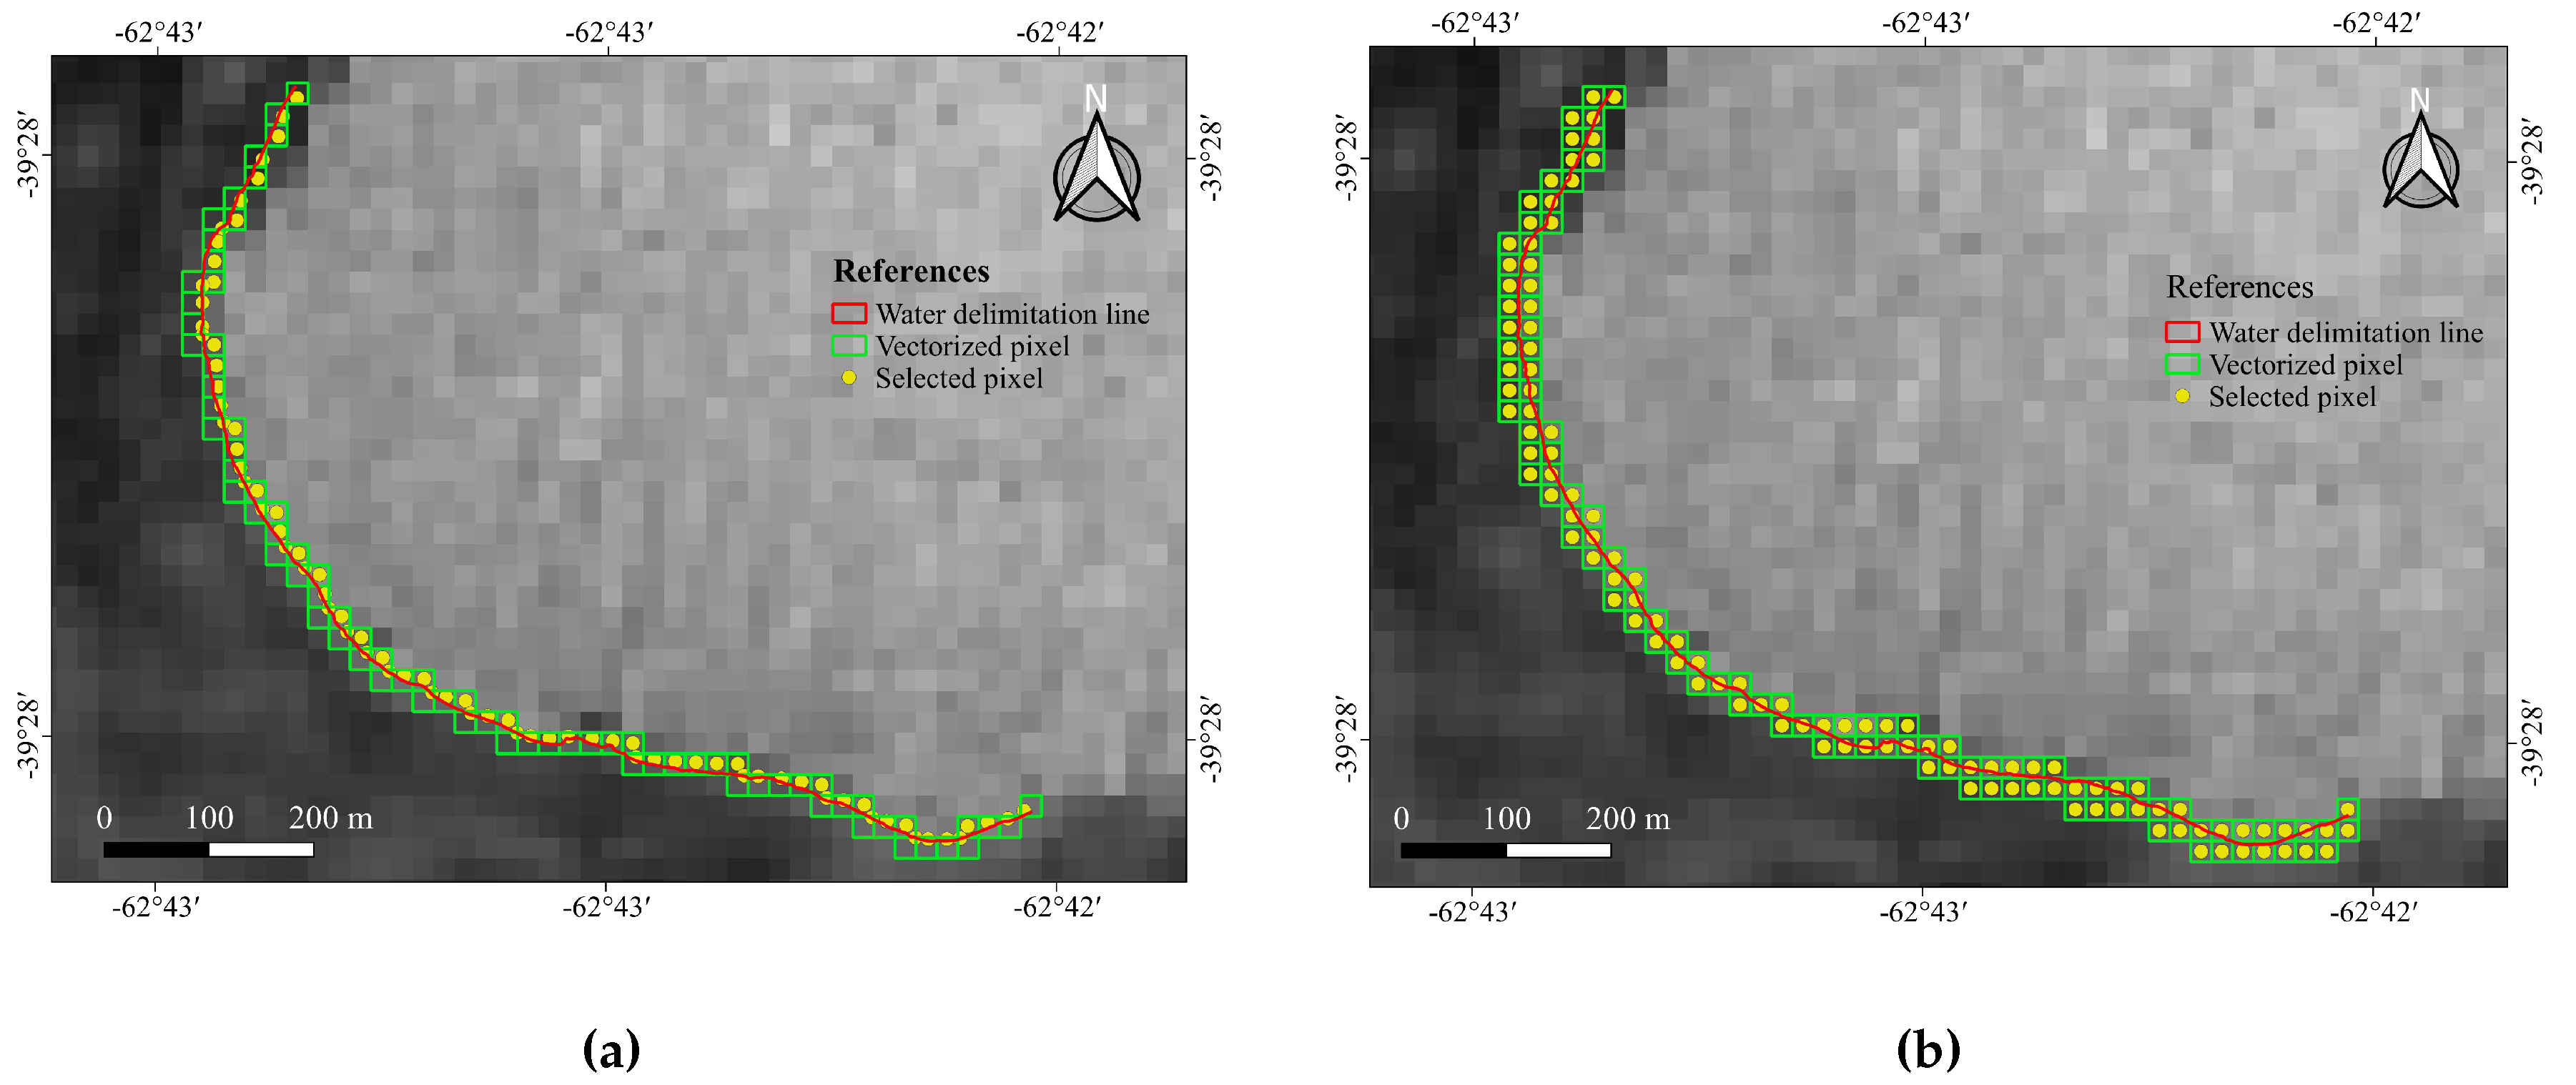
Figure 4). The resulting shapefile was overlapped over the registered Landsat-8 and Sentinel-2 images to establish a set of boundary pixels in each satellite image. The actual shoreline (mixed) pixels in the satellite images were determined according two different criteria. The first criterion is to model the pixel acquisition as a zeroth-order process, and therefore the pixel with its center closest to the segmented shoreline is considered to be the raster representation of the shoreline in the satellite image. This criterion is coincident with the so called nearest neighbour in image processing. The second criterion was to assume a first order image generation process during the satellite acquisition. According to this criterion, the actual vectorized shoreline passes between two pixel centers, and therefore these two pixels are in fact mixed pixels to some extent (unless in the very rare case in which the vectorized shoreline passes exactly over the very center of one pixel.
Figure 5 and
Figure 6 show these two criteria applied respectively over the Landsat and Sentinel images.
The assessment of the computed NDWI indexes proceeded as follows. For each of the mixed pixels selected in the satellite images (according to the two different criteria) the NDWI is computed with the selected method. Then the footprint of the pixel is put into correspondence with the UAV mosaic, where it occupies hundreds or thousands of pixels, according to their respective resolutions. The percentage of water pixels within this footprint is computed. With these two values (NDWI and water pixel percentage in the footprint), a scatterplot can be elaborated, where the actual correspondence within NDWI and water coverage can be assessed (see
Figure 7). Then, for each of the NDWI indexes, we have four different scatterplots, composed by the established mixed pixels that were determined according to two different criteria in the Landsat-8 and in the Sentinel-2 images.
3. Results
3.1. Landsat-8 and Sentinel-2 criterion 1
Figure 8a shows that NDWI values obtained according to Xu’s proposed equation, for the Landsat-8 image, are negative and positive for pixels with the same water surface. Furthermore, most of the extracted pixels are negative and few positive extracted pixels cover a higher water percentage. On the contrary, McFeeters values obtained are all negative (
Figure 8c). In both plots, the regression line has a positive slope, showing a slight tendency to the highest NDWI value, so the percentage of water in that pixel is also higher. The NDWI values obtained from Gao’s equation are all positive regardless of pixel water coverage (
Figure 8b). The slope of the regression line is smooth and NDWI values are similar for a low and high water percentage in the pixel.
In the case of the Sentinel-2 image, according to Xu’s proposed equation, NDWI values are mostly positive, few negative pixels values have indistinctly little and much water percentage (
Figure 9a). Values obtained from McFeeters NDWI are all negative, in which few pixels with positive values cover a greater percentage of 40% water (
Figure 9c). The regression line in both plots is similar to McFeeters and Xu in Landsat-8. The NDWI values obtained from Gao’s index are all positive regardless of pixel water coverage (
Figure 9b). The slope of the regression line is smooth. Moreover, Gao, Xu and McFeeters NDWI values are scatter and similar for both, low and high value of water percentage.
3.2. Landsat-8 and Sentinel-2 criterion 2
As shown in
Figure 10a for Landsat-8 image, Xu’s NDWI values are mostly negative, and a few positive pixels have low and high value of water percentage. McFeeters’s NDWI values are all negative (
Figure 10c). The regression line shows, in both plots, a negative slope, with a slight tendency to the higher NDWI value, so the water cover percentage is lower. NDWI values obtained from Gao’s index are all positive (
Figure 10b) and the slope of the regression line is smooth, a similar case to Gao’s criteria 1. It is also possible to observe values scatter and similar, no matter the water cover percentage.
As shown in
Figure 11a, in the case of Sentinel-2 image, NDWI values are mostly positive according to Xu’s index, whereas a few pixels with negative values are those with the greatest water coverage. On the contrary, the values obtained according to the McFeeters index are mainly negative. The few pixels extracted with positive values are those with little water coverage (
Figure 11c). The regression line has a negative slope in both plots, shows an inverse correlation. Similar to criteria 1, as shows
Figure 11b, NDWI values obtained from Gao’s equation are all positive regardless of pixel water coverage and the slope of the regression line is smooth. NDWI values are more scatter than for Landsat-8 image in the three calculated NDWIs.
4. Discussion and Conclusion
This research intends to assess the quality of NDWI values and their correlation with pixel water coverage in small water bodies. In all, twelve different evaluations were performed (three indices, two satellite constellations, and two criteria for shoreline pixel selection). The results show that these values in the two most widespread satellite constellations, and using three different NDWI formulations, do not have the expected accuracy and consistency.
NDWI values obtained according to Xu’s index have a moderate positive correlation to the actual water coverage of the pixels in the zeroth-order shoreline reconstruction method (criterion 1), and a negative correlation in the criterion 2. The values themselves are mostly negative for the Landsat-8 image, indicating the absence of water. However, for the Sentinel-2 image, the opposite occurs, even detecting water in areas where vegetation is found. This may be attributed to the fact that Xu’s equation has been shown to be effective on a wide range of sensors, showing better results for Sentinel-2 images. Furthermore, different studies show that Xu’s equation is accurate in water bodies with a shallow depth, in areas with high turbidity, or where shallow waters are vegetated.
With the equation proposed by Gao, positive NDWI values are consistently obtained, both for the Landsat-8 and the Sentinel-2 image, and in both criteria. This indicates presence of water in bare ground and soil with vegetation, resulting in a slight overestimation of water coverage. This may be attributed to the fact that Gao’s equation has been shown to be more accurate in areas with low turbidity and in deep water bodies. It is likely that the index is not being sensitive to the variation of the reflectance of the water in relation to the reflectance of the surrounding soil. This index is positively correlated to the actual water coverage, except in Landsat images with shoreline pixels selected according to criterion 2.
Finally, NDWI values obtained by the McFeeters’ index are almost always negative, for both images and criteria. In the case of the Landsat-8 images, this underestimation of the water coverage is stronger, and for Sentinel-2 images, the underestimation is smaller. As with Xu’s index, the correlation between the index and the water coverage is positive with criterion 1 and negative with criterion 2.
A consistent result in all indices is the negative correlation obtained when using criterion 2 (first order shoreline reconstruction). As seen in the corresponding scatterplots, this criterion introduces several pixels with very high actual water coverage. An inspection on the six corresponding scatterplots (
Figure 10 and
Figure 11) shows that the computed indices are not necessarily higher in these pixels (and are significantly below the mean in the Sentinel case), even though that except for McFeeters the actual NDWI was positive in these pixels. This can be attributed to differences in the actual spectral bands of the sensors, and that the Sentinel sensor is more affected by the water turbidity of the lagoon than the Landsat sensor.
Since flood maps computed from satellite images almost in real time are becoming a vital tool for decision-making in disaster monitoring and evaluation, the choice of imagery and index (and also the interpretation of the indices themselves) should be taken with special care. Flooded areas contain mixtures of water and land, vegetation, or even urban areas. Therefore only a fraction of the pixel is free water, which in turn may be turbid or carry a large amount of material in suspension. This contribution shows that the choice of one index over another will depend on the specific characteristics of the satellite image and the water body being studied.
Author Contributions
Conceptualization, C.A.D., G.N.R.S and G.S.; methodology, G.S., G.N.R.S. and C.A.D.; data acquisition: S.G. and A.V.; formal analysis, G.S. and G.N.R.S; writing—original draft preparation, G.S. and G.N.R.S.; writing—review, C.A.D.; visualization and editing, G.S., G.N.R.S. and C.A.D.; supervision, A.V. and C.A.D.; resources, A.V. and C.A.D. All authors have read and agreed to the published version of the manuscript.
Funding
Partial financial support for this research was provided by grants from CONICET, Universidad Nacional del Sur, Agencia Nacional de Promoción Científica y Tecnológica (ANPCYT).
Institutional Review Board Statement
Not applicable.
Informed Consent Statement
Not applicable.
Conflicts of Interest
“The authors declare no conflict of interest.”.
References
- Feyisa, G.L.; Meilby, H.; Fensholt, R.; Proud, S.R. Automated Water Extraction Index: A new technique for surface water mapping using Landsat imagery. Remote Sensing of Environment 2014, 140, 23 – 35. [CrossRef]
- Claudia Kuenzer, Huadong Guo, J.H.P.L.X.L.; Dech, S. Flood Mapping and Flood Dynamics of the Mekong Delta: ENVISAT-ASAR-WSM Based Time Series Analyses. Remote Sensing, vol. 5, issue 2, pp. 687-715 2013, 5, 687–715. [CrossRef]
- Nair, P.K.; Babu, D. Spatial Shrinkage of Vembanad Lake, South West India during 1973-2015 using NDWI and MNDWI. International Journal of Science and Research 2016, 5, 319–7064.
- Islam, A.S.; Bala, S.K.; Haque, A. FLOOD INUNDATION MAP OF BANGLADESH USING MODIS SURFACE REFLECTANCE DATA. International conference on water and flood management (ICWFM) Dhaka, Bangladesh, 2009, pp. 739–748.
- Islam, A.; Bala, S.; Haque, M. Flood inundation map of Bangladesh using MODIS time-series images. Journal of Flood Risk Management 2010, 3, 210–222. [CrossRef]
- Joseph, N.; Daniel, S.; Frederick, P.; Robert, B.G. NASA/DFO MODIS near real-time (NRT) global flood mapping product evaluation of flood and permanent water detection. Evaluation, Greenbelt, MD 2014, 27.
- McFeeters, S. Using the Normalized Difference Water Index (NDWI) within a Geographic Information System to Detect Swimming Pools for Mosquito Abatement: A Practical Approach. Remote Sensing, vol. 5, issue 7, pp. 3544-3561 2013, 5, 3544–3561. [CrossRef]
- J-F, P.; C, V.; Lucy, B.; M, C.; Eric, V.; Bartholomé, E.; Pierre, D. A near real-time water surface detection method based on HSV transformation of MODIS multi-spectral time series data. Remote sensing of environment. Elsevier 2014, 140, 704–716.
- https://landsat.gsfc.nasa.gov/about/. Accessed 01-03-2020.
- S, F.P.; J, P.K.; others. Water body detection and delineation with Landsat TM data. Photogrammetric engineering and remote sensing 2000, 66, 1461–1468.
- https://sentinel.esa.int/web/sentinel/missions/sentinel-2. Accessed 01-03-2020.
- Van der Meer, F. D.and Van der Werff, H.M.A.V.R.F.J.A. Potential of ESA’s Sentinel-2 for geological applications. Remote Sensing of Environment. Remote Sensing of Environment 2014, 148, 124 – 133. [CrossRef]
- Kaire, T.; Tiit, K.; Alo, L.; Margot, S.; Birgot, P.; Nõges, T. First experiences in mapping lake water quality parameters with Sentinel-2 MSI imagery. Remote Sensing 2016, 8, 640.
- Xiucheng, Y.; Shanshan, Z.; Xuebin, Q.; Na, Z.; Ligang, L. Mapping of urban surface water bodies from Sentinel-2 MSI imagery at 10 m resolution via NDWI-based image sharpening. Remote Sensing 2017, 9, 596.
- Alfonso, M.B. Estructura y dinámica del zooplancton en una laguna con manejo antrópico: laguna La Salada (Pedro Luro, Pcia. de Buenos Aires). PhD thesis, UNIVERSIDAD NACIONAL DEL SUR, 2018.
- F., F.C.; Y, B.V.; Cintia, P.M. VARIACION DEL AREA DE LA LAGUNA LA SALADA EN RELACIÓN AL RÉGIMEN PLUVIOMÉTRICO DE LA REGIÓN. Contribuciones Científicas GÆA — Sociedad Argentina de Estudios Geográficos 2008, 20, 109.
- McFeeters, S.K. The use of the Normalized Difference Water Index (NDWI) in the delineation of open water features. International Journal of Remote Sensing 1996, 17, 1425–1432. [CrossRef]
- Xu, H. Modification of normalised difference water index (NDWI) to enhance open water features in remotely sensed imagery. International Journal of Remote Sensing 2006, 27, 3025–3033, . [CrossRef]
- cai Gao, B. NDWI—A normalized difference water index for remote sensing of vegetation liquid water from space. Remote Sensing of Environment 1996, 58, 257–266. [CrossRef]
|
Disclaimer/Publisher’s Note: The statements, opinions and data contained in all publications are solely those of the individual author(s) and contributor(s) and not of MDPI and/or the editor(s). MDPI and/or the editor(s) disclaim responsibility for any injury to people or property resulting from any ideas, methods, instructions or products referred to in the content. |
© 2023 by the authors. Licensee MDPI, Basel, Switzerland. This article is an open access article distributed under the terms and conditions of the Creative Commons Attribution (CC BY) license (http://creativecommons.org/licenses/by/4.0/).
