Submitted:
10 July 2023
Posted:
11 July 2023
You are already at the latest version
Abstract
Keywords:
Introduction
Methodology
Selection of Most Significant Implicated Genes in OSCC.
Selection of Most Significant miRNAs in OSCC.
Analysis of Target Gene/miRNA Interaction.
Important Driver Genes in OSCC
A. Tumor Suppressor Genes
B. Oncogenes
C. Combinatory Significance of Key Driver Genes in OSCC
Results of Bioinformatic Analysis of miRNA/Target Interactions
1. MiR-155-5p in OSCC
2. MiR-16-5p in OSCC
Expression Patterns in OSCC.
Known Target Genes and Affected Pathways.
3. MiR-1-3p in OSCC
Expression Patterns in OSCC.
Known Target Genes and Affected Pathways.
4. MiR-124-3p in OSCC
Expression Patterns in OSCC.
Known Target Genes and Affected Pathways.
5. MiR-34a-5p in OSCC
Expression Patterns in OSCC.
Known Target Genes and Affected Pathways.
Discussion
Author Contributions
Funding
Data Availability Statement
Conflicts of Interest
References
- Pare, A.; Joly, A. [Oral cancer: Risk factors and management]. Presse medicale 2017, 46, 320–330. [Google Scholar] [PubMed]
- Ali, K. Oral cancer - the fight must go on against all odds. Evidence-based dentistry 2022, 23, 4–5. [Google Scholar]
- Johnson, D.E.; Burtness, B.; Leemans, C.R.; Lui, V.W.Y.; Bauman, J.E.; Grandis, J.R. Head and neck squamous cell carcinoma. Nature reviews. Disease primers 2020, 6, 92. [Google Scholar] [CrossRef] [PubMed]
- Bugshan, A.; Farooq, I. Oral squamous cell carcinoma: metastasis, potentially associated malignant disorders, etiology and recent advancements in diagnosis. F1000Research 2020, 9, 229. [Google Scholar] [CrossRef]
- Abati, S.; Bramati, C.; Bondi, S.; Lissoni, A.; Trimarchi, M. Oral Cancer and Precancer: A Narrative Review on the Relevance of Early Diagnosis. International journal of environmental research and public health 2020, 17. [Google Scholar] [CrossRef]
- Li, L.; Li, C.; Wang, S.; Wang, Z.; Jiang, J.; Wang, W.; Li, X.; Chen, J.; Liu, K.; Li, C.; et al. Exosomes Derived from Hypoxic Oral Squamous Cell Carcinoma Cells Deliver miR-21 to Normoxic Cells to Elicit a Prometastatic Phenotype. Cancer research 2016, 76, 1770–1780. [Google Scholar] [CrossRef] [PubMed]
- Gharat, S.A.; Momin, M.; Bhavsar, C. Oral Squamous Cell Carcinoma: Current Treatment Strategies and Nanotechnology-Based Approaches for Prevention and Therapy. Critical reviews in therapeutic drug carrier systems 2016, 33, 363–400. [Google Scholar] [CrossRef]
- Khurshid, Z.; Zafar, M.S.; Khan, R.S.; Najeeb, S.; Slowey, P.D.; Rehman, I.U. Role of Salivary Biomarkers in Oral Cancer Detection. Advances in clinical chemistry 2018, 86, 23–70. [Google Scholar]
- Ghantous, Y.; Bahouth, Z.; Abu El-Naaj, I. Clinical and genetic signatures of local recurrence in oral squamous cell carcinoma. Archives of oral biology 2018, 95, 141–148. [Google Scholar] [CrossRef]
- Weckx, A.; Riekert, M.; Grandoch, A.; Schick, V.; Zoller, J.E.; Kreppel, M. Time to recurrence and patient survival in recurrent oral squamous cell carcinoma. Oral oncology 2019, 94, 8–13. [Google Scholar] [CrossRef]
- Fantozzi, P.J.; Bavarian, R.; Tamayo, I.; Bind, M.A.; Woo, S.B.; Villa, A. The role of family history of Cancer in Oral Cavity Cancer. Head & face medicine 2021, 17, 48. [Google Scholar]
- Vatsa, P.P.; Jindal, Y.; Bhadwalkar, J.; Chamoli, A.; Upadhyay, V.; Mandoli, A. Role of epigenetics in OSCC: an understanding above genetics. Medical oncology 2023, 40, 122. [Google Scholar] [CrossRef]
- Sasahira, T.; Kirita, T. Hallmarks of Cancer-Related Newly Prognostic Factors of Oral Squamous Cell Carcinoma. International journal of molecular sciences 2018, 19. [Google Scholar] [CrossRef] [PubMed]
- Deshmukh, A.; Rao, K.N.; Arora, R.D.; Nagarkar, N.M.; Singh, A.; Shetty, O.S. Molecular Insights into Oral Malignancy. Indian journal of surgical oncology 2022, 13, 267–280. [Google Scholar] [CrossRef]
- Yapijakis, C. Regulatory Role of MicroRNAs in Brain Development and Function. Advances in experimental medicine and biology 2020, 1195, 237–247. [Google Scholar]
- Di Leva, G.; Garofalo, M.; Croce, C.M. MicroRNAs in cancer. Annual review of pathology 2014, 9, 287–314. [Google Scholar] [CrossRef] [PubMed]
- Ghosh, R.D.; Pattatheyil, A.; Roychoudhury, S. Functional Landscape of Dysregulated MicroRNAs in Oral Squamous Cell Carcinoma: Clinical Implications. Frontiers in oncology 2020, 10, 619. [Google Scholar] [CrossRef]
- Palaia, G.; Pippi, R.; Rocchetti, F.; Caputo, M.; Macali, F.; Mohsen, A.; Del Vecchio, A.; Tenore, G.; Romeo, U. Liquid biopsy in the assessment of microRNAs in oral squamous cell carcinoma: A systematic review. Journal of clinical and experimental dentistry 2022, 14, e875–e884. [Google Scholar] [CrossRef]
- Kim, S.; Lee, J.W.; Park, Y.S. The Application of Next-Generation Sequencing to Define Factors Related to Oral Cancer and Discover Novel Biomarkers. Life 2020, 10. [Google Scholar] [CrossRef]
- Shanmugam, A.; Hariharan, A.K.; Hasina, R.; Nair, J.R.; Katragadda, S.; Irusappan, S.; Ravichandran, A.; Veeramachaneni, V.; Bettadapura, R.; Bhati, M.; et al. Ultrasensitive detection of tumor-specific mutations in saliva of patients with oral cavity squamous cell carcinoma. Cancer 2021, 127, 1576–1589. [Google Scholar] [CrossRef]
- Starzynska, A.; Adamska, P.; Sejda, A.; Sakowicz-Burkiewicz, M.; Adamski, L.J.; Marvaso, G.; Wychowanski, P.; Jereczek-Fossa, B.A. Any Role of PIK3CA and PTEN Biomarkers in the Prognosis in Oral Squamous Cell Carcinoma? Life 2020, 10. [Google Scholar] [CrossRef]
- Vairaktaris, E.; Loukeri, S.; Vassiliou, S.; Nkenke, E.; Spyridonidou, S.; Vylliotis, A.; Papakosta, V.; Lazaris, A.; Agrogiannis, G.; Yapijakis, C.; et al. EGFR and c-Jun exhibit the same pattern of expression and increase gradually during the progress of oral oncogenesis. In vivo 2007, 21, 791–796. [Google Scholar]
- Yapijakis, C.; Kalogera, S.; Papakosta, V.; Vassiliou, S. The Hamster Model of Sequential Oral Carcinogenesis: An Update. In vivo 2019, 33, 1751–1755. [Google Scholar] [CrossRef] [PubMed]
- Vairaktaris, E.; Spyridonidou, S.; Papakosta, V.; Vylliotis, A.; Lazaris, A.; Perrea, D.; Yapijakis, C.; Patsouris, E. The hamster model of sequential oral oncogenesis. Oral oncology 2008, 44, 315–324. [Google Scholar] [CrossRef] [PubMed]
- D'Cruz, A.; Dechamma, P.N.; Saldanha, M.; Maben, S.; Shetty, P.; Chakraborty, A. Non-Invasive Saliva-based Detection of Gene Mutations in Oral Cancer Patients by Oral Rub and Rinse Technique. Asian Pacific journal of cancer prevention: APJCP 2021, 22, 3287–3291. [Google Scholar] [CrossRef] [PubMed]
- Levine, A.J.; Oren, M. The first 30 years of p53: growing ever more complex. Nature reviews. Cancer 2009, 9, 749–758. [Google Scholar] [CrossRef] [PubMed]
- Lindemann, A.; Takahashi, H.; Patel, A.A.; Osman, A.A.; Myers, J.N. Targeting the DNA Damage Response in OSCC with TP53 Mutations. Journal of dental research 2018, 97, 635–644. [Google Scholar] [CrossRef]
- Hyodo, T.; Kuribayashi, N.; Fukumoto, C.; Komiyama, Y.; Shiraishi, R.; Kamimura, R.; Sawatani, Y.; Yaguchi, E.; Hasegawa, T.; Izumi, S.; et al. The mutational spectrum in whole exon of p53 in oral squamous cell carcinoma and its clinical implications. Scientific reports 2022, 12, 21695. [Google Scholar] [CrossRef]
- Szturz, P.; Wouters, K.; Kiyota, N.; Tahara, M.; Prabhash, K.; Noronha, V.; Adelstein, D.; Vermorken, J.B. Altered fractionation radiotherapy combined with concurrent low-dose or high-dose cisplatin in head and neck cancer: A systematic review of literature and meta-analysis. Oral oncology 2018, 76, 52–60. [Google Scholar] [CrossRef]
- Zhang, X.; Zhang, L.; Tan, X.; Lin, Y.; Han, X.; Wang, H.; Ming, H.; Li, Q.; Liu, K.; Feng, G. Systematic analysis of genes involved in oral cancer metastasis to lymph nodes. Cellular & molecular biology letters 2018, 23, 53. [Google Scholar]
- Shima, K.; Nosho, K.; Baba, Y.; Cantor, M.; Meyerhardt, J.A.; Giovannucci, E.L.; Fuchs, C.S.; Ogino, S. Prognostic significance of CDKN2A (p16) promoter methylation and loss of expression in 902 colorectal cancers: Cohort study and literature review. International journal of cancer 2011, 128, 1080–1094. [Google Scholar] [CrossRef] [PubMed]
- Padhi, S.S.; Roy, S.; Kar, M.; Saha, A.; Roy, S.; Adhya, A.; Baisakh, M.; Banerjee, B. Role of CDKN2A/p16 expression in the prognostication of oral squamous cell carcinoma. Oral oncology 2017, 73, 27–35. [Google Scholar] [CrossRef] [PubMed]
- Stransky, N.; Egloff, A.M.; Tward, A.D.; Kostic, A.D.; Cibulskis, K.; Sivachenko, A.; Kryukov, G.V.; Lawrence, M.S.; Sougnez, C.; McKenna, A.; et al. The mutational landscape of head and neck squamous cell carcinoma. Science 2011, 333, 1157–1160. [Google Scholar] [CrossRef] [PubMed]
- Hu, X.; Zhai, Y.; Shi, R.; Qian, Y.; Cui, H.; Yang, J.; Bi, Y.; Yan, T.; Yang, J.; Ma, Y.; et al. FAT1 inhibits cell migration and invasion by affecting cellular mechanical properties in esophageal squamous cell carcinoma. Oncology reports 2018, 39, 2136–2146. [Google Scholar] [CrossRef]
- Tang, Y.I.; Liu, Y.; Zhao, W.; Yu, T.; Yu, H. Caspase-8 polymorphisms and risk of oral squamous cell carcinoma. Experimental and therapeutic medicine 2015, 10, 2267–2276. [Google Scholar] [CrossRef]
- Hayes, T.F.; Benaich, N.; Goldie, S.J.; Sipila, K.; Ames-Draycott, A.; Cai, W.; Yin, G.; Watt, F.M. Integrative genomic and functional analysis of human oral squamous cell carcinoma cell lines reveals synergistic effects of FAT1 and CASP8 inactivation. Cancer letters 2016, 383, 106–114. [Google Scholar] [CrossRef]
- Xi, Y.; Negrao, M.V.; Akagi, K.; Xiao, W.; Jiang, B.; Warner, S.C.; Dunn, J.D.; Wang, J.; Symer, D.E.; Gillison, M.L. Noninvasive genomic profiling of somatic mutations in oral cavity cancers. Oral oncology 2023, 140, 106372. [Google Scholar] [CrossRef]
- Kurasawa, Y.; Shiiba, M.; Nakamura, M.; Fushimi, K.; Ishigami, T.; Bukawa, H.; Yokoe, H.; Uzawa, K.; Tanzawa, H. PTEN expression and methylation status in oral squamous cell carcinoma. Oncology reports 2008, 19, 1429–1434. [Google Scholar]
- Purow, B. Notch inhibition as a promising new approach to cancer therapy. Advances in experimental medicine and biology 2012, 727, 305–319. [Google Scholar]
- Fukusumi, T.; Califano, J.A. The NOTCH Pathway in Head and Neck Squamous Cell Carcinoma. Journal of dental research 2018, 97, 645–653. [Google Scholar] [CrossRef]
- Pickering, C.R.; Zhang, J.; Yoo, S.Y.; Bengtsson, L.; Moorthy, S.; Neskey, D.M.; Zhao, M.; Ortega Alves, M.V.; Chang, K.; Drummond, J.; et al. Integrative genomic characterization of oral squamous cell carcinoma identifies frequent somatic drivers. Cancer discovery 2013, 3, 770–781. [Google Scholar] [CrossRef] [PubMed]
- Pylayeva-Gupta, Y.; Grabocka, E.; Bar-Sagi, D. RAS oncogenes: weaving a tumorigenic web. Nature reviews. Cancer 2011, 11, 761–774. [Google Scholar] [CrossRef] [PubMed]
- Alshahrani, S.A.; Al-Qahtani, W.S.; Almufareh, N.A.; Domiaty, D.M.; Albasher, G.I.; Safhi, F.A.; AlQassim, F.A.; Alotaibi, M.A.; Al-Hazani, T.M.; Almutlaq, B.A. Oral cancer among Khat users: finding evidence from DNA analysis of nine cancer-related gene mutations. BMC oral health 2021, 21, 626. [Google Scholar] [CrossRef]
- Simpson, D.R.; Mell, L.K.; Cohen, E.E. Targeting the PI3K/AKT/mTOR pathway in squamous cell carcinoma of the head and neck. Oral oncology 2015, 51, 291–298. [Google Scholar] [CrossRef]
- Cohen, Y.; Goldenberg-Cohen, N.; Shalmon, B.; Shani, T.; Oren, S.; Amariglio, N.; Dratviman-Storobinsky, O.; Shnaiderman-Shapiro, A.; Yahalom, R.; Kaplan, I.; et al. Mutational analysis of PTEN/PIK3CA/AKT pathway in oral squamous cell carcinoma. Oral oncology 2011, 47, 946–950. [Google Scholar] [CrossRef] [PubMed]
- Brand, T.M.; Iida, M.; Wheeler, D.L. Molecular mechanisms of resistance to the EGFR monoclonal antibody cetuximab. Cancer biology & therapy 2011, 11, 777–792. [Google Scholar]
- Slamon, D.J.; Clark, G.M.; Wong, S.G.; Levin, W.J.; Ullrich, A.; McGuire, W.L. Human breast cancer: correlation of relapse and survival with amplification of the HER-2/neu oncogene. Science 1987, 235, 177–182. [Google Scholar] [CrossRef]
- Popovic, B.; Jekic, B.; Novakovic, I.; Lukovic, L.; Konstantinovic, V.; Babic, M.; Milasin, J. Cancer genes alterations and HPV infection in oral squamous cell carcinoma. International journal of oral and maxillofacial surgery 2010, 39, 909–915. [Google Scholar] [CrossRef]
- Jelovac, D.B.; Tepavcevic, Z.; Nikolic, N.; Ilic, B.; Eljabo, N.; Popovic, B.; Carkic, J.; Konstantinovic, V.; Vukadinovic, M.; Milicic, B.; et al. The amplification of c-erb-B2 in cancer-free surgical margins is a predictor of poor outcome in oral squamous cell carcinoma. International journal of oral and maxillofacial surgery 2016, 45, 700–705. [Google Scholar] [CrossRef]
- Dai, S.; Zhou, Z.; Chen, Z.; Xu, G.; Chen, Y. Fibroblast Growth Factor Receptors (FGFRs): Structures and Small Molecule Inhibitors. Cells 2019, 8. [Google Scholar] [CrossRef]
- Xie, X.; Wang, Z.; Chen, F.; Yuan, Y.; Wang, J.; Liu, R.; Chen, Q. Roles of FGFR in oral carcinogenesis. Cell proliferation 2016, 49, 261–269. [Google Scholar] [CrossRef]
- Lopes, V.K.M.; Jesus, A.S.; Souza, L.L.; Miyahara, L.A.N.; Guimaraes, D.M.; Pontes, H.A.R.; Pontes, F.S.C.; Carvalho, P.L. Ki-67 protein predicts survival in oral squamous carcinoma cells: an immunohistochemical study. Brazilian oral research 2017, 31, e66. [Google Scholar] [CrossRef] [PubMed]
- Nayak, S.; Goel, M.M.; Makker, A.; Bhatia, V.; Chandra, S.; Kumar, S.; Agarwal, S.P. Fibroblast Growth Factor (FGF-2) and Its Receptors FGFR-2 and FGFR-3 May Be Putative Biomarkers of Malignant Transformation of Potentially Malignant Oral Lesions into Oral Squamous Cell Carcinoma. PloS one 2015, 10, e0138801. [Google Scholar] [CrossRef]
- Raimondi, A.R.; Molinolo, A.A.; Itoiz, M.E. Fibroblast growth factor-2 expression during experimental oral carcinogenesis. Its possible role in the induction of pre-malignant fibrosis. Journal of oral pathology & medicine: official publication of the International Association of Oral Pathologists and the American Academy of Oral Pathology 2006, 35, 212–217. [Google Scholar]
- Gluck, C.; Glathar, A.; Tsompana, M.; Nowak, N.; Garrett-Sinha, L.A.; Buck, M.J.; Sinha, S. Molecular dissection of the oncogenic role of ETS1 in the mesenchymal subtypes of head and neck squamous cell carcinoma. PLoS genetics 2019, 15, e1008250. [Google Scholar] [CrossRef] [PubMed]
- Pande, P.; Soni, S.; Chakravarti, N.; Mathur, M.; Shukla, N.K.; Ralhan, R. Prognostic impact of Ets-1 overexpression in betel and tobacco related oral cancer. Cancer detection and prevention 2001, 25, 496–501. [Google Scholar] [PubMed]
- Sheng, X.; Li, X.; Qian, Y.; Wang, S.; Xiao, C. ETS1 regulates NDRG1 to promote the proliferation, migration, and invasion of OSCC. Oral diseases 2023. [Google Scholar] [CrossRef]
- Gupta, S.; Gupta, S. Role of human papillomavirus in oral squamous cell carcinoma and oral potentially malignant disorders: A review of the literature. Indian journal of dentistry 2015, 6, 91–98. [Google Scholar] [CrossRef] [PubMed]
- Xu, H.; Jin, X.; Yuan, Y.; Deng, P.; Jiang, L.; Zeng, X.; Li, X.S.; Wang, Z.Y.; Chen, Q.M. Prognostic value from integrative analysis of transcription factors c-Jun and Fra-1 in oral squamous cell carcinoma: a multicenter cohort study. Scientific reports 2017, 7, 7522. [Google Scholar] [CrossRef] [PubMed]
- Perez-Sayans, M.; Suarez-Penaranda, J.M.; Pilar, G.D.; Barros-Angueira, F.; Gandara-Rey, J.M.; Garcia-Garcia, A. What real influence does the proto-oncogene c-myc have in OSCC behavior? Oral oncology 2011, 47, 688–692. [Google Scholar] [CrossRef]
- Hu, L.; Liu, J.; Li, Z.; Wang, C.; Nawshad, A. Transforming growth factor-beta1 activates DeltaNp63/c-Myc to promote oral squamous cell carcinoma. Oral surgery, oral medicine, oral pathology and oral radiology 2016, 122, 460–482.e464. [Google Scholar] [CrossRef] [PubMed]
- Pallavi, N.; Nalabolu, G.R.K.; Hiremath, S.K.S. Bcl-2 and c-Myc expression in oral dysplasia and oral squamous cell carcinoma: An immunohistochemical study to assess tumor progression. Journal of oral and maxillofacial pathology: JOMFP 2018, 22, 325–331. [Google Scholar] [CrossRef] [PubMed]
- Liu, Z.M.; Bao, Y.; Li, T.K.; Di, Y.B.; Song, W.J. MKI67 an potential oncogene of oral squamous cell carcinoma via the high throughput technology. Medicine 2022, 101, e32595. [Google Scholar] [CrossRef]
- Dragomir, L.P.; Simionescu, C.; Margaritescu, C.; Stepan, A.; Dragomir, I.M.; Popescu, M.R. P53, p16 and Ki67 immunoexpression in oral squamous carcinomas. Romanian journal of morphology and embryology = Revue roumaine de morphologie et embryologie 2012, 53, 89–93. [Google Scholar] [PubMed]
- Sudha, V.M.; Hemavathy, S. Role of bcl-2 oncoprotein in oral potentially malignant disorders and squamous cell carcinoma: an immunohistochemical study. Indian journal of dental research: official publication of Indian Society for Dental Research 2011, 22, 520–525. [Google Scholar] [PubMed]
- Arya, V.; Singh, S.; Daniel, M.J. Clinicopathological correlation of Bcl-2 oncoprotein expression in oral precancer and cancer. Journal of oral biology and craniofacial research 2016, 6, 18–23. [Google Scholar] [CrossRef]
- Rahmani, A.; Alzohairy, M.; Babiker, A.Y.; Rizvi, M.A.; Elkarimahmad, H.G. Clinicopathological significance of PTEN and bcl2 expressions in oral squamous cell carcinoma. International journal of clinical and experimental pathology 2012, 5, 965–971. [Google Scholar]
- Dwivedi, R.; Chandra, S.; Mehrotra, D.; Raj, V.; Pandey, R. Predicting transition from oral pre-malignancy to malignancy via Bcl-2 immuno-expression: Evidence and lacunae. Journal of oral biology and craniofacial research 2020, 10, 397–403. [Google Scholar] [CrossRef]
- Mehterov, N.; Sacconi, A.; Pulito, C.; Vladimirov, B.; Haralanov, G.; Pazardjikliev, D.; Nonchev, B.; Berindan-Neagoe, I.; Blandino, G.; Sarafian, V. A novel panel of clinically relevant miRNAs signature accurately differentiates oral cancer from normal mucosa. Frontiers in oncology 2022, 12, 1072579. [Google Scholar] [CrossRef] [PubMed]
- Wu, M.; Duan, Q.; Liu, X.; Zhang, P.; Fu, Y.; Zhang, Z.; Liu, L.; Cheng, J.; Jiang, H. MiR-155-5p promotes oral cancer progression by targeting chromatin remodeling gene ARID2. Biomedicine & pharmacotherapy = Biomedecine & pharmacotherapie 2020, 122, 109696. [Google Scholar]
- Baba, O.; Hasegawa, S.; Nagai, H.; Uchida, F.; Yamatoji, M.; Kanno, N.I.; Yamagata, K.; Sakai, S.; Yanagawa, T.; Bukawa, H. MicroRNA-155-5p is associated with oral squamous cell carcinoma metastasis and poor prognosis. Journal of oral pathology & medicine: official publication of the International Association of Oral Pathologists and the American Academy of Oral Pathology 2016, 45, 248–255. [Google Scholar]
- D'Souza, W.; Kumar, A. microRNAs in oral cancer: Moving from bench to bed as next generation medicine. Oral oncology 2020, 111, 104916. [Google Scholar] [CrossRef] [PubMed]
- Erfanparast, L.; Taghizadieh, M.; Shekarchi, A.A. Non-Coding RNAs and Oral Cancer: Small Molecules With Big Functions. Frontiers in oncology 2022, 12, 914593. [Google Scholar] [CrossRef]
- Liu, B.; Hu, J.; Zhao, H.; Zhao, L.; Pan, S. MicroRNA-155-5p Contributes to 5-Fluorouracil Resistance Through Down-Regulating TP53INP1 in Oral Squamous Cell Carcinoma. Frontiers in oncology 2021, 11, 706095. [Google Scholar] [CrossRef]
- Aali, M.; Mesgarzadeh, A.H.; Najjary, S.; Abdolahi, H.M.; Kojabad, A.B.; Baradaran, B. Evaluating the role of microRNAs alterations in oral squamous cell carcinoma. Gene 2020, 757, 144936. [Google Scholar] [CrossRef]
- Hu, S.; Wang, H.; Yan, D.; Lu, W.; Gao, P.; Lou, W.; Kong, X. Loss of miR-16 contributes to tumor progression by activation of tousled-like kinase 1 in oral squamous cell carcinoma. Cell cycle 2018, 17, 2284–2295. [Google Scholar] [CrossRef] [PubMed]
- Rishabh, K.; Khadilkar, S.; Kumar, A.; Kalra, I.; Kumar, A.P.; Kunnumakkara, A.B. MicroRNAs as Modulators of Oral Tumorigenesis-A Focused Review. International journal of molecular sciences 2021, 22. [Google Scholar] [CrossRef]
- Wang, X.; Li, G.H. MicroRNA-16 functions as a tumor-suppressor gene in oral squamous cell carcinoma by targeting AKT3 and BCL2L2. Journal of cellular physiology 2018, 233, 9447–9457. [Google Scholar] [CrossRef]
- Manikandan, M.; Deva Magendhra Rao, A.K.; Arunkumar, G.; Manickavasagam, M.; Rajkumar, K.S.; Rajaraman, R.; Munirajan, A.K. Oral squamous cell carcinoma: microRNA expression profiling and integrative analyses for elucidation of tumourigenesis mechanism. Molecular cancer 2016, 15, 28. [Google Scholar] [CrossRef]
- Troiano, G.; Mastrangelo, F.; Caponio, V.C.A.; Laino, L.; Cirillo, N.; Lo Muzio, L. Predictive Prognostic Value of Tissue-Based MicroRNA Expression in Oral Squamous Cell Carcinoma: A Systematic Review and Meta-analysis. Journal of dental research 2018, 97, 759–766. [Google Scholar] [CrossRef]
- Maclellan, S.A.; Lawson, J.; Baik, J.; Guillaud, M.; Poh, C.F.; Garnis, C. Differential expression of miRNAs in the serum of patients with high-risk oral lesions. Cancer medicine 2012, 1, 268–274. [Google Scholar] [CrossRef] [PubMed]
- Khalil, M.I.; Madere, C.; Ghosh, I.; Adam, R.M.; De Benedetti, A. Interaction of TLK1 and AKTIP as a Potential Regulator of AKT Activation in Castration-Resistant Prostate Cancer Progression. Pathophysiology: the official journal of the International Society for Pathophysiology 2021, 28, 339–354. [Google Scholar] [CrossRef] [PubMed]
- Liu, L.; Jiang, H.; Zhao, J.; Wen, H. MiRNA-16 inhibited oral squamous carcinoma tumor growth in vitro and in vivo via suppressing Wnt/beta-catenin signaling pathway. OncoTargets and therapy 2018, 11, 5111–5119. [Google Scholar] [CrossRef] [PubMed]
- Peng, C.Y.; Liao, Y.W.; Lu, M.Y.; Yu, C.H.; Yu, C.C.; Chou, M.Y. Downregulation of miR-1 enhances tumorigenicity and invasiveness in oral squamous cell carcinomas. Journal of the Formosan Medical Association = Taiwan yi zhi 2017, 116, 782–789. [Google Scholar] [CrossRef]
- Wang, Z.; Wang, J.; Chen, Z.; Wang, K.; Shi, L. MicroRNA-1-3p inhibits the proliferation and migration of oral squamous cell carcinoma cells by targeting DKK1. Biochemistry and cell biology = Biochimie et biologie cellulaire 2018, 96, 355–364. [Google Scholar] [CrossRef]
- Koshizuka, K.; Hanazawa, T.; Fukumoto, I.; Kikkawa, N.; Matsushita, R.; Mataki, H.; Mizuno, K.; Okamoto, Y.; Seki, N. Dual-receptor (EGFR and c-MET) inhibition by tumor-suppressive miR-1 and miR-206 in head and neck squamous cell carcinoma. Journal of human genetics 2017, 62, 113–121. [Google Scholar] [CrossRef]
- Organ, S.L.; Tsao, M.S. An overview of the c-MET signaling pathway. Therapeutic advances in medical oncology 2011, 3, S7–S19. [Google Scholar] [CrossRef]
- Al Rawi, N.; Elmabrouk, N.; Abu Kou, R.; Mkadmi, S.; Rizvi, Z.; Hamdoon, Z. The role of differentially expressed salivary microRNA in oral squamous cell carcinoma. A systematic review. Archives of oral biology 2021, 125, 105108. [Google Scholar] [CrossRef]
- Hunt, S.; Jones, A.V.; Hinsley, E.E.; Whawell, S.A.; Lambert, D.W. MicroRNA-124 suppresses oral squamous cell carcinoma motility by targeting ITGB1. FEBS letters 2011, 585, 187–192. [Google Scholar] [CrossRef]
- Salazar-Ruales, C.; Arguello, J.V.; Lopez-Cortes, A.; Cabrera-Andrade, A.; Garcia-Cardenas, J.M.; Guevara-Ramirez, P.; Peralta, P.; Leone, P.E.; Paz, Y.M.C. Salivary MicroRNAs for Early Detection of Head and Neck Squamous Cell Carcinoma: A Case-Control Study in the High Altitude Mestizo Ecuadorian Population. BioMed research international 2018, 2018, 9792730. [Google Scholar] [CrossRef]
- Li, X.; Fan, Q.; Li, J.; Song, J.; Gu, Y. MiR-124 down-regulation is critical for cancer associated fibroblasts-enhanced tumor growth of oral carcinoma. Experimental cell research 2017, 351, 100–108. [Google Scholar] [CrossRef]
- Qiao, C.Y.; Qiao, T.Y.; Jin, H.; Liu, L.L.; Zheng, M.D.; Wang, Z.L. LncRNA KCNQ1OT1 contributes to the cisplatin resistance of tongue cancer through the KCNQ1OT1/miR-124-3p/TRIM14 axis. European review for medical and pharmacological sciences 2020, 24, 200–212. [Google Scholar] [PubMed]
- Xu, M.; Wang, Y.; Xia, R.; Wei, Y.; Wei, X. Role of the CCL2-CCR2 signalling axis in cancer: Mechanisms and therapeutic targeting. Cell proliferation 2021, 54, e13115. [Google Scholar] [CrossRef]
- Shen, W.; Jin, Z.; Tong, X.; Wang, H.; Zhuang, L.; Lu, X.; Wu, S. TRIM14 promotes cell proliferation and inhibits apoptosis by suppressing PTEN in colorectal cancer. Cancer management and research 2019, 11, 5725–5735. [Google Scholar] [CrossRef]
- Jia, L.F.; Wei, S.B.; Mitchelson, K.; Gao, Y.; Zheng, Y.F.; Meng, Z.; Gan, Y.H.; Yu, G.Y. miR-34a inhibits migration and invasion of tongue squamous cell carcinoma via targeting MMP9 and MMP14. PloS one 2014, 9, e108435. [Google Scholar] [CrossRef]
- Jadhav, K.B.; Shah, V.; Chauhan, N.; Shah, N.; Parmar, G. Expression of microRNA-21 in saliva and tumor tissue of patients with oral squamous cell carcinoma: a predictor of cervical lymph node metastasis. Oral surgery, oral medicine, oral pathology and oral radiology 2022, 133, 60–69. [Google Scholar] [CrossRef]
- Li, T.; Li, L.; Li, D.; Wang, S.; Sun, J. MiR-34a inhibits oral cancer progression partially by repression of interleukin-6-receptor. International journal of clinical and experimental pathology 2015, 8, 1364–1373. [Google Scholar] [PubMed]
- Manzano-Moreno, F.J.; Costela-Ruiz, V.J.; Garcia-Recio, E.; Olmedo-Gaya, M.V.; Ruiz, C.; Reyes-Botella, C. Role of Salivary MicroRNA and Cytokines in the Diagnosis and Prognosis of Oral Squamous Cell Carcinoma. International journal of molecular sciences 2021, 22. [Google Scholar] [CrossRef]
- Li, Y.Y.; Tao, Y.W.; Gao, S.; Li, P.; Zheng, J.M.; Zhang, S.E.; Liang, J.; Zhang, Y. Cancer-associated fibroblasts contribute to oral cancer cells proliferation and metastasis via exosome-mediated paracrine miR-34a-5p. EBioMedicine 2018, 36, 209–220. [Google Scholar] [CrossRef]
- Piotrowski, I.; Zhu, X.; Saccon, T.D.; Ashiqueali, S.; Schneider, A.; de Carvalho Nunes, A.D.; Noureddine, S.; Sobecka, A.; Barczak, W.; Szewczyk, M.; et al. miRNAs as Biomarkers for Diagnosing and Predicting Survival of Head and Neck Squamous Cell Carcinoma Patients. Cancers 2021, 13. [Google Scholar] [CrossRef] [PubMed]
- Rokavec, M.; Oner, M.G.; Li, H.; Jackstadt, R.; Jiang, L.; Lodygin, D.; Kaller, M.; Horst, D.; Ziegler, P.K.; Schwitalla, S.; et al. IL-6R/STAT3/miR-34a feedback loop promotes EMT-mediated colorectal cancer invasion and metastasis. The Journal of clinical investigation 2014, 124, 1853–1867. [Google Scholar] [CrossRef]
- Gobin, E.; Bagwell, K.; Wagner, J.; Mysona, D.; Sandirasegarane, S.; Smith, N.; Bai, S.; Sharma, A.; Schleifer, R.; She, J.X. A pan-cancer perspective of matrix metalloproteases (MMP) gene expression profile and their diagnostic/prognostic potential. BMC cancer 2019, 19, 581. [Google Scholar] [CrossRef]
- Zhu, C.; Wei, Y.; Wei, X. AXL receptor tyrosine kinase as a promising anti-cancer approach: functions, molecular mechanisms and clinical applications. Molecular cancer 2019, 18, 153. [Google Scholar] [CrossRef]
- Ge, X.; Gao, J.; Sun, Q.W.; Wang, C.X.; Deng, W.; Mao, G.Y.; Li, H.Q.; Guo, S.S.; Cheng, J.; Wu, Y.N.; et al. MiR-34a inhibits the proliferation, migration, and invasion of oral squamous cell carcinoma by directly targeting SATB2. Journal of cellular physiology 2020, 235, 4856–4864. [Google Scholar] [CrossRef]
- Roy, S.K.; Shrivastava, A.; Srivastav, S.; Shankar, S.; Srivastava, R.K. SATB2 is a novel biomarker and therapeutic target for cancer. Journal of cellular and molecular medicine 2020, 24, 11064–11069. [Google Scholar] [CrossRef]
- Shiah, S.G.; Chou, S.T.; Chang, J.Y. MicroRNAs: Their Role in Metabolism, Tumor Microenvironment, and Therapeutic Implications in Head and Neck Squamous Cell Carcinoma. Cancers 2021, 13. [Google Scholar] [CrossRef]
- Menini, M.; De Giovanni, E.; Bagnasco, F.; Delucchi, F.; Pera, F.; Baldi, D.; Pesce, P. Salivary Micro-RNA and Oral Squamous Cell Carcinoma: A Systematic Review. Journal of personalized medicine 2021, 11. [Google Scholar] [CrossRef]
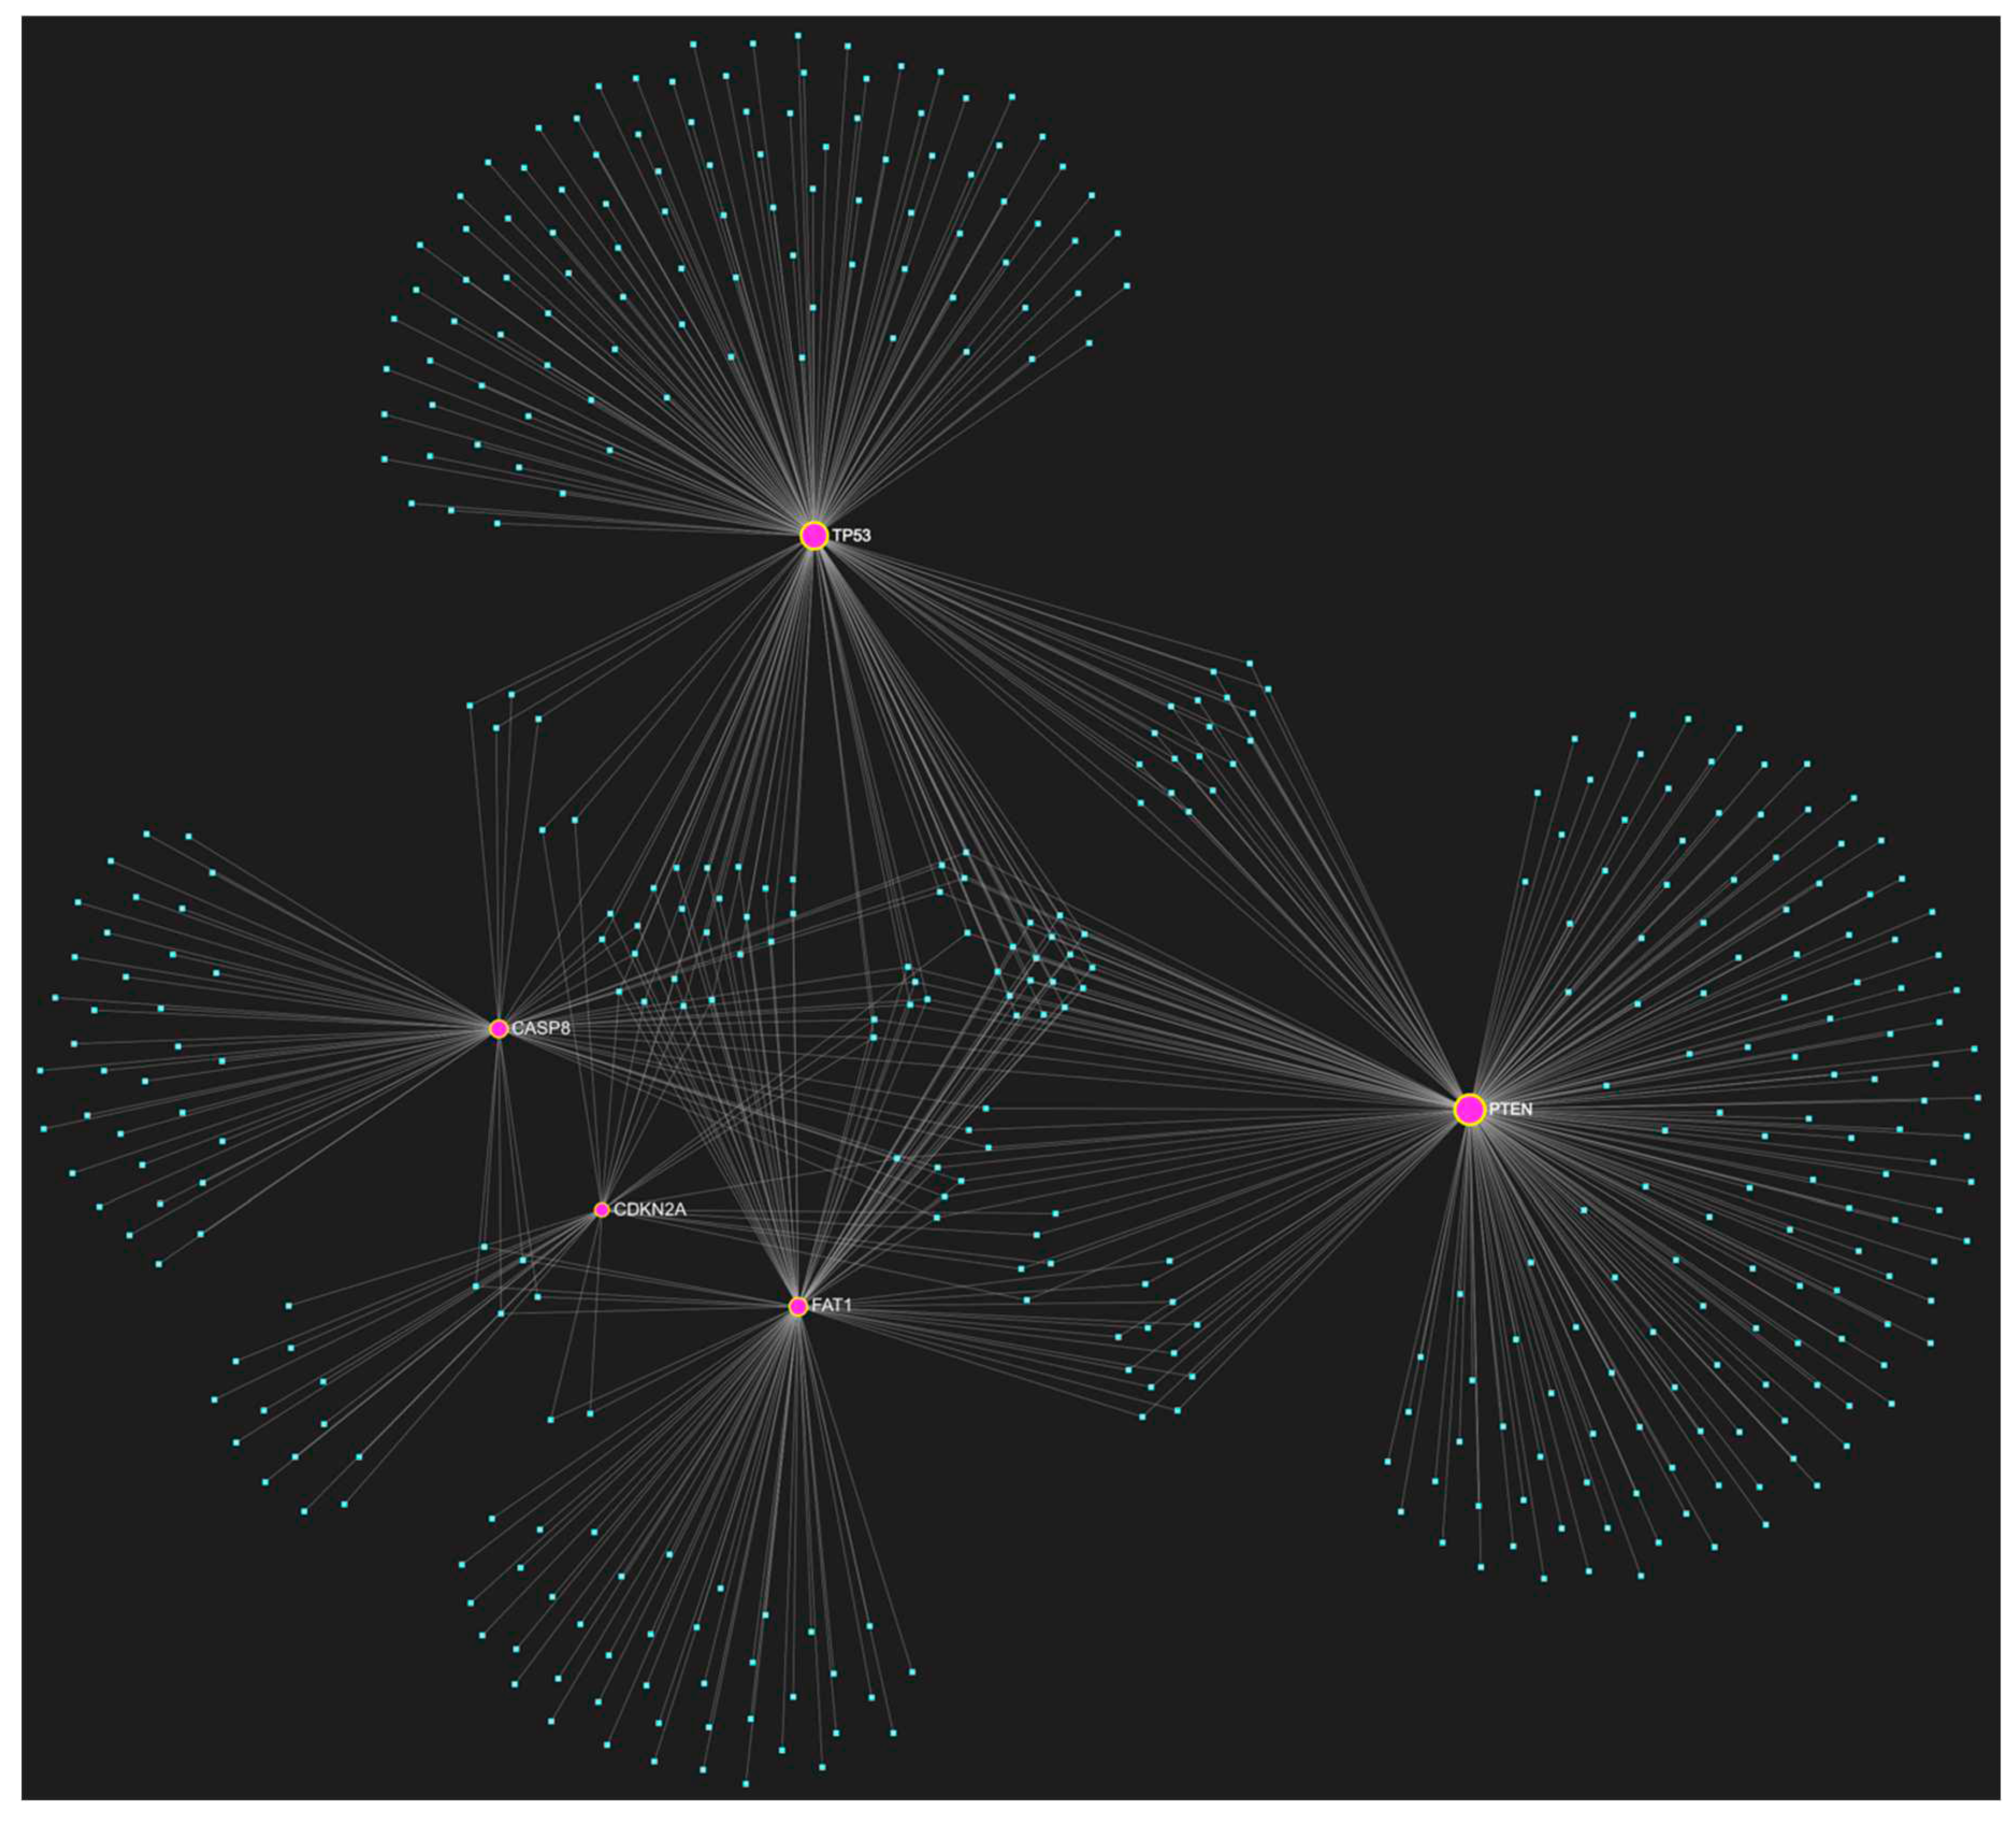
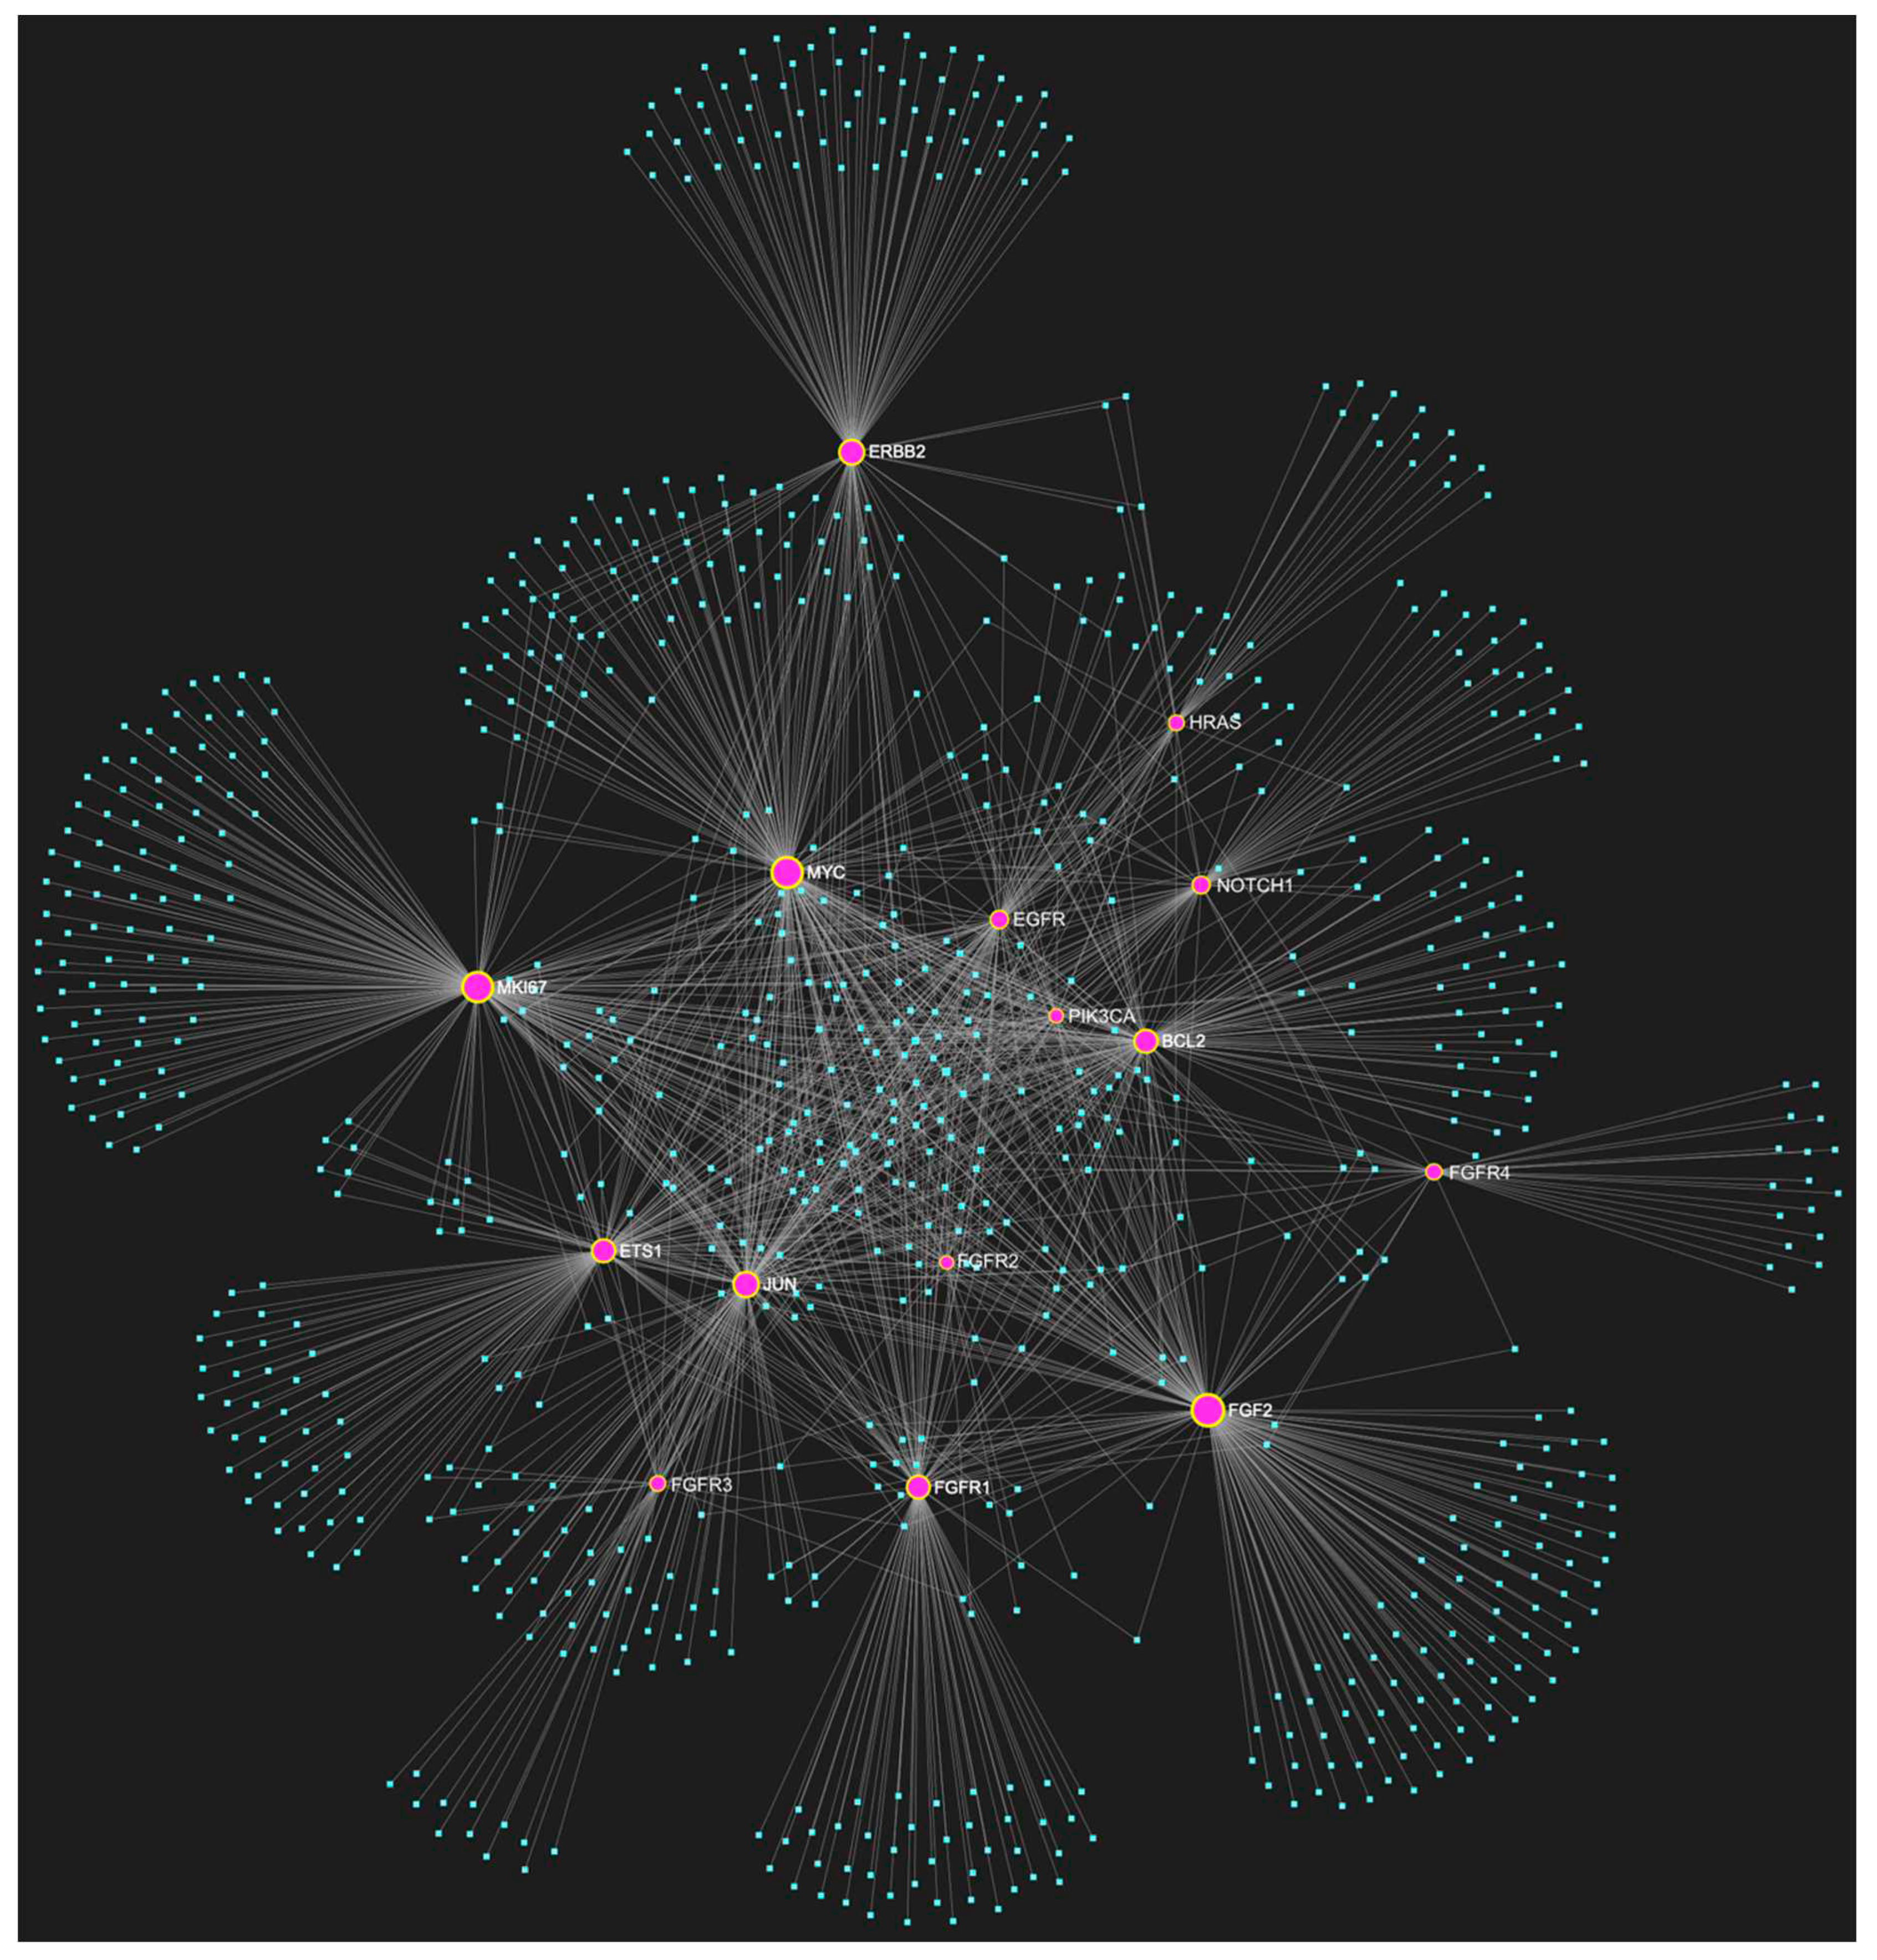
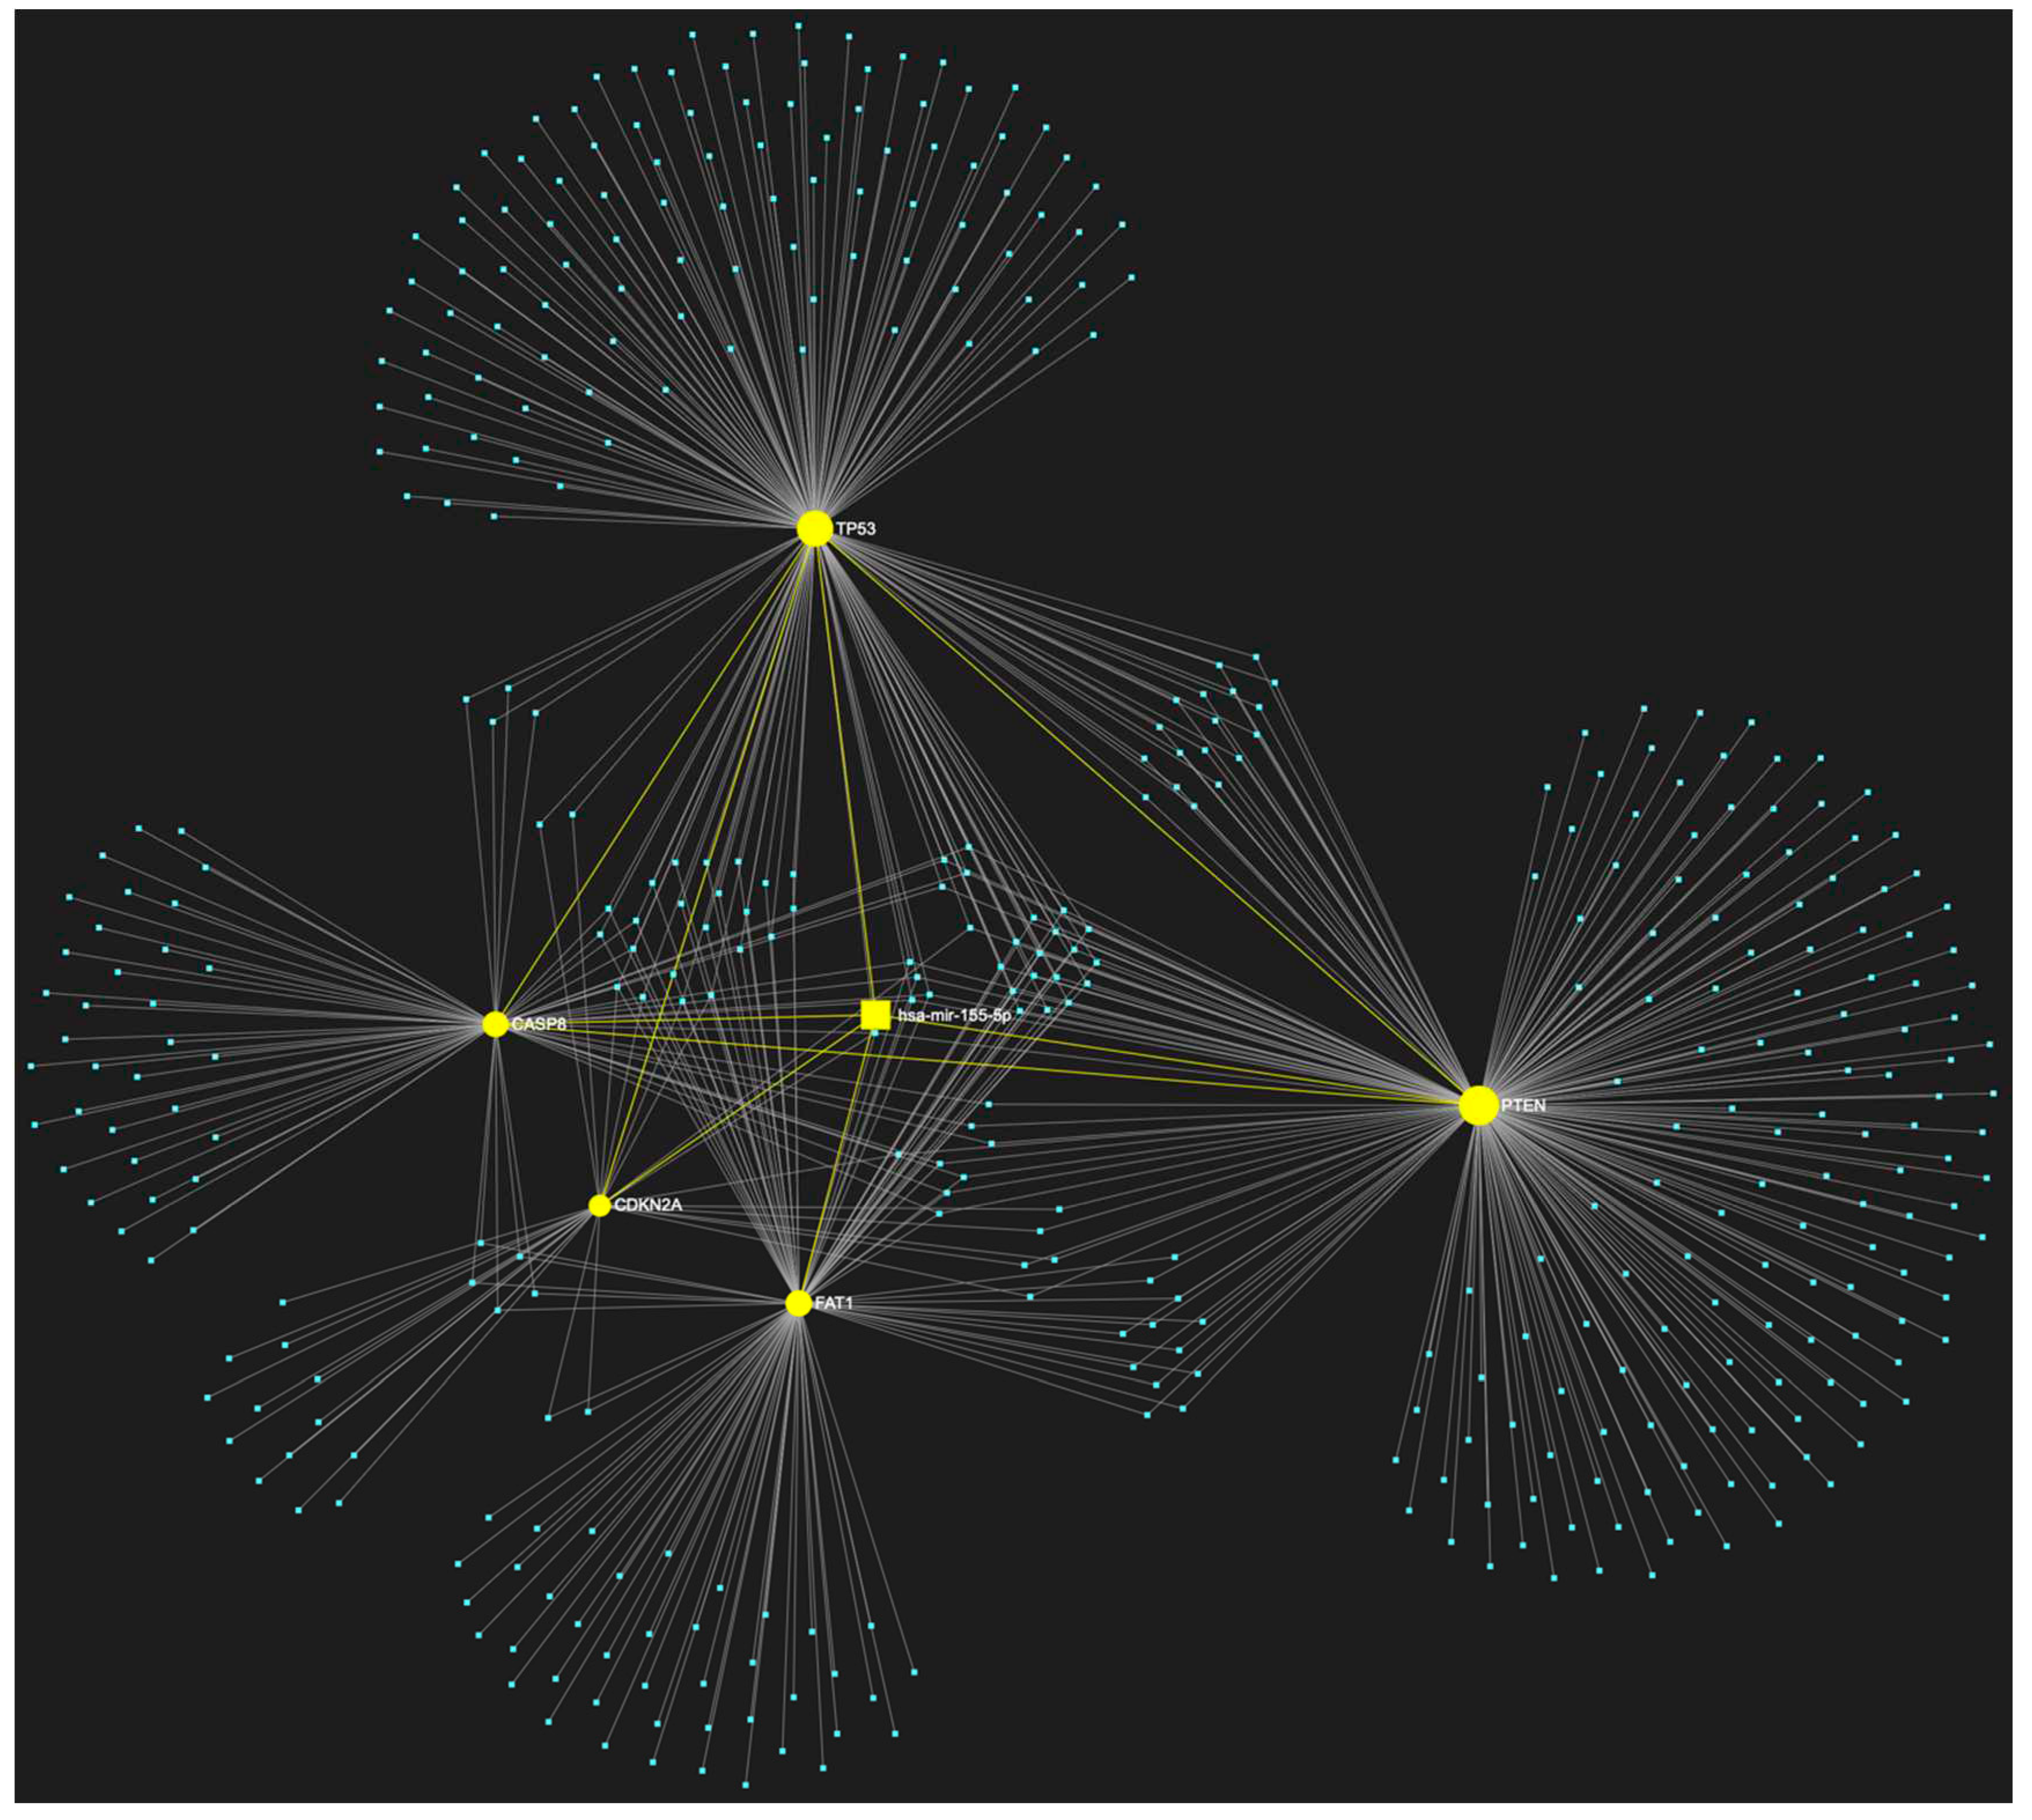
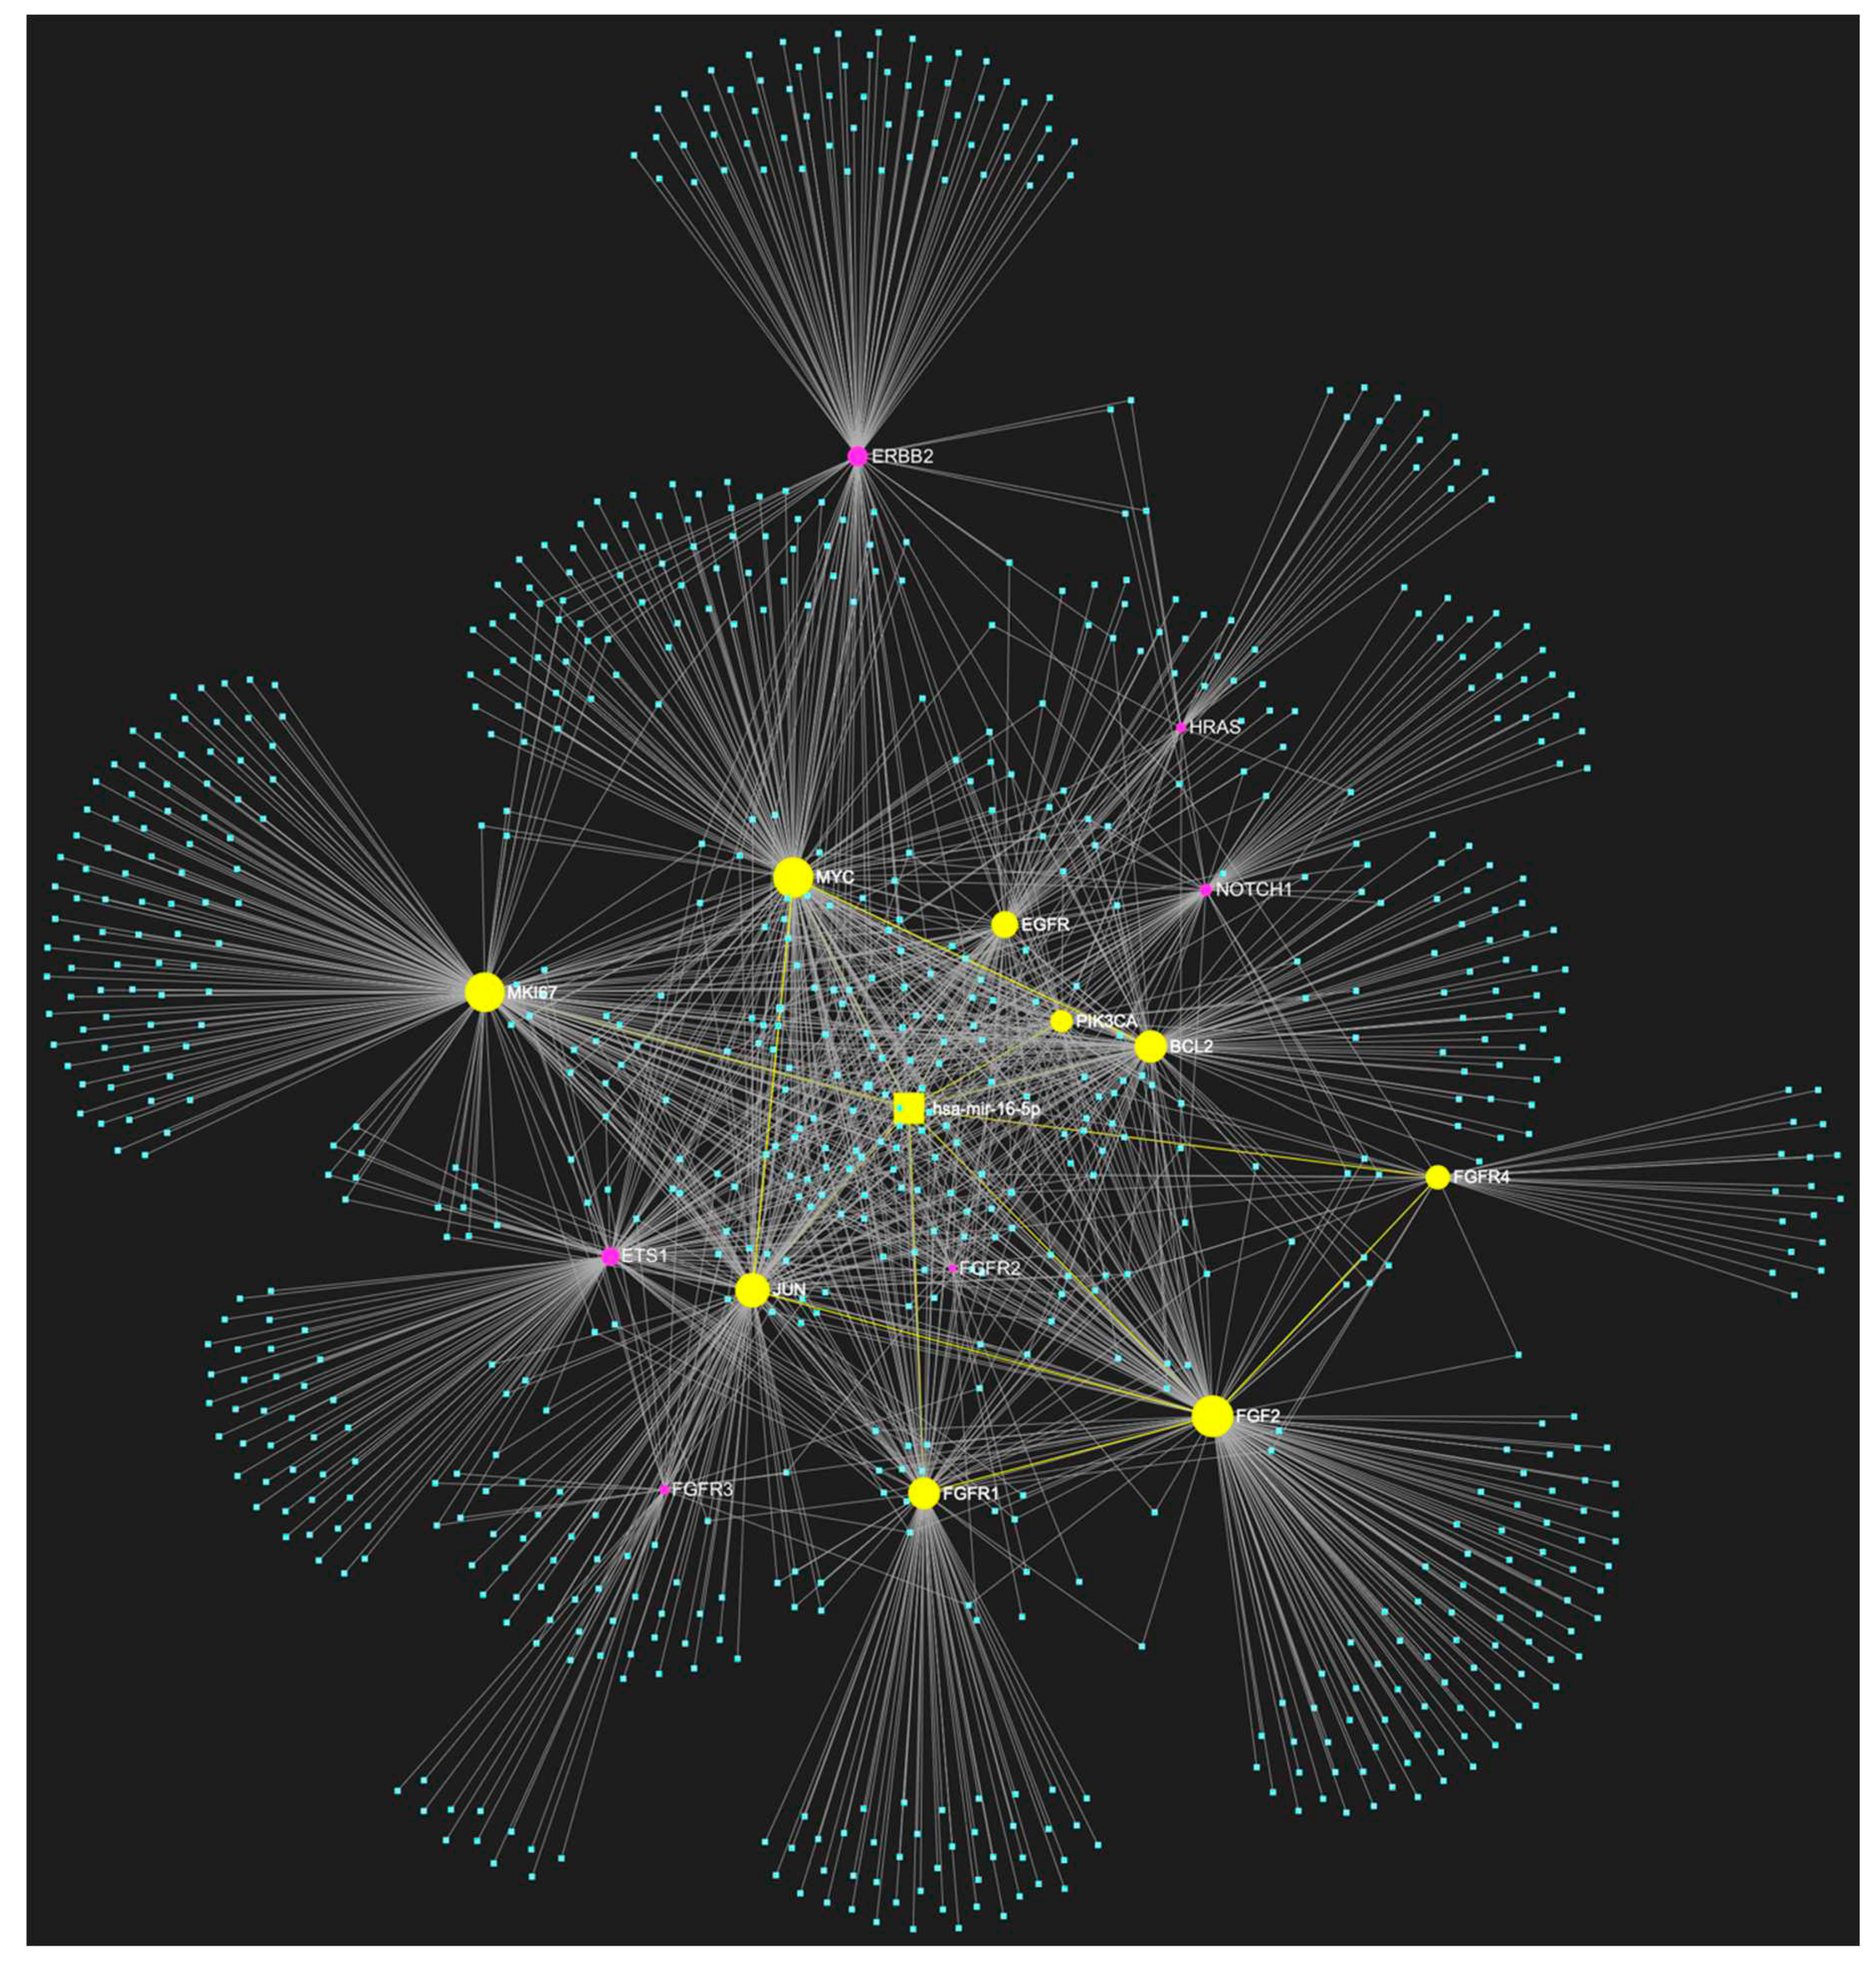

| ↑ miRNA | Sample Source | ↑ miRNA | Sample Source |
|---|---|---|---|
| let-7a-3p | Tissue [17] | miR-222 | Tissue, Cell lines [17,19,72] |
| let-7i | Tissue [17] | miR-223 | Tissue, Plasma, Serum [17,18,77] |
| miR-106b | Cell lines [17] | miR-24-3p | Tissue, Saliva, Plasma, Serum [14,17,18,75,98,107] |
| miR-10a | Tissue, Cell lines [77,106] | miR-25 | Serum [17] |
| miR-10b | Tissue, Cell lines, Plasma [14,77] | miR-26a | Tissue, Cell lines [19] |
| miR-117 | Tissue, Cell lines [19] | miR-26a | Tissue, Cell lines [77] |
| miR-118 | Tissue, Cell lines [19] | miR-27 | Tissue, Cell lines [77] |
| MiR-1246 | Tissue, Cell lines, Salivary exosomes [17,77,107] | miR-27a | Tissue, Cell lines [18,72,73] |
| miR-1250 | Saliva [18] | miR-27b | Tisuue, Cell lines, Saliva [107] |
| miR-1269a | Tissue, Cell lines [19] | miR-29b | Tissue, Cell lines [17] |
| miR-127 | Tissue [17] | miR-31-5p | Tissue, Cell lines, Saliva, Plasma [14,18,72,75,77,88,98,106,107] |
| miR-1275 | Tissue [17] | miR-3162 | Whole blood [18] |
| miR-128a | Cell lines [17] | miR-323-5p | Saliva [18] |
| miR-130b | Tissue, Cell lines [19] | miR-34a | Salivary exosomes [98] |
| MiR-134 | Tissue, Plasma [17,72,77] | miR-34b | Tissue, Cell lines [19] |
| miR-135 | Tissue, Cell lines [19] | miR-34c | Tissue, Cell lines [19] |
| miR-135b-5p | Tissue [17] | miR-3651 | Tissue, Whole blood [18,77] |
| miR-136 | Saliva [18] | miR-372 | Tissue, Cell lines [72,77] |
| miR-142 | Tissue [17,19] | miR-373 | Tissue, Cell lines [72,77] |
| miR-143 | Tissue, Cell lines [19] | miR-412-3p | Saliva [98] |
| miR-143 | Tissue, Cell lines [106] | miR-412-3p | Saliva [18] |
| miR-144 | Tissue [17] | miR-423 | Tissue, Cell lines [19] |
| miR-145 | Saliva [98] | miR-423-3p | Tissue, Plasma [18,19] |
| MiR-146a-5p | Tissue, Saliva, Plasma [17,72,73,75,107] | miR-424 | Tissue, Cell lines [77] |
| miR-146b | Tissue [17] | miR-4484 | Salivary exosomes [98] |
| miR-147 | Saliva [18] | miR-450a | Tissue, Cell lines [77] |
| miR-148a | Tissue, Saliva [18,19] | miR-451 | Tumor, Saliva, Serum [17] |
| miR-148b | Cell lines [17] | MiR-4513 | Cell lines [73,77] |
| miR-150-5p | Tissue, Plasma [18,19] | miR-455-5p | Tissue [17,77] |
| MiR-155-5p | Tissue, Cell lines [18,72,73,75] | miR-483 | Saliva [18] |
| MiR-15b | Tissue, Cell lines [17] | miR-483-5p | Serum [18] |
| miR-181 | Tissue, Plasma [14,18] | miR-483-5p | Plasma, Serum [17] |
| miR-181a | Plasma [18] | miR-494 | Tissue, Saliva, Whole blood [18,77] |
| miR-181b | Plasma [18] | miR-497 | Tissue [17] |
| miR-182-5p | Tissue [75] | miR-503 | Saliva [18] |
| MiR-183 | Cell lines [73] | miR-5100 | Tissue, Serum [18,77] |
| miR-184 | Saliva, Plasma [14,18,98] | miR-512-3p | Saliva [18] |
| miR-187 | Plasma [18] | miR-542 | Tissue, Cell lines [19] |
| miR-18a-5p | Tissue, Cell lines [77] | miR-543 | Tissue, Cell lines [77] |
| miR-191 | Whole blood [18] | miR-582-5p | Cell lines [17] |
| miR-196a-3p | Plasma [96] | MiR-626 | Tissue, Cell lines, Serum [18,73] |
| miR-196a-5p | Saliva, Plasma [18,72,75,88] | miR-632 | Saliva [18] |
| MiR-196b | Tissue, Cell lines, Saliva [72,88] | miR-646 | Saliva [18] |
| miR-196b | Plasma [18] | miR-650 | Tissue, Cell lines [77] |
| miR-200b-3p | Plasma [18] | miR-654 | Tissue, Cell lines [77] |
| miR-21-3p | Tissue [17,77] | miR-668 | Saliva [18] |
| miR-21-5p | Tissue, Cell lines, Saliva, Whole blood Plasma, Serum [17,18,19,73,75,77,88,96,98,107] | MiR-7975 | Salivary exosomes [107] |
| miR-210 | Whole blood [18] | miR-877 | Saliva [18] |
| MiR-211 | Tissue [14,72,75] | miR-877-5p | Saliva [17] |
| miR-214 | Tissue, Cell lines [17] | miR-92b | Serum [18] |
| MiR-218 | Tissue [72,77] | miR-93 | Saliva [98] |
| miR-220a | Saliva [18] | MiR-96-5p | Tissue [75] |
| miR-221 | Tissue, Cell lines [17,19] |
| ↓ MiRNA | Sample Source | ↓ MiRNA | Sample Source |
|---|---|---|---|
| let-7a-5p | Tissue, Cell lines, Saliva [17,72,88] | miR-23b-3p | Tissue [17,75,77] |
| miR-107 | Tissue, Cell lines, Saliva [17,98] | miR-26a | Tissue, Cell lines, Saliva [17,72,98] |
| let-7c | Tissue, Saliva [72,107] | miR-26b | Cell lines [17] |
| let-7c-5p | Tissue [17] | miR-27a-3p | Tissue, Cell lines [17] |
| let-7d | Tissue, Cell lines, Saliva, Whole blood, Serum [17,18,72,75] | miR-27b | Tissue, Saliva, Plasma [17,75,88,98] |
| let-7e | Tissue, Cell lines [72] | miR-299 | Tissue, Cell lines [77] |
| let-7f | Tissue, Cell lines [17,72] | miR-29a-3p | Tissue, Serum [17,18,73,75] |
| miR-1-3p | Tissue, Cell lines [17,73,75,77] | miR-29b-3p | Tissue, Cell lines [17,73] |
| miR-100 | Tissue, Saliva [17,107] | miR-29c | Tissue, Cell lines [17] |
| miR-101 | Tissue, Cell lines [73,77] | miR-30a-5p | Plasma [18] |
| miR-106a | Tissue, Cell lines [77] | miR-320 | Tissue, Cell lines [77] |
| miR-107 | Tissue, Cell lines [77] | miR-320a | Saliva [18] |
| miR-10a | Tissue, Cell lines [17] | miR-338-3p | Serum [18] |
| miR-124-3p | Tissue, Cell lines, Saliva [17,77,88] | miR-340 | Tissue [106] |
| miR-1250 | Saliva [17] | miR-34a-5p | Tissue, Saliva [77,96,98] |
| miR-125a-5p | Tissue, Saliva [14,18,88,107] | miR-375 | Tissue, Cell lines, Saliva [19,72,73,75,77,88,98,107] |
| miR-125b-2-3p | Tissue, Cell lines [17] | miR-376c-3p | Tissue, Cell lines [73] |
| miR-125b-5p | Tissue, Cell lines [17,75,77] | miR-377 | Tissue, Cell lines [77] |
| miR-125b-5p | Tissue [106] | miR-378 | Tissue, Cell lines [73] |
| miR-126 | Tissue, Cell lines [17,77] | miR-4282 | Tissue, Cell lines [73] |
| miR-1271 | Tissue, Cell lines [17] | miR-429 | Tissue, Cell lines [17,77] |
| miR-128-3p | Cell lines [17] | miR-433 | Tissue, Cell lines [17] |
| miR-1291 | Tissue [17] | mir-4485 | Tissue [17] |
| miR-133a-3p | Tissue, Cell lines [17,73,75,77] | miR-4488 | Tissue [17] |
| miR-133a-5p | Tissue, Cell lines [17] | miR-4492 | Tissue [17] |
| mir-136 | Saliva [17,88] | miR-4497 | Tissue [17] |
| miR-137 | Tissue, Cell lines [17,72] | miR-4508 | Tissue [17] |
| miR-138-3p | Tissue, Cell lines [17,77] | miR-451 | Tissue, Cell lines, Saliva, Serum [17] |
| miR-138-5p | Tissue, Cell lines [14,17,75,77] | miR-4516 | Tissue [17] |
| miR-139-5p | Tissue, Cell lines, Saliva [17,18,72,73,77,88] | miR-4532 | Tissue [17] |
| miR-141 | Tissue [17] | miR-486 | Tissue, Cell lines [19,73,77] |
| miR-142-3p | Saliva [107] | mir-487-3p | Tissue [73] |
| miR-143 | Tissue, Cell lines [17,72,77] | miR-491-5p | Tissue [75,77] |
| miR-145-5p | Tissue, Cell lines, Saliva [17,18,73,77,88] | miR-494-3p | Cell lines [17] |
| miR-146a-5p | Tissue, Cell lines, Saliva [77,88] | miR-494-5p | Tissue, Cell lines [17] |
| miR-147 | Saliva [17] | miR-495 | Tissue [75,77] |
| miR-148a | Tissue, Saliva, Plasma [17,75] | miR-499 | Tissue [19] |
| miR-149 | Tissue, Cell lines [17,73] | miR-499a | Tissue [17] |
| miR-150-3p | Tissue, Cell lines [17] | miR-503 | Saliva [17] |
| miR-153-3p | Tissue [75] | miR-504 | Tissue [19] |
| miR-16-5p | Tissue, Cell lines [73,77] | miR-506 | Tissue [17] |
| miR-17-5p | Tissue, Cell lines [73,75,77] | miR-519d | Tissue [75,96] |
| miR-181a-5p | Tissue, Cell lines, Plasma [75,77] | miR-542-3p | Tissue [17] |
| miR-184 | Tissue, Cell lines [72] | miR-545 | Tissue [75,77] |
| miR-186 | Tissue, Cell lines, Whole blood [18,73,77] | miR-585 | Cell lines [17] |
| miR-188 | Tissue, Cell lines [77] | miR-6087 | Tissue [17] |
| miR-195 | Tissue, Cell lines [73,77] | miR-617 | Cell lines [73] |
| miR-196-5p | Tissue [96] | miR-632 | Saliva [17] |
| miR-196a-5p | Tissue, Cell lines [19] | miR-646 | Saliva [17] |
| miR-198 | Cell lines [73] | miR-6510-3p | Tissue [17] |
| miR-199 | Tissue [19] | miR-655 | Tissue, Cell lines [77] |
| miR-199a-5p | Tissue, Cell lines [73,77] | miR-668 | Saliva [17] |
| miR-200a | Saliva, Salivary exosomes [14,18,88,98,107] | miR-675 | Tissue, Cell lines [17] |
| miR-200c | Tissue, Cell lines [77] | miR-7 | Saliva [98] |
| miR-203 | Cell lines [73,77] | miR-758 | Saliva, Serum [18] |
| miR-204-5p | Tissue, Cell lines [77] | miR-769-5p | Plasma [18] |
| miR-205-5p | Tissue, Saliva [75,77,88] | miR-7704 | Tissue [17] |
| miR-214 | Tissue [19] | miR-874 | Cell lines [17] |
| miR-216a | Tissue, Cell lines [17] | miR-877-5p | Saliva [17] |
| miR-218 | Tissue, Cell lines, Saliva [17,77,98,106] | miR-9 | Tissue, Cell lines, Serum [18,73] |
| miR-22 | Tissue, Cell lines [77] | miR-9 | Tissue, Cell lines [77] |
| miR-22-3p | Tissue, Cell lines [17,73] | miR-92a-3p | Saliva [88] |
| miR-220a | Saliva [17] | miR-92b | Tissue [19] |
| miR-221 | Tissue, Cell lines [77] | miR-93 | Saliva [107] |
| miR-223 | Serum [18] | miR-98 | Tissue, Cell lines [77] |
| miR-23a-3p | Tissue, Cell lines [77] | miR-99a-5p | Tissue, Cell lines, Saliva, Serum [18,72,77,107] |
| miRNA | Reported Expression in OSCC | Predicted Target OSCC-associated tumor suppressor genes (5) | Target score |
|---|---|---|---|
| hsa-miR-155-5p | ↑ | TP53, CDKN2A, FAT1, CASP8, PTEN | 5/5 |
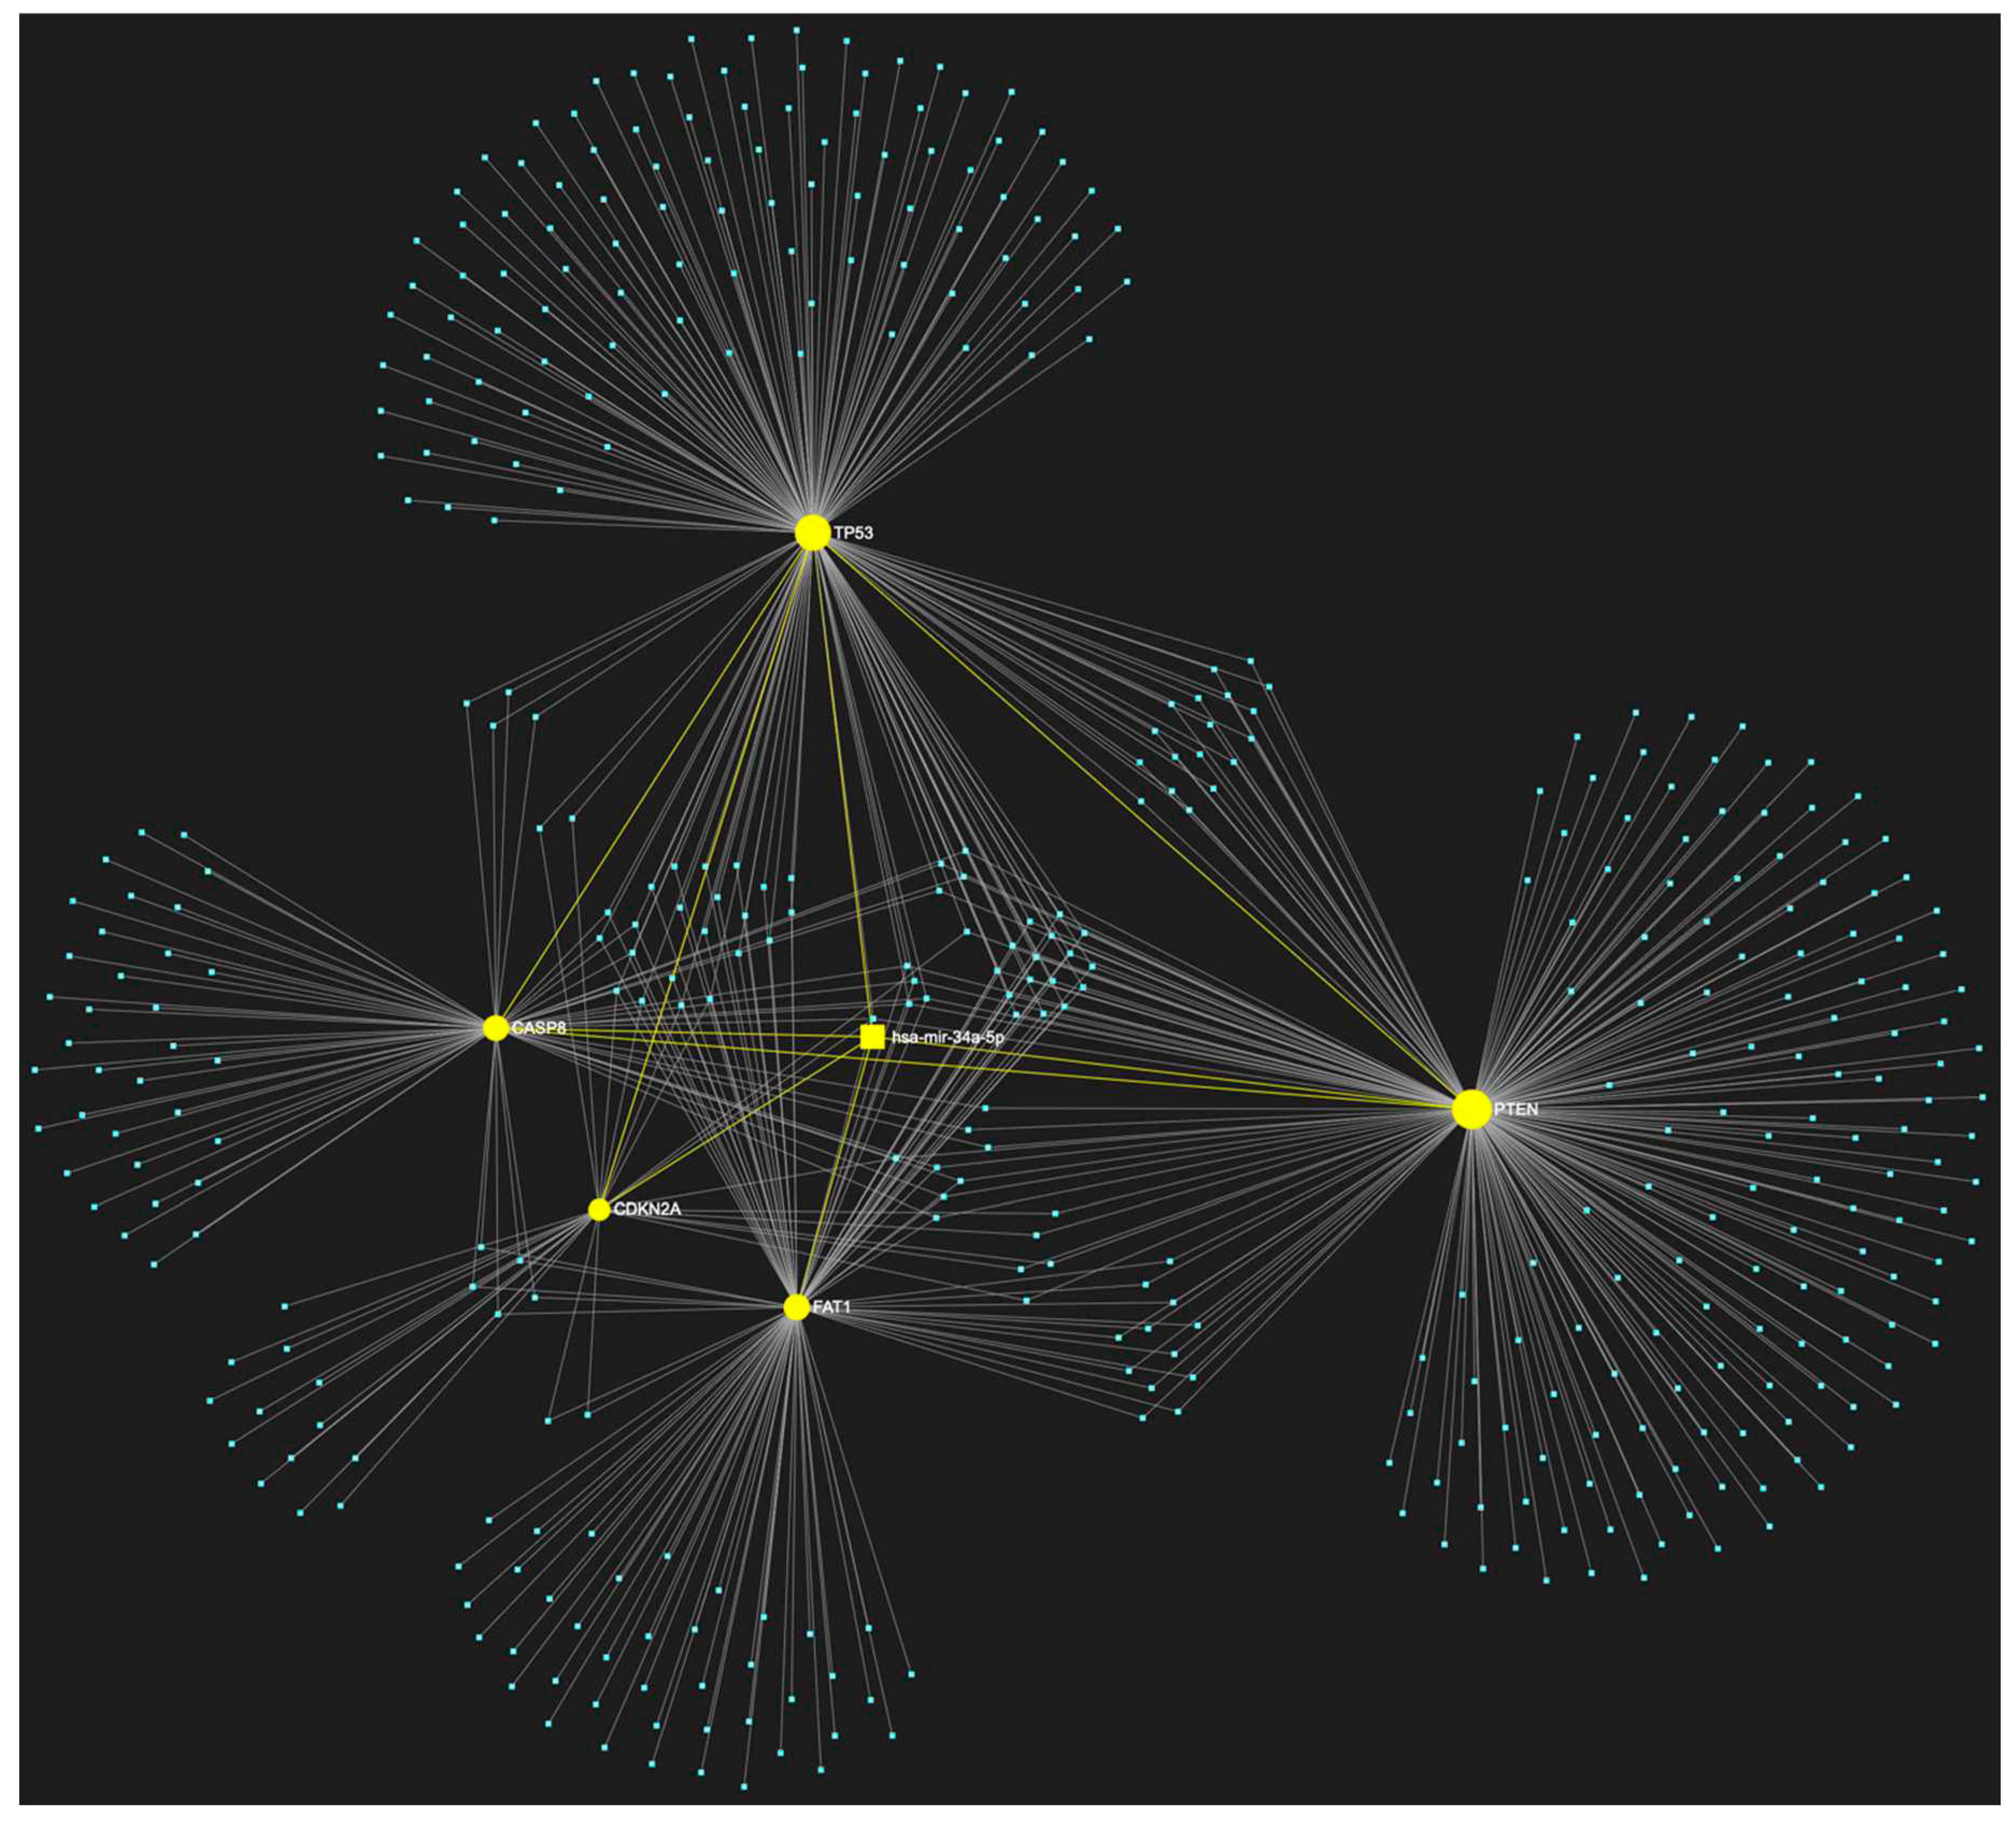
| hsa-miR-34a-5p | ↑ (rarely) | TP53, CDKN2A, FAT1, CASP8, PTEN | 5/5 |
| miRNA | Reported Expression in OSCC | Predicted Target OSCC-associated oncogenes (15) | Target score |
| hsa-miR-34a-5p | ↓ (mostly) | NOTCH1, HRAS, PIK3CA, EGFR, ERBB2, FGFR1, FGFR2, FGFR3, FGFR4, FGF2, ETS1, JUN, MKI67, MYC, BCL2 | 15/15 |
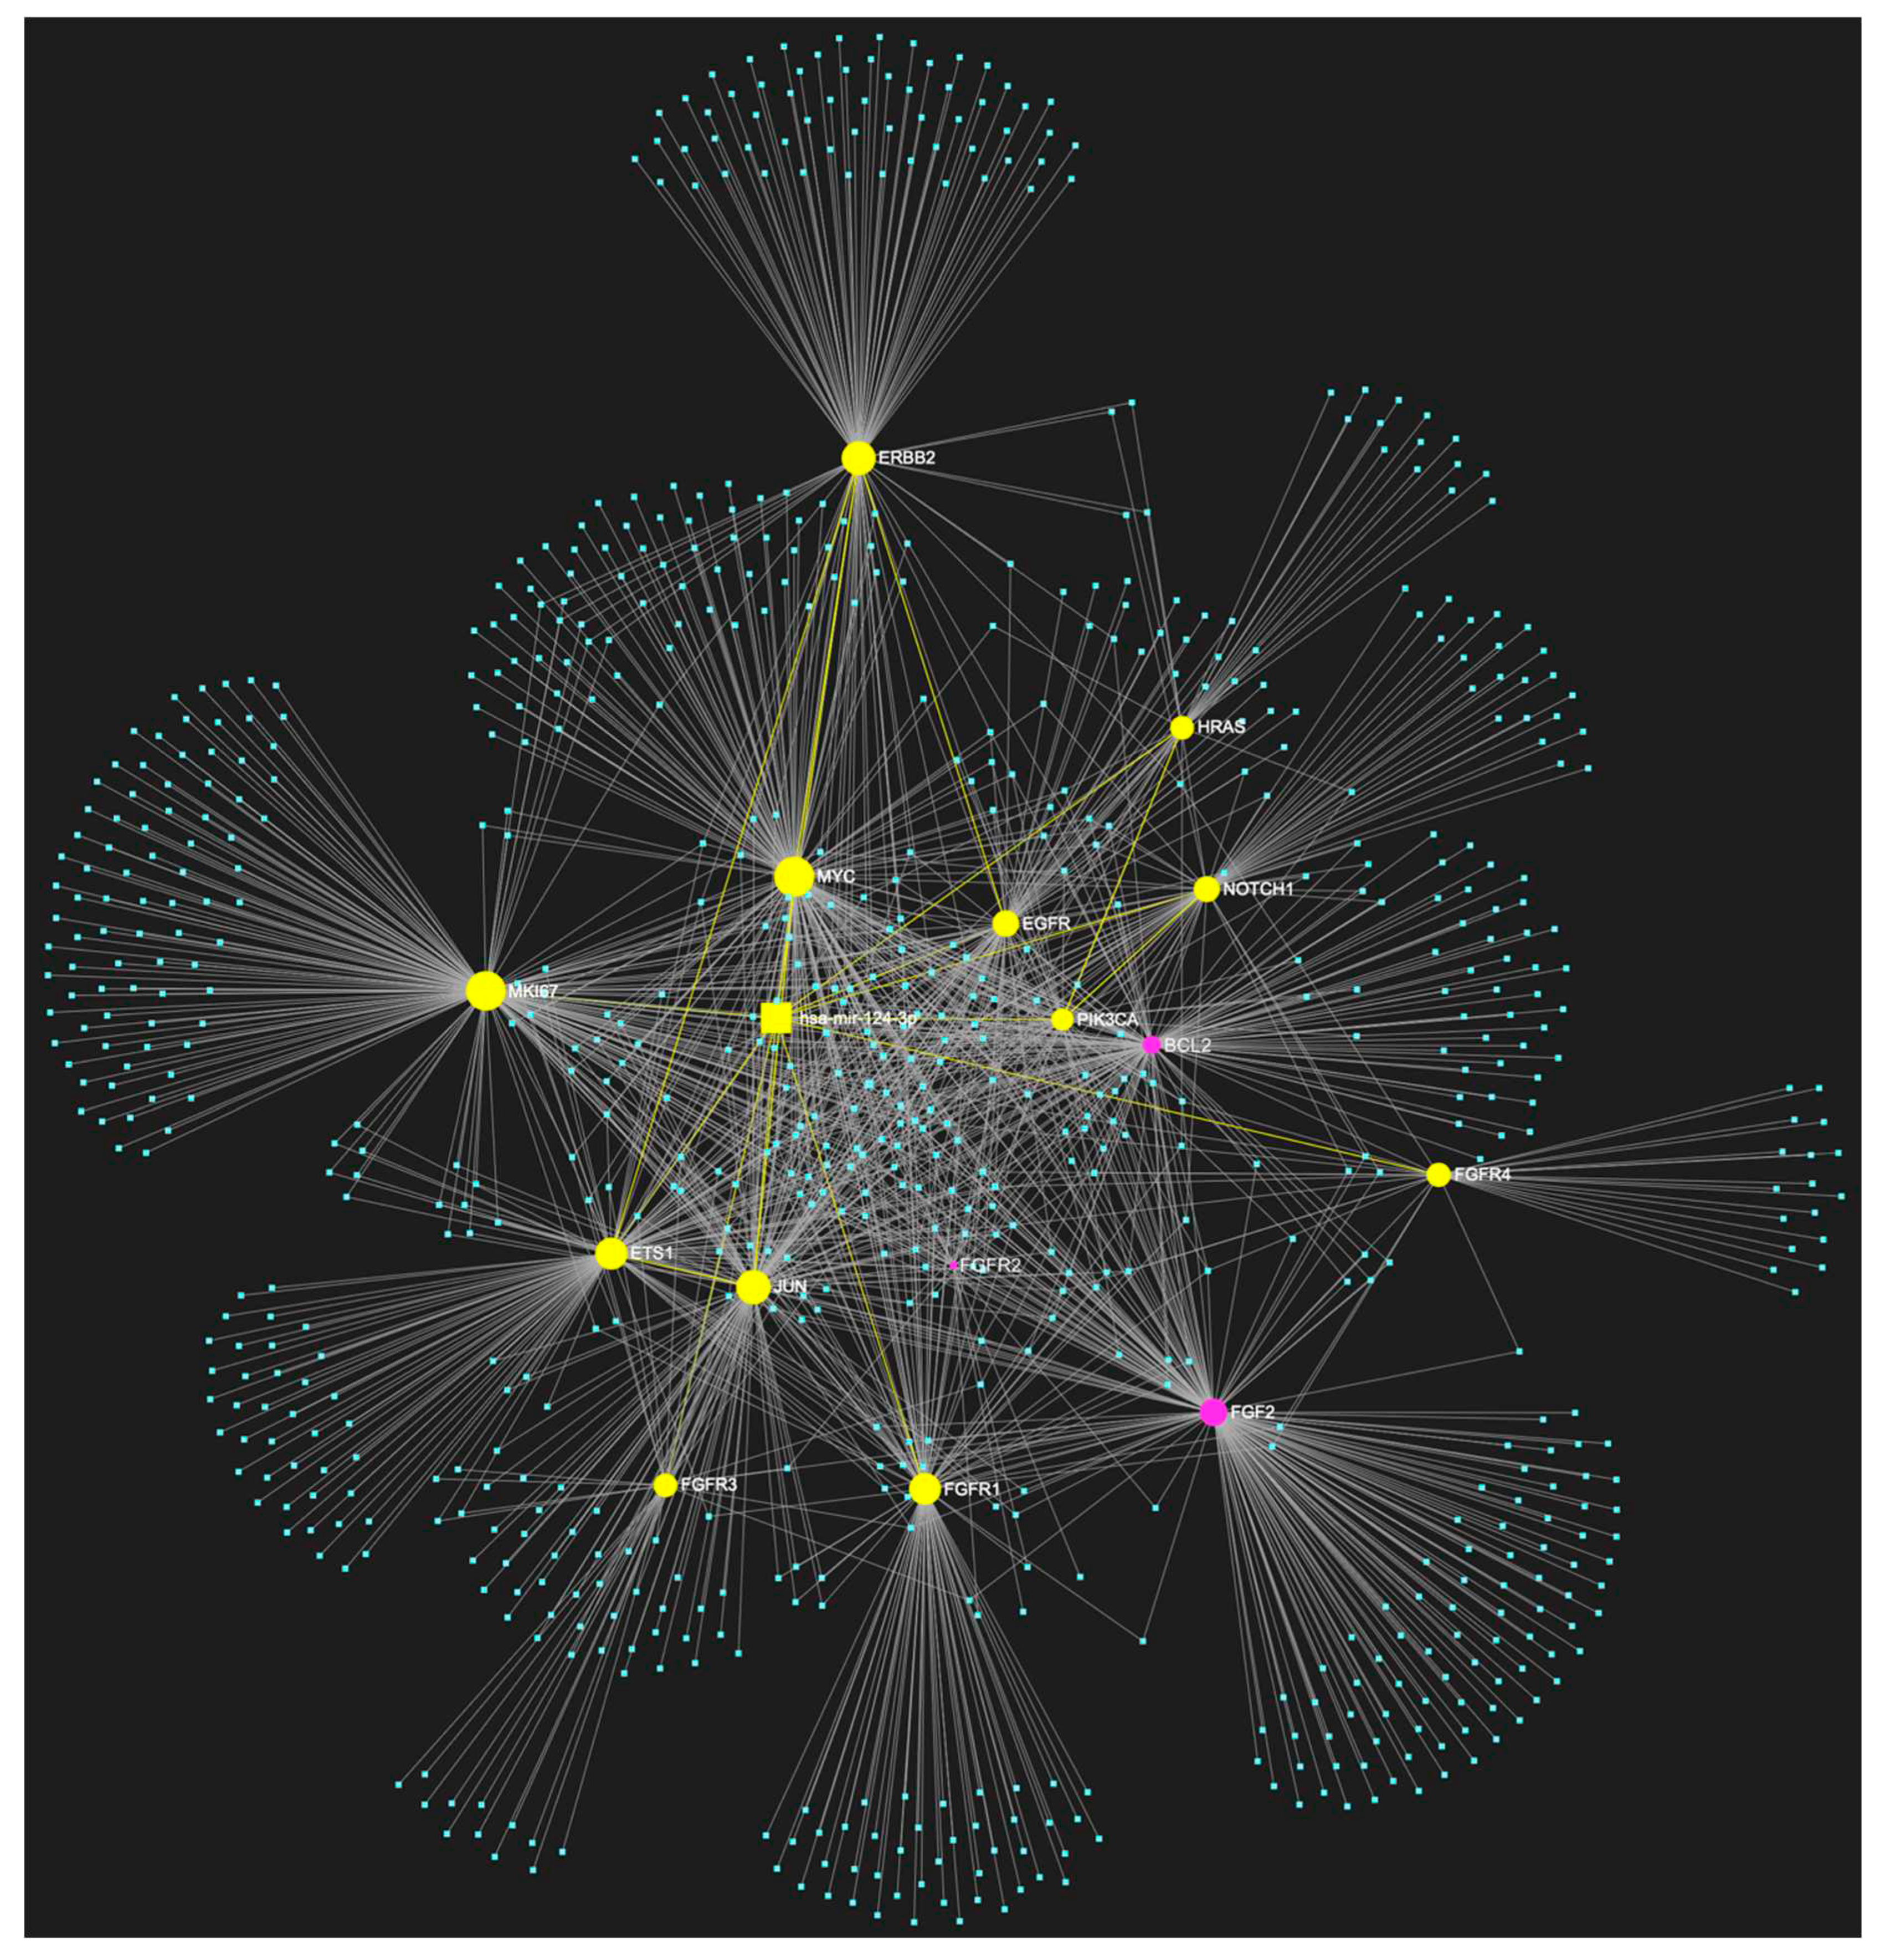
| hsa-miR-124-3p | ↓ | NOTCH1, HRAS, PIK3CA, EGFR, ERBB2, FGFR1, FGFR2, FGFR3, FGFR4, FGF2, ETS1, JUN, MKI67, MYC, BCL2 | 12/15 |
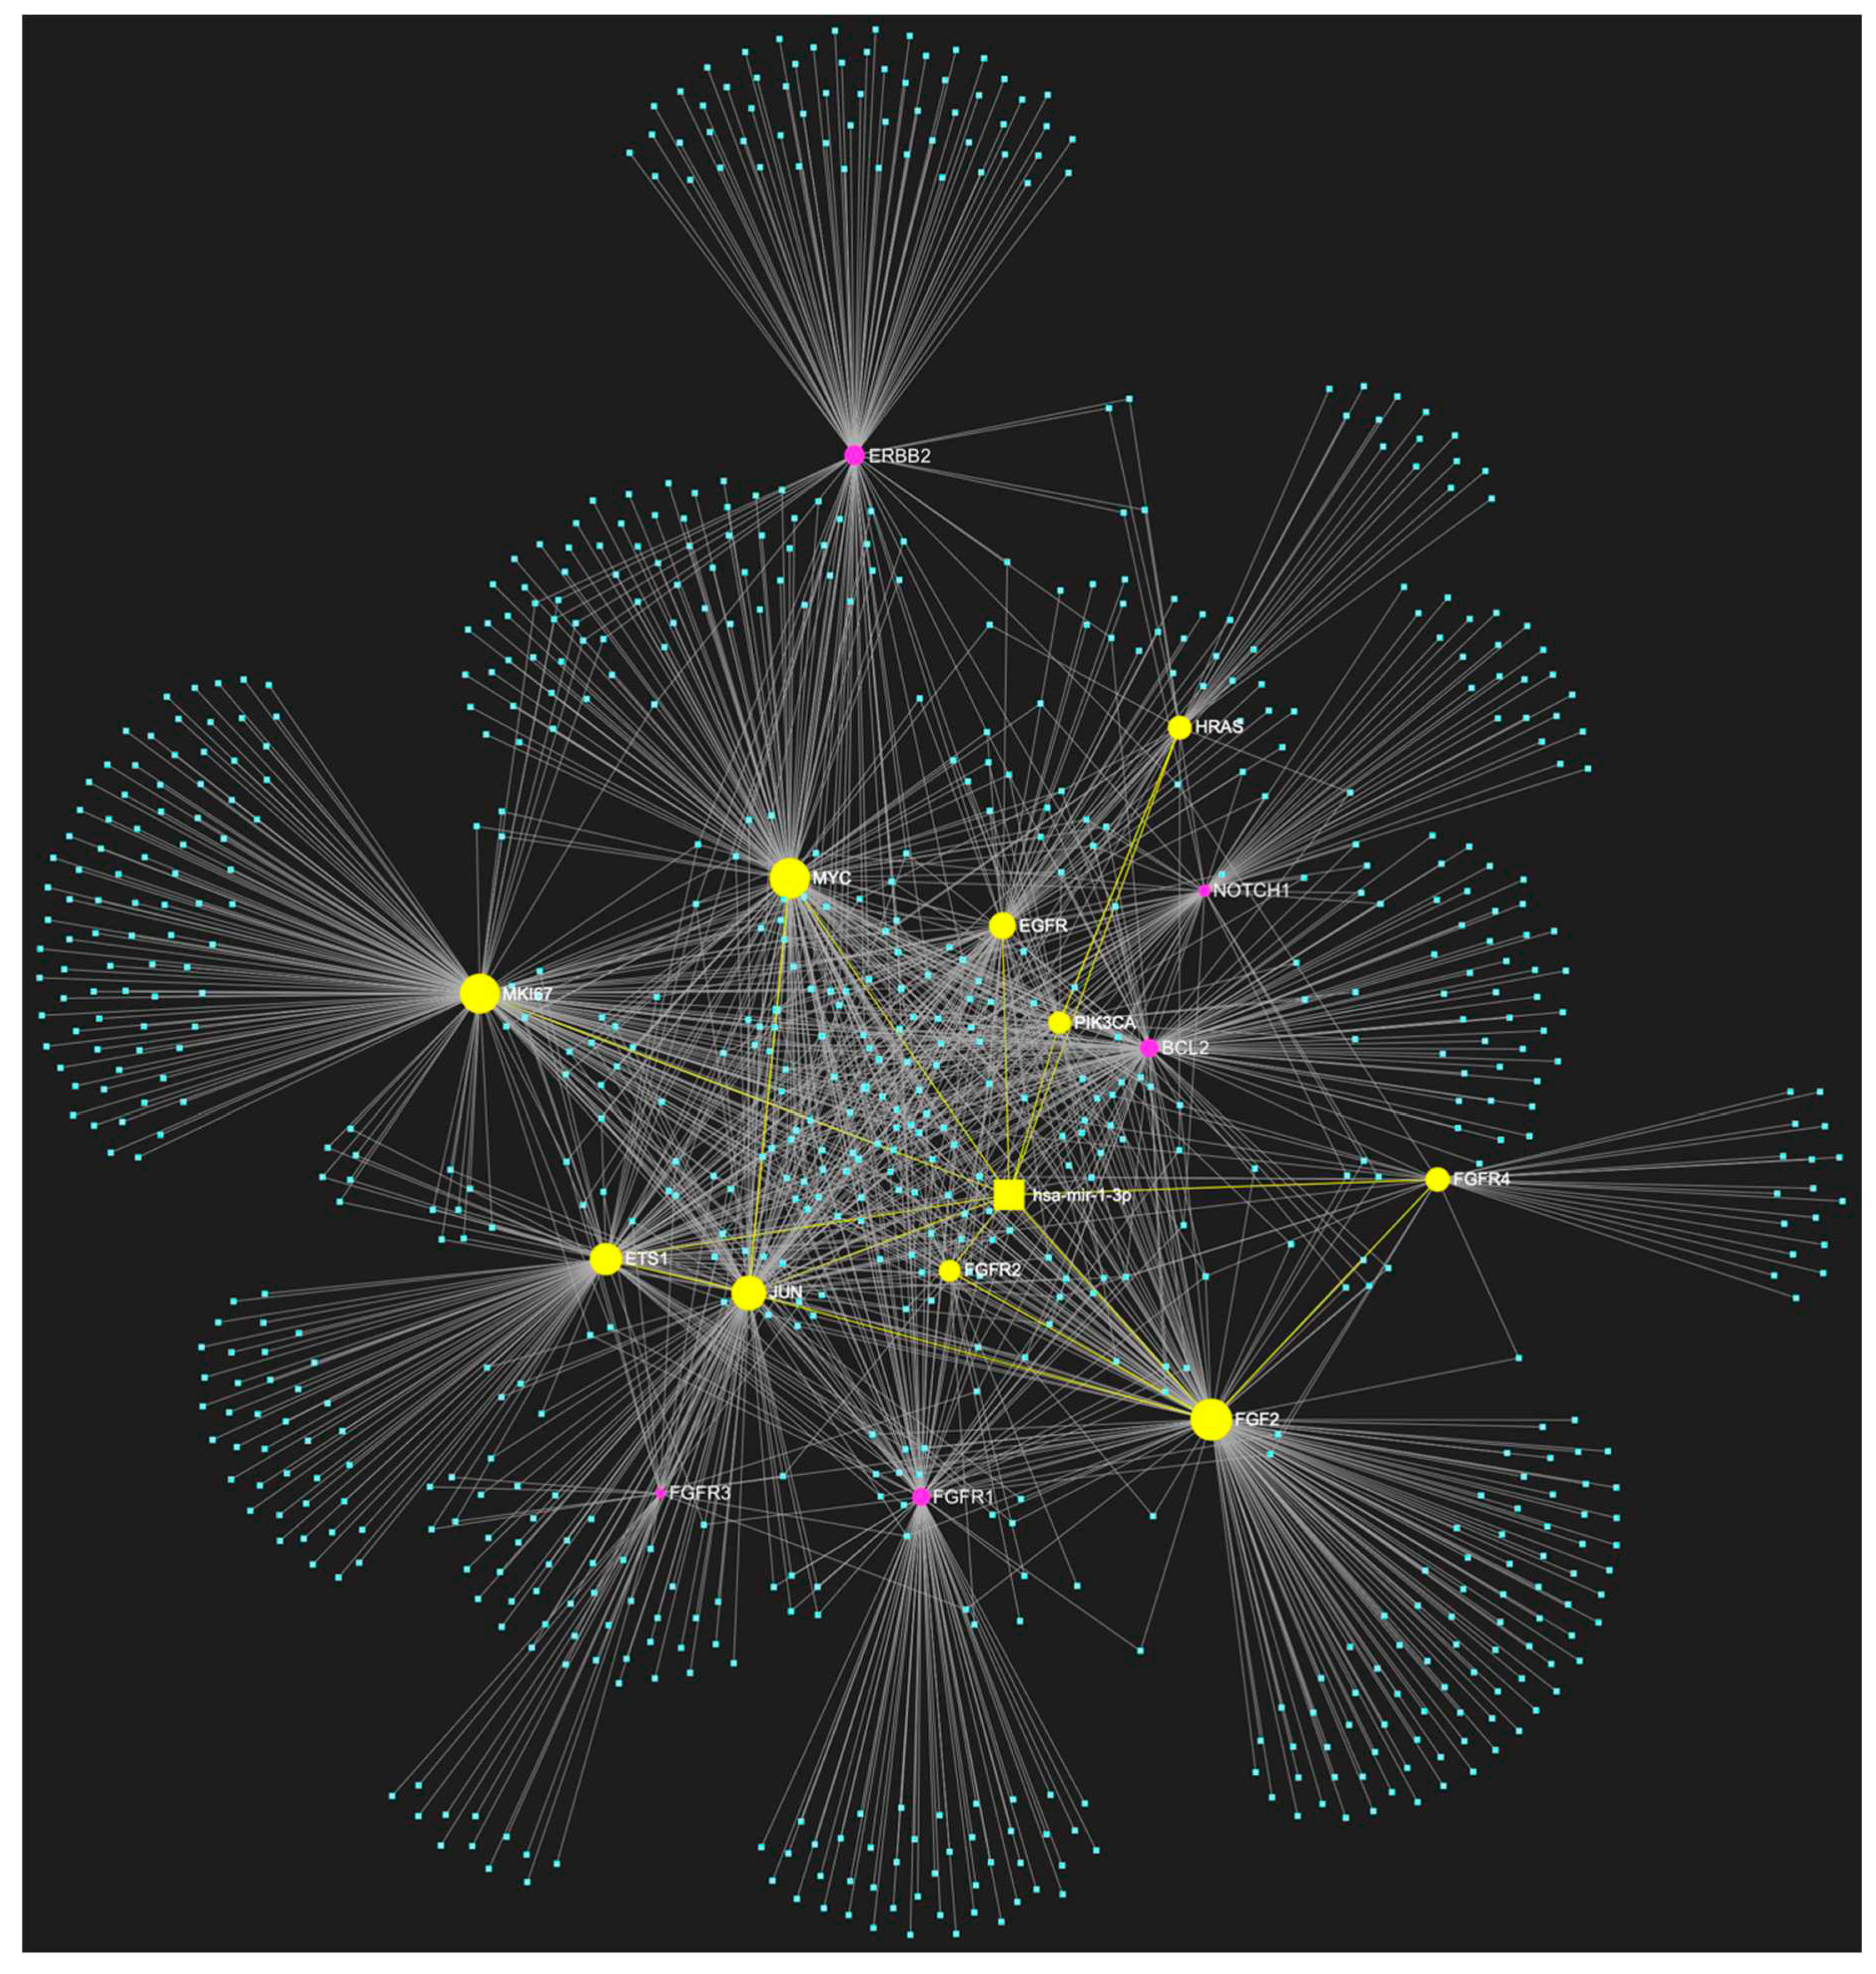
| hsa-miR-1-3p | ↓ | NOTCH1, HRAS, PIK3CA, EGFR, ERBB2, FGFR1, FGFR2, FGFR3, FGFR4, FGF2, ETS1, JUN, MKI67, MYC, BCL2 | 10/15 |
| hsa-miR-16-5p | ↓ | NOTCH1, HRAS, PIK3CA, EGFR, ERBB2, FGFR1, FGFR2, FGFR3, FGFR4, FGF2, ETS1, JUN, MKI67, MYC, BCL2 | 9/15 |
Disclaimer/Publisher’s Note: The statements, opinions and data contained in all publications are solely those of the individual author(s) and contributor(s) and not of MDPI and/or the editor(s). MDPI and/or the editor(s) disclaim responsibility for any injury to people or property resulting from any ideas, methods, instructions or products referred to in the content. |
© 2023 by the authors. Licensee MDPI, Basel, Switzerland. This article is an open access article distributed under the terms and conditions of the Creative Commons Attribution (CC BY) license (https://creativecommons.org/licenses/by/4.0/).


