Preprint
Article

Functional and Species Diversity across Disturbance Levels and Environmental Variables in Yayu Coffee Forest Biosphere Reserve, Southwest Ethiopia

Altmetrics

Downloads

244

Views

87

Comments

0

Submitted:

10 July 2023

Posted:

11 July 2023

You are already at the latest version

Alerts
Abstract
In many previous studies, the conclusions for the effects of disturbance and environmental gradients on the diversity was remain controversial due to exclusions of trait-based diversity in their methodology. This study hypothesized trait-based indices are more likely to show monotonic and predictable relations than traditional based species diversity to guide effective restoration of tree species diversity against environmental change and anthropogenic factors. This study therefore, was initiated to access trait based functional diversity of Yayu Coffee Forest Biosphere Reserve (YCFBR), Southwest Ethiopia. Data was collected from 90 proportionally distributed plots along disturbance levels from core, buffer and transitional zones. For functional trait diversity estimation, traits relevant to plant-life strategy, competition and response to disturbances and climate change were selected. Multiple regression model was used to test the response of species diversity and functional diversity to disturbance and environmental gradients. The result revealed that, anthropogenic disturbance and elevational gradients are the most important factors influencing functional diversity in the YCFBR. Overall this study demonstrates that, trait based functional diversity is useful to predict adaptation potentials of species in heterogeneous environments. Species with low specific leaf area & selective seed mass is recommended for the restoration of disturbed ecosystem.
Keywords: 
Subject: Biology and Life Sciences  -   Forestry

1. Introduction

Tropical forest ecosystems host the richest terrestrial biodiversity and provide local, regional and global benefits [1]. Tropical forests are also the most biodiverse ecosystems in the world, yet their functioning is threatened by anthropogenic disturbances and climate change [2]. From the total earth’s surface 31 % is covered by forests which is approximately 4.06 billion hectares [3]. More than 420 million ha of forest were lost globally in the period between 1990– 2020 because of deforestation, and more than 90% of that loss took place in tropical areas and about 2,400 trees are cut down each minute as indicated in the report of the Global Forest Resources Assessment. For 2015 to 2020 tropical deforestation rate was estimated at 10.2 Mha yr−1 and the loss is expected to significantly contribute to an increase of greenhouse gases in the atmosphere, resulting in accelerated global warming [3]. Biodiversity loss continues apace at regional or global scales across a wide range of ecosystems, due to increasing intensity of disturbances, such as overexploitation of species, destruction of habitats and climate change [4,5]. Following this, much attention has been paid in recent years to the massive loss of ecosystem services and biodiversity worldwide due to forest clearance. This is due to the importance that these ecosystems have with regards to global climate change, biodiversity loss and ecosystem services [6]. This rapid environmental changes are putting species at risk, and such changes in species composition can have strong effect on ecosystem processes and functions [7].
Ethiopia has diverse climate of various ecological regions and novel habitats with different topography have driven the establishment of diverse vegetation, which range from afroalpine vegetation to semi-arid and arid vegetation type [8]. Among these, Moist afromontane forest of Ethiopia is mainly found in the Southwest escarpment of Ethiopia [9], where most of the country’s Biosphere reserves (Yayu, Kafa, Sheka and Majang) are located and known as “Ethiopia’s green lungs” [10]. Moist afromontane forests of the Southwestern Ethiopia are the most biodiversity and carbon rich biomes in Ethiopia [11,12] playing an important in climate change mitigation [13]. However, this forest is under threat from expansion of coffee cultivation, agriculture expansion, overgrazing, firewood collection, and charcoal production [14]. Similarly in the case of YCFBR, commercial coffee (Coffea arabica) farming is an important economic activity, but can contribute to forest degradation leading to decline in species diversity and ecosystem services [15,16]. The United Nations Educational, Scientific and Cultural Organization (UNESCO) requires research and monitoring activities to be carried out in all biosphere reserves [17]. This is because biosphere reserves should be models for the implementation of mitiga tion and adaptation strategies which address the threats of climate change [16]. As a result, continuous research and monitoring is necessary for managing biosphere reserves for their long-term sustainability.
Generating trait based functional information at local as well as global scales is vital to implement effective restoration of forest ecosystems including forest biosphere reserves [7,18]. Plants have certain characteristics which allow them to respond to various environmental conditions, like changes in climate, water scarcity in the soil, lack of minerals and others. These measurable characteristics of individual species relating to species’ morphological, physiological, or phenological characteristics that influence growth, reproduction, or survival are characterized by plant functional traits [19]. Because these traits mediate species’ responses to environmental changes [20], moreover, these changes point to mechanism alterations in ecosystem functioning and services [18,21]. Studies that combine richness and functional trait analysis are rare but have the potential to provide a more holistic understanding of how environmental gradients impact biodiversity [22]. Furthermore, functional traits capture essential aspects of species’ ecological tradeoffs and roles within an ecosystem, making them useful in determining the ecological consequences of environmental change, however, they have not been used as commonly as more traditional metrics of species diversity.
Plant functional traits are less explored in tropical forests despite covering the substantial area in the world. Also, the relationship between species richness and functional richness was not examined yet. In many previous studies the conclusions for the effects of disturbance and environmental gradients on the diversity was remain controversial [20]. Because traditional way of diversity measurements does not give clear conclusions due to exclusions of trait-based diversity measurements in their methodology. Therefore, trait-based diversity measurements is the best methods of diversity metrics in relation to disturbance and environmental gradients to come up with clear policy for biodiversity conservations in different ecosystem. Based on this hypothetic claims, this study was initiated to: 1) examine how the functional diversity metrics respond to anthropogenic disturbance and environmental factors of YCFBR and 2) examine the relationships of functional diversity indices with species richness. In this study it was hypothesized that, disturbance and environmental factors can influence plant composition, growth, and survival.

2. Materials and Methods

2.1. Study Area Descriptions

This study was conducted at Yayu Coffee Forest Biosphere Reserve, Southwest Ethiopia which is located at 582 Km in Southwest of Addis Ababa (Figure 1). This biosphere is one of the largest remaining patches of Afromontane Rainforest in the Southwestern part of Ethiopia. The YCFBR was registered in 2010 and it is one of the five UNESCO’s registered biosphere reserves in Ethiopia with the primary objective of maintaining biodiversity and supporting sustainable development [16]. The biosphere covers five districts; namely Yayu, Hurumu, Bilo-Nopa, Dorani, Alge-Sachi and Chora (Figure 1). Geographically, it lies between latitude 8° 0′42″ to 8°44′23″ N and longitude 35°20′31″ to 36°18′20″ E [23]. The total area of YCFBR is about 167,021 hectares and its core, buffer and transitional zones covers 27,733, 21,552, and 117,736 hectares, respectively with altitude ranging between 1240 m and 2400 m above sea level [24]. The soil types of the study area are red or brownish ferrisols derived from volcanic parent material. The prevalence of high rainfall masks other soil-forming factors and other soil groups in the area include nitosols, acrisols, vertisols and cambisols [25].
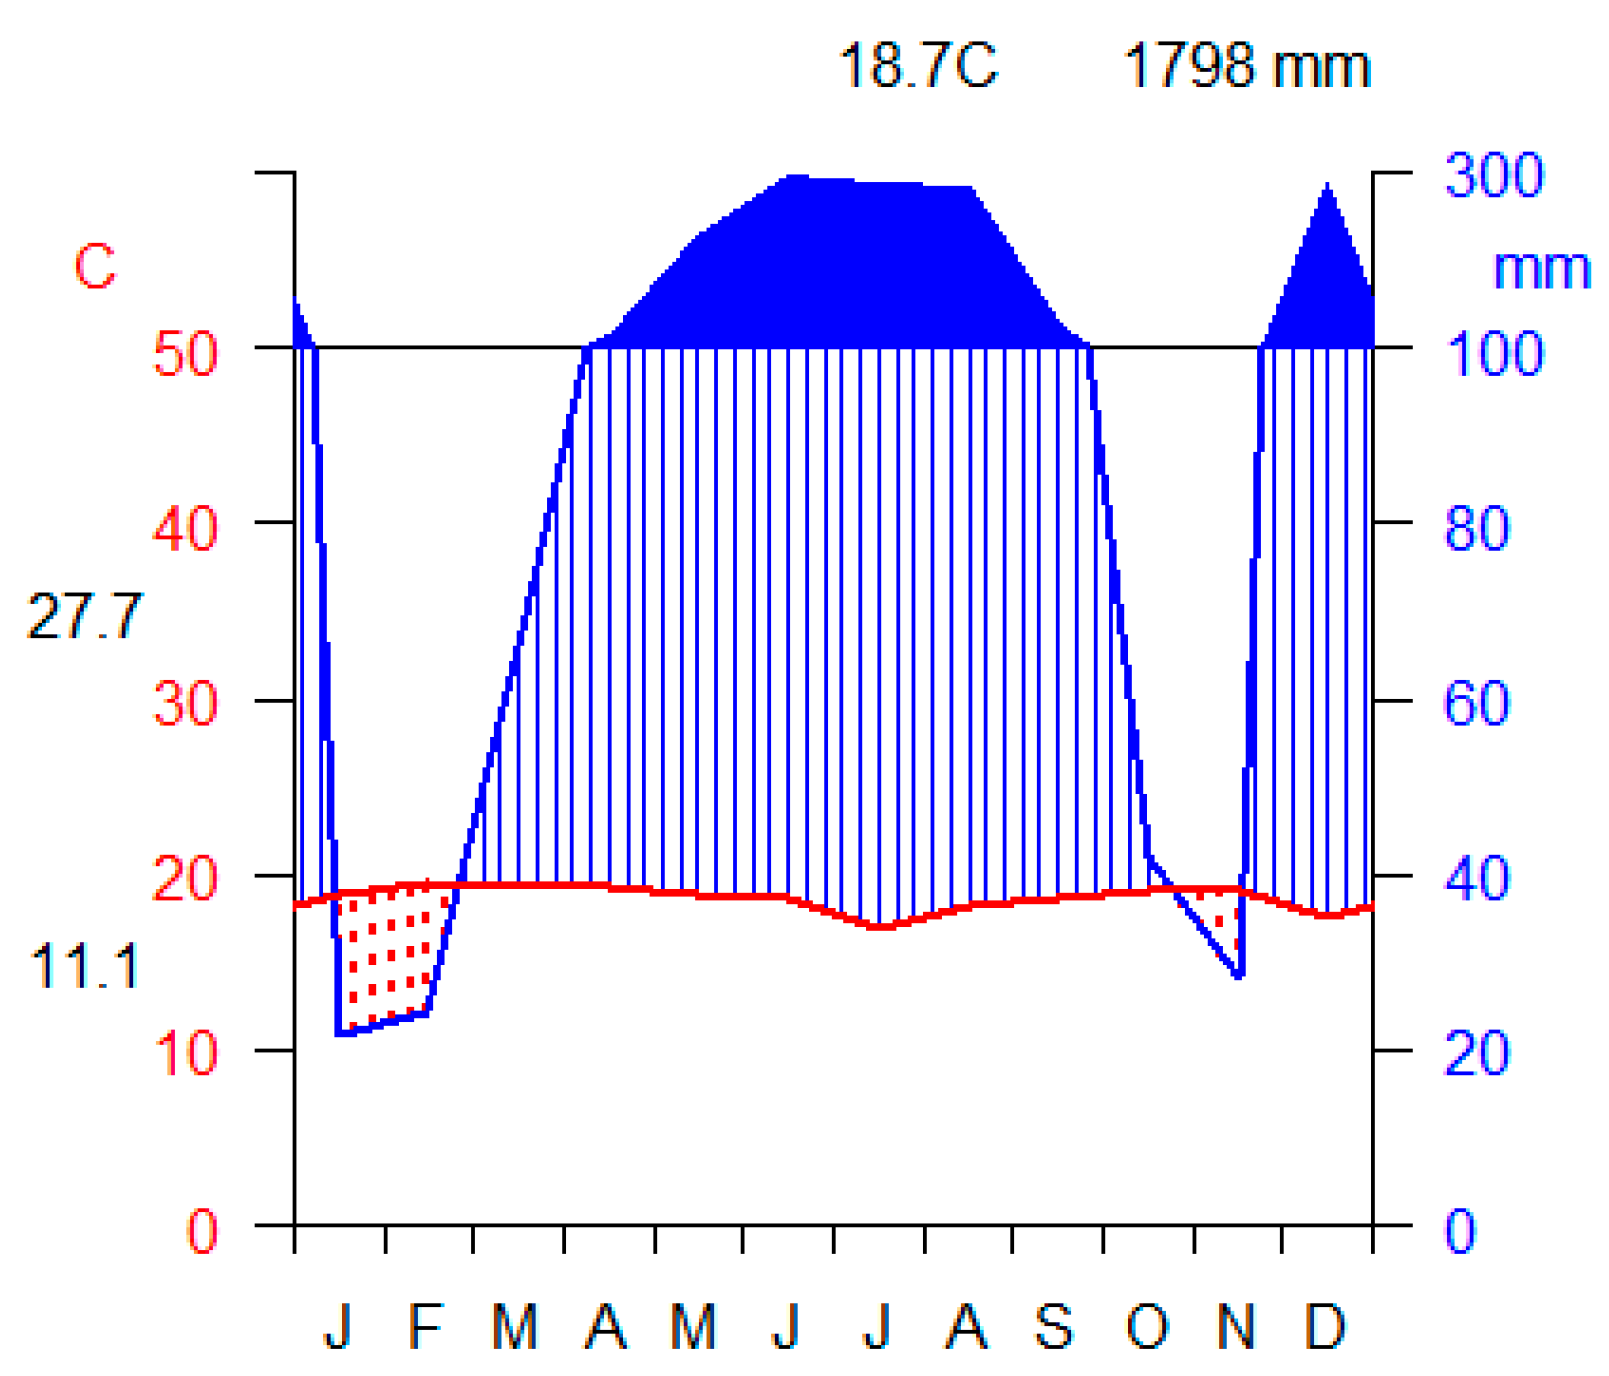
The area receives bimodal rainfall with the mean annual rainfall of 1798 mm per year. Long rainy season for the area is from March to October and short rainy season is from December to January. The mean annual temperature of the study area is 18.70C and mean maximum and mean minimum temperature is 27.70C and 11.10C, respectively (Figure 2). In general, this area is known for its hot and humid climatic condition [16]. Vegetation types of the area is predominantly classified as moist Afromontane forests [8].

2.2. Sampling Design

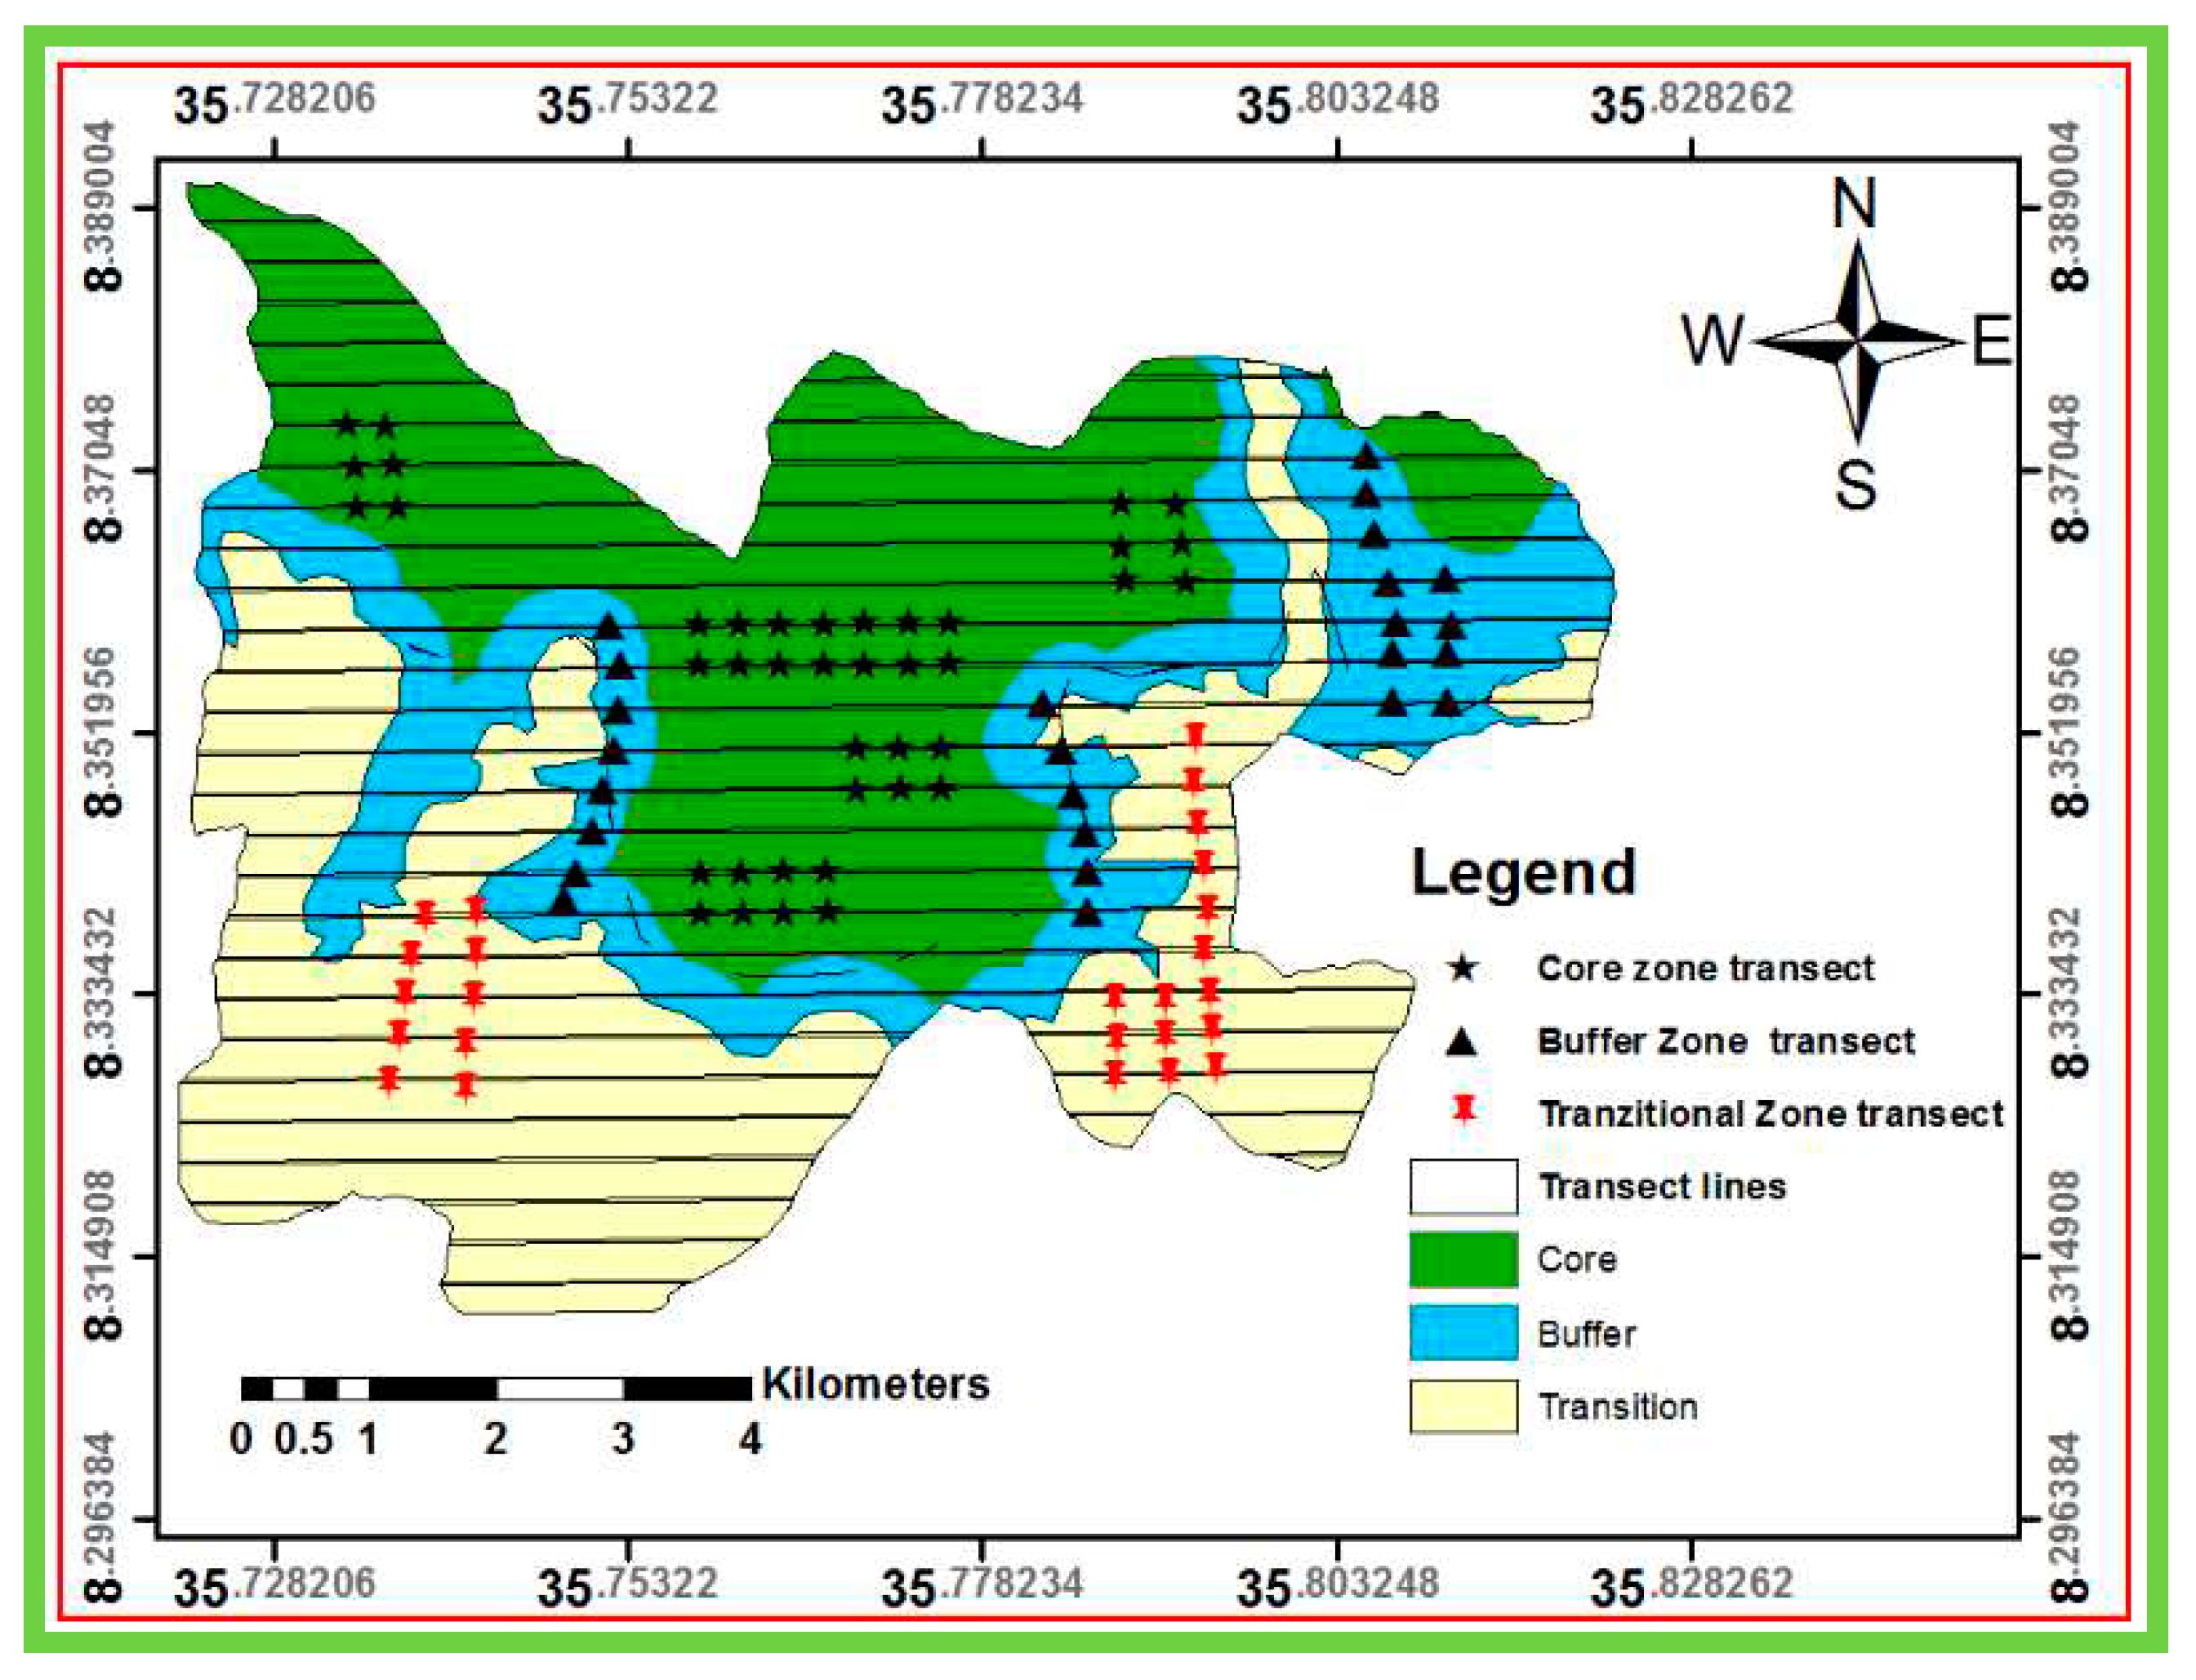
In this study, multistage sampling techniques were employed. At the first stage, stratification of the biosphere reserve in to core zone, buffer, and transitional zones was done to ensure the representation of the three zones in the sampling [26,27]. At the second stage, Yayu and Hurumu districts were selected purposively because the two districts contain three zones unlike the other districts [16,27]. At the third stage, Wabo and Gaba kebeles were selected purposively from Yayu and Hurumu districts, respectively, using the same criteria used for district selection (Figure 3). At the final stage, anthropogenic disturbance and environmental variables such as slope, aspect and elevation were selected to study the relative patterns of woody diversity along anthropogenic disturbance and environmental gradients.
Data was collected using stratified systematic sampling with a random start [28] and this sampling approach also used for this study and representative plots and transects lines that were systematically distributed for the core, buffer and transitional zones. All transect lines were orientated northwards as a rule of thumb (North-South compass direction). Plot size of 20 m × 20 m (400 m2) was used to collect vegetation data from the core and buffer zone, while 30 m x 30 m (900m2) plot size was used for the transitional zone based on expected density of woody species in each zonation. To minimize the influence of border effects, all plots were laid at least 150m away from the nearest roads and the coordinate for the location of plots was recorded [29]. Transect lines and sample plots were laid at 300 m from each other. Then, a total of 90 plots were systematically distributed for the core, buffer, and transitional zones (Figure 3).

2.3. Vegetation Data Collection and Environmental Factors

In each plot, the diameter at breast height (DBH) of trees and shrubs was measured for DBH > 2.5 cm [28,30]. In two perpendicular directions, the DBH was measured at two perpendicular directions and its average value was recorded. When the branching of multi-stemmed individuals occurred below the DBH, each stem was measured separately. Furthermore, all woody lianas with a DBH > 1 cm at 1.30 m from the rooting point was recorded, since this provides a detail assessment of diversity [31]. Here liana is defined as any long-stemmed, woody vine that uses trees or other means for vertical support, whereas shrub is a woody plant that is multi-stemmed at the base of the plant [32]. Whereas for coffee plants, diameter at stump height of all coffee shrubs (height at 40 cm) was measured in two perpendicular directions and the average value was taken. For the case of multi-stemmed coffee plants, all stem in single plant were measured independently and the equivalent diameter (d40cm) of the plant was calculated [31]. Plant identification was carried out both in the field (vernacular names) and in the herbarium. For species which were difficult to identify in the field, plant specimens were sampled, labeled, pressed and transported to the National Herbarium (ETH), Addis Ababa University for further identification and nomenclature of plant taxa was done following flora of Ethiopia and Eritrea [33,34].
The disturbance intensity levels were derived from the relative measurement of major disturbance indicators for each plots following the modified methods [35,36]. Each disturbance data was collected for each plot on the basis of visible signs and measured as: Grazing intensities (if the damage observed is > 50% it is described as high grazing intensity, if the damage observed is 10-50% as medium and if the damage observed is < 10% as low grazing intensity) [37], number of tree stumps (ratio of total stumps to total stems per plot in percentages (%)) [35], and coffee dominance was measured as ratio of number of coffee plants to total number of woody plants in each plots in % [38,39]. Stumps in this study are defined as the remains of the stems of woody plants measuring diameter at stump height 30 cm above ground level (DSH = 30 cm) of ≥ 2 cm after cutting [40]. Then, plots were categorized into four disturbance intensity levels (DIL) based on the percent of each disturbance scored as: relatively undisturbed (< 5 %), slightly disturbed (5-25%), moderately disturbed (25-50 %), and disturbed forest (> 50 %) [35].
Elevation, aspects, slope and geographical location of each plot were recorded. The elevation and aspects were measured using altimeter; whereas, Sunto clinometer was used to measure slope and indexed in to five levels. Then, slope classification was performed based on [41] as: flat (0 %–3 %), gentle (3 %–8 %), moderate (8 %–25 %), hilly (25 %–40 %) and steep (> 40 %). Aspect was also classified in to 8 with sub-directions as North (N) for direction readings between [0-22.50), [337.5-3600), Northwest (NW) if it reads from 22.50 to 67.50, East (E) if it is between 67.5-112.50, Southeast (SE) if it reads between 112.5-157.50, South (S) if the readings is between 157.5-202.50, Southwest (SW) if it is between 202.5-247.50, West (W) if the point is in 247.5-292.50 and Northwest (NW) if it is located between 292.5-337.50 [42].

2.4. Quantification of Functional Diversity and Taxonomic Diversity Indices

Traits relevant to plant-life strategy, competition ability, response to disturbances and climate change were selected for functional diversity estimation [43,44,45]. These were wood density (WD), seed mass (SM), specific leaf area (SLA) and tree maximum height (Hmax) [46]. Data on species WD was obtained from Ethiopia’s Forest Reference Level Submission to the UNFCCC [47] and average value was used when multiple values are available for a single species. When the WD value was missed for a given species, the average genus WD was used. Similarly, mean WD at family level was used in case genus data for WD was missed. Also, when a family WD is missing, a plot level average WD was used [48]. SLA, SM and Hmax were extracted from the TRY database (www.try-db.org) [19]. Functional diversity indices was calculated for the nine functional diversity indices using species traits value and species richness. These are functional diversity based on dendrogram for plot-based (FDp), functional evenness (FEve), functional richness (FRic), functional diversions (FDiv), functional dispersion (FDis), community weight mean of woody density (CWM.WD), community weight mean of specific leaf area (CWM.SLA), community weight mean of maximum heights (CWM.Hmax) and community weight mean of seed mass (CWM.SM). Then species diversity values for the three taxonomic diversity indices, species richness (S), species Shannon-Wiener index (H’), and species evenness index (E) were calculated [49,50].

2.5. Statistical Analysis

For the analysis of functional traits, we constructed a species–abundance matrix and a species–trait matrix. By linking these two matrices, we developed a trait–abundance matrix used to calculate functional diversity indices. All the selected functional diversity indices were calculated by the FDiversity software [51]. Standardization was performed for multi-trait functional diversity indices, because the trait variables of this study showed difference in orders of magnitude and scales of measurement, whereas single functional trait index was calculated without standardization [52]. Spearman correlation was used to test the association between functional diversity with species diversity, disturbance level, slope, aspect and elevational gradients. Based on this significance, polynomial regression model was used to test the variation patterns of functional diversity along disturbance intensity and environmental factors. Furthermore, the effects of disturbance and environmental variables (fixed factors) on functional diversity (response variables) were tested using mixed effects model. The significant effect of fixed factors was determined using “lmerTest” package by employing R software ) using ‘lme4’ and ‘cAIC4’ packages [53,54].

3. Results

3.1. Variation of Plant Functional Diversity along Disturbance Gradients

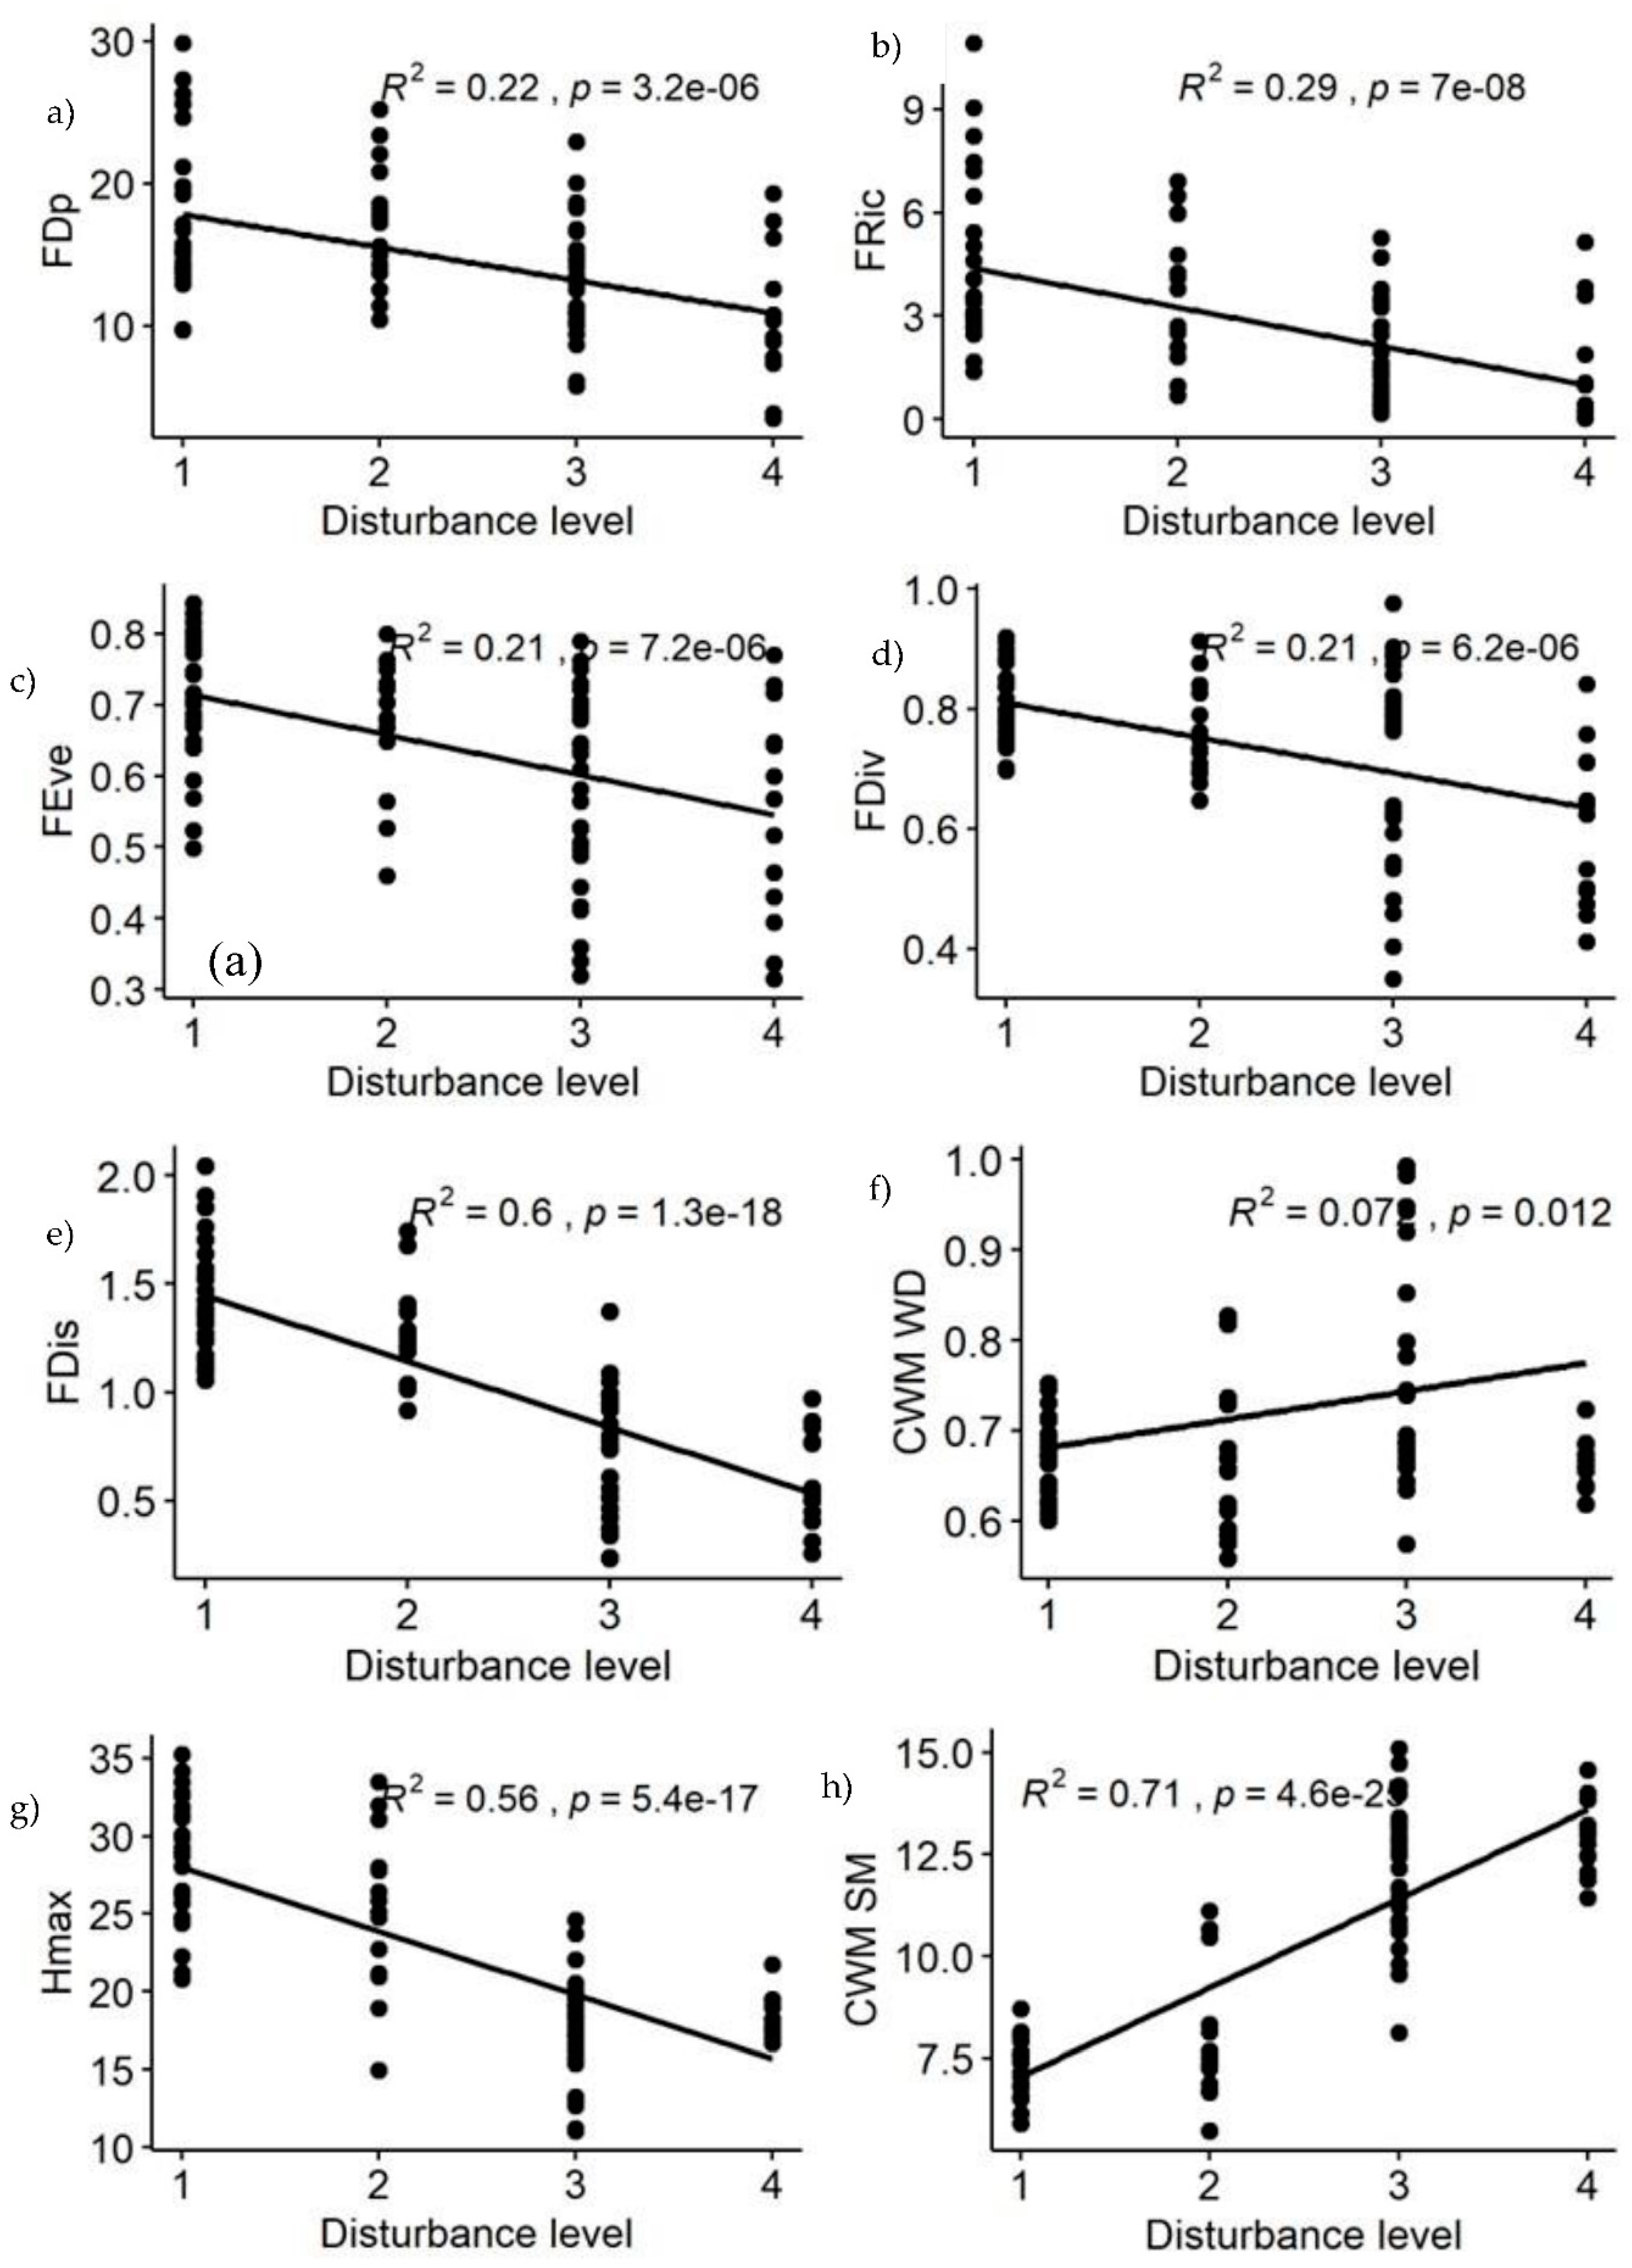
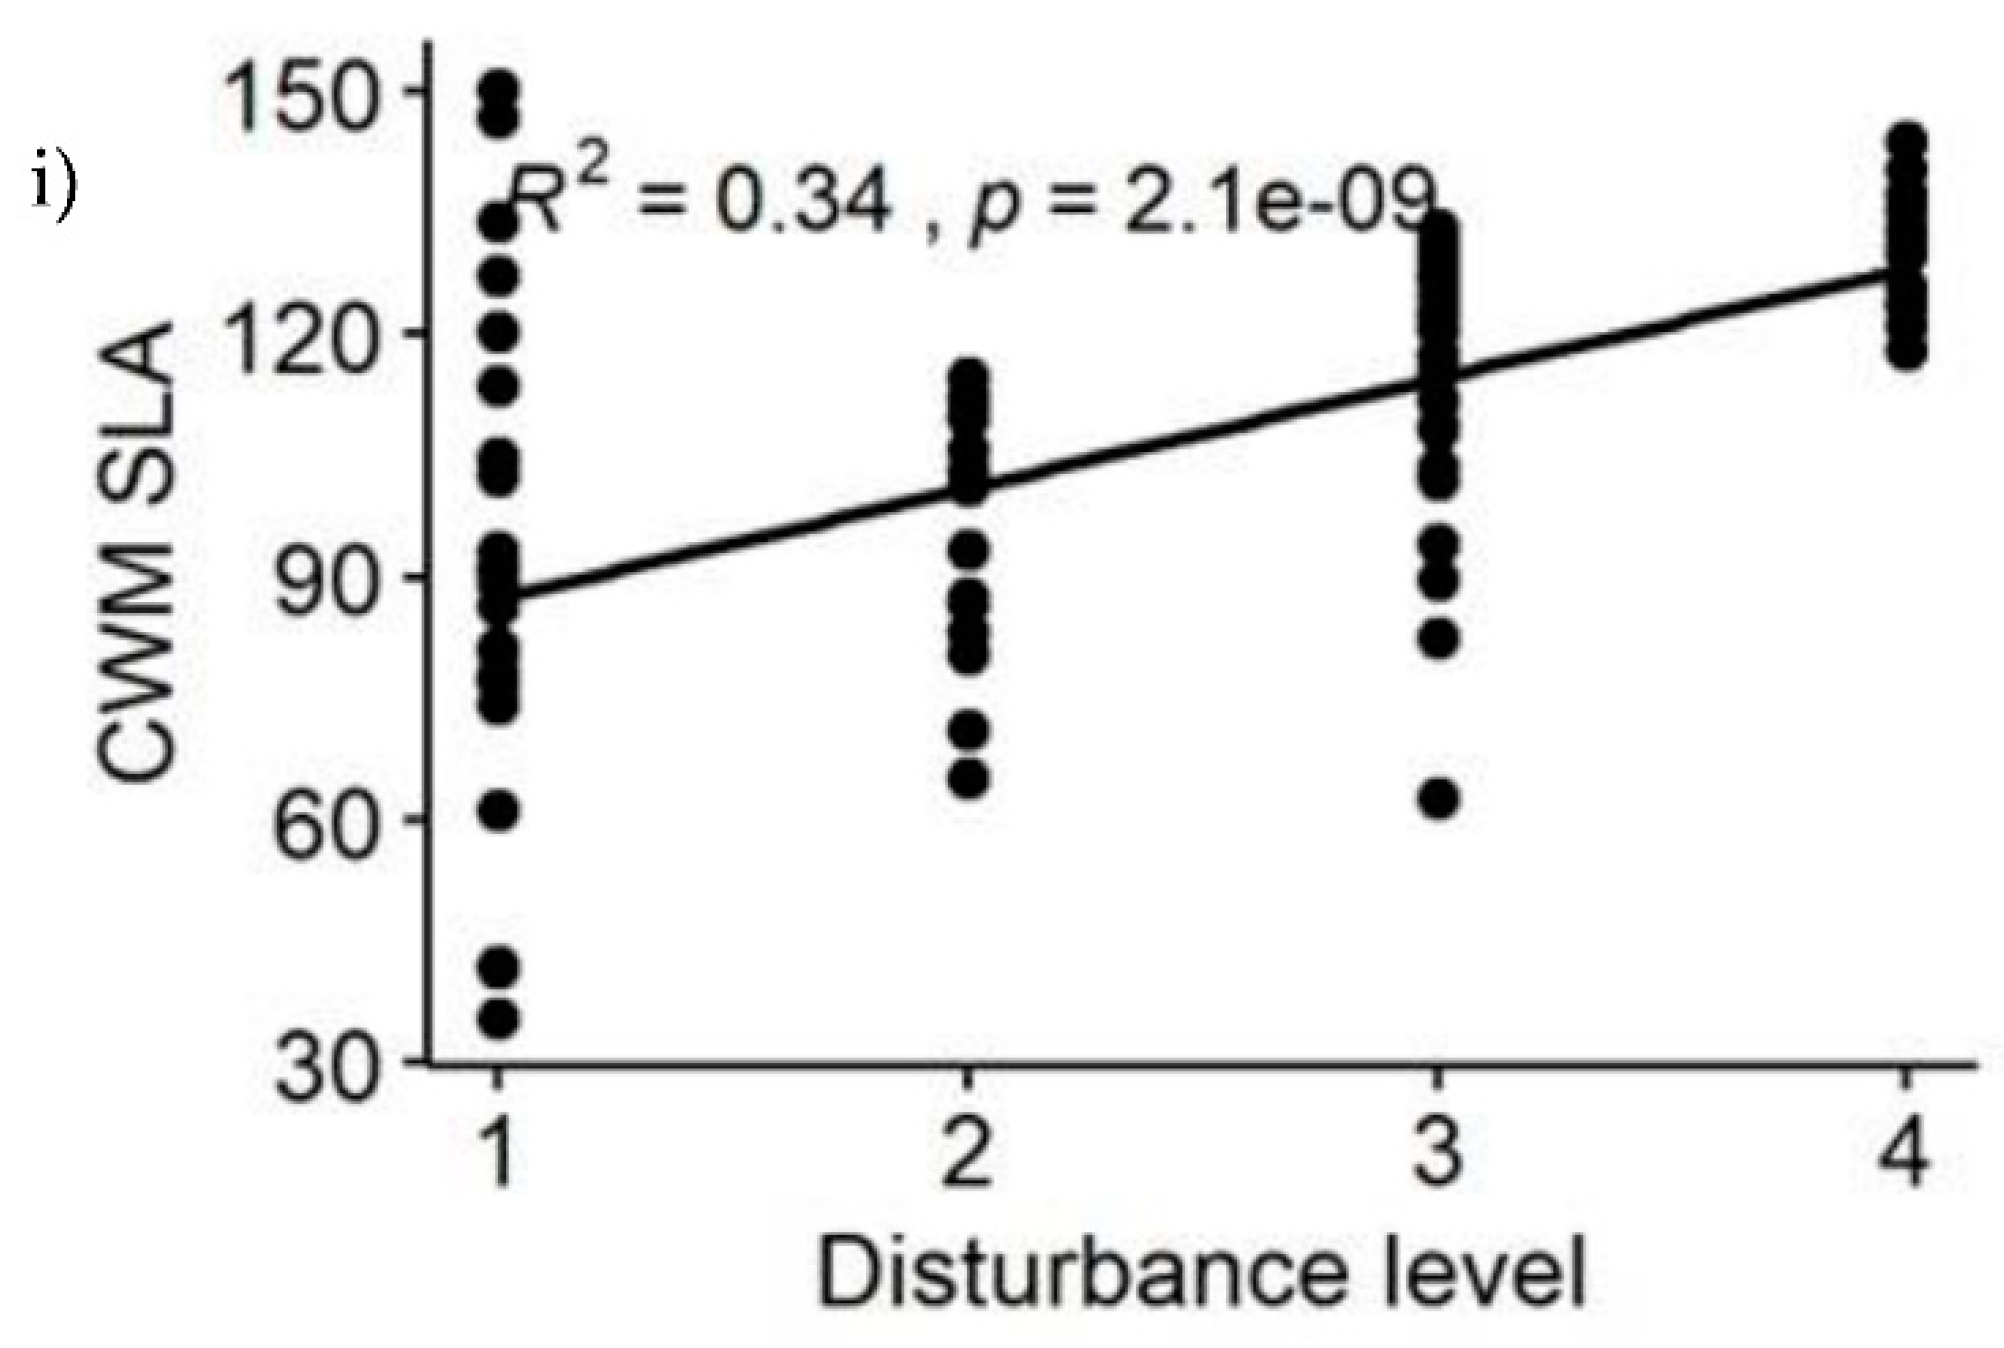
Among the calculated functional diversity indices, FDp, FRic, FEve, FDiv, FDis, and CWM.Hmax showed decreasing pattern with disturbance intensity level, i.e., functional diversity decreased significantly with disturbance intensity increase (Table 1 & Figure 4a–e,g). The greater the disturbance intensity was, the less the functional diversity obtained. In contrast the three functional diversity indices for CWM.WD, CWM.SLA and CWM.SM showed increasing pattern with disturbance intensity levels (Table 1 & Figure 4f,h,i), because they were positively correlated with each other. These findings reflected that CWM.WD, CWM.SM and CWM.SLA are less affected in disturbed forest sites (Figure 4f,h,i), whereas FDp, FRic, FEve, FDiv, FDis, and CWM.Hmax are affected in the disturbed forest sites of YCFBR (Figure 4a–e,g,h).
FDp, FEve, FRic, FDiv, FDis, CWM WD, CWM SLA, CWM Hmax and CWM SM, refers to functional diversity plot based dendrogram, functional evenness, functional richness, functional diversions, functional dispersion, community weight mean of woody density (g/m3), community weight mean of specific leaf area (cm2/g), community weight mean of maximum heights (m) and community weight mean of seed mass (g), respectively.

3.2. Relationships between Functional Diversity and Environmental Factors of YCFBR

Coefficients of the regression model showed that functional diversity indices impacted by the disturbance, slope, aspect and elevation gradients of the YCFBR (Table 1). The disturbance has significant effect on all functional diversity indices except for CWM.WD. No significant effects was found due to slope on functional diversity indices, except for FDis. Except CWM.WD, all functional diversity indices were significantly influenced by elevational gradients in the YCFBR. Surprisingly, no significant effects was found due to aspects on all functional diversity (Table 1). Furthermore results revealed that functional diversity indices for FRic, FEve, FDiv, FDis, and CWM.Hmax had negative association with disturbance and elevational gradients. This indicated that a higher disturbance and elevational gradients corresponded to a lower functional diversity. In contrast CWM.SLA and CWM.SM showed positive association with disturbance and elevation.
Multiple regression analysis revealed that disturbance and topographic variables, i.e., elevation, aspect and slope were independent factors influencing species diversity and functional diversity distribution (Table 2). Mixed effects model showed that aspect and disturbance had a positive significant effects on all functional diversity indices (Table 2). In contrast disturbance had a negative significant effect on CWM.WD and CWM.SM. Aspect had a positive significant effect on FDp, FEve and FDiv (Table 2). Overall, the study highlights the importance of considering both anthropogenic factors and environmental variables in understanding biodiversity and ecosystem functioning in heterogeneous environments. Therefore, anthropogenic disturbance and elevational gradients were found to be the major factors influencing functional diversity in the YCFBR, because they were correlated with each other.

3.3. Functional Diversity Indices and Species Diversity Relationships

The nine functional diversity indices were all closely associated to species richness (S), Shannon Weiner diversity (H') and evenness index (E) in the YCFBR (Table 3). As per the given table, S and H' shows positive and significant correlations with all functional diversity components except for the three indices, i.e., CWM.SLA, CWM.WD and CWM.SM (Table 3). The strongest positive correlations with S were observed for FDp and FRic, while FDis shows the strongest positive correlation with H' and E. CWM.Hmax also has strong positive correlations with both S and H'. Evenness index, on the other hand, has significantly positive correlations with most of the components except for CWM.SLA and CWM.SM indicating that higher values of SLA and SM are associated with lower species diversity (Table 3). This findings suggested that, species diversity and functional diversity are highly correlated to each other and both positive and negative correlations were existed between species and functional diversity indices.
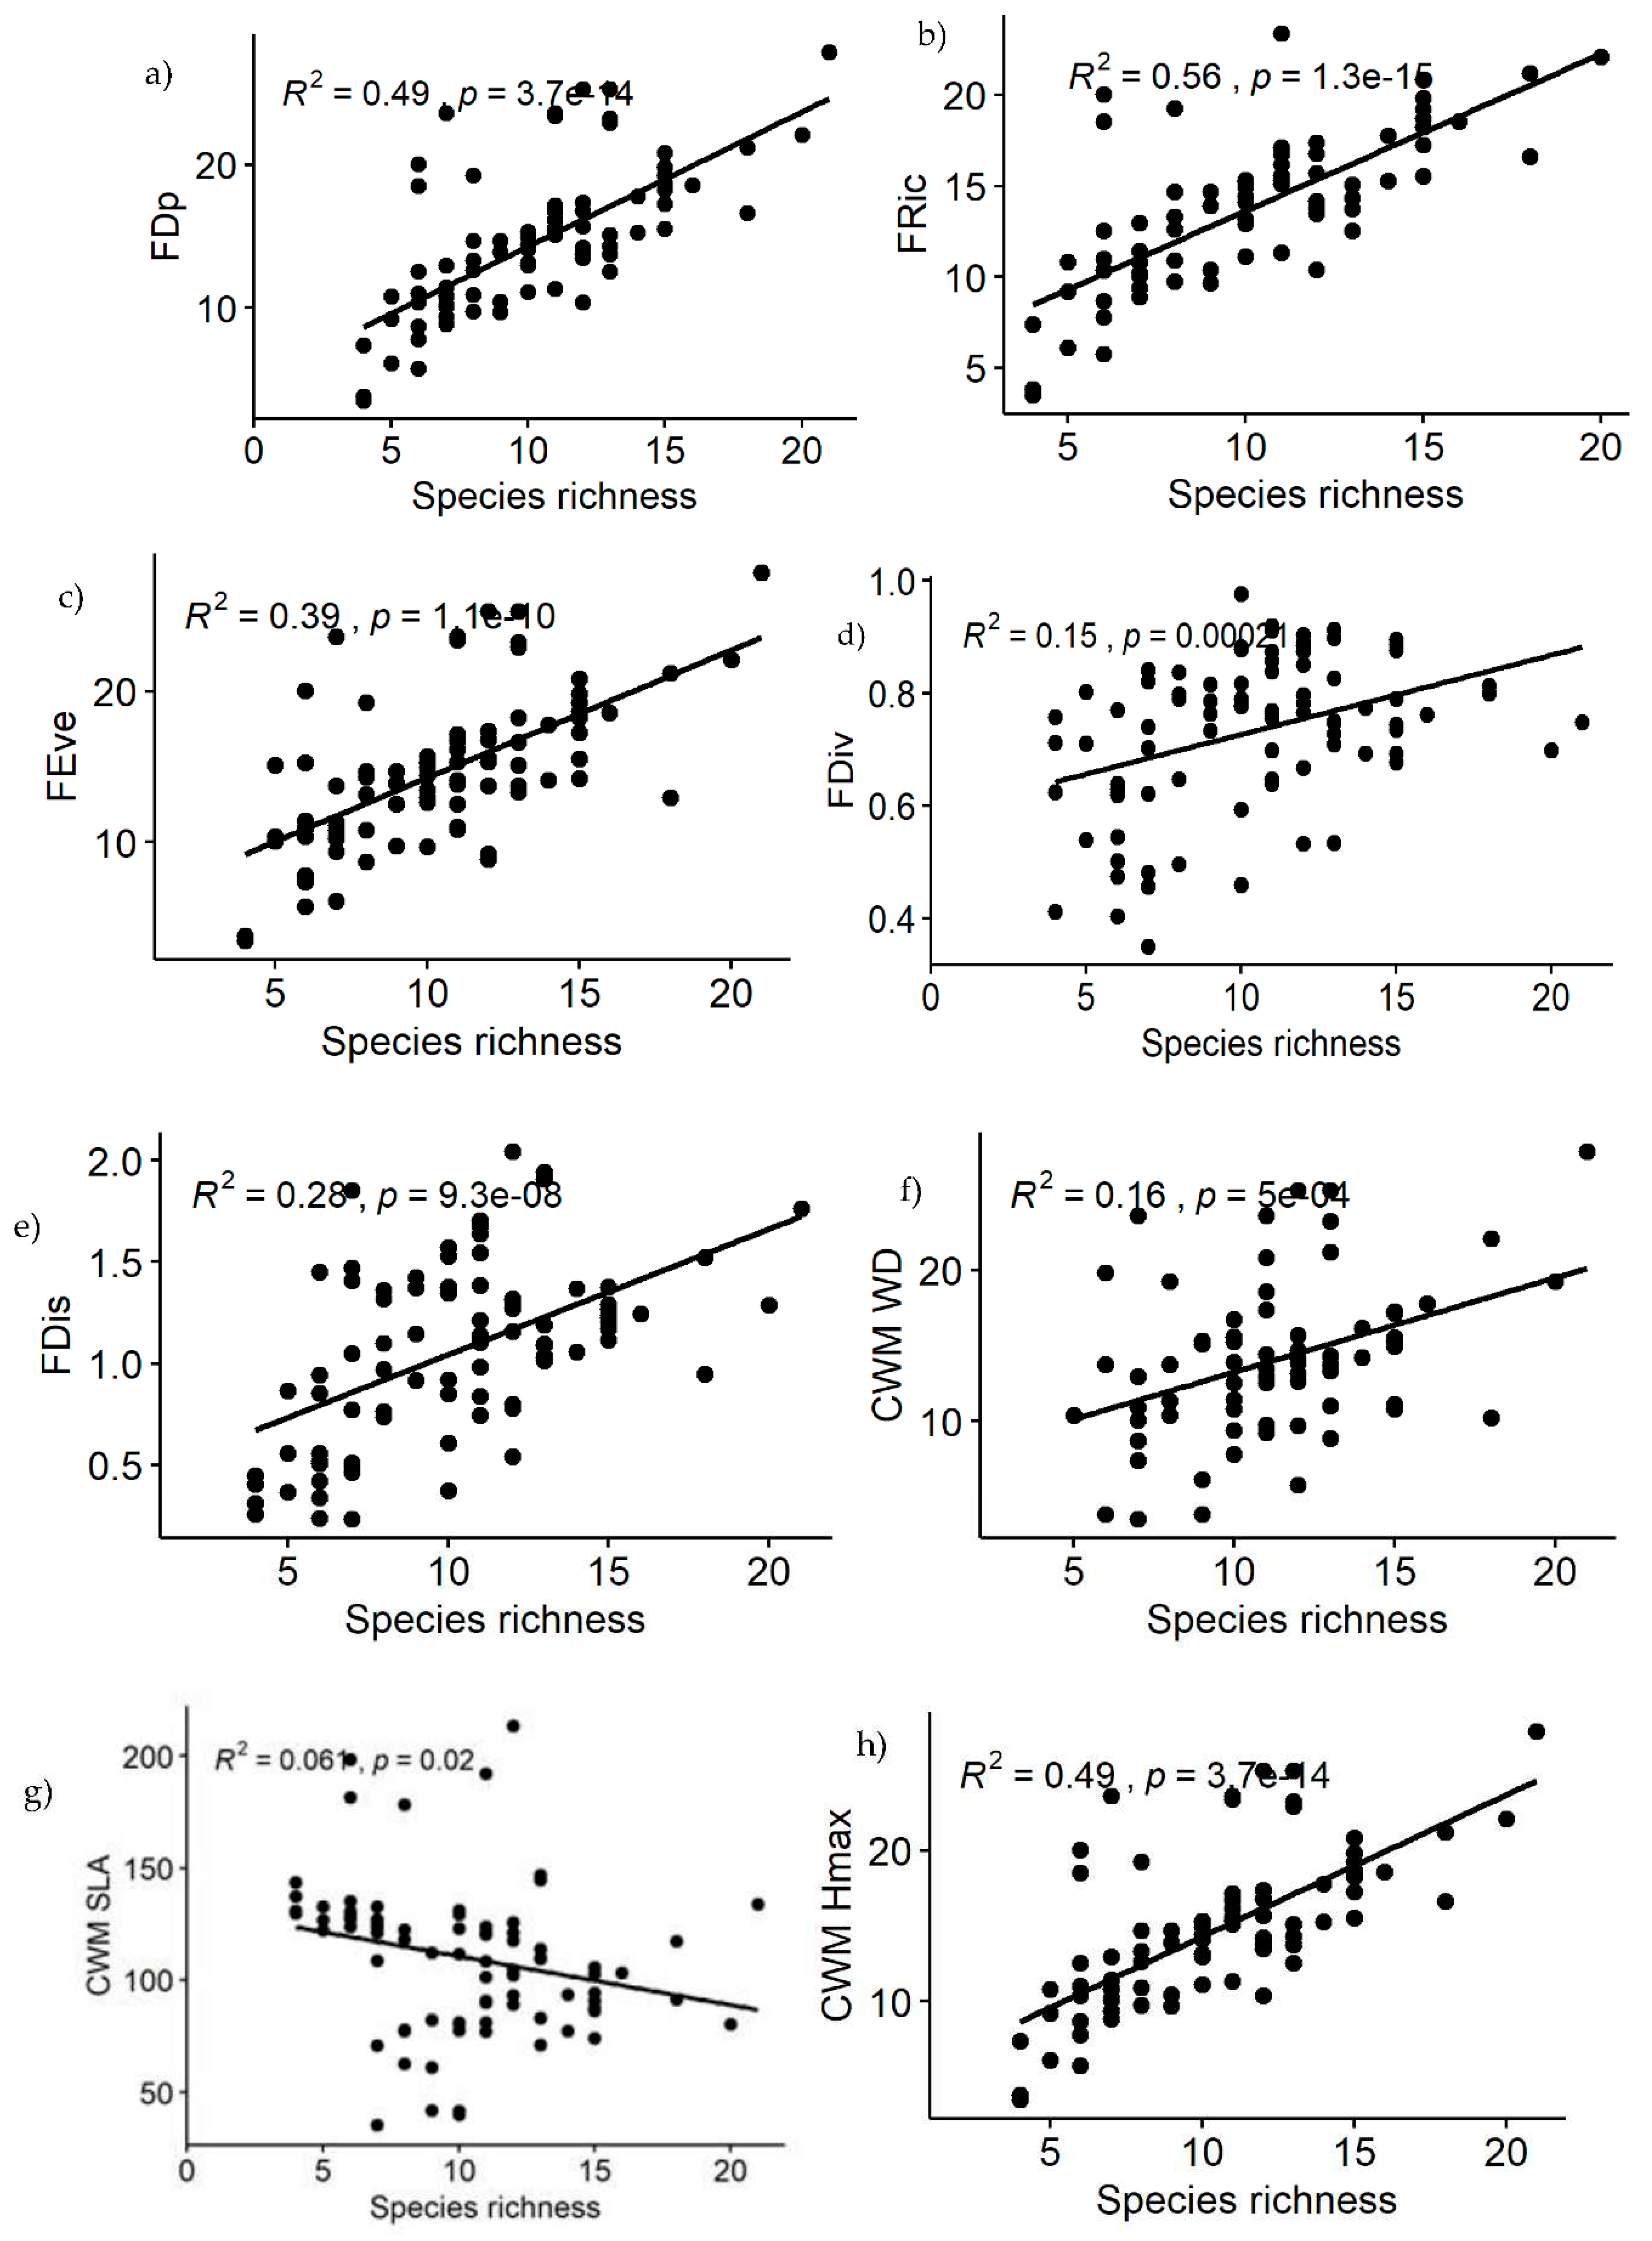
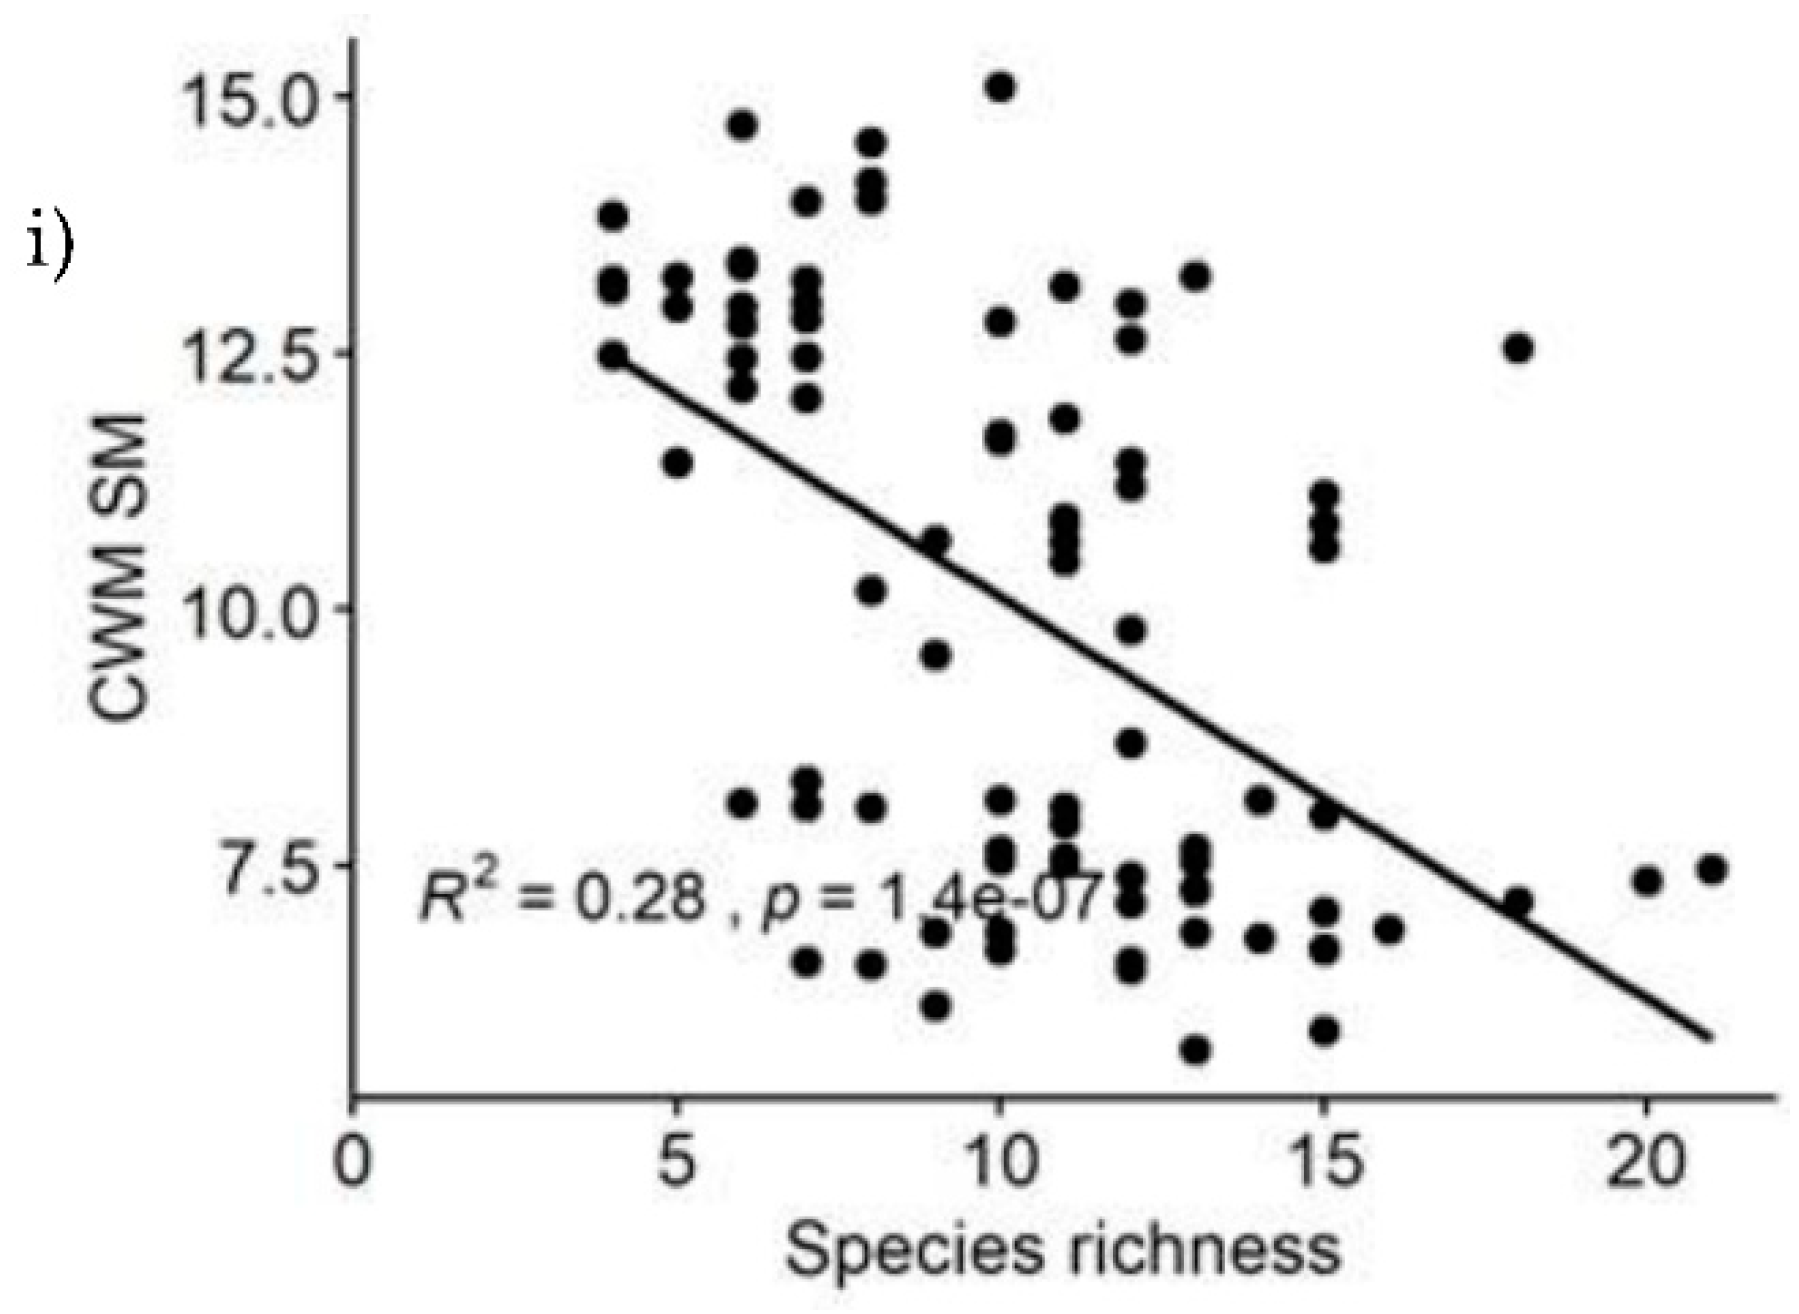
Also polynomial regression results revealed that, relationships of functional diversity with species richness (S) showed non-linear trend (Figure 5a–i). Among the nine functional diversity indices, seven of the them (FDp, FRic, FEve, FDiv, FDis, CWM.WD & CWM.Hmax) revealed increasing patterns with increasing species richness (Figure 5a–f,h). Functional diversity for the CWM.SLA and CWM.SM showed decreasing pattern as species richness increased (Figure 5g,i). The greater the species richness was the less functional diversity obtained. Because functional diversity of CWM.SLA and CWM.SM are negatively correlated with species richness (Table 3).

4. Discussions

4.1.Variations of Plant Functional Diversity along Disturbance Gradients

Most of functional diversity indices tested in this study showed decreasing pattern with disturbance intensity level which has a wide consistence with [60] who quantified the variation of FRich, FDiv, and FEve along anthropogenic disturbance gradients. In contrast three functional diversity indices analyzed for CWM.WD, CWM.SLA and CWM.SM along disturbance gradients showed increasing pattern which has similarity with the findings of [61]. Generally speaking, the relationships between CWM.WD, CWM.SLA, and CWM.SM with disturbance gradients can vary depending on the type and intensity of the disturbance and there is also similar finding reported [62]. Low disturbance intensity promote the growth of high wood-density species and species with low SLA are able to allocate more resources to structural tissues and less to leaf production, which provides them with greater drought tolerance and protection against herbivory. In addition low disturbances can create more heterogeneous environments, allowing for the coexistence of a wider range of species with different trait values leads to functional diversity increase which is consistence with [63]. The main groups of species that contribute to functional diversity can vary depending on the ecosystem type, because their traits and roles differ based on their specific functions within the ecosystem [58]. For example, plants may differ in their growth rates, nutrient requirements, and tolerance to environmental stressors [59].
There are various potential reasons why patterns of functional diversity increased for SM with disturbance intensity level. These are facilitation, stress tolerance and evolutionary trade-offs of SM against disturbance [64]. In contrast but consistence with [7] species with smaller seeds are more likely to establish themselves in disturbed areas, as they require less resources for germination and early growth. Also larger seed sizes may be more likely to successfully established due to larger seeds may be better equipped to germinate and established in environments with high levels of stress [64]. Furthermore, large seed size may confer advantages in terms of seedling survival and growth, but may also come with trade-offs such as reduced seed production or dispersal ability. Where establishment success is more uncertain, smaller-seeded species may compensate for their reduced ability to compete with larger-seeded species by producing more seeds [62]. Therefore, the relationship between disturbance and functional diversity for SM and in general is likely to be complex and context-dependent due to range of factors.
Functional diversity can be measured by the suite of ecological functions that different species perform in an ecosystem in response to varying levels of disturbance [60,61,62]. Aligned with this, patterns of functional diversity along disturbance gradients are typically decreasing because disturbances often favor species that are adapted to the disturbed conditions, such as fast-growing species or opportunistic colonizers, at the cost of other species that are less adapted as already indicated [63]. This tells us that, the species diversity with a low tolerance for changes in environmental conditions are likely to be negatively affected by disturbance or other environmental stress. For example, when disturbance occurs, some species may increase or declined depending on their ecological traits, such as their life history, morphology, or physiology as already pointed out [59,62,65]. This contrasted results were obtained due to ecological difference, because the study area is characterized as moist forests and receives bimodal rain fall which facilitated photosynthesis and growth rate (Figure 1). Similar to this findings, the previous study confirmed functional diversity and environmental variations combined explained 90.4% of total variation in forest ecosystem functioning in tropical forests [66]. The reality on the ground showed that maximum plant height reflected to larger trees are highly threatened by human activities for logging, coffee management and conversion to agricultural lands. Farmers are managing their coffee farm land by removing larger trees to minimize shade effects which affects their coffee seed productions. Therefore, it is time to acknowledge the crucial role of functional diversity in nature and take action to protect it. Therefore, the influence of disturbance on functional diversity is actually the influence on community composition and function in the YCFBR.

4.2. Effects of Environmental Factors on Functional Diversity

Hmax, SLA, WD and SM are particularly sensitive to anthropogenic disturbance and the whole plant functional ecosystem process [7,18]. In line with this, results indicated that SM has increasing pattern as disturbance levels increased, because large seeds have often develop in nutrient-poor environments and survive in stressful environmental conditions and the same was true for SLA, Hmax and WD traits. Because tropical forests experience significant disturbances as described by [18]. Functional diversity can increase with elevation due to the presence of unique or specialized species adapted to the particular environmental conditions found there which has similarity with the previous study [67,68].
Results from mixed effects model demonstrated that aspect and disturbance had significant effects on all functional diversity indices. Also as illustrated by [69], functional diversity is closely related to environmental variables such as aspect and elevation which is consistence with the current findings. Therefore, disturbance and aspect were important factors influecing fuctional diversity indces in the YCFBR. This implies, those functional diversity indices have positive relationships with environmental factors can enhace species diversity, whereas those indices have negative relationships with environmental factors can influence negatively the species diversity. Therefore it is crucial choosing tree species survive and adapt in disturbed ecosystem for conservation and rehabilitation of degraded environment such as transitional zone of YCFBR. As already highted in the preior findings, monitoring functional diversity is important to gauge the severity of disturbances and the state of a community [59]. This implied that different components of functional diversity have different effects on different ecosystem characteristics and minimizing anthropogenic disturbance to maintain a healthy ecosystem is important in the area.

4.3. Functional Diversity and Species Diversity Relationships

All of the functional diversity indices increased in a polynomial manner as species richness and diversity increased, which idicated that their relationships is direct but non-linear which has consistence with the previous studies [48,60,62,70]. The non-linear relations between functional diversity and species diversity proved that functional diversity can provide special information which is different from species diversity. Because, the variation in species abundance and distribution can mainly explained through species diversity, however functional diversity can explain variations of species morphology, physiology, reproduction, ecology and phenology as already reported by [67] as cited in [70]. Previous findings pointed out [69], different functions will likely be maximized by functionally different species, and consequently diverse mixtures would provide combinations that maximize multiple functions. Functional diversity and species richness is interrelated with each other which is consistence with the findings of [62,71]. Therefore, functional diversity and species diversity can be used as indicators of forest composition, structure, functioning, forest ecosystem process and inner environment should not be interchanged which is supported with the previous science [59,72].
In contrast, there are possible science explanations for why functional diversity for CWM.SLA and CWM.SM may decrease with species richness; these are due to biogeographic filtering and complementarity effects [73,74]. As more species are added to a community, the available niche space may become increasingly filled, leading to greater competition among species for resources. This can result in a shift towards species with similar functional traits that are better adapted to the available environmental conditions, and a decrease in functional diversity overall. Similarly, functional diversity may initially increase with species richness as new functional traits are added to the community, there may be a point where additional species are redundant in terms of their functional contribution. This would lead to diminishing returns in terms of functional diversity, and a levelling off or decrease in functional diversity as species richness increases [48]. This results suggests that taxonomic diversity patterns are not easily identifiable at local scale and are less responsive to topographical variation than functional and structural diversity measures thus why this study used trait-based diversity measurement. Overall, the study suggest that different functional diversity components capture different aspects of community diversity and that multiple measures may be necessary to fully quantify functional diversity.

5. Conclusions

Plant characteristics related to competitive ability, resource exploitation, regeneration capacity, and resistance to stress are suggested to be excellent indicators of the impact of disturbance and environmental factors on the species and functional diversity. The species and functional diversity varies due to disturbance and environmental heterogeneities. In summary, our study showed that the functional diversity of plant communities in the YCFBR is significantly affected by human disturbance, with some functional traits being more vulnerable than others. The results highlight the importance of conservation measures to maintain functional diversity in the face of increasing anthropogenic pressure. Only by protecting intact ecosystems and restoring degraded area can we ensure the provision of ecosystem services that are critical for human well-being and the sustainability of the planet. Further research is encouraged in the area to apply zonation-based livelihoods’ assessments to suit the unique needs of each forest zone and promote sustainable management practices.

Author Contributions

Ferede Abuye Jeldu, Motuma Tolera and Teshale Woldeamanuel conceived the presented idea and developed the theory and analytical methodologies. Ferede Abuye Jeldu also planned and carried out the data collections and data analysis. All authors substantially contributed to discussion of methodologies and results. Ferede Abuye Jeldu wrote the first draft and received substantial contribution from other authors. The authors read and approved the final manuscript.

Funding

We obtained funding for this research from the IPCC and grants from African Forest Forum (AFF) with grant number 01-2.1.1.

Acknowledgments

This document was produced with the financial support of the IPCC. The contents of this document are solely the liability of Ferede Abuye Jeldu and under no circumstances may be considered as a reflection of the position of the IPCC. Also, we extend our sincere gratitude to African Forest Forum (AFF) for supporting this work. Sincere gratitude is being extended to the Yayu Coffee Forest Biosphere Reserve Management Unit and district administrators (Yayu and Hurumu districts) for their collaboration during data collection in YCFBR. Our sincere gratitude goes to Dr. Mengistu Teshome for his support during statistical analysis.

Conflicts of Interest

The authors declare no conflict of interest.

References

  1. Lewis, C.C. , Weiner, B.J., Stanick, C. et al. Advancing Implementation Science through Measure Development and Evaluation: A Study Protocol. implemenation Sci. 2015, 102. [Google Scholar] [CrossRef]
  2. Aguirre-Gutiérrez, Jesús. , Erika Berenguer, Imma Oliveras Menor, David Bauman, Jose Javier Corral-Rivas, M.G.N.-M. et al. Functional Susceptibility of Tropical Forests to Climate Change. Ecol. Evol. 2022, 1–26.
  3. IPCC Tropical Forests In Climate Change: Impacts, Adaptation and Vulnerability. Contribution of Working Group II to the Sixth Assessment Report of the Intergovernmental Panel on Climate Change. Trop. For. 2022, CCP7. [Google Scholar]
  4. Geneletti, D. Integrating Ecosystem Services in Land Use Planning: Concepts and Applications; 2012;
  5. Cardinale, B.J.; Duffy, J.E.; Gonzalez, A.; Hooper, D.U.; Perrings, C.; Venail, P.; Narwani, A.; MacE, G.M.; Tilman, D.; Wardle, D.A.; et al. Biodiversity Loss and Its Impact on Humanity. Nature 2012, 486. [Google Scholar] [CrossRef]
  6. Devries, B.; Pratihast, A.K.; Verbesselt, J.; Kooistra, L.; Herold, M. Characterizing Forest Change Using Community-Based Monitoring Data and Landsat Time Series. PLoS One 2016. [Google Scholar] [CrossRef] [PubMed]
  7. Singh, S. Lowto Moderate-Level Forest Disturbance Effects on Plant Functional Traits and Associated Soil Microbial Diversity in Western Himalaya. Front. For. Glob. Chang. 2021, 4, 1–12. [Google Scholar] [CrossRef]
  8. Friis, I. Forests and Forest Trees of Northeast Tropical Africa. Their Natural Habitats and Distribution Patterns in Ethiopia, Djibouti and Somalia. Kew Bulletin Additional Series XV. Kew, United Kingdom: HMSO [Her Majesty’s Stationery Office]. 1992.
  9. Mengesha Asefa, Min Cao, Yunyun He, Ewuketu Mekonnen, and X.S.; Yang, J. Ethiopian Vegetation Types, Climate and Topography. Sci. direct 2020, 42, 302–311, doi:http: //www.keaipubl ishing.com/en/journals/plant-diversity/ http:// journal.kib.ac.cn.
  10. Semegnew Tadese, Teshome Soromessa, Tesefaye Bekele, and G.G. Biosphere Reserves in the Southwest of Ethiopia: Review Article. Hindawi Adv. Agric. 2021, 1–7. [CrossRef]
  11. MEFCC National Potential and Priority Maps for TreeBased Landscape Restoration in Ethiopia (Version 0.0): Technical Report. Addis Ababa: Ministry of Environment, Forest and Climate Change. 2017.
  12. Yitebitu Moges, Z.E. and S.N. ETHIOPIAN FOREST RESOURCES: CURRENT STATUS AND FUTURE MANAGEMENT OPTIONS IN VIEW OF ACCESS TO CARBON FINANCES: REVIEW. 2010, 1–55.
  13. DeVries Ben, Jan Verbesselt, Lammert Kooistra, M. H. Robust Monitoring of Small-Scale Forest Disturbances in a Tropical Montane Forest Using Landsat Time Series. Sci. direct 2015, 161, 107–121. [Google Scholar]
  14. DeVries B, Pratihast AK, V. J.; Kooistra L, H.M. Characterizing Forest Change Using Community-Based Monitoring Data and Landsat Time Series. PLoS One 2016, 11, 1–25. [Google Scholar] [CrossRef]
  15. Hundera, K.; Aerts, R.; Fontaine, A.; Van Mechelen, M.; Gijbels, P.; Honnay, O.; Muys, B. Effects of Coffee Management Intensity on Composition, Structure, and Regeneration Status of Ethiopian Moist Evergreen Afromontane Forests. Environ. Manage. 2013. [Google Scholar] [CrossRef]
  16. YCFBRMP Yayu Coffee Forest Biosphere Reserve Management Plan:Oromia Environment, Forest and Climate Change Authority and Oromia Forest and WildLife Enterprise. 2018.
  17. Hou, Z.; Lv, G.; Jiang, L. Functional Diversity Can Predict Ecosystem Functions Better Than Dominant Species: The Case of Desert Plants in the Ebinur Lake Basin. sustainability 2021, 13, 1–13. [Google Scholar] [CrossRef]
  18. Shipra, V. Plant Functional Traits in Tropical Dry Forests: A Review. 2020, 1–86.
  19. Kattge, Jens, Gerhard Bönisch, Sandra Díaz, S. et al. TRY Plant Trait Database – Enhanced Coverage and Open Access. Glob. chnage Biol. 2020, 26, 119–188. [Google Scholar] [CrossRef] [PubMed]
  20. Jesse, R. Laskya, María Uriarteb, Vanessa K. Boukilic, and R.L.C. Trait-Mediated Assembly Processes Predict Successional Changes in Community Diversity of Tropical Forests. Ecol. Appl. 2016, 111, 5616–5621. [Google Scholar]
  21. Nicola Kühn, Carolina Tovar, J.C.; Vigdis Vandvik, B.J.E. and K.J.W. Globally Important Plant Functional Traits for Coping with Climate Change. Front. Biogeogr. 2021, 1–18. [CrossRef]
  22. Sarah Lueder, Kaushik Narasimhan, Jorge Olivo, D. C.; Juana G. Jurado, L.G. and J.K. Functional Traits, Species Diversity and Species Composition of a Neotropical Palm Community Vary in Relation to Forest Age. Front. Ecol. Evol. 2022, 10, 1–13. [Google Scholar]
  23. Tadesse Woldemariam, T.W. , Feyera, Senbeta, Kassahun, T. and Fite, G. Yayu Coffee Forest Biosphere Reserve Nomination Form. Ethiopian MAB National Committee, Addis Ababa. 2009.
  24. Beyene, A.D.; Mekonnen, A.; Hirons, M.; Robinson, E.J.Z.; Gonfa, T.; Gole, T.W.; Demissie, S. Contribution of Non-Timber Forest Products to the Livelihood of Farmers in Coffee Growing Areas: Evidence from Yayu Coffee Forest Biosphere Reserve. J. Environ. Plan. Manag. 2020, 63, 1633–1654. [Google Scholar] [CrossRef]
  25. Gole, T.W. Vegetation of the Yayu Forest in SW Ethiopia: Impacts of Human Use and Implications for in Situ Conservation of Wild Coffea Arabica L. Populations. Ecol. Dev. Ser. 2003, 10. [Google Scholar]
  26. Jemal, O.; Callo-Concha, D.; van Noordwijk, M. Local Agroforestry Practices for Food and Nutrition Security of Smallholder Farm Households in Southwestern Ethiopia. Sustain. 2018. [Google Scholar] [CrossRef]
  27. NABU, T.N. and B.C.U. NABU’s Biodiversity Assessment at the Kafa Biosphere Reserve. Berlin, Addis Ababa. 2017.
  28. UNFCCC Measurements for Estimation of Carbon Stocks in Afforestation and Reforestation Project Activities under the Clean Development Mechanism: A Field Manual. A F. Man. 2015, 1–72.
  29. Djomo, A.N.; Picard, N.; Fayolle, A.; Henry, M.; Ngomanda, A.; Ploton, P.; McLellan, J.; Saborowski, J.; Adamou, I.; Lejeune, P. Tree Allometry for Estimation of Carbon Stocks in African Tropical Forests. Forestry 2016. [Google Scholar] [CrossRef]
  30. Pearson Timothy, Sarah Walker, and S.B. Source Book for Land Use, Land-Use Change and Fores Try Proje Cts. 2005, 1–64.
  31. Snowdon, P. , Raison, J., Keith, H., Ritson, P., Grierson, P., Adams, M.; Montagu, K., Bi, H.Q., Burrows, W. & Eamus, D. Protocol for Sampling Tree and Stand Biomass. Natl. Carbon Account. Syst. Tech. Rep. no. 31. Aust. Greenh. Off. Canberra 2002. [Google Scholar]
  32. EFAP EFAP, Ethiopian Forestry Action Program, Volume III.Summary Final Report, Ethiopia, Addis Ababa. 2020.
  33. Edwards, S. , Tadesse, M. , Demissew, S. and Hedberg, I. Flora of Ethiopia and Eritrea: Magnoliaceae to Flacourtiaceae. The National Herbarium, Addis Ababa and the Department of Systematic Botany, Uppsala. 2000, 2. [Google Scholar]
  34. Hedberg, I. , Kelbessa, E. , Edwards, S., Demissew, S. and Persson, E. Flora of Ethiopia and Eritrea, Gentianaceae to Cyclocheilaceae. The National Herbarium, Addis Ababa University, Addis Ababa and Uppsala. 2006, 5. [Google Scholar]
  35. Yuan, Z. , Wang, S., Ali, A. et al Aboveground Carbon Storage Is Driven by Functional Trait Composition and Stand Structural Attributes Rather than Biodiversity in Temperate Mixed Forests Recovering from Disturbances. Ann. For. Sci. 2018, 75. [Google Scholar] [CrossRef]
  36. Woldu, G.; Solomon, Negasi, Hadgu Hishe, Hailemariam Gebrewahid, M. A.G.; Birhane, E. Topographic Variables to Determine the Diversity of Woody Species in the Exclosure of Northern Ethiopia. Sci. direct 2019, 6, 1–7. [Google Scholar]
  37. Wekesa, C. , Leley, N., Maranga, E., Kirui, B., Muturi, G., Mbuvi, M., & Chikamai, B. Effects of Forest Disturbance on Vegetation Structure and Above-Ground Carbon in Three Isolated Forest Patches of Taita Hills. Open J. For. 2016, 6, 142–161. [Google Scholar] [CrossRef]
  38. Girma Shumi, Ha¨rdtle, P. R.. J.H.. W.; Schultner, K.H.. F.S.. J.F.. J. Woody Plant Species Diversity as a Predictor of Ecosystem Services in a Social–Ecological System of Southwestern Ethiopia. Landsc. Ecol. 2021, 36, 373–391. [Google Scholar] [CrossRef]
  39. Girma Shumi, Ha¨rdtle, P.R.. J.H.. W.; Schultner, K.H.. F.S.. J.F.. J. Land Use Legacy Effects on Woody Vegetation in Agricultural Landscapes of South-Western Ethiopia. WILEY Biodivers. Distrib. 2018, 1–13. [CrossRef]
  40. Melese Genete Muluneh, Motuma Tolera Feyissa, and T. M.W. Effect of Forest Fragmentation and Disturbance on Diversity and Structure of Woody Species in Dry Afromontane Forests of Northern Ethiopia. Biodivers. Conserv. 2021, 30, 1753–1779. [Google Scholar] [CrossRef]
  41. Technologies), W. (World O. of C.A. and Where the Land Is Greener: Case Studies and Analysis of Soil and Water Conservation Initiatives Worldwide. Berne, Switzerland: WOCAT. 2007.
  42. Lujin Hu, Zongyi He, Jiping Liu, C. Z. Method for Measuring the Information Content of Terrain from Digital Elevation Models. open J. entropy 2015, 17, 7021–7051. [Google Scholar] [CrossRef]
  43. Grime, J.P. Benefits of Plant Diversity to Ecosystems: Immediate, Filter and Founder Effects. J. Ecol. 1998, 86, 901–1076. [Google Scholar] [CrossRef]
  44. McGill BJ, Enquist BJ, Weiher E, W. M. Rebuilding Community Ecology from Functional Traits. Trends Ecol. Evol. 2006, 21, 178–185. [Google Scholar] [CrossRef] [PubMed]
  45. Westoby, M. A Leaf-Height-Seed (LHS) Plant Ecology Strategy Scheme. Plant Soil 1998, 199, 213–227. [Google Scholar] [CrossRef]
  46. Mason, N. , Mouillot, D., Lee, W., et al. Functional Rich_ Ness, Functional Evenness and Functional Divergence: The Primary Components of Functional Diversity. Oikos 2005, 111, 112–118. [Google Scholar] [CrossRef]
  47. EFRL ETHIOPIA’S FOREST REFERENCE LEVEL SUBMISSION TO THE UNFCCC. 2017.
  48. Sylvanus Mensah, Vale`re K. Salako, Achille E. Assogbadjo Kakaı, R.G. Differential Responses of Taxonomic, Structural, and Functional Diversity to Local-Scale Environmental Variation in Afromontane Forests in South Africa. Trop. Conserv. Sci. 2018.
  49. Magurran, A.E. Ecological Diversity and Its Measurements.Chapman & Hall, London. 1988, 179.
  50. Pielou, E.C. Ecological Diversity, London: Wiley. 1975.
  51. Casanoves, F. , Pla, L., Di Rienzo, J., and Diaz, S. FDiver_ Sity: A Software Package for the Integrated Analysis of Func_ Tional Diversity, Methods. Col. Evol. 2011, 2, 233–237. [Google Scholar]
  52. Pla, L., Casanoves, F., & Rienzo, J.D. Quantifying Functional Biodiversity. Springer, Dordrecht, Heidelberg, London, New York. 2012.
  53. Kuznetsova, A. , Brockhoff, P. B., & Christensen, R.H.B. LmerTest Package: Tests in Linear Mixed Effects Models. J. Stat. Software, 2017, 82, 1–26. [Google Scholar]
  54. Bates, D, Mächler, M, Bolker, B. , & Walker, S. Fitting Linear Mixed-Effects Models Using Lme4. J. Stat. Softw. 2015, 67, 1–48. [Google Scholar]
  55. Feyera Senbeta, Christine Schmitt, Tadese Woldemariam, H. J.B. and M.D. PLANT DIVERSITY, VEGETATION STRUCTURE AND RELATIONSHIP BETWEEN PLANT COMMUNITIES AND ENVIRONMENTAL VARIABLES IN THE AFROMONTANE FORESTS OF ETHIOPIA. SINET Ethiop. J. Sci., 2014, 37, 113–130. [Google Scholar]
  56. Garuma, G.C. Plant Diversity and Ethnobotanical Study of Traditional Medicinal and Wild Edible Plants in Yayo and Hurumu Districts, Ilu Abba Bor Zone of Oromia Region, Southwest Ethiopia:A. Ph.D. Thesis, ; Addis Ababa University Addis Ababa, Ethiopia, 2020. [Google Scholar]
  57. Gautam M.K , R. K. Manhas, and A.K.T. Overstory Structure and Soil Nutrients Effect on Plant Diversity in Unmanaged Moist Tropical Forest. Acta Oecologica 2016, 75, 43–53. [CrossRef]
  58. Wilkinson, D.M. The Disturbing History OfIntermediate Disturbance. Oikos 1999, 84, 145–7., doi:10.2307/3546874 (https://doi.org/10.2307%2F35468 74) . JSTOR 3546874 (https://www.jstor.org/stable/35468 74). [CrossRef]
  59. Kong, L.; Xiong, K. . Z.; S.; Zhang, Y.; Deng, X. Review on Driving Factors of Ecosystem Services: Its Enlightenment for the Improvement of Forest Ecosystem Functions in Karst Desertification Control. forest 2023, 14, 1–20. [Google Scholar] [CrossRef]
  60. Biswas, S. R. , and A.U.M. Species Diversity and Functional Diversity Relationship Varies with Disturbance Intensity. Ecosphere 2011, 2, 1–10. [Google Scholar] [CrossRef]
  61. Levine, N.M.; Zhang, K.; Longo, M.; Baccini, A.; Phillips, O.L.; Lewis, S.L.; Alvarez-Dávila, E.; De Andrade, A.C.S.; Brienen, R.J.W.; Erwin, T.L.; et al. Ecosystem Heterogeneity Determines the Ecological Resilience of the Amazon to Climate Change. Proc. Natl. Acad. Sci. U. S. A. 2016. [Google Scholar] [CrossRef]
  62. Zhang Jin-Tun, Xiaohang Bai, D. S. FUNCTIONAL DIVERSITY AND ITS ATTRIBUTE FACTORS IN THE YUNMENG MOUNTAIN NATIONAL FOREST PARK IN BEIJING, CHINA. CERNE 2017, 23, 75–84. [Google Scholar] [CrossRef]
  63. Bertrand Fournier, Francois Gillet, Renee-Claire Le Bayon, Edward A. D. Mitchell, M.M. Functional Responses of Multitaxa Communities to Disturbance and Stress Gradients in a Restored Floodplain. J. Appl. Ecol. 2015, 1–19. [CrossRef]
  64. Adler Peter, Roberto Salguero-Gómez, Aldo Compagnoni, and M. F. Functional Traits Explain Variation in Plant Life History Strategies. Biol. Conserv. 2014, 111, 740–745. [Google Scholar]
  65. Hongwei Zhang, F.L.L. Adaptive Cooperative Tracking Control of Higher-Order Nonlinear Systems with Unknown Dynamics. Sci. direct 2012, 48, 1432–1439. [Google Scholar] [CrossRef]
  66. Ying Li, Jihua Hou, Li Xu, Mingxu Li, Zhi Chen, Zihao Zhang, N. H. Variation in Functional Trait Diversity from Tropical to Cold-Temperate Forests and Linkage to Productivity. Ecol. Indic. 2022, 138, 1–22. [Google Scholar] [CrossRef]
  67. Papanikolaou, A.D. , Fyllas, N.M., Mazaris, A.D., D.; trakopoulos, P.G., Kallimanis, A.S., and Pantis, J.D. Grazing Effects on Plant Functional Group Diversity in Mediterra_nean Shrublands. Biodiv. Conserv 2011, 20, 2831–2843. [Google Scholar] [CrossRef]
  68. Zhang Jin Tun, Jitian Xiao, L. L. Variation of Plant Functional Diversity Along a Disturbance Gradient in Mountain Meadows of the Donglingshan Reserve, Beijing, China. Russ. J. Ecol. 2015, 46, 157–166. [Google Scholar] [CrossRef]
  69. Mensaha Sylvanus, Kolawolé Valère Salakoa, Achille Assogbadjob, R. G.K.; Brice Sinsinb, T.S. Functional Trait Diversity Is a Stronger Predictor of Multifunctionality than Dominance: Evidence from an Afromontane Forest in South Africa. Ecol. Indic. 2020, 115, 1–11. [Google Scholar]
  70. Mengistu Teshome, Zebene, Asfaw, & Mohammed, M. Pattern of Functional Diversity along the Elevation Gradient in the Dry Evergreen Afromontane Forest of Hararghe Highland, Southeast Ethiopia. biosytems Divers. 2020, 28, 257–264. [Google Scholar] [CrossRef]
  71. Zhang Zihao, Hou Jihua, and H. N. Predictability of Functional Diversity Depends on the Number of Traits. J. Resour. Ecol. 2021, 12, 332–345. [Google Scholar] [CrossRef]
  72. Laliberte, E. and Legendre, P. A Distance_based Framework for Measuring Functional Diversity from Multiple Traits. Ecology 2010, 91, 295–305. [Google Scholar] [CrossRef]
  73. Ruksan Bose, B.R.R.R.P.; Munoz, F. Phylogenetic Diversity in the Western Ghats Biodiversity Hotspot Reflects Environmental Filtering and Past Niche Diversification of Trees. J. Biogeogr. 2018, 1–13. [Google Scholar] [CrossRef]
  74. Mayfield1, M. M., S. P.B.; Morgan, J.W.; Aubin, I.; And, S.M.; Vesk, P.A. What Does Species Richness Tell Us about Functional Trait Diversity? Predictions and Evidence for Responses of Species and Functional Trait Diversity to Land-Use Change. Glob. Ecol. Biogeogr. 2010, 19, 423–431. [Google Scholar] [CrossRef]
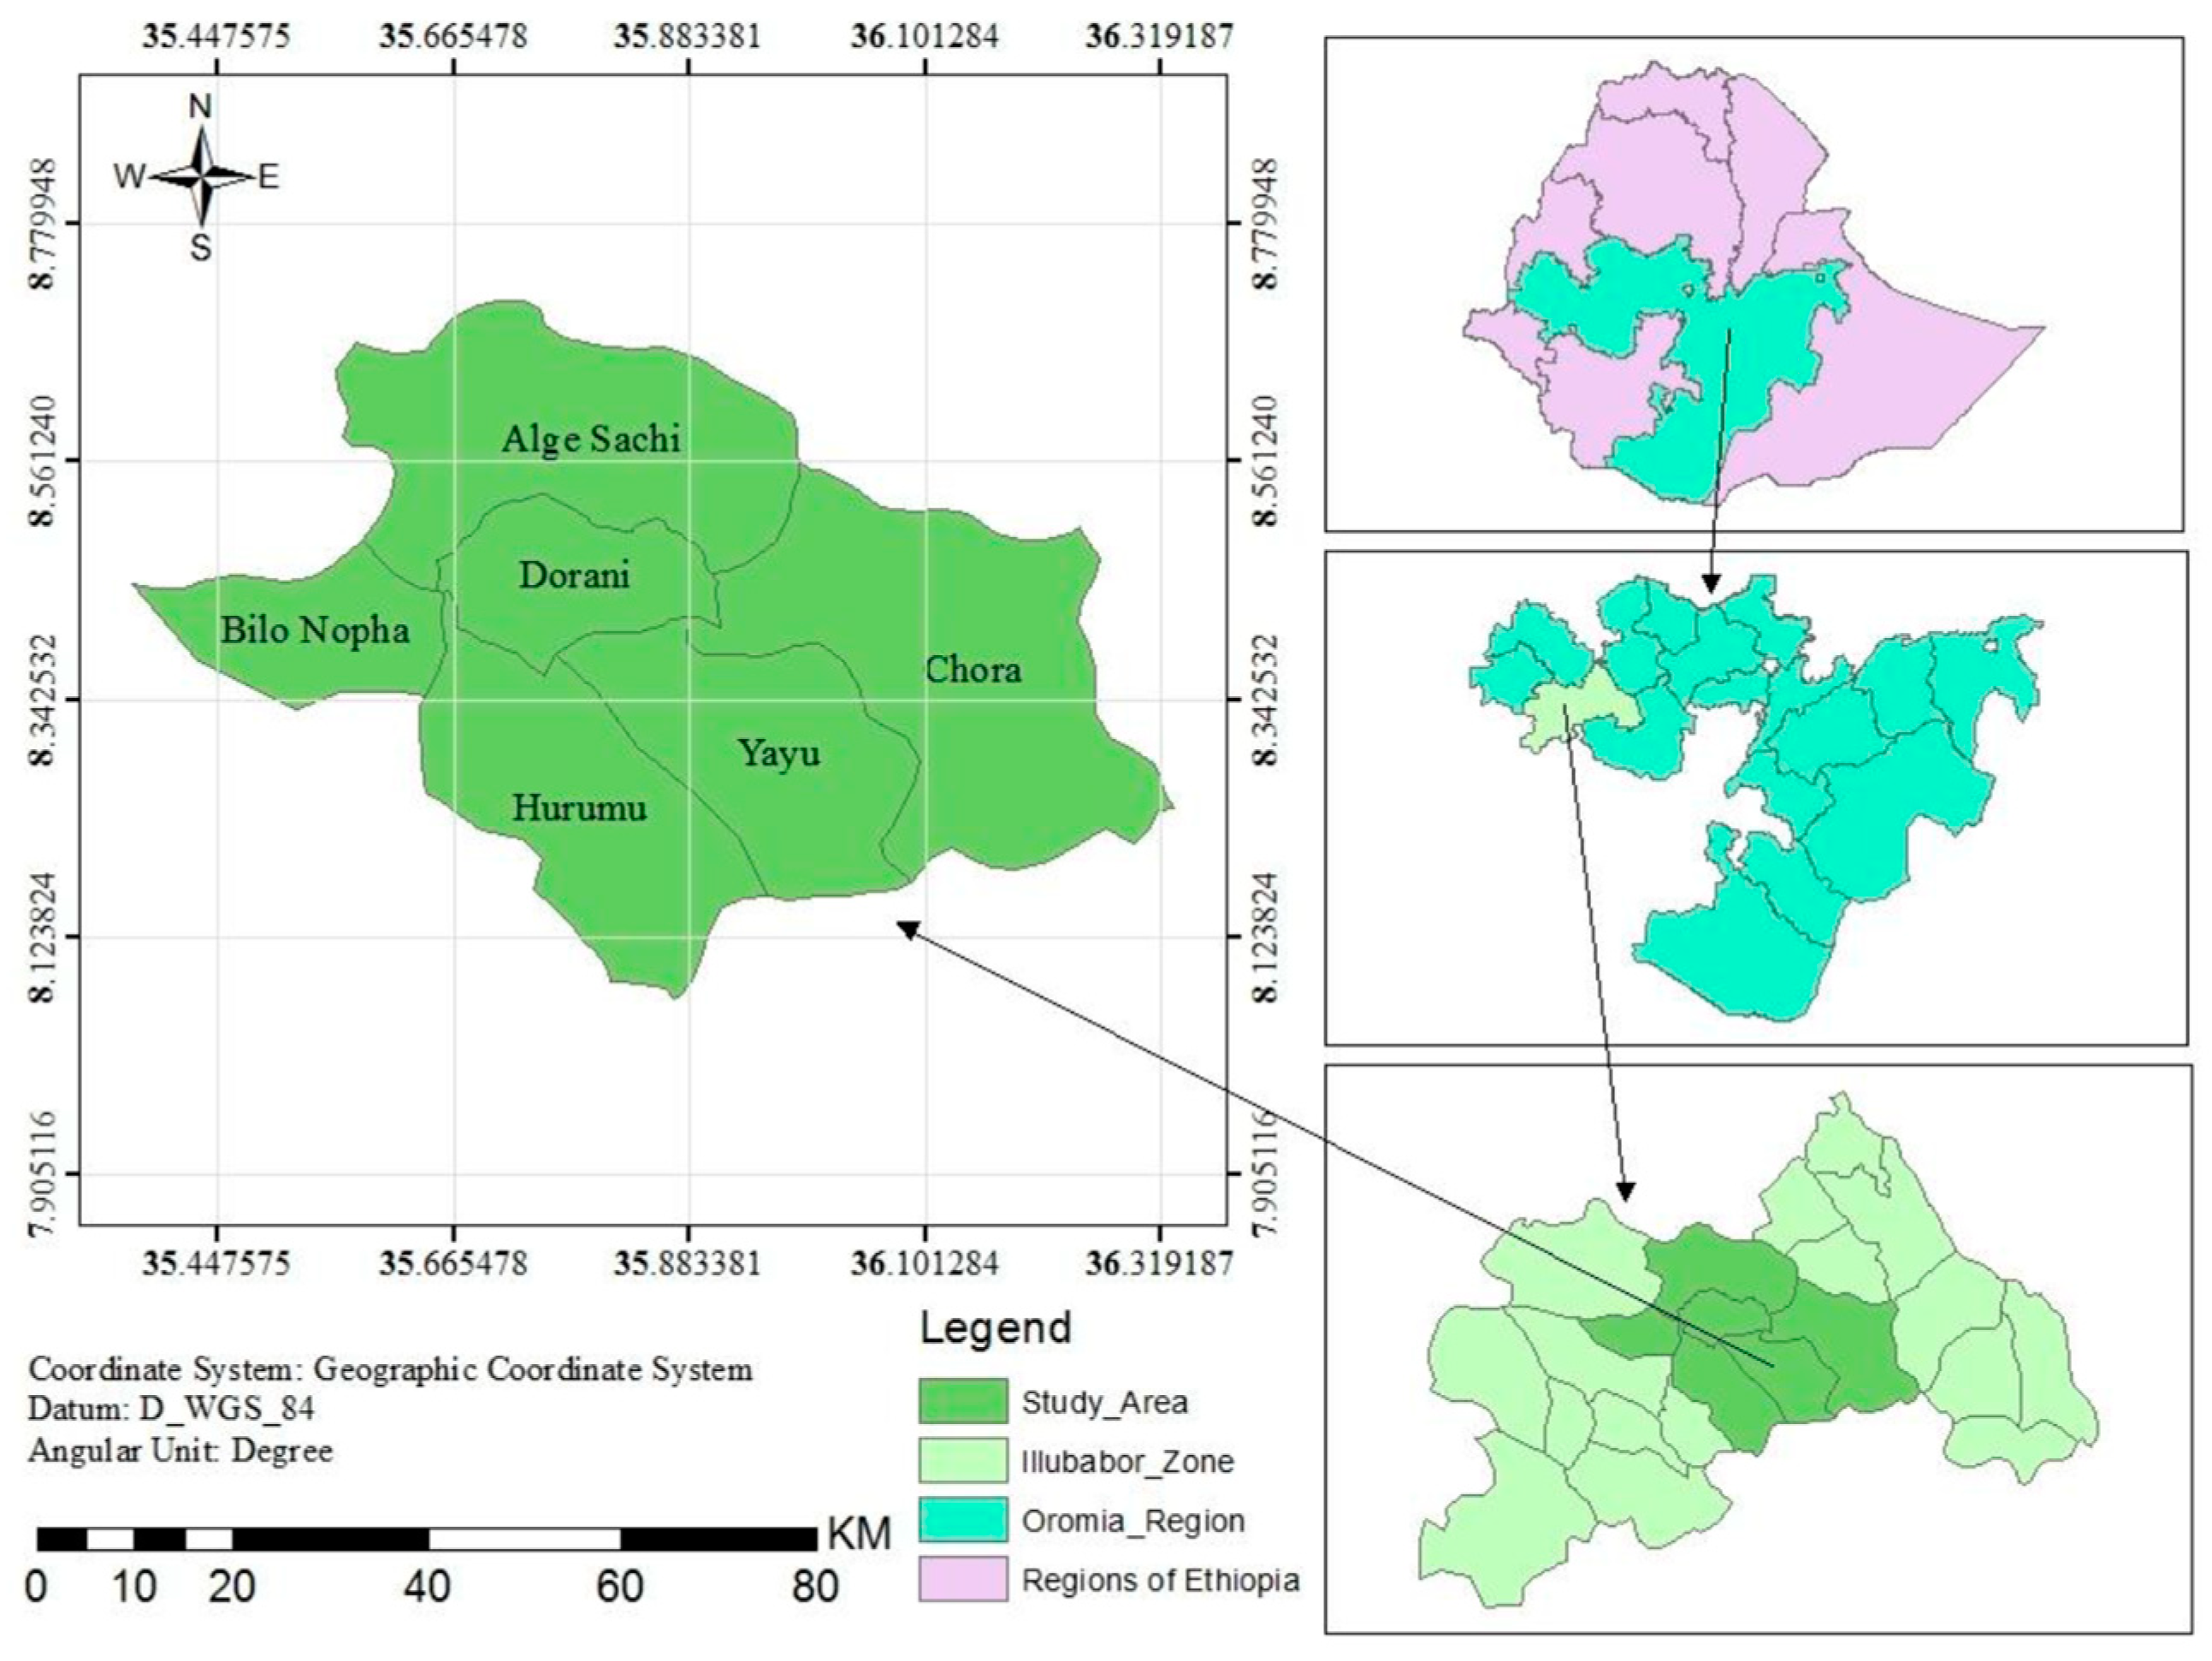
Figure 1. Map of study area (Yayu Coffee Forest Biosphere Reserve).
Preprints 79092 g001
Figure 2. Climate diagram results for the study area for the rain fall (mm) and temperature (OC)
Preprints 79092 g002
Figure 3. Zones and transects showing the distributions of plots within zones of the study area.
Preprints 79092 g003
Figure 4. Changes of functional diversity indices of YCFBR along disturbance gradients (1= undisturbed forest sites, 2= slightly disturbed forest sites, 3=moderately disturbed forest sites, 4= Disturbed forest sites).
Preprints 79092 g004aPreprints 79092 g004b
Figure 5. Relationships between species richness and functional diversity indices of YCFBR, Southwest Ethiopia.
Preprints 79092 g005aPreprints 79092 g005b
Table 1. Spearman correlation coefficients between functional diversity indices and environmental factors of Yayu Coffee Forest Biosphere Reserve, Southwest Ethiopia.
FDp FRic FEve FDiv FDis CWM WD CWM SLA CWM Hmax CWM SM
Disturbance -0.46*** -0.54*** -0.51*** -0.44*** -0.70*** 0.11 0.61*** -0.75*** 0.81***
Slope 0.19 0.20 0.03 0.15 0.25* 0.10 -0.00 0.11 -0.12
Aspect 0.00 -0.02 0.02 0.09 -0.02 0.13 0.01 -0.03 -0.02
Elevation -0.44*** -0.49*** -0.34** -0.43*** -0.52*** -0.016 0.39*** -0.44*** 0.52***
Note: * p < 0.05, ** p < 0.01, *** p < 0.001.
Table 2. Mixed effects model representing the effects of aspects and disturbance gradients on functional diversity components with 'type III' analysis of variance and Satterthwaite's methods.
FunctionalDiversity Component Effect Estimate d.f. SE P Value
FDp Aspect 0.015 81.615 0.007 0.029 *
Disturbance 2.311 83.147 0.565 9.84e-05 ***
FRic Disturbance 1.400 83.104 0.520 0.009 **
FEve Aspect 0.001 82.947 0.0004 0.027 *
disturbance 0.069 16.181 0.029 0.031 *
FDiv Aspect 0.002 82.960 0.0007 0.047 *
FDis disturbance 0.277 83.05 0.032 2.38e-13 ***
CWM WD disturbance -0.079 83.928 0.030 0.011 *
CWM Hmax Disturbance 1.541 74.251 0.758 0.046 *
CWM SM Disturbance -2.196 83.033 0.144 < 2e-16 ***
Notes: d.f. =degrees of freedom, SE = standard error, *** = P < 0.001, ** = P < 0.01, * = P < 0.05), P=value for the significant level effects.
Table 3. Spearman correlation coefficients between species diversity and functional diversity indices of Yayu Coffee Forest Biosphere Reserve, Southwest Ethiopia.
Functional Diversity Components Species Richness (S) Shannon Weiner Diversity (H') Evenness Index (E)
FDp 0.70 *** 0.48*** 0.40***
FRic 0.64 *** 0.51*** 0.52***
FEve 0.41*** 0.50*** 0.37***
FDiv 0.33** 0.39*** 0.33**
FDis 0.46*** 0.63**** 0.72***
CWM SLA -0.36*** -0.56*** -0.51***
CWM WD -0.036 -0.30** 0.028
CWM Hmax 0.42*** 0.71*** 0.59***
CWM SM -0.55*** -0.86*** -0.57***
Notes: *** = P < 0.001, ** = P < 0.01, * = P < 0.05.
Disclaimer/Publisher’s Note: The statements, opinions and data contained in all publications are solely those of the individual author(s) and contributor(s) and not of MDPI and/or the editor(s). MDPI and/or the editor(s) disclaim responsibility for any injury to people or property resulting from any ideas, methods, instructions or products referred to in the content.
Copyright: This open access article is published under a Creative Commons CC BY 4.0 license, which permit the free download, distribution, and reuse, provided that the author and preprint are cited in any reuse.
Prerpints.org logo

Preprints.org is a free preprint server supported by MDPI in Basel, Switzerland.

Subscribe

© 2024 MDPI (Basel, Switzerland) unless otherwise stated