Preprint
Article

Scientific Research Support for the Construction and Operation of Inwashed Tailing Dumps at Operating Sites

Altmetrics

Downloads

98

Views

25

Comments

0

A peer-reviewed article of this preprint also exists.

Submitted:

10 July 2023

Posted:

11 July 2023

You are already at the latest version

Alerts
Abstract
Accidents at mining enterprises, including tailing dumps, pose significant threats to human lives, structures, and the environment. This study focuses on designing, constructing, and operating tailing dumps in Siberia's northern region. To ensure safety and minimize environmental impacts, comprehensive scientific monitoring and research were conducted at all stages, including design, construction, operation, and disposal. The aim was to create a uniform mass within the dam body, requiring understanding of the tailings' structure and technological characteristics during placement. Parameters like particle size, distribution, density, and moisture content were considered to assess tailings' physical and geometric properties. Estimated monitoring was introduced as a permanent model to quickly assess the stability of hydrotechnical constructions. This involved monitoring changes in exploitation properties, structure height, beach length, and water levels. A controlled inwashing technology for subsequent dam layers was developed. Complex research facilitated the formulation of an estimated monitoring methodology and an algorithm for tailing dam formation. Practical application demonstrated high reliability and confirmed load-bearing capacity, allowing for the forecast of dam stability and safe execution. Findings led to alterations in work techniques, ensuring safe and efficient operation of tailing dams.
Keywords: 
Subject: Environmental and Earth Sciences  -   Waste Management and Disposal

1. Introduction

Accidents at mining enterprises, including tailing dumps, occur almost every year in various countries. The reported damages highlight a significant threat posed by reservoirs of various origins to human lives, engineering structures, and the surrounding environment [1].
Currently, the mining industry plays a key role in meeting humanity's needs for valuable minerals. However, along with the process of extracting natural resources, there is a need for effective processing and disposal of the waste generated by this activity. Tailings storage facilities become a central element in addressing this issue, providing a place for the collection and storage of mining industry waste [1,2,3,4,5].
However, the construction and operation of tailings storage facilities present complex and multifaceted challenges that require a scientific approach and research efforts to ensure their safety and sustainability. Scientific research in this field plays an important role in developing optimal methods and technologies for constructing tailings storage facilities, as well as finding ways to minimize their negative impact on the environment [1].
Scientific monitoring is necessary at all stages:
  • design;
  • construction;
  • operation;
  • disposal.
For inwashed tailing dumps, tailings simultaneously serve as a valuable construction material used in the creation of such dumps. By processing and compacting the tailings, it is possible to form engineering structures such as dams, embankments, or protective barriers. This enables the efficient utilization of available resources and reduces the need for additional construction materials, thus minimizing costs.
Issues of environmental safety for existing industrial waste storage facilities are of particular importance, since almost all tailings are long-term sources of negative impacts on the atmosphere, hydrosphere, soil and vegetation cover, and change existing landscapes. The assessment of the degree and scale of pollution of the territory and water resources (specific surface watercourses) is carried out on the basis of geoinformation mapping of the environment for various territories both in our country and abroad. However, due to the uniqueness of each tailing facility due to the specifics of production. characteristics of the territory (relief, location, climate, etc.), these results are of limited use. Each tailing dump requires its own research. [1]
Assessing the impact of tailings storage facilities on the environment is also a crucial aspect of scientific research in this field. Research allows us to assess potential risks to human health and the environment, determine optimal ways to minimize the impact on natural resources, and develop measures for restoring the natural environment.
In recent years, numerous studies have been conducted to investigate the processes of waste formation and containment, analyze potential risks, prevent accidents, develop efficient monitoring systems, and control the condition of tailings storage facilities. These studies help optimize the selection of materials for building tailings storage facilities, improve methods and technologies for their construction, and develop reliable systems to prevent leaks and environmental accidents [1,6].
The work presented provides an overview of our recent scientific research aimed at supporting the construction and operation of tailings storage facilities at active industrial sites. It discusses methods and technologies for building tailings storage facilities, analyzes research findings on waste processing, evaluates the impact of tailings storage facilities on the environment, and considers measures to prevent accidents.
The significance of scientific research in the field of tailings storage facilities cannot be underestimated. These studies not only improve the technologies and methods of constructing tailings storage facilities but also develop new approaches to waste processing and disposal in the mining industry.
We hope that this article contributes to raising awareness about the need for scientific and technical support in the field of tailings storage facilities and stimulates further research on this important and relevant topic. Understanding and applying the results of scientific research will help engineers, designers, and environmentalists develop more efficient and safe systems for storing and disposing of mining industry waste, thereby promoting sustainable development in this industry sector.

2. Case History

The set objectives were successfully achieved in several significant projects, where all the mentioned stages were carried out.
The object of research of the present work is the tailing dumps, located on the North of Siberia.
In northern regions of Russia - the areas of large mining and metallurgical enterprises dozens of million cubic meters of different deposits have been accumulating for a long time in the tailing dumps
The tailing dams inwashing processes are produced in spring and summer, when the average daily temperature is above -5°C [1]. Based on the operating conditions of alluvial storage in permafrost, it should be noted that the increase in the annual capacity of alluvial layer may not provide its complete consolidation process during short spring-summer period (3-4 months) before freezing in winter, and thus it will reduce the stability of the structure. In order to optimize the inwash technology of tailing dam it is necessary to determine the time of tail’s consolidation [7,8].
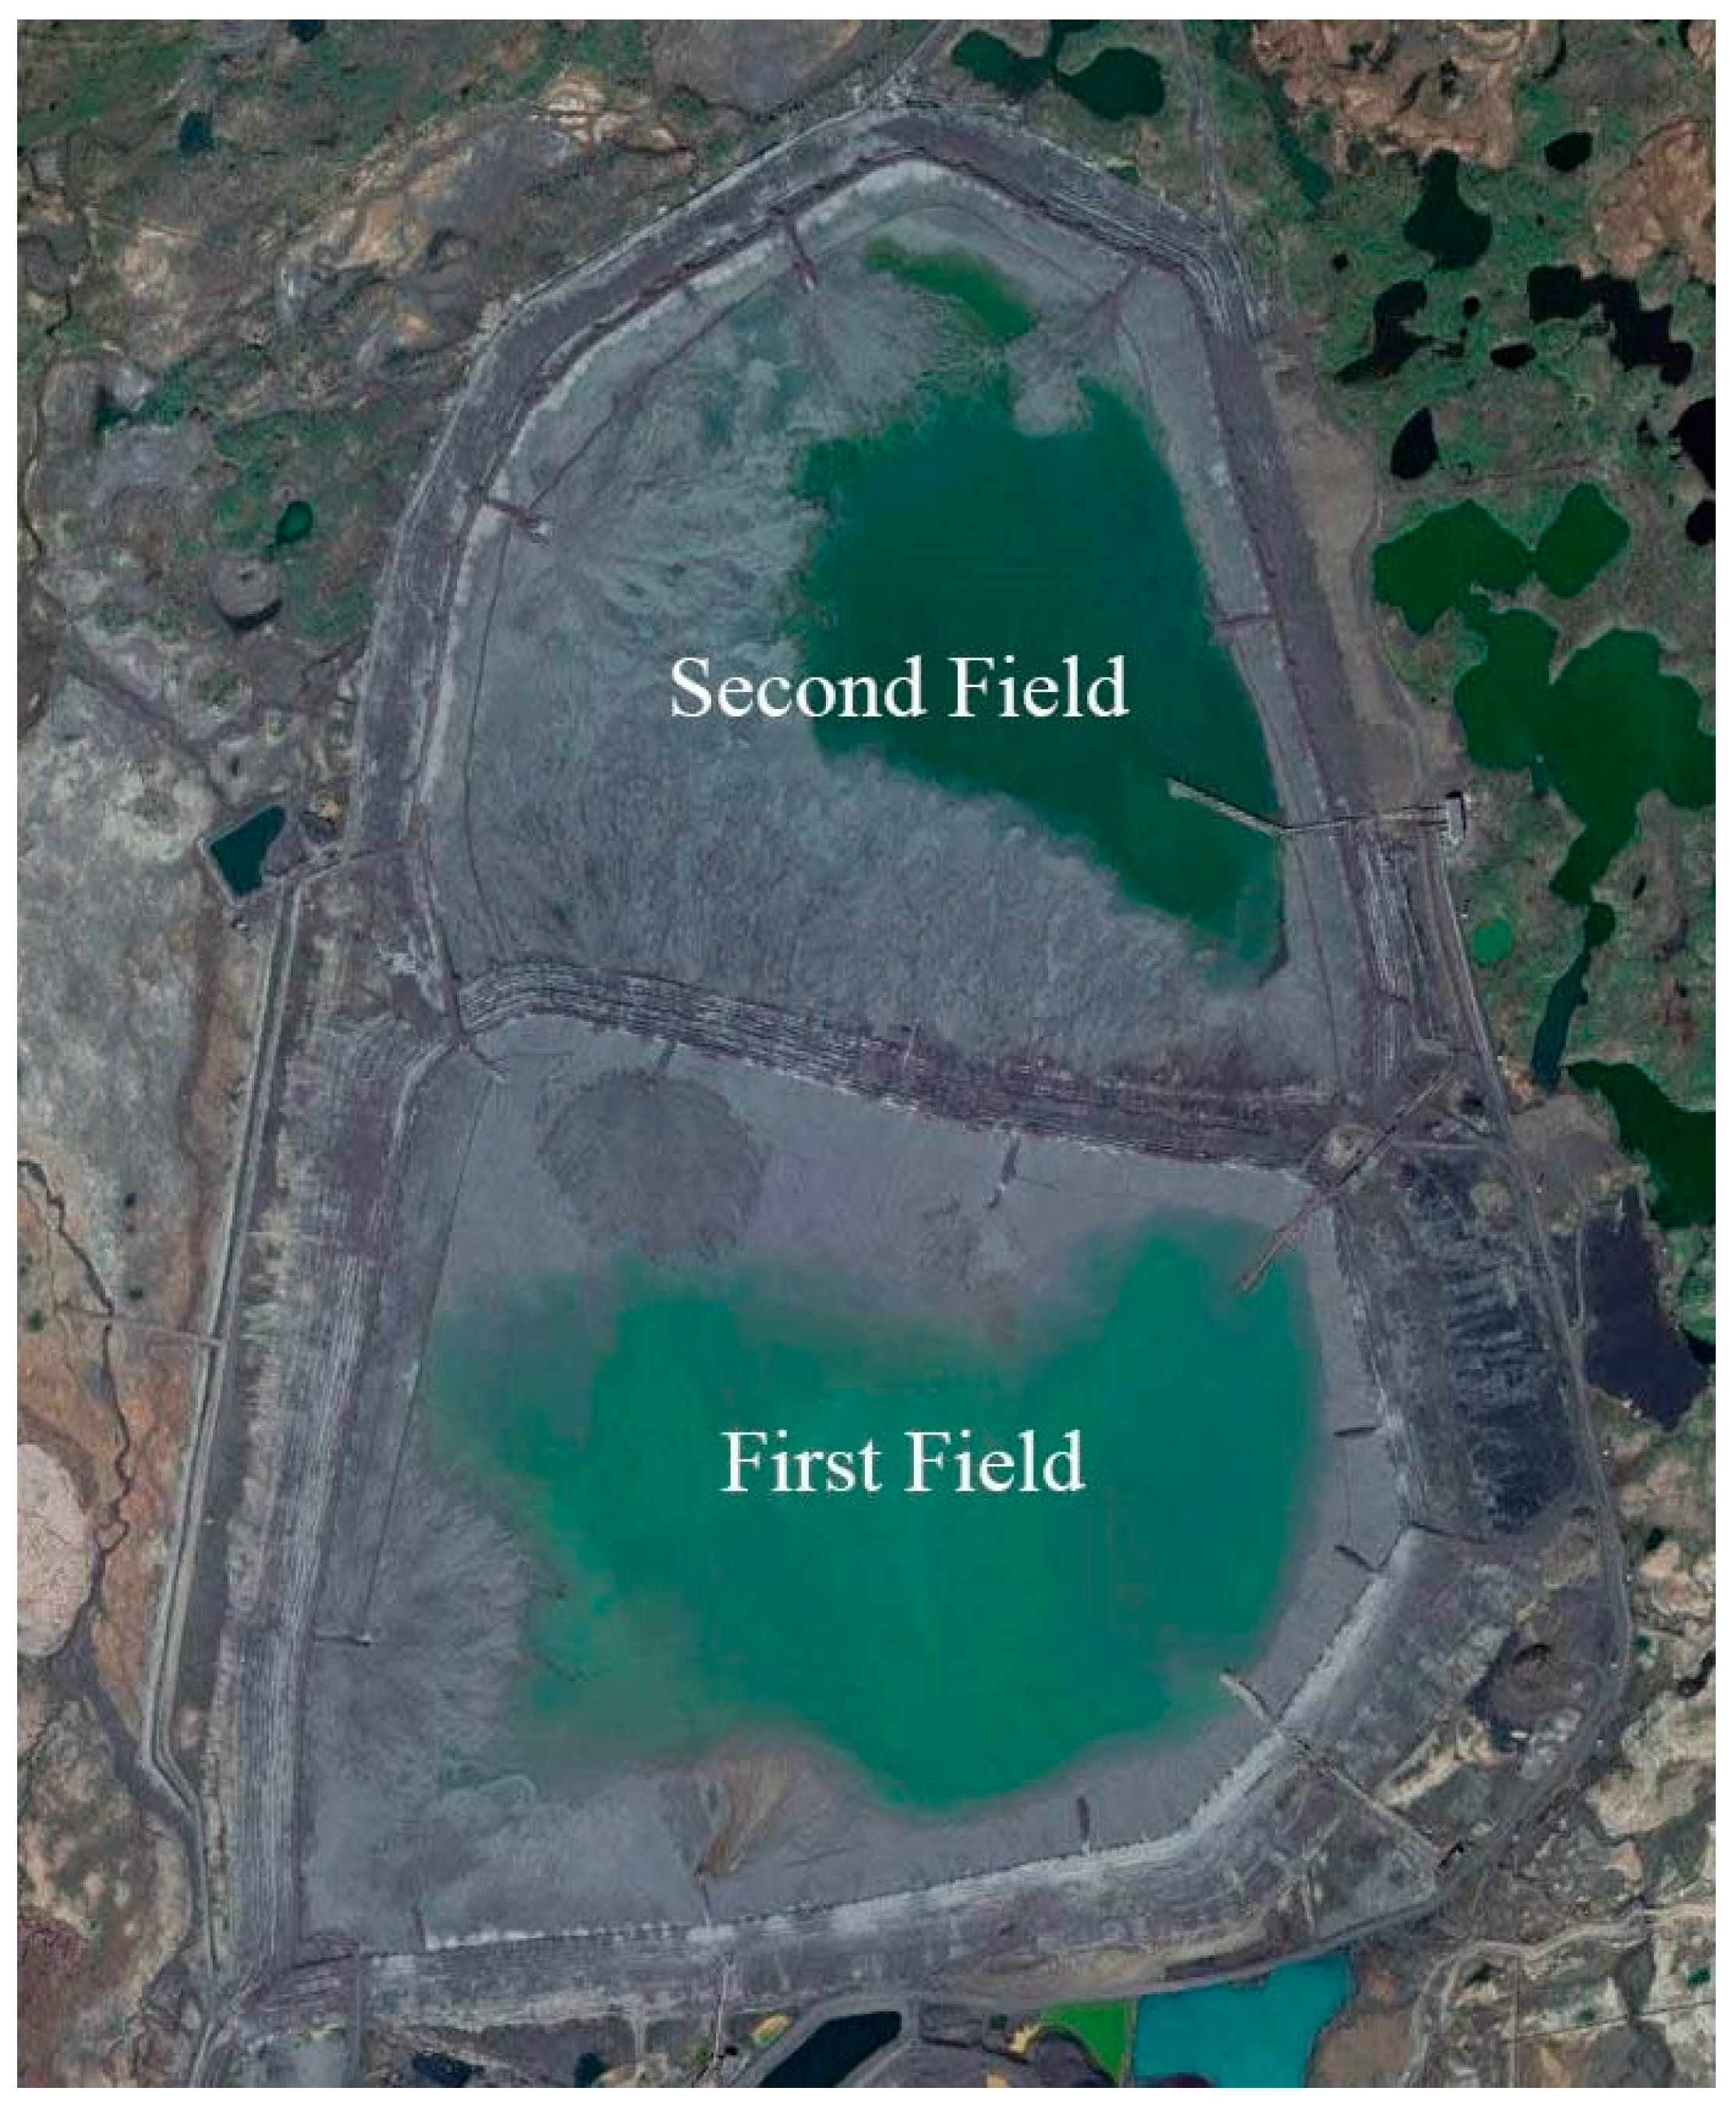
During the design, construction and operation of tailing dumps located in North of Siberia, comprehensive scientific monitoring and research were conducted. Scientific studies and monitoring were carried out to ensure the safety of the structures and minimize their negative impact on the environment (Figure 1).
The utilization of the disposal area started in 1983, marking the beginning of its operation. At that time, the first pond's dam was constructed, reaching an approximate height of 70 meters. Several years later, in 2006, to accommodate additional waste, a second tailing pond was introduced to the existing tailing dump. This second pond is still undergoing construction. Its dam stands at a height of approximately 50 meters. As a result, the tailing dump now consists of a cascade arrangement of multiple dumps, with each dam having a height difference of about 20 meters between them. It is planned that the tops of both dams will eventually reach a height of 90 meters, allowing for effective containment and management of the waste materials [1,8].
The constructive characteristics of the first pond and dam are as follows:
  • The disposal area covers an area of 4.02 square kilometers.
  • The tailing dam is constructed as a persistent drainage prism using metallurgical slag:
    • The width of the prism is 8 meters.
    • The length of the prism is 8500 meters.
  • The capacity of the disposal area is 16.7 million cubic meters.
  • The height of the dam is 39.3 meters.
  • The inclination of the top drain level is 1:50.
  • The inclination of the bottom slope is 1:4.
  • The maximum depth of the pool is 4.7 meters.
  • The average depth of the pool is 2.5 meters.
The constructive characteristics of the second pond and dam are as follows:
  • The disposal area covers an area of 2.4 square kilometers.
  • The tailing dam is constructed as a persistent drainage prism using metallurgical slag:
    • The width of the prism is 8 meters.
    • The length of the prism is 4313 meters.
  • The capacity of the disposal area is 16.7 million cubic meters.
  • The expected operational lifespan is 20 years.
  • The height of the dam is 19-20 meters.
  • The inclination of the top drain level is 1:50-1:100.
  • The inclination of the bottom slope is 1:4-1:5.
  • The maximum depth of the pool is 5.2 meters.
  • The average depth of the pool is 2.9 meters. [1,8].
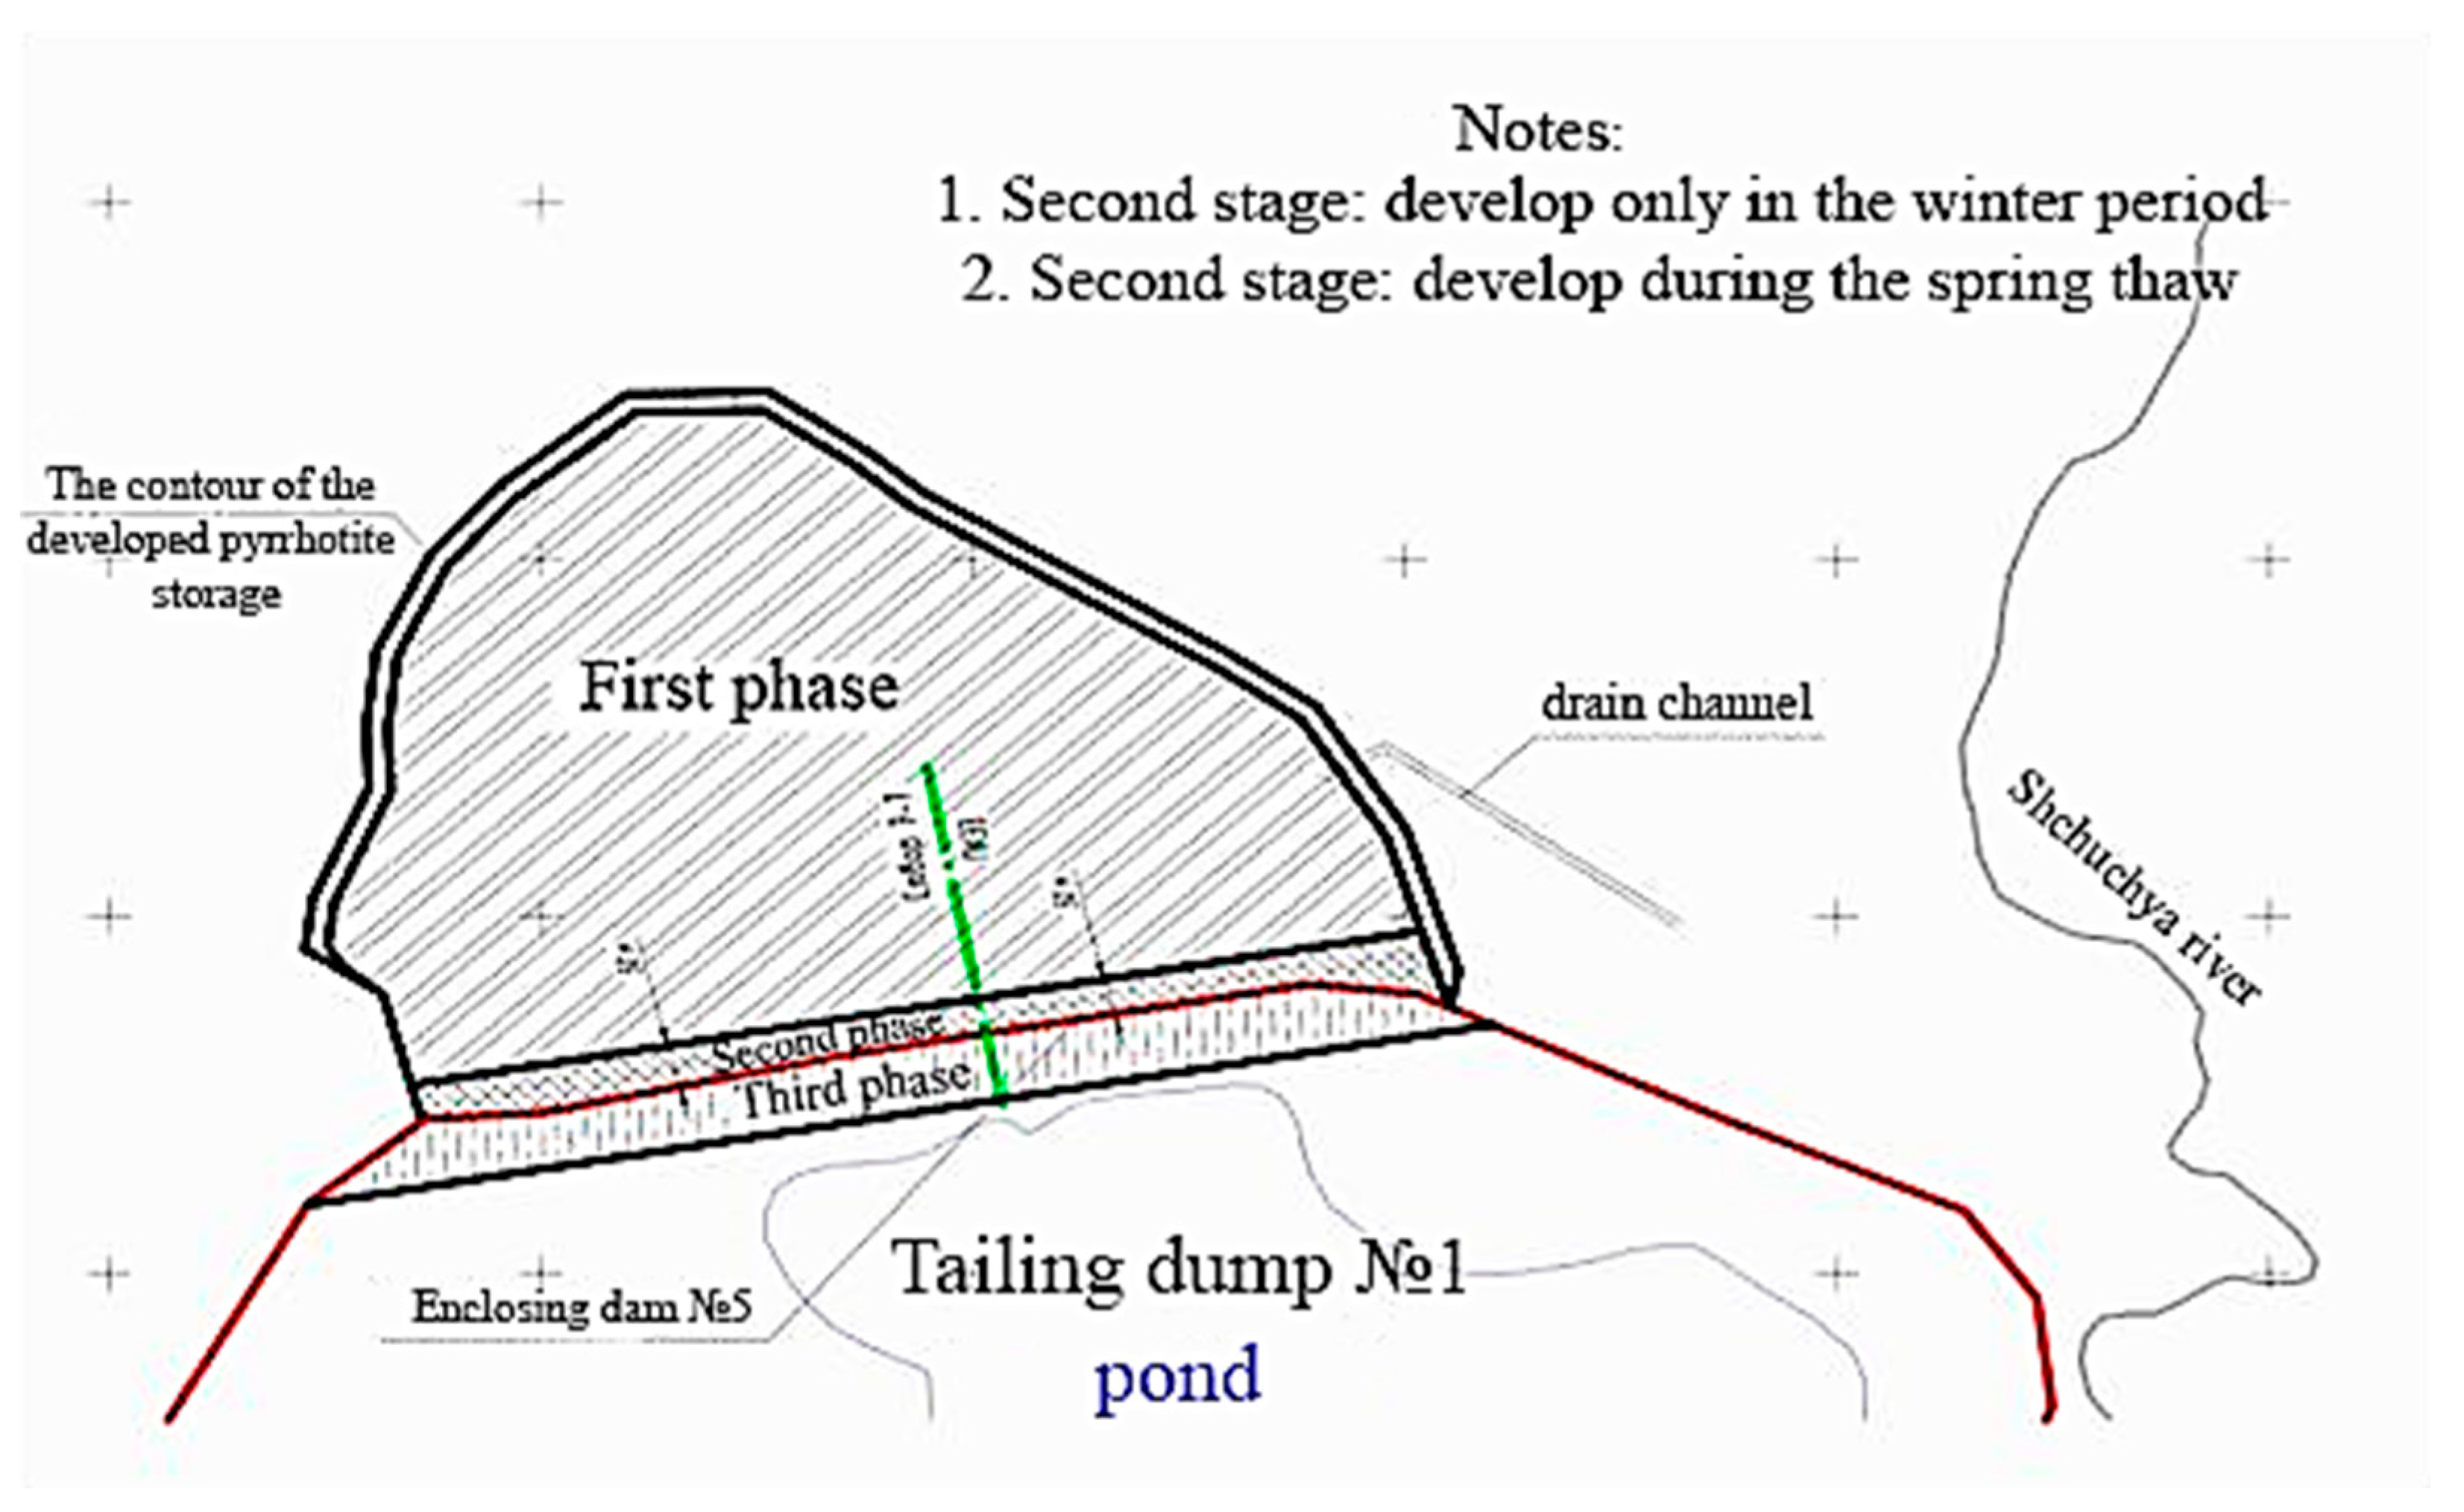
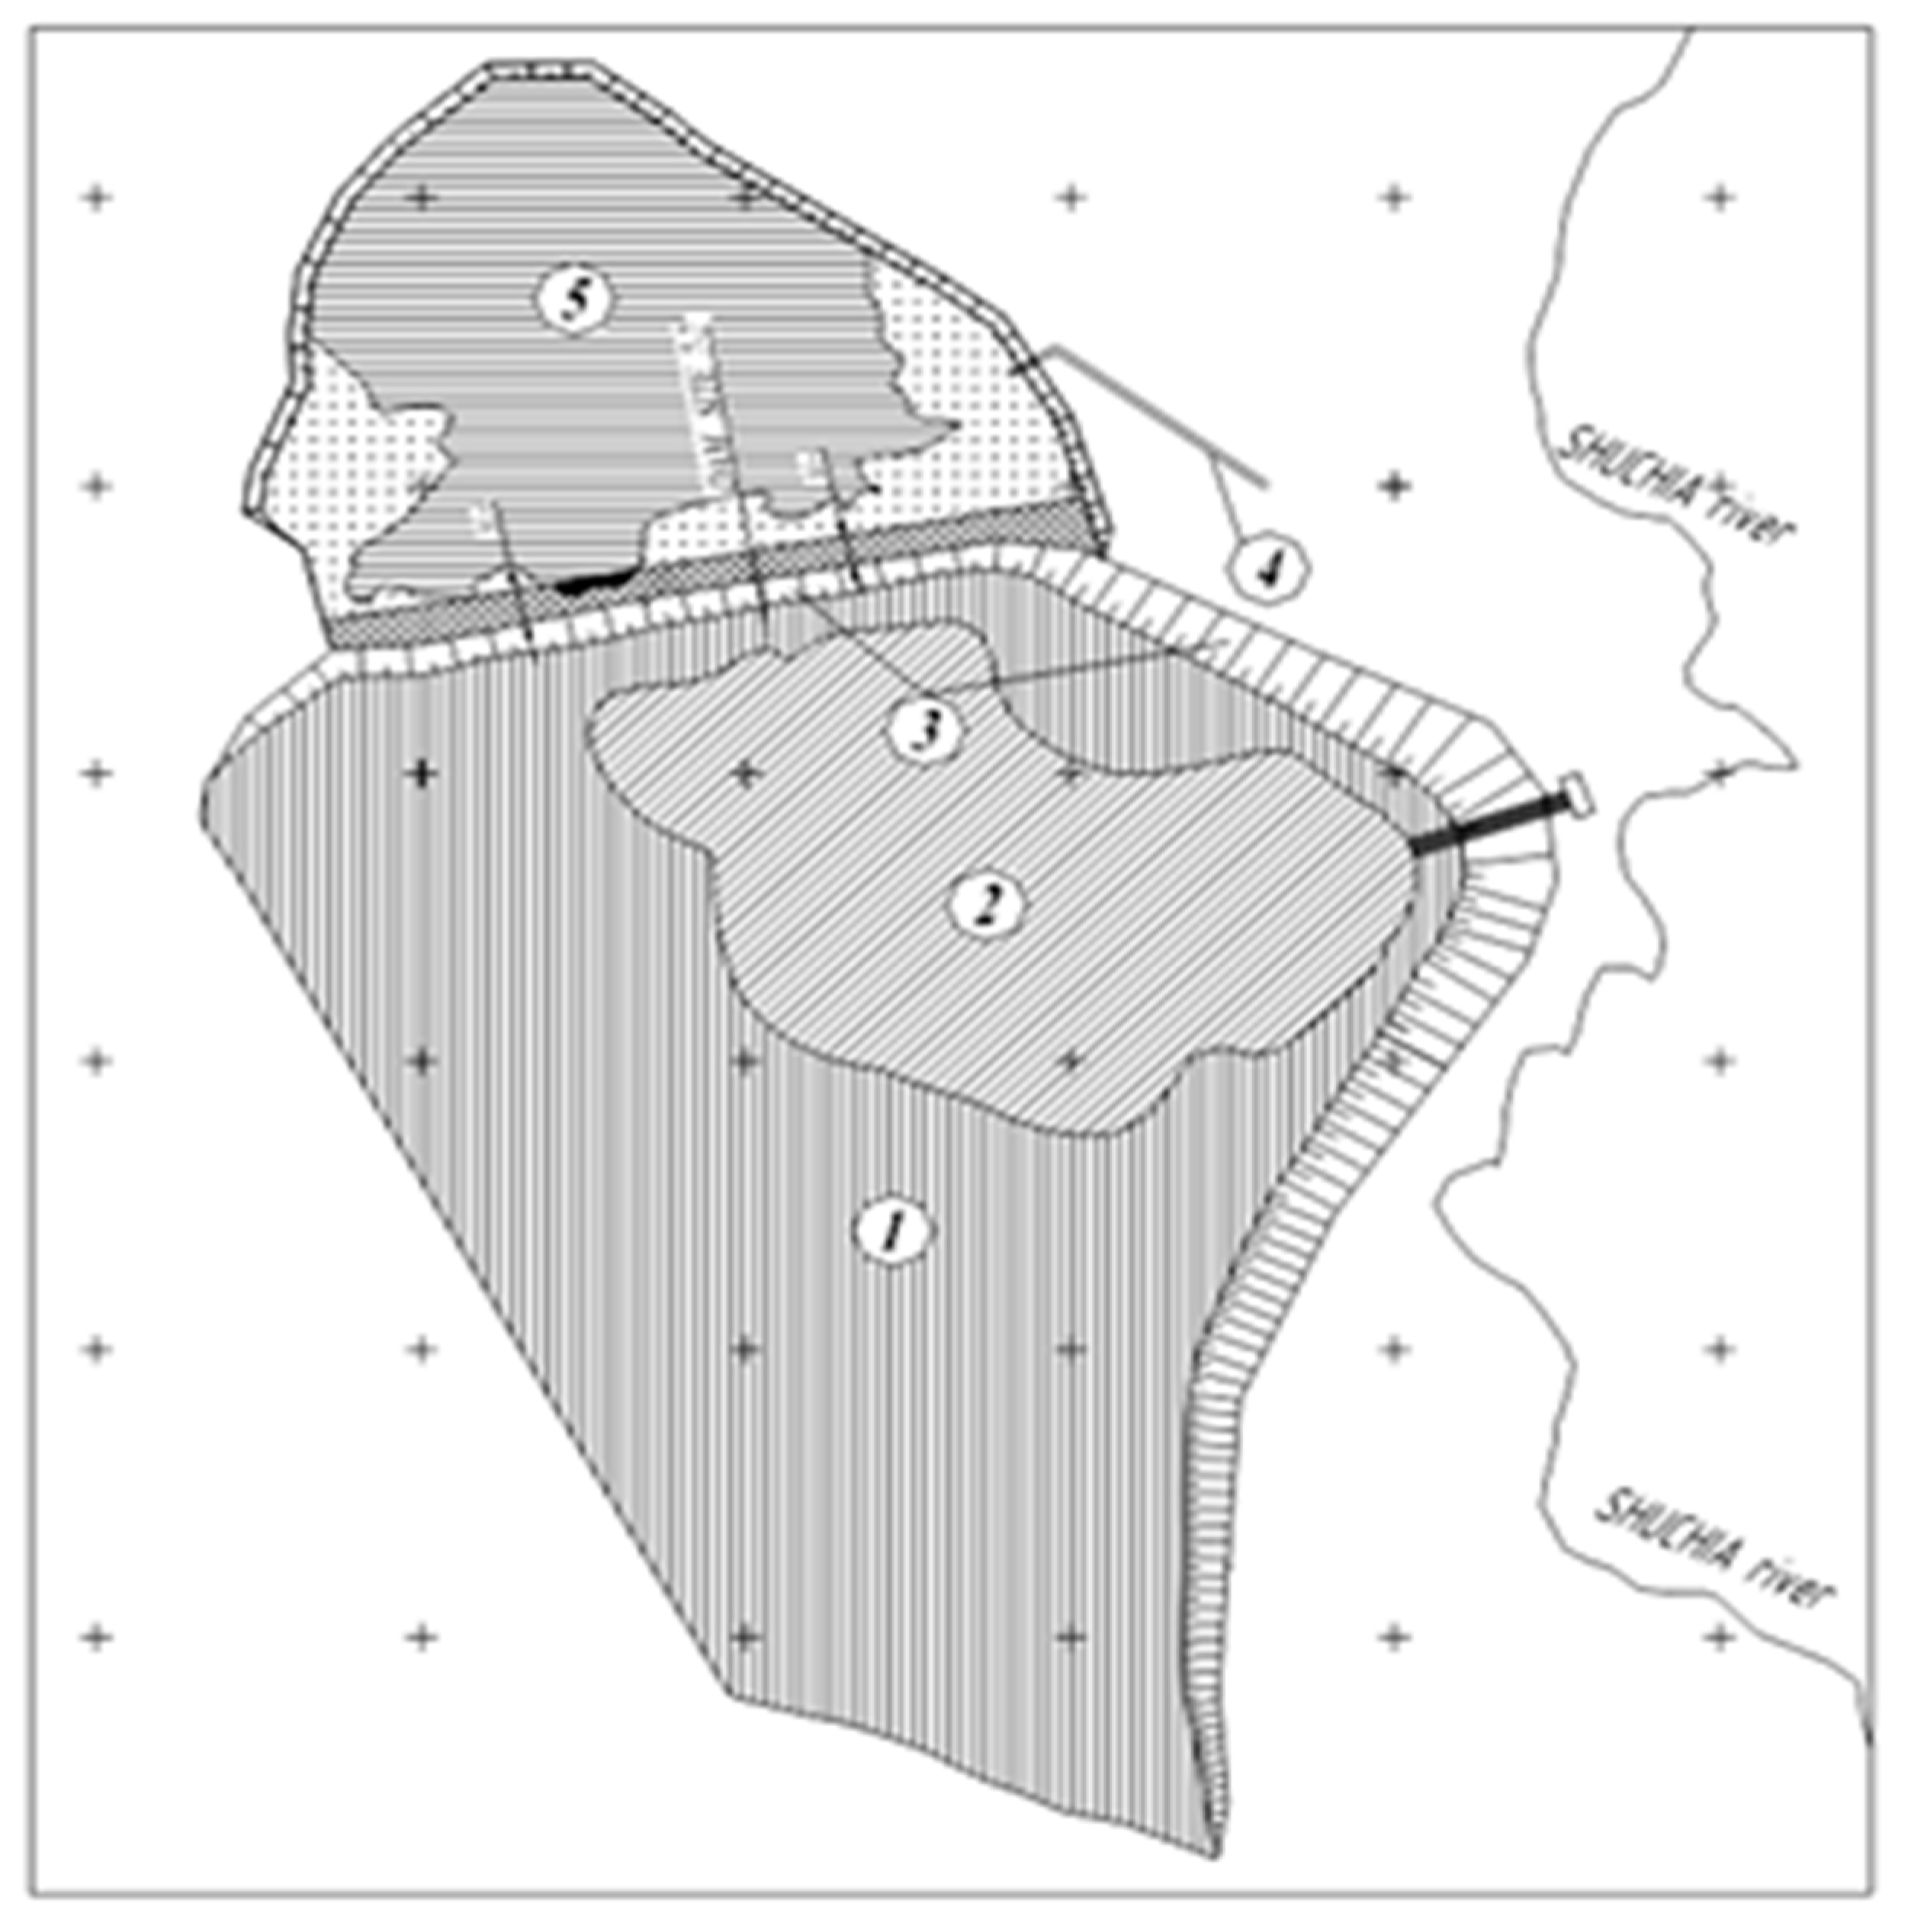
The disposal process for tailing dump№1 was accompanied by comprehensive monitoring and scientific support. The situation plan of the tailing dump is shown in Figure 2.
The constructive characteristics of dam are:
  • the disposal area – 715 000 sq. ms
  • the length of the tailing dam - 4.41 kms
  • the height of dam - 56.7 m;
  • the inclination of a top drain level - 1:20-1:30
  • the inclination of a bottom slope - 1: 3
  • the maximal depth of pool – 4.0 m
  • the average depth of pool – 0.4 m [8]
The basis of pool and dam is layered by frozen artificial, alluvial and moraine soils with gravel and pebble with sand, loam and loam additions. The thickness of the stratum is of 5-60 m. The underlaying layer is heterogeneous rock.
Problems of stability of the structure are connected with the fact that the levee of the tailing dump was erected by the principle I (frozen condition), with application of freezing columns as the basic method of structure protection. During the operation and preservation of the damp the freezing system has failed, and now the maintenance of the stability of object consists in passing the flood waters and keeping safe water level in pond zone. Thus during the summer-autumnal period on downstream side of a dam egresses and separate earthflows are observed.
In the tailing dump №1 the tails had been stored from 1948 to 1975. After commissioning of the tailing dump №2 in 1976, the dump №1 had been used from 1976 to 1987 as a backwater basin.
Since 1987 the tailing dump has served as a construction for reception of drain, regulation and passing of flood waters and for accumulation of surface-water flow arriving on the water –collecting area of the tailing dump in the form of atmospheric precipitation.
Now on the tailing dump №1 the hydromechanized lifting and reprocessing of stale tails with extraction of non-ferrous metals and precious metals is carried out. In the magnetic pyrite depository №2 which is located in the basis of a downstream side of the tailing dump №1 the works on lifting of magnetic pyrite concentrate with the help of hydromechanization are being done [8].
Condition of the local dam of the tailing dump №1 in the place where it adjoins the magnetic pyrite depository is unsatisfactory. Lifting of stale concentrate and tails in a hydromechanized way can entail destruction of the local dam, filling of the worked-out area of the magnetic pyrite depository №2 and loss of valuable raw materials.

3. Methods

3.1. Design and Construction

In the conventional approach, stability calculations for the tailing dam are typically conducted during the design phase with a certain level of safety margin considered [8].
As already noted since 1997, a controlled inwash technology has been implemented for the dam. This method includes constructing a retaining prism using metallurgical slag, on top of which a metal distributing slurry pipeline is installed. Furthermore, a ring slag fill is built in the beach zone, positioned at a specific distance from the axis of the distributing slurry pipeline. This fill serves the purpose of retaining solid particles within the beach zone while also allowing for water to flow into the pool with increased illumination.
The scheme of the dam inwash is shown in Figure 3.
Further, during the construction of the dam and the alluvium of the
As a result of mutual research-and-production investigations the technology of controlled inwashing of the dam subsequent layers was designed [9]. It includes the following operations:
  • the construction of the retaining prism of metallurgical slag. The metal distributing slurry pipeline is laid on it;
  • the construction of ring slag fills in the beach zone at the specific distance from the axis of the distributing slurry pipeline. It retains the solid particles in the beach zone and simultaneously it clearing the water coming into the pool.
The scheme of the dam inwash is shown in Figure 4.
Functions of a slurry collecting prism in operation of an inwash are the following:
  • placing of prism on various distances from distributive slurry pipeline allows regulating intensity of an inwash;
  • slurry collecting prism promotes more intensive consolidation of hydraulic fill tails and increase of stability of a dam;
  • it allows operating of bottom contour formation in pond zone that is rather an important factor that provides winter storing of tails under ice;
  • it promotes more intensive frost penetration in an inwash massif that raises its static and filtration stability and in that way provides environmental safety of the tailing dump;
  • it carries out reinforcing a body of a levee function.
However, it is important to note that additional calculations can only be carried out in specific cases where there are modifications made to the mining or extraction technology. Unfortunately, this means that issues pertaining to industrial and environmental safety concerning tailings often lack consistent monitoring, which can contribute to unforeseen accidents. As a consequence, the implementation of permanent monitoring is not practiced, leaving potential risks unattended to. This highlights the need for more rigorous and continuous monitoring practices to ensure the overall safety and sustainability of tailings management.
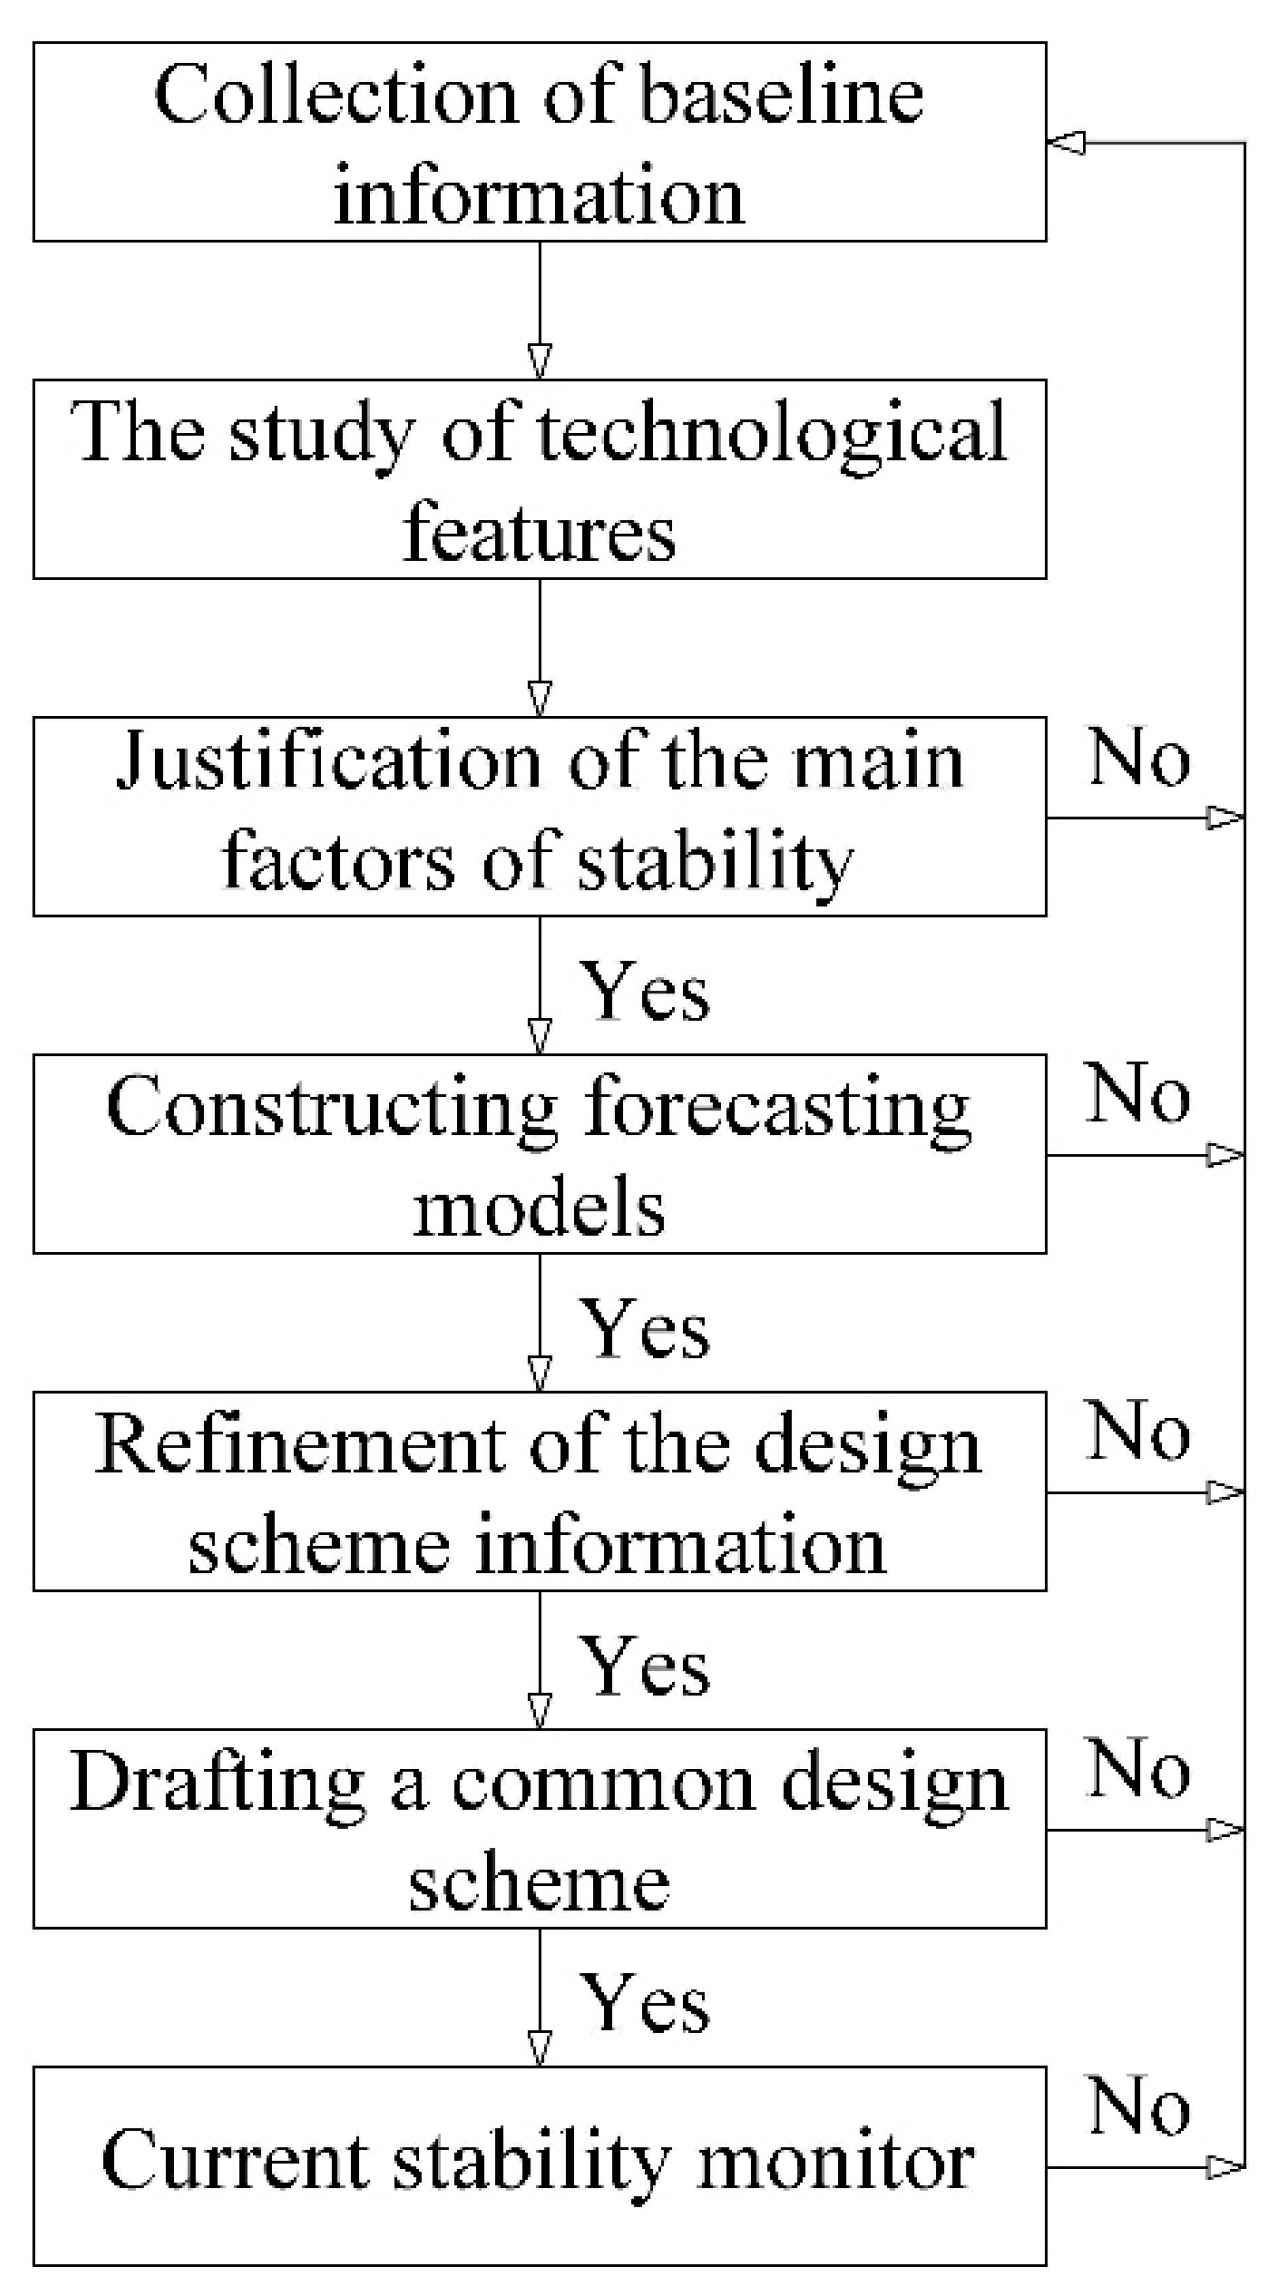
Carried out complex researches allows to formulate a methodology of the estimated monitoring for the tailing dam’s stability. The algorithm is shown in Figure 5.
Along with the standard set of observations the methodology of the estimated monitoring includes, the tailing dam’s stability calculations under changing techno-logical parameters of exploitation, observing geometric characteristics of construction and the properties of the inwashed tails [10].
The technique includes a number of successive operations.
At the first stage after receiving the research data on the structure and the properties of the composing inwashed soils, the preliminary calculations for the most typical cross-section and average values of physical and mechanical properties are conducted. The result is accepted as the baseline.
As the initial data for the calculation should be used the following materials [10,11]:
  • geology, geocryological and hydrogeological conditions, physical and mechanical properties of natural and artificial soils taken according to engineering studies, research and direct definitions and observations in the field and laboratory conditions;
  • geometrical parameters of structures defined by the direct geodetic works [8];
At the second stage while changing the values of soils characteristics towards increase and decrease was investigated the influence of the physico-mechanical properties of soils to the construction stability.
At the third stage, the influence on the tailing dam’s stability of the design parameters of height of dam and of angle of the foundations under constant values of physical and mechanical properties are tested.
At the fourth stage, the changes of physico-mechanical properties of inwashed soils during alluvion and subsequent consolidation are tested. It is recommended to study the physical and mechanical characteristics by microstructural analysis and modeling.
At the final stage the multivariate calculations of dam’s stability are conducted using all installed above patterns. The calculation were carried out by means of program UniFos. The program UniFos is a part of UWay complex and is intended for calculations of stability of soil constructions. It is written in object-oriented language C ++ with usage of optimising compiler Borland C ++ Borland International v.5.02 with library OWL usage v.5.0 [12].
The results are recorded in the database and can be replaced in the process of getting new data on the structure. Estimated maintenance of the tailing dam stability is comparing with the information obtained as a result of standard monitoring of hydraulic structures safety of with the existing database. And if, at least, one of the parameters will vary from the normalized values, the calibration calculations must be carried out and engineering activities must be designed to eliminate deviations.
Thus, the idea of the estimated monitoring of the stability of hydrotechnical constructions is presented as a permanent model quickly check the State of buildings when changing technology exploitation properties of alluvial soils, height of structures, the length of the beach, the water level in the body of the enclosing constructions, etc.
Taking into account the significant difference in elevation between the dams of the first and second fields, which amounts to almost 20 meters, it can be said that they form a cascading tailings storage facility.
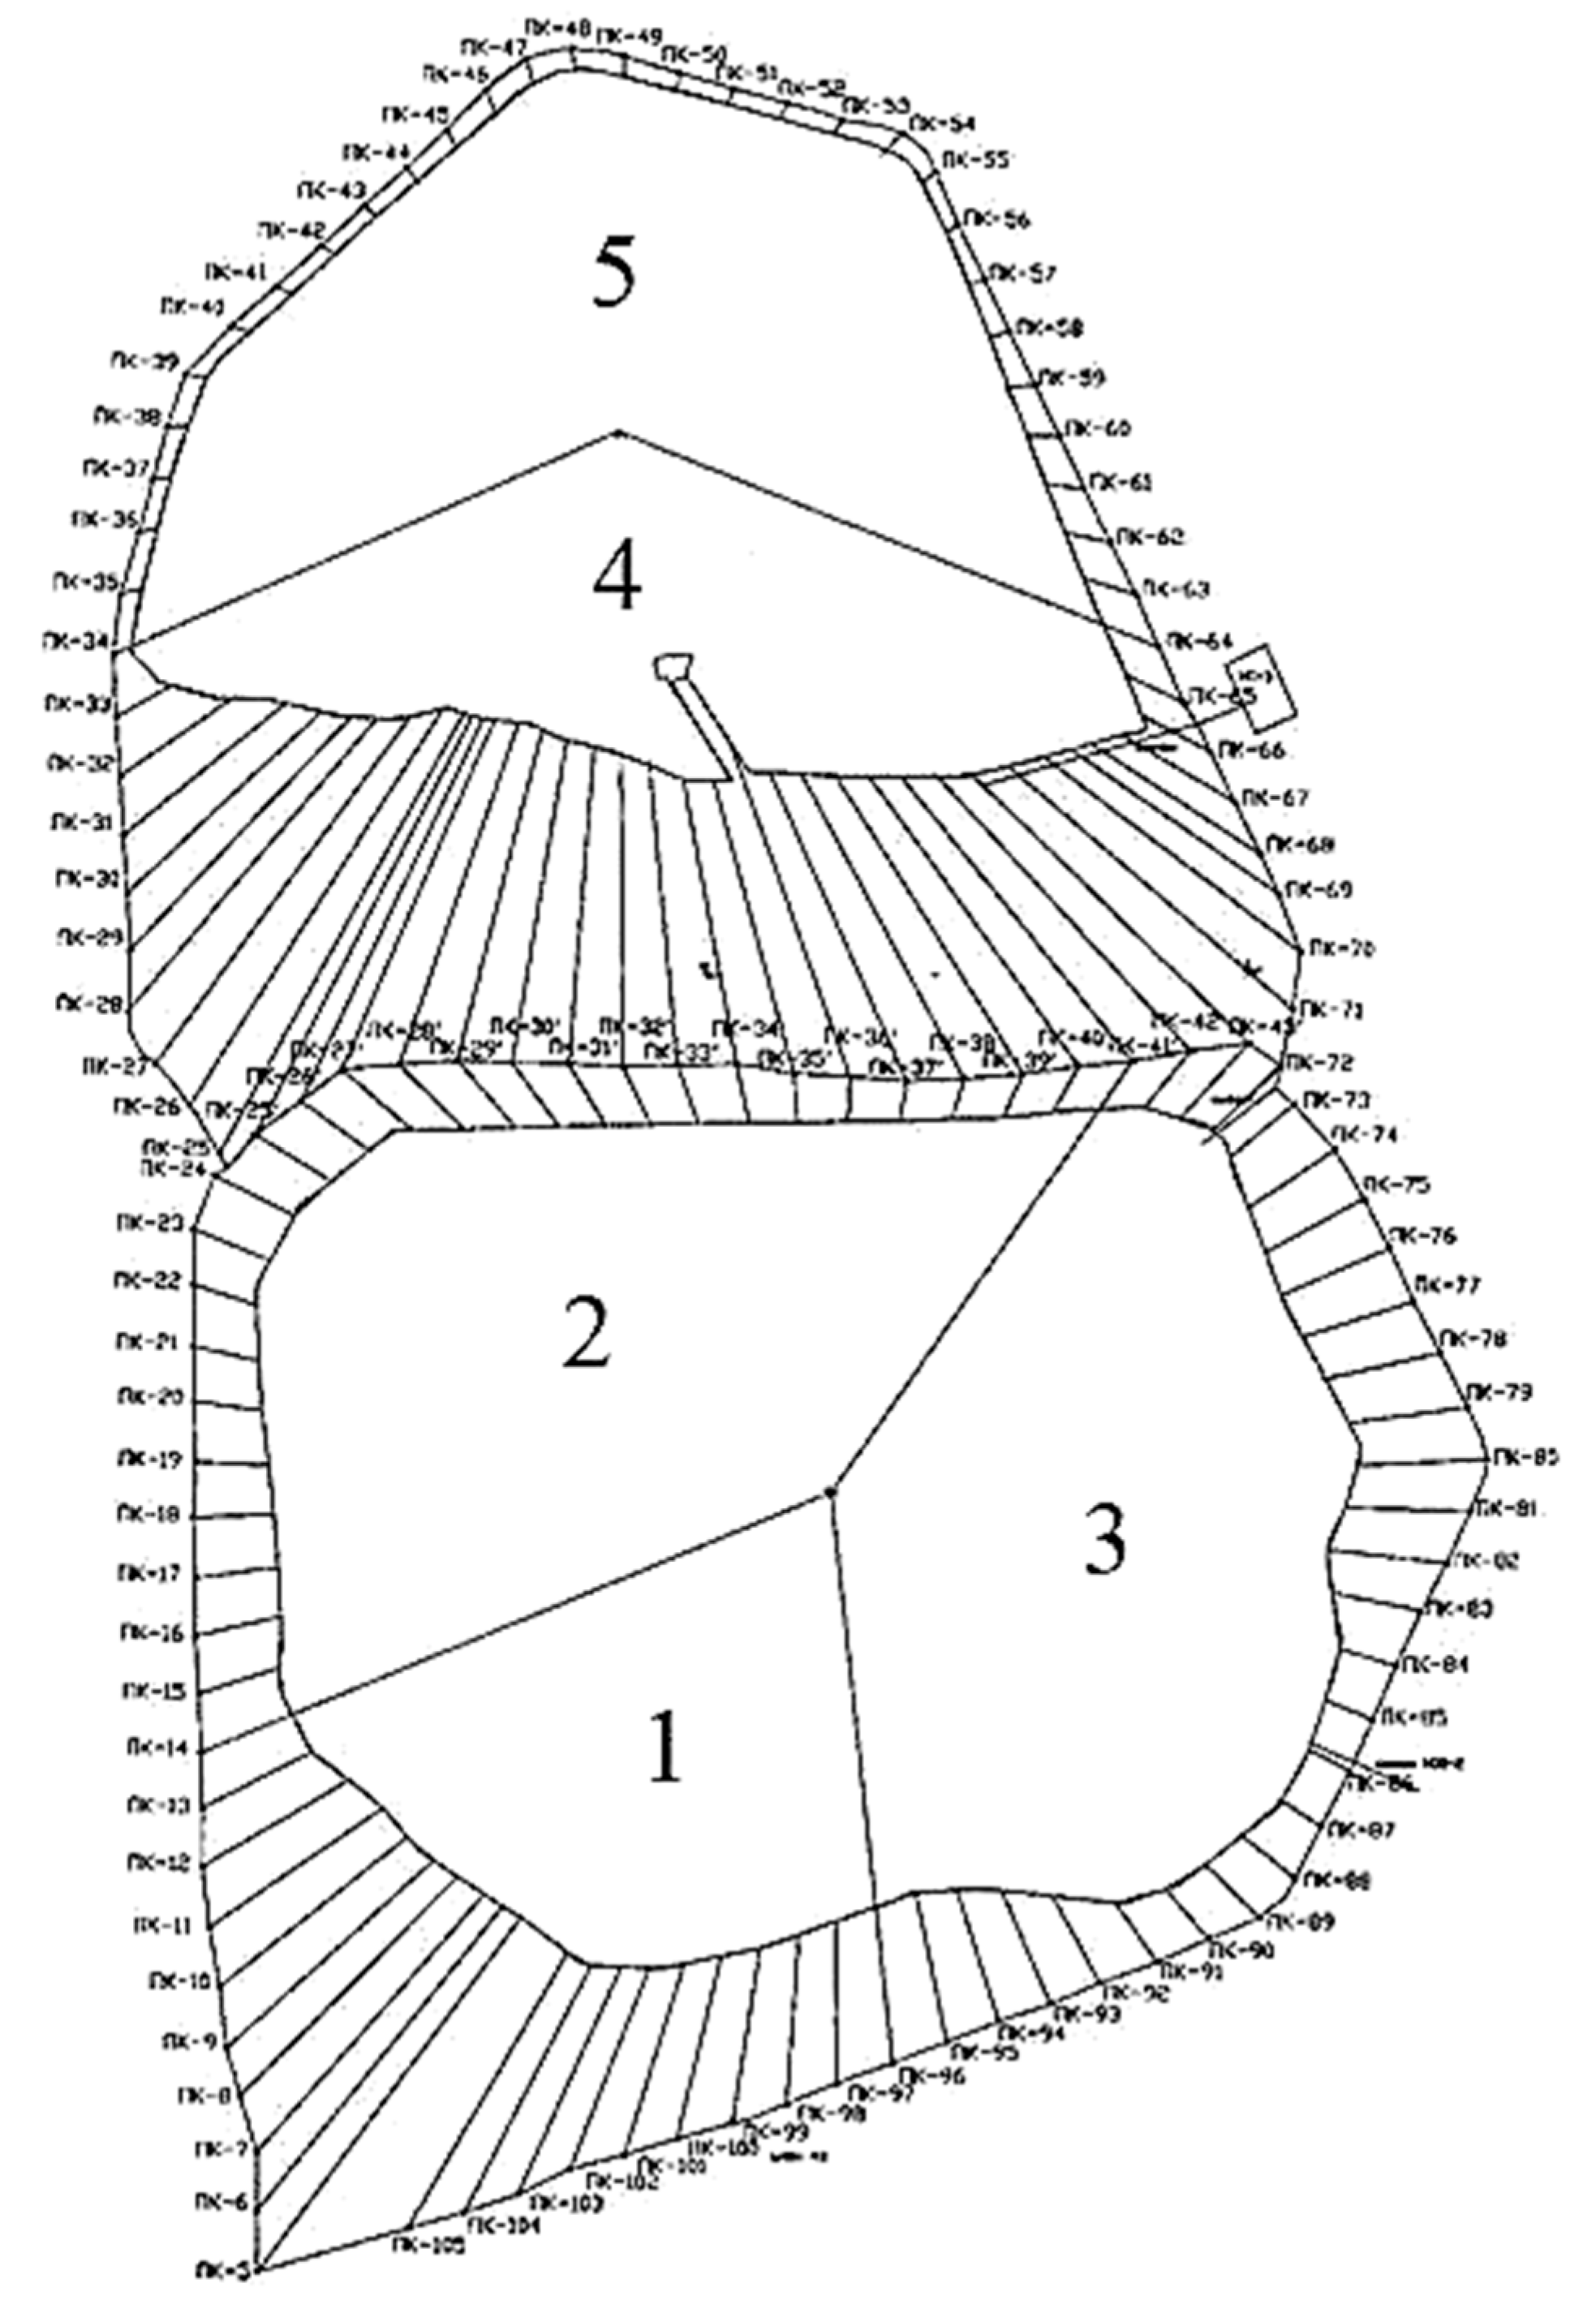
The developed technology of the dam inwash takes into consideration the height of a dam inwashed for one cycle and as a whole for a year, the width of the inwash front, the quantity of the inwashed tails, operations schedule etc. The inwash is made by sections and after formation of a layer of tails with the capacity of ≈0,5 m, hydraulic fill section is left for "rest" (10-15 days). The given way of an inwash provides an advance growth of a dam. The beach sectoring for the determination of the volume of the inwashed tails and the sequence of the sections inwash of tailing dump are presented in Figure 6 and Table 1 [7].
The schedule of the inwash works is made for the whole year. This, in its turn, has allowed to design the duration of the dam operation until achievement of its design elevation.
The dam is washed alternately in the first and second fields at an average daily air temperature above -5°C [1]
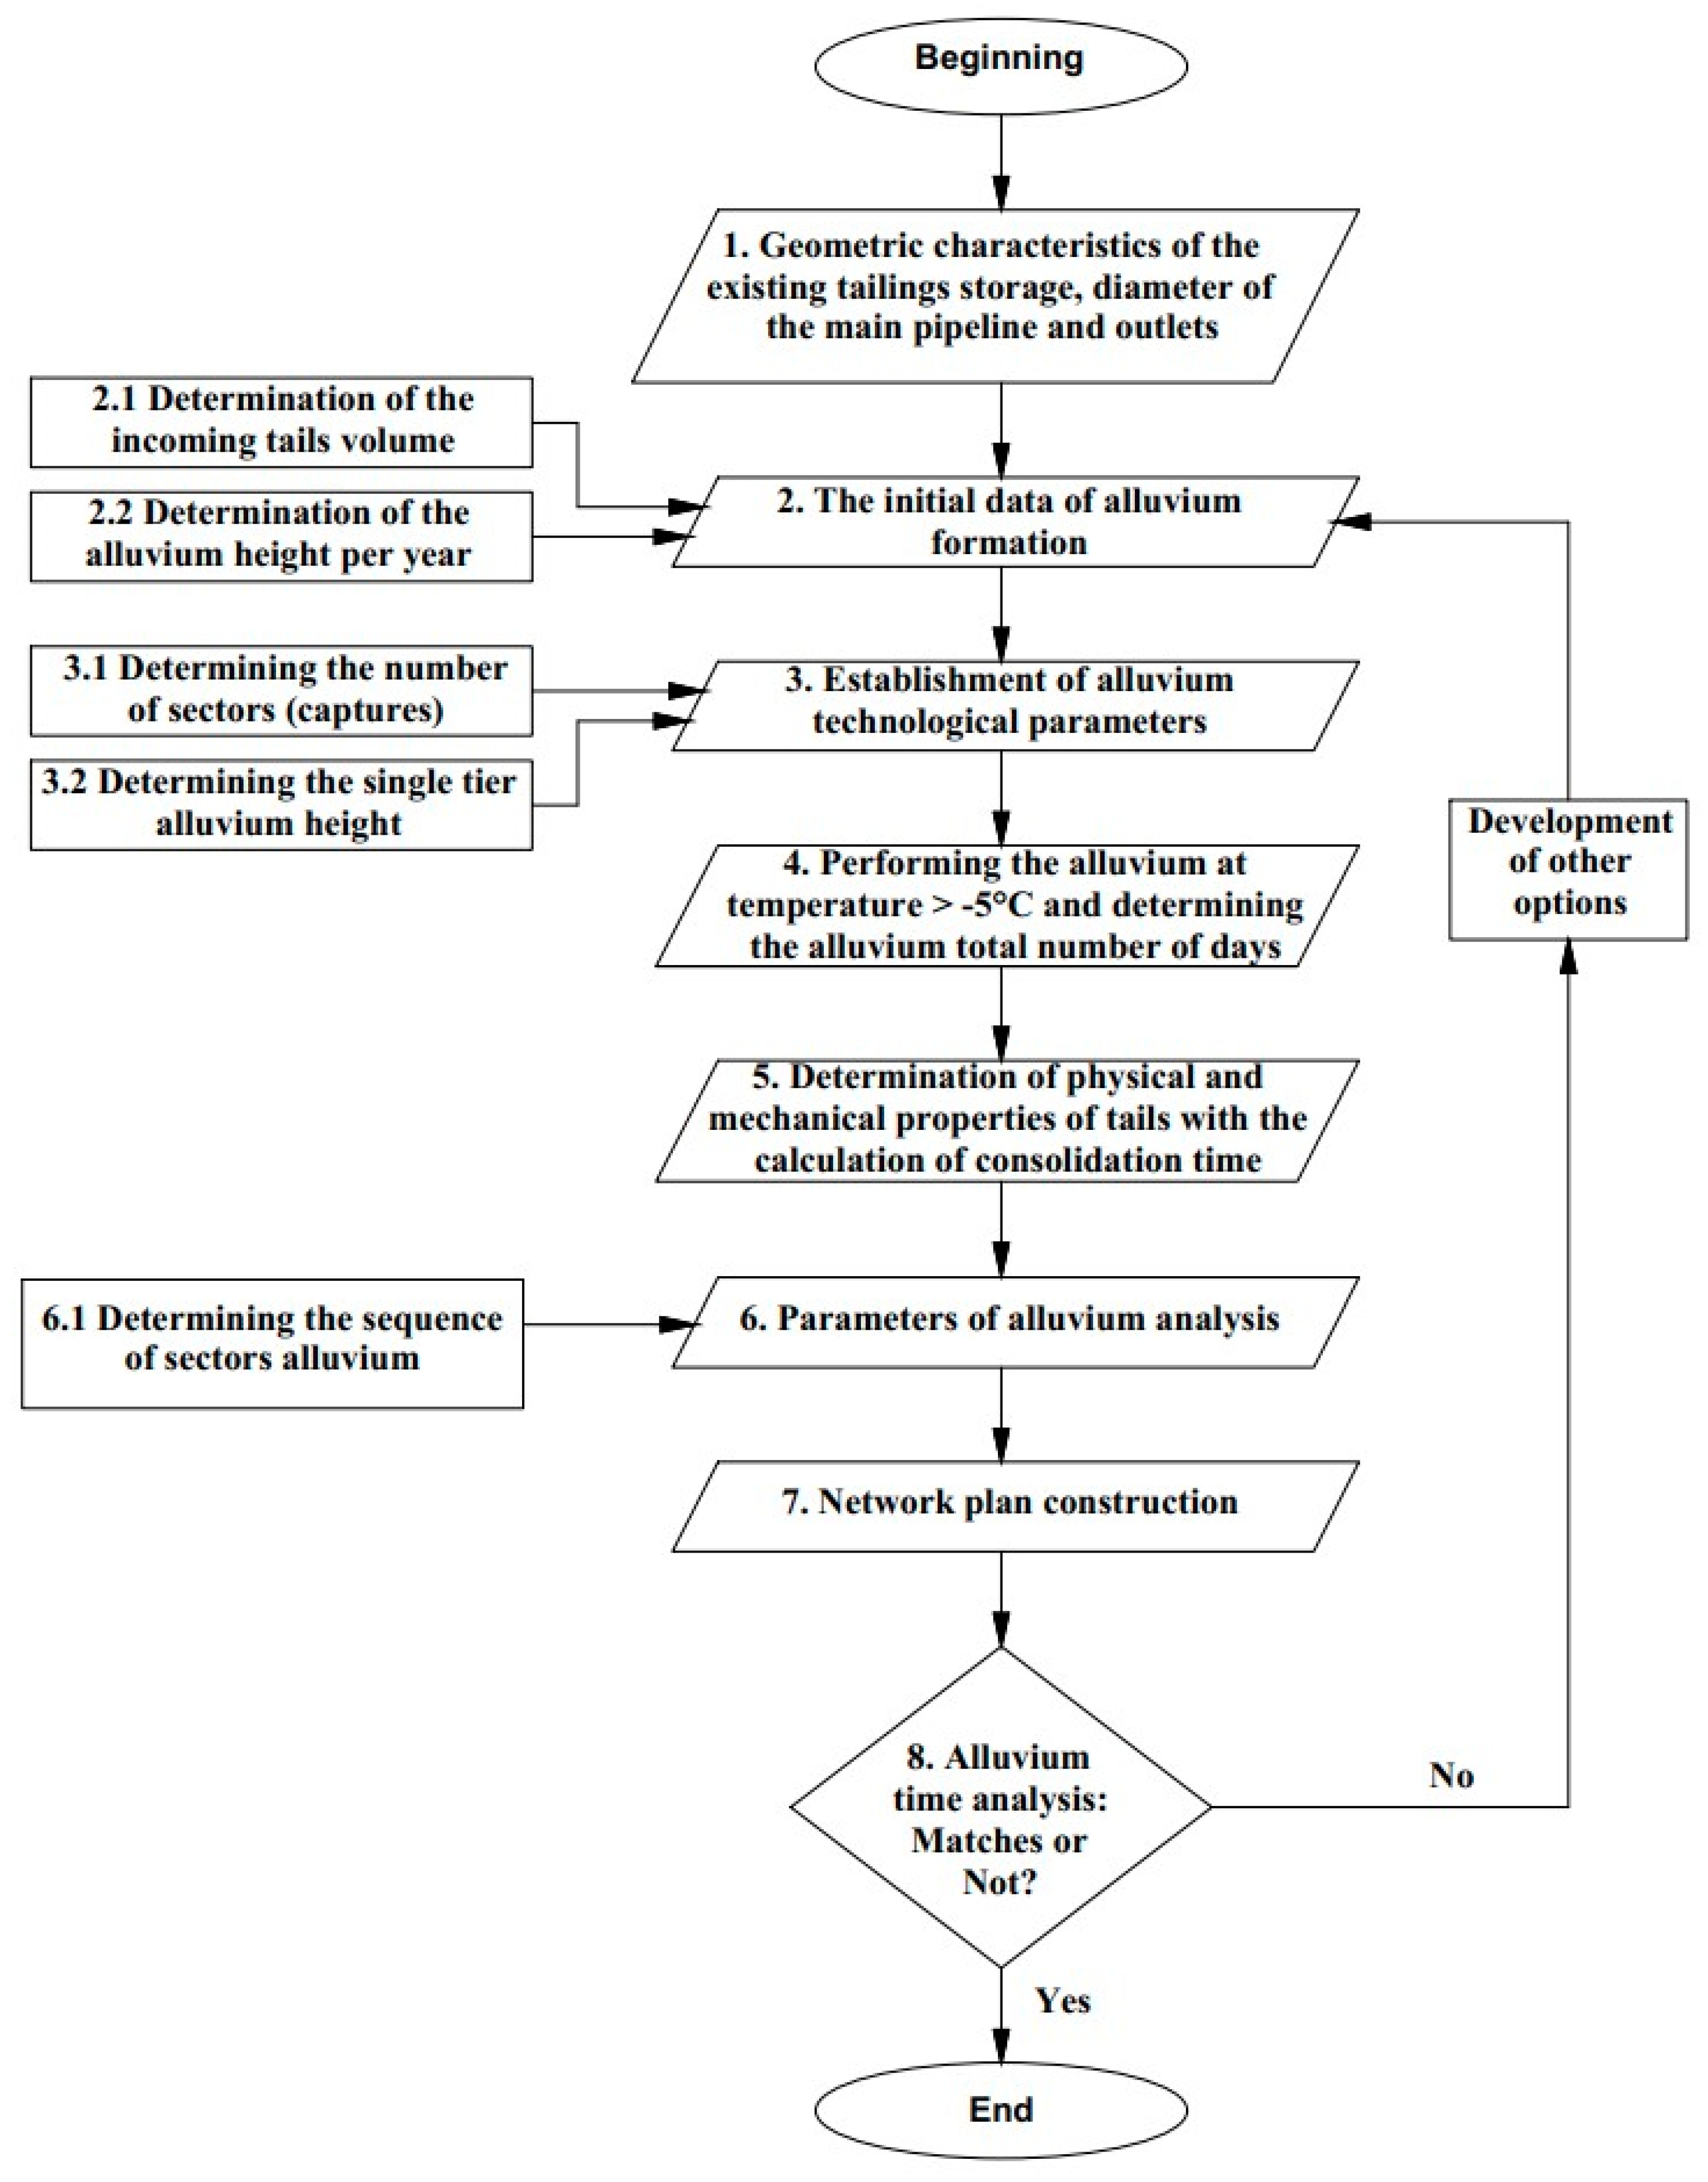
A complex of experimental studies allowed to develop an algorithm for the tailing dam formation (Figure 7) [13].
On its first stage of studies need to prepare initial data for further calculations: the geometric characteristics of the existing tailing dump with the definition of areas; the diameter of the main pipeline; the number of outlets and their diameters.
At the second stage – initial data formation, it is necessary to determine the volume of incoming tails and calculate the height of the layer of annual alluvium in accordance with the actual areas of alluvium.
Third stage – depending on the daily volume of tails and throughput of one release, the required number of outlets and the width of the alluvium sector and the total number of sectors for which tailings will be stored must be determined.
Fourth stage – need to perform the alluvium of the tailings dump and indicate the total time of the inwash onto the beach (the number of days per year with a temperature above -5˚С), which can be determined according climatic conditions of the region [1,14].
Besides, it is necessary to set a limit on the height of the annual inwash. This parameter is important for dumps located in the cryolithozone. The value of the maximum permissible height of alluvium per year should ensure the conditions of freezing of the alluvial massif and depends on the climatic characteristics of the area, chemical composition, physical and mechanical properties of the tails. In order to determine the value of the maximum permissible height of annual alluvium, separate studies should be conducted for each specific case.
The fifth stage – determination of tails physical and mechanical properties. To establish the dependence of the skeleton density of the soil on its moisture content, a series of individual soil tests for compaction must be carried out with a consistent increase in its moisture content. The test results should be made in the form of a graph. The number of individual tests for plotting should be at least six, and also sufficient to identify the maximum value of the soil skeleton density [14].
Next, the plasticity limits of tails must be determined. Depending on the density, humidity, characteristics of the soil structure and the magnitude of the load acting on them, the ratio of filtration and rheological phenomena in the process of soil consolidation varies. The upper limit of humidity is moisture at the yield point [14].
As it is known the process of consolidation is conventionally divided into two phases, primary or seepage and secondary, due to creep of the soil skeleton. The time of completion of the filtrational consolidation stage (Cv) have to be determined using the consolidation curves constructed in the coordinates displacement (s) - logarithm of time (lg t) according to Casagrande method.
The coefficient of secondary consolidation Cα also need to be determined by the tangent of the angle between the linear segment of the curve in the area of secondary consolidation and a straight line parallel to the abscissa axis [7,13,14,15,16].
The consolidation time can be calculated by changing the geometric characteristics of the samples under laboratory conditions [7,13,14,15,16]:
t = F C v × h h s
where t is the consolidation time, min; F is the cross-sectional area of the sample, cm2; Сv is the consolidation coefficient, cm2/min; h is the initial height of the layer, cm; s is the displacement, cm
The regression polynomial (polynomial) equation should be prepared (2) as an arranged in ascending powers of the studying factor and simultaneously linear to all coefficients, and the time of tailings consolidation should be determined at known design values of humidity and density [13,14,15,16].
y = f x = b 0 + b 1 x 1 + b 2 x 2 + b n x n
Alluvium at the storage area must be carried out in several stages. Moreover, between the end of the alluvium of the lower tier and the beginning of the alluvium of the subsequent tier, a technological break should be established.
Sixth stage – analysis of the structure alluvium parameters. Based on the operating conditions of alluvial tailings in the permafrost zone, it should be noted that the increase in the annual capacity of the layer may not provide its complete consolidation during short spring-summer period before freezing. Thus it will reduce the stability of the structure.
Based on the operating conditions of alluvial storage in permafrost, it should be noted that the increase in the annual capacity of the layer may not provide its complete consolidation during short spring-summer period before freezing. Thus it will reduce the stability of the structure. In order to optimize the inwash technology of tailing dam it is necessary to determine the time of tail’s consolidation. It is necessary to accurately determine the time of tailings consolidation, which is the most important factor in optimizing of the inwash technology in the conditions of the permafrost zone.
To ensure a sufficient amount of time during the process of tailings consolidation, the sequence of all-in-sectors need to be determined.
Seventh stage - in order to fulfill the regulatory requirements for optimizing the process of inwash, the network planning method have to be applied.
As a result of the construction and calculation of the network plan, the duration of the critical path in days is determined, which allows to conclude whether the entire volume of all the inwashed tails is laid in the required time frame [17].
At the last stage need to check the compliance of the obtained number of days required for tailings inwash. In case of non-compliance it is necessary to return to the stage of determining the initial data.
The objective of our technological operations is to create a uniform and homogeneous mass of material. To achieve this goal, knowledge about the structure of tailings and the technological characteristics of their placement within the dam body is necessary. Studying the structure of tailings will help us understand their physical and geometric properties, such as particle size, particle size distribution, density, and moisture content.
In the laboratory, the research of technogenic soils - tails were carried out according to the methodical scheme developed in the laboratory of soil science of the Institute of Earth Crust of the Russian Academy of Sciences. by Ryashchenko T.G. [18] and including the definition of a set of indicators that are divided into four groups:
  • structural (characterizing structural elements, type of structural connections and types of structures);
  • chemical (indicators of chemical composition and physical-chemical properties);
  • physical (indicators of physical condition and properties);
  • mechanical (indicators of deformation and strength properties).
Air-dry samples of tails of the disturbed build were used. Selected samples are gray samples, stains hands, there are small aggregates, and clay fractions (clay sand) are clearly present.
Granulometric analysis was carried out in three ways of sample preparation: microaggregate (shaking in water), standard (boiling with ammonia), and dispersed (boiling with sodium pyrophosphate).
The Table 2 shows the accepted indices of indicators with their decoding.
When determining the parameters of the microstructure: the number of aggregates (A) and primary particles (M), their size distribution (Ai, Mi) and the coefficients of freedom of fractions (Fi), representing the share (%) of primary particles in their total amount (primary plus those in aggregates), special calculations were performed.
Type of soil structural model was set on the size of the prevailing elements (Ai+Mi) and special factor G according to the classification [18]. Coefficient G - the share of primary particles in the total sum of structural elements (primary particles plus aggregates), %; x - the size of primary particles and aggregates, microns.
Table 3. Accepted indexes.
Indicator Decoding Unit Coarseness
М1s content of coarse-sand fraction % more than 0.25 mm
М2s content of fine-sand fraction % 0,25 - 0,05 mm
М1d the content of coarse-dusty fraction % 0,05 - 0,01mm
М2d the content of fine-dusty fraction % 0,01- 0,002 mm
М1с content of coarse clay fraction % 0,002-0,001mm
М2с content of fine clay fraction % less than 0,001mm
where Ms, Md, Mc - the total content of sandy, dusty and clay fractions, %; 1, 2-indices.
The method proposed by A.K. Larionov [19] and expanded by T.G. Ryashchenko [20,21] was used for the micro-agregency ratios calculation. These coefficients represent the difference between the fraction contents determined during dispersed sample preparation and microaggregate preparation. They are used to assess the degree of aggregation, determine the size of aggregates and their structure, i.e. you can find out what smaller particles they consist of. In addition, the degree of freedom of fine-grained particles (less than 0.001 mm) particles in the size of K1-2 ma is determined [23].
Micro-aggregate ratios defined as follows:
K m a 1 2 = M s 2 d M s 2 ( ma )
K m a 1 1 = M s 1 d M s 1 ( m a )
K m a 2 2 = M d 2 d M d 2 ( ma )
K m a 2 1 = M d 1 d M d 1 ( ma )
K m a 3 2 = M c 2 d M c 2 ( ma )
K m a 3 1 = M c 1 d M c 1 ( ma )
where (d) - the content of the relevant faction in a dispersed way of sample preparation, %; (ma) - the same with microaggregate mode of preparation, %
The lower this coefficient, the greater the degree of freedom, that is, clay particles are not part of aggregates, but are primary. When all fine-clay particles are free and do not participate in the formation of aggregates K1-2ma greater than or equal to zero. K3-1ma is always negative if coarse-grained particles are aggregates and is zero if all of them are primary. The other four coefficients can have arbitrary values.
When determining the parameters of the microstructure: the number of aggregates (A) and primary particles (M), their size distribution (Ai, Mi) and the coefficients of freedom of fractions (Fi), representing the share (%) of primary particles in their total amount (primary plus those in aggregates); special calculations were performed [21,22]. Depending on the number of aggregates, the type of microstructure was determined according to the classification Table 4.
Type structural model of soil was set on the size of the prevailing elements (Ai+Mi) and special factor G according to the classification Table 5 [21].
Coefficient G — the share of primary particles in the total sum of structural elements (primary particles plus aggregates), %; x — the size of primary particles and aggregates, mm.
Strength indicators were determined on specially prepared samples with humidity varying in the range from 2 to 40 %. Such humidity regime is due to a small difference (5.2 %) between the limits of plasticity and fluidity; the need to assess the strength at low humidity, which corresponds to the humidity of the soil during the rest of the beach.
Tests were spent on the automated test complex “ASIS” (Figure 8) which is intended for carrying out of mechanical tests of natural and industrial building materials at various sorts of a stress condition and loading paths. Special software ASIS is applied to management of test process. The software exercises in the automated mode administration of test process, recording and transfer of results of test to other software packages for the further processing, [].
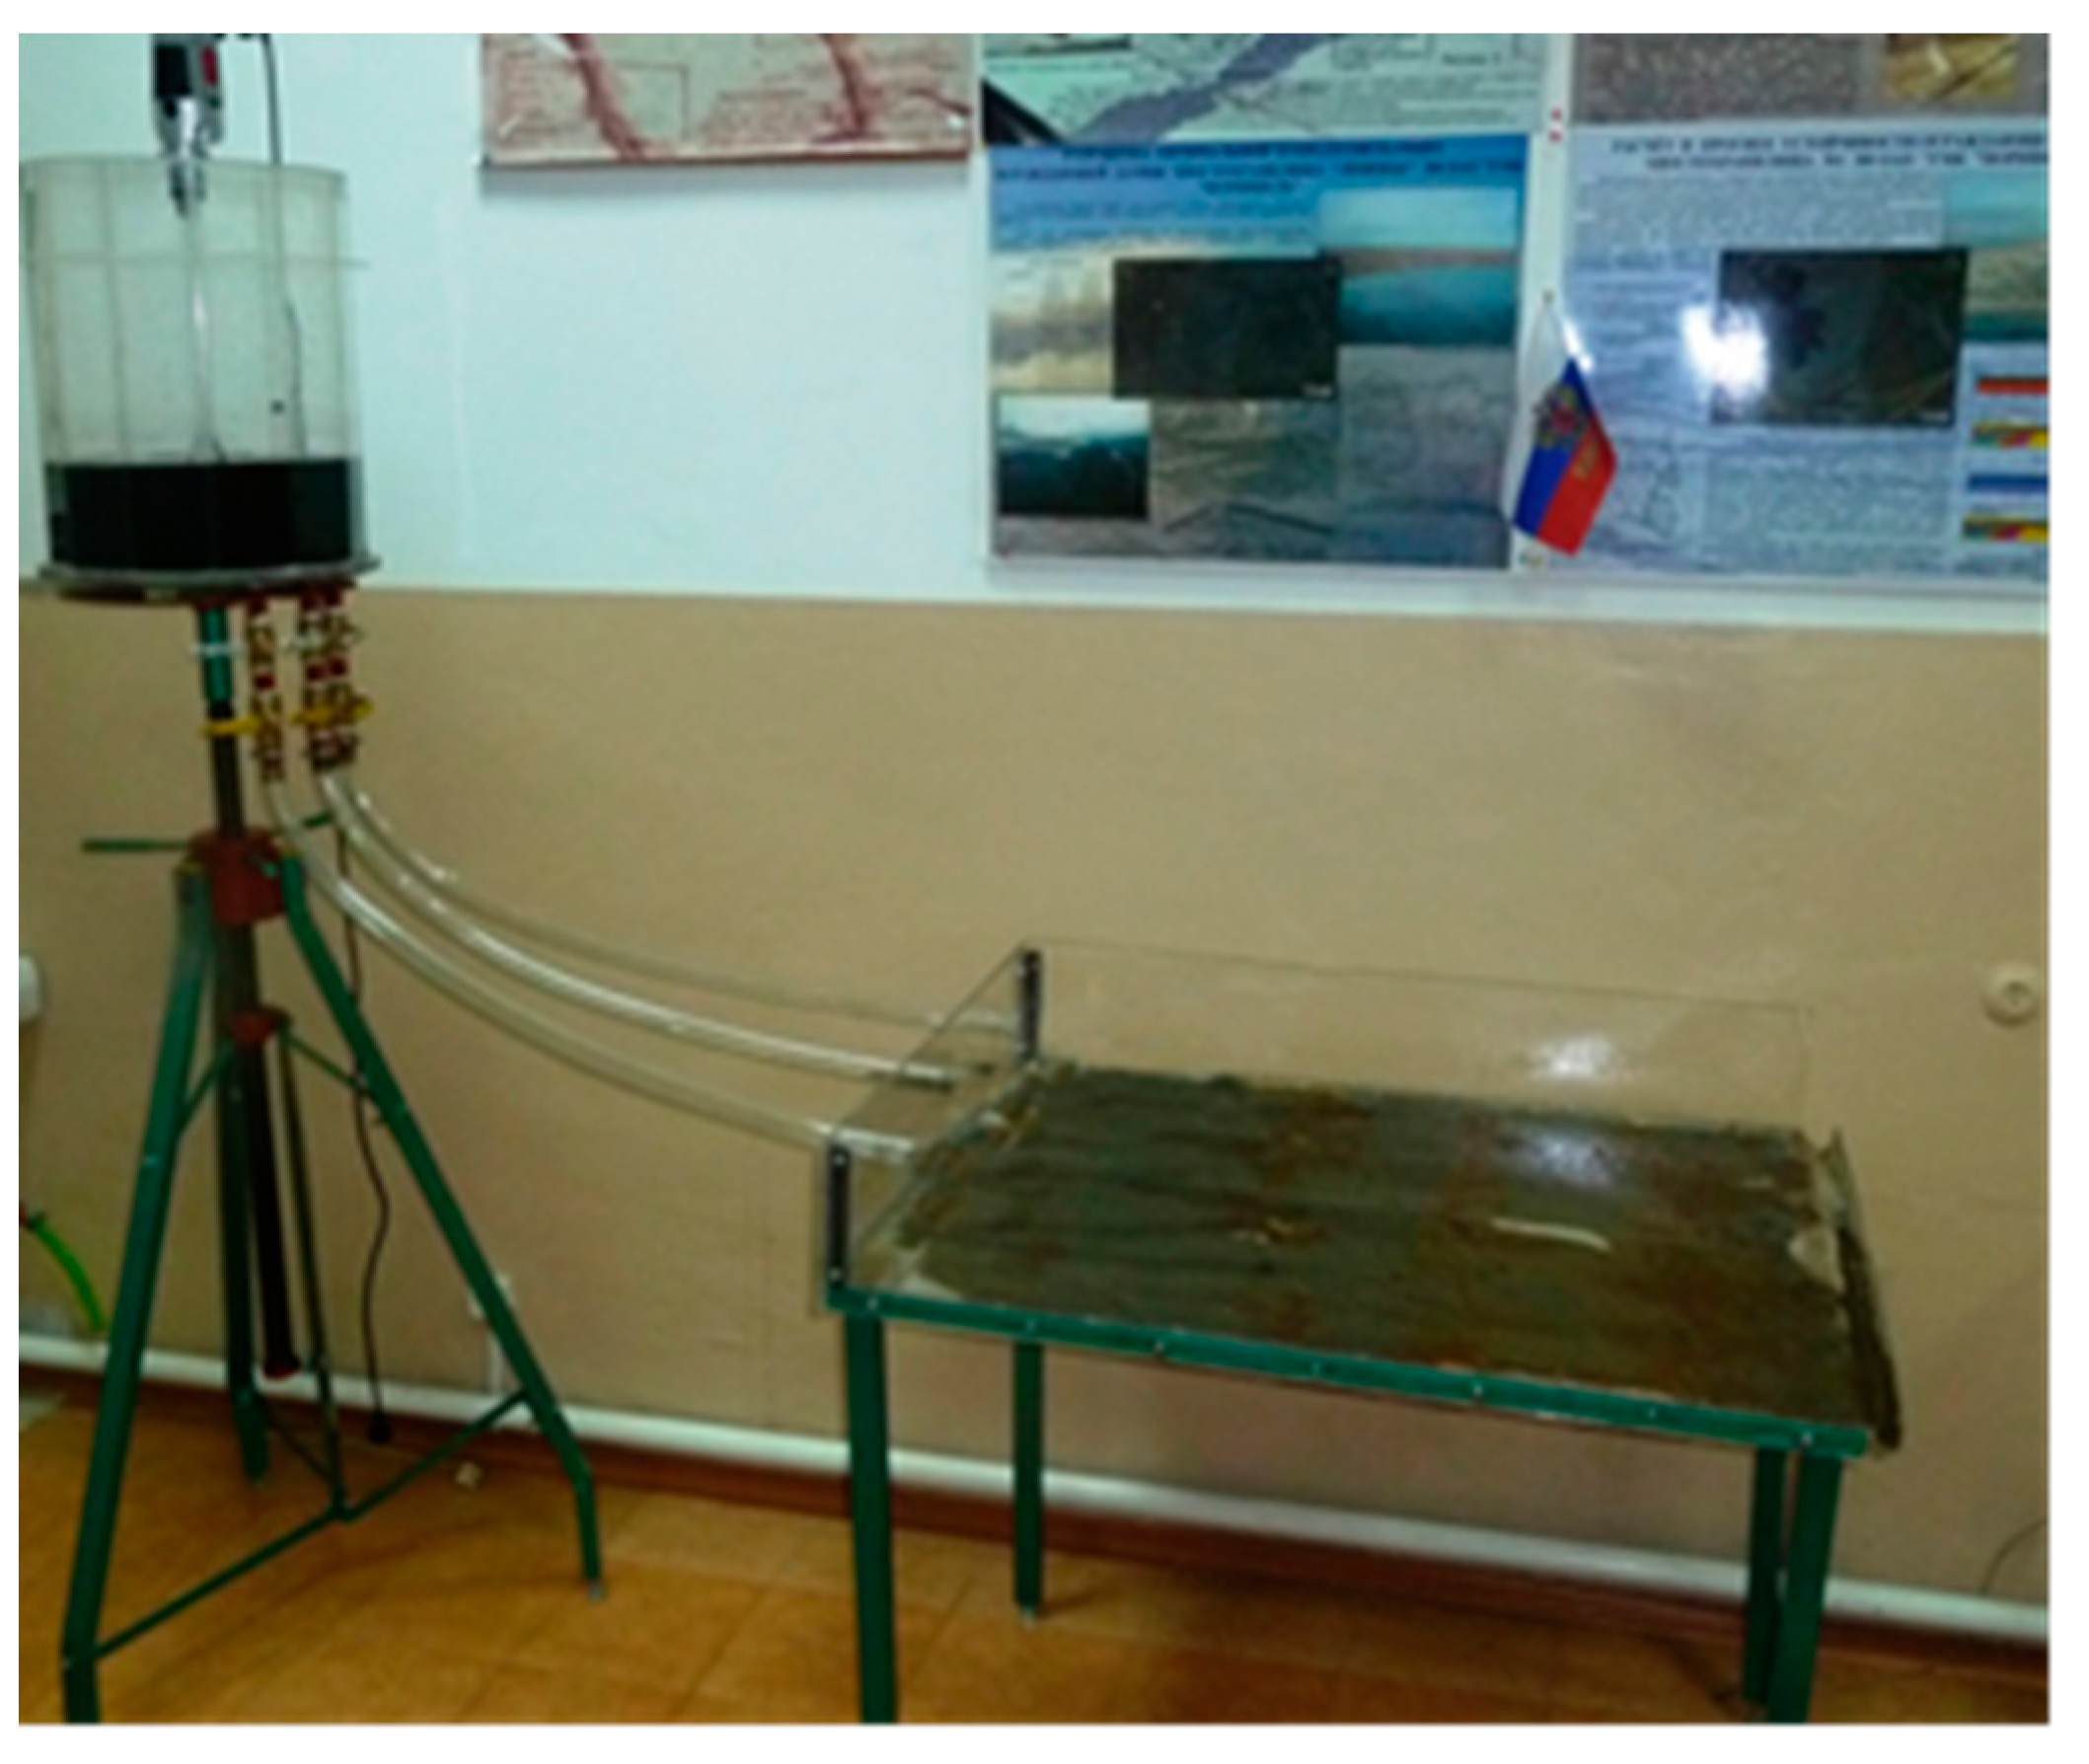
Having determined the structure of the tailings, now we need to simulate the technological process for laying a homogeneous and dense structure of the massif. For this, model tests were performed on a specially designed installation. The study of the influence of the technological parameters of the alluvium on the formation of a stable tailings dam was carried out using physical modeling.
For research, a laboratory stand was developed and manufactured [23], consisting of a tray, organic glass, with the possibility of changing the slope, a slurry distribution sump (distribution slurry pipeline), distribution outlets through which alluvium is carried out (Figure 9). When designing the alluvium model for the tailings dam in accordance with the conditions of the theory of similarity, the geometric scale was chosen as 1:100

3.2. Operation and Disposal

As mentioned earlier, during the construction of a tailings storage facility, it is crucial to ensure a uniform and compact state of the tailings mass. The deposition process is carried out according to a specific technology or methodology, which dictates the manner in which the tailings are placed and distributed within the storage facility. This process aims to achieve a consistent and stable structure that minimizes the risk of environmental contamination and ensures the long-term integrity of the facility (see Figure 4).
During operations involving the filling of the tailing dump, there may arise a need to either increase the capacity of the dump or implement measures to address a decrease in the stability coefficient of specific sections of the dam. To tackle this issue, a compaction method and a secondary dike dam have been developed and implemented. These measures are aimed at improving the stability and integrity of the tailing dump during the filling process.
During the process of tail development and its subsequent disposal, ensuring safety measures and preventing the collapse or loss of stability of the enclosing dam is of utmost importance. Safety precautions must be carefully followed to mitigate any risks and safeguard the structural integrity of the dam.

4. Results and Discussion

4.1. Design, Construction and Operation

At the design and construction stage, it was changed the construction technology of the tailings dam to form an impervious screen to prevent seepage from the tailings through the dam and increase its stability.
The technical solution consists of placing sleeves made of nonwoven geotextile filtering material in layers perpendicular to the flow propagation, with the sleeves filled with tails to form an earth dam in a bay from the side of the tailings pond (Figure 10). On the side of the enclosing dam, an impermeable screen made of non-filtering geotextile material is installed to prevent filtration from the tailings pond. The impermeable screen is directed towards the inner slope of the enclosing slag prism of the next layer, it is folded until the next layer is deposited, and then unfurled on top of the deposited tails, covering at least the width of the supporting part of the prism of the next layer for clamping [24].
The method of constructing a tailings dam is carried out as follows: the construction of the enclosing dam in the form of slag prisms and a dividing dam, the installation of main and distribution pipelines, and the layer-by-layer dispersed deposition of tails on the inner beach. The dividing dam is constructed by placing a sleeve made of nonwoven geotextile filtering material perpendicular to the flow propagation, filling the sleeve with tails to form an earth dam in a bay from the side of the tailings pond. On the side of the enclosing dam, an impermeable screen made of non-filtering geotextile material is installed to prevent filtration from the tailings pond. The impermeable geotextile material is placed along the bottom of the tailings pond, directed towards the inner slope of the enclosing slag prism of the next layer, folded until the next layer is deposited, and then unfurled on top of the deposited tails, covering at least the width of the supporting part of the prism of the next layer for clamping. The diameter of the sleeve made of filtering geotextile material is determined based on the desired thickness of the deposited layer. Upon reaching the desired thickness of the layer, a new sleeve made of geotextile material is laid. The same operations are repeated for each subsequent layer.
During the tests, the influence of technological parameters of inwash on the characteristics of tailings distribution along the beach of the tailings storage facility was investigated.
The inwash technological parameters were as follows:
  • values of the weighted average particle diameter - 0.05 – 0.63 mm;
  • the pulp pace - 3,91; 4,05 and 4,31 m/sec;
  • the solid phase to liquid phase ratio - 1:2; 1:2.5; 1:3.5 and 1:4.
The laboratory experiments were conducted on laboratory-scale plant made accord-ing to the requirements of the similarity theory criteria [10,25]. In accordance with the conditions of the theory of similarity, the geometric scale was chosen to be 1:100 (Table 6, Table 7 and Table 8).
The tails distribution along the beach zone with optimum pulp quality depending on the pulp speed are presented in Table 9.
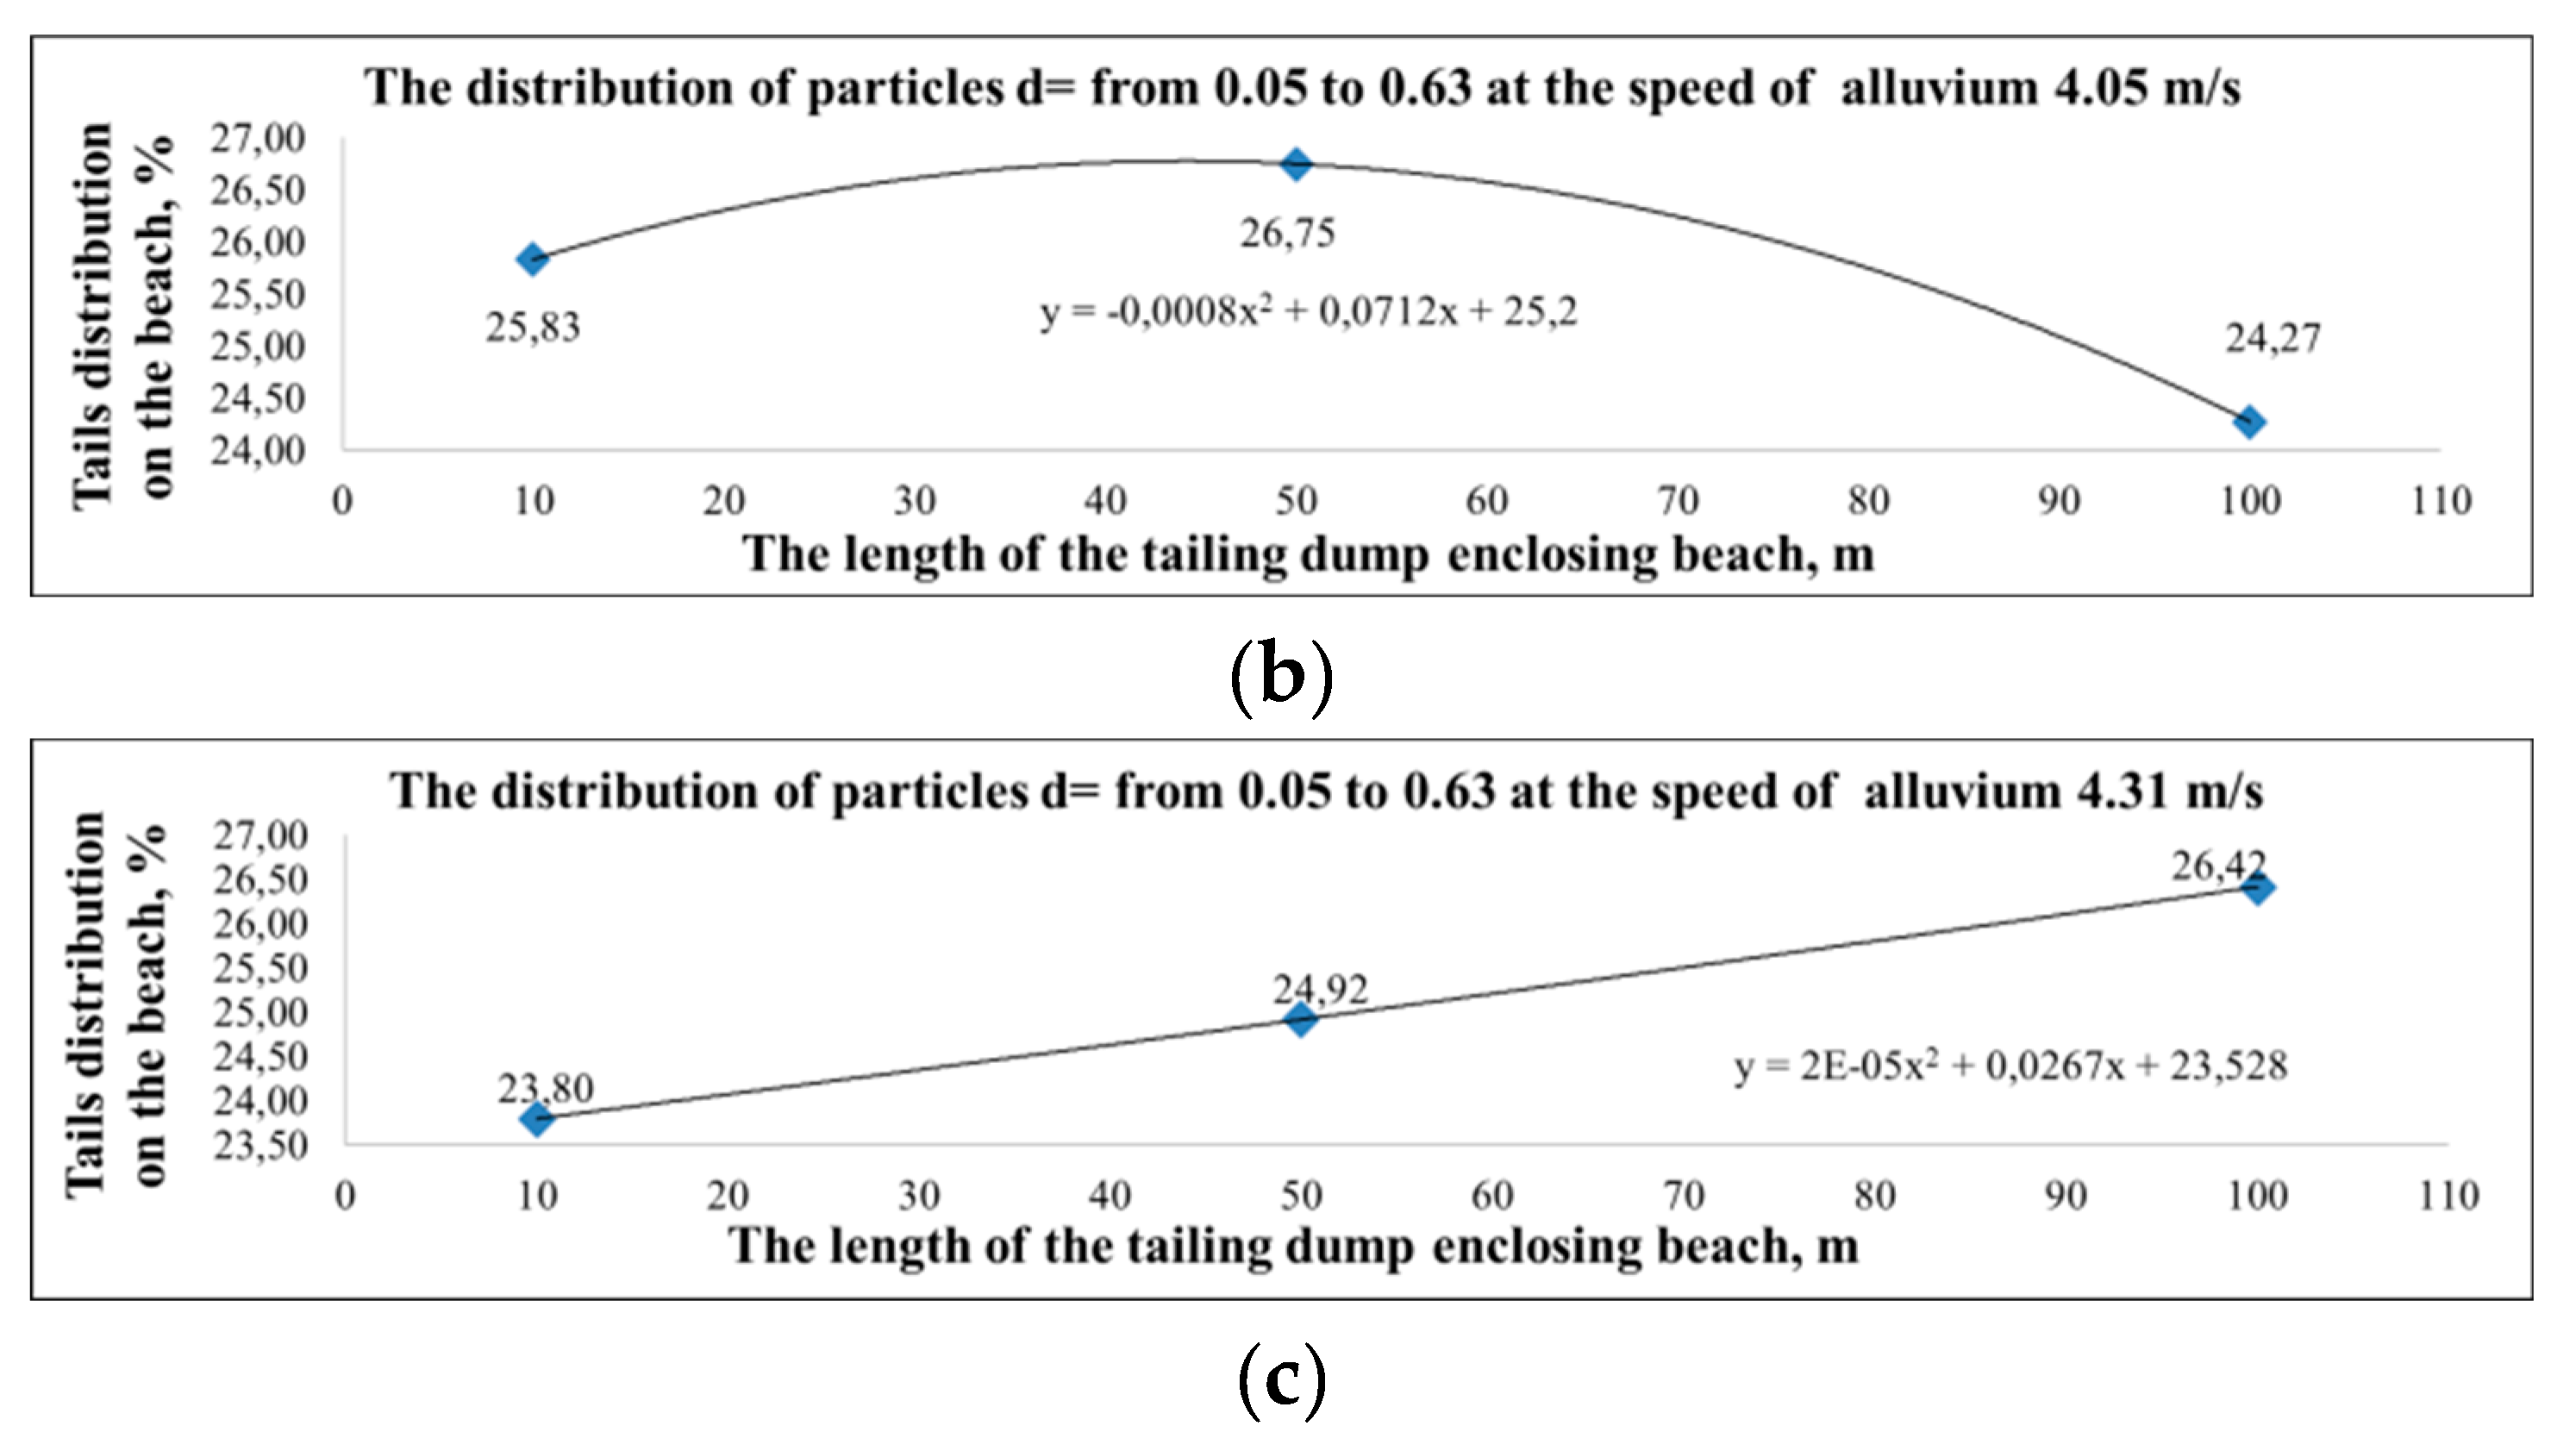
As a result of the experiments, polynomial trend lines of tails distribution along the beach area were obtained with optimum pulp consistency (liquid to solid ratio) depending on the speed of the pulp (Figure 11).
Figure 12 shows a summary graph of the tails distribution along the beach at a dis-tance of 10, 40 and 70 m from the distribution slurry pipeline.
According to the data in Figure 12 the tails distribution along the beach has quadratic dependence on the pulp velocity, the height of the pulp axis, and the weighted average particle diameter.
Figure 2 shows the dam's coefficient of stability kst depending on its construction parameters- the height of the dam, the bottom slope layout and the duration of the shore.
The results indicate that raising the height of the dam and the bottom slope layout decreases its stability coefficient substantially. But the raising the duration of the shore from 50 to 150 meters increases stability coefficient [10,25].
In the aggregate, these parameters will be dominant for any task of increasing the stability of a certain part of the beach due to the redistribution of tails.
To determine the influence of geometric characteristics on the stability of the tailing dam, three variants of calculations were performed with beach lengths of 50, 100, and 150 meters.
Regularities of changes in the coefficient of stability (kst) of the dam against its design parameters - the height and steepness of the bottom slope and the length of the beach - are shown in Figure 2.
The results of calculations show that with the same initially given data, an increase in the height of the dam leads to a significant decrease of its stability coefficient.
Figure 13. The kst value depending on the geometrical parameters: (a) the influence of the height of the dam; (b) the bottom slope layout; (c) beach length effect.
Preprints 79106 g013
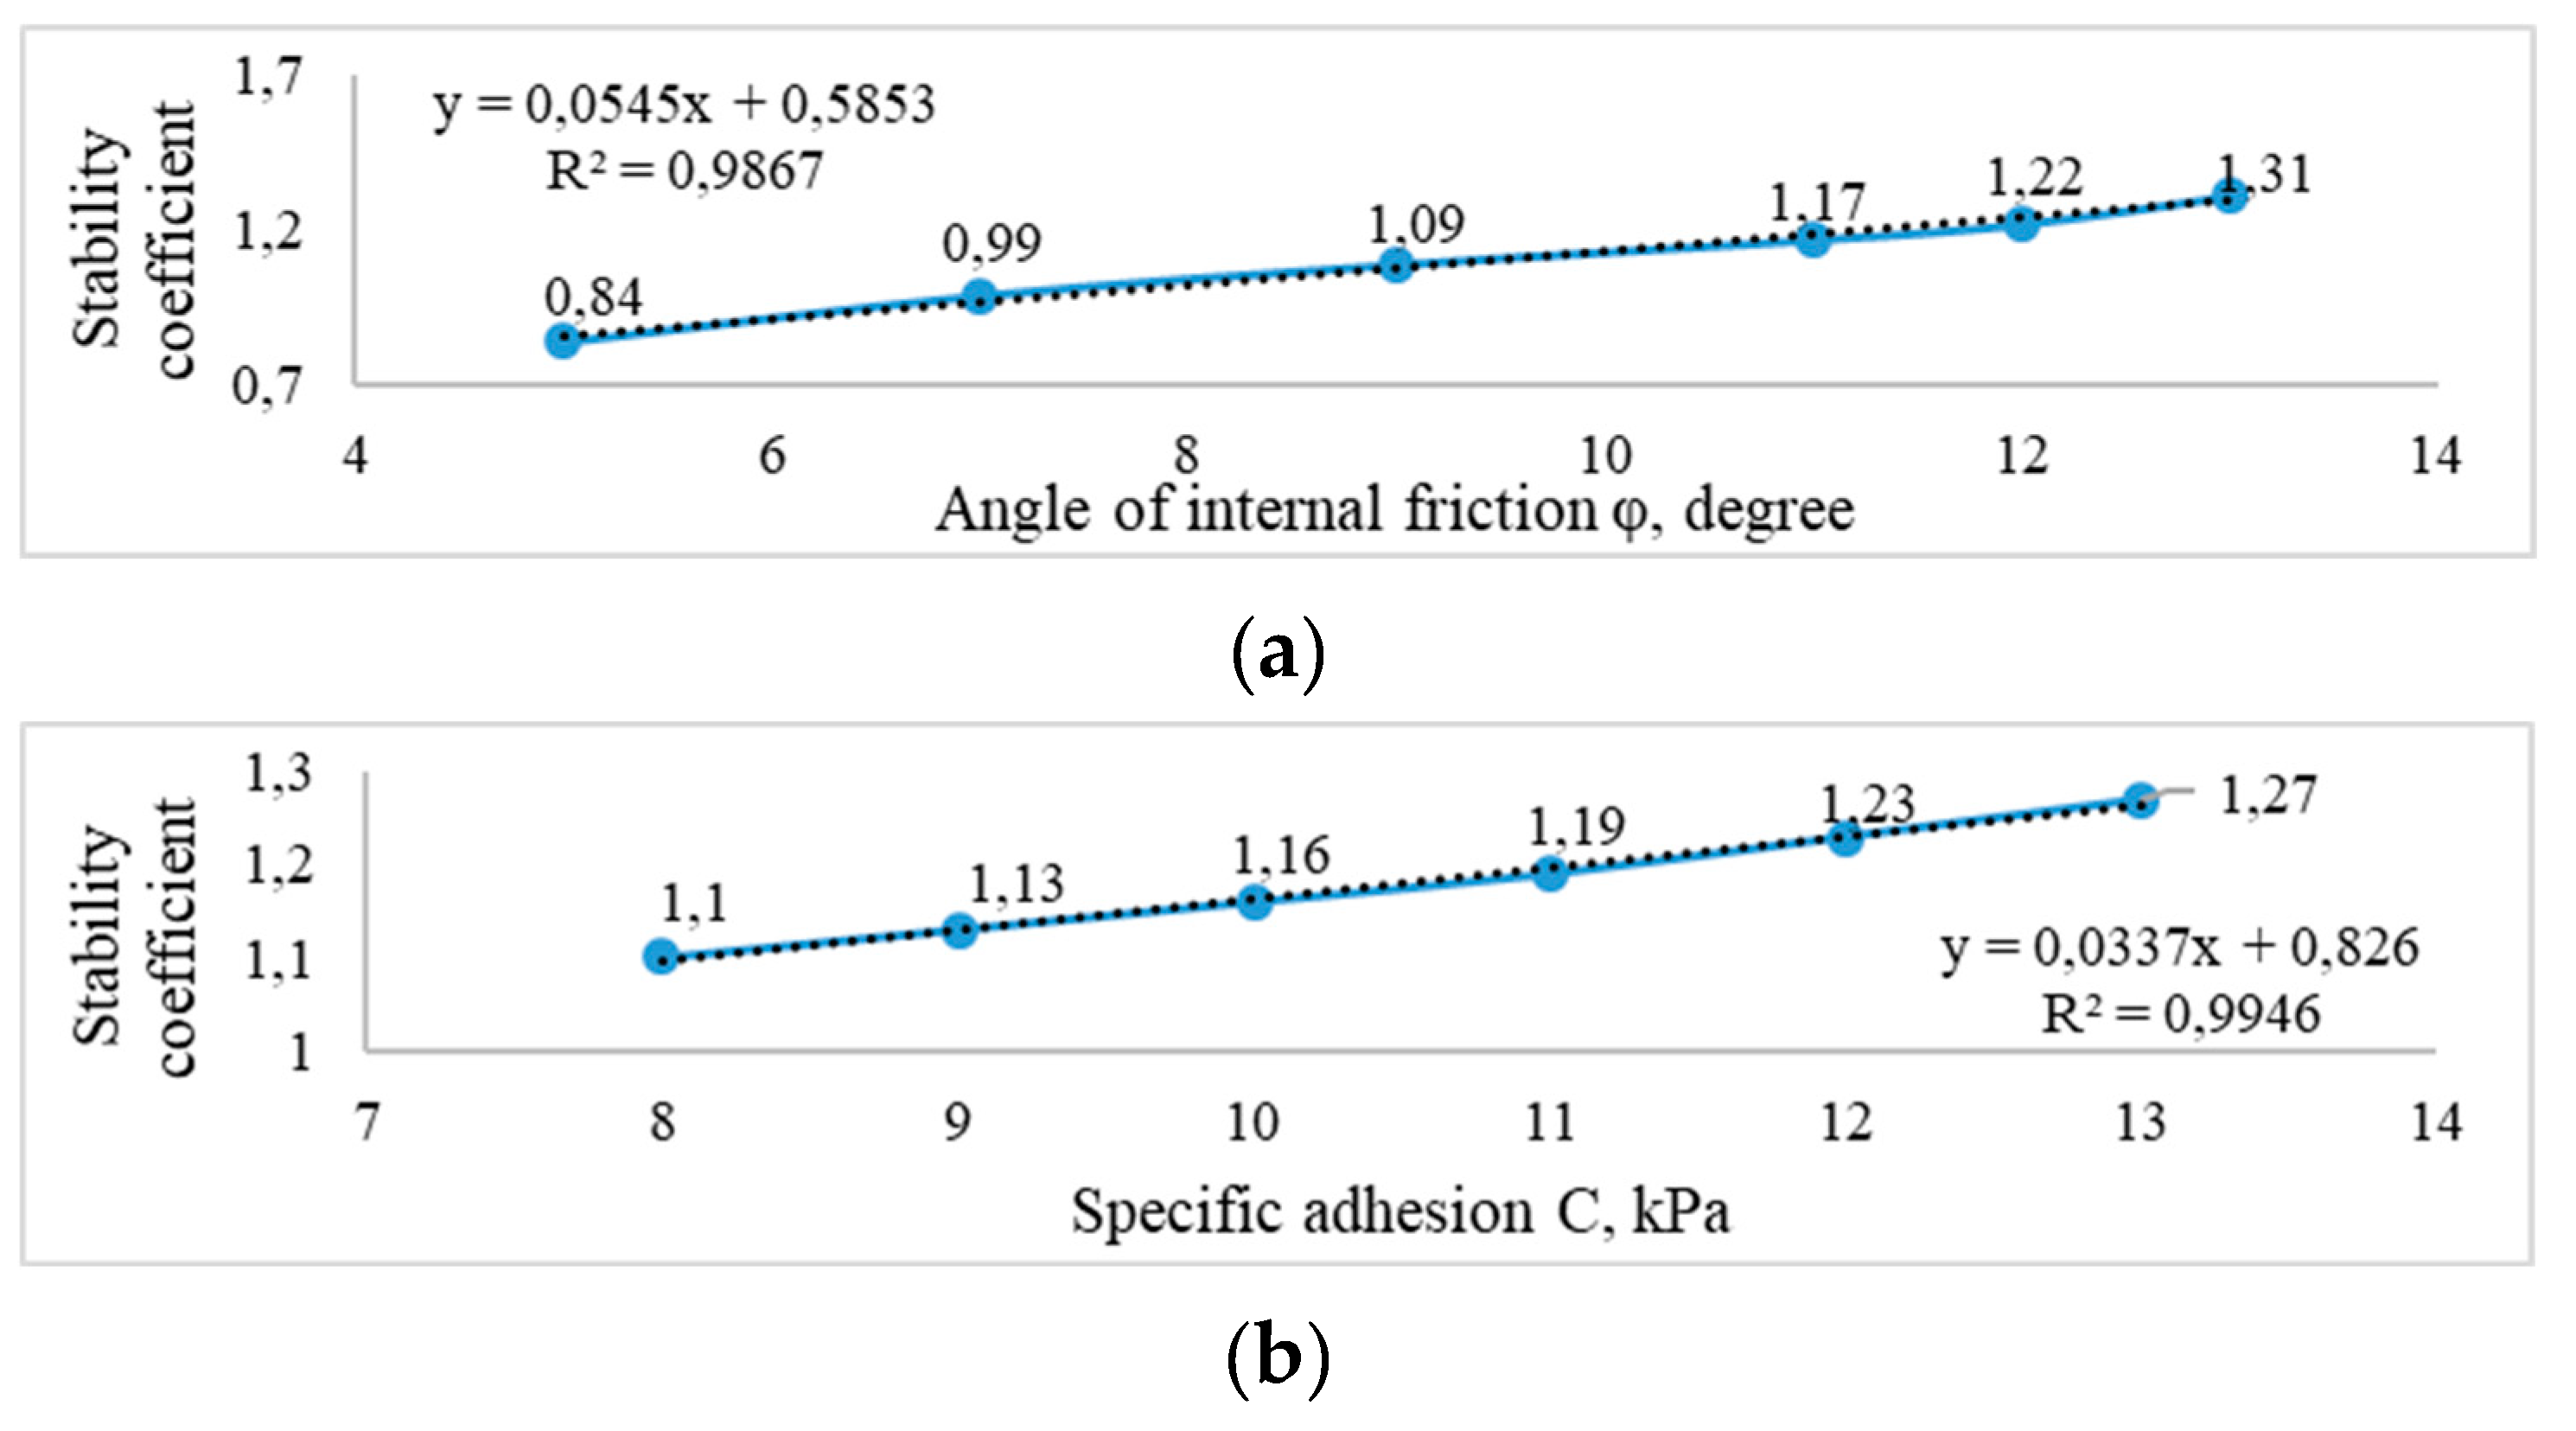
The influence of physical and mechanical properties has been studied using physical modeling of the enclosing tailing dam formation. The change of such criteria for assessing the accident and stability - as the strength characteristics of man-made soils - the angle of internal friction and specific adhesion were investigated.
To establish the effect of changes in the physical and mechanical properties on stability, the values of specific adhesion and angle of internal friction of the soils com-posing the dam body were changed in the design scheme (Figure 3).
In the aggregate, these parameters will be dominant for any task of increasing the stability of a certain part of the beach due to the redistribution of tails.
To determine the influence of geometric characteristics on the stability of the tailing dam, three variants of calculations were performed with beach lengths of 50, 100, and 150 meters.
Regularities of changes in the coefficient of stability (kst) of the dam against its design parameters - the height and steepness of the bottom slope and the length of the beach - are shown in Figure 2.
The results of calculations show that with the same initially given data, an increase in the height of the dam leads to a significant decrease of its stability coefficient.
The influence of physical and mechanical properties has been studied using physical modeling of the enclosing tailing dam formation. The change of such criteria for assessing the accident and stability - as the strength characteristics of tails - the angle of internal friction and specific adhesion were investigated.
To establish the effect of changes in the physical and mechanical properties on stability, the values of specific adhesion and angle of internal friction of the soils composing the dam body were changed in the design scheme (Figure 14).
Analysis of the results showed a proportional dependence of the change in the stability coefficient on the soils’ physical and mechanical properties, while the specific adhesion is a more important parameter determining stability than the angle of internal friction.
In order to control the strength characteristics and, accordingly, the stability of the enclosing dam, the process of the tailings’ in-wash on the beach area with the use of a compactor of dynamic action was modeled. The values of the stability coefficient are shown in Figure 15.
From the analysis of the test results, it can be concluded that the coefficient of technogenic deposit enclosing dam stability linearly depends on the geometrical parameters of the dam, the strength characteristics of the in-washed deposits, and the degree of their compaction [25].
The developed method of estimated performance monitoring the stability of tailing dam was tested and implemented in a number of design decisions for the tailing dumps of the mining and non-ferrous metallurgy industrial enterprise in the North of Siberia.
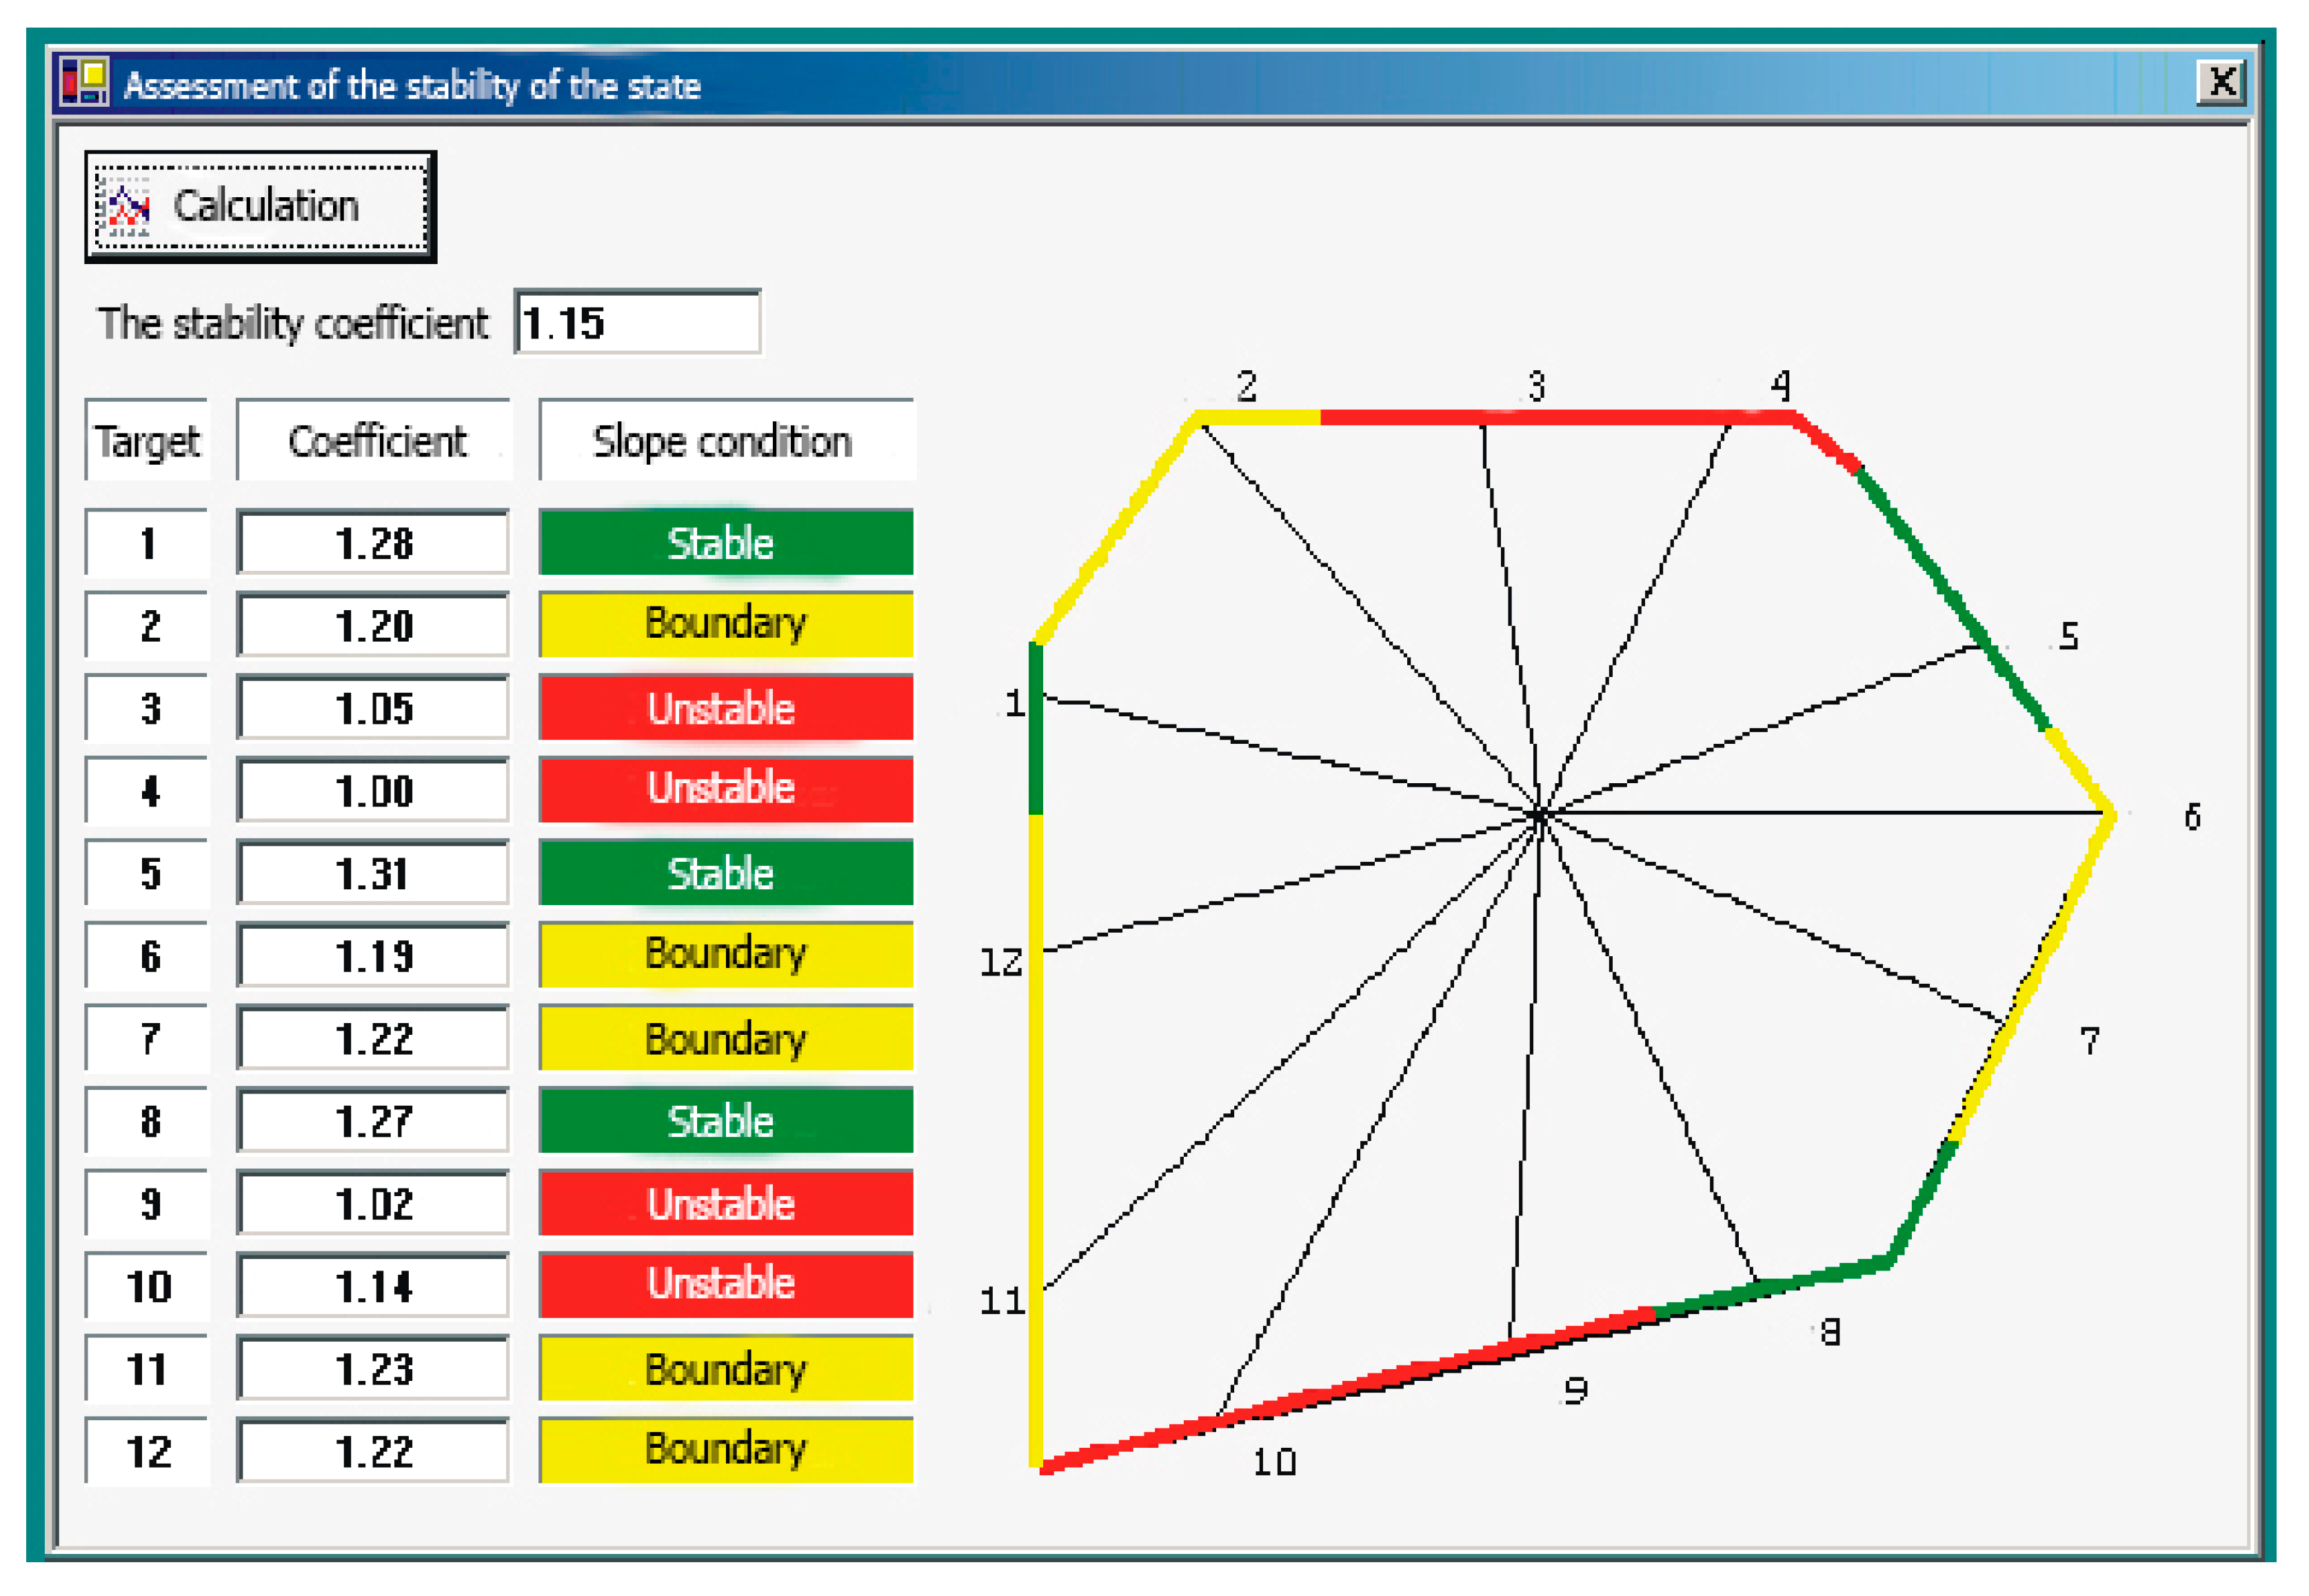
The results of calculations used for zoning and to visualize the state of the tailings of tailing dump. Normally the legend to the map serves as a table, in which different colors marked valid, invalid, and above the permissible values safety factor of sustainability as indicated in Table 10 [25].
The scheme is represented as a cartographic model with dedicated it clearing blocks by color the status of the tailing dam stability (Figure 16).
According to the results of calculations it is established:
  • plots along areas 1, 5 and 8 are in a steady state – slope condition is stable;
  • plots along areas 2, 6, 7, 11 and 12 should be operated with careful observance of the requirements of the project for the operation of the tailing dump – slope condition is boundary;
  • dam sites along cross-sections 3, 4, 9, and 10 need urgent measures to increase the bearing capacity of the dam – slope condition is unstable.
In these areas (3, 4, 9, 10), various methods must be applied to prevent an accident.
It is possible to do by technological ways. We will consider the results of approbation of some of them [26].
Intensity of the inwash process increases on the sites where the secondary coating of tails of the beach area at a distance of 5 m were carried out by tails with the help of excavating equipment. The schematic circuit of banking is shown in Figure 17.
This allows to form an additional embankment dam, which in turn leads to a change of:
  • geometric parameters of the dam with an increase in the size of the dam along the top;
  • processes of consolidation of inwashed tailings, their acceleration and natural im-provement of the dam base.
Creation of a secondary dam with the help of an excavator has shown high efficiency.
Average speed of arrangement of a secondary dam from stale tails with the help of an excavator comes to ~10-30 meters per hour.
At realization of the technology with the use of banking by excavating equipment, the following operations are being occasionally excluded from the technology used now:
  • dismantling of a distributive slurry pipeline;
  • overlifting of a distributive slurry pipeline.
Using the technology of levee embankment allows increasing its volume up to 6%.
The next technological way of compression process and dumps volume increasing has been used by compacting of inwashed beach zone by rollers (Figure 18)
During compaction process of tails the next rules were observed:
  • The selection of the type of the roller has been carried out under the average characteristics of compacting tails;
  • The compacting was made with keeping of a technological pause for two weeks, after inwashing of the next layer of tails and achieving of the optimum humidity by 15÷20 %;
  • Each subsequent compacting trace of roller overlaped previous on 20÷30 cm;
  • The direction of movement of road-roller has been chosen from a retaining prism of a dam to a slurry collecting slag prism;
  • The number of one trace passes has been defined in dependence from the weight characteristics of the roller, initial density, humidity of tails, and from the demanded final density of tails.
As a result of compacting it is possible to receive reserves of volume of depositing tails up to 25÷30 %.
Parameters of compression process depend on humidity, density, and grain-size composition of tails.
Compression was carried out in two weeks after the completion of an inwash of the next sector. The use of compression allows increasing the capacity of a beach up to 30 %. Besides, due to compression, filtration factor reduction of a body of a dam is observed and value of stability factor increases
The results of the obtained data were compared with the results of the basic version of the calculation of the stability of the structure. They show the dynamics of changes in the properties of soils, which effects on the stability coefficient, proving the legitimacy of the technology application (Table 11).
Thus the approach on accident factors allow for monitoring construction in the process of exploitation and to take urgent measures in hazardous areas surrounding the tailings dam.
When choosing a technological scheme of construction and operation the influence of climatic conditions on the geotechnical massif technological scheme forming process is of particular importance.
On available samples of tails 15 series of samples of the set moisture content and density for carrying out of the further trials have been generated. At planning out of quantity of experiments the methods of probability theory and the mathematical statistics were used. The given conclusion has been taken as principle definitions of quantity of tests at the set parameters of experiment. Physical properties of the tested samples are presented in Table 12 [25,27,28].
The compression curves for the tail samples with specified moisture content and density are shown in Figure 19. From that data we can see that the behavior of tails at different moisture content and density remains invariable. It testifies that the given factor of consolidation can be applied to definition of consolidation characteristics of tails that considerably will reduce labour input.
The time, required for consolidation of the layer and also the description of the process of the sample deformation in height h depending on its deformation properties were defined by the equation (1). The results are presented in Table 13.
As known, the process of tailings inwash is divided into two stages: tails inwash and consolidation of inwashed tails.
The obtained values of the inwash and tails consolidation times presented in Table 14.
On the basis of the obtained results, it follows that with successive washing of sec-tors, the duration of the inwash will be:
( H 1 + K 1 ) 2 + ( H 2 + K 2 ) 2 + ( H 3 + K 3 ) 2 + ( H 4 + K 4 ) 4 + ( H 5 + K 5 ) 4 = = ( 14 + 12 ) 2 + ( 7 + 12 ) 2 + ( 9 + 12 ) 2 + ( 16 + 12 ) 4 + ( 15 + 16 ) 4 = 368   days . where H - the inwash process; K – the consolidation process of the tails; 1-5 – the sector numbers.
However, according to the climatic conditions of the region, tailings can be in-washed only for 195 days.
In order to meet the regulatory requirements, optimization of the process of reclamation has been applied to network planning (Figure 20).
The inwash is proposed to start from the 4th sector of H4, since the time required for its inwash is 16 days and is the longest in duration. After the end of the H4 wash-up, the consolidation process of K4 begins, simultaneously with it 5th sector H5 - inwash for 15 days.
In addition, in the case of two fields, it is advisable to go through all the stages of reclamation and consolidation in one field, and then move on to another, since in longer distances this will be more rational and ergonomic.
As a result of the construction and calculation of the network schedule, it was de-termined that the critical path duration is 189 days, which allows us to conclude that the entire volume of tailings will be laid in the required time.
Further, complex studies of the composition, structure and properties of tailings were carried out for the engineering and geological justification of the formation of alluvial technogenic massifs.
The results of research have shown that tailings have their own characteristic features of structure, composition and properties.
The results of the analysis of the granulometric composition of soils obtained by microaggregate, standard and dispersion methods are presented in Table 15:
The results of determining the granulometric composition were used to calculate the microaggregate coefficients (Kma) for six fractions based on the difference in their contents during dispersed and aggregate sample preparation, presented in Table 16.
A negative coefficient indicates the number of aggregates of the corresponding value. The coefficient of microaggregates with a positive sign - an increase of particles of smaller sizes that released from aggregates.
Thus, during dispersion, a natural process occurs: larger elements destroyed, and the smallest ones collected in a fraction less than 0.001 mm.
The degree of soil aggregation and the size of their aggregates and particles determined by the microaggregationality coefficients. Experiments and calculations made it possible to determine the features of tailings microstructure, types of microstructures and structural models of soils (Table 17).
The next step is to get the total content of primary particles + particles in the composition of the aggregates (Table 18).
The degree of soil aggregation and the size of their aggregates and particles determined by the microaggregationality coefficients. Experiments and calculations made it possible to determine the features of tailings microstructure, types of microstructures and structural models of soils (Table 19).
Air-dry samples were used to determine indicators of physical and physical-chemical properties of soils. The research results presented in (Table 20).
Due to the specific values of the strength of technogenic soils, which is associated with their specific composition (ore dressing wastes), it is not possible to use any recommendations of regulatory documents and reference calculated values "c" and "φ". Experimental data are required for calculations.
According to dispersed granulometry (boiling with sodium pyrophosphate) and on the basis of the calculations performed, the following information can be provided:
The tailings of the tailing dump are sandy loams, the content of the medium-coarse sandy fraction (>0.25 mm) is 49.2%, the fine-fine sandy fraction (0.25-0.05 mm) - 30.1%. The amount of clay particles is 10.0%. According to the total number of aggregates, an aggregated-skeletal (A=9.5%) microstructure was established. The type of structural model is medium-coarse sandy (medium-coarse sandy structural elements prevail), elementary (G2=82%).
Mathematical modelling of various schemes of refining tails and magnetic pyrite concentrate, with the forecast of stability of frame fillings, was done in order to develop effective technique. Drilling and maintenance of inspection equipment, measuring of temperatures and water levels in a dam body were executed. Exploration drilling including full testing of core samples was carried out on the territory of the magnetic pyrite depository №2.
To forecast the levee stability a number of programs was used. The program complex UWay FEM package was applied to calculate temperature condition on the basis of finite elements. To forecast the levee stability, the program UniFos was used [12].
The program complex UWay permits to forecast the stress-strained state of soil and rocky massifs, the change of temperature and hydrological modes of soil massif.
The UWay program makes the following types of calculations:
  • changes of geometry of settlement area (for example, the registration of phases of buildings);
  • changes of properties of materials;
  • changes of boundary conditions (both power, and displacement);
  • operation of materials according to various models of behaviour of soils under load
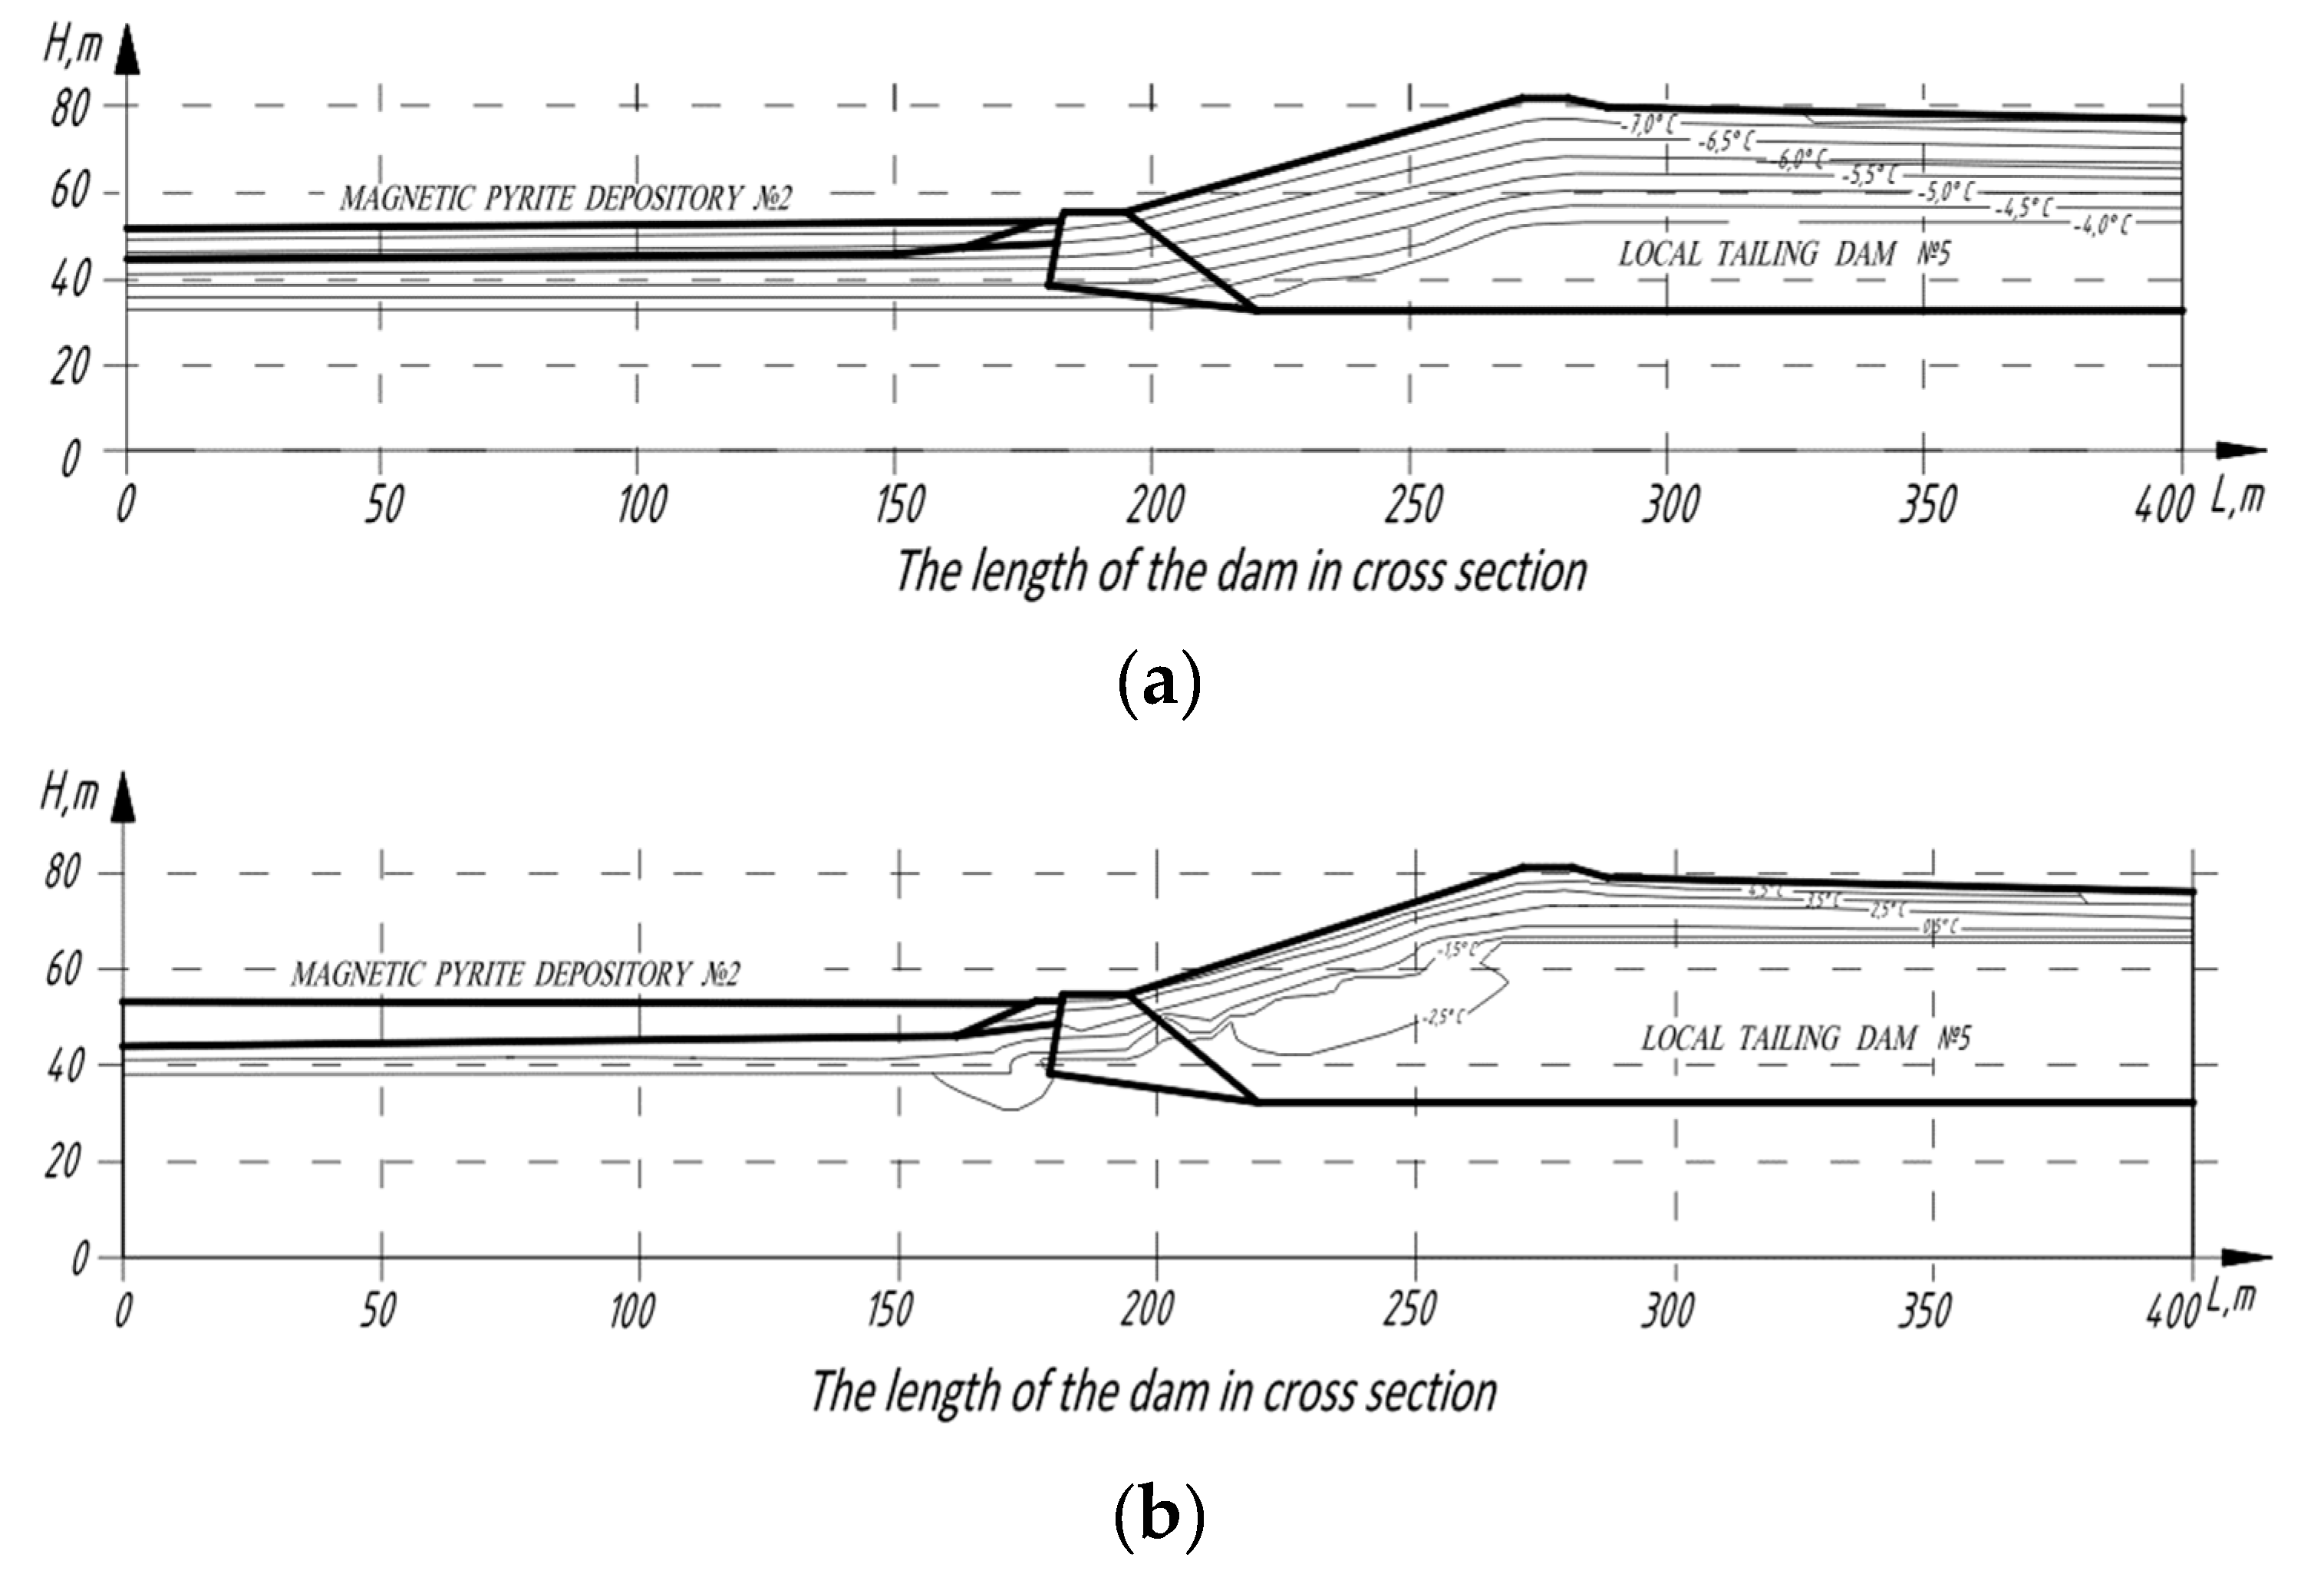
At the first stage the calculations of the temperature conditions in tailing dam’s massif for winter and summer periods were made. The results of calculations are shown in Figure 21.
The given results were used for the appointment of physical and mechanical characteristics of soils composing the dam’s body and have formed the basis of the calculations of dam’s coefficient stability. The calculations were carried out by means of the UniFos program.
The UniFos program is a part of the UWay complex and is assigned for calculations of stability of soil constructions. It is written in the object-oriented language C ++ with the usage of optimizing compiler Borland C ++ Borland International v.5.02 with the library OWL usage v.5.0 [12]
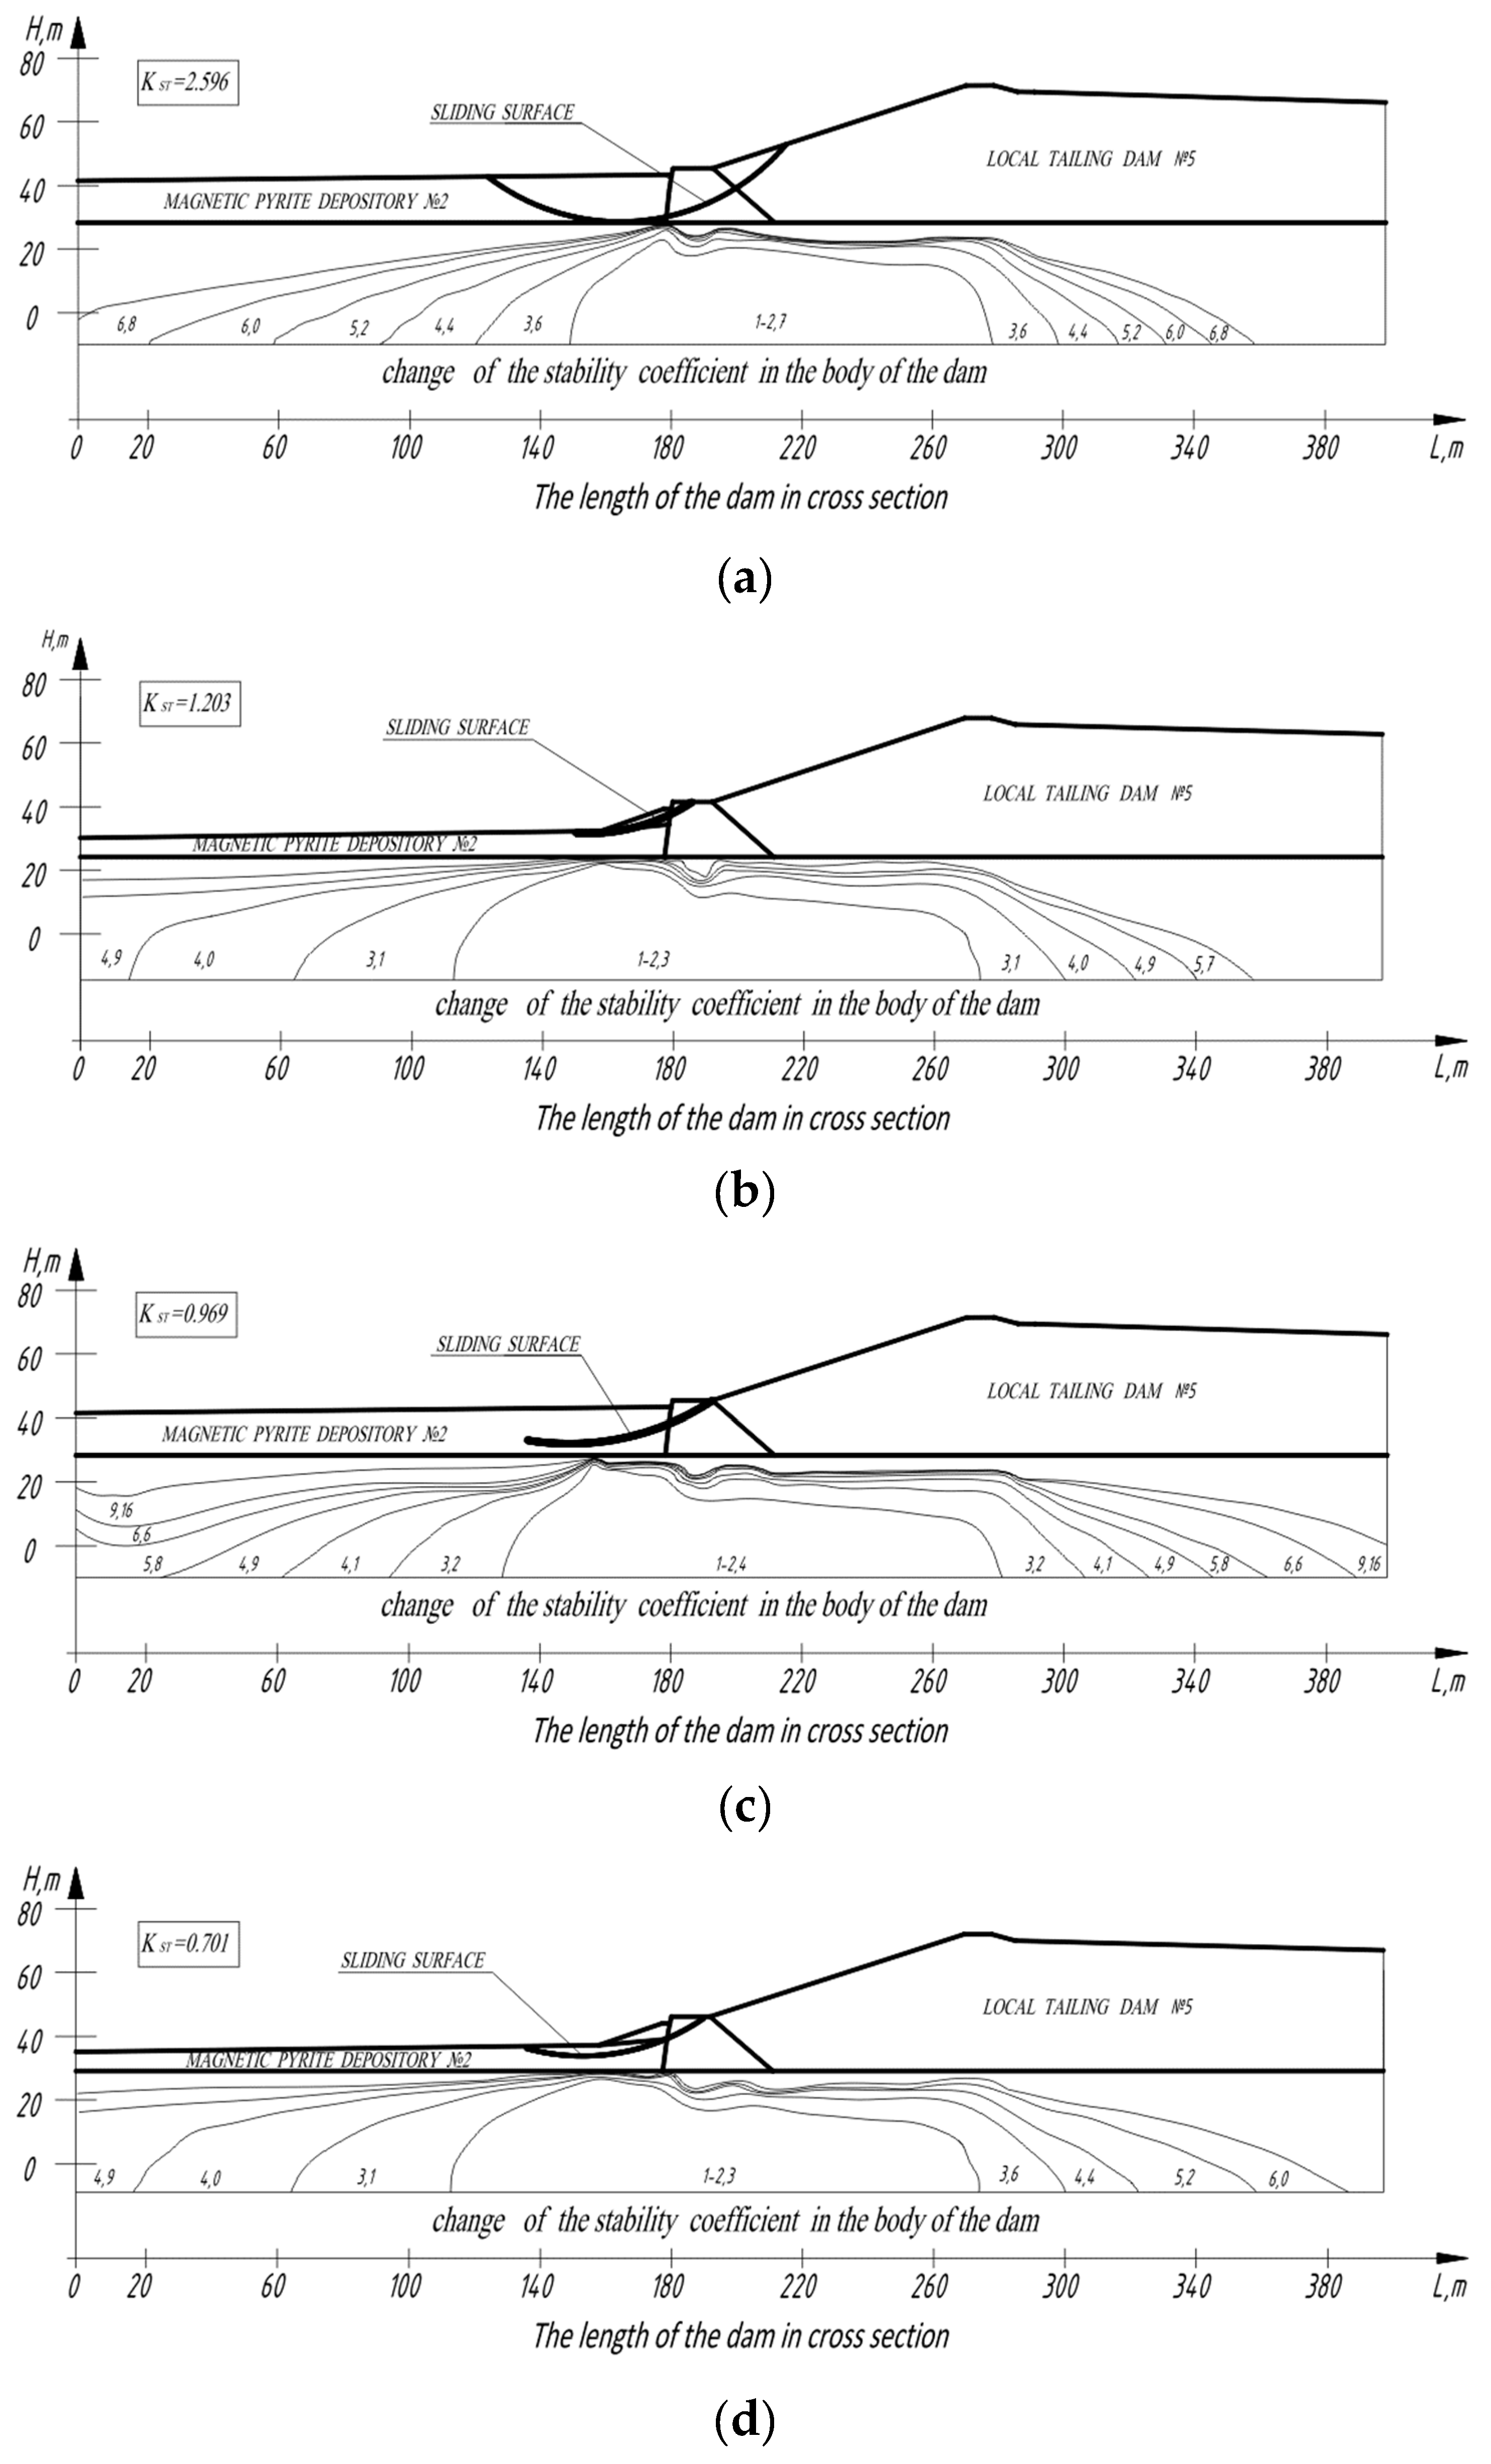
At the next stage the calculations of the stability coefficient of the tailing dam were carried out for four conditions:
a) in winter time before excavating works;
b) in winter time on termination of excavating;
c) in summer time on termination of excavating works and flooding by water;
d) in summer time without flooding by water.
The results of calculations of the dam’s stability coefficient are shown in Figure 22.
The analysis of results of mathematical modeling shows that the dam stability is not provided during the summer period (stability coefficient is less than 1) when the earlier suggested technology of magnetic pyrite concentrate excavating is used. This result helped to form the basis for changing work technique that provided, in its turn, safe and effective execution phase.
The justification of the minimum sizes of the security zone, and the development of the concentrate excavating technology were executed at the following stage of modelling.
At this stage various options of concentrate refining were considered:
  • with preservation of a security zone of various width (20, 50, 75, 100 m),
  • with the backfilling and without,
  • with a thawing assumption, etc.
The results of calculations of stability coefficient for the various sizes of a security zone width permit to draw a conclusion that its optimum equals 50 m. This conclusion was based on the development of the excavating technology of magnetic pyrite concentrate.
The excavating technology of the pyrite concentrate is offered to be carried out in the following sequence (Figure 23):
  • 1 turn: To excavate the concentrate from the whole area of the pyrite depository №2 up to the border of the security zone (about 50 m);
  • 2 turn: To excavate the concentrate within the security zone during winter period;
  • 3 turn: To substitute the excavated volume within the security zone for soil material from the local tailing dam using slope flattening (at the beginning of the summer period).
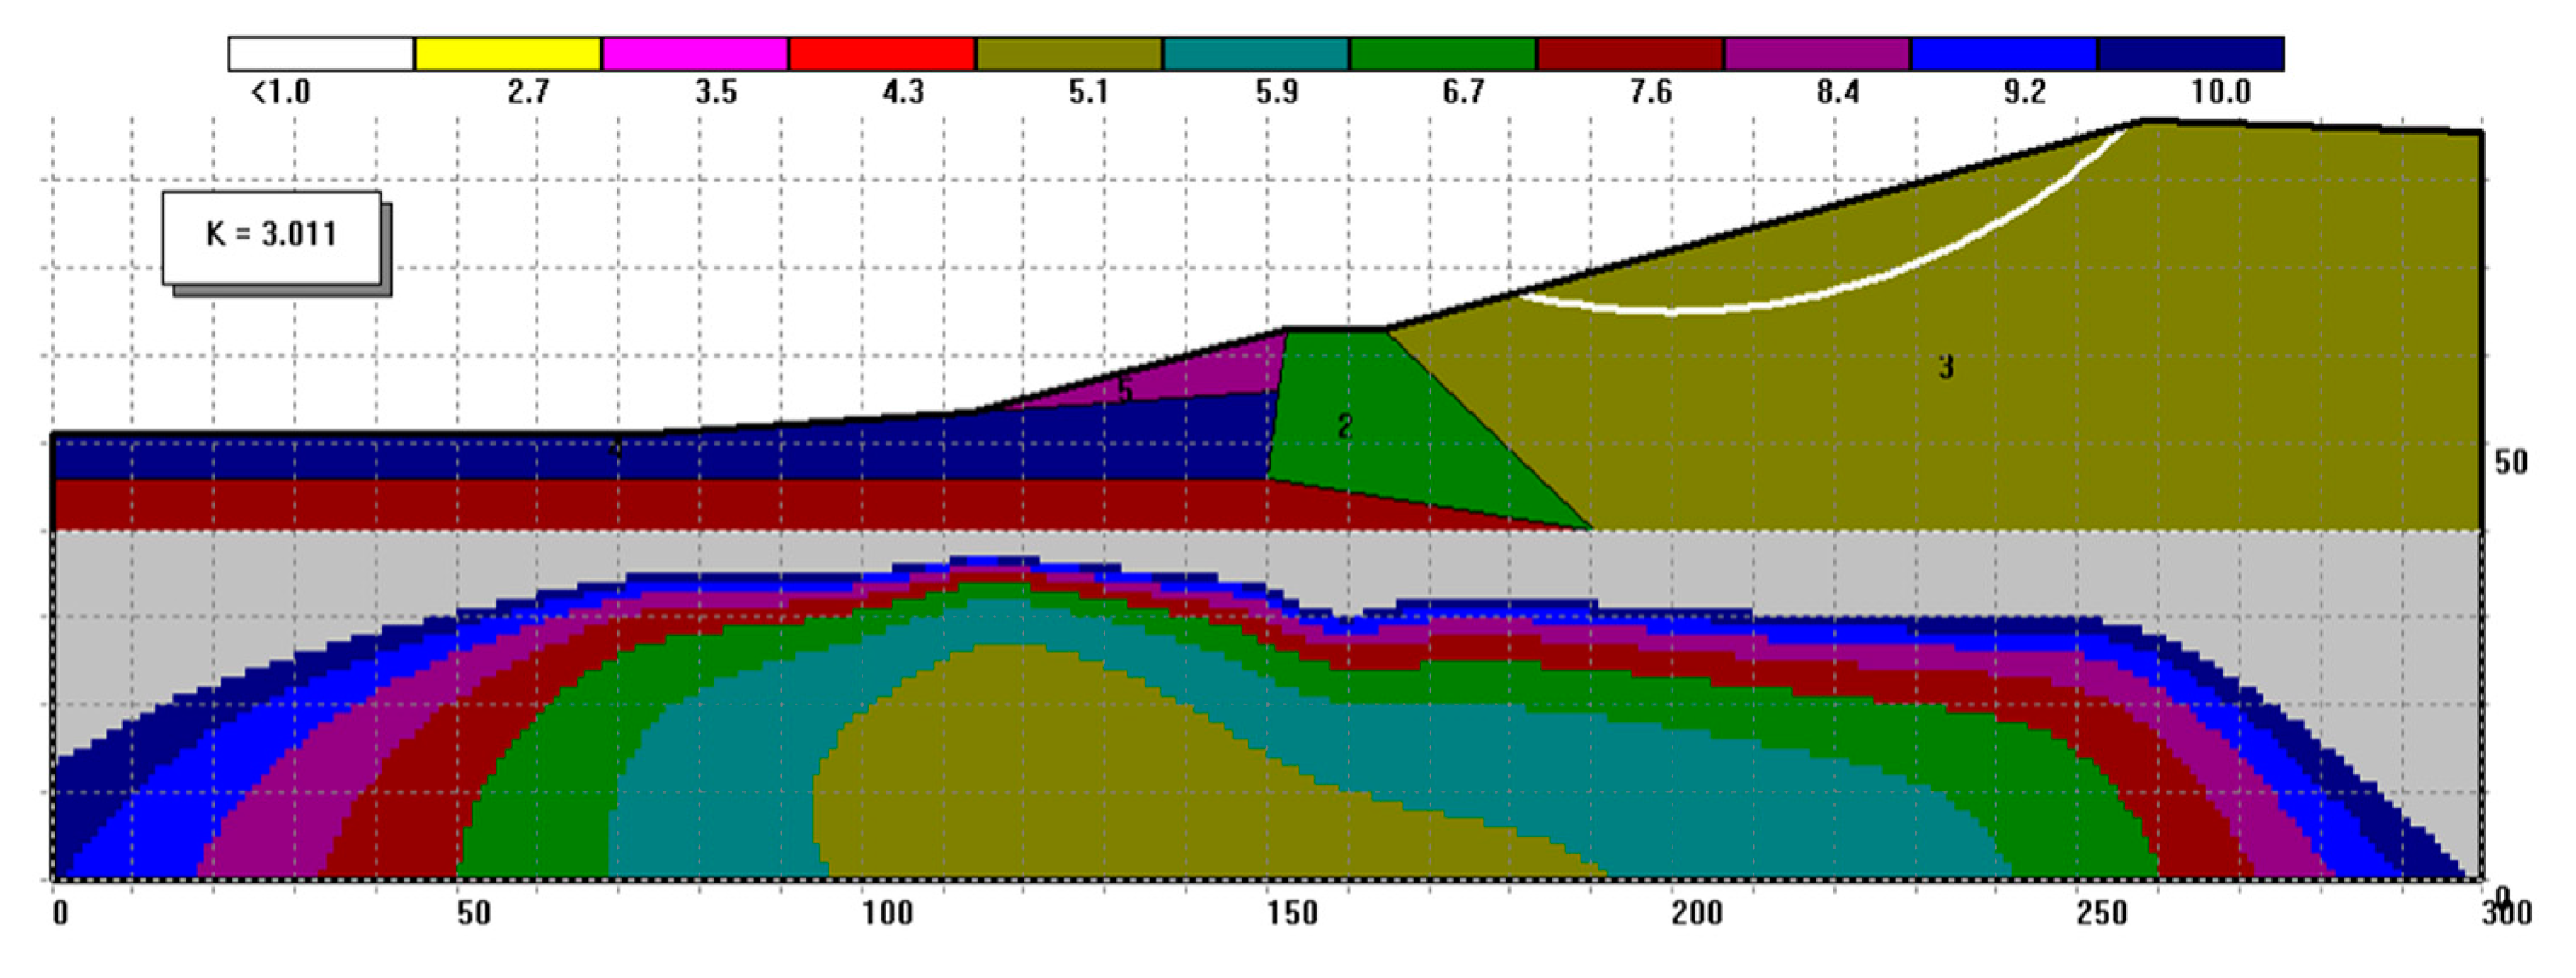
The crest of a dam will be cut off by 2 meters, i.e. to the mark of 121,0 m (under the condition of preservation of minimum admissible excess of dam crest level over the level of a pond mirror (mark - 117,2 m). The slope inclination will decrease to 1:4 that improves the dam stability.
The stability coefficient will grow to 3.0 value that testifies to a steady condition of the tailing dam (Figure 24).
Program complex UWay FEM package has been applied to the dam’s temperature condition calculation on the basis of finite elements.
Forecasting of stability of a levee is executed by means of the UniFos program.
The carried out calculations permitted to forecast the stability of tailing dam and formed the basis for alteration of work technique that provided safe and effective execution phase.

5. Conclusions

The comprehensive research carried out has provided both theoretical and practical justification for several directions of effective and safe operation of the tailing dump in the coming years.
Accidents at mining enterprises, particularly those involving tailing dumps, present a significant threat to human lives, engineering structures, and the surrounding environment. This underscores the urgent need for effective measures to address the risks associated with reservoirs of various origins.
Scientific research is essential in developing optimal methods and technologies for constructing these facilities while minimizing their negative impact on the environment.
Scientific monitoring is crucial throughout all stages of tailings storage facility management, including design, construction, operation, and disposal.
Thus, the practical application of the developed method of estimated monitoring for tailing dam stability has demonstrated high reliability of the obtained results and confirmed the actual load-bearing capacity of the tailings dam.
Conducted researches permitted to forecast the stability of tailing dam and formed the basis for alteration of work technique that provided safe and effective execution phase.
Author Contributions

Conceptualization, Alan Lolaev, Aleksandr Badoev and Aleksan Oganesyan; Data curation, Aleksandr Badoev; Formal analysis, Aleksandr Badoev and Aleksan Oganesyan; Funding acquisition, Alan Lolaev; Investigation, Aleksandr Badoev, Aleksan Oganesyan, Emil Oganesyan, Stanislav Dzeboev and Ilya Tvauri; Methodology, Alan Lolaev, Aleksandr Badoev, Aleksan Oganesyan and Emil Oganesyan; Project administration, Alan Lolaev; Resources, Alan Lolaev and Aleksan Oganesyan; Software, Aleksandr Badoev and Aleksan Oganesyan; Supervision, Alan Lolaev; Validation, Alan Lolaev; Visualization, Aleksandr Badoev and Ilya Tvauri; Writing – original draft, Aleksandr Badoev; Writing – review & editing, Alan Lolaev and Aleksandr Badoev.

Acknowledgments

The work was carried out according to the plan of the research work of the Vladikavkaz Scientific Center of the Russian Academy of Sciences – registration number: АААА-А19 119040190054-8.

Conflicts of Interest

The authors declare no conflict of interest.

References

  1. Lolaev, A.,Butygin, V.: Geological and ecological problems of industrial hydraulic engineering in cryolite zone. Nedra, Moscow, 2005 [In Russian].
  2. Okewale I.A., Grobler H. Investigations into Grading Characteristics of Tailings. In: Ha-Minh C., Tang A.M., Bui T.Q., Vu X.H., Huynh D.V.K. (eds) CIGOS 2021, Emerging Technologies and Applications for Green Infrastructure. Lecture Notes in Civil Engineering, 2022, vol. 203. Springer, Singapore. [CrossRef]
  3. Okewale, I.A., Grobler, H.. Influence of Fabrics on Compression Mechanics of Iron Tailings. In: Ha-Minh, C., Tang, A.M., Bui, T.Q., Vu, X.H., Huynh, D.V.K. (eds) CIGOS 2021, Emerging Technologies and Applications for Green Infrastructure. Lecture Notes in Civil Engineering, 2022, vol 203. Springer, Singapore. [CrossRef]
  4. Zhang, Q.; Yin, G.; Wei, Z.; Fan, X.; Wang, W.; Nie, W. An experimental study of the mechanical features of layered structures in dam tailings from macroscopic and microscopic points of view. Eng. Geol. 2015, 195, 142–154. [Google Scholar] [CrossRef]
  5. Carrera, A.; Coop, M.; Lancellotta, R. Influence of grading on the mechanical behaviour of Stava tailings. Geotechnique 2011, 61, 935–946. [Google Scholar] [CrossRef]
  6. Butyugin, V.V.; Shkoda, V.S. The role of hybrid modeling in the development of technologies for the construction of alluvial hydraulic structures. The collection of abstracts of reports of scientific and technical conference / Norilsk industrial institute. Norilsk, pp. 123-124, 2000. [In Russian].
  7. Lolaev, A.B.; Badtiev, B.P.; Butyugin, V.V.; Badoev, A.S. Determination of consolidation characteristics of tailings washed by technogenic deposits. Sustainable development of mountain territories. 2017, Vol. 9, No. 4(34), pp. 355-361. DOI 10.21177/1998-4502-2017-9-4-355-361. [In Russian].
  8. Lolaev, A.; Butygin, V.; Akopov, A.; Oganesian, A.; Sumin, M. Optimization of the Inwash Technology of the Cascade Tailing Dump Levee in Permafrost Region. Proc. 6th Int. Congr. ICEG. 2010, Delhi, India.
  9. Patent No. 2486310 C1 Russian Federation, IPC E02B 7/06. method of raising the dam of the hydraulic dump: No. 2011149442/13: application 05.12.2011: publ. 27.06.2013 / A. B. Lolaev, A. P. Akopov, A. Kh. Oganesyan, M. N. Sumin. [In Russian].
  10. Lolaev A., Oganesyan A., Oganesyan E., Badoev A. (2020) Estimated Monitoring Methodology for the Tailings Dam Stability. In: Correia A., Tinoco J., Cortez P., Lamas L. (eds) Information Technology in Geo-Engineering. ICITG 2019. Springer Series in Geomechanics and Geoengineering. Springer, Cham. [CrossRef]
  11. Kalinin, E.V. Engineering-geological calculations and modeling. Moscow: ed. Moscow University, 2006. [In Russian].
  12. Vlasov, A.N.; Yanovsky, Yu.G.; Mnushkin, M.G.; Popov, A.A. "Solving geomechanical problems with UWay FEM package." In Proceedings of EPMESC’IX. International Conference on Enhancement and Promotion of Computational Methods in Engineering and Science. Macao, 2003.
  13. Lolaev, A.; Oganesyan, A.; Badoev, A.; Oganesyan, E. Tailing dams formation algorithm. Arab. J. Geosci. 2020, 13, 974. [Google Scholar] [CrossRef]
  14. Badoev, A.S. Engineering-geological substantiation of alluvial technogenic soil massifs formation in the conditions of cryo-lithozone (on the example of the Norilsk industrial region)." Dissertation of Candidate of Geological and Mineralogical Sciences, Irkutsk, Russia: IEC SB RAS, 2020. [In Russian].
  15. PNIIS Gosstroy USSR. Recommendations for determining the parameters of creep and soil consolidation by laboratory methods. Moscow, Stroyizdat, 1989. [In Russian].
  16. Lipiński, M.J.; Wdowska, M.K.; Jaroń. Influence of Fines Content on Consolidation and Compressibility Characteristics of Granular Materials. IOP Conf. Series: Mater. Sci. Eng. 2017, 245, 032062. [Google Scholar] [CrossRef]
  17. Lolaev, A.B., Badoev, A.S., Khulelydze, K.K., Butyugin, V.V. Network planning for the optimization of technological parameters of the tailings leaching process. Sustainable development of mountain territories, Vol. 9, No. 3(33), p. 281-286, 2017 [In Russian]. [CrossRef]
  18. Ryashchenko, T.G. Regional soil science (Eastern Siberia). Irkutsk, Russia: IES SB RAN, 2010.
  19. Larionov, A.K. Methods for studying soils structure. Moscow, Russia: Nedra, 1971. [In Russian].
  20. Ryashchenko, T.G., Akulova, V.V., Ukhova, N.N., Shtelmakh, S.I., Grin, N.N. Loess soils of the Mongol-Siberian region. Irkutsk, Russia: IEC SB RAS, 2014. [In Russian].
  21. Ryashchenko, T.G., Vashestyuk, Yu.V., Grin, N.N. Method 'Microstructure' in the practice of regional engineering and geological studies of loess and clay soils: monograph. Irkutsk: Publishing house IRNITU, 2021. [In Russian].
  22. Osipov, V.I., Sokolov, V.N., Rumyantseva, N.A. Microstructure of clay rocks. Ed. Academician E.M. Sergeev. Moscow: Nedra, 1989. [In Russian].
  23. Utility Model Patent No. 122098 U1 Russian Federation, IPC E02B 1/02. laboratory stand for modeling the flushing process of hydrotechnical structures: No. 2012128269/13: application 07/03/2012: publ. 11/20/2012 / A. B. Lolaev, M. N. Sumyn, A. P. Akopov [and others] [In Russian].
  24. Patent No. 2654718 C1 Russian Federation, IPC E02B 7/06. The method of construction of a wash-off dam: No. 2017102802: application. 27.01.2017: publ. 05/22/2018 / A. B. Lolaev, A. Kh. Oganesyan, A. S. Badoev, E. H. Oganesyan. [In Russian].
  25. Lolaev A., Oganesyan A., Badoev A., Oganesyan E. Geotechnical Modelling of Optimization of Technological Parameters of the Tailing Dam Alluvium. In: Duc Long P., Dung N. (eds) Geotechnics for Sustainable Infrastructure Development. Lecture Notes in Civil Engineering, vol 62. Springer, Singapore, 2020. [CrossRef]
  26. Lolaev, A. B., Butygin, V. V., Akopov, A. P., et al. The tailing dump capacity increasing in a mode of operation in permafrost region. In Proceedings of the 14th Asian Regional Conference on Soil Mechanics and Geotechnical Engineering, Hong Kong, 23-27 May 2011. Hong Kong, 2011.
  27. Soils. Classification. GOST 12801-2011 from January 01, 2013. Moscow, Russia: Standartinform, 2013. [In Russian]. 01 January.
  28. Soils. Laboratory methods for determination of physical characteristics. GOST 5180-2015 from April 01, 2016. Moscow, Russia: Standartinform, 2016. [In Russian].
Figure 1. Monitored tailing dump.
Preprints 79106 g001
Figure 2. The situation plan of the tailing dump №1: 1 - tailing dump №1; 2 - the pond; 3 - local tailing dam; 4 - spillway channel; 5 - magnetic pyrite depository №2.
Preprints 79106 g002
Figure 3. The scheme of the dam inwash: 1 – distributive slurry pipeline; 2 – geotextile anti-filtration screen; 3 – the retaining slag prism of a dam; 4 – slurry collecting slag prism; 5 – pool; 6 – inwashed tails.
Preprints 79106 g003
Figure 4. The scheme of the dam inwash: 1 – distributive slurry pipeline; 2 – geotextile anti-filtration screen; 3 – a retaining slag prism of a dam; 4 – slurry collecting slag prism; 6 – inwashed tails.
Preprints 79106 g004
Figure 5. Algorithm of the methodology of the estimated monitoring for the tailing dam stability.
Preprints 79106 g005
Figure 6. Beach sectoring.
Preprints 79106 g006
Figure 7. The algorithm of tailing dam forming.
Preprints 79106 g007
Figure 8. A test complex "ASIS.
Preprints 79106 g008
Figure 9. The design of a laboratory setup for modeling the alluvium of the tailings dam.
Preprints 79106 g009
Figure 10. The scheme of the dam inwash: 1 - enclosing dam in the form of slag prisms; 2 - slurry pipeline; 3 - tailings beach; 4 - separating earth dam in a bay; 5 - tails; 6 - geotextile filtering material; 7 - geotextile non-filtering material; 8 - pond.
Preprints 79106 g010
Figure 11. The distribution of tails on the beach at speed: (а) v = 3,91 m/sec; (b) v = 4,05 m/sec; (c) v = 4,31 m/sec.
Preprints 79106 g011aPreprints 79106 g011b
Figure 12. Tails distribution along the beach.
Preprints 79106 g012
Figure 14. Influence of tailings strength characteristics on the dam's stability coefficient: (a) angle of internal friction; (b) specific adhesion.
Preprints 79106 g014
Figure 15. The density’s effect on the dam’s stability factor.
Preprints 79106 g015
Figure 16. Tailing dam stability monitoring.
Preprints 79106 g016
Figure 17. Arrangement of a secondary banking dam of hydraulic fill tails with the help of excavating equipment: (a) elementary diagram of arrangement; (b) in-situ tests.
Preprints 79106 g017
Figure 18. The scheme of the compacting process: 1. compacting lay of tails; 2. a retaining prism of a dam; 3. slurry collecting slag prism; 4. a beach zone; 5. roller.
Preprints 79106 g018
Figure 19. Compression curves for the tail samples with specified moisture content and density.
Preprints 79106 g019
Figure 20. Network graph of tailings alluvium.
Preprints 79106 g020
Figure 21. Results of calculations of the temperature conditions: (a) in winter time; (b) in summer time.
Preprints 79106 g021
Figure 22. Results of stability coefficient calculations: (a) in winter time prior to the beginning of excavating; (b) in winter time on termination of excavating; (c) in summer time on termination of excavating and flooding by water; (d) the same without flooding by water.
Preprints 79106 g022
Figure 23. Sequence of the excavating technology of a pyrite concentrate.
Preprints 79106 g023
Figure 24. The stability coefficient of the enclosing dam after completion of works.
Preprints 79106 g024
Table 1. Alluvium process options.
№ of field № of sector Area of plots, m2 Accepted height of the alluvium, m Volume of plots, m2 Distance between pickets, m Volume of single layer of the alluvium, m3
I field 1 634436,45 1 634436,5 1800 317218,23
2 305490,65 1 305490,7 2700 152745,33
3 426747,19 1 426747,2 2700 213373,59
II field 4 728976,26 2 1457953 3200 364488,13
5 689924,71 2 1379849 3000 344962,35
Table 2. Accepted indexes.
Index Parameter, %
А Total amount of aggregates
А1 Aggregates – 1.00-0.25 mm
А2 Aggregates – 0.25-0.05 mm
А3 Aggregates – 0.05-0.01 mm
А4 Aggregates – 0.01-0.002 mm
А5 Aggregates – 0.002-0.001 mm
М1 Primary (free) particles – 1.00-0.25 mm
М2 Primary particles – 0.25-0.05 mm
М2-А Particles in aggregates – 0.25-0.05 mm
М3 Primary particles – 0.05-0.01 mm
М3-А Particles in aggregates – 0.05-0.01 mm
М4 Primary particles – 0.01-0.002 mm
М4-А Particles in aggregates – 0.01-0.002 mm
М5 Primary particles – 0.002-0.001 mm
М5-А Particles in aggregates – 0.002-0.001 mm
М6 Primary particles – < 0.001 mm
М6-А Particles in aggregates – < 0.001 mm
М7 The real fraction content < 0.001 mm
М8 The real fraction content < 0.002 mm
М9 Fraction content < 0.002 mm according to standard granulometry
Kcl Clay coefficient (M8/M9)
М11 The total fraction content 0.05-0.002 according to standard granulometry
F1 Fraction freedom coefficient – 1.00-0.25 mm
F2 Fraction freedom coefficient – 0.25-0.05 mm
F3 Fraction freedom coefficient – 0.05-0.01 mm
F4 Fraction freedom coefficient – 0.01-0.002 mm
F5 Fraction freedom coefficient – 0.002-0.001 mm
F6 Fraction freedom coefficient – < 0.001 mm
Table 4. Classification of microstructure types of clay soils.
Total number of aggregates(А), % Microstructure Conditional index
А< 10 skeletal sk
10< А<25 aggregated-skeletal ag-sk
25 < А < 40 skeletally aggregated sk-ag
А >40 aggregated ag
Table 5. Classification of types of structural models of clay and loess soils.
The size of the prevailing elements Model type G = Мх/Ах+Мх Model type
А1 + М1 Medium-coarse sand (250-500 microns) 80 < G < 100 Elementary
А2+М2 Fine-grained (50-250 microns) 20 < G < 80 Mixed
A3 + M3 coarse-dusty (10-50 microns) G < 20 Aggregated
А4 + М4 Fine-dusty (2-10 microns)
А5 + М5 Coarse clay (1-2 microns)
Table 6. Tails distribution % at a fixed speed of the pulp 3,91 m/sec.
Speed of the pulp, m/sec Liquid to solid ratio Distance from the distribution pipeline, m Sieve sizes
0,63 0,2 0,05
3,91 1/2,5 10 1,20 22,98 75,82
50 32,74 29,40 37,86
100 7,62 6,82 85,56
1/3,5 10 2,66 10,63 86,71
50 7,94 26,22 65,84
100 4,90 20,30 74,80
1/2 10 3,67 17,64 78,69
50 21,51 25,95 52,54
100 4,80 19,25 75,95
1/4 10 10,99 21,98 67,04
50 17,54 22,53 59,93
100 9,77 3,52 86,71
Table 7. Tails distribution % at a fixed speed of the pulp 4,05 m/sec.
Speed of the pulp, m/sec Liquid to solid ratio Distance from the distribution pipeline, m Sieve sizes
0,63 0,2 0,05
4,05 1/2,5 10 10,41 9,33 80,26
50 11,18 8,74 80,08
100 16,27 16,16 67,56
1/3,5 10 3,08 4,95 91,97
50 11,30 15,84 72,87
100 14,13 43,59 42,28
1/2 10 2,82 5,12 92,06
50 8,66 7,65 83,68
100 8,56 36,28 55,16
1/4 10 2,92 8,80 88,28
50 4,61 8,66 86,74
100 9,87 15,47 74,66
Table 8. Tails distribution % at a fixed speed of the pulp 4,31 m/sec.
Speed of the pulp, m/sec Liquid to solid ratio Distance from the distribution pipeline, m Sieve sizes
0,63 0,2 0,05
4,31 1/2,5 10 0,78 20,59 78,63
50 12,44 18,15 69,40
100 4,89 10,24 84,87
1/3,5 10 2,10 10,77 87,13
50 5,37 21,26 73,38
100 3,56 18,39 78,04
1/2 10 2,65 15,85 81,51
50 11,35 18,95 69,70
100 3,51 17,13 79,36
1/4 10 7,80 18,82 73,38
50 13,03 20,13 66,84
100 7,27 1,49 91,24
Table 9. Tails distribution with optimum pulp quality.
Speed of the alluvium, m/sec Distance from the enclosing dam, m
10 50 100
3,91 22,25 22,22 22,15
4,05 25,83 26,75 24,27
4,31 23,80 24,92 26,42
Table 10. The legend to the map of the tailing dump stability.
Combination of loads and effects Class of Structure
I II III IV
Basic
Above the allowable (Stable) >1,3 >1,2 >1,15 >1,1
Allowable (Boundary) 1,3-1,25 1,2-1,15 1,15-1,1 1,1-1,05
Invalid (Unstable) <1,25 <1,15 <1,1 <1,05
Special
Above the allowable (Stable) >1,1 >1,1 >1,05 >1,05
Allowable (Boundary) 1,1-1,05 1,1-1,05 1,05 1,05
Invalid (Unstable) <1,05 <1,05 <1,05 <1,05
Table 11. Comparative results of the tailing dam stability calculation.
№ of site kst value, before applying the proposed technology kst value, after applying the proposed technology
3 1,05 1,28
4 1,00 1,26
9 1,02 1,31
10 1,14 1,43
Table 12. Physical properties of samples.
№ exp Humidity W, % Density ρ, g/cm3 Soil particle density ρs, g/cm3 Void ratio e The degree of saturation Sr Flow indexIL Variety in terms of yield
1 4 1,05 2,63 1,60 0,07 < 0 Solid
2 6 1,01 2,63 1,76 0,09 < 0 Solid
3 8 1,09 2,63 1,61 0,13 < 0 Solid
4 10 1,12 2,63 1,58 0,17 < 0 Solid
5 12 1,16 2,63 1,54 0,21 < 0 Solid
6 14 1,18 2,63 1,54 0,24 < 0 Solid
7 16 1,12 2,63 1,72 0,24 < 0 Solid
8 18 1,15 2,63 1,70 0,28 < 0 Solid
9 20 1,34 2,63 1,36 0,39 < 0 Solid
10 22 1,3 2,63 1,47 0,39 < 0 Solid
11 24 1,44 2,63 1,26 0,50 < 0 Solid
12 26 1,51 2,63 1,19 0,57 < 0 Solid
13 28 1,94 2,63 0,74 1,00 0,15 Plastic
14 30 1,87 2,63 0,83 0,95 0,54 Plastic
15 32 1,87 2,63 0,86 0,98 0,92 Plastic
Table 13. The time of the layer consolidation.
№ exp Filtrational consolidation coefficient Cv, cm2/min Time, min The coefficient of secondary consolidation Cα, cm2/min Time, days
1 6,89 10,38 0,0083 6,01
2 3,90 18,69 0,0117 4,34
3 5,80 12,03 0,0112 4,32
4 2,81 24,41 0,0090 5,27
5 5,36 12,86 0,0102 4,67
6 5,21 13,66 0,0091 5,43
7 5,22 14,02 0,0114 4,48
8 5,17 14,14 0,0125 4,07
9 5,92 10,99 0,0132 3,43
10 5,41 12,63 0,0141 3,37
11 5,52 11,61 0,0124 3,59
12 6,54 9,70 0,0124 3,55
13 17,16 3,64 0,0022 19,87
14 12,32 5,26 0,0045 9,90
15 15,23 4,14 0,0035 12,61
Table 14. The time of alluvium and consolidation of tailings.
The volume of pulp alluvium on the area per day, m3 The time of the alluvium of one full layer, days Required humidity W, % Required density ρ, g/cm3 The time of consolidation of one complete layer, days
23972 14 20 1,65 12
23972 7 12
23972 9 12
23972 16 12
23972 15 12
Table 15. Results of granulometric soil analysis.
№ tests Sample preparation type М1s М2s М1d М2d М1с М2с
Lebyazhye tails Aggregate 60.1 28.1 6.1 1.9 2.1 1.7
Semi-dispersed 51.4 26.9 12.2 1.1 5.7 2.7
Dispersed 49.2 30.1 8.3 2.4 6.8 3.2
The content of fractions (%): M1s - medium and coarse-sand (250-500 microns), M2s - fine sand (50-250 microns), M1d - coarse dusty (10-50 microns), M2d - fine dusty (2-10 microns), M1c - coarse clay (1-2 microns), M2c - fine clay (<1 microns) (according to Ryashchenko).
Table 16. Obtained microaggregate coefficients.
№ tests К1-2ma К1-1ma К2-2ma К2-1ma К3-2ma К3-1ma
Lebyazhye tails 1.5 4.7 0.5 2.2 2.0 -10.9
where Kma - microaggregate coefficients (%), calculated accordingly for М2с, М1с1-2ma, К1-1ma), М2d, М1d2-2ma, К2-1ma) и М2s, М3s3-2ma, К3-1ma).
Table 17. Types of microstructures and structural models of soils-tails.
Sample А (%) Mic.-st. type Structural models of soils М7 F6 М8
Lebyazhye tails 10.9 Ag-Sk Х1 60.1 G1 82 3.2 53 10.0
where А - total number of aggregates, including А1-5 - 250-500, 50-250, 10-50, 2-10, 1-2 μm; М1-5 - number of primary particles of the same size, М6 - number of primary particles < 1 μm; М2-А - М6-А - number of particles 50-250, 10-50, 2-1 and < 1 μm as part of aggregates; М7 – total number (primary and in aggregates) of particles < 1 μm; М8 - total number (primary and in aggregates) of particles < 2 μm м; F1-F6 - coefficients of freedom calculated for fractions 250-500, 50-250, 10-50, 2- 10, 1-2 и < 1 μm.
Table 18. Total content (primary particles + particles in aggregates).
Sample М F2 М3A F3 М F4 М F5 М F6
7)
Lebyazhye tails 30.1 93 8.3 73 2.4 79 6.8 31 3.2 53
where М - fine-fine sandy, М - coarse-silty, М – fine-dusty, М - coarse-clayey and М - fine-clay fractions and their coefficients of freedom F (%).
Table 19. Types of microstructures and structural models of soils.
№ tests Microstructure type The model type according to the size of the prevailing elements Type of structural model (G, %)
Unal tails Skeletal Fine grained [А22] Elementary (93)
Fiagdon tails Skeletal-aggregated Medium-coarse sanded [А11] Mixed (56)
Tyrnyauz tails Skeletal Fine grained [А22] Elementary (85)
Lebyazhye tails aggregated-skeletal Medium-coarse sanded [А11] Elementary (82)
Table 20. Indicators of Physical and Physical-Chemical Properties of Soils.
№ tests ρs WL WP IP V φ1 φ2 Dj Ece
Lebyazhye tails 2.62 31.9 27.6 4.9 2.5 19.2 15.8 7.2 12.3
Note: ρs – density of the mineral part of the soil, g/cm3; WL, WP, Ip - upper and lower limits of plasticity, number of plasticity, %; V - sedimentation volume, cm3; φ1, φ2 - angle of natural slope in air and under water, deg.; Dj - angle change, deg.; Ece - cation exchange capacity of the soil, mg-eq per 100 g of substance.
Disclaimer/Publisher’s Note: The statements, opinions and data contained in all publications are solely those of the individual author(s) and contributor(s) and not of MDPI and/or the editor(s). MDPI and/or the editor(s) disclaim responsibility for any injury to people or property resulting from any ideas, methods, instructions or products referred to in the content.
Copyright: This open access article is published under a Creative Commons CC BY 4.0 license, which permit the free download, distribution, and reuse, provided that the author and preprint are cited in any reuse.
Prerpints.org logo

Preprints.org is a free preprint server supported by MDPI in Basel, Switzerland.

Subscribe

© 2024 MDPI (Basel, Switzerland) unless otherwise stated