Preprint
Article

An Integrated Approach of Fuzzy Analytic Hierarchy Process and Super Slacked-based Measure for the Logistics Industry in Vietnam

Altmetrics

Downloads

142

Views

35

Comments

0

A peer-reviewed article of this preprint also exists.

Submitted:

11 July 2023

Posted:

11 July 2023

You are already at the latest version

Alerts
Abstract
In the context of economic development and international economic integration, the logistics industry in Vietnam is developing to meet the market demand for the transportation of goods; thus, many logistics enterprises have been formulated and grown up in recent years. This research aims to measure the efficiency of logistics enterprises and recommend a feasible solution to improve their future performance by integrating the Super Slacked-based Measure model (Super-SBM) in Data Envelopment Analysis and Fuzzy Analytic Hierarchy Processes (Fuzzy AHP) in multi-criteria decision-making. The super-SBM model was utilized to conduct the efficiency scores of logistics enterprises from 2016 to 2022 based on calculating the ratio between input and output variables; the empirical result determined each enterprise's effectiveness and ineffectiveness. Next, the Fuzzy AHP method evaluated and ranked criteria that directly impacted the operational process of logistics enterprises based on experts' opinions; the examined result suggested a feasible direction to improve their business efficiency in the future. The proposed hybrid models are a helpful solution for efficiency determination and development direction for logistics enterprises. An overall picture of the logistics enterprises was also drawn to describe their operational business process.
Keywords: 
Subject: Business, Economics and Management  -   Other

1. Introduction

Industrialization and modernization in the world are a foundation to enhance the development of the logistics industry. The growth of smart technologies [1,2] supported the processes of multi-model cargo delivery, industry 4.0 in logistics provides a high need for transparency and integrity control [3,4], the modern technologies development in logistics centers helped to improve the quality level of the services [5]. The software tools could optimize the whole process of city logistics [6]. Additionally, methods and techniques improved the performance of the logistics industry. The lean manufacturing principles are used to develop measures for the efficiency improvement of using sufficient warehouses, optimizing the research and inventory processes, and mechanizing internal logistics [7]. International leasing as a financial method was implemented to improve the transport and logistics system [8]. Therefore, the new technologies and methods are practical approaches to increase the logistics industry's efficiency. According to Statistics (2023) [9], the size of the global logistics industry in 2021 increased by 2.7 trillion euros compared with the year 2020. Although the covid-19 pandemic impacted most industries and led to an economic crisis, the global logistics sector has been pushed and grown up sharply.
Vietnam’s logistics services have been developed since the Commercial Law in 2005 [10] “Logistics was considered as commercial activities whereas traders organize the performance of one or many jobs including reception, transportation, warehousing, yard storage of cargoes, completion of customs procedures and other formalities and paperwork, provision of consultancy to customers, service of packaging, marking, delivery of goods, or other service related to goods according to agreements with customers to enjoy service charges.” Since Vietnam became a member of the world trade organization in 2007, the logistics industry has had more than opportunities to expand and develop. The e-commerce boom, growing supply of manufactured goods, and increasing consumption are significant elements in rising Vietnam’s logistics industry. As a result, the logistics sector has a sharp growth rate among the fastest-expanding sectors, accounting for 4.5 percent of the country’s GDP in 2021 [11]. Although Vietnam’s logistics industry has had a typical success, it still meets several challenges, such as high logistics costs, low technical quality, shortage of quality human resources, etc. Therefore, this study measured the business performance of Vietnam’s logistics companies from 2016 to 2022 based on the super-SBM model in the DEA method, then relative criteria to increase the logistics performance were formalized based on the Fuzzy AHP method from experts’ advice.
Previous research approached and analyzed the logistics sector by different methods. The statistical learning method is applied to forecast prices and enhance the competitiveness level of a firm [12]. The analytic hierarchy process method was used for the performance evaluation of green logistics [13]. A systematic literature review methodology analyzed documented barriers and benefits of industry 4.0 technology adoption in warehouse management [14]. Applying the CCR model in the DEA method measured and determined the efficient and inefficient cases and suggested efficiency improvement of green supply chain management [15]. A qualitative research method was utilized to present the impacted factors of digital transformation in Vietnam's logistics enterprises [16]. In this study, the integration of the super-SBM model and Fuzzy AHP was implemented to evaluate and improve the performance of logistics companies in Vietnam.
Decision making will give choices by determining a decision, collecting information, and assessing alternative; thus, the DEA method and Fuzzy method in Decision making have expanded and applied in various studies. The DEA method with efficiency calculation presents the performance of a DMU by the ratio of inputs and outputs. Wang et al. (2018) [17] implemented measuring the efficiency scores of port logistics companies in Vietnam by the super-SBM model. Marto et al. (2022) [18] applied the DEA optimization to present the performance of GDP per capital in EU regions. Goyal et al. (2008) [19] utilized the fuzzy techniques to give decisions about the outcome of auctions and the agent’s bidding strategy to the different criteria and market conditions. Dogan et al. (2023) [20] used the fuzzy theory to evaluate customer transactions.
The super-efficiency of a decision-making unit (DMU) presents increasing inputs and reducing outputs, which a DMU's efficiency score has yet to become efficient [21]. The super-efficiency estimates separate scores for DMUs in the same period for both efficient and inefficient cases. The super-SBM model in the DEA method integrates super-efficiency and has been applied for various aspects. Zhou et al. (2018) [22] measured the eco-efficiency of 21 cities in Guangdong Province, China, based on factors of capital, labour force, water supply, energy resource, land resource, industrial soot emission, total wastewater, industrial solid wastes emission, and GDP. Wang et al. (2020) [23] estimated the efficiency of estate companies in Vietnam through the calculated values from 2012-2017, then determined the efficient cases and inefficient cases every year. Huang and Liu (2020) [24] estimated the efficiency of a sustainable hydrogen product scheme's efficiency when they analyzed scale, cost, energy consumption, annual hydrogen production, and carbon emission indicators. Du et al. (2021) [25] evaluated the ecological efficiency of marine ranching in Shandong, China, by evaluating criteria of ecology and resource, policy and management, technology, economy, ecology, and adverse ecological impacts. Ma et al. (2022) [26] conducted the regional financial efficiency of 31 provinces in China when they calculated the efficiency score with factors such as the number of employees in the financial industry, fixed assets investment in the financial sector, deposit balance of financial institutions, loan-to-deposit ratio, gross domestic product, the added value of the financial industry, and loan balance of financial institutions. Therefore, the super-SBM model was a suitable model to implement the efficiency measurement of DMUs which can solve the drawback of scoring at the efficiency level.
The fuzzy AHP method is used for evaluating the weights of criteria and priorities of alternatives [27] based on pairwise comparison. The Fuzzy AHP method is a combination of the AHP and fuzzy sets, which sets up the comparison matrix, aggregating multiple judgements, measuring the consistency, and defuzzifying the fuzzy weights [28] to evaluate the criteria and select alternatives; thus, it has been applied in various types of research. Rezaie et al. (2014) [29] measured the criteria weights which impacted the financial ratios on performance evaluation of 27 Iranian cement firms in the Tehran stock exchange. Ali et al. (2014) [30] used the fuzzy AHP method to determine the weights of eight evidential layers in Taherabad area, eastern Iran. Choosakun and Yeom (2021) [31] applied the fuzzy AHP method to assess the advanced public transport system in Bangkok Metropolitan Region; the traffic accident reduction relating to public transportation, smart public transport network density, and waiting time for public transportation were the essential characteristics. Wang et al. (2022) [32] evaluated the flood risk of 14 lines and 268 stations of the Guangzhou metro in China via the fuzzy AHP method; the analyzed results found outlines 3, 6, and 5 with the highest overall risk level. Sahin and Kulakli (2023) [33] applied the fuzzy AHP method to define the weights of criteria while evaluating the websites of four leading universities in the field of open education in Tuekiye. The Fuzzy AHP is a valuable tool to assess and rank the criteria, which can evaluate the weights of criteria to recommend a feasible solution to improve and increase the operational performance of a particular object.
With the above principles and previous applications, this study used the super-SBM model in the DEA method to calculate the efficiency scores of each logistics company in Vietnam through the ratio between output variables and input variables. Then, each efficient and inefficient case was identified to describe their operational business process and suggest a feasible solution to increase the efficiency score in ineffective cases by reducing input excess and increasing the output shortage. Moreover, the fuzzy AHP method was implemented to identify the weights of criteria which could figure out the impact level of main and sub-criteria for improving the logistics company’s performance in Vietnam. An overall picture of the operational process in historical times and the future development direction of the logistics industry in Vietnam was illustrated as a valuable reference.

2. Methods

2.1. Research framwork

The performance and feasible solution for logistics companies in Vietnam will be estimated based on the super-SBM model and fuzzy AHP method, as shown in Figure 1.
Stage 1: Our objective wanted to investigate and explore a deep knowledge of Vietnam's logistics sector, so we determined to collect actual data and exam criteria for improving the logistics companies' performance.
Stage 2: The theoretical research of logistics, super-SBM model, and fuzzy AHP were provided to clarify previous studies' backgrounds.
Stage 3: The data of logistics companies in Vietnam from 2016 to 2022 were gathered to measure their efficiency scores. All collected data were tested by the Pearson correlation and ensured "isotonic." They must remove and re-select if any data are unappreciated when their Pearson correlation value is not from -1 to +1 or equal to "0". The appreciated data were used to determine efficient and inefficient logistics companies every year.
Stage 4: The efficiency scores presented their able business and exhibited the essential improvement of efficiency, so the Fuzzy AHP method was used for identification of impacted criteria level. The criteria's weights figured out the importance and improvement level for each criterion.
Stage 5: Main results recaptured and discussed with the logistics industry's development.

2.2. Super-SBM Model

Cooper et al. (2007) [34] indicated that data envelopment analysis is a linear programming methodology to determine the relative efficiency of multiple similar entities or decision-making units (DMUs). The observed data for DMUs are used for calculating the relative efficiency scores through a nonparametric procedure. Each DMU computes the efficiency scores according to a set of technical features such as model orientation, model metrics, and production possibility set. Model orientation presents three variants, including input-oriented, output-oriented, and non-oriented. Model metrics show two variants with radial and non-radial models. Every model in the DEA method will have different access: Charnes, Cooper Rhodes (CCR) is a radial model with proportion changes [35]; slacks-based measure (SBM) is non-radial model with specific slacks for each input and output [36]; super efficiency shows ranking efficient units and facilitates comparison based on parametric methods [37]; super-SBM is a radial model which can measure the efficiency score, determine, and identify the separate scores for both efficiency and inefficiency [38]. The super SBM model calculates the distance under variable return-to-scale conditions. Therefore, this study used the super-SBM model to evaluate the performance of logistics companies in Vietnam. We set up logistics companies as n DMUs with the input A = a i j and output B = b i j ( A , B > 0 ) . The production possibility is determined as:
P = a , b / a X λ , b B λ , λ 0
where the non-negative vector is λ .
An expression utilizes to describe a certain D M U ( a 0 , b 0 ) , the production possibility for super-efficiency score is employed as:
P a 0 , b 0 = a ¯ , b ¯ / a ¯ j = 1 , 0 n λ j a j , b ¯ j = 1 , 0 n λ j b j , b ¯ 0 , λ 0
With the weighted distance l 1 from ( a 0 , b 0 ) to ( a ¯ , b ¯ ) P ( a 0 , b 0 ) , the product of two indices ( ) , including distance in the input space and output space is defined as:
= 1 m i = 1 m a i ¯ / a i 0 1 s r = 1 s b r ¯ / b r 0
The input excess and output shortfall of this expression will be vectors s- and s+ respectively.
The super-efficiency ( * ) of super-SBM model is calculated as:
* = min = 1 m i = 1 m a i ¯ / a i 0 1 s r = 1 s b r ¯ / b r 0 / a ¯ j = 1 , 0 n λ j a j , b ¯ j = 1 , 0 n λ j b j , a ¯ a 0 , b ¯ b 0 , b 0 , λ 0
The super-efficiency scores present efficient scores with * 1 and inefficient scores with * < 1 . The inefficient case needs to find a feasible solution to improve its efficiency score by increasing the value of output factors and decreasing the value of input factors.

2.3. Fuzzy Analytic Hierarchy Process

The fuzzy Analytic Hierarchy Process integrates qualitative and quantitative methods to define the eigenvalues and eigenvectors based on determining fuzzy numbers and the triangular fuzzy judgment matrix [39]. The eigenvector presents the priorities of the alternatives for a positive reciprocal pairwise comparison judgment matrix. The FAHP method is used to determine the priority vectors and rank alternatives.

2.3.1. Triangular Fuzzy Number

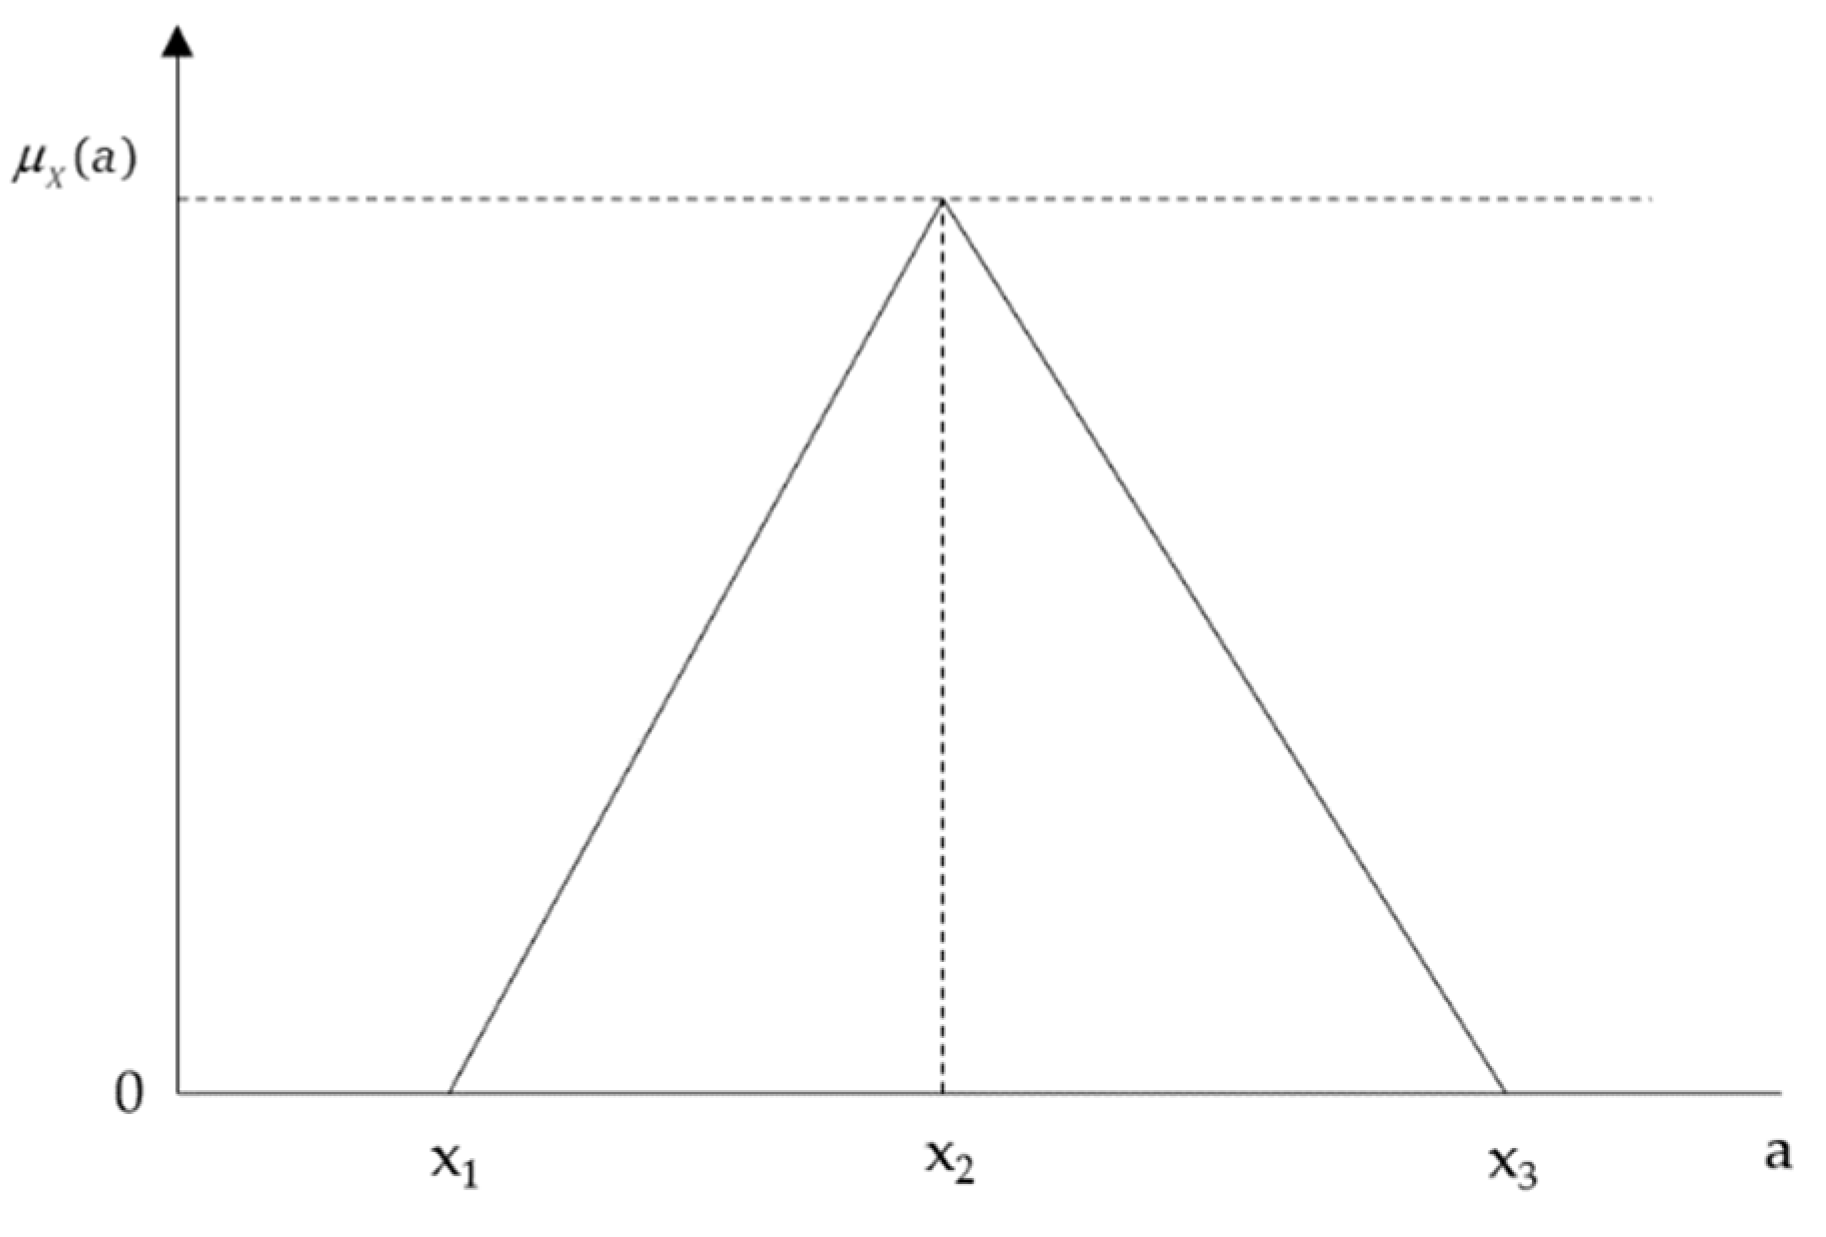
Fuzzy number is a fuzzy set with the real numbers. Triangular fuzzy number is a fuzzy number with three points [40]. We set up x1, x2, x3 be real numbers, the triangular fuzzy number X = ( x 1 , x 2 , x 3 ) will be showed in Figure 2.
The parameters including x 1 , x 2 , and x 3 present the smallest possible value, most promising value, and largest possible value, respectively [41]. The triangular fuzzy number is determined as:
t ( x 1 , α , x 2 , x 3 ) = 1 x 2 x 1 x 2 α ( α x 1 x 2 ) 1 x 1 x 2 x 3 x 2 ( x 2 < x 1 x 3 ) 0 , ( x 1 < α , x 1 > x 3 )
The triangular fuzzy number ranges from 1 ˜ to 9 ˜ .

2.3.2. Fuzzy Linguistic Scale

A fuzzy linguistic scale indicates the quality of information retrieval and formulates a method of choosing the optimum set of values of qualitative attributes [42]. Ryjov (1987) [43] and Ryjov (1992) [44] measured the fuzzy linguistic scale by calculating the actual object’s properties. The performance of candidates for each criterion is utilized to identify the evaluation criteria weights when formulating pair-wise comparison metrics among criteria. The linguistics scale is used for measuring the performance of candidates [45], as shown in Table 1.

2.2.3. Fuzzy AHP Algorithm

The fuzzy AHP method is formulated with fuzzy logic theory and sets the AHP scale into a fuzzy triangle scale [46]; it is developed as following steps:
Step 1: Determine the problem, then establish a hierarchical analysis framework from the triangle number.
Step 2: Generate a comparison matrix, the matrix has a strong position for the consistency framework and is used for analyzing the overall priority sensitivity for change. We set up that the number of criteria is n , the weight for criterion is w i , and the ratio of the weight and criterion is x i j . Therefore, the pair-wise comparison is computed by:
x i j = w i w j , i , j = 1 , 2 , 3 , ... n
The fuzzy pairwise comparison matrix will be:
X ˜ = 1 x 12 x 13 x 14 x 21 1 x 23 x 24 x 31 x 32 1 x 34 x 41 x 42 x 43 1
Then, invert the fuzzy number:
X ¯ 1 = ( x 1 , x 2 , x 3 ) 1
And the inversion for the fuzzy pairwise comparison matrix will be:
X ˜ 1 = 1 x 12 x 13 x 14 1 / x 21 1 x 23 x 24 1 / x 31 1 / x 32 1 x 34 1 / x 41 1 / x 42 1 / x 43 1
Step 3: The fuzzy geometric mean value will be calculated by:
g ˜ i j = X ˜ 1 X ˜ 2 X ˜ 3 X ˜ 4 = ( x 11 , x 21 , x 31 ) ( x 12 , x 22 , x 32 ) ( x 13 , x 23 , x 33 ) ( x 14 , x 24 , x 34 ) = x 11 x 12 x 13 x 14 , x 21 x 22 x 23 x 24 , x 31 x 32 x 33 x 34
Step 4: The weight value of the fuzzy vector is conducted:
w i = x 1 + x 2 + x 3 3
Step 5. After the vector weight value is calculated, the alternative value is estimated to rank the criteria and give a selection of decisions. The result indices a comparison of the criteria and the importance of alternative comparison to each criterion.

3. Results

3.1. Efficiency Measurement

In recent years, Vietnam’s logistics industry has transformed due to the impact of the economic impact. In this study, the Super-SBM model in the DEA method was used for measuring the business efficiency of logistics companies in Vietnam from 2016 to 2022, which could present an overall observation of the operational process and understand how to change.

3.1.1. Data Analysis

Based on the research objective of evaluating the performance of logistics companies in Vietnam and the principle of the super-SBM model, the input and output variables of 9 logistics companies in Vietnam from 2016 to 2022, including Petrovietnam Transportation Corporation (PVT); Vietnam National Shipping Lines (MVN); Pacific Petroleum Transportation Joint Stock Company (PVP); International Gas Product Shipping Joint Stock Company (GSP); Airports Corporation Of VietNam (ACV); Port of Hai Phong Joint Stock Company (PHP); Dinh Vu Port Investment and Development Joint Stock Company (DVP); Transimex Corporation (TMS); South Logistics Joint Stock Company (STG), were selected when their data were posted on Vietstock [47]. Three input variables, including current assets (CA), non-current assets (NCA), and Owner's equity (OE) and two output variables, including net revenue (NR) and net profit after tax (NPFT), as shown in Figure 3 are main points in the financial statement to determine the business performance of each company; thus, they were selected to measure the business efficiency.
Input variables:
Current assets: All short assets alternate in the operational process, including cash, bank deposits, short-term receivables, and inventory. The current assets’ validity term is often short and can return the capital within one year or a business cycle.
Non-current assets: The assets have a high capital and long user, including tangible fixed assets, intangible fixed assets, and other long-term assets.
Owner’s equity: The investment funds are owned by the sole proprietor, partner, or shareholders.
Output variables:
Net revenue: The business profit of an enterprise is achieved from the business activities during managing and delivering the products.
Net profit after tax: The business result of an enterprise after deducting fees, including core operations and net of taxes.
The historical values of logistics companies in Vietnam from 2016 to 2022 were collected and summarized in Table A1. The maximum value of CA, NCA, OE, NR, and NPFT was 40221; 25185; 43806; 18329; and 8214, respectively; the minimum value of CA, NCA, OE, NR, and NPFT was 320; 54; 377; 518; and 33 respectively. All collected data were positive data and appreciated to apply in the super-SBM model.

3.1.2. Pearson Correlation Coefficient

The Super-SBM model in the DEA method was used for measuring the business efficiency of logistics companies in Vietnam from 2016 to 2022. The data were applied to calculate the score of efficiency needing to test the correlation coefficient to ensure the isotonic relationship between variables. The relationship between variables of the DEA method identified three types of correlation, including, between input and output, among inputs only, and outputs only [48]. Their values range from -1 to 1, whereas those close to zero indicate a low association, and those close to -1 and +1 indicate a robust linear association. Positive values of the correlation coefficient are a tendency of one variable to increase or decrease together with another variable. Negative values of the correlation coefficient are a tendency to rise in values of one variable and decrease of values of the other variable associated together [49]. Values of the correlation coefficient of logistics companies in Table A2 were from 0.28232 to +1; so, they were positive values and had a linear relationship between variables. Therefore, these nine logistics companies' data were suitable for using the Negative-SBM model for calculating their business efficiency scores.

3.1.3. Business Efficiency

The DEA method was utilized to measure the performance of DMUs, and the Super-SBM model conducted separate efficiency scores for DMUs over each year. Table 2 presents the efficiency change of logistics companies throughout 2016–2022. Their scores had a large fluctuation; the distance between minimum and maximum values of PVN, MVN, PVP, GPS, ACV, PHP, DVP, TMS, and STG was 2.36093; 2.03102; 0.8139; 6.2013; 0.87678; 0.80248; 1.22739; 0.62347; and 1.15685. Four companies, including MVN, GPS, DVP, and TMS, always achieved the efficiency score in the whole term when their scores were above one number in the whole term, whereas GSP held the highest efficiency before the covid-19 pandemic appeared in 2020. The rest of the logistics companies had both inefficient and efficient scores. PVT and ACV attained efficiency excluding 2021, when PVT’s score reduced sharply to 0.71634, and ACV’s score decreased sharply to 0.12322. STG got the efficiency in 2017, 2021, and 2022; its lowest score was 0.5051 in 2016. PHP was efficient in 2016 and 2020; its lowest score was 0.57517 in 2017. PVP was a unique company that only attained the efficiency score in one year, with a score of 1.09951 in 2020; additionally, it had the lowest efficiency in four periods, including three continual years from 2016 to 2018, with 0.28561; 0.30384; and 0.54837, respectively and 0.75669 in 2022. The operational business for each company was impacted directly by the covid-19 pandemic when the efficiency score of many companies deducted when the covid-19 pandemic appeared unexpectedly since 2020 and caused postponement in manufacturing and discontinuity in the global supply chain.
The finding results of 9 logistics companies in Vietnam during the period of 2016–2022 by the super-SBM model in the DEA method escalated their efficiency scores to figure out ineffectiveness and effectiveness. Per the analyzed results, five logistics companies obtained inefficient scores; they should have a direction to improve their business results through an effective operating process. In this study, we investigated, analyzed, and suggested feasible solutions to increase the business values of the logistics company in Vietnam via the Fuzzy AHP method.

3.2. Performance Improvement Direction

3.2.1. Strategic Structure in Business

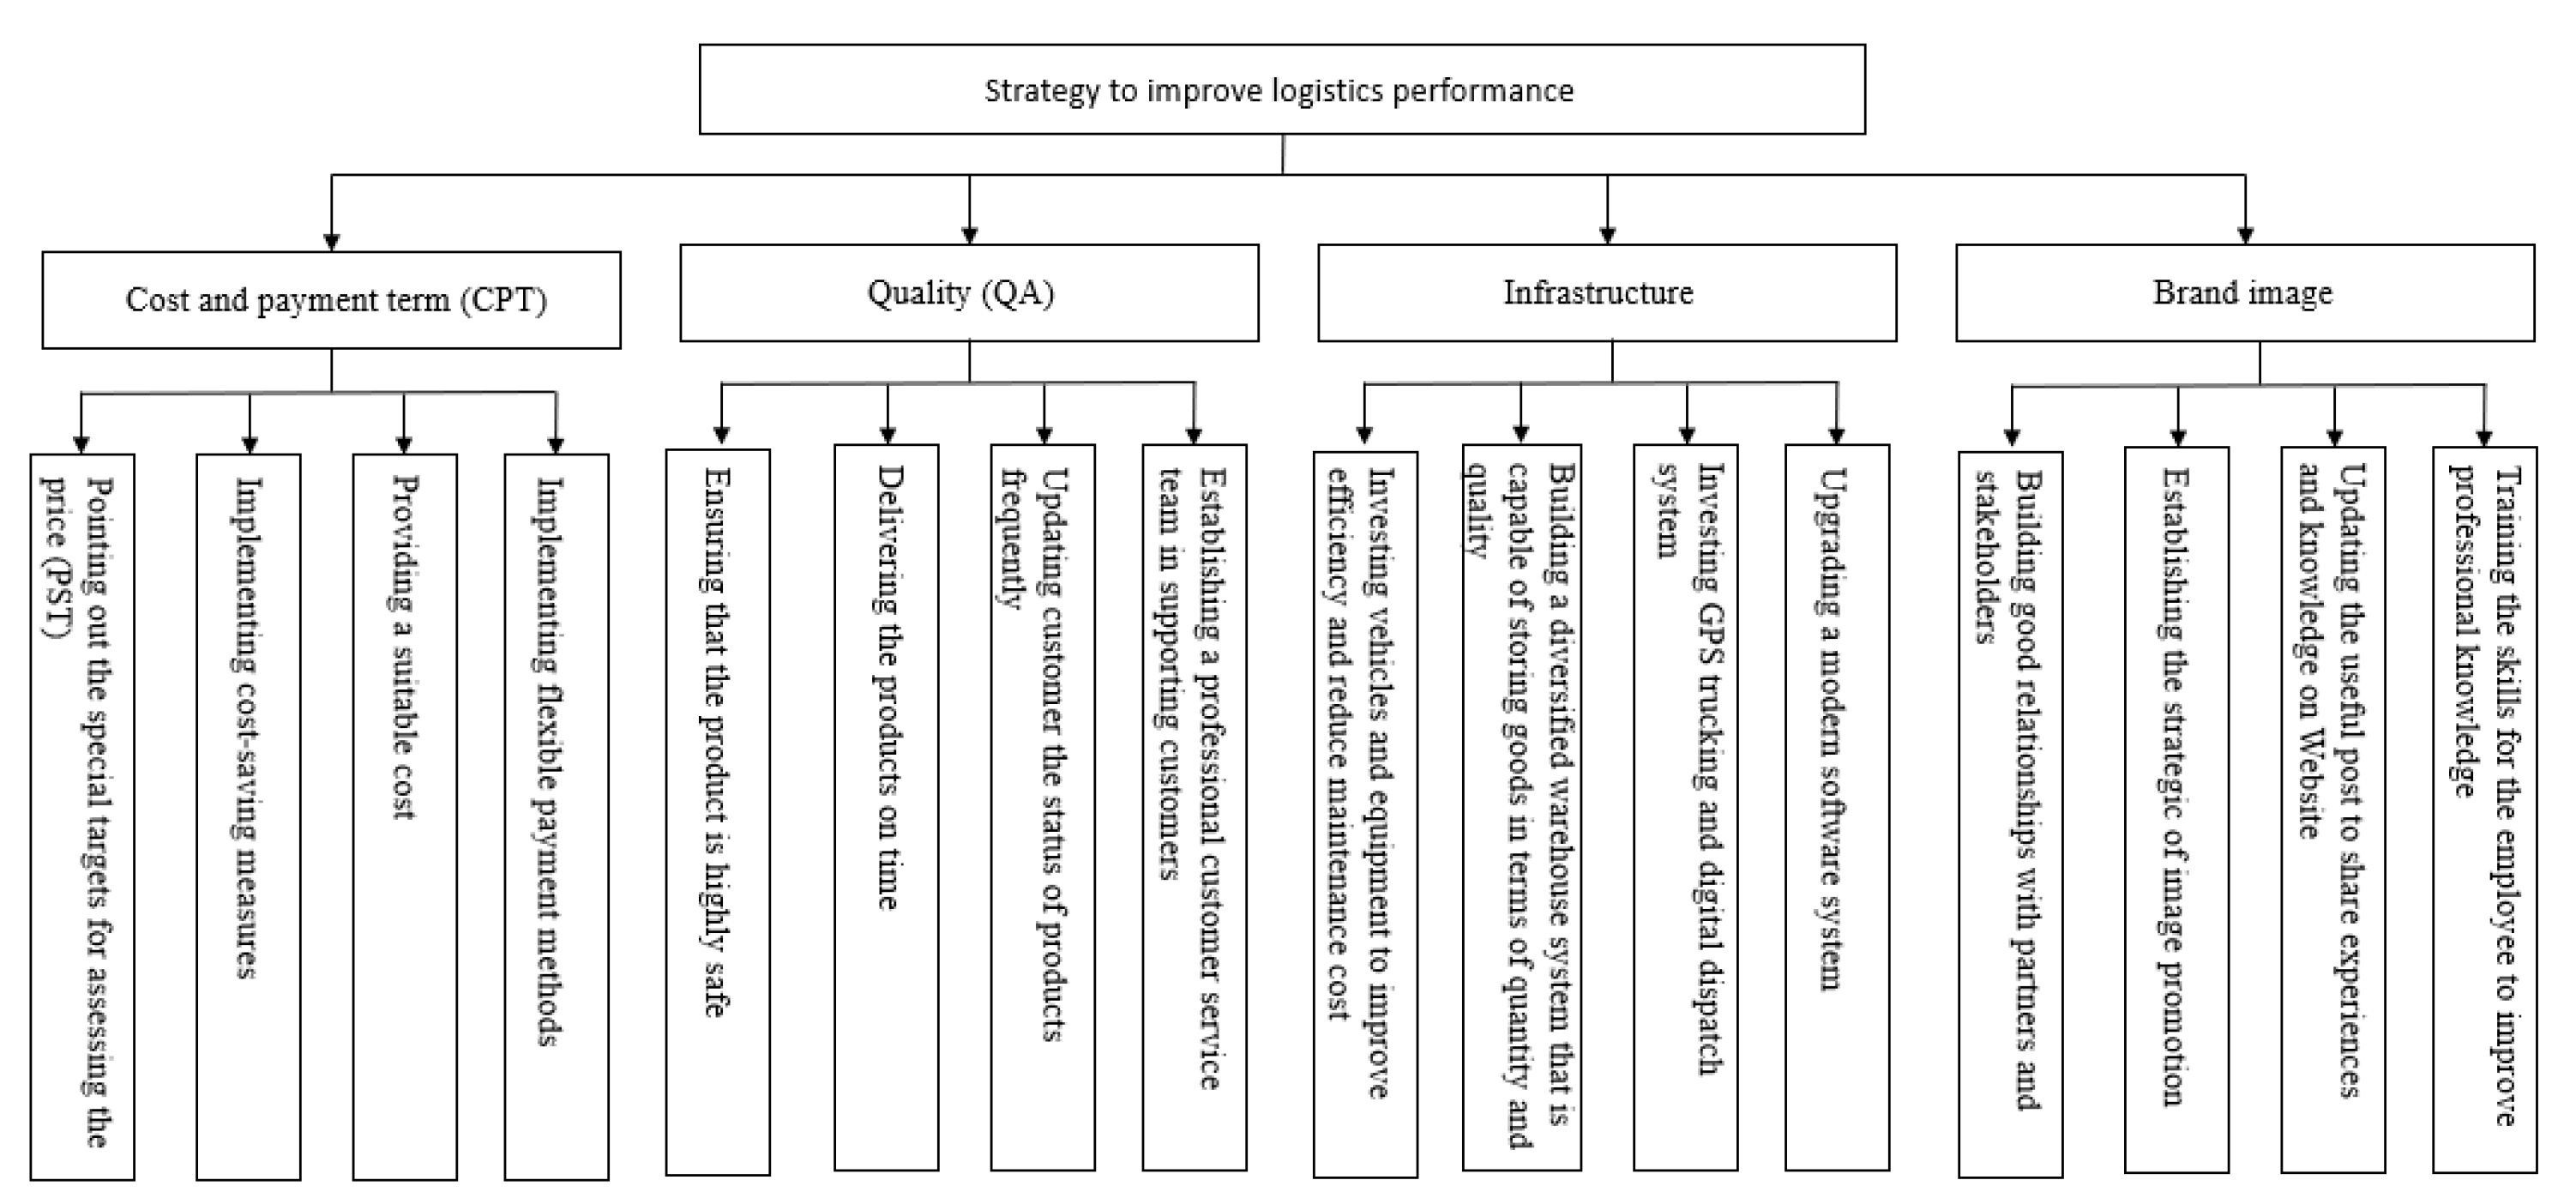
Based on the principle of the Fuzzy AHP method and the purpose of increasing the business efficiency of a Logistics Company, this study modified and established the FAHP structure of the increase of logistics performance, as shown in Figure 4.
Figure 4 indicated that the goal of the strategy to improve logistics performance was the first level. The four main criteria under the goal were the second level of the hierarchical structure. Sixteen sub-criteria under four main criteria were the third level of the hierarchical structure. Four main and sixteen sub-criteria were established to determine the impact factors to increase business efficiency.

3.2.2. Analysis Results of criteria

The above factors were designed based on the FAHP method. This questionnaire was delivered and evaluated by logistics and supply chain management experts with more than ten years of related work experience and a post-undergraduate degree.
The result of the pairwise comparison matrix of the main criteria was set up based on the triangular fuzzy number.
X = ( 1 , 1 , 1 ) ( 1 / 8 , 1 / 7 , 1 / 6 ) ( 9 , 9 , 9 ) ( 9 , 9 , 9 ) ( 6 , 7 , 8 ) ( 1 , 1 , 1 ) ( 6 , 7 , 8 ) ( 1 / 7 , 1 / 6 , 1 / 5 ) ( 1 / 9 , 1 / 9 , 1 / 9 ) ( 1 / 8 , 1 / 7 , 1 / 6 ) ( 1 , 1 , 1 ) ( 1 / 8 , 1 / 7 , 1 / 6 ) ( 1 / 9 , 1 / 9 , 1 / 9 ) ( 5 , 6 , 7 ) ( 6 , 7 , 8 ) ( 1 , 1 , 1 )
The fuzzy geometric value
G = ( 1 X 0.125 X 9 X 9 ) , ( 1 X 0.143 X 9 X 9 ) , ( 1 X 0.167 X 9 X 9 ) ( 6 X 1 X 6 X 0.143 ) , ( 6 X 1 X 1 X 0.143 ) , ( 8 X 1 X 8 X 0.2 ) ( 0.111 X 0.125 X 1 X 0.125 ) , ( 0.111 X 0.143 X 1 X 0.125 ) , ( 0.111 X 0.167 X 1 X 0.167 ) ( 0.111 X 5 X 6 X 1 ) , ( 0.111 X 6 X 7 X 1 ) , ( 0.111 X 7 X 8 X 1 ) 1 / 4 = ( 1.7838 , 1.8444 , 1.9168 ) ( 1.5059 , 1.6905 , 1.8915 ) ( 0.2042 , 0.2183 , 0.2358 ) ( 1.3512 , 1.4698 , 1.5794 )
The fuzzy weights and weights
W f = ( 0.3172 , 0.3531 , 0.3956 ) ( 0.2678 , 0.3237 , 0.3904 ) ( 0.0363 , 0.0418 , 0.0487 ) ( 0.2403 , 0.2814 , 0.326 = 0.3527 0.3249 0.0419 0.2805
The finding results of factors were conducted based on the above process as shown in Table 4.
Table 4 presents the weight of each criterion to describe their importance level. For the main criteria, the M2 has the highest weight at 0.57556; the second weight belongs to M1 at 0.25905; the third weight is M4 at 0.10671; the M3 is the lowest weight at 0.05868. As a result, the range of main criteria for improvement of logistic performance is followed: M2 > M1 > M4 > M3. The logistics company’s quality is essential to identify, enhance, and increase development.
Each main criterion is explained particularly by the sub criterion when the expert’s opinion reviewed and evaluated the detailed sub criterion. The weight of cost and payment term is ranked: S13 > S11 > S12 >S14; this result indicates that the S13 has an important and high effect. The weight of quality is organized: S21 > S22 > S24 >S23; thus, the S21 has a highest value and most important in increasing quality process. The weights of sub criteria for infrastructure are in a range: S32 > S31 > S34 > S33; the S32 has the most important meaning in building the infrastructures. The range of weight for Band image’s sub criteria is organized: S41 > S44 > S42 > S43, which means that the S41 has an important and high impact in building the brand image of logistics company.
The integrated valuation for each sub criterion was conducted by the integration and calculation of sub criteria; the finding results present the overall important level of each criterion in a range: S22 > S23 > S34 > S32 > S11 > S21 > S44 > S41 > S14 > S42 > S12 > S43 > S31 > S33 > S24 > S13. By the way, delivering product on time with the integrated weight at 0.14414 gets the highest value, which means that it’s the most important and meaningful element in improving and increasing the business performance of logistics companies in Vietnam.
The empirical results exhibit the classification and importance level of sub and main criteria in improving the performance of Logistics Companies in Vietnam. The finding revealed that each Logistics Company should improve their quality of service by ensuring the safety of products, delivering the products on time, updating customers on the status of products frequently, and having professional customer service. Consequently, quality is an essential element that the customer uses for identifying and selecting the logistics service.

4. Discussion

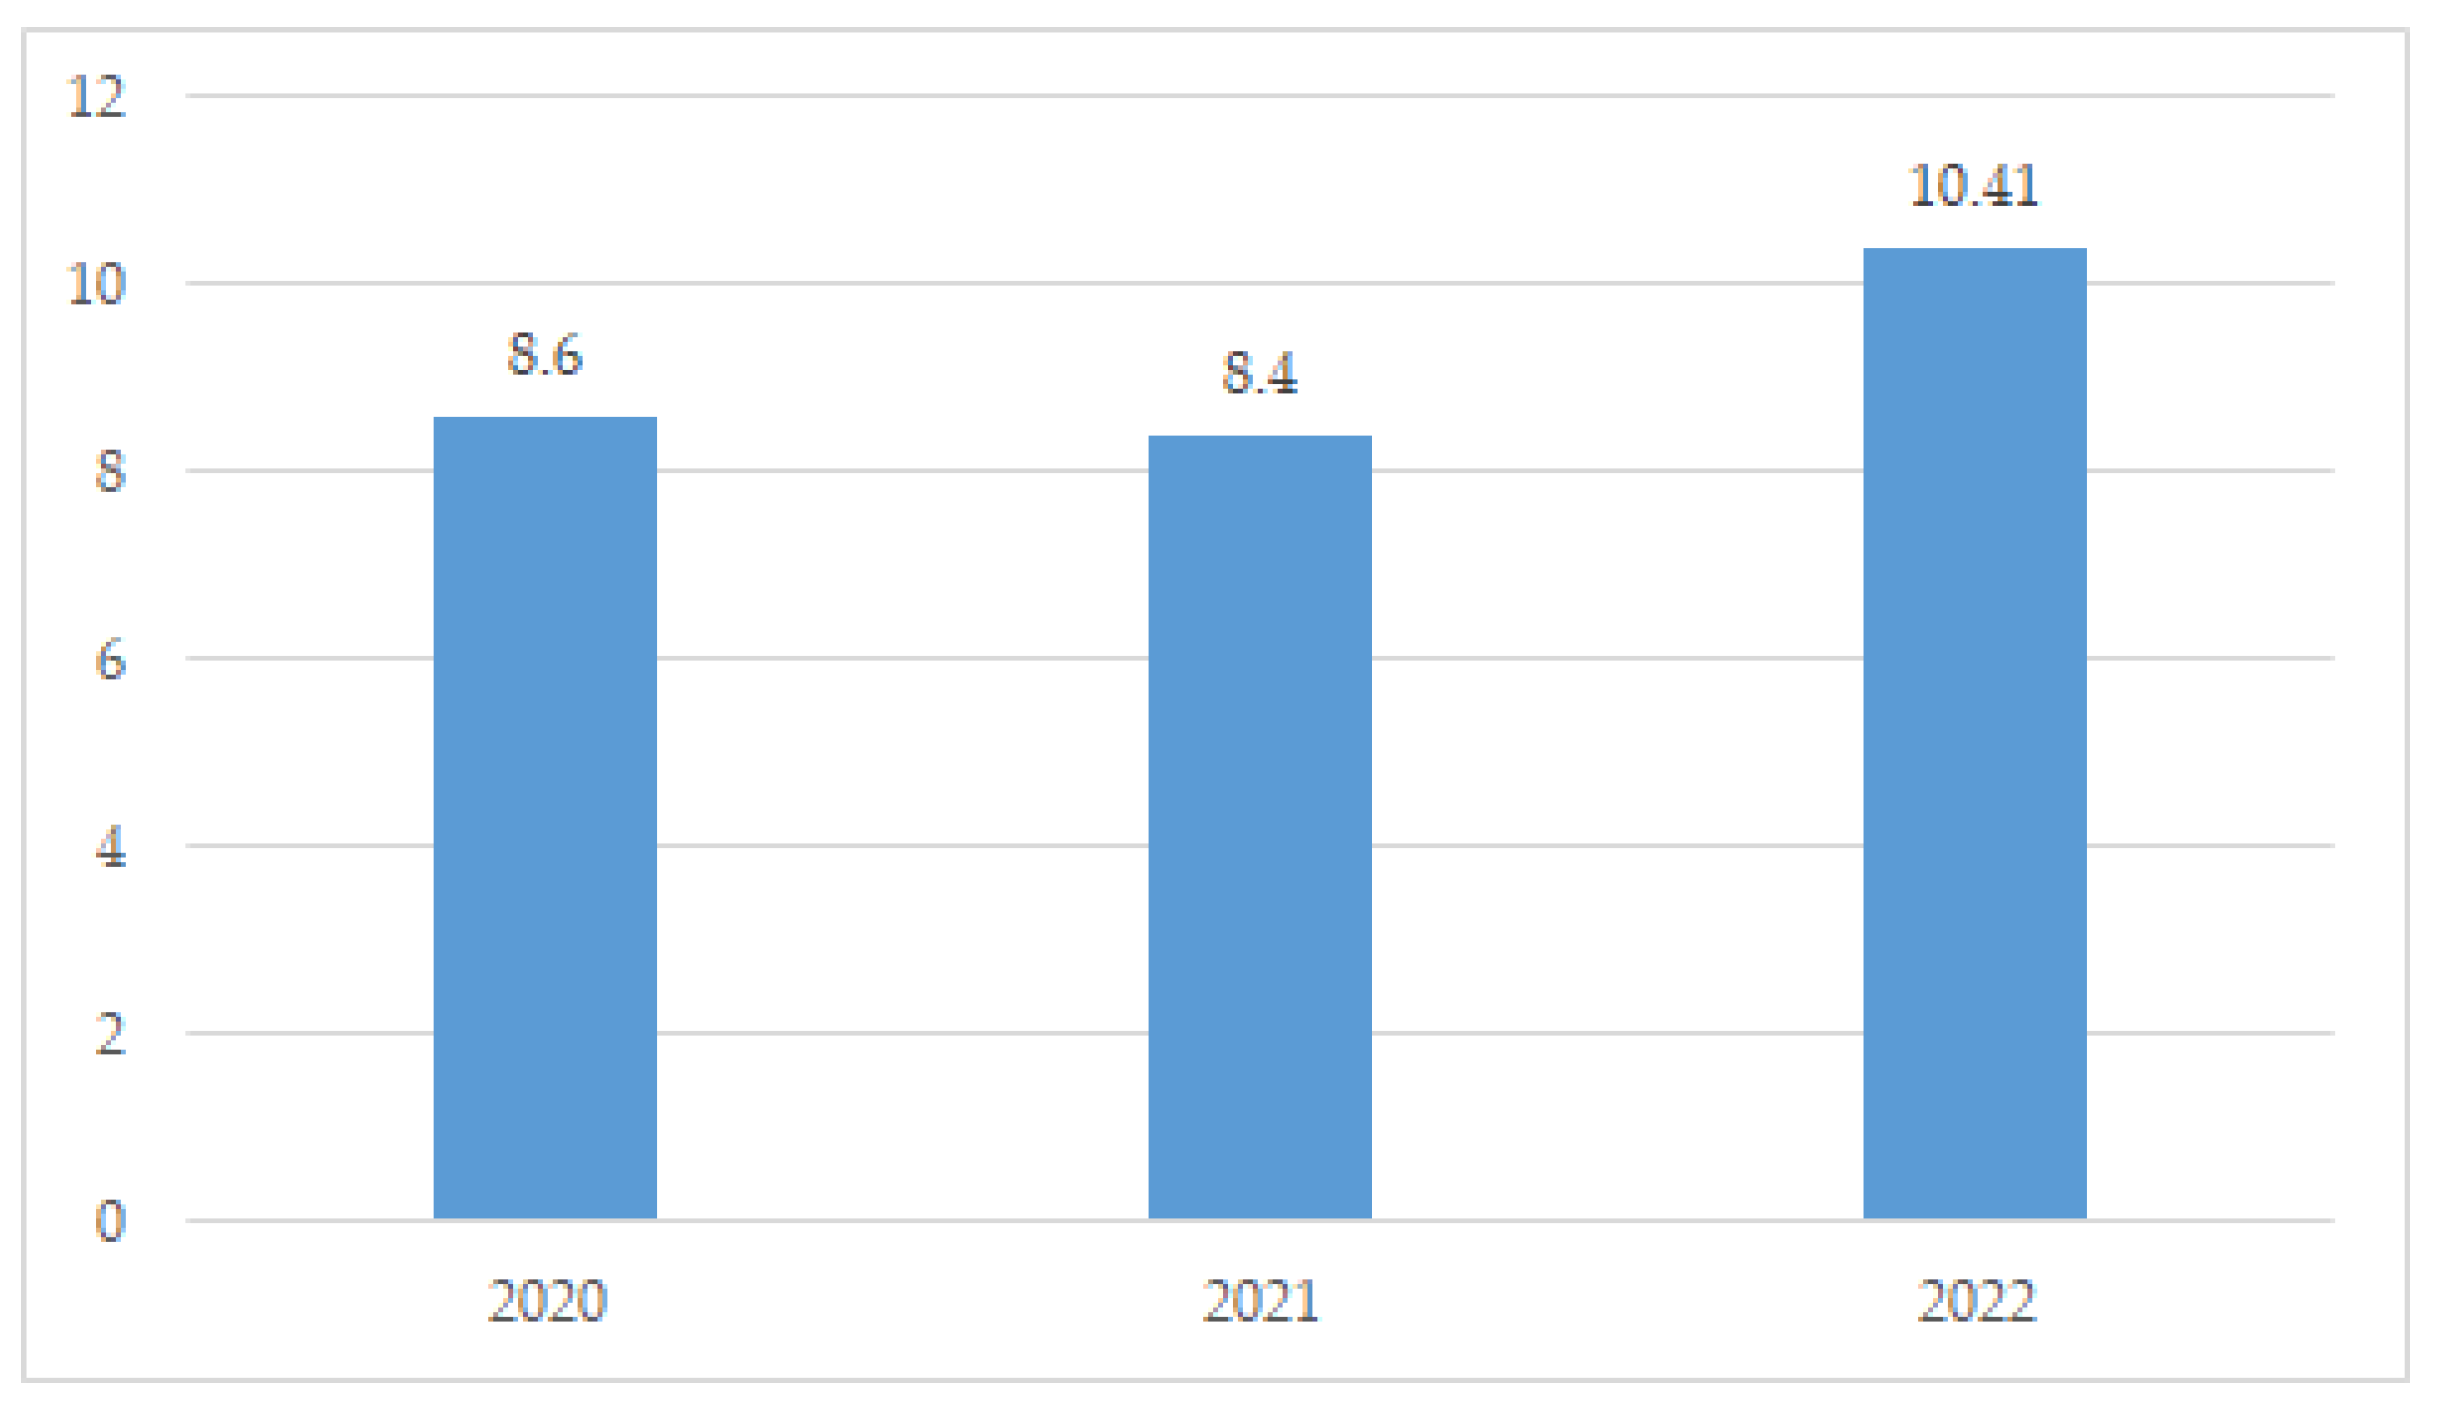
When the global logistics industry grew sharply, the covid-19 pandemic in 2020 directly impacted the worldwide transportation and logistics industry because of travel restrictions, border closures, flight cancellations, and lockdown restrictions. Therefore, the logistics industry faced a unique challenge once the supply chain was disturbed. Figure 5 indicated that the global logistics market 2020 was worth 8.6 trillion USD [50], then it was reduced to 8.4 trillion USD in 2021 [51]. Once the covid-19 pandemic has been controlled since 2022, the logistics industry is being recovered and developed softly, and the global logistics market increased by approximately 10.41 trillion USD [52]. The covid-19 pandemic caused postponement and discontinuity in the global supply chain, which reduced the global logistics market by 0.2 trillion USD in 2021.
In Vietnam while Vietnam was being achieved sustainable economic development, the covid-19 pandemic directly impacted the logistics industry, so the performance of many logistics companies decreased sharply. Based on the super-SBM model, Table 1 revealed the shortcoming performance level of logistics companies as follows: PVT (2.36093); MVN (2.03102); ACV (0.87678); GSP (0.75698); PHP (0.46108); and PVP (0.37193). Since the covid-19 pandemic was controlled in 2022, the performance recovered and increased as follows: PVT (0.39216); MVN (1.58562); ACV (0.87678); GSP (0.06086); PHP (0.06640); PVP (0.02911); and DVP (0.16653). In contrast, two companies, including TMS and STG, reduced the efficiency score to 0.45992 and 0.01163, respectively, in 2022. As a result, the development of logistics enterprises depends on a part of the economic growth. Each logistics company develops strategies to attract customers and increase their business performance.
This study suggested the improvement of logistics enterprises’ performance when establishing and implementing by taking the idea of experts when evaluating the impacted elements through the fuzzy AHP method. The criteria weights were estimated and analyzed to determine their importance in attracting customers to increase business performance. The results in Section 3.2.2 denoted that a Logistics Company must have a reasonable cost and payment term, high quality, modern and enough infrastructure, and build up a reputable brand image. Additionally, the final detailed result showed that they must ensure the products are in the delivery process without damage or loss, be delivered on time, and update the milestones frequently. Each Logistics Company has a private business strategy; however, they establish strategies and plans based on customers’ demand, applying industry 4.0 technologies, such as the Internet of Things; Automated guided vehicles; Autonomous Vehicles; Artificial Intelligence; Big Data, and Data Mining; Blockchain; Cloud Computing and Electronic; Mobile marketplaces; and realistic applications [53], and constructing the modern warehouse system and enough space to handle the shipment. Consequently, logistics companies need suitable policies to create persuasion and customer reliability.

5. Conclusions

The logistics industry is the backbone of economic development because it’s a bridge to connect and deliver products from manufacturer to customer through different transportation modes such as air, ocean, truck, and train. Hence, researchers studied and presented different approaches to logistics to evaluate operational processes, estimate future performance, and suggest recommendations to improve efficiency; however, previous research on logistics exhibited the performance and impact criteria that haven’t combined measuring the efficiency and evaluating the requirements to draw an overall picture of the operational process and it’ influence elements. This study integrated the super-SBM model in the DEA method to estimate the efficiency score and the Fuzzy AHP method to determine weights and identify the importance of each criterion in establishing a strategy for improving efficiency for Logistics Companies in Vietnam.
In the proposed approach, the super-SBM model examined the collected data through the Pearson correlation, then calculated the efficiency score to determine effectiveness and ineffectiveness. The empirical result indicated that MVN, GSP, ACV, DVP, TMS, and STG always attained efficiency in the whole term, although the covid-19 pandemic from 2020 to 2022 impacted and postponed the global supply chain; PVT, PVP, and PHP had a significant influence under the covid-19 pandemic when their efficiency score was reduced sharply and inefficiency. Next, the Fuzzy AHP method analyzed the main and sub-criteria based on the expert’s opinion. The finding revealed that Logistics Companies should have a suitable strategy for establishing and managing their delivery process to improve their quality service, increase customer service, innovate technology, and set up a diversified warehouse.
The empirical results helped Logistics Companies identify their ability, position, and challenges in supply chain management and find a feasible solution to improve their performance in the future. Besides, customers can learn about Logistics Companies’ professional competence to select a suitable service. Readers have a deep knowledge of the logistics industry in Vietnam and understand their operational process in recent years.
Although the study presented the performance and recommended a solution to improve logistics companies' efficiency score in Vietnam, it still has some drawbacks. First, all logistics companies haven't collected; future searches could gather more decision-making units for a larger picture. Second, the input and output variables factors haven't been divarication; future research could take more factors, such as labour force, net interest after tax, etc., to have a large and deep measurement. Third, excluding experts' opinions, further study could implement an investigation for logistics companies to understand their status and difficulties in specific scenarios. This study only analyzed and indicated the current situation; further research could use more models, such as grey forecast, tableau, and ARIMA models, to estimate the future value.

Author Contributions

N.T.K.L designed the research framework, analyzed the data, and wrote the draft paper, T.L.H.N and B.A.H gathered the data, T.L.N analyzed the data, H.H.L created the visualization, T.T.H.T reviewed and edited the paper.

Funding

This research received the support of Thanh Dong University.

Data Availability Statement

Not applicable.

Acknowledgments

We would like to thank the anonymous reviewers for their valuable comments

Conflicts of Interest

The authors declare no conflict of interest.

Appendix A

Table A1. Description data.
Indication Years (I)CA (I)NCA (I)OE (O)NR (O)NPFT
Max 2016 22151 25185 25054 14633 2718
Min 320 73 377 616 33
Average 4403 6814 4921 4354 501
SD 6766 9040 7374 4864 806
Max 2017 26343 22820 27384 13830 4122
Min 458 54 388 627 53
Average 4966 6313 5491 4675 781
SD 7896 8238 8072 5057 1201
Max 2018 31264 22260 30749 16090 6148
Min 410 280 404 639 64
Average 5618 6135 6122 5088 963
SD 9379 7702 9085 5304 1844
Max 2019 37291 20885 36757 18329 8214
Min 367 421 452 560 52
Average 6368 5967 7056 5222 1195
SD 11252 7099 10883 5690 2492
Max 2020 37974 18928 37565 9972 1642
Min 395 359 462 518 60
Average 6702 5432 7235 4031 468
SD 11421 6347 11066 3218 472
Max 2021 37568 17412 37653 13267 3189
Min 542 329 658 609 56
Average 7138 5456 7778 4502 767
SD 11286 5917 11046 3811 897
Max 2022 40221 19817 43806 14350 7127
Min 507 280 737 585 82
Average 7630 5911 9047 5531 1459
SD 12040 6568 12919 5115 2129
Note: SD _ Standard deviation.
Table A2. Pearson correlation.
Variables Years (I)CA (I)NCA (I)OE (O)NR (O)NPAT
(I)CA 2016 1.00000 0.92139 0.98540 0.75533 0.89535
(I)NCA 0.92139 1.00000 0.85088 0.92967 0.66602
(I)OE 0.98540 0.85088 1.00000 0.65281 0.95649
(O)NR 0.75533 0.92967 0.65281 1.00000 0.42586
(O)NPAT 0.89535 0.66602 0.95649 0.42586 1.00000
(I)CA 2017 1.00000 0.87790 0.99728 0.83220 0.98353
(I)NCA 0.87790 1.00000 0.86397 0.98383 0.78969
(I)OE 0.99728 0.86397 1.00000 0.81680 0.98705
(O)NR 0.83220 0.98383 0.81680 1.00000 0.73336
(O)NPAT 0.98353 0.78969 0.98705 0.73336 1.00000
(I)CA 2018 1.00000 0.88469 0.99832 0.87881 0.97220
(I)NCA 0.88469 1.00000 0.89262 0.98206 0.75441
(I)OE 0.99832 0.89262 1.00000 0.88583 0.96822
(O)NR 0.87881 0.98206 0.88583 1.00000 0.75862
(O)NPAT 0.97220 0.75441 0.96822 0.75862 1.00000
(I)CA 2019 1.00000 0.87773 0.99863 0.91968 0.97899
(I)NCA 0.87773 1.00000 0.88684 0.98120 0.77050
(I)OE 0.99863 0.88684 1.00000 0.92947 0.97642
(O)NR 0.91968 0.98120 0.92947 1.00000 0.84384
(O)NPAT 0.97899 0.77050 0.97642 0.84384 1.00000
(I)CA 2020 1.00000 0.89029 0.99843 0.60807 0.88362
(I)NCA 0.89029 1.00000 0.88254 0.88381 0.72344
(I)OE 0.99843 0.88254 1.00000 0.60578 0.90665
(O)NR 0.60807 0.88381 0.60578 1.00000 0.51587
(O)NPAT 0.88362 0.72344 0.90665 0.51587 1.00000
(I)CA 2021 1.00000 0.88665 0.99773 0.29993 0.30724
(I)NCA 0.88665 1.00000 0.88160 0.69276 0.67083
(I)OE 0.99773 0.88160 1.00000 0.29169 0.28232
(O)NR 0.29993 0.69276 0.29169 1.00000 0.90929
(O)NPAT 0.30724 0.67083 0.28232 0.90929 1.00000
(I)CA 2022 1.00000 0.90249 0.99870 0.77528 0.99705
(I)NCA 0.90249 1.00000 0.91209 0.96945 0.92440
(I)OE 0.99870 0.91209 1.00000 0.78834 0.99842
(O)NR 0.77528 0.96945 0.78834 1.00000 0.80503
(O)NPAT 0.99705 0.92440 0.99842 0.80503 1.00000

References

  1. Chung, S. H. Applications of smart technologies in logistics and transport: A review. Transp. Res. E: Logist. Transp. Rev. 2021, 153, 1-17.
  2. Orozonova, A.; Gapurbaeva, S.; Kydykov, A.; Prokopenko, O.; Prause, P.; Lytvynenko, S. Application of smart logistics technologies in the organization of multimodal cargo delivery. Transp. Res. Procedia. 2022, 63, 1192–1198. [Google Scholar] [CrossRef]
  3. Barreto, L.; A. Amaral, Pereira, T. Industry 4.0 implications in logistics: an overview. Procedia Manuf. 2017, 13, 1245-1252.
  4. Holubčík, M.; Koman, G.; Soviar, J. Industry 4.0 in Logistics Operations. Transp. Res. Procedia 2021, 53, 282–288. [Google Scholar] [CrossRef]
  5. Mariusz, K.; Ludmiła, F. D.; Szymon, W. Modern technologies development in logistics centers: the case study of Poland. Transp. Res. Procedia. 2021, 55, pp. 268-275.
  6. Šourek, D. Software Support of City Logistics´ Processes. Transp. Res. Procedia. 2021, 55, 172–179. [Google Scholar] [CrossRef]
  7. Voronova, O. Improvement of warehouse logistics based on the introduction of lean manufacturing principles. Transp. Res. Procedia. 2022, 63, 919–928. [Google Scholar] [CrossRef]
  8. Nechaev, A.; Barykina, Y.; Tyapkina, M. Development of methodological approaches to improve the transport and logistics system using the international leasing. Transp. Res. Procedia. 2022, 63, 441–448. [Google Scholar] [CrossRef]
  9. Statistics. Size of the logistics industry worldwide 2018-2027. Available online: https://www.statista.com/statistics/943517/logistics-industry-global-cagr/. Accessed on 1st May 2023.
  10. The state president. Commercial law. No. 36/2005/QH11. 2005.
  11. Statistics. GDP contribution of the transportation and storage sector in Vietnam from 2015 to 2021. Available online: https://www.statista.com/statistics/1047729/vietnam-gdp-contribution-of-transportation-and-storage-sector/. Accessed on 1st May 2023.
  12. Nataraj, S.; Alvarez, C.; Sada, L.; Juan, A.A.; Panadero, J.; Bayliss, C. Applying Statistical Learning Methods for Forecasting Prices and Enhancing the Probability of Success in Logistics Tenders. Transp. Res. Procedia. 2020, 47, 529–536. [Google Scholar] [CrossRef]
  13. De Souza, E.D.; Kerber, J.C.; Bouzon, M.; Rodriguez, C. M.T. Performance evaluation of green logistics: Paving the way towards circular economy. Clean. Logist. Supply Chain. 2022, 3, 100019. [Google Scholar] [CrossRef]
  14. Tikwayo, L. N.; Mathaba, T. N. D. Applications of Industry 4.0 Technologies in Warehouse Management: A Systematic Literature Review. Logistics 2023, 7, 24.
  15. Zaare Tajabadi, F.; Daneshvar, S. Benchmark Approach for Efficiency Improvement in Green Supply Chain Management with DEA Models. Sustainability 2023, 15, 4433. [Google Scholar] [CrossRef]
  16. Le Viet, H.; Dang Quoc, H. The Factors Affecting Digital Transformation in Vietnam Logistics Enterprises. Electronics 2023, 12, 1825. [Google Scholar] [CrossRef]
  17. Wang, C.-N.; Day, J.-D.; Lien, N.T.K.; Chien, L.Q. Integrating the Additive Seasonal Model and Super-SBM Model to Compute the Efficiency of Port Logistics Companies in Vietnam. Sustainability 2018, 10, 2782. [Google Scholar] [CrossRef]
  18. Marto, M.; Lourenço Marques, J.; Madaleno, M. An Evaluation of the Efficiency of Tertiary Education in the Explanation of the Performance of GDP per Capita Applying Data Envelopment Analysis (DEA). Sustainability 2022, 14, 15524. [Google Scholar] [CrossRef]
  19. Goyal, M.; Lu, J.; Zhang, G. Decision Making in Multi-Issue e-Market Auction Using Fuzzy Techniques and Negotiable Attitudes. J. Theor. Appl. Electron. Commer. Res. 2008, 3, 97–110. [Google Scholar] [CrossRef]
  20. Dogan, O. A Recommendation System in E-Commerce with Profit-Support Fuzzy Association Rule Mining (P-FARM). J. Theor. Appl. Electron. Commer. Res. 2023, 18, 831–847. [Google Scholar] [CrossRef]
  21. Chen, Y. , Du, J., Hoa, J. Super-efficiency based on a modified directional distance function. Omega 2013, 41, 621–625. [Google Scholar] [CrossRef]
  22. Zhou, C.S.; Shi, C.Y.; Wang, S.J.; Zhang, G.J. Estimation of eco-efficiency and its influencing factors in Guangdong province based on Super-SBM and panel regression models. Ecological Indicators. 2018, 86, 67–80. [Google Scholar] [CrossRef]
  23. Wang, C. N.; Hsu, H. P.; Wang, J. W.; Kao, Y. C.; Nguyen, T. P. Strategic Alliance for Vietnam Domestic Real Estate Companies Using a Hybrid Approach Combining GM (1,1) with Super SBM DEA. Sustainability 2020, 12, 1891. [Google Scholar] [CrossRef]
  24. Huang, Y. S.; Liu, S. J. Efficiency evaluation of a sustainable hydrogen production scheme based on super efficiency SBM model. J. Clean. Prod. 2020, 256. [Google Scholar] [CrossRef]
  25. Du, Y. W.; Jiang, J.; Li, C. H. Ecological efficiency evaluation of marine ranching based on the Super-SBM model: A case study of Shandong. J. Clean. Prod. 2021, 131. [Google Scholar] [CrossRef]
  26. Ma, F. N.; Li, J. Y.; Ma, H. W.; Sun, Y. Evaluation of the Regional Financial Efficiency Based on SBM-Shannon Entropy model. Procedia Comput. Sci. 2022, 199, 954–961. [Google Scholar] [CrossRef]
  27. Emrouznejad, A.; Marra, M. The state of the art development of AHP (1979–2017): a literature review with a social network analysis. Int. J. Prod. Res. 2017, 55, 6653–6675. [Google Scholar] [CrossRef]
  28. Liu, Y.; Claudia, M. E.; Earl, C. A review of fuzzy AHP methods for decision-making with subjective judgements. Expert Syst. Appl. 2020, 161, 113738. [Google Scholar] [CrossRef]
  29. Rezaie, K.; Ramiyani, S.S.; Nazari-Shirkouhi, S.; Badizadeh, A. Evaluating performance of Iranian cement firms using an integrated fuzzy AHP–VIKOR method. Appl. Math. Model. 2014, 38, 5033–5046. [Google Scholar] [CrossRef]
  30. Ali, N.; Mohammad, H.K.; Majid, G. Application of fuzzy AHP method to IOCG prospectivity mapping: A case study in Taherabad prospecting area, eastern Iran. Int J Appl Earth Obs Geoinf. 2014, 33, 142–154. [Google Scholar]
  31. Choosakun, A.; Yeom, C. Developing Evaluation Framework for Intelligent Transport System on Public Transportation in Bangkok Metropolitan Regions Using Fuzzy AHP. Infrastructures 2021, 6, 182. [Google Scholar] [CrossRef]
  32. Wang, G.; Liu, L.; Shi, P.; Zhang, G.; Liu, J. Flood Risk Assessment of Metro System Using Improved Trapezoidal Fuzzy AHP: A Case Study of Guangzhou. Remote Sens. 2021, 13, 5154. [Google Scholar] [CrossRef]
  33. Şahin, Y.; Kulakli, A. Evaluation of Open and Distance Education Websites: A Hybrid Multi-Criteria Decision-Making Approach. Systems 2023, 11, 58. [Google Scholar] [CrossRef]
  34. Cooper; J. O.; T. E. Heron, T. E.; Heward, W. L. Applied BehaviorAnalysis, Pearson, New York, 2007.
  35. Charnes, A.; Cooper, W. W.; Rhodes, E. Measuring the Efficiency of Decision Making Units. Eur. J. Oper. Res. 1978, 2, 429–444. [Google Scholar] [CrossRef]
  36. Tone. K. A slacks-based measure of efficiency in data envelopment analysis. Eur. J. Oper. Res. 2001, 130, 498–509. [Google Scholar] [CrossRef]
  37. Andersen, P.; Niels, C. P. A Procedure for Ranking Efficient Units in Data Envelopment Analysis. Manag. Sci. 1993, 39, 1261–1264. [Google Scholar] [CrossRef]
  38. Tone. K. A slacks-based measure of super-efficiency in data envelopment analysis. Eur. J. Oper. Res. 2002, 243, 32–41. [Google Scholar]
  39. Saaty T. L. Decision-making with the AHP: why is the principal eigenvector necessary. Eur. J. Oper. Res. 2003, 145 85–91.
  40. Cheng, C. H. Group opinion aggregation based on a grading process: a method for constructing triangular fuzzy numbers. Comput. Math. with Appl. 2004, 48, 1619–1632. [Google Scholar] [CrossRef]
  41. Ballı, S.; Korukoğlu, S. Operating System Selection Using Fuzzy AHP and TOPSIS Methods. Math. Comput. Appl. 2009, 14, 119–130. [Google Scholar] [CrossRef]
  42. Ryjov, A. Fuzzy Linguistic Scales: Definition, Properties and Applications. In: Reznik, L., Kreinovich, V. (eds) Soft Computing in Measurement and Information Acquisition. Stud. Fuzziness Soft Comput. 2003, 127.
  43. Ryjov, A. The Degree of Fuzziness of Fuzzy Descriptions. Mathematical Cybernetics and its Application to Biology. 1987, 60–77. [Google Scholar]
  44. Ryjov, A. The Axiomatic Definition of a Linguistic Scale Fuzziness Degree, its Major Properties and Applications. NASA. Johnson Space Center, North American Fuzzy Logic Proceeding Society (NAFIPS'92). 1992, 21–29.
  45. Deliktas, D.; Ustun; O. Multiple criteria decision-making approach for industrial engineer selection using fuzzy AHP-Fuzzy TOPSIS. Anadolu Univ. J. of Sci. and Technology A – Appl. Sci. and Eng. 2018, 19.
  46. Dwi, P.; Mochammad, S. Fuzzy Analytical Hierarchy Process Method to Determine the Quality of Gemstones. Adv. Fuzzy Syst. 2018, Article ID 9094380, 1–6. [Google Scholar]
  47. Vietstock. Available online: https://finance.vietstock.vn/. Accessed on 19.01.2023.
  48. López, F. J.; Ho, J. C.; Ruiz-Torres, A. J. A computational analysis of the impact of correlation and data translation on DEA efficiency score. J. Ind. Prod. Eng. 2016, 33, 192–204. [Google Scholar] [CrossRef]
  49. Kirch, W. Pearson’s Correlation Coefficient. Encyclopedia of Public Health. Springer, Dordrecht, 2008; 1090–1091.
  50. Martin, P. Global logistics market size by region 2020. Available online: https://www.statista.com/statistics/1069868/total-global-logistics-market-size-region/. Accessed on June 03 2023.
  51. Martin, P. Logistics industry worldwide - statistics & facts. Available online: https://www.statista.com/topics/5691/logistics-industry-worldwide/#topicOverview. Accessed on June 03 2023.
  52. Statistics Research Department. Size of the logistics industry worldwide 2018-2028. Available online: https://www.statista.com/statistics/943517/logistics-industry-global-cagr/. Accessed on June 03 2023.
  53. Mladen, K.; Giulio, P. A.; Pier, P. M.; Snežana, T. Evaluation of the smart reverse logistics development scenarios using a novel MCDM model. Clean. Environ. Syst. 2022, 7, 100099. [Google Scholar]
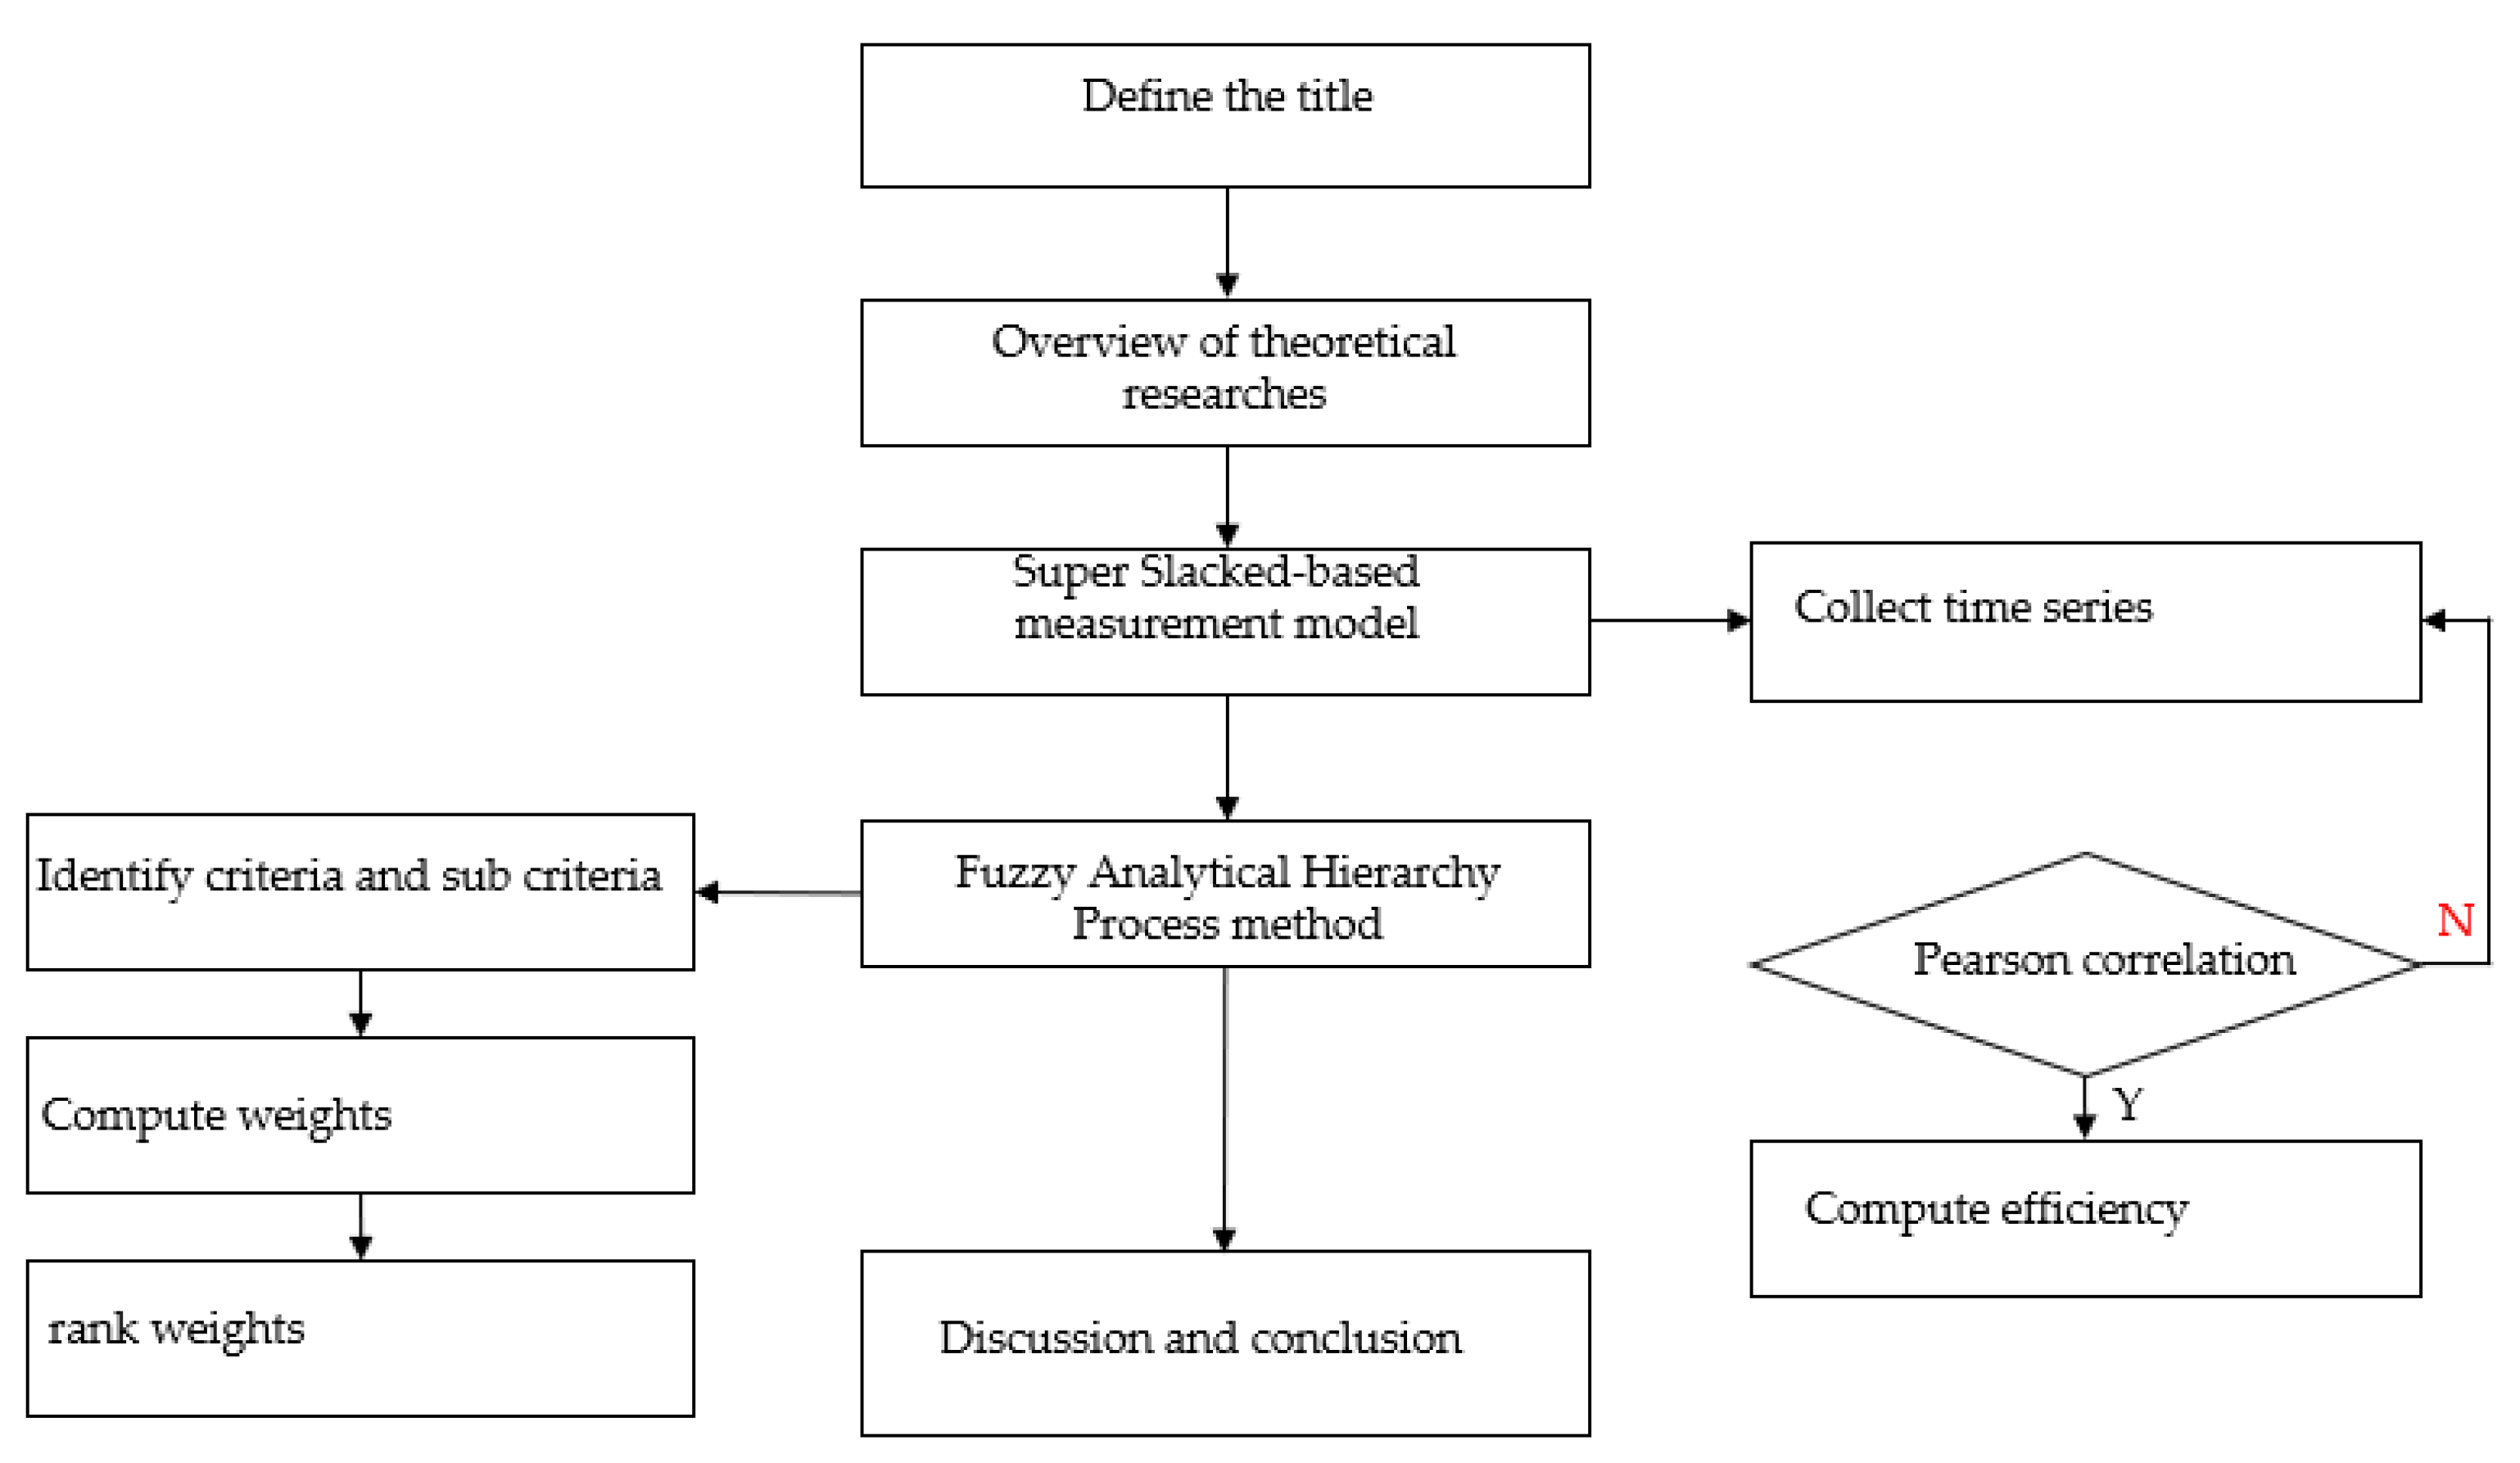
Figure 1. Research flowchart.
Preprints 79139 g001
Figure 2. Triangular fuzzy number.
Preprints 79139 g002
Figure 3. Data flowchart.
Preprints 79139 g003
Figure 4. Improvement Structure of Logistics Company’s Efficiency.
Preprints 79139 g004
Figure 5. Global logistics market.
Preprints 79139 g005
Table 1. Linguistic scale.
Fuzzy number Linguistic scale Scale of fuzzy number Positive reciprocal fuzzy scale
1 ˜ Equally importance (1,1,1) (1,1,1)
2 ˜ Intermediate values between 1 ˜ and 3 ˜ (1,2,3) (1,1/2,1/3)
3 ˜ Moderate importance (2,3,4) (1/2,1/3,1/4)
4 ˜ Intermediate values between 3 ˜ and 5 ˜ (3,4,5) (1/3,1/4,1/5)
5 ˜ Essential importance (4,5,6) (1/4,1/5,1/6)
6 ˜ Intermediate values between 5 ˜ and 7 ˜ (5,6,7) (1/5,1/6,1/7)
7 ˜ Very vital importance (6,7,8) (1/6,1/7,1/8)
8 ˜ Intermediate values between 7 ˜ and 9 ˜ (7,8,9) (1/7,1/8,1/9)
9 ˜ Extreme vital importance (9,9,9) (1/9,1/9,1/9)
Table 2. Business efficiency scores from 2016 to 2022 of logistics companies in Vietnam.
DMUs 2016 2017 2018 2019 2020 2021 2022
PVT 1.47896 1.21982 1.55269 1.62353 3.07727 0.71634 1.10850
MVN 2.53397 2.53341 2.16434 2.14556 3.03102 1.00000 2.58562
PVP 0.28561 0.30384 0.54837 0.71986 1.09951 0.72758 0.75669
GSP 5.62939 8.09925 3.39223 2.59714 2.65493 1.89795 1.95881
ACV 1.00000 1.00000 1.00000 1.00000 1.00000 0.12322 1.00000
PHP 1.37765 0.57517 0.68637 0.63470 1.21104 0.74996 0.81636
DVP 2.32096 1.29849 1.99321 1.67440 2.09580 2.35935 2.52588
TMS 1.67996 1.16393 1.23256 1.09705 1.15367 1.72052 1.26460
STG 0.50510 1.66195 0.58248 0.66432 0.66694 1.10816 1.09653
Table 3. Business efficiency scores from 2016 to 2022 of logistics companies in Vietnam.
Main criteria Sub criteria Description
M1 – Cost and payment term S11 – Pointing out the special targets for assessing the price The cost of each transportation type and the suitable payment term should be figured out the detailed information.
S12 – Implementing cost-saving measures
S13 – Providing a suitable cost
S14 – Implementing flexible payment methods.
M2 – Quality S21 – Ensuring that the product is highly safe. The goods in transit time aren’t damaged and they are delivered timely. Additionally, the logistics company should follow up closely and inform the status of shipments to customer frequently.
S22 – Delivering the products on time.
S23 – Updating customer the status of products frequently.
S24 – Establishing a professional customer service team in supporting customers.
M3 – Infrastructure S31 – Investing vehicles and equipment to improve efficiency and reduce maintenance cost.
S32 – Building a diversified warehouse system that is capable of storing goods in terms of quantity and quality.
S33 – Investing GPS trucking and digital dispatch system.
S34 – Upgrading a modern software system.
M4 – Brand image S41 – Building good relationships with partners and stakeholders.
S42 – Establishing the strategic of image promotion.
S43 – Updating the useful post to share experiences and knowledge on Website.
S44 – Training the skills for the employee to improve professional knowledge.
Table 4. The weights of criteria.
Main criteria. Weights Sub Criteria Weights Integrated weight Rank
M1 0.25905 S11 0.29363 0.07022 6
S12 0.24089 0.05761 8
S13 0.41784 0.09993 4
S14 0.04764 0.01139 16
M2 0.57556 S21 0.41792 0.14414 1
S22 0.33007 0.07894 5
S23 0.09161 0.02460 12
S24 0.16040 0.04056 11
M3 0.05868 S31 0.30444 0.06789 7
S32 0.44953 0.10751 3
S33 0.07213 0.01645 15
S34 0.17390 0.04159 10
M4 0.10671 S41 0.57983 0.13867 2
S42 0.15936 0.03811 12
S43 0.07718 0.01846 14
S44 0.18363 0.04392 9
Disclaimer/Publisher’s Note: The statements, opinions and data contained in all publications are solely those of the individual author(s) and contributor(s) and not of MDPI and/or the editor(s). MDPI and/or the editor(s) disclaim responsibility for any injury to people or property resulting from any ideas, methods, instructions or products referred to in the content.
Copyright: This open access article is published under a Creative Commons CC BY 4.0 license, which permit the free download, distribution, and reuse, provided that the author and preprint are cited in any reuse.
Prerpints.org logo

Preprints.org is a free preprint server supported by MDPI in Basel, Switzerland.

Subscribe

© 2024 MDPI (Basel, Switzerland) unless otherwise stated