Submitted:
10 July 2023
Posted:
12 July 2023
You are already at the latest version
Abstract
Keywords:
1. Introduction
2. Materials and Methods
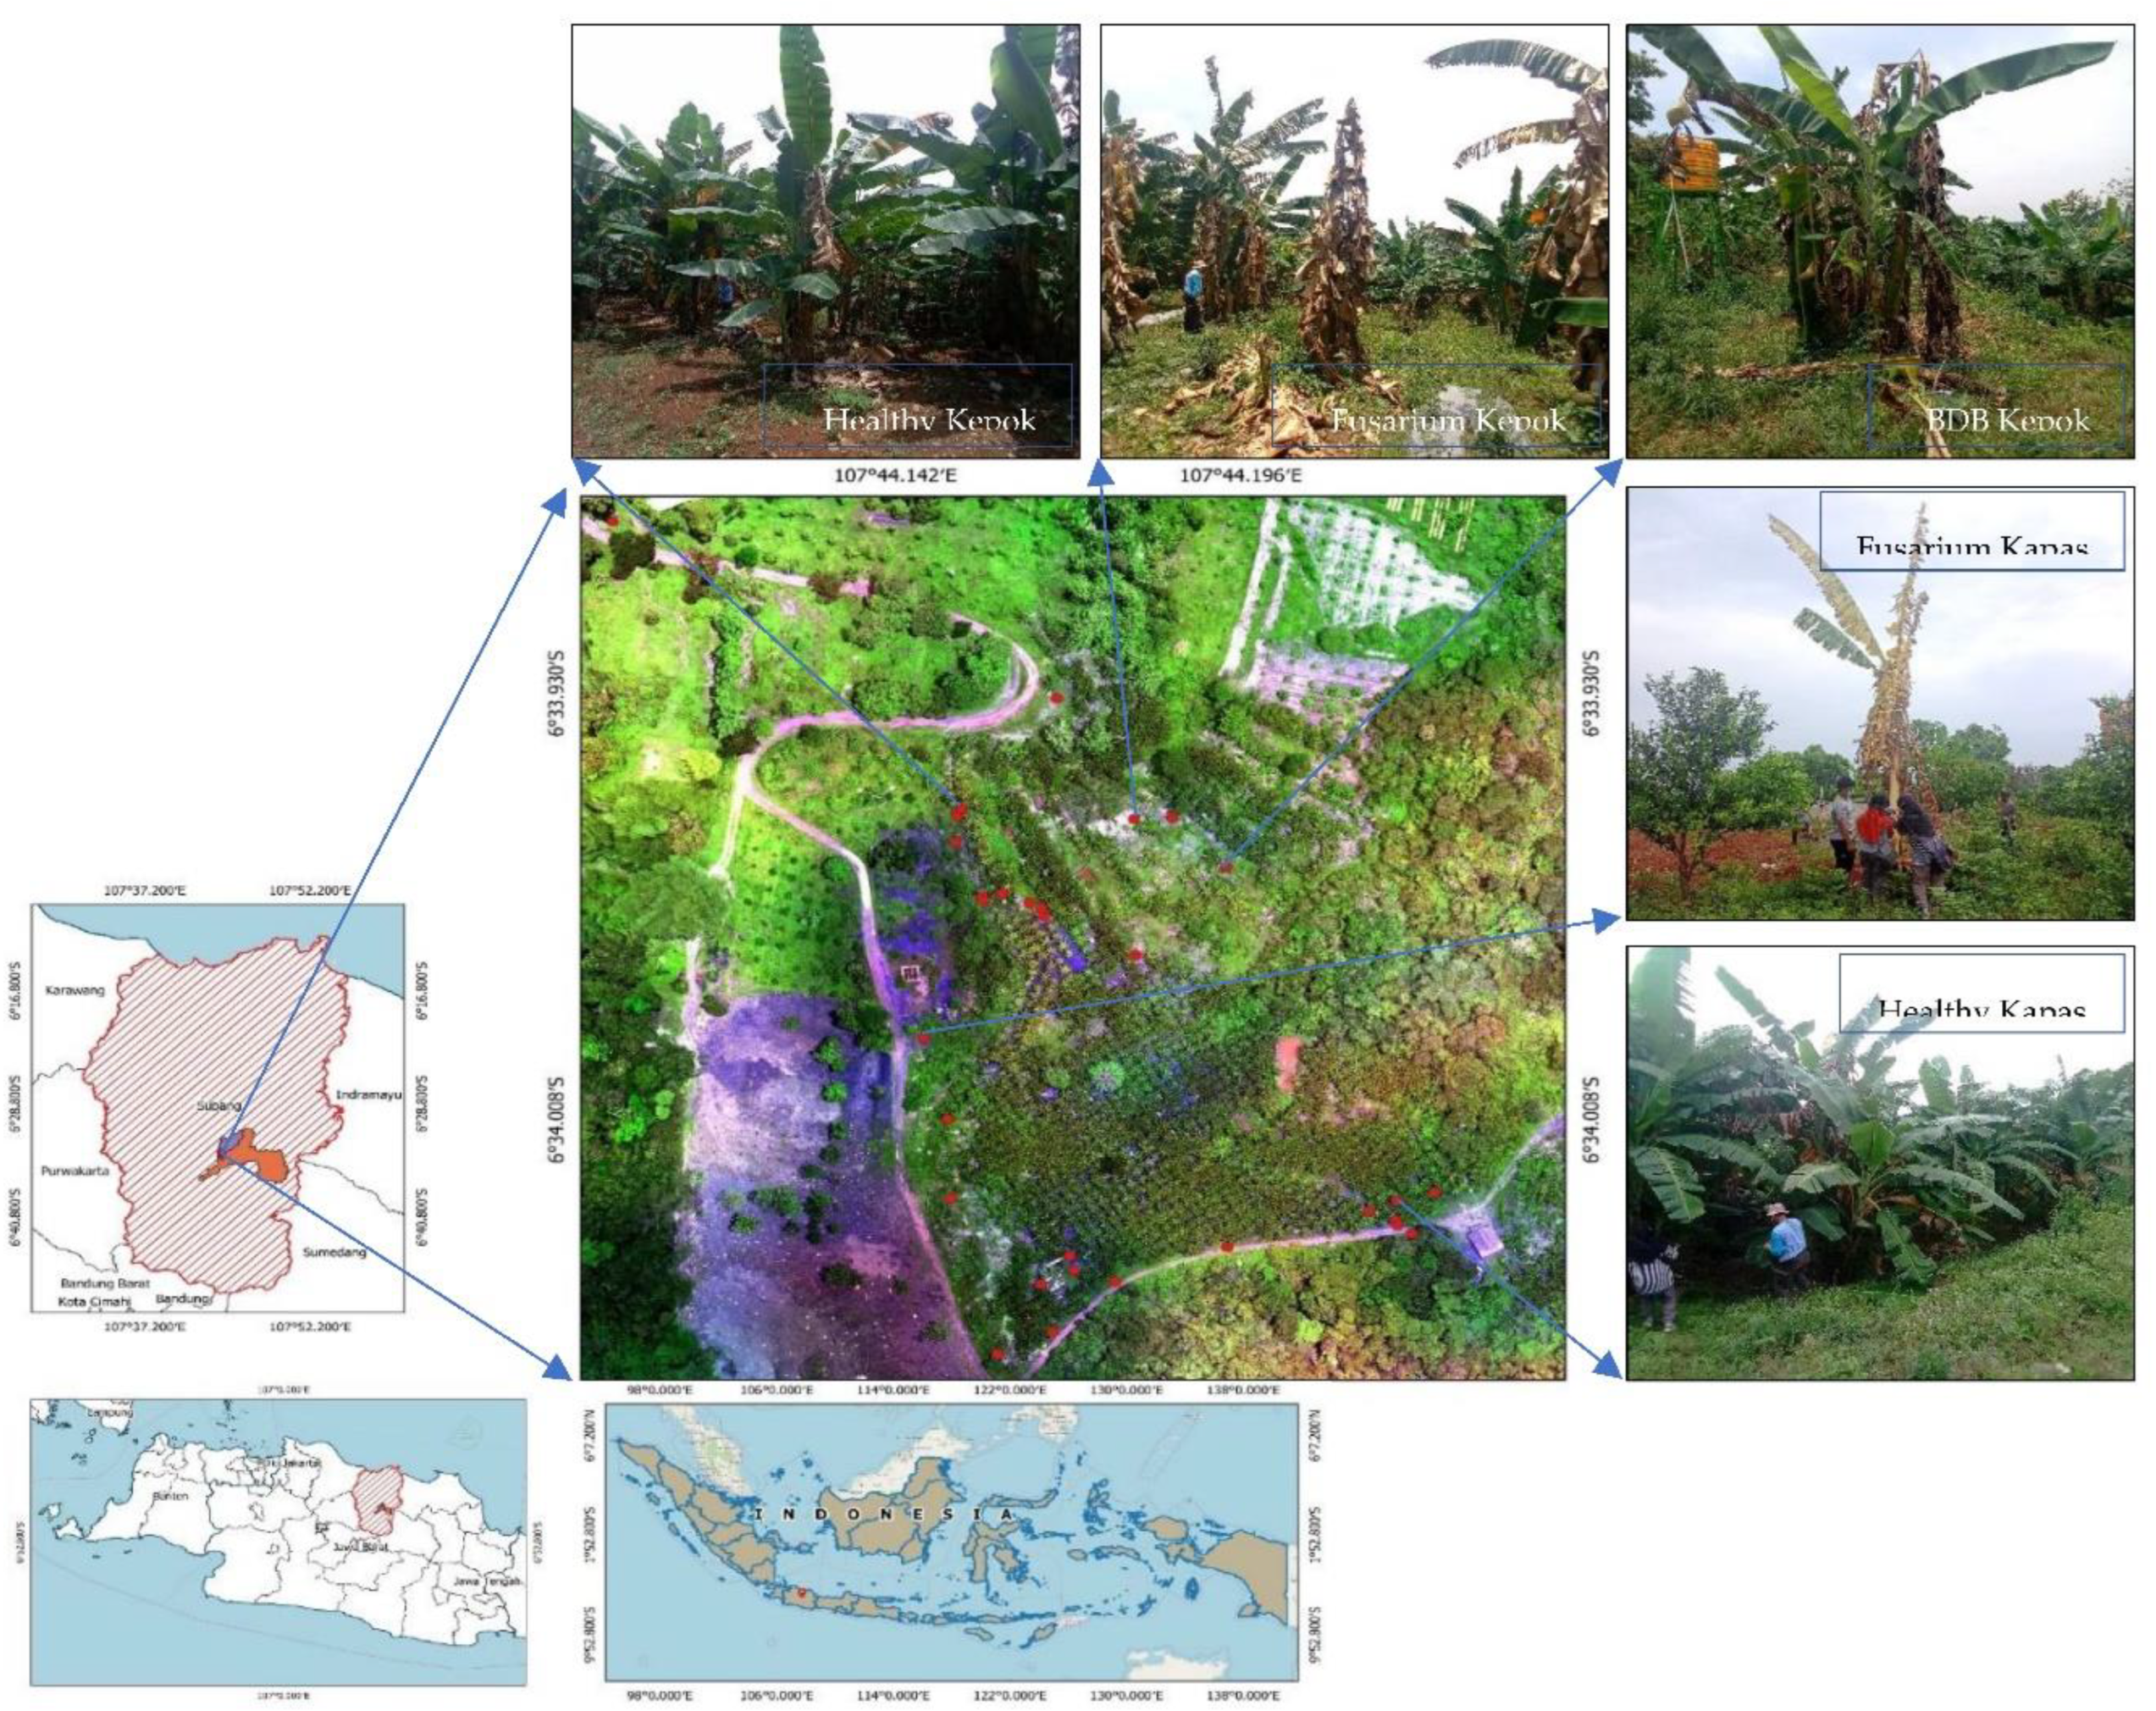
2.1. Study Location
2.2. Data
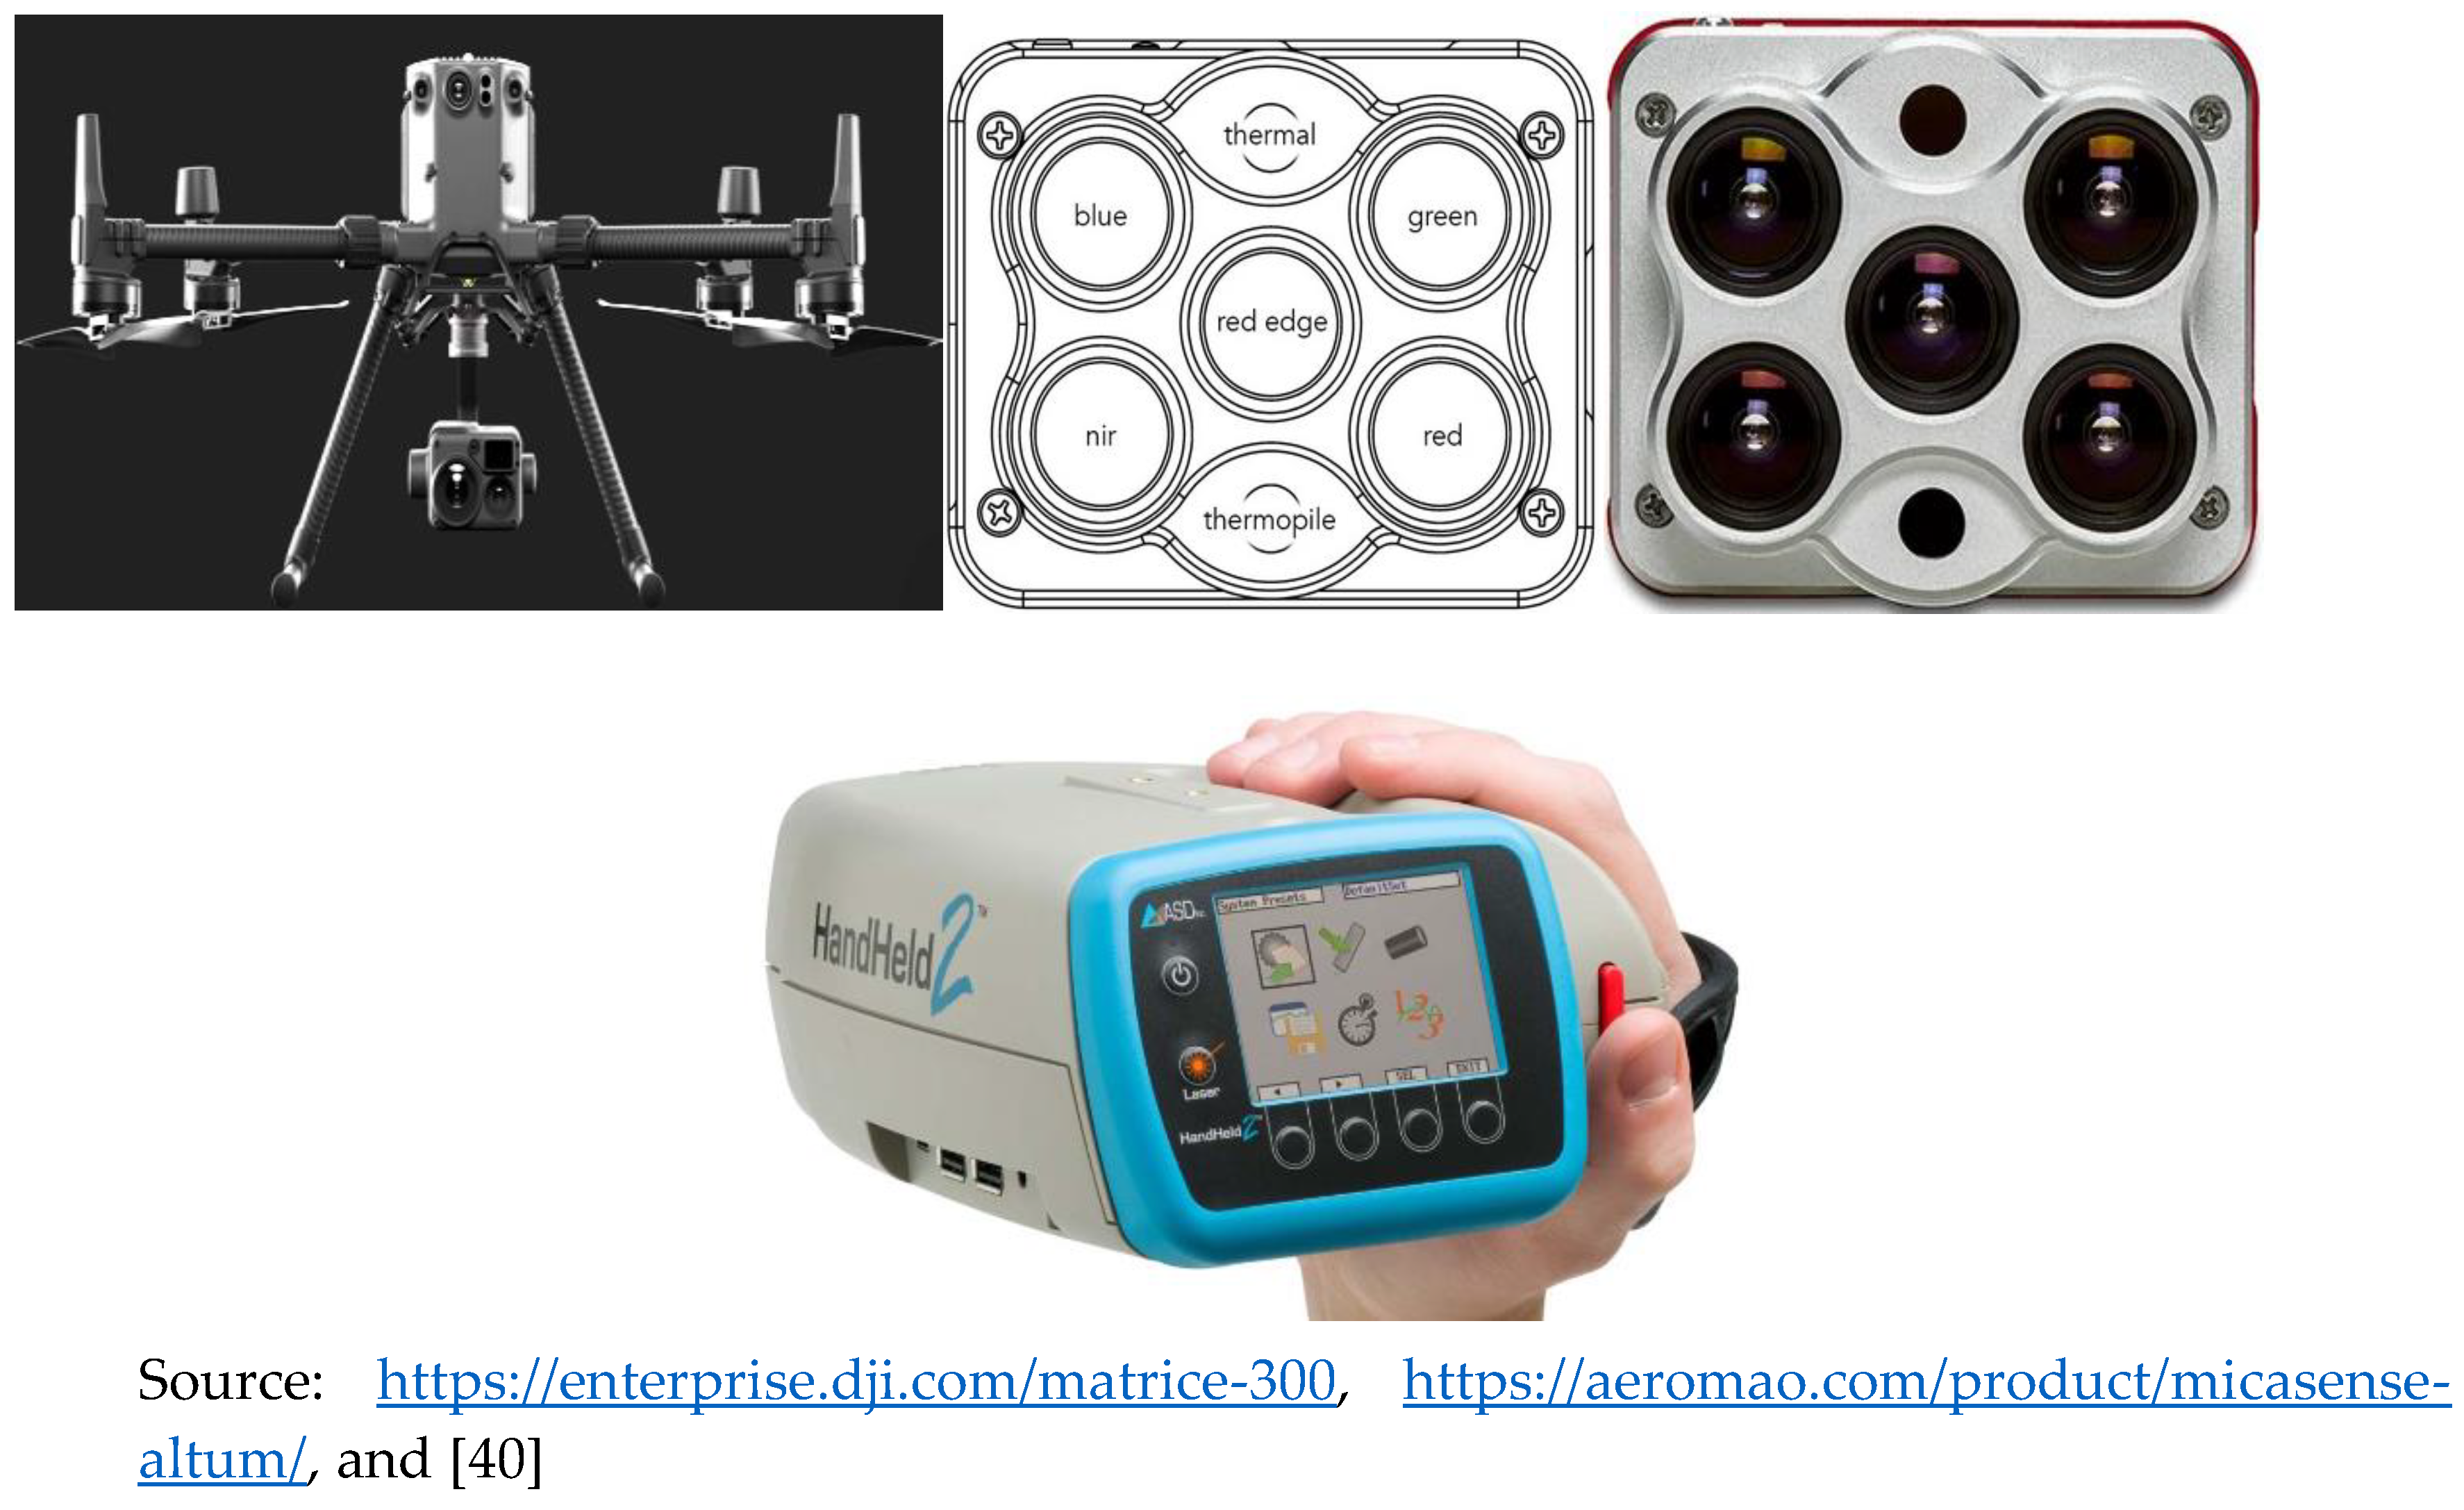
2.2.1. Multispectral Aerial Photo Taken via a UAV
2.2.2. Banana Leaves’ Spectral Reflectance
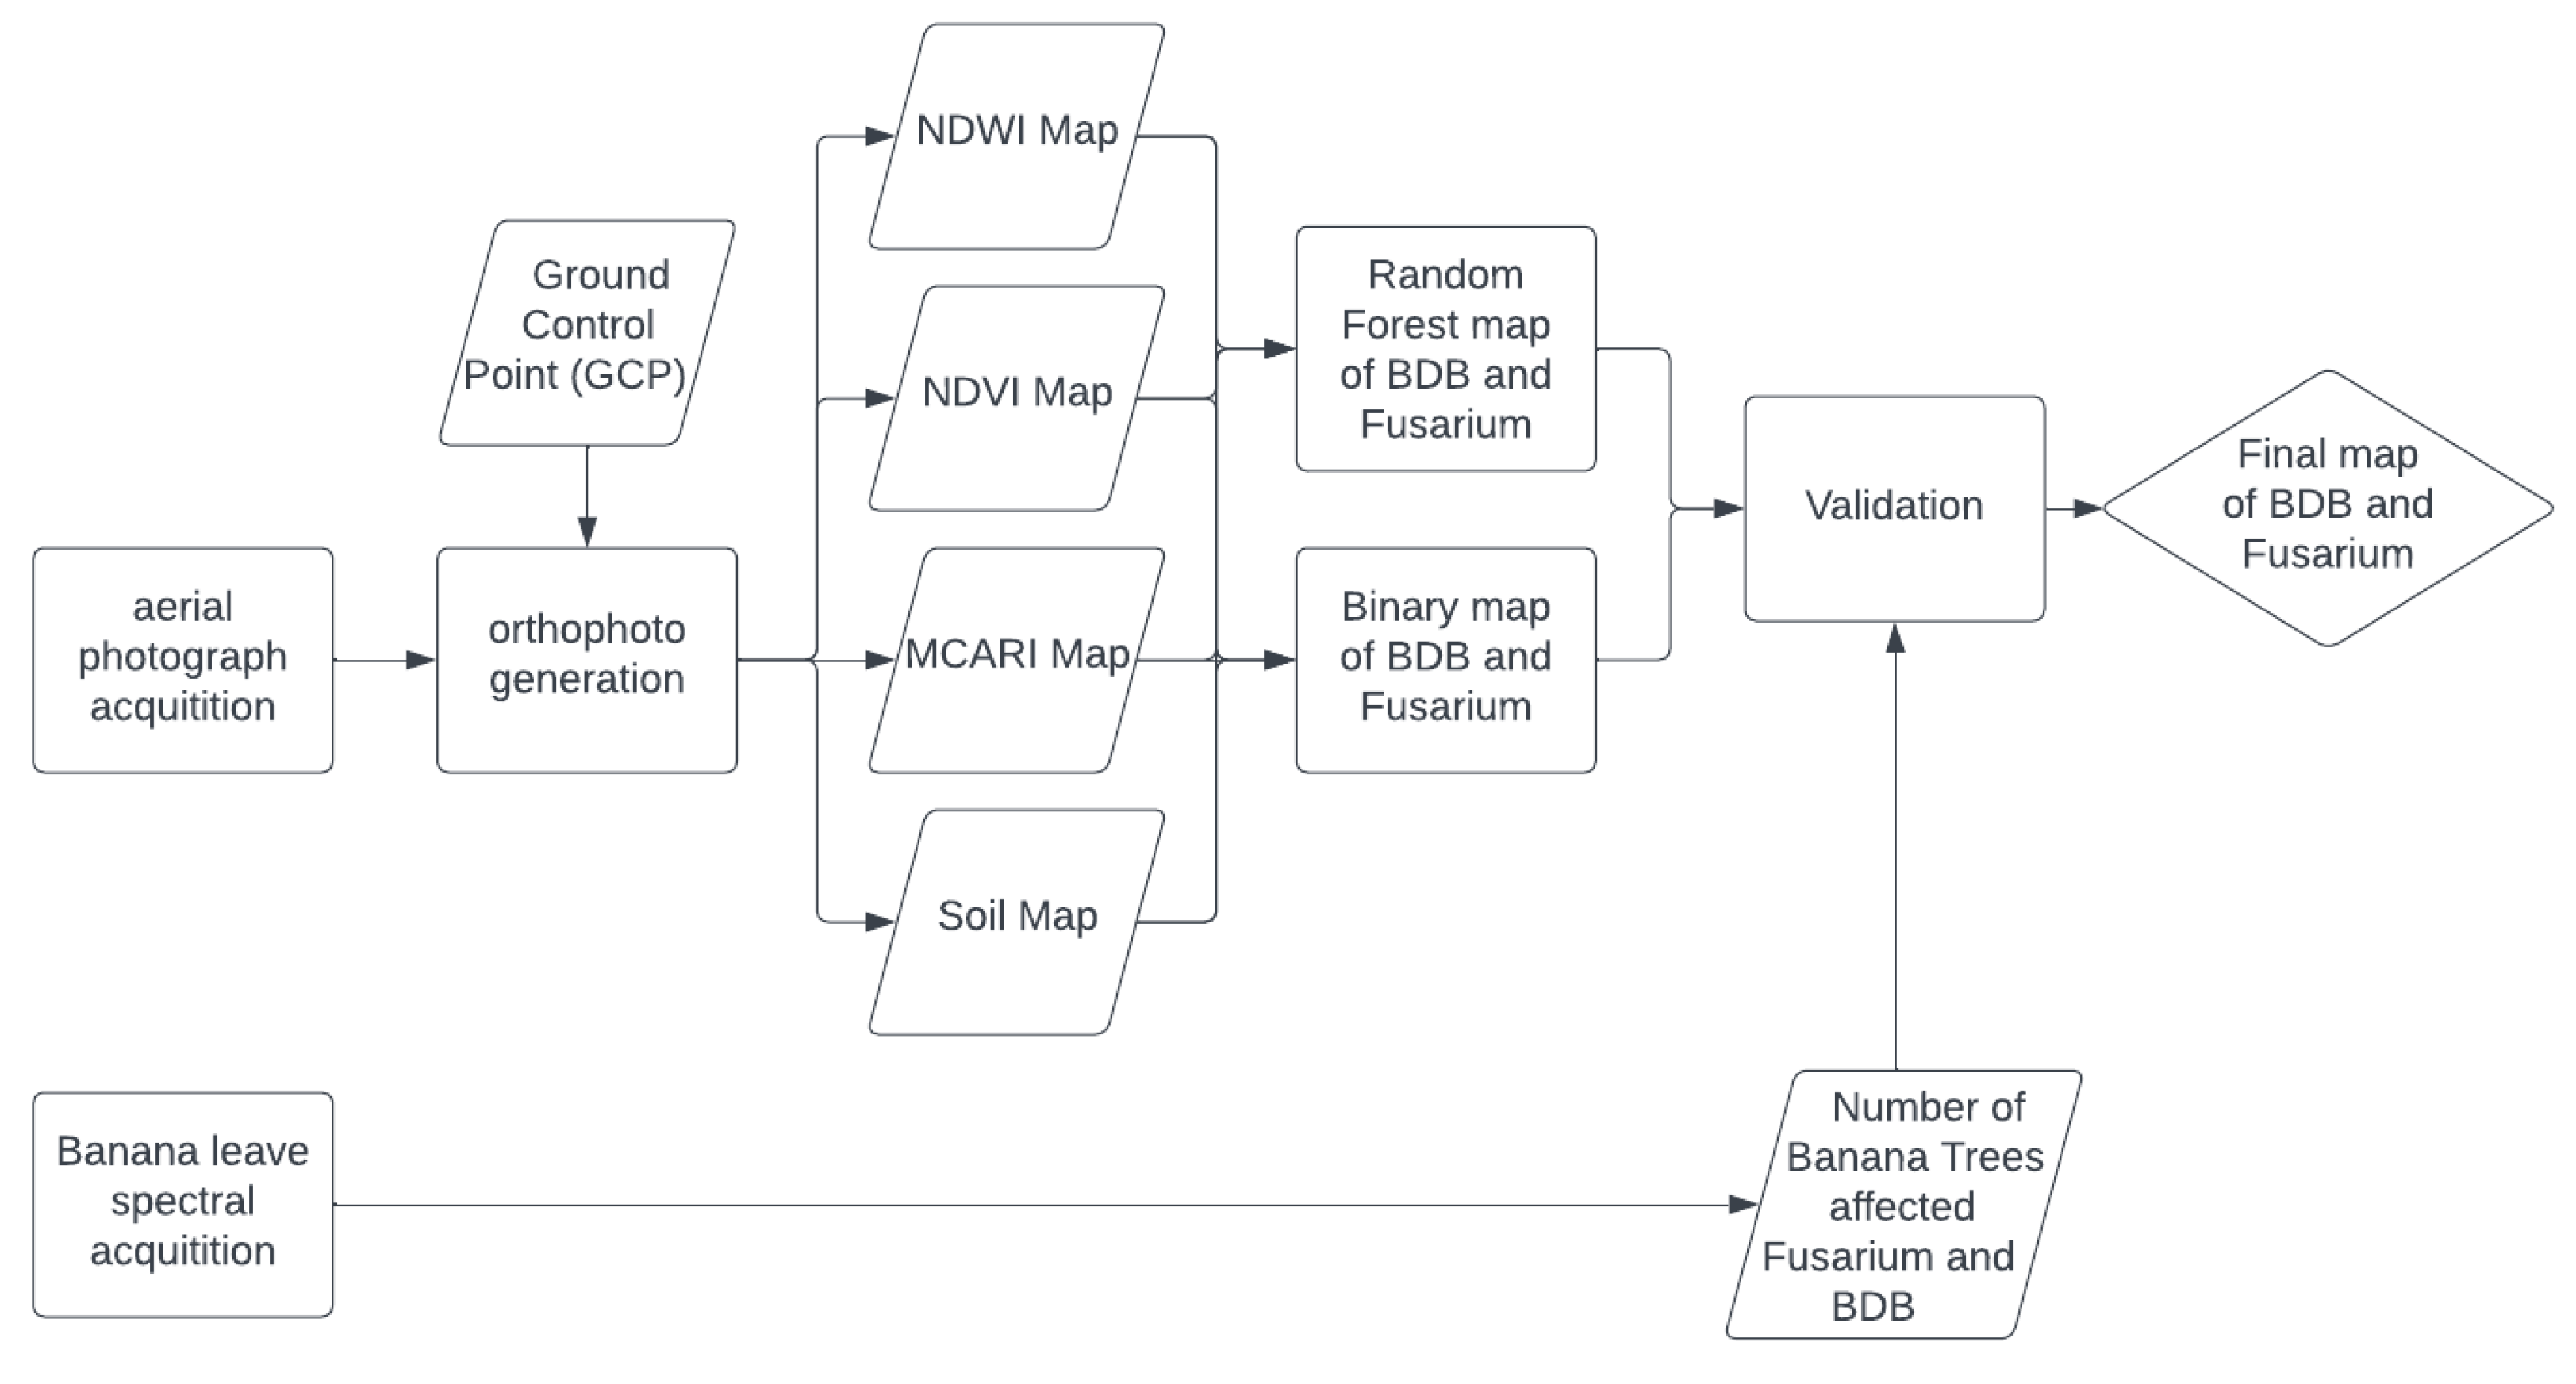
2.3. Methods
3. Results
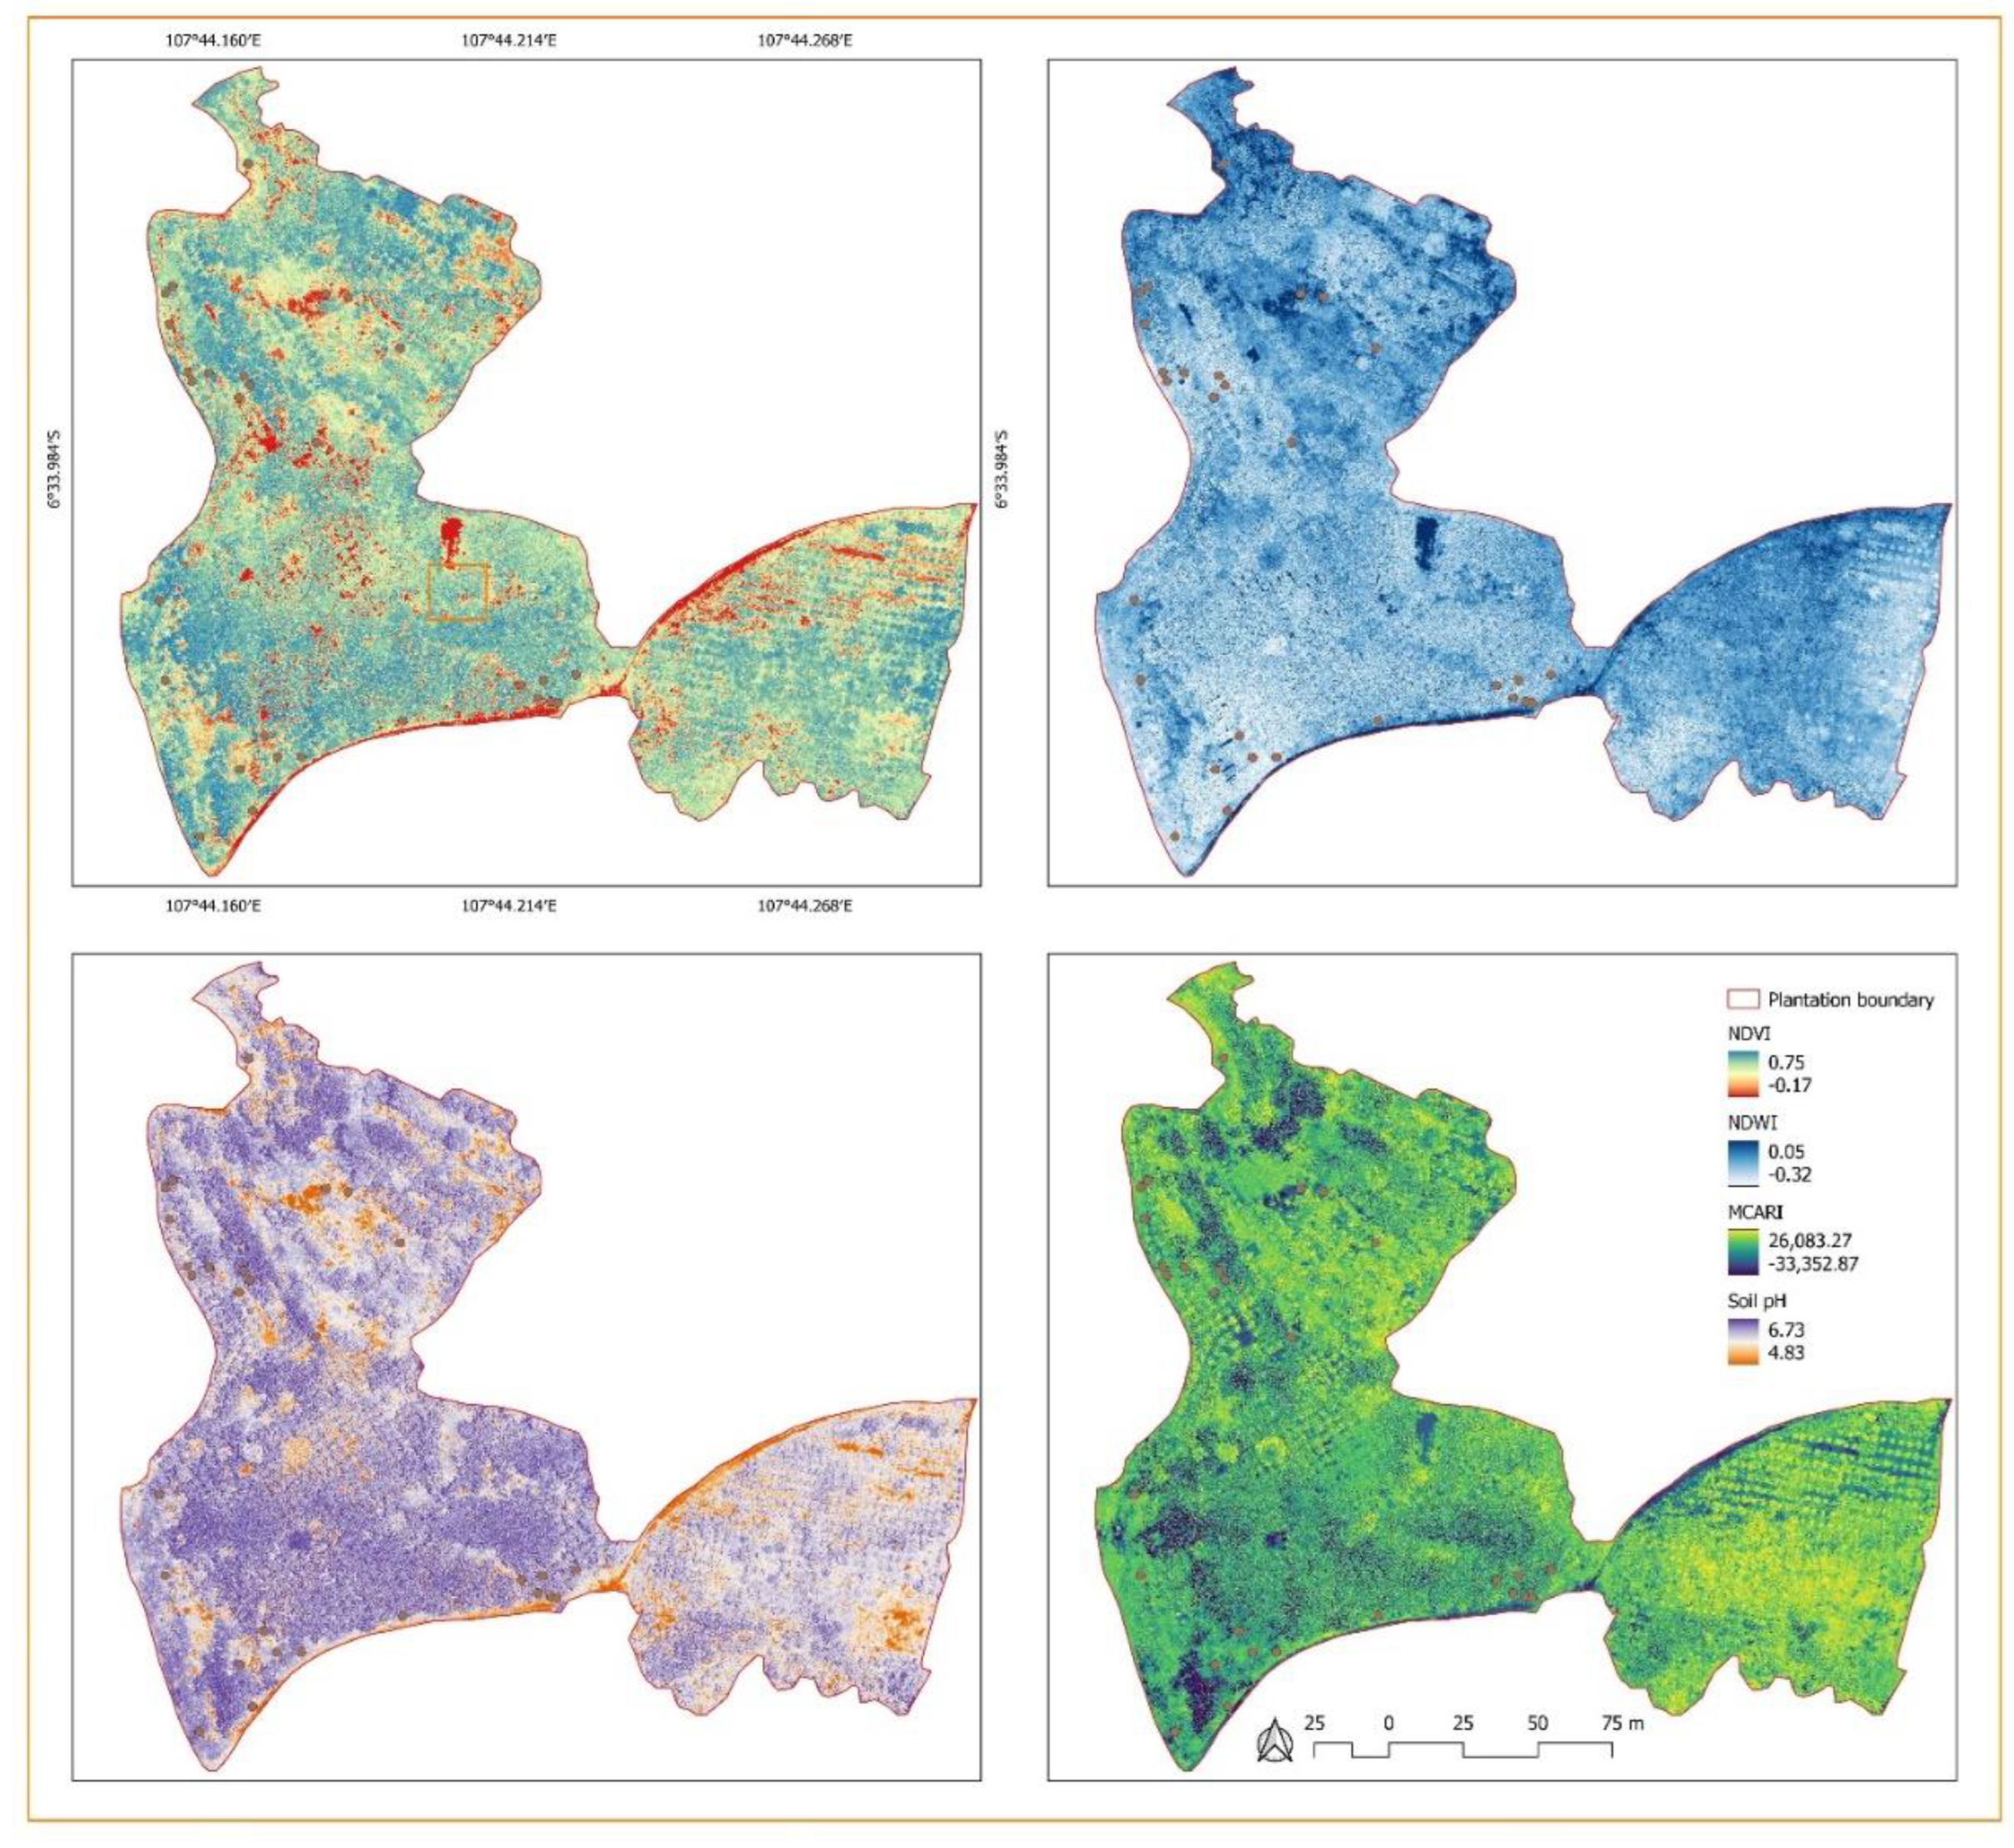
3.1. Status of the Banana Trees Based on the Aerial Photos-Derived Spectral Indices
3.2. The Distribution of BDB and FUSARIUM Wilt Based on Aerial Photos-Derived Spectral Indices
4. Discussion
5. Conclusions
Author Contributions
Conflicts of Interest
References
- Real, L.A.; McElhany, P. Spatial Pattern and Process in Plant-Pathogen Interactions. Ecology 1996, 77, 1011–1025. [Google Scholar] [CrossRef]
- Halliday, F.W.; Jalo, M.; Laine, A.L. The Effect of Host Community Functional Traits on Plant Disease Risk Varies along an Elevational Gradient. Elife 2021, 10, 1–21. [Google Scholar] [CrossRef] [PubMed]
- Ampt, E.A.; van Ruijven, J.; Zwart, M.P.; Raaijmakers, J.M.; Termorshuizen, A.J.; Mommer, L. Plant Neighbours Can Make or Break the Disease Transmission Chain of a Fungal Root Pathogen. New Phytol. 2022, 233, 1303–1316. [Google Scholar] [CrossRef] [PubMed]
- Géoffroy Dato, K.M.; Dégbègni, M.R.; Atchadé, M.N.; Tachin, M.Z.; Hounkonnou, M.N.; Omondi, B.A. Spatial Parameters Associated with the Risk of Banana Bunchy Top Disease in Smallholder Systems. PLoS ONE 2021, 16, 1–19. [Google Scholar] [CrossRef]
- Ray, J.D.; Subandiyah, S.; Rincon-Florez, V.A.; Prakoso, A.B.; Mudita, I.W.; Carvalhais, L.C.; Markus, J.E.R.; O Dwyer, C.A.; Drenth, A. Geographic Expansion of Banana Blood Disease in Southeast Asia. Plant Dis. 2021, 105. [Google Scholar] [CrossRef]
- Wikantika, K.; Ghazali, M.F.; Dwivany, F.M.; Novianti, C.; Yayusman, L.F.; Sutanto, A. Integrated Studies of Banana on Remote Sensing, Biogeography, and Biodiversity : An Indonesian Perspective. Diversity 2022, 14, 277. [Google Scholar] [CrossRef]
- Soesanto, L.; Mugiastuti, E.; Ahmad, F. Diagnosis Lima Penyakit Utama Karena Jamur Pada 100 Kultivar Bibit Pisang. J. Hama dan Penyakit Tumbuh. Trop. 2013, 12, 36–45. [Google Scholar] [CrossRef]
- Pegg, K.G.; Coates, L.M.; O’Neill, W.T.; Turner, D.W. The Epidemiology of Fusarium Wilt of Banana. Front. Plant Sci. 2019, 10, 1–19. [Google Scholar] [CrossRef]
- Wibowo, A.; Alboneh, A.R.; Somala, M.; Subandiyah, S.; Pattison, T.; Molina, A. Increasing Soil Suppressivity to Fusarium Wilt of Banana through Banana Intercropping with Allium Spp. J. Perlindungan Tanam. Indones. 2015, 19, 33–39. [Google Scholar] [CrossRef]
- Saremi, H.; Burgess, L.W. Effect of Soil Temperature on Distribution and Population Dynamics of Fusarium Species. J. Agr. Sci. Tech. 2006, 2, 119–125. [Google Scholar]
- McFeeters, S.K. The Use of The Normalized Difference Water Index (NDWI) in The Delineation of Water Feature. Int. J. Remote Sens. 1996, 17, 425–1432. [Google Scholar] [CrossRef]
- Gao, B.C. NDWI-A Normalized Difference Water Index for Remote Sensing of Vegetation Liquid Water from Space. Remote Sens. Environ. 1996, 58, 257–266. [Google Scholar] [CrossRef]
- Chen, D.; Huang, J.; Jackson, T.J. Vegetation Water Content Estimation for Corn and Soybeans Using Spectral Indices Derived from MODIS Near- and Short-Wave Infrared Bands. Remote Sens. Environ. 2005, 98, 225–236. [Google Scholar] [CrossRef]
- Clayton, E.E. . The Relation of Soil Moisture to the Fusarium Wilt of the Tomato. Am. J. Bot. 1923, 10, 133–147. [Google Scholar] [CrossRef]
- Oritsejafor, J.J. Influence of Moisture and PH on Growth and Survival of Fusarium Oxysporum f.Sp. Elaeidis in Soil. Trans. Br. Mycol. Soc. 1986, 87, 511–517. [Google Scholar] [CrossRef]
- Yan, H.; Nelson, B.J. Effects of Soil Type, Temperature, and Moisture on Development of Fusarium Root Rot of Soybean by Fusarium Solani (FSSC 11) and Fusarium Tricinctum. Plant Dis. 2022, 106, 2974–2983. [Google Scholar] [CrossRef]
- Segura-Mena, R.A.; Stoorvogel, J.J.; García-Bastidas, F.; Salacinas-Niez, M.; Kema, G.H.J.; Sandoval, J.A. Evaluating the Potential of Soil Management to Reduce the Effect of Fusarium Oxysporum f. Sp. Cubense in Banana (Musa AAA). Eur. J. Plant Pathol. 2021, 160, 441–455. [Google Scholar] [CrossRef]
- Rouse, J.W.; Haas, R.H.; Scheel, J.A.; Deering, D.W. Monitoring Vegetation Systems in the Great Plains with ERTS. In Proceedings of the 3rd Earth Resource Technology Satellite Symposium, Washington, DC, USA, 10–14 December 1974; Volume 1, pp. 309–317. [Google Scholar]
- Razali, S.M.; Nuruddin, A.A.; Lion, M. Mangrove Vegetation Health Assessment Based on Remote Sensing Indices for Tanjung Piai, Malay Peninsular. J. Landsc. Ecol. 2019, 12, 26–40. [Google Scholar] [CrossRef]
- Ye, H.; Huang, W.; Huang, S.; Cui, B.; Dong, Y.; Guo, A.; Ren, Y.; Jin, Y. Recognition of Banana Fusarium Wilt Based on UAV Remote Sensing. Remote Sens. 2020, 12, 938. [Google Scholar] [CrossRef]
- Gitelson, A.; Merzlyak, M.N. Spectral Reflectance Changes Associated with Autumn Senescence of Aesculus Hippocastanum L. and Acer Platanoides L. Leaves. Spectral Features and Relation to Chlorophyll Estimation. J. Plant Physiol. 1994, 143, 286–292. [Google Scholar] [CrossRef]
- Gitelson, A.A.; Gritz, Y.; Merzlyak, M.N. Relationships between Leaf Chlorophyll Content and Spectral Reflectance and Algorithms for Non-Destructive Chlorophyll Assessment in Higher Plant Leaves. J. Plant Physiol. 2003, 160, 271–282. [Google Scholar] [CrossRef] [PubMed]
- Gitelson, A.A.; Viña, A.; Ciganda, V.; Rundquist, D.C.; Arkebauer, T.J. Remote Estimation of Canopy Chlorophyll Content in Crops. Geophys. Res. Lett. 2005, 32, 1–4. [Google Scholar] [CrossRef]
- Penuelas, J.; Inoue, Y. Reflectance Indices Indicative of Changes in Water and Pigment Contents of Peanut and Wheat Leaves. Photosynthetica 1999, 36, 355–360. [Google Scholar] [CrossRef]
- Ramoelo, A.; Skidmore, A.K.; Cho, M.A.; Schlerf, M.; Mathieu, R.; Heitkönig, I.M.A. Regional Estimation of Savanna Grass Nitrogen Using the Red-Edge Band of the Spaceborne RapidEye Sensor. Int. J. Appl. Earth Obs. Geoinf. 2012, 19, 151–162. [Google Scholar] [CrossRef]
- Zhou, X.; Huang, W.; Zhang, J.; Kong, W.; Casa, R.; Huang, Y. A Novel Combined Spectral Index for Estimating the Ratio of Carotenoid to Chlorophyll Content to Monitor Crop Physiological and Phenological Status. Int. J. Appl. Earth Obs. Geoinf. 2019, 76, 128–142. [Google Scholar] [CrossRef]
- Gitelson, A.A.; Merzlyak, M.N.; Chivkunova, O.B. Optical Properties and Nondestructive Estimation of Anthocyanin Content in Plant Leaves¶. Photochem. Photobiol. 2001, 74, 38. [Google Scholar] [CrossRef]
- Zhang, S.; Li, X.; Ba, Y.; Lyu, X.; Zhang, M.; Li, M. Banana Fusarium Wilt Disease Detection by Supervised and Unsupervised Methods from UAV-Based Multispectral Imagery. Remote Sens. 2022, 14, 27. [Google Scholar] [CrossRef]
- Roujean, J.L.; Breon, F.M. Estimating PAR Absorbed by Vegetation from Bidirectional Reflectance Measurements. Remote Sens. Environ. 1995, 51, 375–384. [Google Scholar] [CrossRef]
- Gitelson, A.A. Wide Dynamic Range Vegetation Index for Remote Quantification of Biophysical Characteristics of Vegetation. J. Plant Physiol. 2004, 161, 165–173. [Google Scholar] [CrossRef]
- Bannari, A.; Asalhi, H.; Teillet, P.M. Transformed Difference Vegetation Index (TDVI) for Vegetation Cover Mapping. Int. Geosci. Remote Sens. Symp. 2002, 5, 3053–3055. [Google Scholar] [CrossRef]
- Chen, J.M. Evaluation of Vegetation Indices and a Modified Simple Ratio for Boreal Applications. Can. J. Remote Sens. 1996, 22, 229–242. [Google Scholar] [CrossRef]
- Yang, Z.; Willis, P.; Mueller, R. Impact of Band-Ratio Enhanced AWiFS Image to Crop Classification Accuracy. Proceeding Pecora 17 2008, 17, 1–11. [Google Scholar]
- Tucker, C.J. Red and Photographic Infrared Linear Combinations for Monitoring Vegetation. Remote Sens. Environ. 1979, 8, 127–150. [Google Scholar] [CrossRef]
- Huete, A.R. A Soil-Adjusted Vegetation Index (SAVI). Remote Sens. Environ. 1988, 25, 295–309. [Google Scholar] [CrossRef]
- BPS Kabupaten Subang. Subang Dalam Angka Tahun 2021; BPS: Subang, Malaysia, 2022; ISBN 0215.4285. [Google Scholar]
- Susilokarti, D.; Supadmo Arif, S.; Susanto, S.; Sutiarso, L. Identification of Climate Change Based on Rainfall Data in Southern Part of Jatiluhur, Subang District, West Jawa. Agritech 2015, 35, 98–105. [Google Scholar] [CrossRef]
- Agisoft LLC AgiSoft PhotoScan Standard 2016, 1.
- Agisoft LLC MicaSense RedEdge MX Processing Workflow (Including Reflectance Calibration). Available online: https://agisoft.freshdesk.com/support/solutions/articles/31000148780-micasense-rededge-mx-processing-workflow-including-reflectance-calibration-in-agisoft-metashape-pro (accessed on 22 May 2023).
- ASD. FieldSpec ® HandHeld 2 TM Spectroradiometer User Manual; ASD Inc.: Boulder, CO, USA, 2010. [Google Scholar]
- Stamford, J.D.; Vialet-Chabrand, S.; Cameron, I.; Lawson, T. Development of an Accurate Low Cost NDVI Imaging System for Assessing Plant Health. Plant Methods 2023, 19, 1–19. [Google Scholar] [CrossRef]
- Chen, J.J.; Zhen, S.; Sun, Y. Estimating Leaf Chlorophyll Content of Buffaloberry Using Normalized Difference Vegetation Index Sensors. Horttechnology 2021, 31, 297–303. [Google Scholar] [CrossRef]
- Tanaka, M.; Hama, A.; Tsurusaki, Y.; Shibato, Y. Methods of Aerial Photography Using Drone and Image Analyses for Evaluation of Cabbage Growth at Individual Level. J. Remote Sens. Soc. Jpn. 2021, 41, 375–385. [Google Scholar] [CrossRef]
- Yang, H.; Yang, X.; Heskel, M.; Sun, S.; Tang, J. Seasonal Variations of Leaf and Canopy Properties Tracked by Ground-Based NDVI Imagery in a Temperate Forest. Sci. Rep. 2017, 7, 1–10. [Google Scholar] [CrossRef]
- Ghazali, M.F.; Wikantika, K.; Aryantha, I.N.P.; Maulani, R.R.; Yayusman, L.F.; Sumantri, D.I. Integration of Spectral Measurement and UAV for Paddy Leaves Chlorophyll Content Estimation. Sci. Agric. Bohem. 2020, 2020, 86–97. [Google Scholar] [CrossRef]
- Ghazali, M.F.; Wikantika, K.; Harto, A.B.; Kondoh, A. Generating Soil Salinity, Soil Moisture, Soil PH from Satellite Imagery and Its Analysis. Inf. Process. Agric. 2019, 11, 294–306. [Google Scholar] [CrossRef]
- McFeeters, S.K. The Use of The Normalized Difference Water Index (NDWI) in The Delineation of Water Feature. Int. J. Remote Sens. 1996, 17, 425–1432. [Google Scholar] [CrossRef]
- JRC European Commission NDWI (Normalized Difference Water Index). Prod. Fact Sheet 2011, 5, 6–7.
- Thomas, D.S.; Turner, D.W. Banana (Musa Sp.) Leaf Gas Exchange and Chlorophyll Fluorescence in Response to Soil Drought, Shading and Lamina Folding. Sci. Hortic. 2001, 90, 93–108. [Google Scholar] [CrossRef]
- Zhang, J.; Bei, S.; Li, B.; Zhang, J.; Christie, P.; Li, X. Organic Fertilizer, but Not Heavy Liming, Enhances Banana Biomass, Increases Soil Organic Carbon and Modifies Soil Microbiota. Appl. Soil Ecol. 2019, 136, 67–79. [Google Scholar] [CrossRef]
- Robinson, J.C.; Sauco, V.G. Site Selection, Soil Requirement, and Soil Preparation. In Bananas and Plantains; Hulbert, S., Chippendale, F., Eds.; CABI: Wallingford, UK, 2010; p. 299. ISBN 978. [Google Scholar]
- Jones, J.B.; Soil, P.H. Liming, and Liming Materials. In Agronomic Handbook Management of Crops, Soils and Their Fertility; CRC Press: Washington, DC, USA, 2002; pp. 237–251. ISBN 0-8493-0897-6. [Google Scholar]
- von Uexküll, H.R.; Mutert, E. Global Extent, Development and Economic Impact of Acid Soils. Plant Soil 1995, 171, 1–15. [Google Scholar] [CrossRef]
- Crusciol, C.A.C.; Artigiani, A.C.C.A.; Arf, O.; Carmeis Filho, A.C.A.; Soratto, R.P.; Nascente, A.S.; Alvarez, R.C.F. Soil Fertility, Plant Nutrition, and Grain Yield of Upland Rice Affected by Surface Application of Lime, Silicate, and Phosphogypsum in a Tropical No-till System. Catena 2016, 137, 87–99. [Google Scholar] [CrossRef]
- Orr, R.; Nelson, P.N. Impacts of Soil Abiotic Attributes on Fusarium Wilt, Focusing on Bananas. Appl. Soil Ecol. 2018, 132, 20–33. [Google Scholar] [CrossRef]
- Segura, R.A.; Stoorvogel, J.J.; Sandoval, J.A. The Effect of Soil Properties on the Relation between Soil Management and Fusarium Wilt Expression in Gros Michel Bananas. Plant Soil 2022, 471, 89–100. [Google Scholar] [CrossRef]
- Thi, L. Le; Mertens, A.; Vu, D.T.; Vu, T.D.; Minh, P.L.A.; Duc, H.N.; de Backer, S.; Swennen, R.; Vandelook, F.; Panis, B.; et al. Diversity of Fusarium Associated Banana Wilt in Northern Viet Nam. MycoKeys 2022, 87, 53–76. [Google Scholar] [CrossRef]
- Le Thi, L.; Mertens, A.; Vu, D.T.; Vu, T.D.; Anh Minh, P.; Le Duc, H.N.; de Backer, S.; Swennen, R.; Vandelook, F.; Panis, B.; et al. Diversity of Fusarium Associated Banana Wilt in Northern Viet Nam. MycoKeys 2022, 87, 53–76. [Google Scholar] [CrossRef] [PubMed]
- Buddenhagen, I. Understanding Strain Diversity in Fusarium Oxysporum f. Sp. Cubense and History of Introduction of ‘ Tropical Race 4 ’ to Better Manage Banana Production. Acta Hortic. 2009, 193–204. [Google Scholar] [CrossRef]
- Dita, M.; Barquero, M.; Heck, D.; Mizubuti, E.S.G.; Staver, C.P. Fusarium Wilt of Banana: Current Knowledge on Epidemiology and Research Needs toward Sustainable Disease Management. Front. Plant Sci. 2018, 871, 1–21. [Google Scholar] [CrossRef] [PubMed]
- Huang, Y.H.; Wang, R.C.; Li, C.H.; Zuo, C.W.; Wei, Y.R.; Zhang, L.; Yi, G.J. Control of Fusarium Wilt in Banana with Chinese Leek. Eur. J. Plant Pathol. 2012, 134, 87–95. [Google Scholar] [CrossRef] [PubMed]
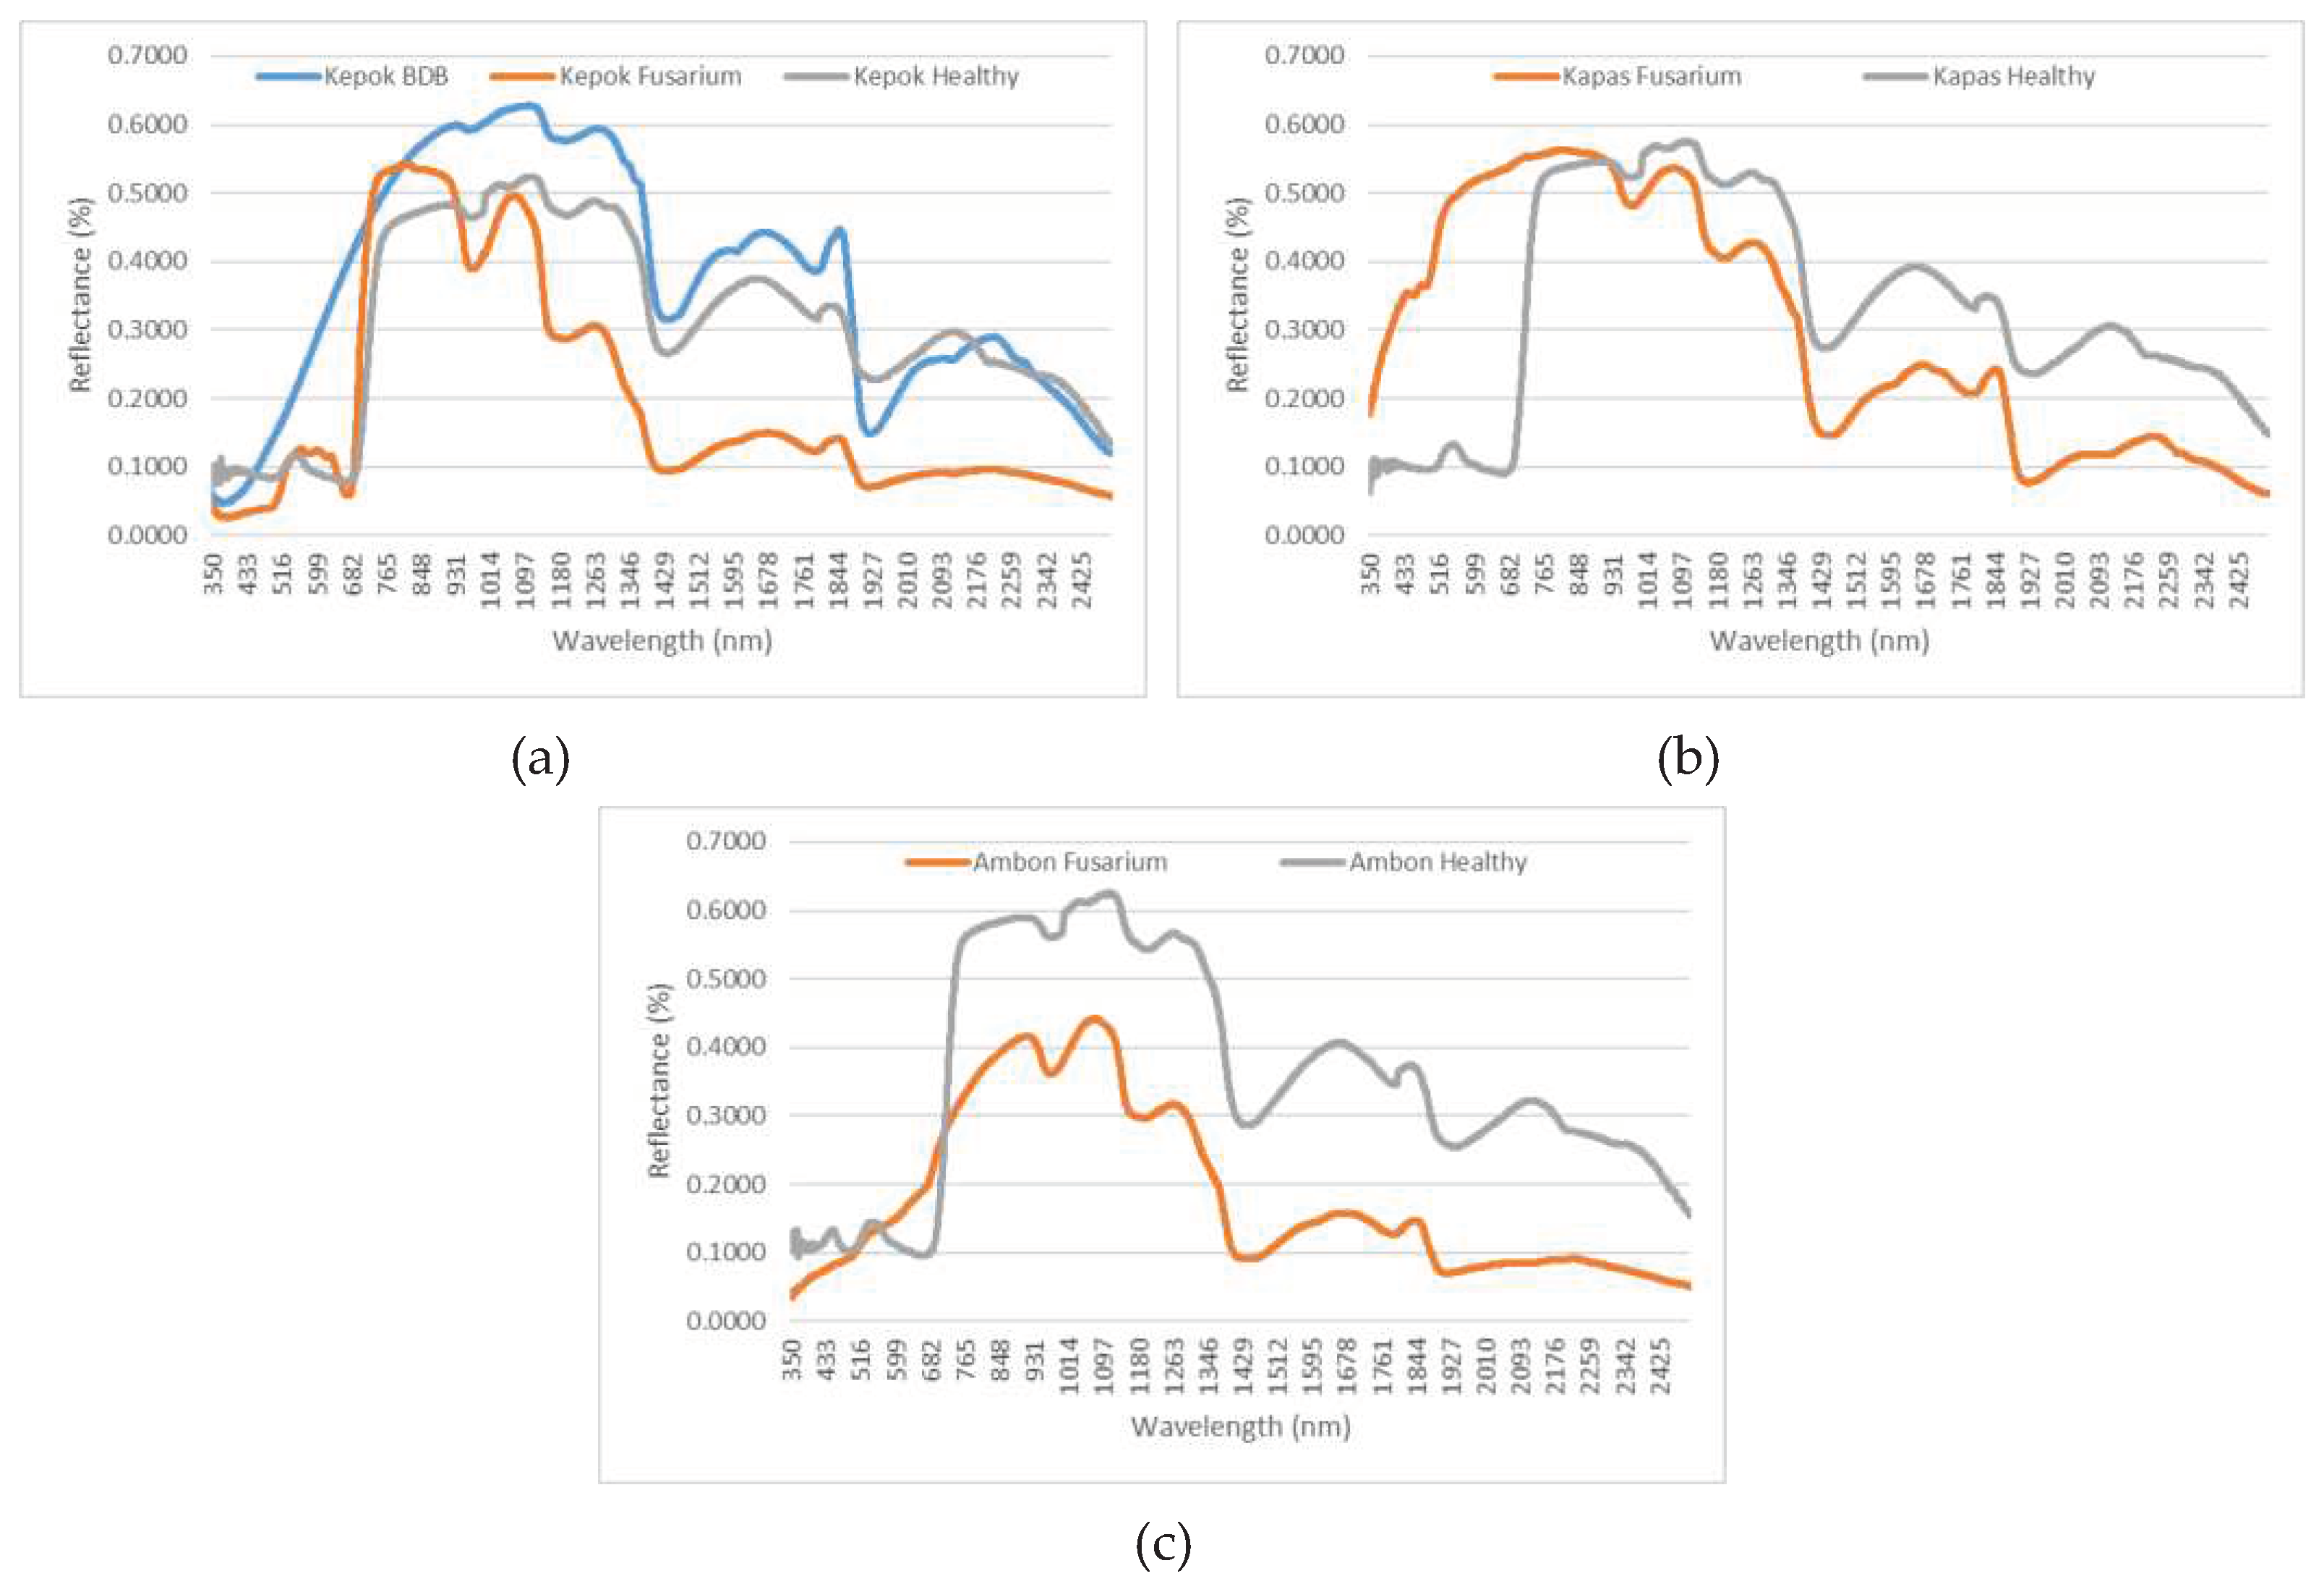
| No | Band Name | Centre Wavelength | Bandwidth |
|---|---|---|---|
| 1 | Blue | 465 nm | 32 nm |
| 2 | Green | 560 nm | 27 nm |
| 3 | Red | 668 nm | 16 nm |
| 4 | Red edge | 717 nm | 12 nm |
| 5 | Near-infrared | 842 nm | 57 nm |
| 6 | Thermal | 11µm | 6 µm |
| No | Cultivars | Diseases | NDVI | NDWI | MCARI | Soil pH | ||||
|---|---|---|---|---|---|---|---|---|---|---|
| Min | Max | Min | Max | Min | Max | Min | Max | |||
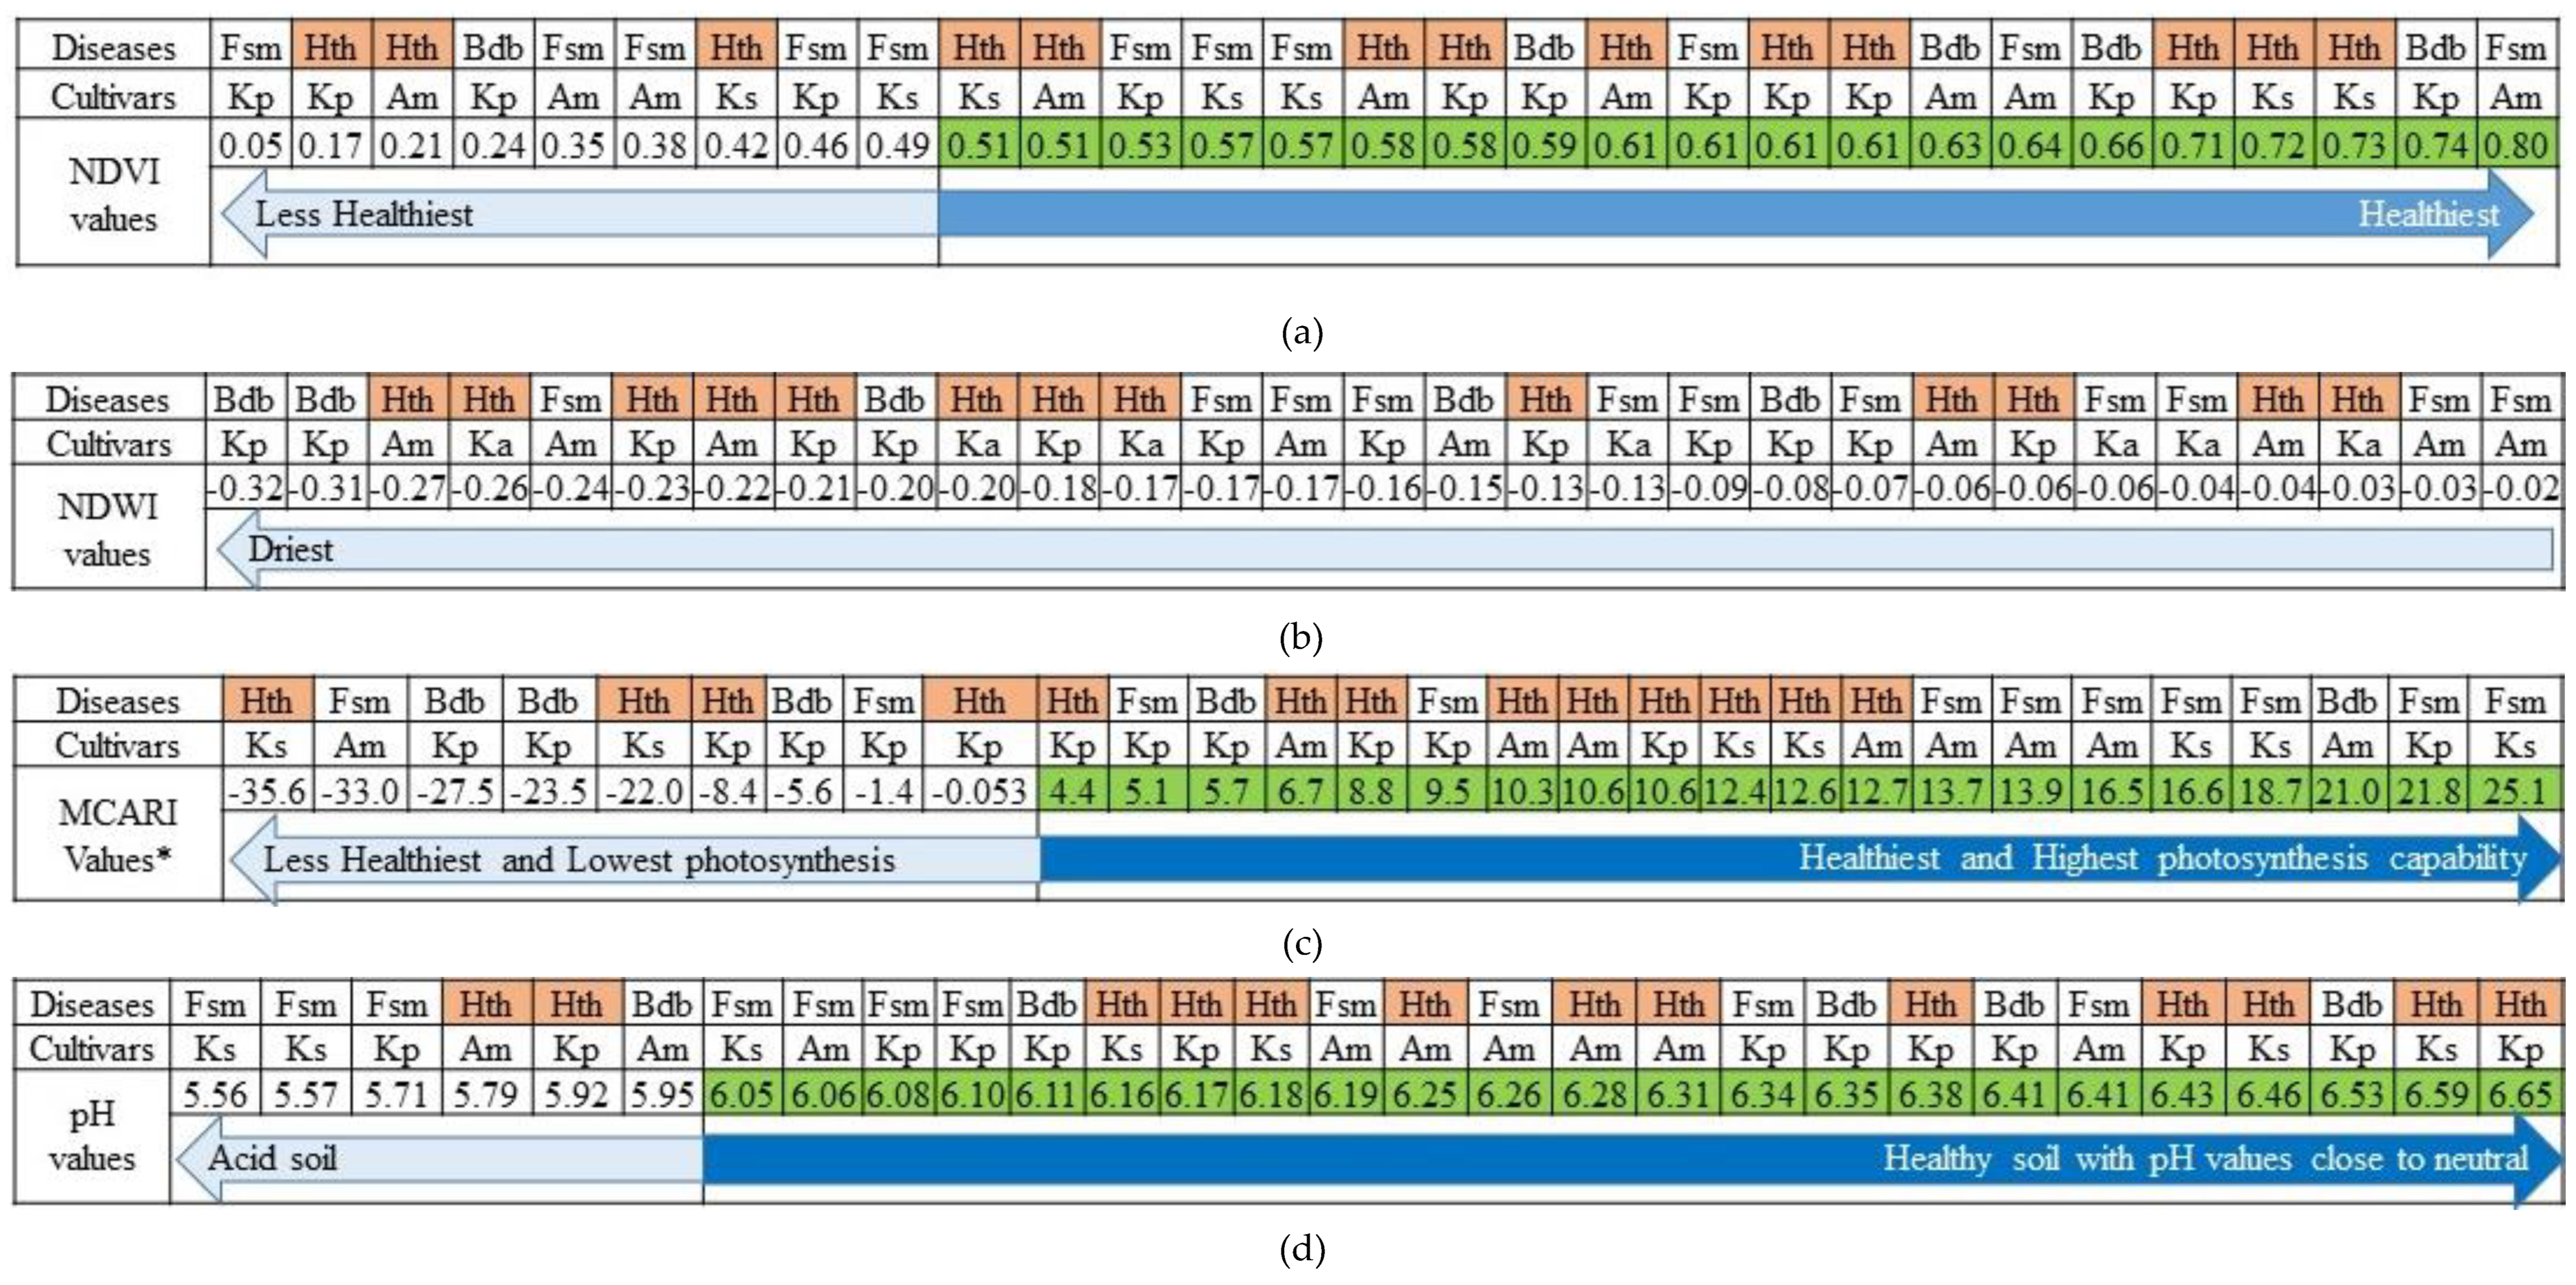
| 1 | Ambon | Fusarium | 0.35 | 0.80 | -0.24 | -0.02 | -33029.25 | 16547.45 | 6.06 | 6.41 |
| BDB | 0.63 | 0.63 | -0.15 | -0.15 | 21073.20 | 21073.20 | 5.95 | 5.95 | ||
| Healthy | 0.21 | 0.61 | -0.27 | -0.04 | 6773.85 | 12734.36 | 5.79 | 6.31 | ||
| 2 | Kapas | Fusarium | 0.49 | 0.57 | -0.13 | -0.04 | 16608.73 | 25183.98 | 5.56 | 6.05 |
| Healthy | 0.42 | 0.73 | -0.26 | -0.03 | -35623.27 | 12617.84 | 6.16 | 6.59 | ||
| 3 | Kepok | Fusarium | 0.05 | 0.61 | -0.17 | -0.07 | -1463.12 | 21841.52 | 5.71 | 6.34 |
| BDB | 0.24 | 0.74 | -0.32 | -0.08 | -27543.98 | 5746.49 | 6.11 | 6.53 | ||
| Healthy | 0.17 | 0.71 | -0.23 | -0.06 | -8423.26 | 10640.53 | 5.92 | 6.65 | ||
| UAV-derived Spectral Indices | NDVI | NDWI | MCARI | Soil pH |
|---|---|---|---|---|
| Gini Index | 0.22 | 0.28 | 0.35 | 0.15 |
| Predicted | Total | ||||
|---|---|---|---|---|---|
| BDB | Fusarium | Healthy | |||
| True | BDB | 5 | 0 | 0 | 5 |
| Fusarium | 0 | 11 | 0 | 11 | |
| Healthy | 0 | 0 | 13 | 13 | |
| Total | 5 | 11 | 13 | 29 | |
| No | Pairs of spectral indices | Coefficient of Determination (R2) | |
|---|---|---|---|
| UAV | Spectro | ||
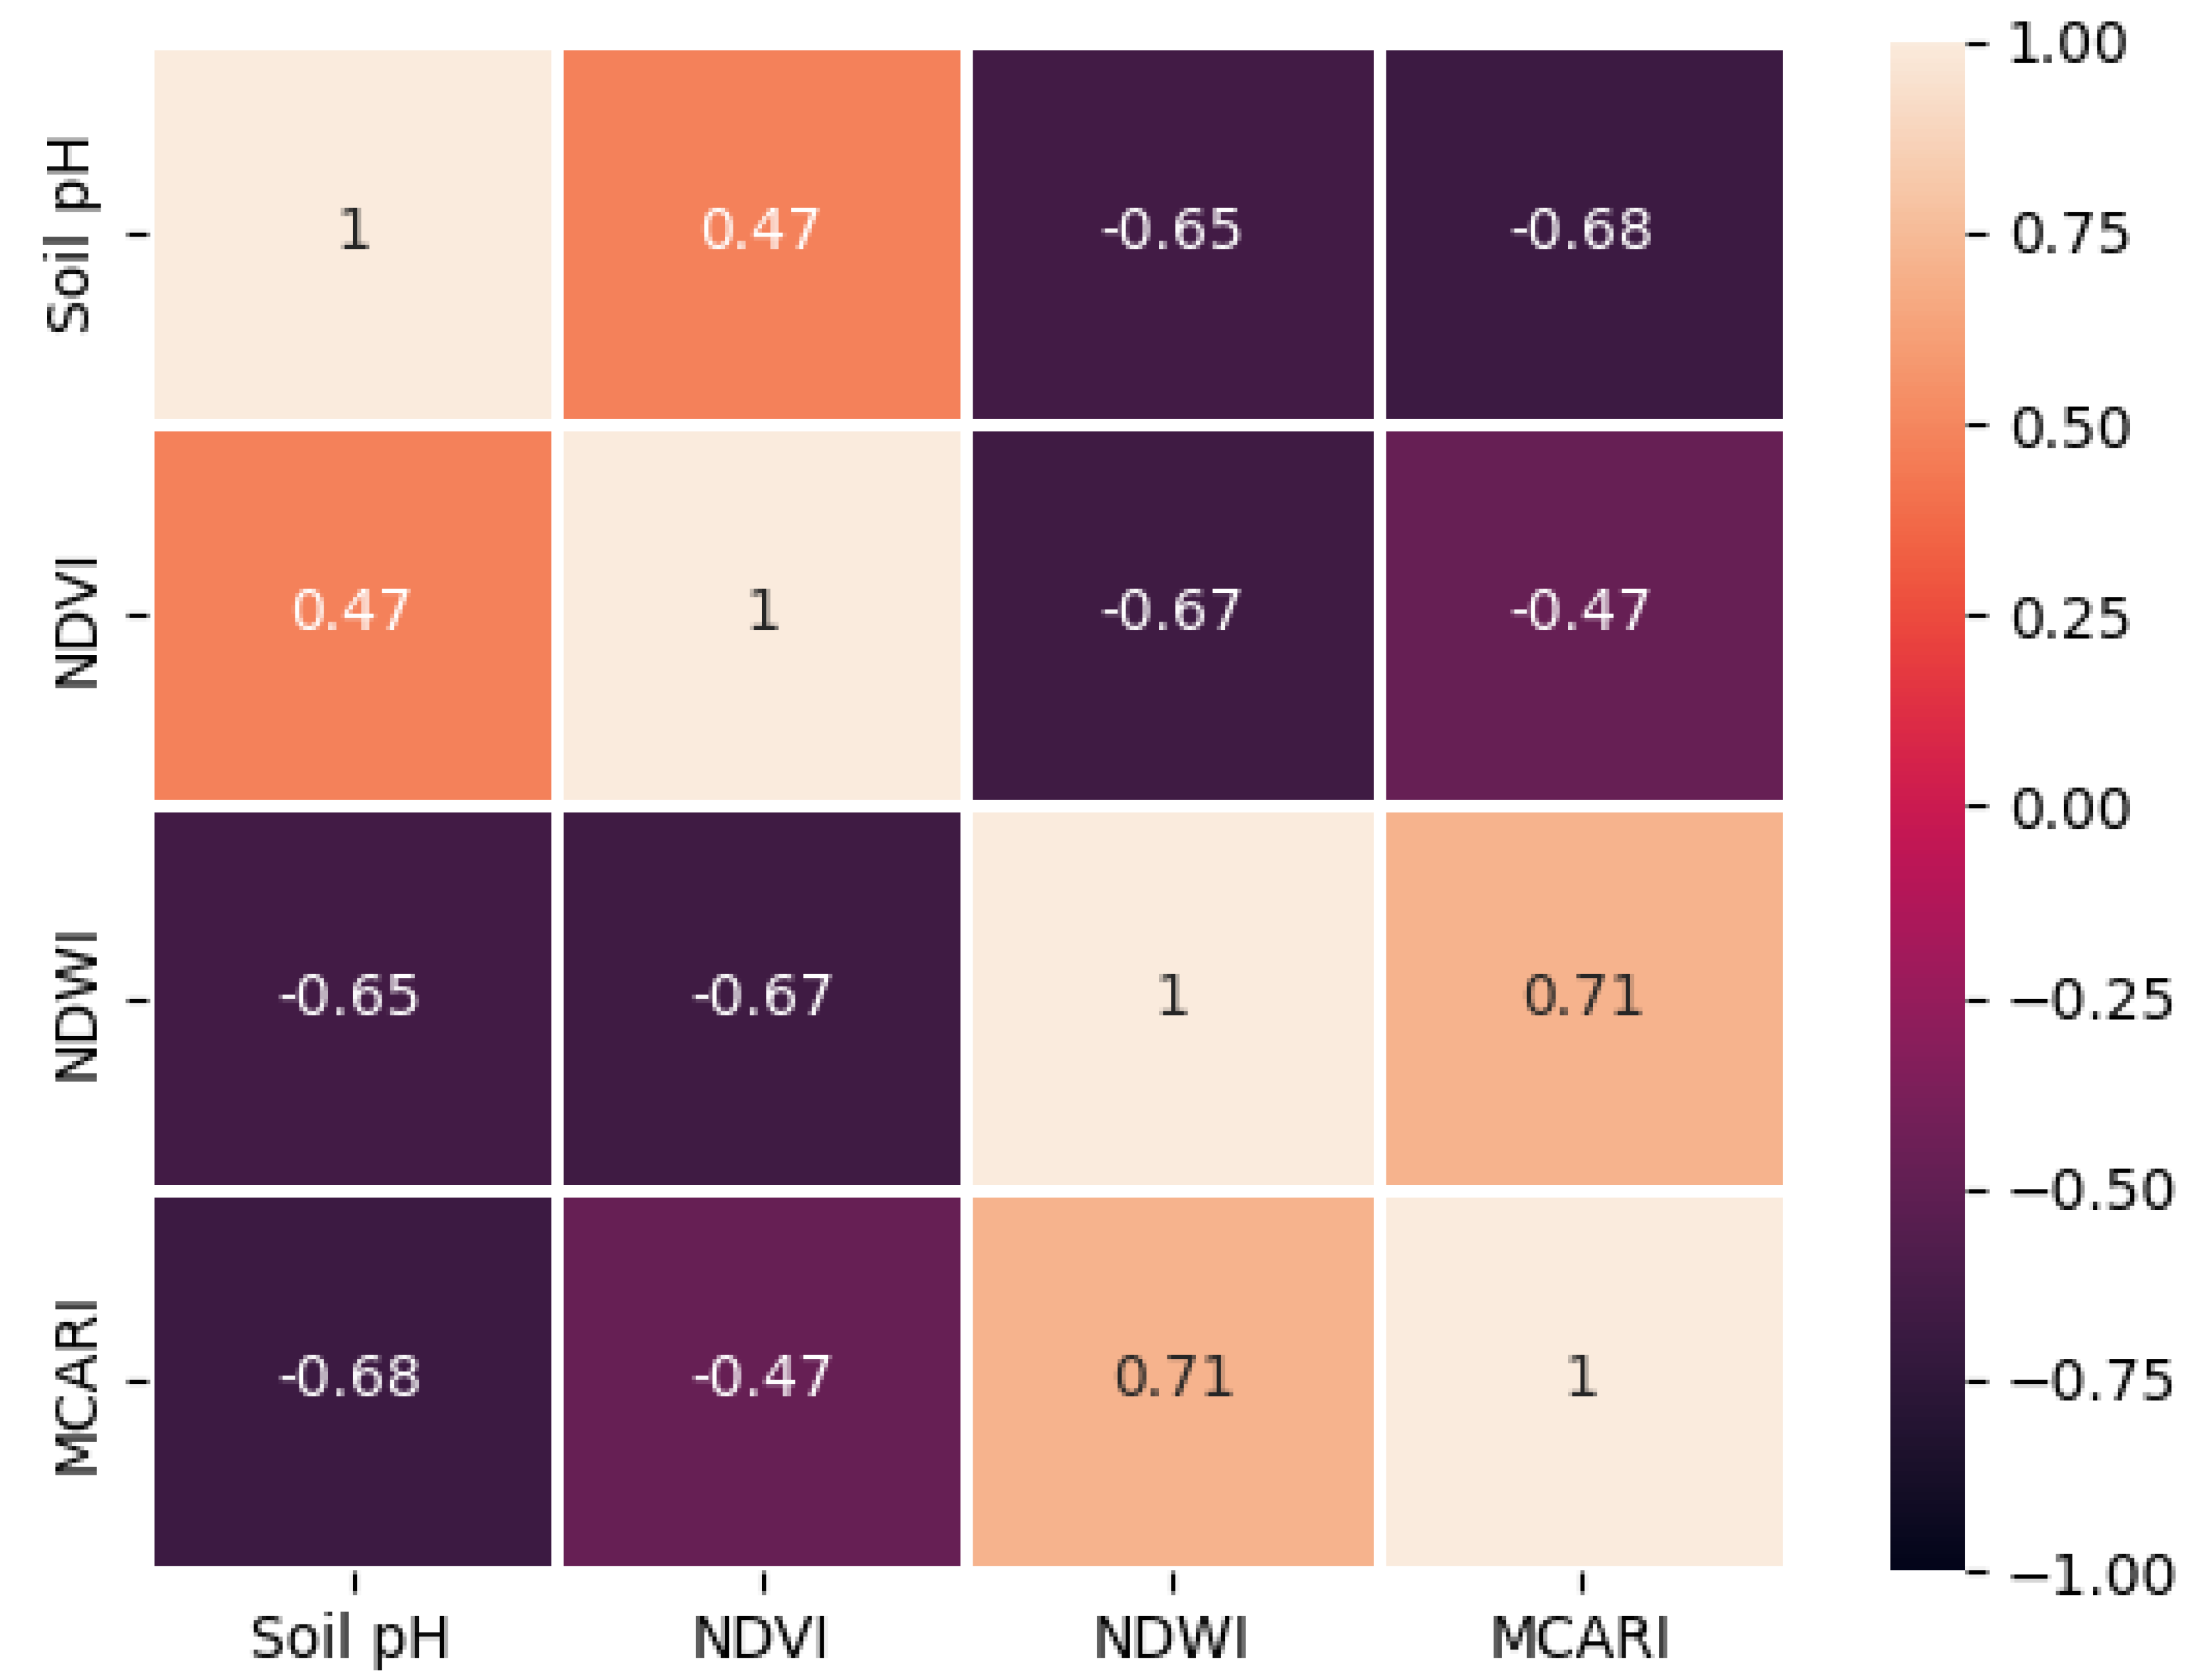
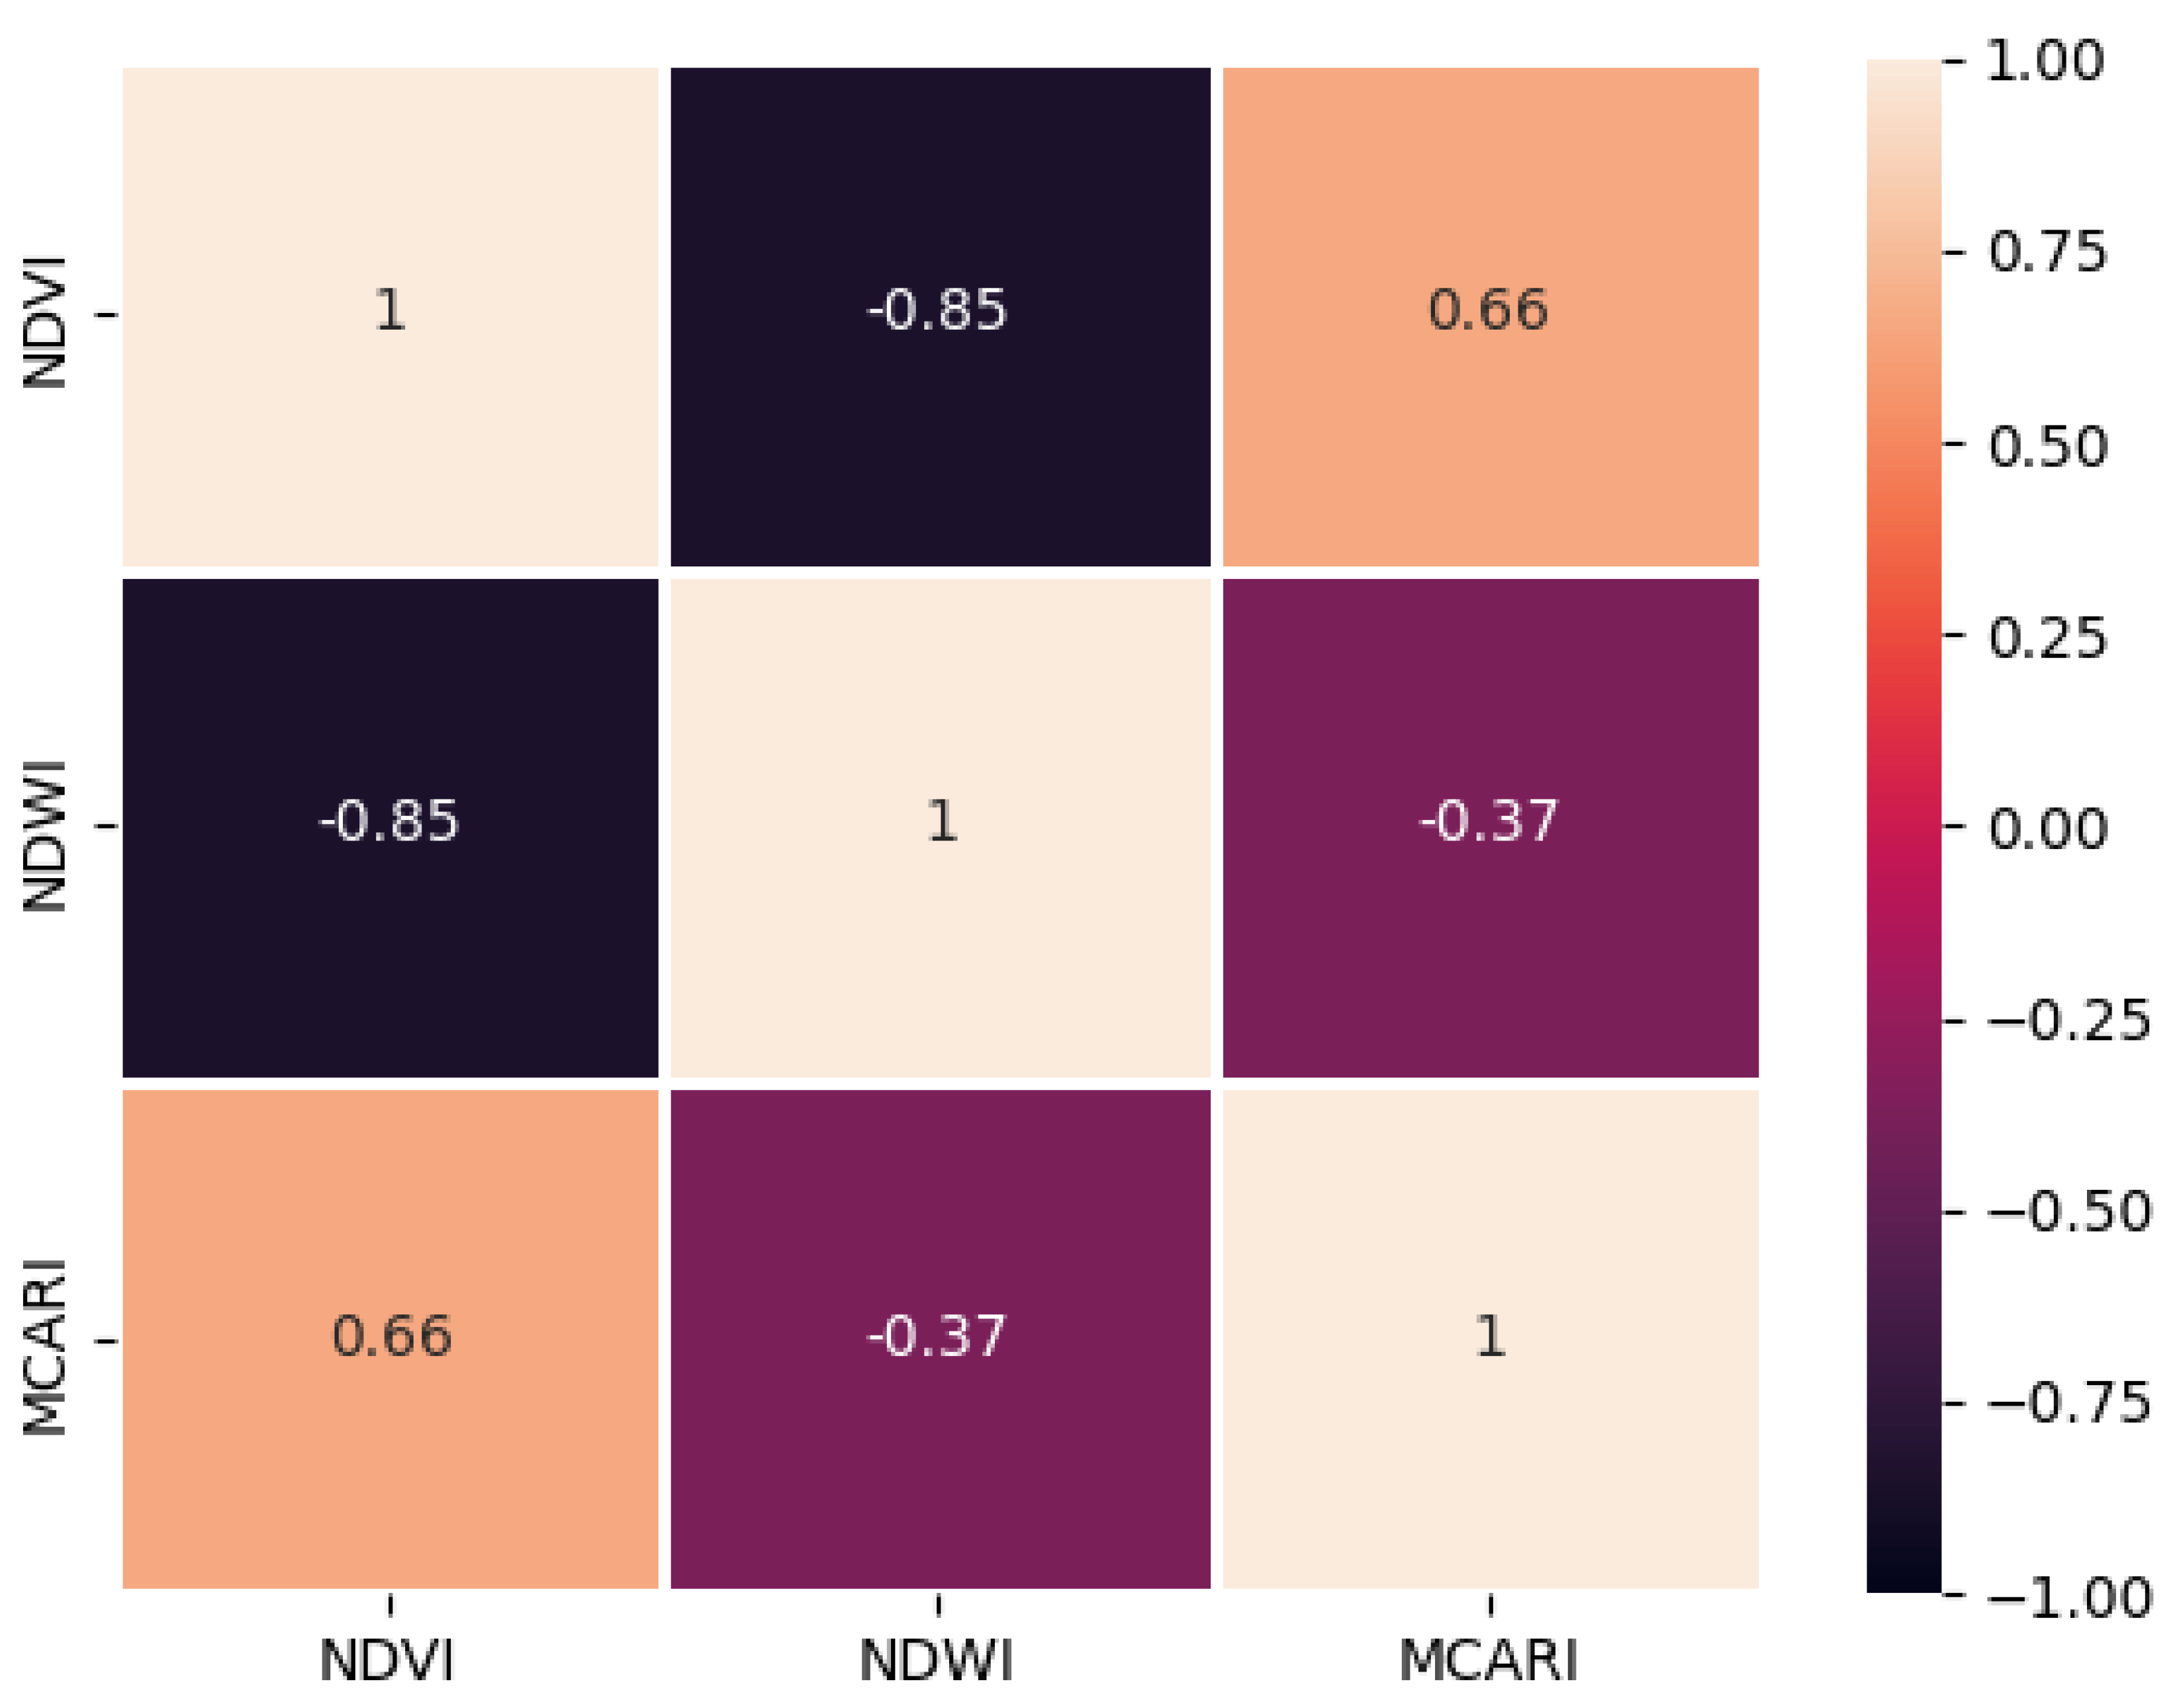
| 1 | NDVI-MCARI | -0.47 | 0.66 |
| 2 | NDVI-NDWI | -0.67 | -0.87 |
| 3 | NDWI-MCARI | 0.71 | 0.66 |
Disclaimer/Publisher’s Note: The statements, opinions and data contained in all publications are solely those of the individual author(s) and contributor(s) and not of MDPI and/or the editor(s). MDPI and/or the editor(s) disclaim responsibility for any injury to people or property resulting from any ideas, methods, instructions or products referred to in the content. |
© 2023 by the authors. Licensee MDPI, Basel, Switzerland. This article is an open access article distributed under the terms and conditions of the Creative Commons Attribution (CC BY) license (http://creativecommons.org/licenses/by/4.0/).


