Submitted:
11 July 2023
Posted:
13 July 2023
You are already at the latest version
Abstract
Keywords:
1. Introduction
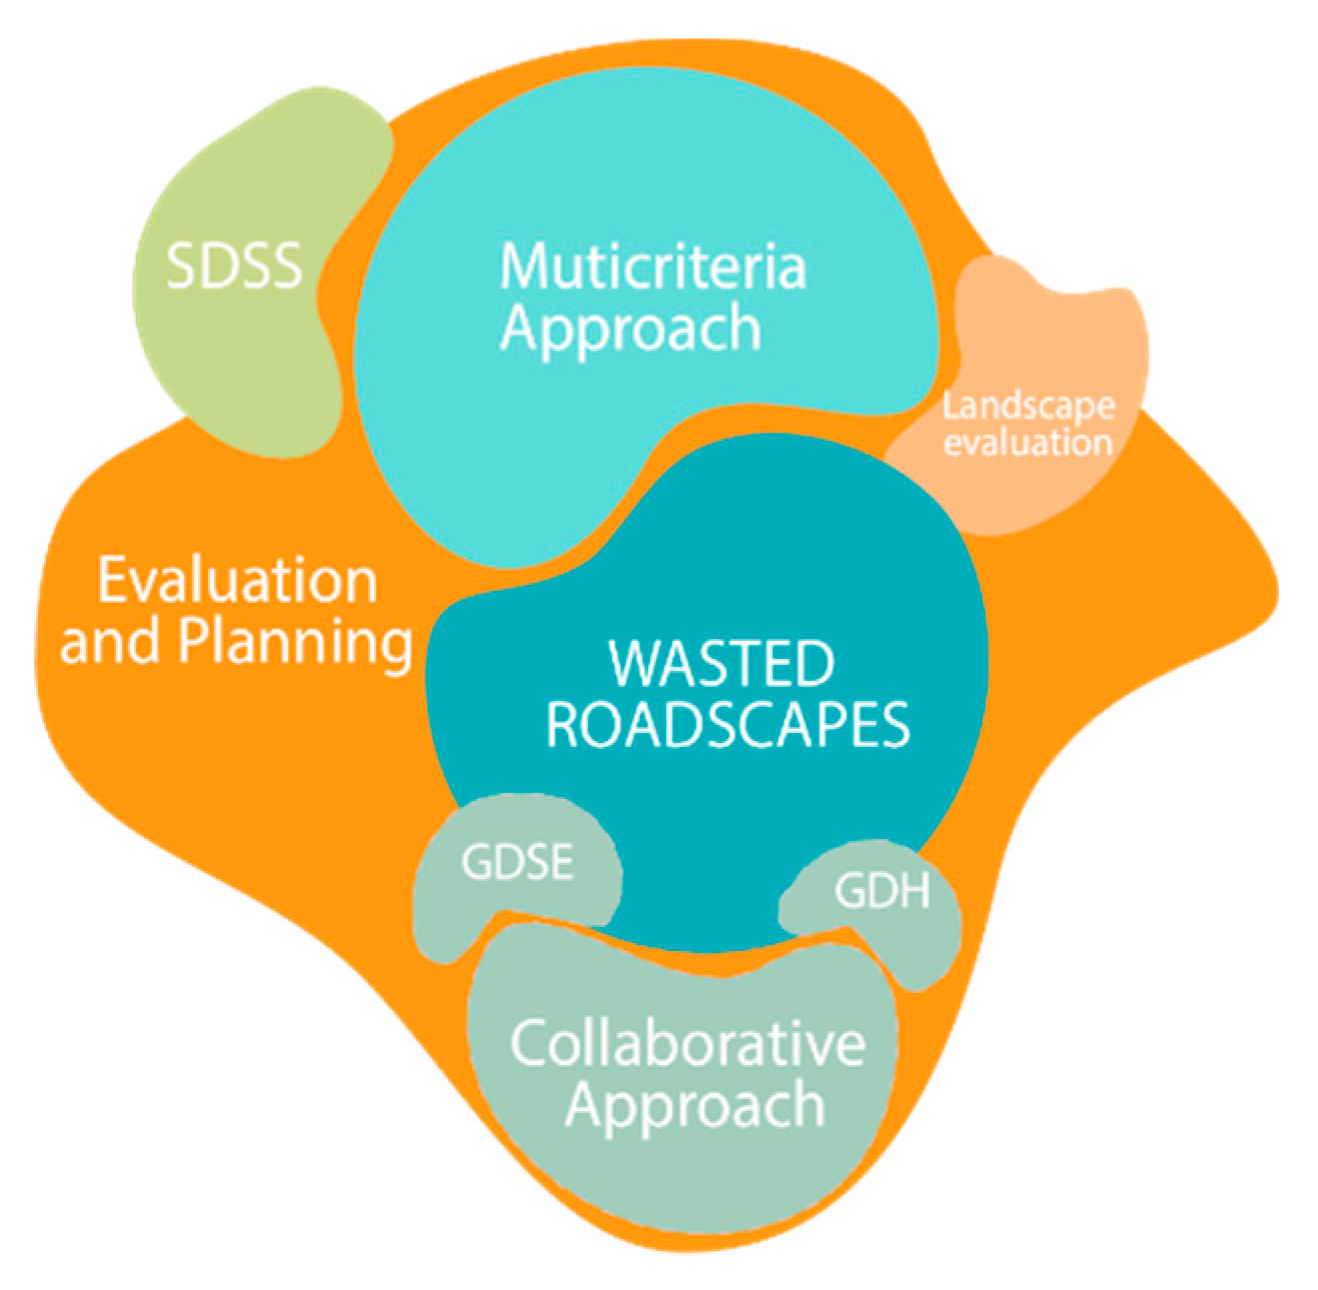
- How can wasted roadscapes be analysed and evaluated within a spatial regeneration decision-making process?
- How can Geodesign support decision-making in the definition of sustainable solutions?
2. Wasted Roadscapes as an Evolutive Issue
- Social and cultural Wasted Roadscape (WRsc): represent those places that, due to their location, can assume socio-cultural value because they are located at strategic points and can be reused to define projects beneficial to society;
- Ecosystem service Wasted roadscape (WRes): are rejected places that can have intrinsic environmental value (emerged from ex-ante assessment) and can define new forms of naturalness and support the territory’s ecological aspects;
- Hub Wasted roadscape (WRhub): represent those places that, due to their morphological characteristics (emerged from analysis and evaluation before the definition of a project), assume a technical-functional value, i.e., they are those places valid for services attached to infrastructure (stations, info points, car sharing, parking lots).
3. Materials and Methods
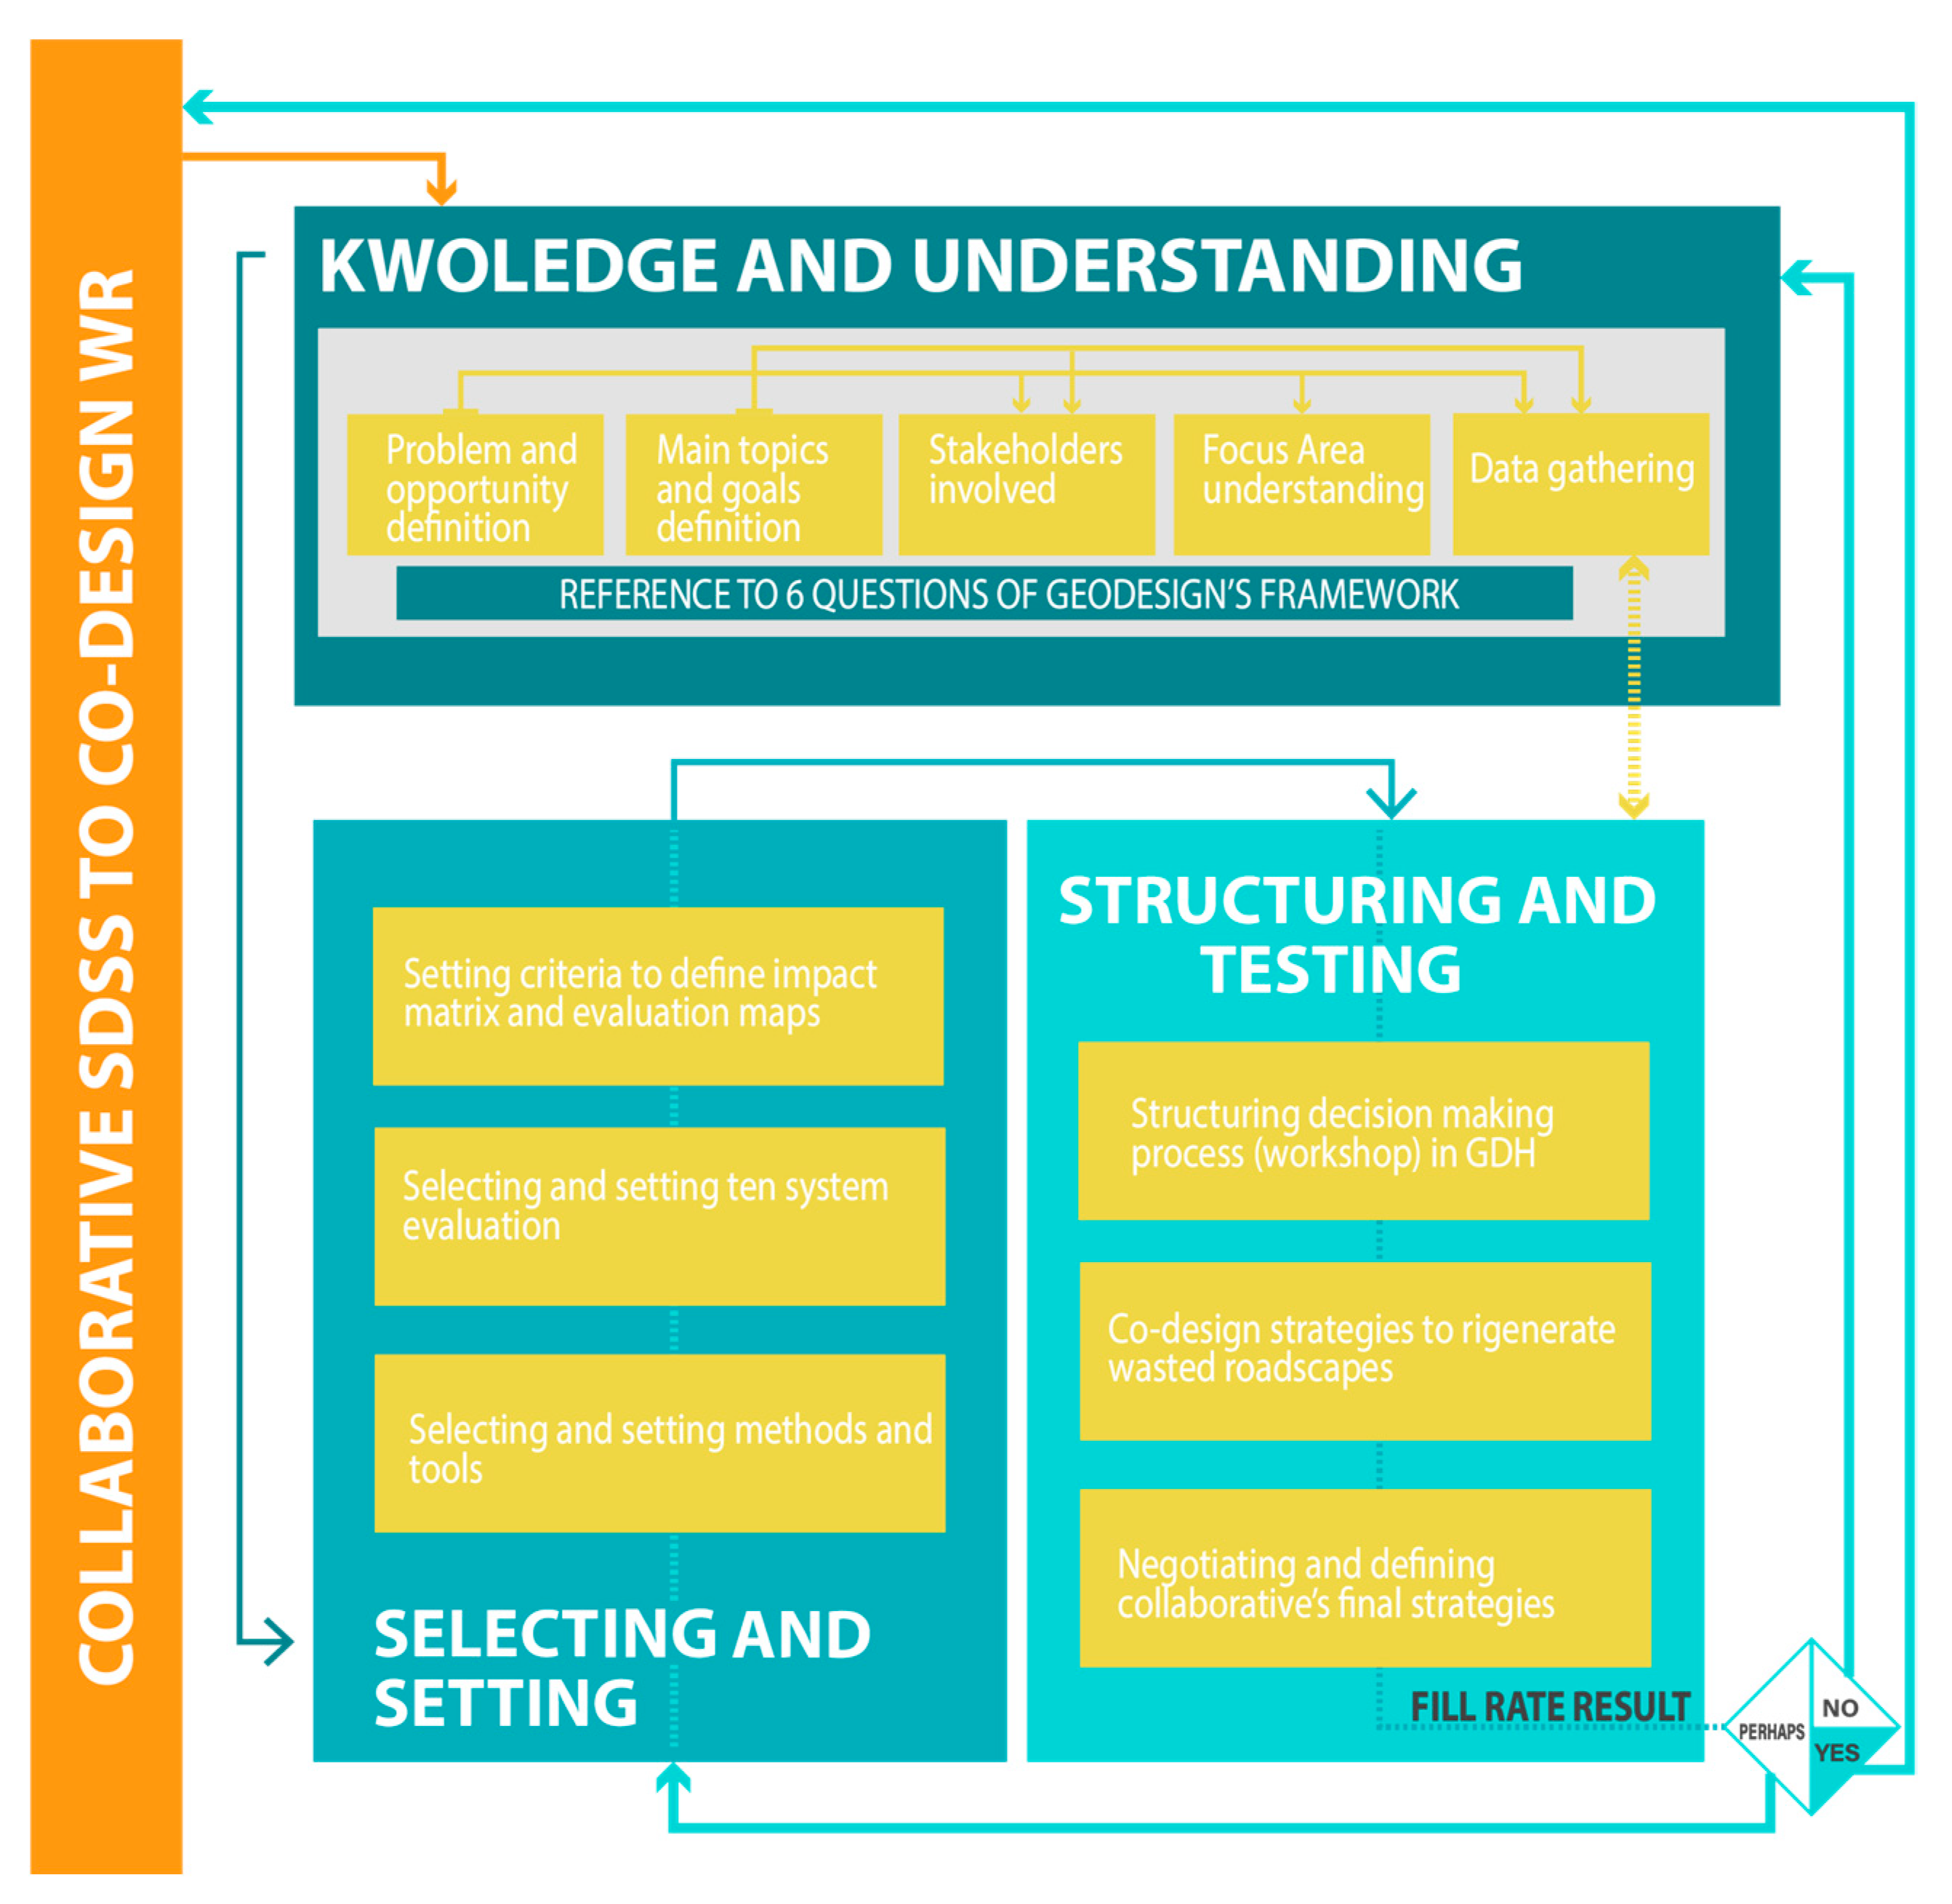
3.1. A Geodesign-Based Methodology for Regenerating Wasted Roadscapes of Bacoli
- How can wasted roadscapes be analysed and evaluated within a spatial regeneration decision-making process?
- How can Geodesign support decision-making in the definition of sustainable solutions?
- Knowledge and understanding (i);
- Selecting and setting (ii);
- Structuring and testing (iii)
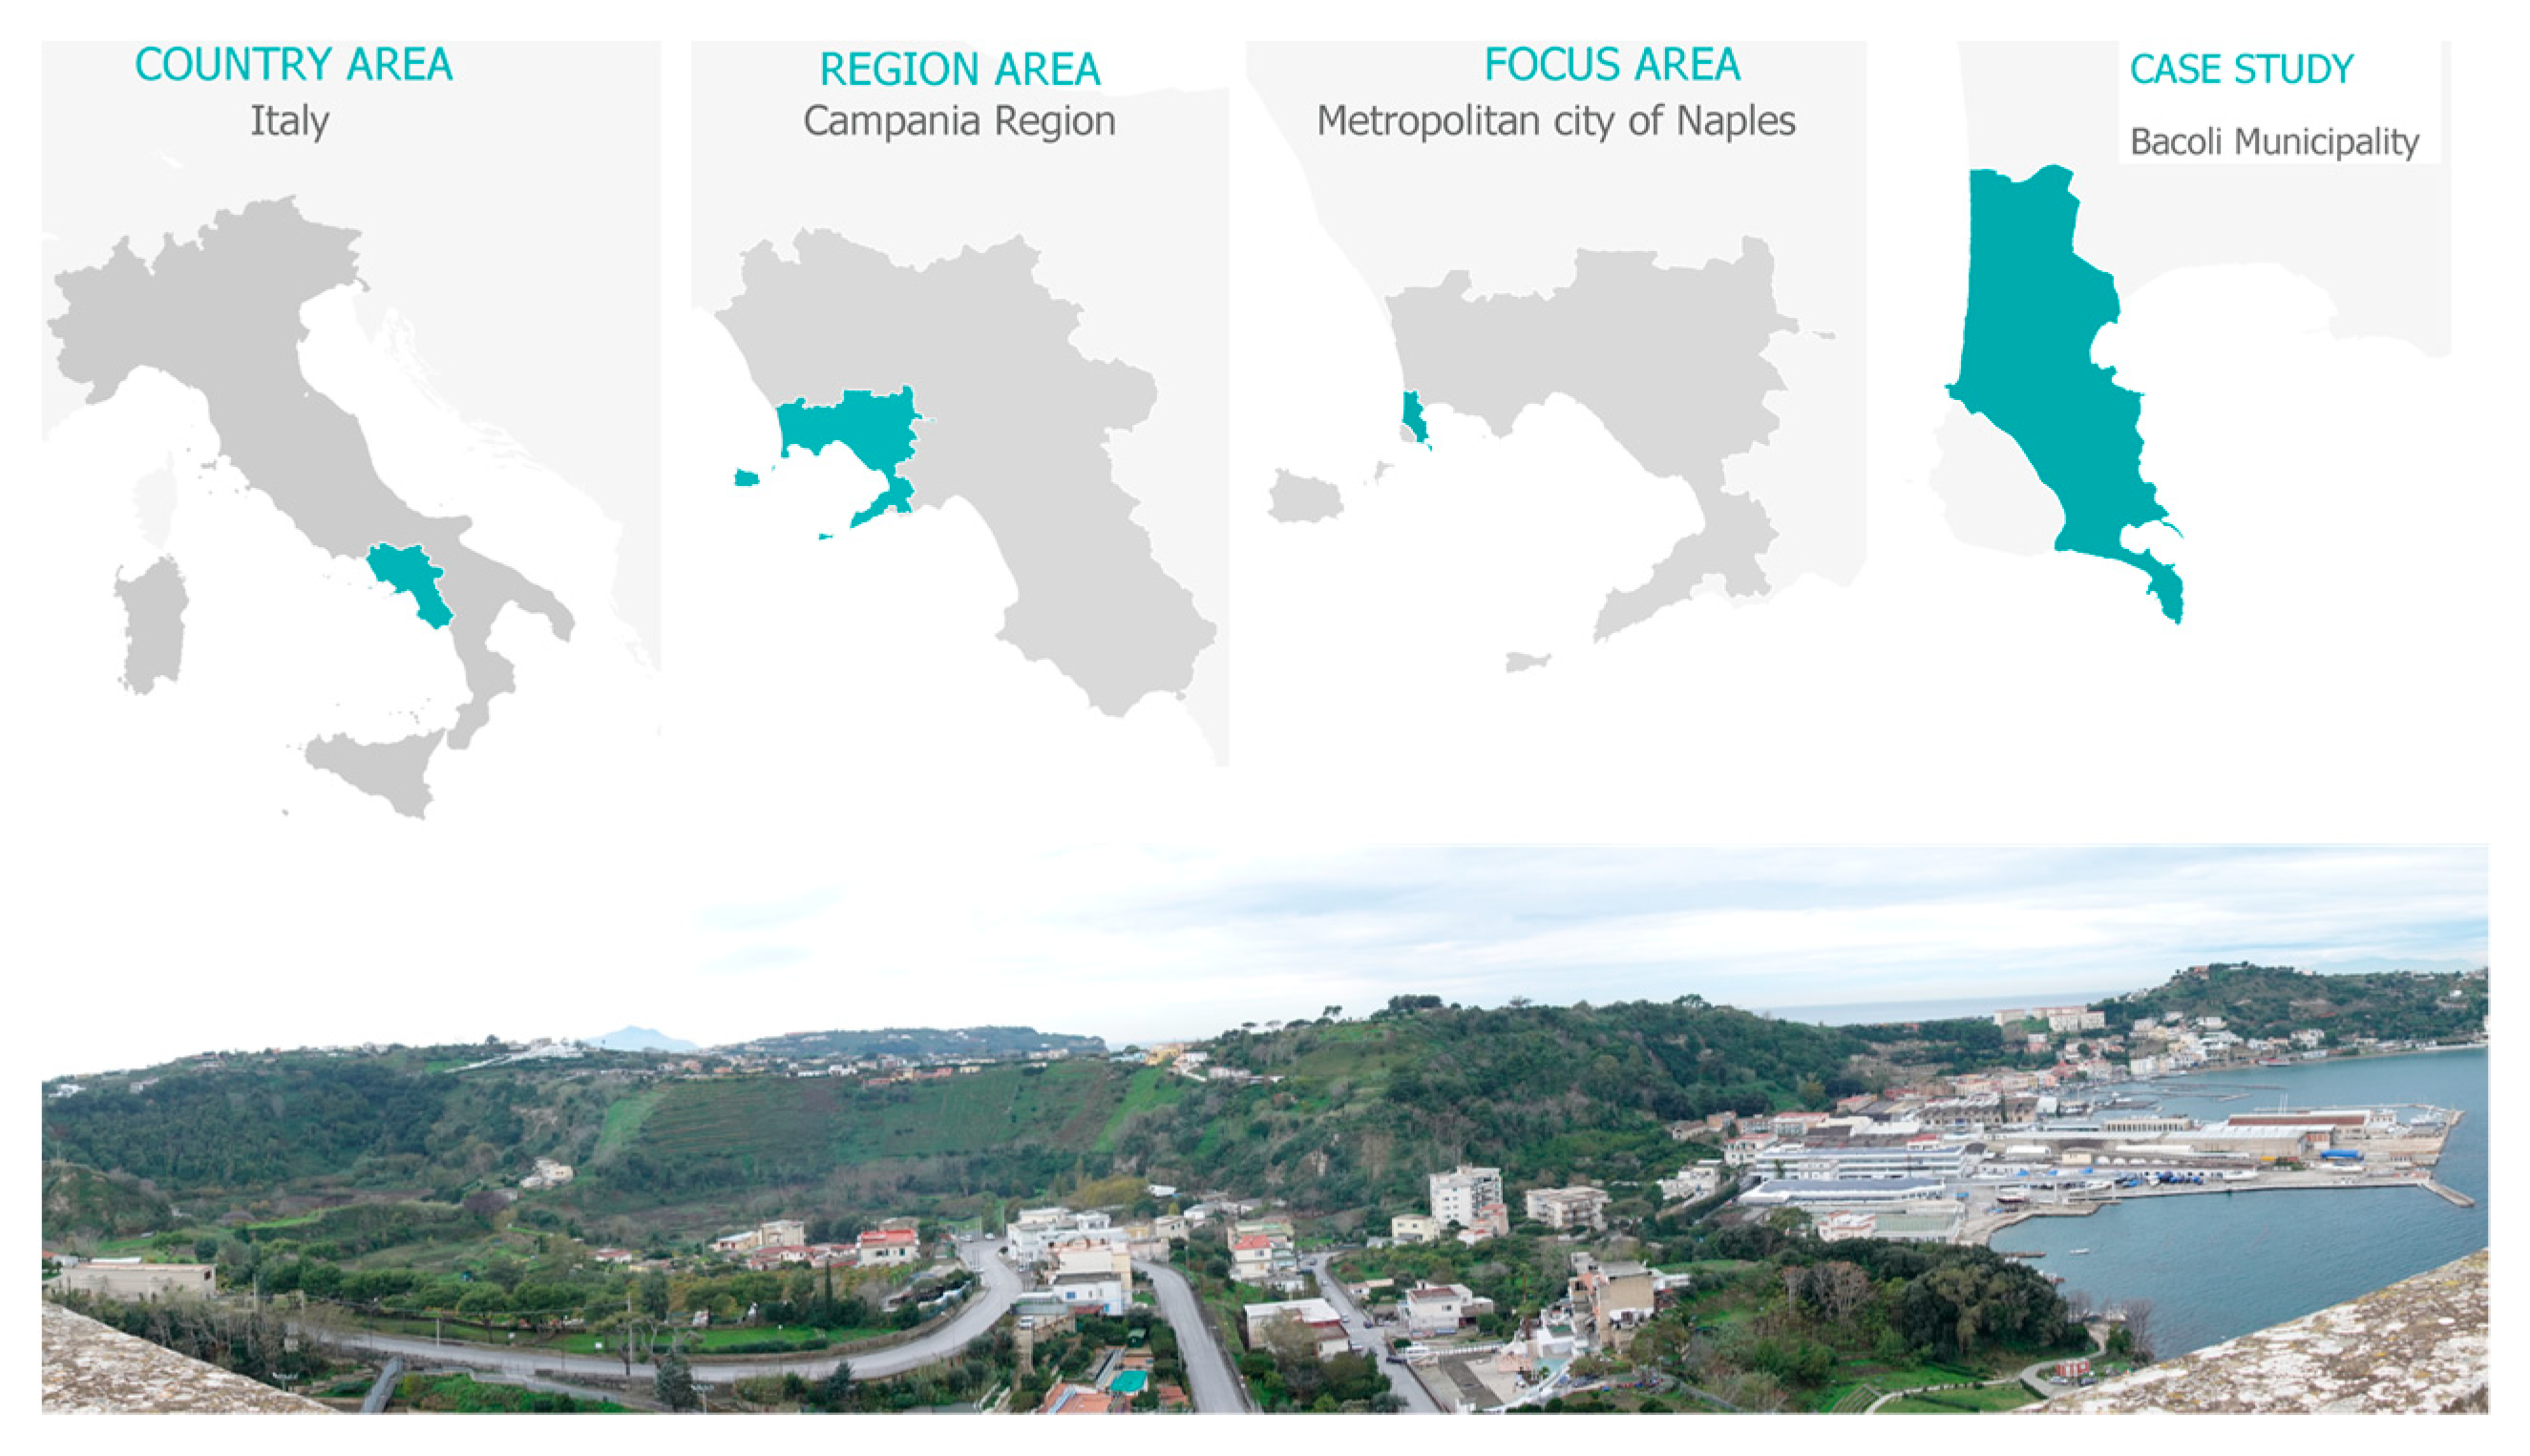
3.2. Study Area
4. Outcomes
4.1. Knowledge and Understanding Phase: The Data Gathering
- How should the context be described?
- How is the context operating?
- Is the context working well?
- How could the context be transformed?
- What differences can the transformation cause?
- How should the context be changed?
- Port development;
- Connectivity with neighbouring landscapes;
- Recovery, regeneration, and reclamation of degraded and abandoned landscape linked to the infrastructure network.
4.2. Selecting and Setting Phase: The Data Analysis
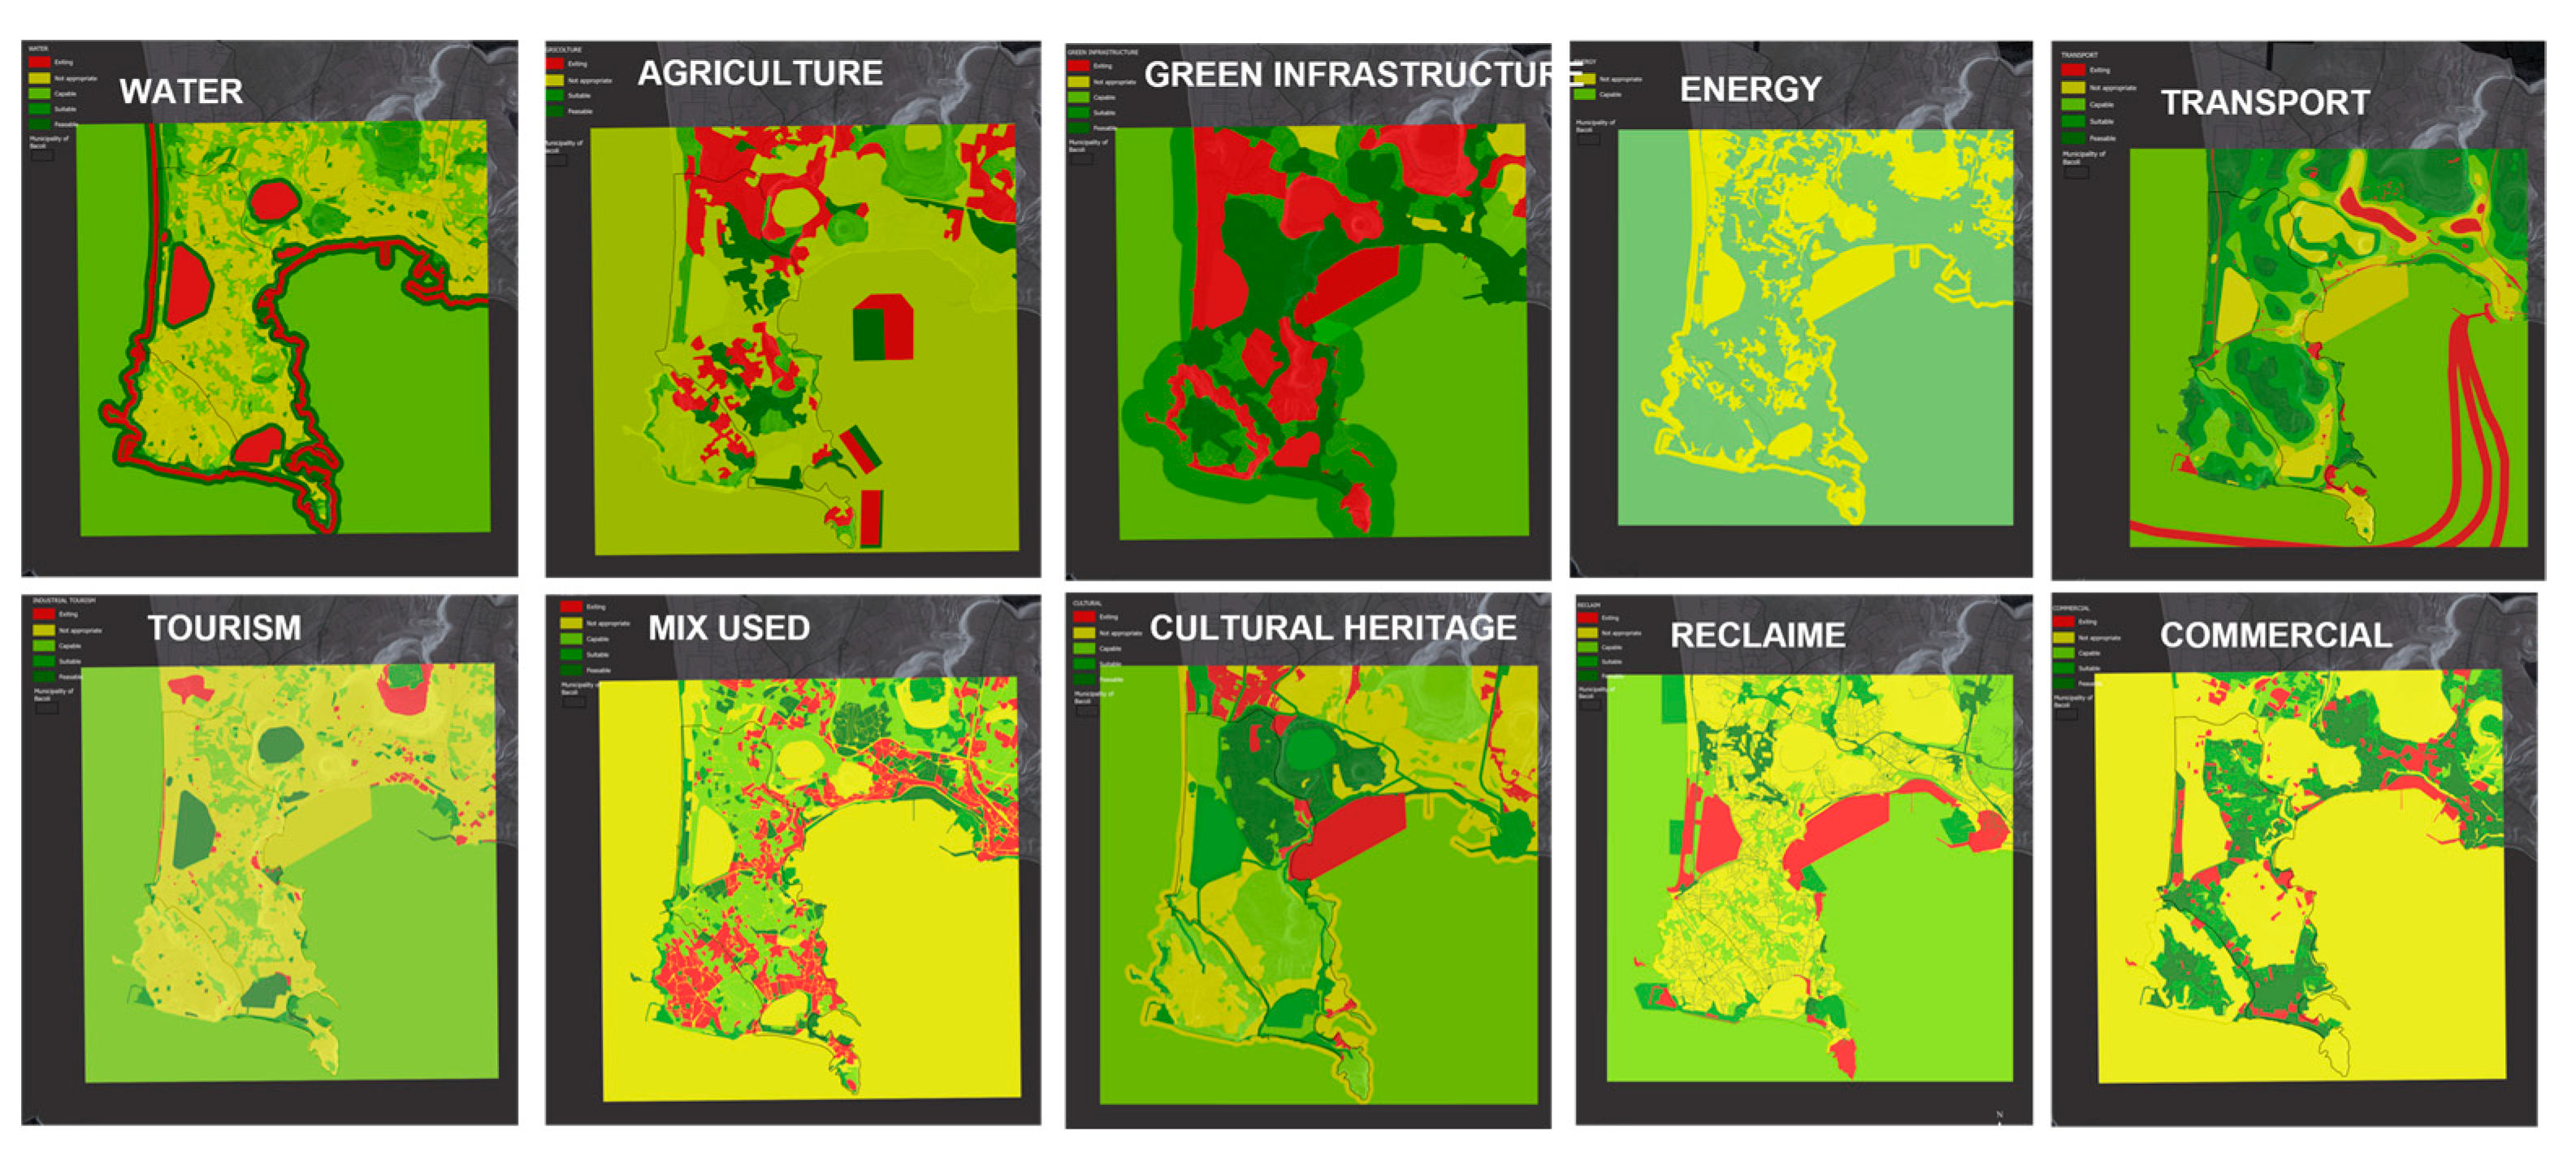
4.2.1. Evaluation Map
- Dark green (Feaseble) represents the highest feasibility for change, as there are prerequisites for new projects;
- Green (Suitable) means suitability for transformation, as the area already has technologies that support the project;
- Light green (Capable) identifies cases where transformations are appropriate unless the means to support interventions are provided;
- Yellow (Not appropriate) identifies cases where changes are inappropriate;
- Red (Existing) represents areas already healthy where the system should not be compromised.
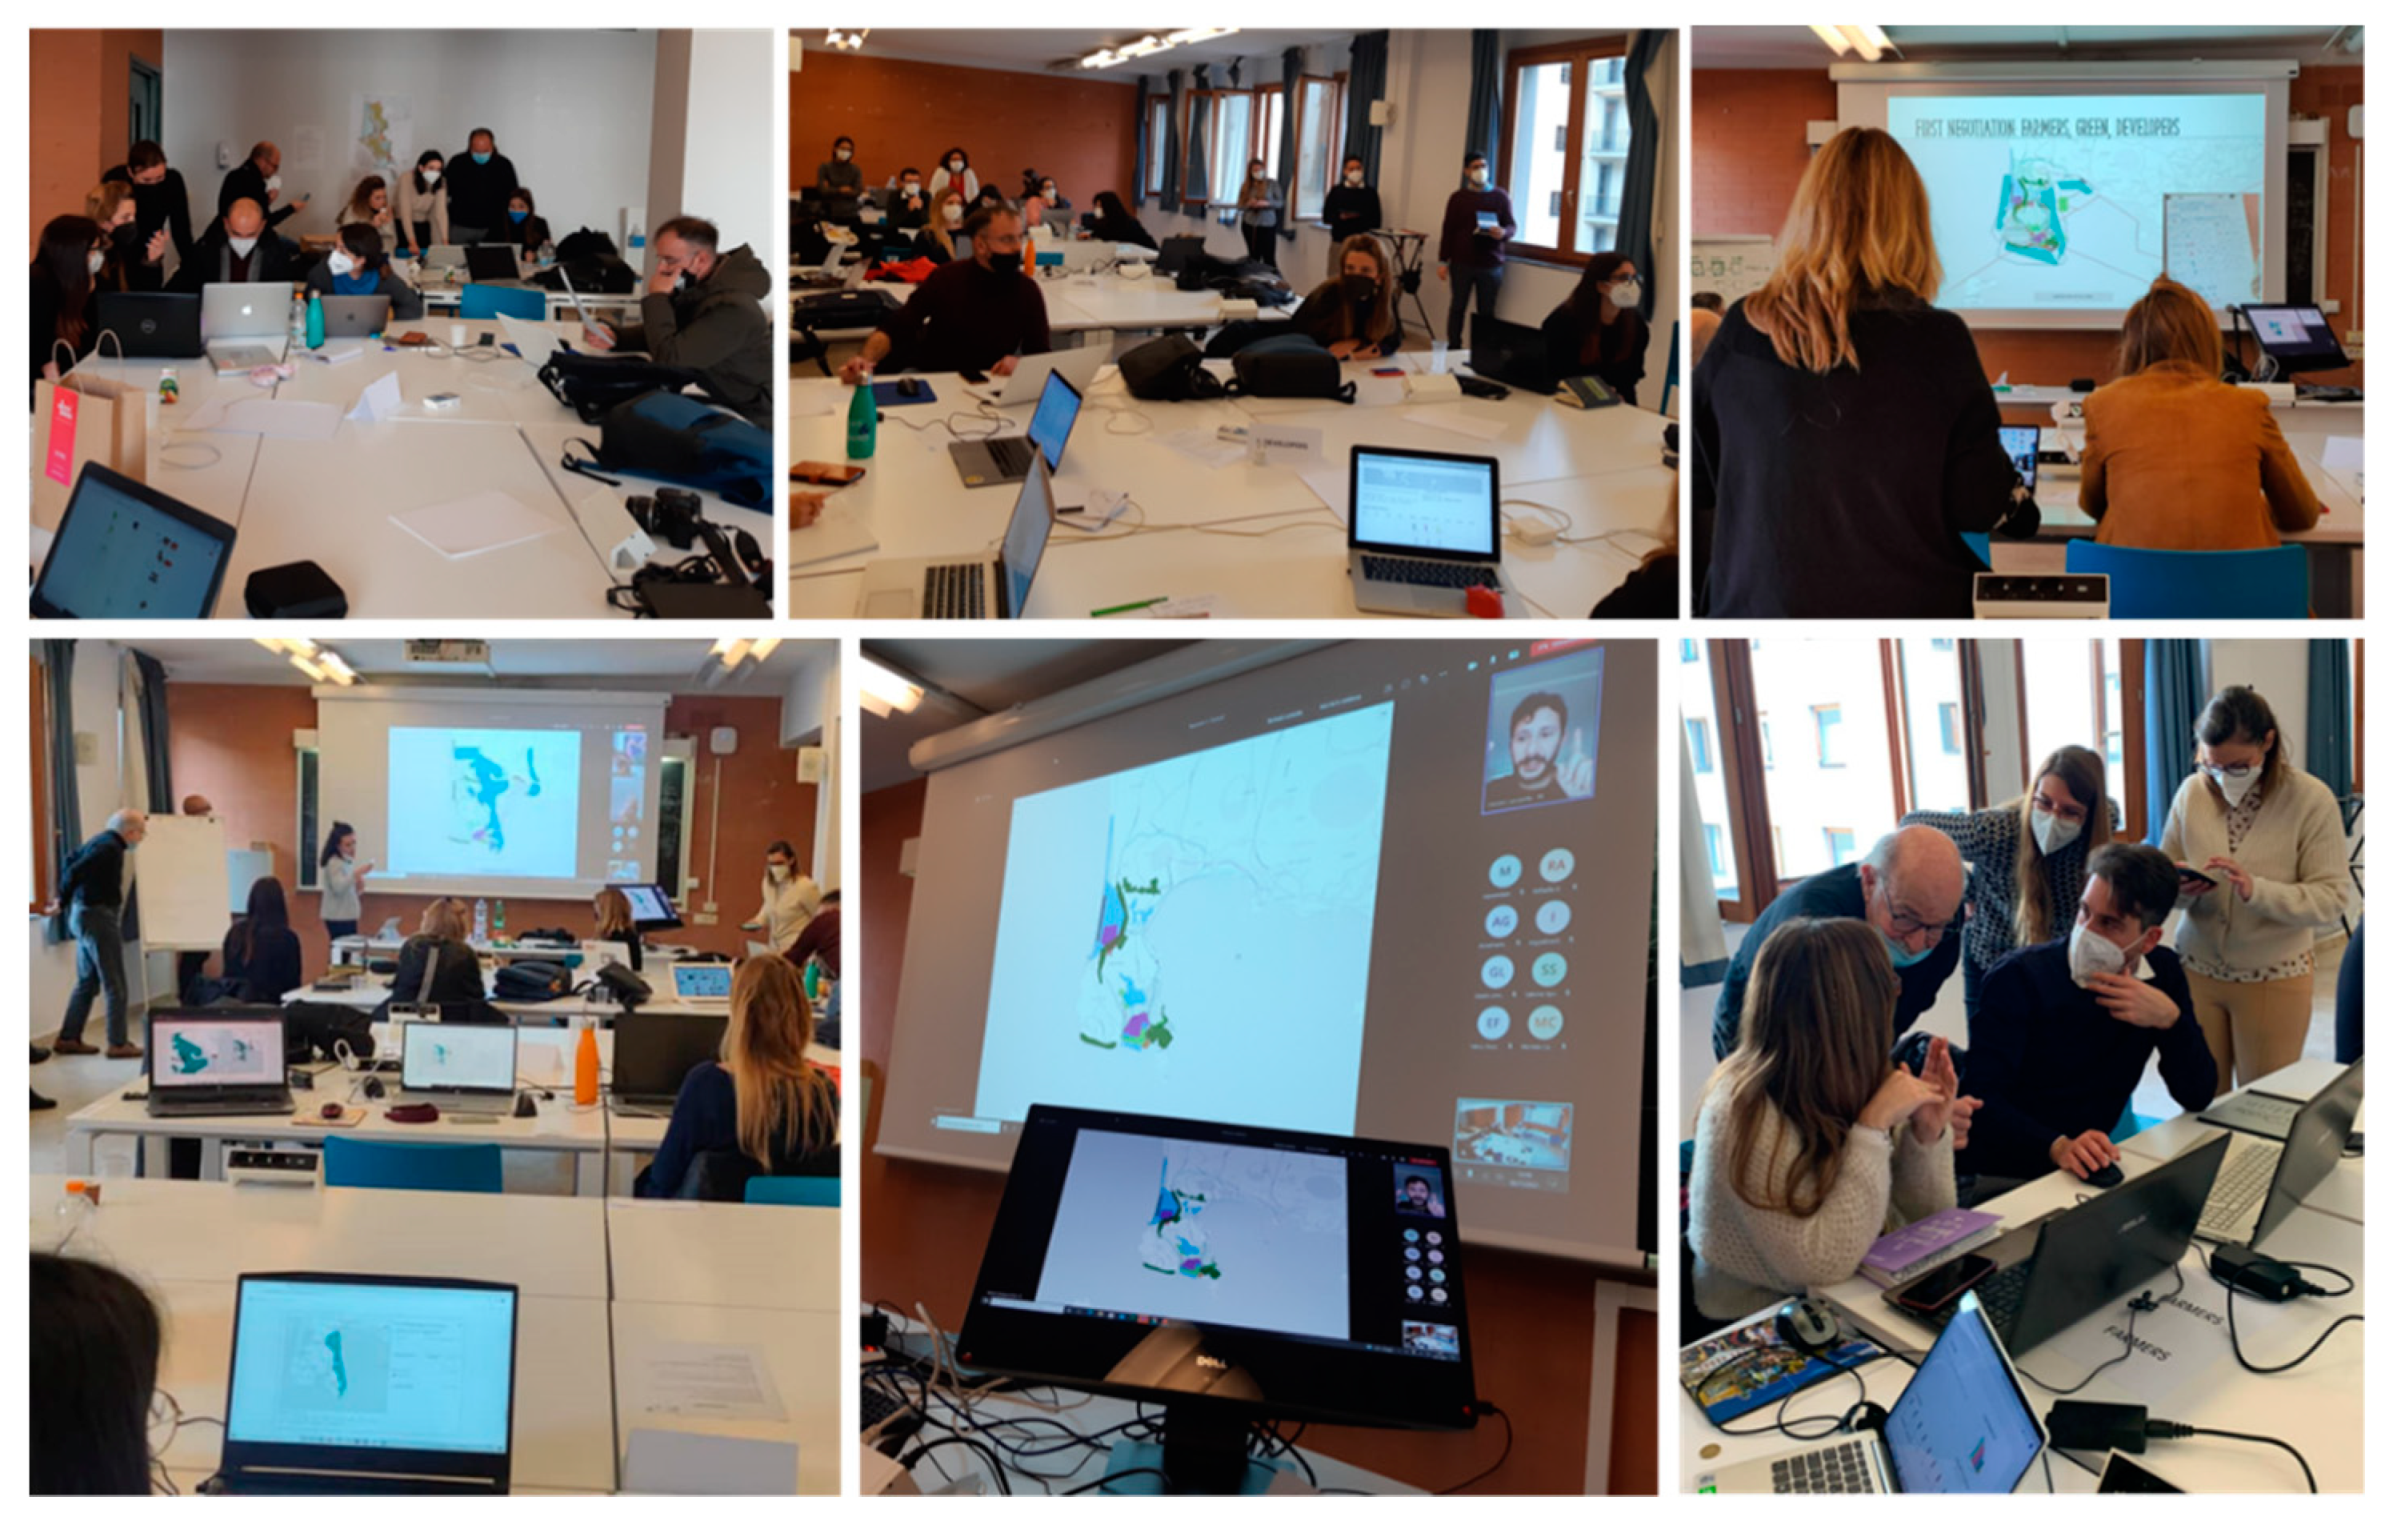
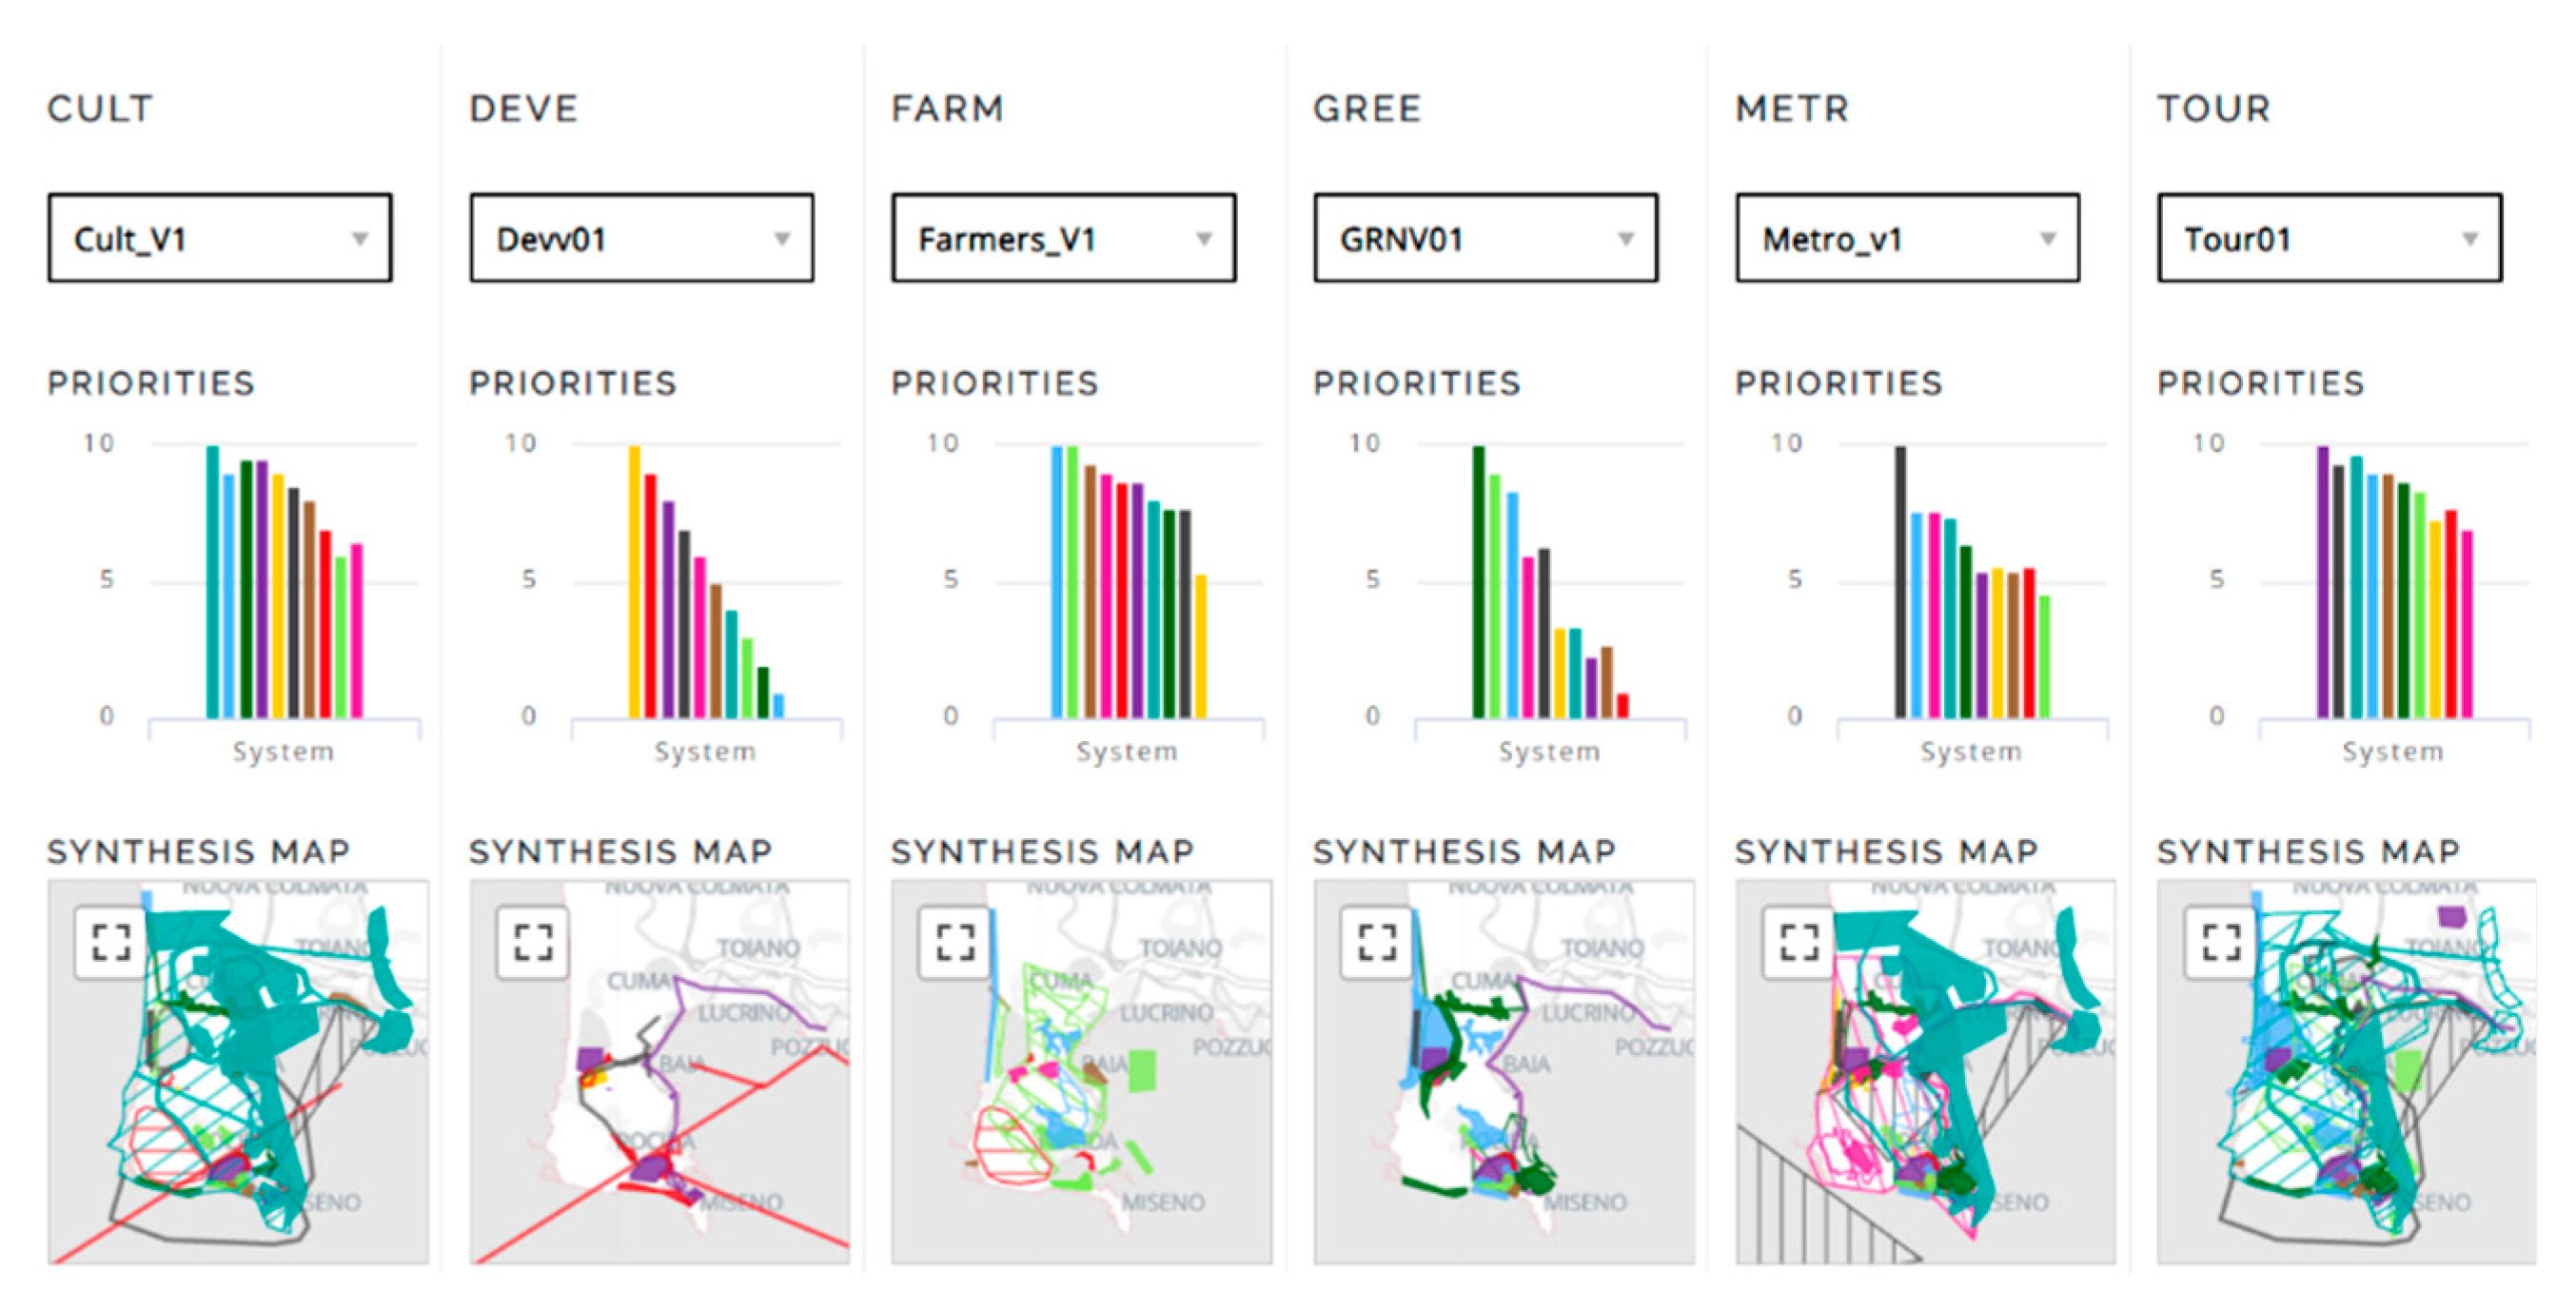
4.3. Structuring and Testing: The Geodesign Workshop
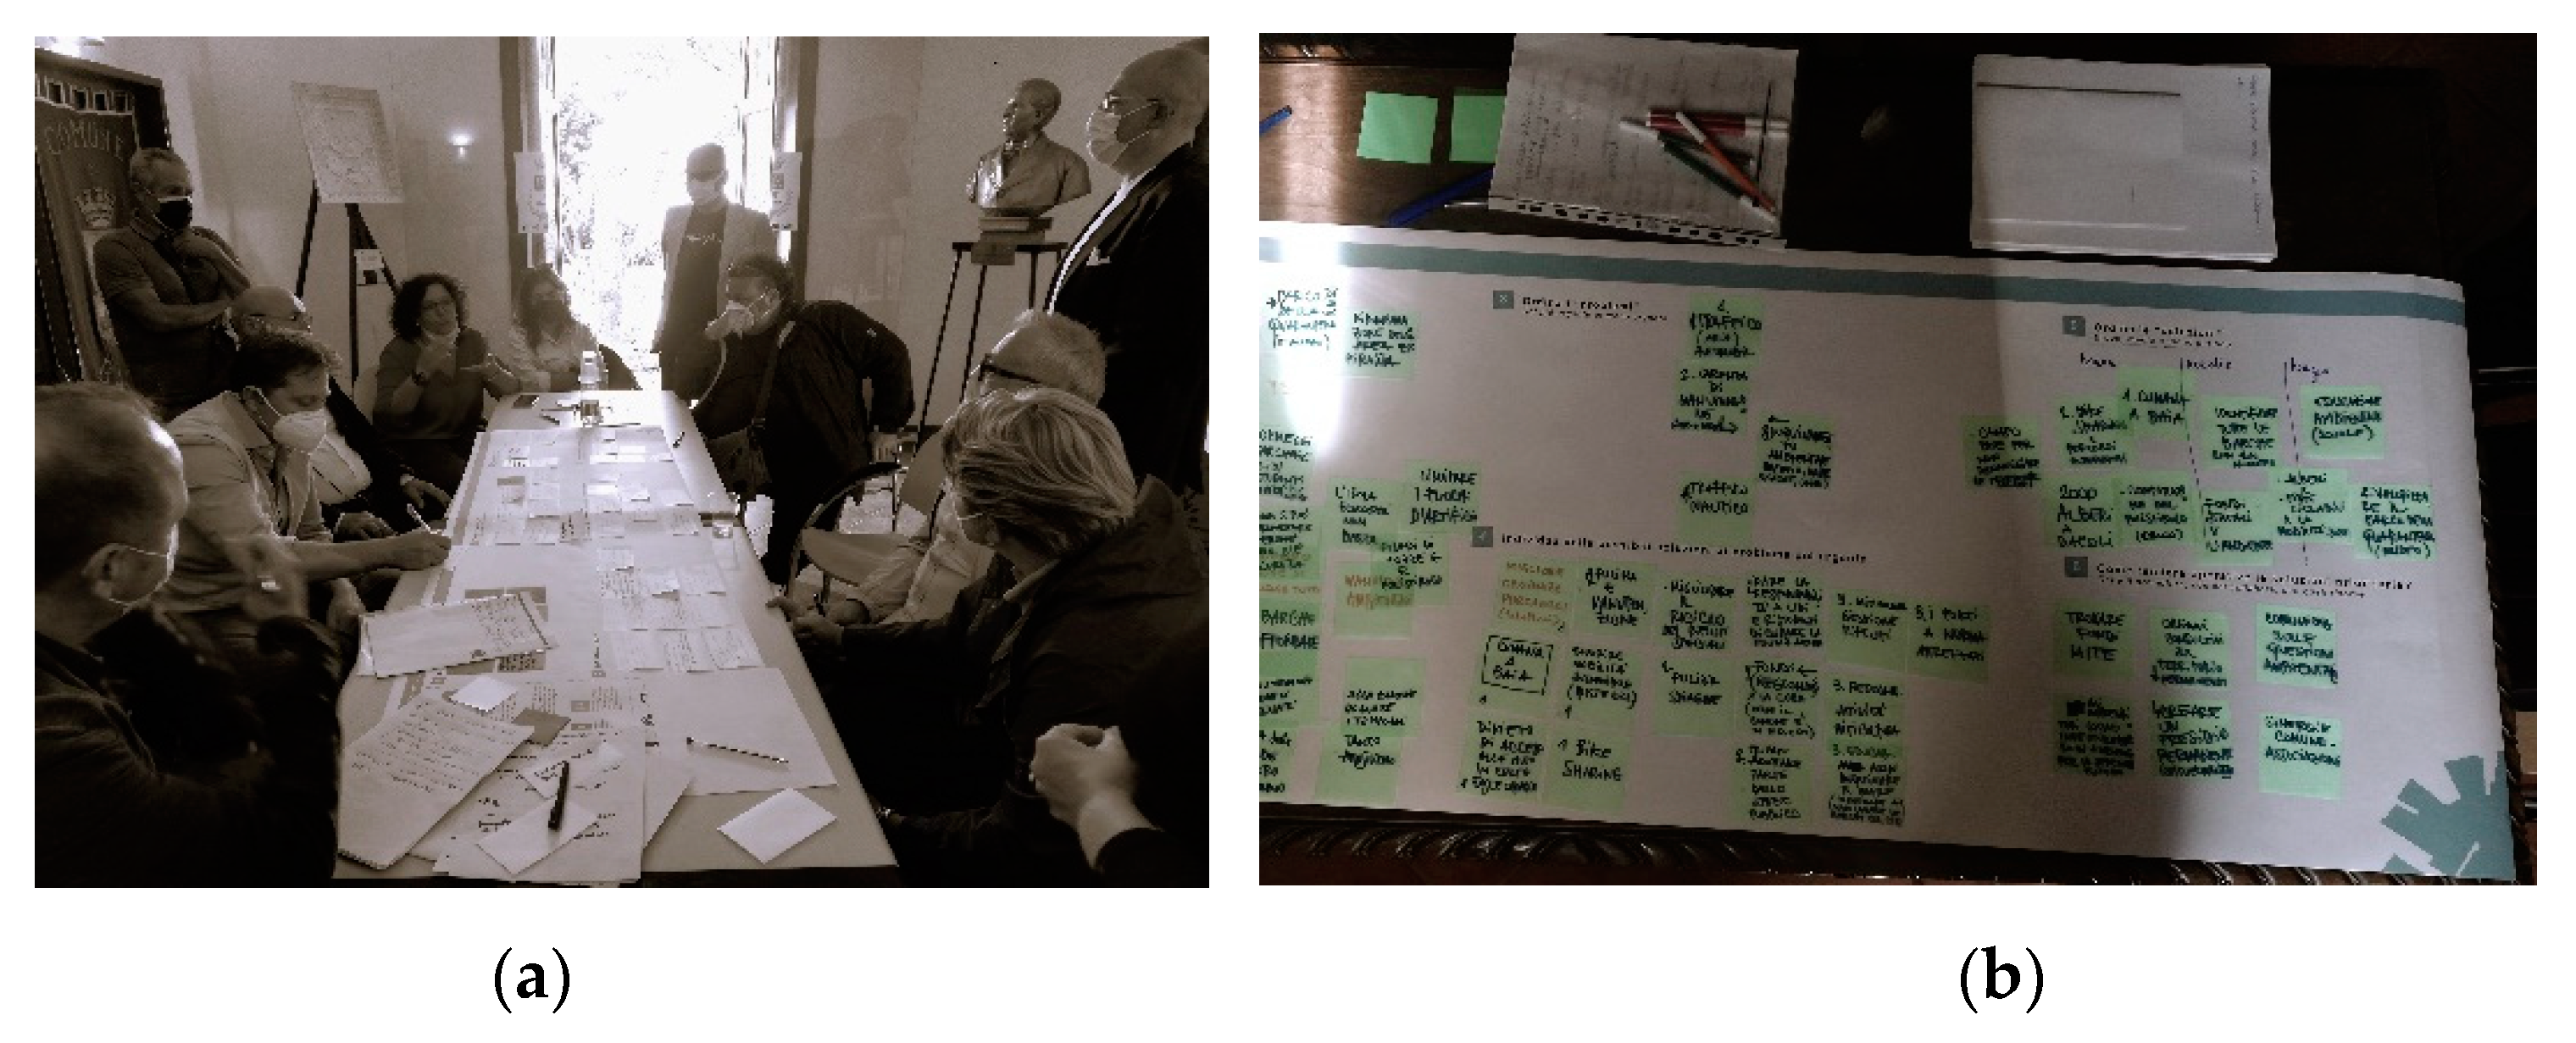
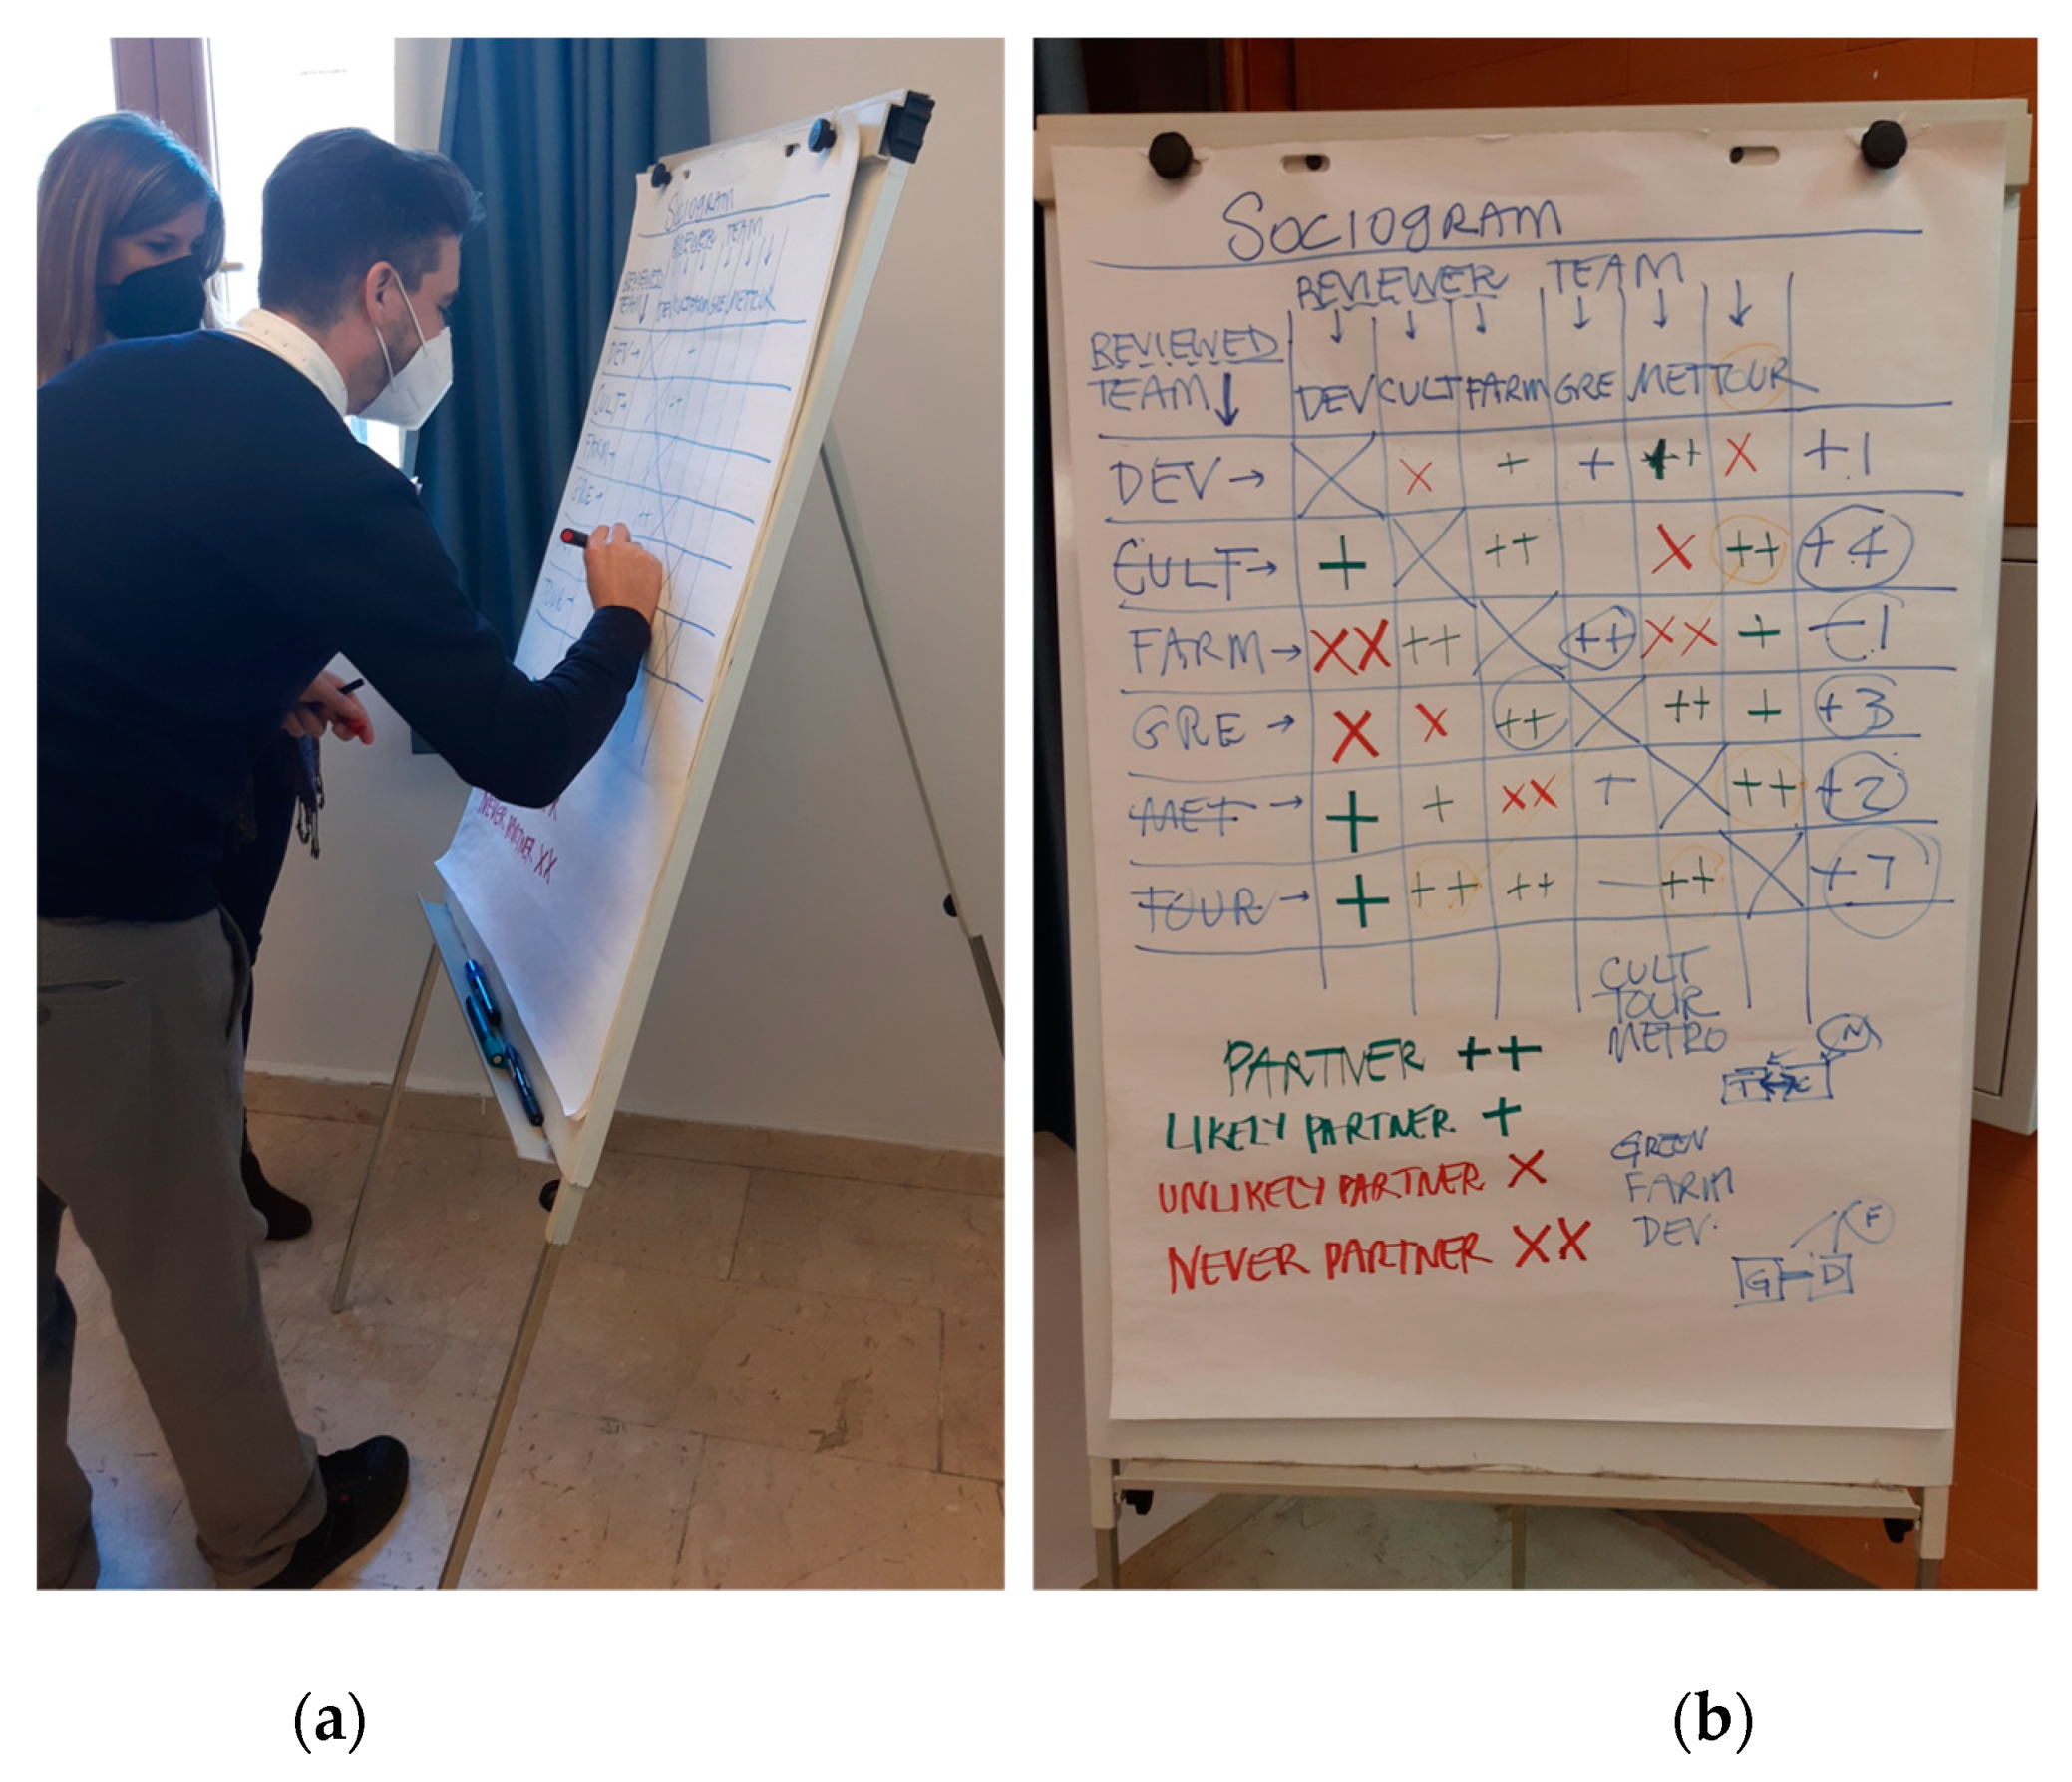
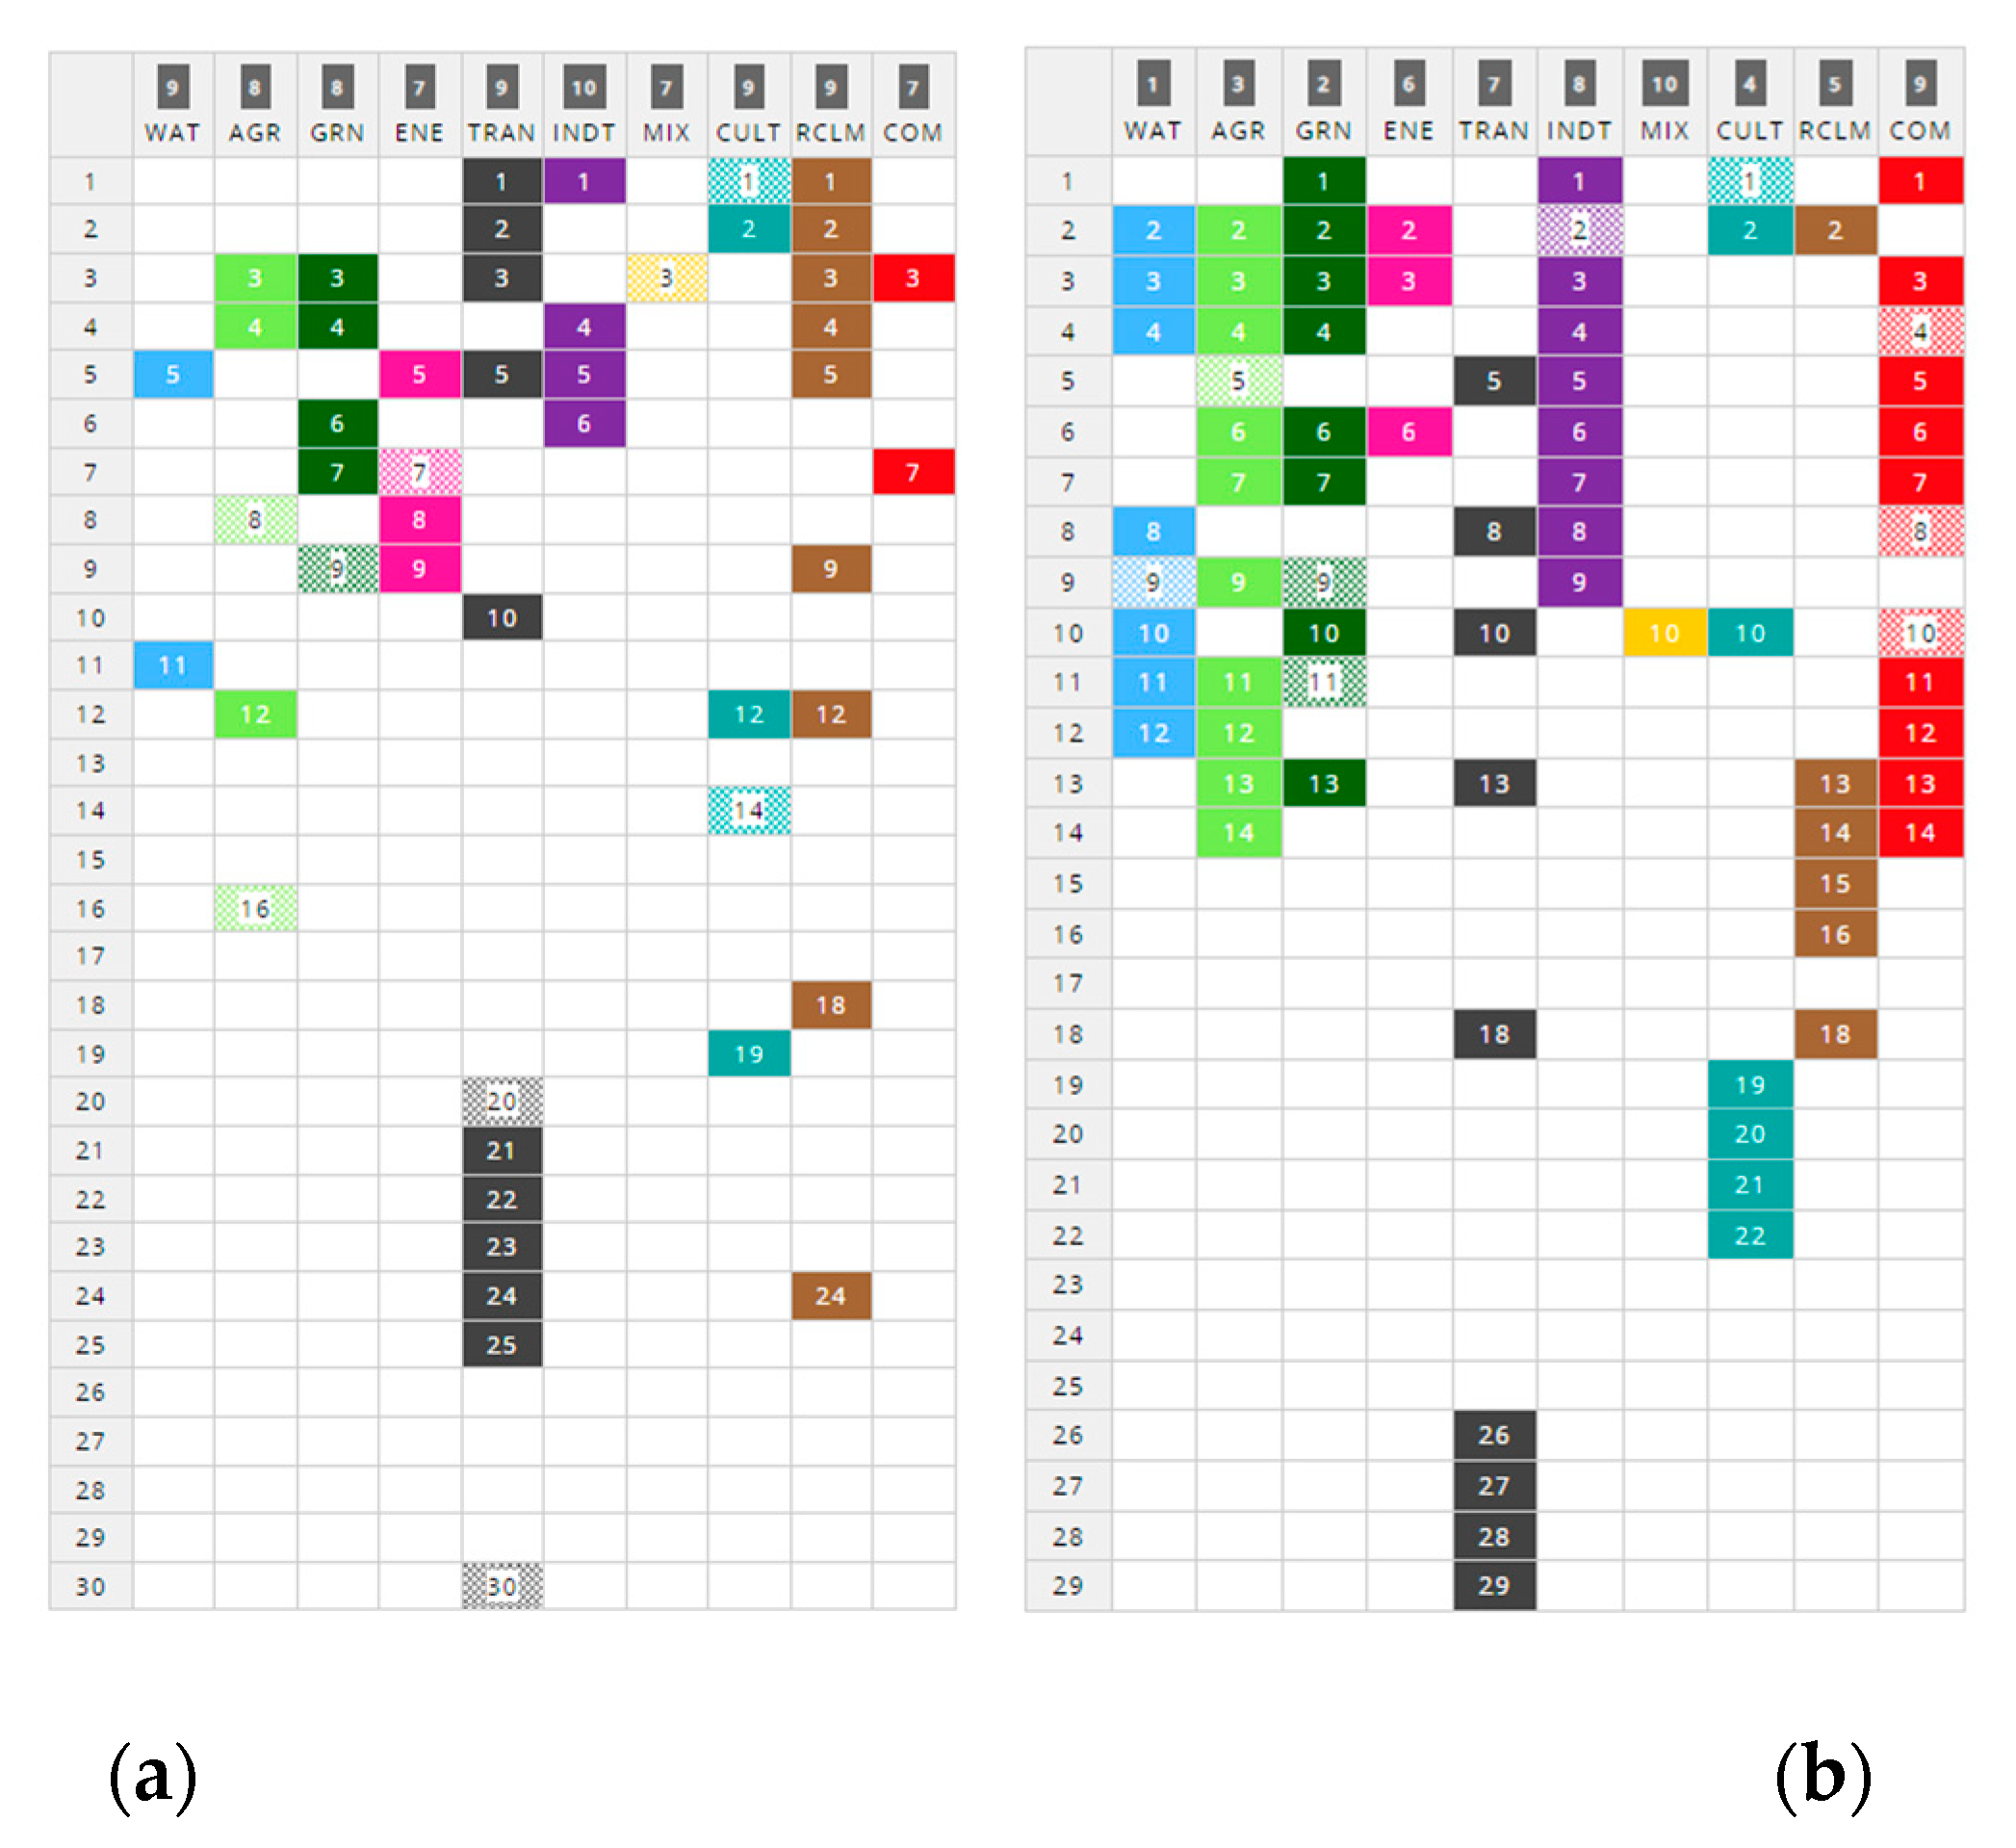
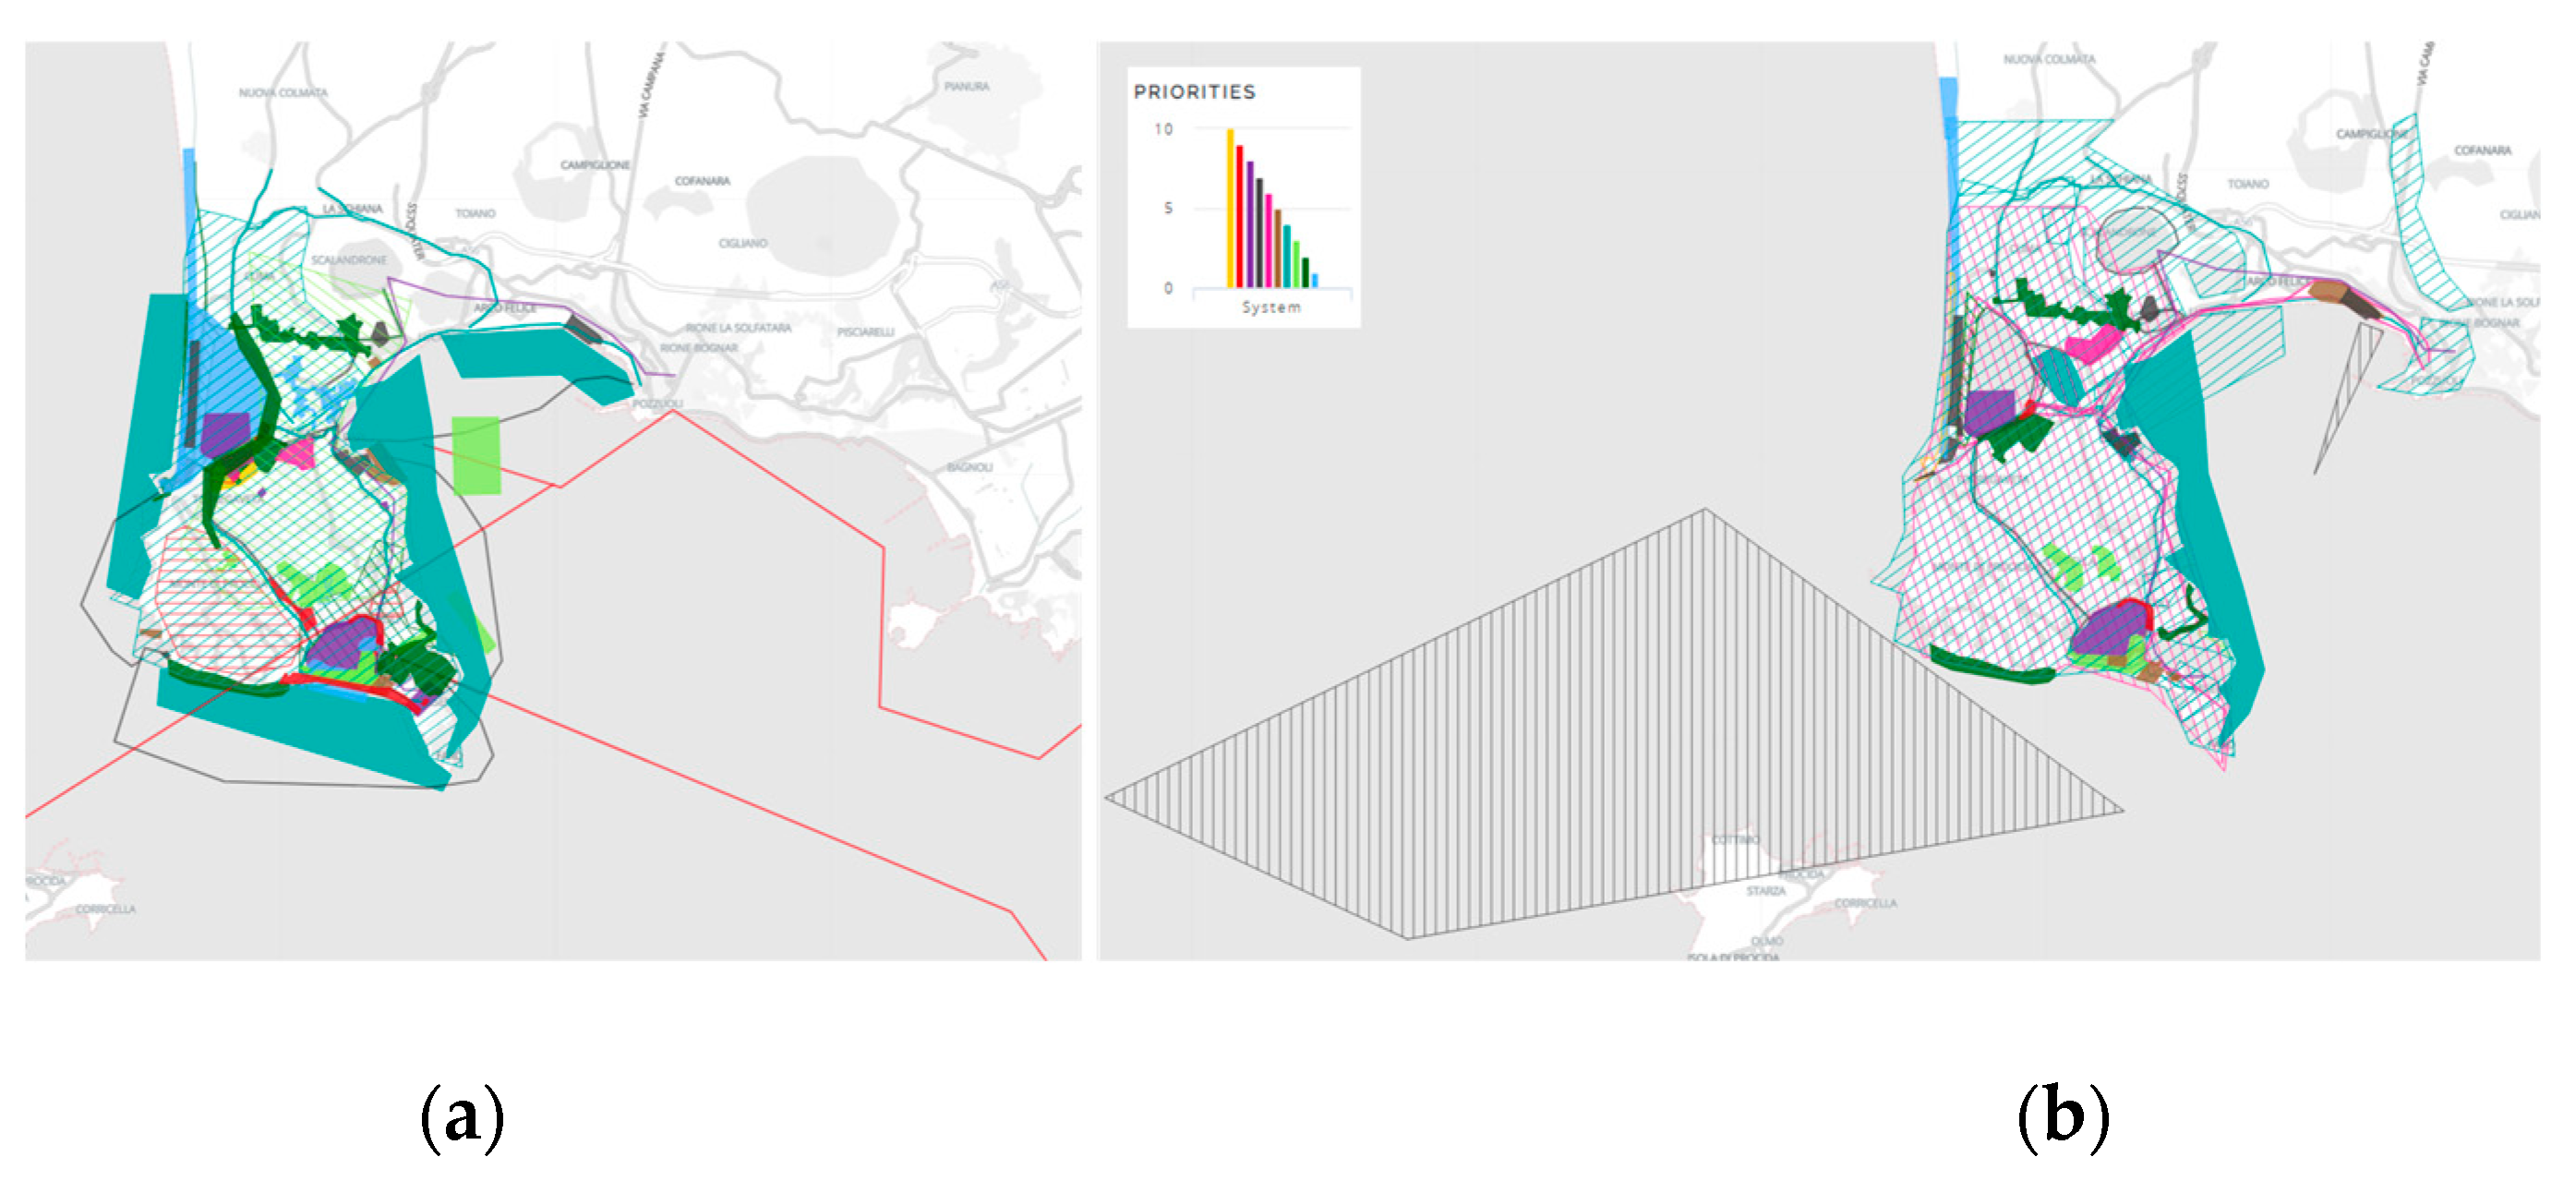
- Tourism, Culture, Metropolitan Teams (TCM);
- Green, Developers, Farmers Team (GDH).
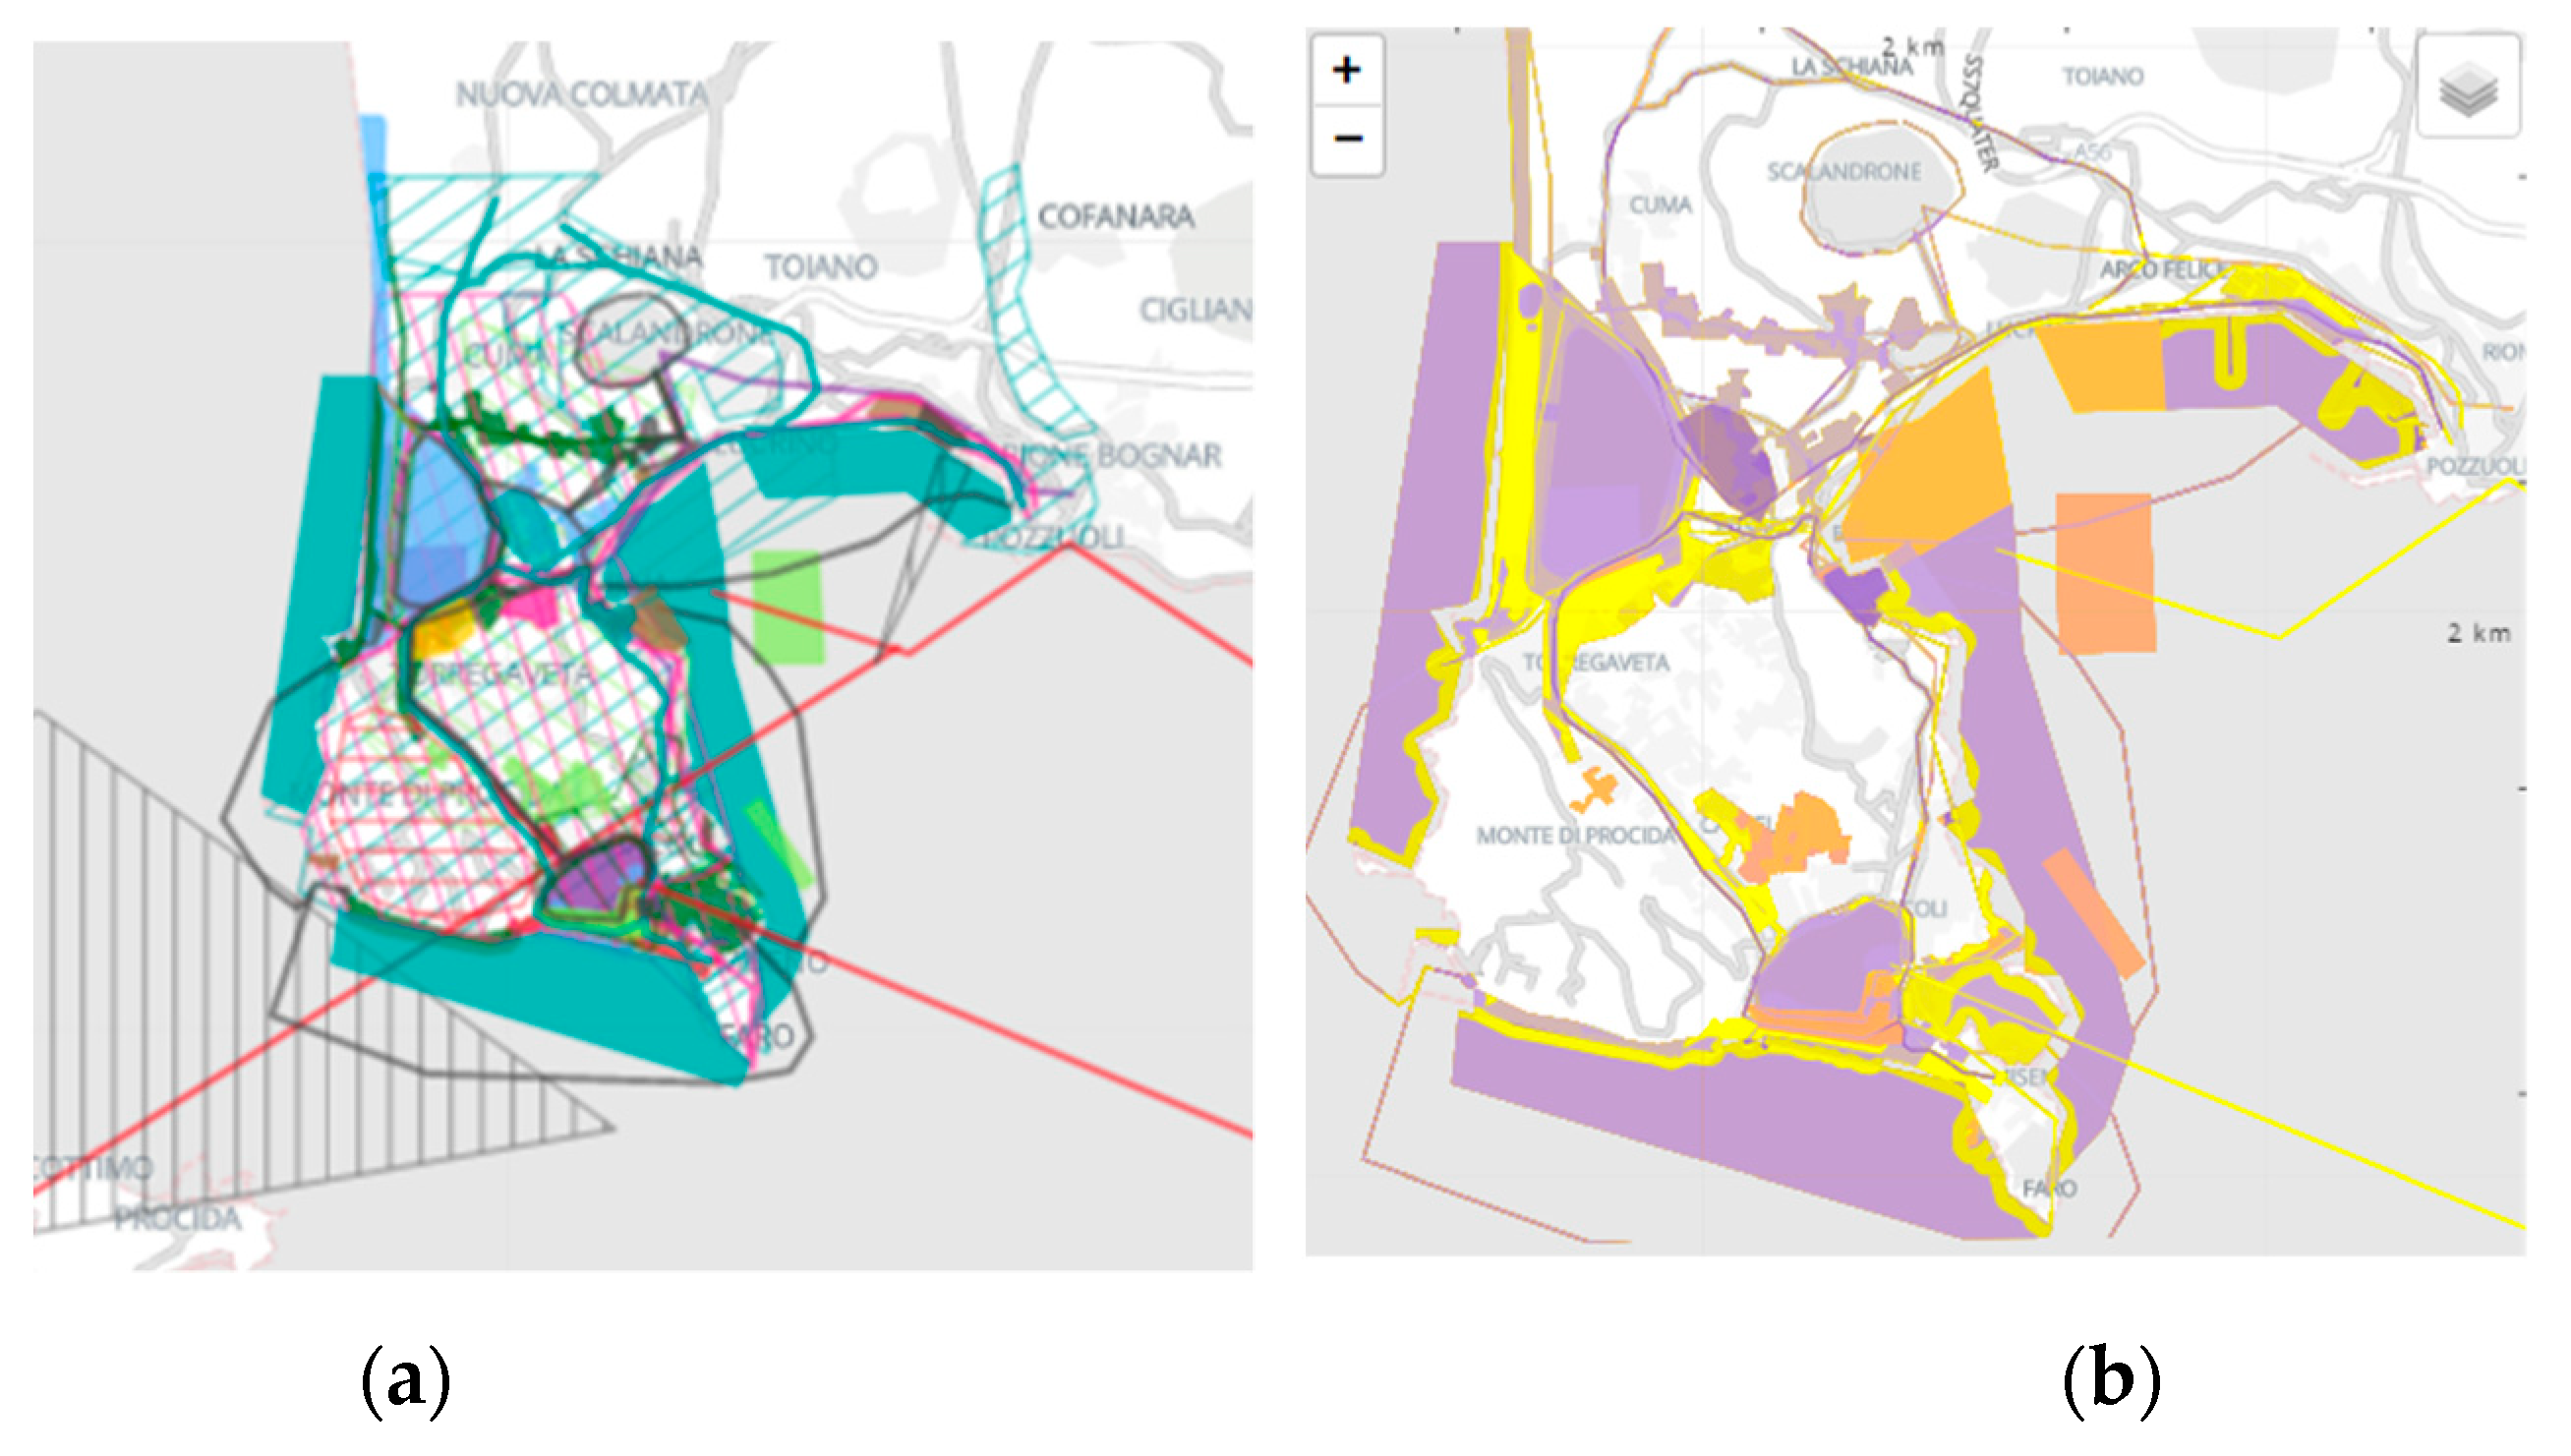
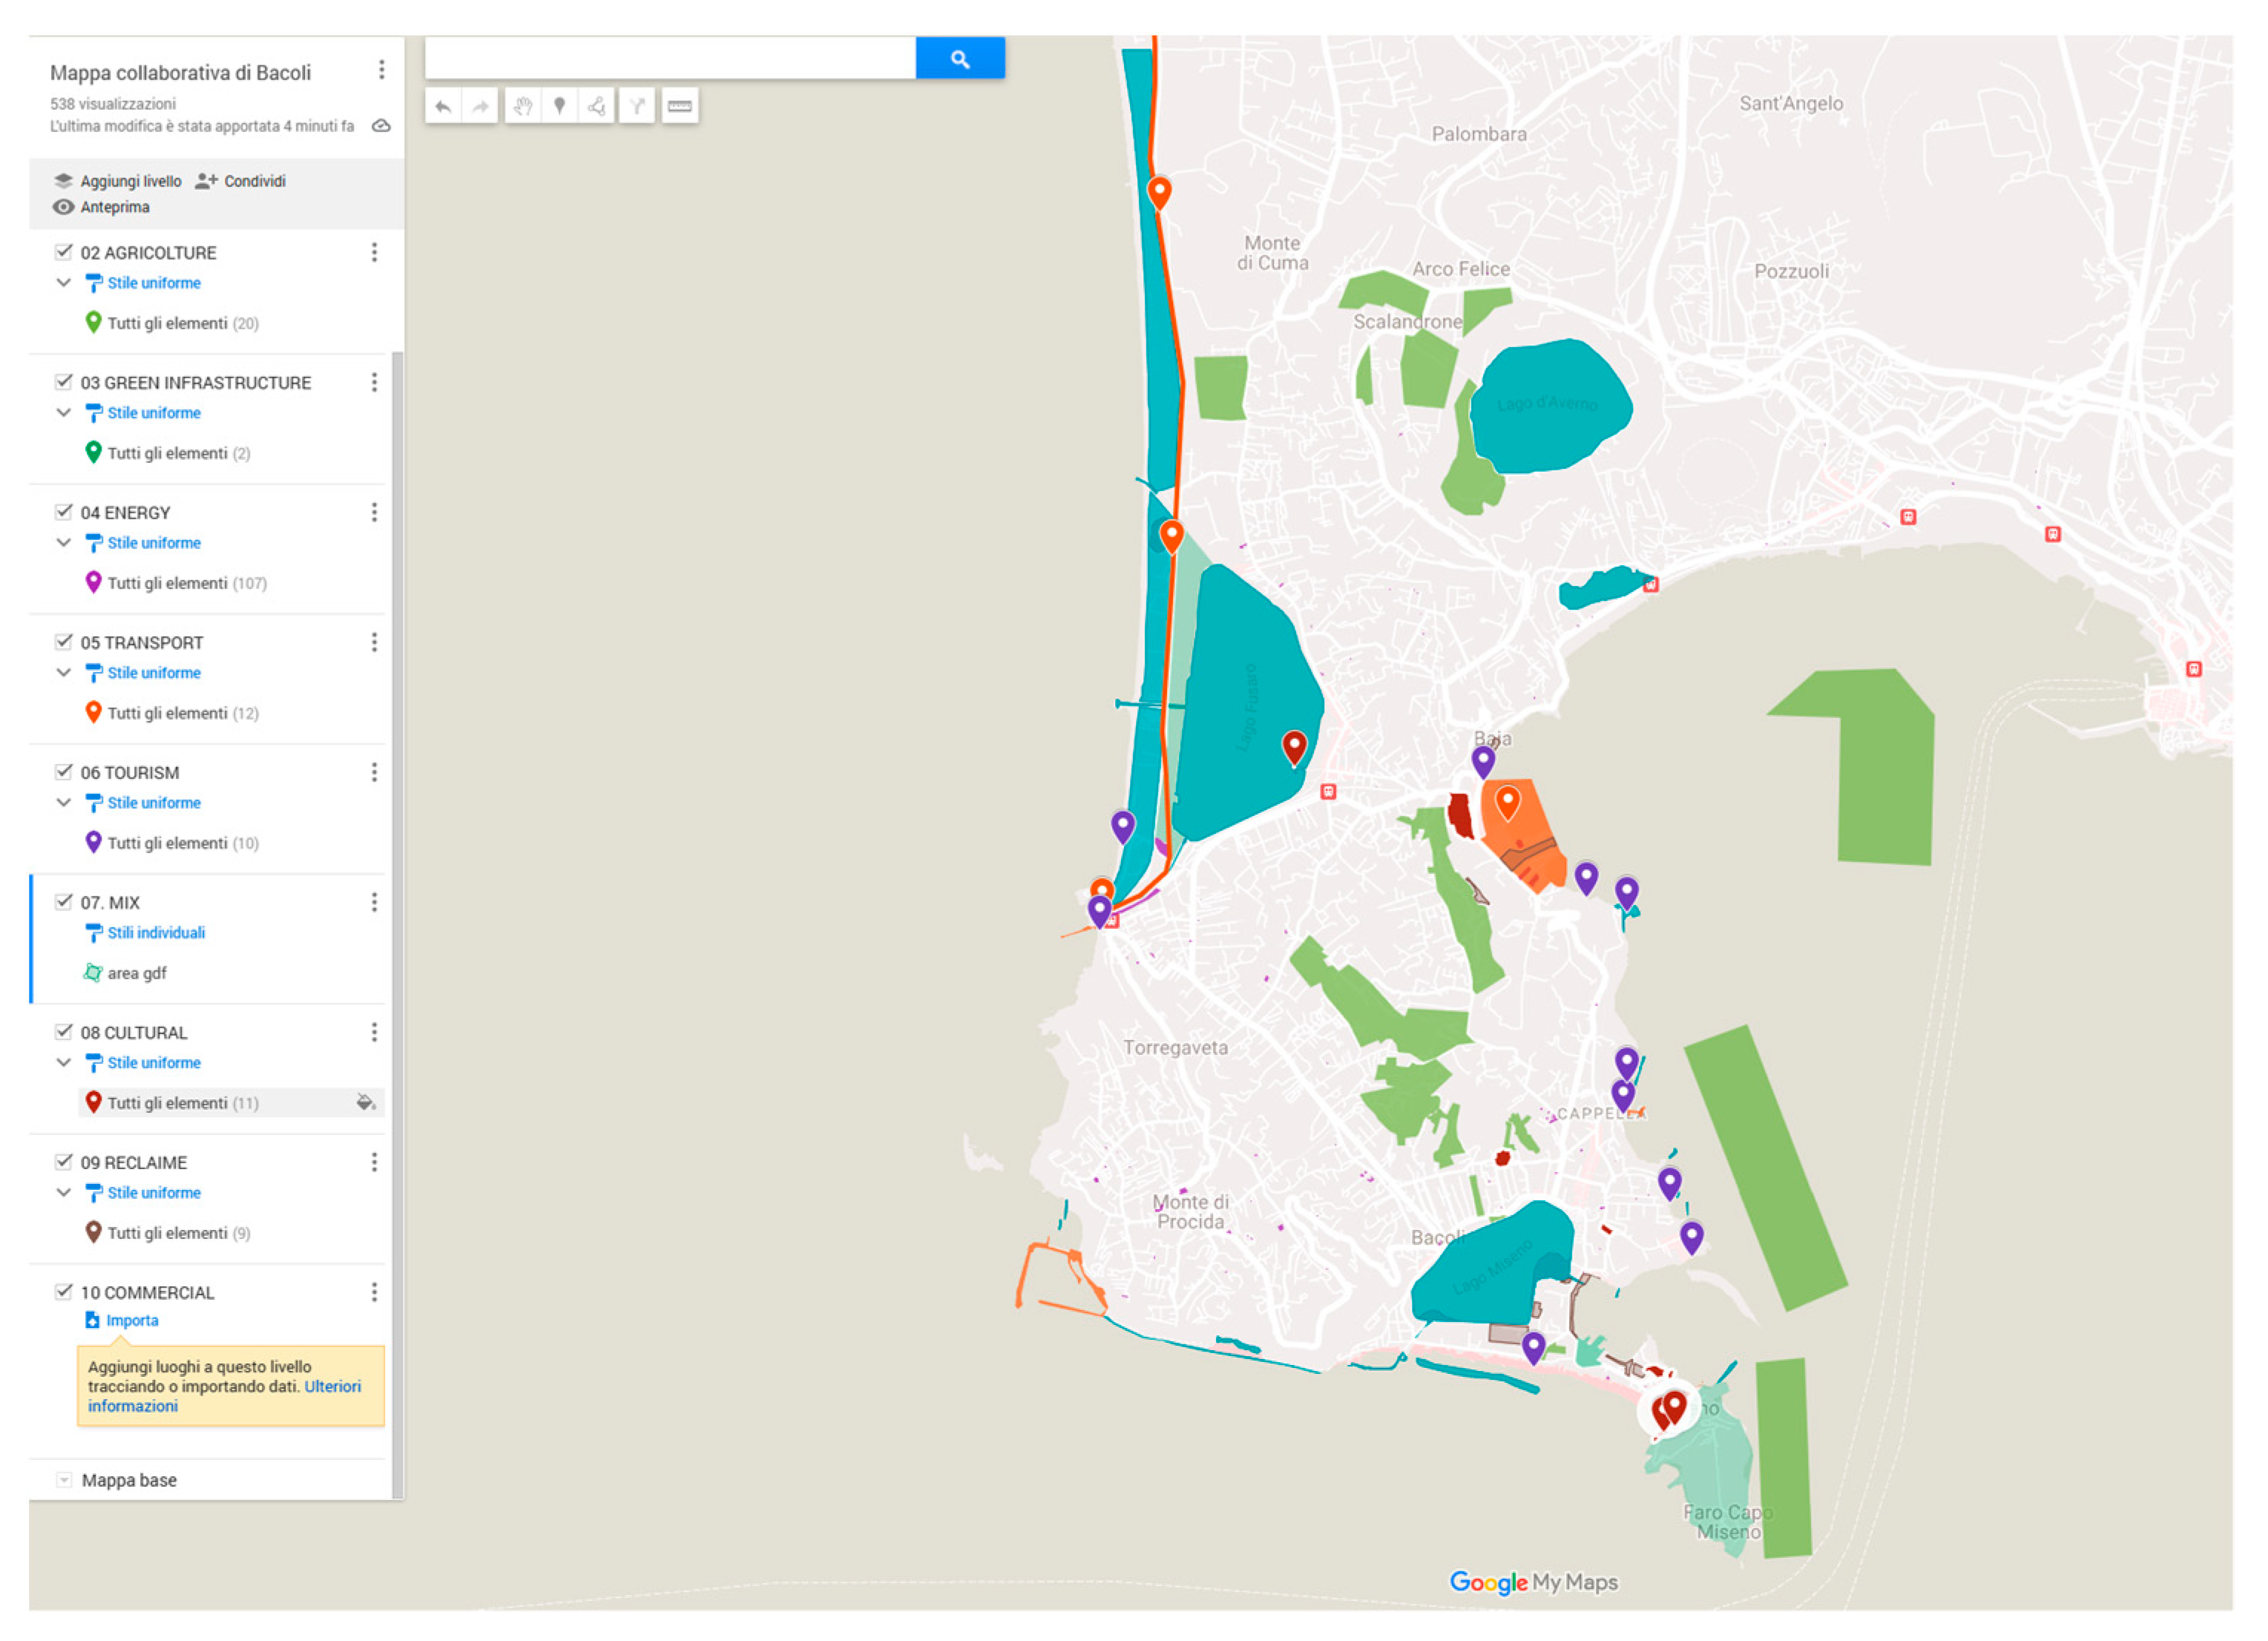
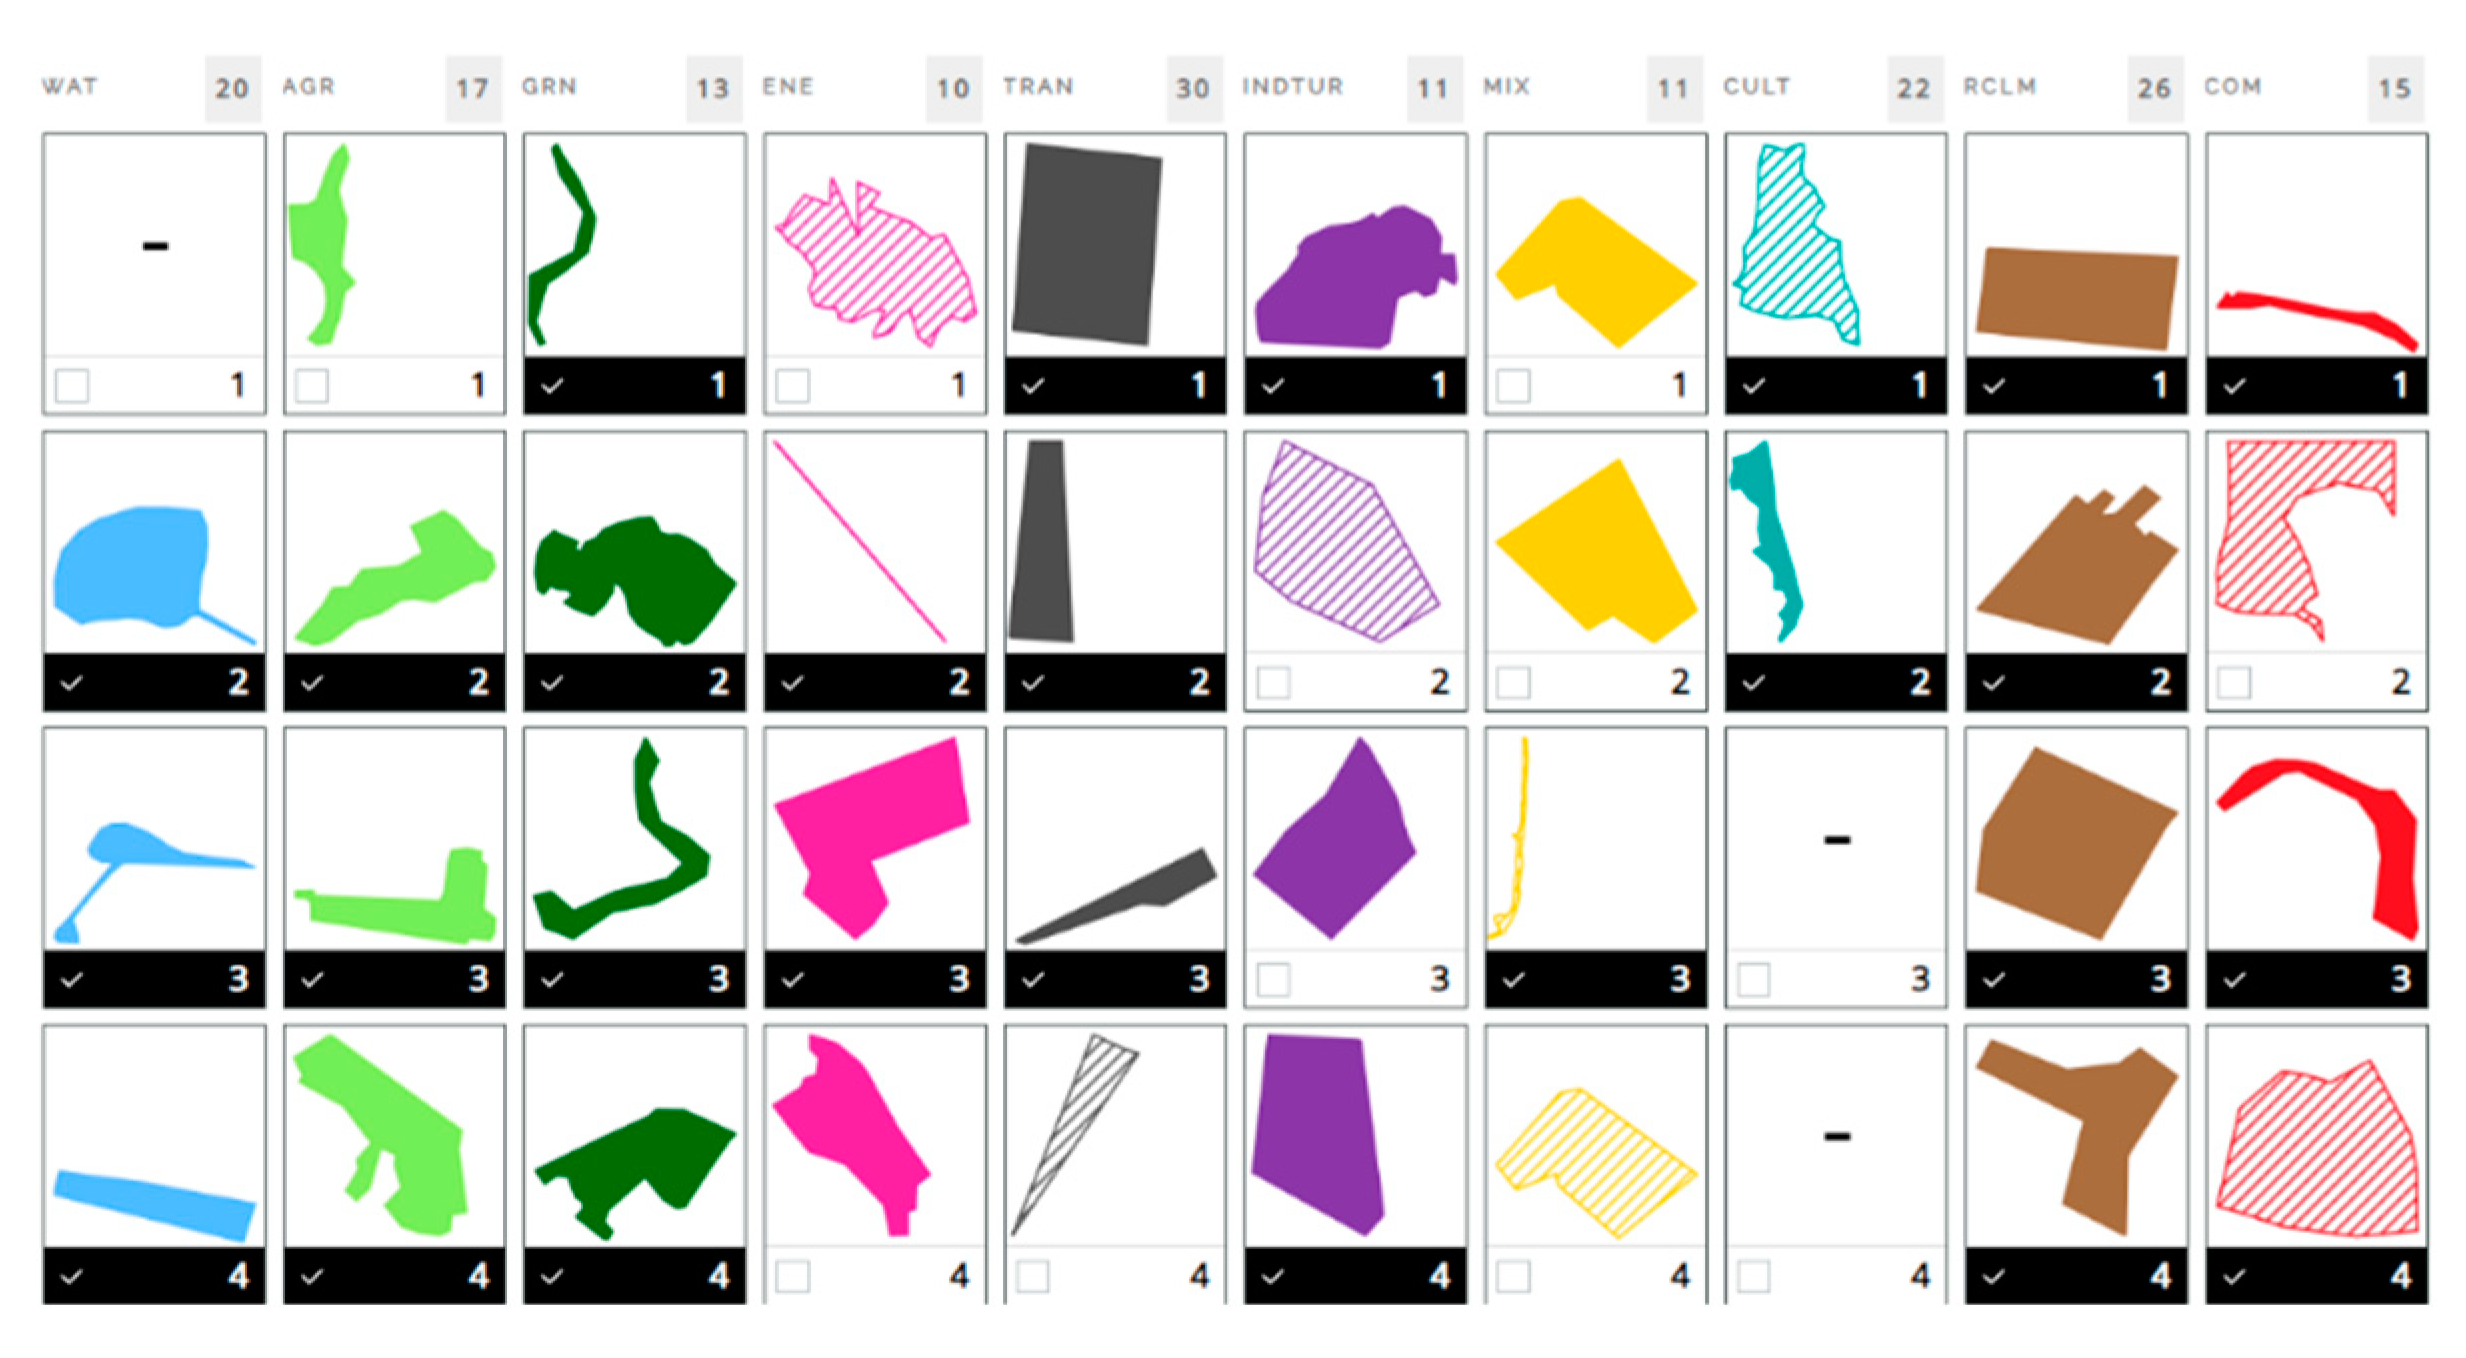
- WRsc: Enhancement and recovery of the Roman theatre and baths area, redevelopment of the theatre compendium area and the former “Pirana area”;
- WRes: Regeneration of stagnant water and enhancement of the “Grotte dell’Acqua” thermal water springs. Reclamation of marine waters and hydrographic network
- WRhub: Reconversion of the former Pozzuoli shipyards and Miseno military areas. Regeneration of the former “Mericraft area.”
5. Discussion and Closing Remarks
Author Contributions
Funding
Data Availability Statement
Acknowledgements
Conflicts of Interest
References
- Marin, J.; De Meulder, B. Interpreting Circularity. Circular City Representations Concealing Transition Drivers. Sustainability (Switzerland) 2018, 10. [Google Scholar] [CrossRef]
- Cerreta, M.; di Girasole, E.G.; Poli, G.; Regalbuto, S. Operationalising the Circular City Model for Naples’ City-Port: A Hybrid Development Strategy. Sustainability 2020, 12, 2927. [Google Scholar] [CrossRef]
- Bosone, M.; Nocca, F.; Girard, L.F. The Circular City Implementation: Cultural Heritage and Digital Technology. 2021. [CrossRef]
- Fusco Girard, L.; Nijkamp, P. Le Valutazioni per Lo Sviluppo Sostenibile Della Città e Del Territorio; FrancoAngeli, Ed.; Napoli, 1997.
- Girard, L.F.; Nocca, F. Moving towards the Circular Economy/City Model: Which Tools for Operationalising This Model? Sustainability (Switzerland) 2019, 11, 1–48. [Google Scholar] [CrossRef]
- Amenta, L.; Timmeren, A. Van Beyond Wastescapes: Towards Circular Landscapes. Addressing the Spatial Dimension of Circularity through the Regeneration of Wastescapes. Sustainability 2018, 10, 4740. [Google Scholar] [CrossRef]
- Cerreta, M., Inglese, P., Mazzarella, C. Wastescapes Sustainable Management: Enabling Contexts for Eco-Innovative Solutions. GAR 2019.
- Geldermans, B. REPAiR: REsource Management in Peri-Urban AReas: Going Beyond Urban Metabolism. TU Delft University 2019, 289. [Google Scholar]
- Russo, M.; Libera Amenta; Attademo, A.; Maria, C.; Formato, E.; Remøy, H.; Leer, J. van der; Varjú, V.; Arciniegas, G. REPAiR: D 5.1: PULLs Handbook. REPAiR - REsource Management in Peri-Urban AReas: Going Beyond Urban Metabolism; 2017.
- Pluchino, P. La Città Vivente: Introduzione al Metabolismo Urbano Circolare; Malcor D’ edizione, Ed.; 2019; ISBN 9788897909484.
- Bottero, M.; Datola, G.; Monaco, R. Fuzzy Cognitive Maps: Valutazione Dei Processi Dinamico per La Un Approccio Valutativo Di Rigenerazione Urbana. Journal valori e valutazioni 2019, 23, 77–90. [Google Scholar]
- Secchi, B. La città europea contemporanea e il suo progetto. TERRITORIO 2002. [Google Scholar]
- Batty, M. Cities as Complex Systems: Scaling, Interactions, Networks, Dynamics and Urban Morphologies. In Encyclopedia of Complexity and Systems Science; Meyers Robert A., Ed.; Springer New York, 2008 ISBN 1467-1298.
- Elmqvist, T.; Bai, X. Urban Planet: Knowledge towards Sustainable Cities; Cambridge University Press: Cambridge, 2018; ISBN 9781107196933. [Google Scholar]
- Holling, C.S. Resilience and Stability of Ecological Systems; 1973; Vol. 4.
- Gilles, C. Manifesto Del Terzo Paesaggio; F. De Pieri, Ed.; Quodlibet: Macerata, 2005. [Google Scholar]
- Schneider, A.; Woodcock, C.E. Compact, Dispersed, Fragmented, Extensive? A Comparison of Urban Growth in Twenty-Five Global Cities Using Remotely Sensed Data, Pattern Metrics and Census Information. Urban Studies 2008, 45, 659–692. [Google Scholar] [CrossRef]
- Duvernoy, I.; Zambon, I.; Sateriano, A.; Salvati, L. Pictures from the Other Side of the Fringe: Urban Growth and Peri-Urban Agriculture in a Post-Industrial City (Toulouse, France). J Rural Stud 2018, 57, 25–35. [Google Scholar] [CrossRef]
- Corona, P. Forestry Research to Support the Transition towards a Bio-Based Economy. In Proceedings of the Annals of Silvicultural Research; 2014; Vol. 38, pp. 37–38.
- Morote, Á.F.; Saurí, D.; Hernández, M. Residential Tourism, Swimming Pools, and Water Demand in the Western Mediterranean. Professional Geographer 2017, 69, 1–11. [Google Scholar] [CrossRef]
- Munafò, M.; Sallustio, L.; Salvi, S.; Marchetti, M. Recuperiamo Terreno. Convegno recuperiamo terreno 2015, 1. [Google Scholar]
- Salvati, L.; Mavrakis, A.; Serra, P.; Carlucci, M. Lost in Translation, Found in Entropy: An Exploratory Data Analysis of Latent Growth Factors in a Mediterranean City (1960–2010). Applied Geography 2015, 60, 107–119. [Google Scholar] [CrossRef]
- Krumholz, N. Roman Impressions: Contemporary City Planning and Housing in Rome. Landsc Urban Plan 1992, 22, 107–114. [Google Scholar] [CrossRef]
- Leontidou, L. The Mediterranean City in Transition: Social Change and Urban Development. The Mediterranean city in transition: social change and urban development 1990. [CrossRef]
- Tombolini, I.; Zambon, I.; Ippolito, A.; Grigoriadis, S.; Serra, P.; Salvati, L. Revisiting “Southern” Sprawl: Urban Growth, Socio-Spatial Structure and the Influence of Local Economic Contexts. Economies 2015, 3, 237–259. [Google Scholar] [CrossRef]
- Fregolent, L.; Tonin, S. Local Public Spending and Urban Sprawl: Analysis of This Relationship in the Veneto Region of Italy. J Urban Plan Dev 2016, 142, 05016001. [Google Scholar] [CrossRef]
- Alphan, H. Land-Use Change and Urbanization of Adana, Turkey. Land Degrad Dev 2003, 14, 575–586. [Google Scholar] [CrossRef]
- Biasi, R.; Colantoni, A.; Ferrara, C.; Ranalli, F.; Salvati, L. In-between Sprawl and Fires: Long-Term Forest Expansion and Settlement Dynamics at the Wildland–Urban Interface in Rome, Italy. Int. J. Sustain. Dev. World Ecol. 2015, 22, 467–475. [Google Scholar] [CrossRef]
- Catalán, B.; Saurí, D.; Serra, P. Urban Sprawl in the Mediterranean?: Patterns of Growth and Change in the Barcelona Metropolitan Region 1993–2000. Landsc Urban Plan 2008, 85, 174–184. [Google Scholar] [CrossRef]
- Cecchini, M.; Zambon, I.; Pontrandolfi, A.; Turco, R.; Colantoni, A.; Mavrakis, A.; Salvati, L. Urban Sprawl and the ‘Olive’ Landscape: Sustainable Land Management for ‘Crisis’ Cities. GeoJournal 2019, 84, 237–255. [Google Scholar] [CrossRef]
- Kairis, O.; Karavitis, C.; Kounalaki, A.; Salvati, L.; Kosmas, C. The Effect of Land Management Practices on Soil Erosion and Land Desertification in an Olive Grove. Soil Use Manag 2013, 29, 597–606. [Google Scholar] [CrossRef]
- Pili, S.; Grigoriadis, E.; Carlucci, M.; Clemente, M.; Salvati, L. Towards Sustainable Growth? A Multi-Criteria Assessment of (Changing) Urban Forms. Ecol Indic 2017, 76, 71–80. [Google Scholar] [CrossRef]
- Terzi, F.; Bolen, F. Urban Sprawl Measurement of Istanbul. Eur. Plan. Stud. 2009, 17, 1559–1570. [Google Scholar] [CrossRef]
- Steinitz, C. A Framework for Geodesign: Changing Geography by Design; esri press, redlands california: Redlands, California, 2012; Vol. 7. [Google Scholar]
- Campagna, M. Metaplanning: About Designing the Geodesign Process. Landsc Urban Plan 2016, 156, 118–128. [Google Scholar] [CrossRef]
- Campagna, M.; Di Cesare, E.A. Geodesign: Lost in Regulations (and in Practice). Smart energy in the smart cities 2016, 307–327. [Google Scholar] [CrossRef]
- Cocco, C.; Jankowski, P.; Campagna, M. An Analytic Approach to Understanding Process Dynamics in Geodesign Studies. Sustainability (Switzerland) 2019, 11, 4999. [Google Scholar] [CrossRef]
- Di Cesare EA; Cocco C; Campagna M Il Geodesign Come Metodologia per La Progettazione Collaborativa Di Scenari Di Sviluppo per l’Area Metropolitana Di Cagliari. ASITA 2016 Proceedings 2016, 333–340.
- Brown, V.A.; Harris, J.A.; Russell, J.Y. Tackling Wicked Problems: Through the Transdisciplinary Imagination2010, 1–312. [CrossRef]
- Pettit, C.J.; Hawken, S.; Ticzon, C.; Leao, S.Z.; Afrooz, A.E.; Lieske, S.N.; Canfield, T.; Ballal, H.; Steinitz, C. Breaking down the Silos through Geodesign – Envisioning Sydney’s Urban Future. Sage J. 2019, 46, 1387–1404. [Google Scholar] [CrossRef]
- Mayer, I.S.; van Bueren, E.M.; Bots, P.W.G.; van der Voort, H.; Seijdel, R. Collaborative Decisionmaking for Sustainable Urban Renewal Projects: A Simulation – Gaming Approach. 2005, 32, 403–423. [CrossRef]
- Cerreta, M.; Panaro, S.; Cannatella, D. Multidimensional Spatial Decision-Making Process: Local Shared Values in Action. Lecture Notes in Computer Science (including subseries Lecture Notes in Artificial Intelligence and Lecture Notes in Bioinformatics) 2012, 7334 LNCS, 54–70. [CrossRef]
- Cerreta, M.; De, P. Integrated Spatial Assessment (ISA): A Multi-Methodological Approach for Planning Choices. Advances in Spatial Planning 2012. [Google Scholar] [CrossRef]
- Attardi, R.; Bonifazi, A.; Torre, C.M. Evaluating Sustainability and Democracy in the Development of Industrial Port Cities: Some Italian Cases. Sustainability 2012, 4, 3042–3065. [Google Scholar] [CrossRef]
- Di Cesare EA; Cocco C; Campagna M Il Geodesign Come Metodologia per La Progettazione Collaborativa Di Scenari Di Sviluppo per l’Area Metropolitana Di Cagliari. ASITA 2016 Proceedings 2016, 333–340.
- Raffestin, C. Immagini e Identità Territoriali. Il Mondo E I Luoghi: Geografie Delle Identità E Del Cambiamento 2003, 3–11.
- Michael Hall, C. The Ecological and Environmental Significance of Urban Wastelands and Drosscapes. In Organising Waste in the City: International Perspectives on Narratives and Practices; Zapata, M.J., Hall, M., Eds.; Policy Press Scholarship, 2013; pp. 21–40 ISBN 9781447306382.
- Koolhaas, R. Junkspace. Per Un Ripensamento Radicale Dello Spazio Urbano; Quodlibet, 2006; ISBN 978-8874621125.
- Monclús, J.; Díez Medina, C. Urban Voids and ‘in-between’ Landscapes. Urban Visions: From Planning Culture to Landscape Urbanism 2018, 247–256. [CrossRef]
- Mumford, L. The Highway and the City. Archit Rec 1958, 123, 179–186. [Google Scholar]
- Shannon, K.; Smets, M. The Landscape of Contemporary Memory; NAi Publishers, 2010.
- Smets, M. Lotus International,Electa. Milano 2001, p. 23.
- Ballal, H. Collaborative Planning with Digital Design Synthesis. 2015.
- Nyerges, T.; Ballal, H.; Steinitz, C.; Canfield, T.; Roderick, M.; Ritzman, J.; Thanatemaneerat, W. Geodesign Dynamics for Sustainable Urban Watershed Development. Sustain Cities Soc 2016, 25, 13–24. [Google Scholar] [CrossRef]
- Campagna, M.; Steinitz, C.; Di Cesare, E.A.; Cocco, C.; Ballal, H.; Canfield, T. Collaboration in Planning: The Geodesign Approach. Rozwój Regionalny i Polityka Regionalna 2016, 35, 55–72. [Google Scholar]
- Arciniegas, G.; Šileryté, R.; Dąbrowski, M.; Wandl, A.; Dukai, B.; Bohnet, M.; Gutsche, J.-M. A Geodesign Decision Support Environment for Integrating Management of Resource Flows in Spatial Planning. Urban Plan 2019, 4, 32. [Google Scholar] [CrossRef]
- Cerreta, M.; Mazzarella, C.; Somma, M. Opportunities and Challenges of a Geodesign Based Platform for Waste Management in the Circular Economy Perspective; 2020; Vol. 12252 LNCS; ISBN 9783030588106.
- Steinitz, C. A Framework for Geodesign: Changing Geography by Design; ESRI Press, R.C., Ed.; 2012.
- Geertman, S.; Stillwell, J. Planning Support Systems in Practice Advances in Spatial Science. 2012, 580.
- Pelzer, P.; Arciniegas, G.; Geertman, S.; de Kroes, J. Using Maptable® to Learn about Sustainable Urban Development. Lecture Notes in Geoinformation and Cartography 2013, 0, 167–186. [Google Scholar] [CrossRef]
- Pettit, C.J.; Raymond, C.M.; Bryan, B.A.; Lewis, H. Identifying Strengths and Weaknesses of Landscape Visualisation for Effective Communication of Future Alternatives. Landsc Urban Plan 2011, 100, 231–241. [Google Scholar] [CrossRef]
- Campagna, M.; Di Cesare, E.A.; Cocco, C. Integrating Green-Infrastructures Design in Strategic Spatial Planning with Geodesign. Sustainability 2020, 12, 1820. [Google Scholar] [CrossRef]
- Somma, M.; Campagna, M.; Canfield, T.; Cerreta, M.; Poli, G.; Steinitz, C. Collaborative and Sustainable Strategies Through Geodesign: The Case Study of Bacoli. Lecture Notes in Computer Science (including subseries Lecture Notes in Artificial Intelligence and Lecture Notes in Bioinformatics) 2022, 13379 LNCS, 210–224. [CrossRef]
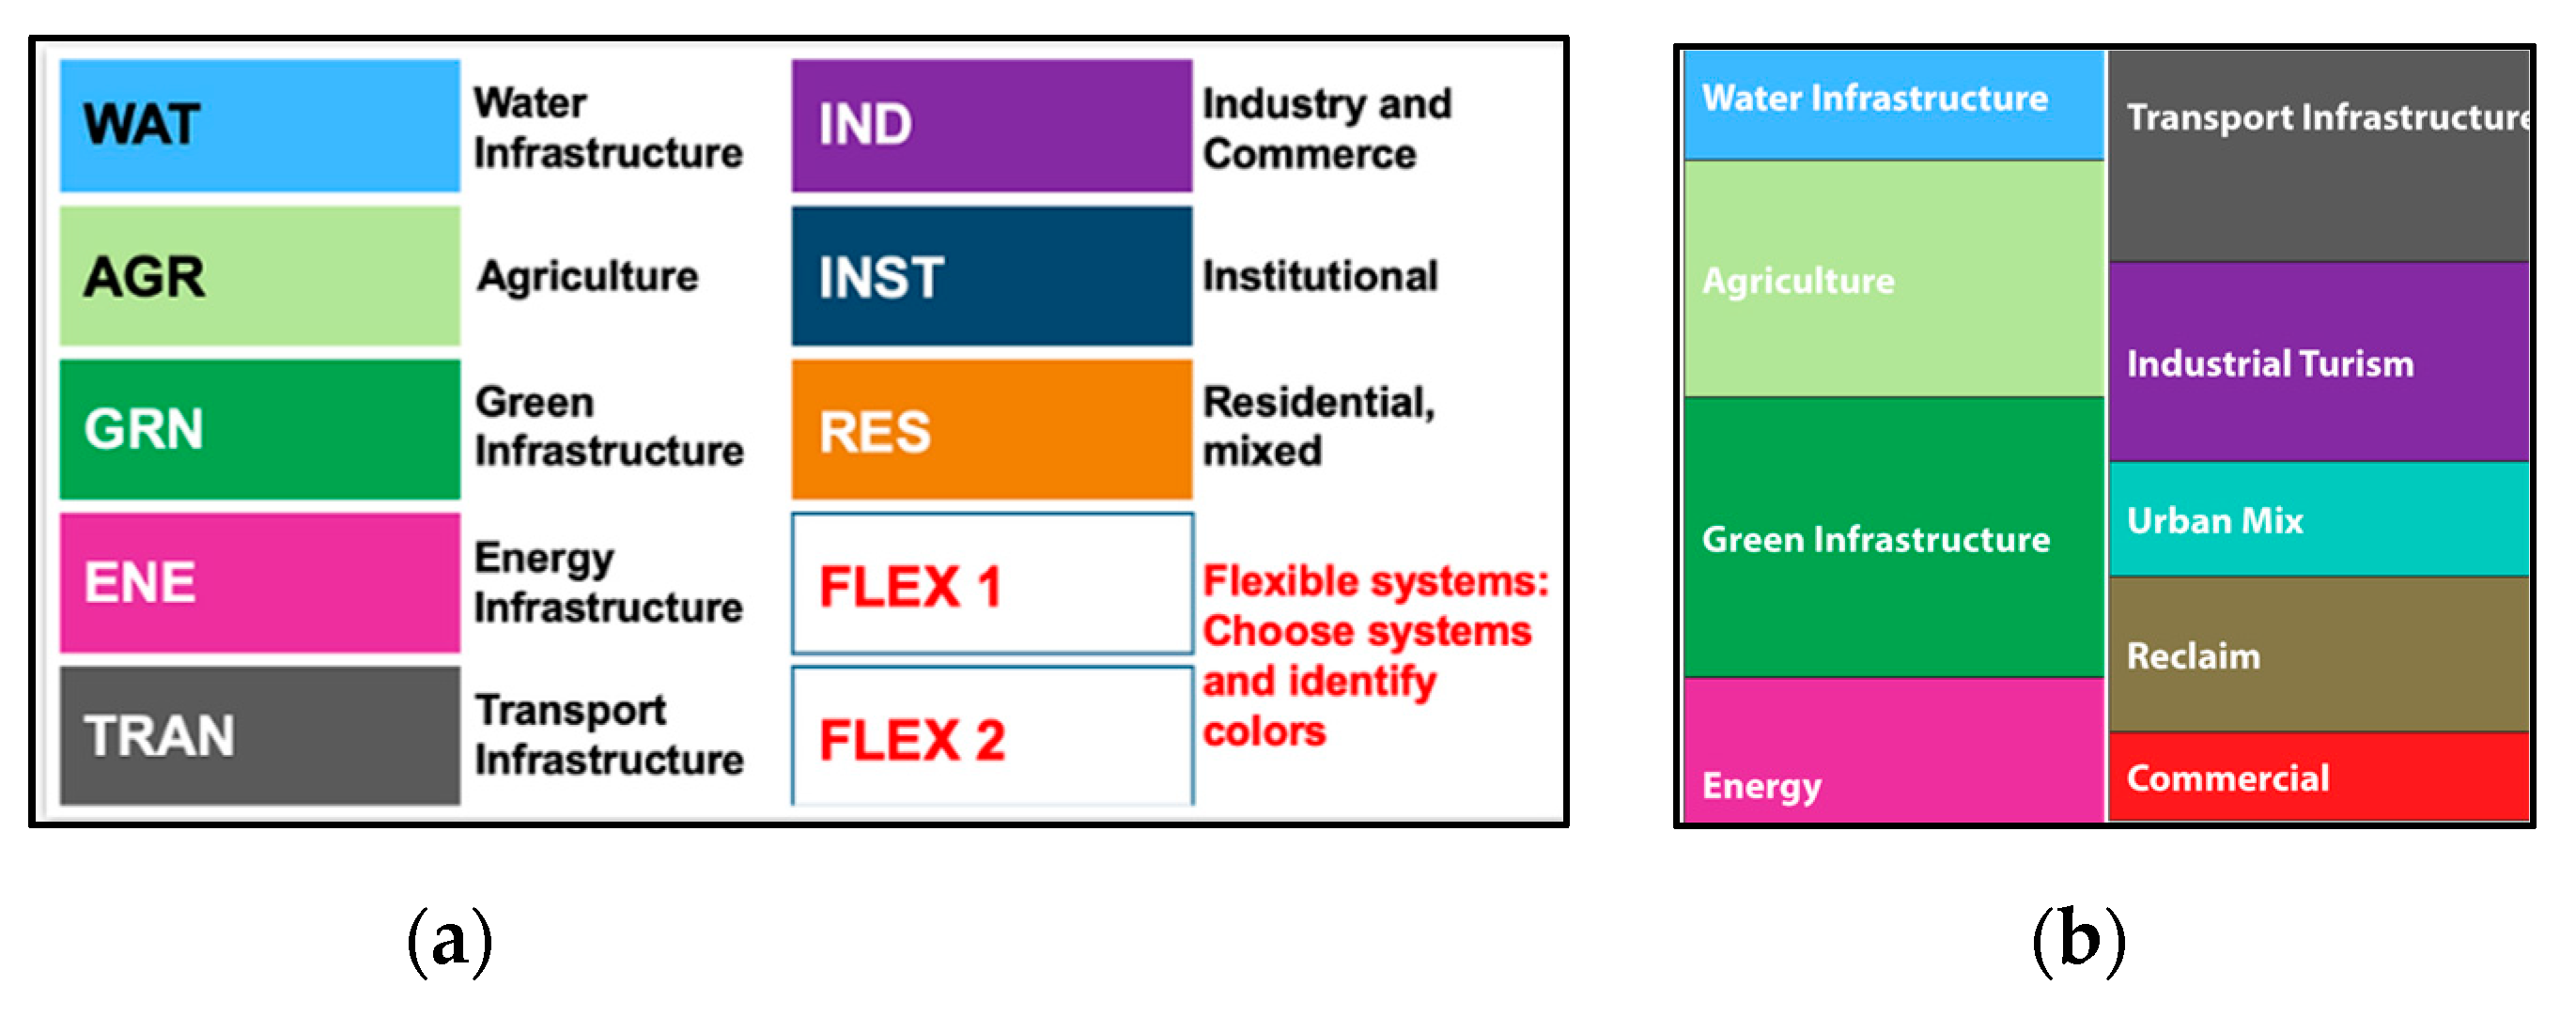
| System | Acronimus | Description |
|---|---|---|
| Water Infrastructure |
WAT | It refers to the water mirror system where actions related to the restoration and improvement of existing water systems are to be envisaged existing or the creation of blue infrastructure. |
| Agriculture | AGR | It concerns the improvement and development of the local agri-food sector. The system’s actions include the creation of new enterprises, brands, circuits and structures dedicated to a local market and capable of attracting tourists through knowledge of the local production chain. |
| Green Infrastructure |
GRN | It concerns solutions for protecting and enhancing natural heritage, both in landscape and environmental aspects, in the landscape-environmental and economic-productive aspects. This system favours the creation of green infrastructures on a metropolitan scale, connecting areas of high naturalistic value and ensuring sustainable use of the territory and its resources. |
| Energy | ENE | It provides policies and strategies for sustainable energy efficiency, one of the most challenging goals to mitigate climate change’s impacts and reduce household costs. |
| Transport Infrastructure |
TRAN | It is crucial for the efficiency of the study area. Therefore, it is necessary to envisage direct interventions to create and improve the road infrastructure, nodes and mobility routes to support people and goods by land and water and make the area decongesting traffic. On the one hand, technical issues should solve the intertwining congestion problems in the case of transport systems. However, on the other hand, the impact on the surrounding environment and the needs of travellers. |
| Industrial Tourism |
INDTOUR | It refers to tourist services and assets. It provides for interventions for the protection and development of an integrated offer of cultural and environmental assets, tourist attractions and services to enhance the capacity of reception and accommodation facilities. |
| Urban Mix | MIX | The system is helpful to ensure that choices that are functional to the context provide an urban mixite that ties in with the objectives of sustainable and innovative development. |
| Reclaim | RCLM | The most vulnerable systems but the potential for the area’s sustainable development. This system must provide for the regeneration, redevelopment and recovery of all currently degraded spaces and buildings. |
| Cultural Heritage |
CULT | The system accommodates projects that concern preserving and enhancing existing local historical and cultural heritage. |
| Commercial | COM | It is the system supporting tourism and territorial development |
| Water Infrastructure System | ||
|---|---|---|
| Criteria | Some Data collection | Other Data |
| Feasible | UA_50000 buffer100 Protect area | Regional and municipality data: Lake system, Subsurface reticulation, Hydrographic reticulation typology, Hydraulic risk (hazard), Hydraulic risk classification, Hydraulic vulnerability, Crags, Coastal storm surge, Wetlands |
| Suitable | UA_14_100: Green urban areas; UA_14_200: Sports and leisure facilities; UA_31: Forests; UA_32: Herbaceous vegetation associations (natural grassland, moors...); UA_33: Open spaces with little or no vegetation Seawater | |
| Capable | UA_13_300: Construction sites; UA_21: Arable land (annual crops); UA_22: Permanent crops (vineyards, fruit trees, olive groves); UA_23: Pastures; UA_24: Complex and mixed cultivation; UA_25: Orchards UA_13_400: Land without current use | |
| Not Appropriate |
UA_11_100: Continuous Urban fabric (S.L. > 80%); UA_11_210/240: Discontinuous Density Urban Fabric - Industrial, commercial, public, military and private units - Fast transit roads and associated land; UA_12_220: Other roads and associated land; UA_12_230: Railways and associated land; UA_12_300: Port area | |
| Exiting | Lakes 500 mt Buffer cost zones | |
| Agriculture System | |||
|---|---|---|---|
| Criteria | Some Data collection | Other Data | |
| Feasible | CUAS_42: Areas with sparse vegetation Buffer_Miticoltura: Waters adjacent to breeding facilities |
Regional and municipality data, Corine Land Cover data collection: CLC C1. Artificial surfaces; CLC C2. Agricultural surfaces; CLC C3. Wooded and seeded; CLC C4. Wetlands; CLC C5. Water bodies, Miti-culture. |
|
| Suitable | - | ||
| Capable | CUAS_31: Permanent grassland, meadows, and pastures; CUAS_32: Pastures that are unused or of uncertain use; CUAS_51: Hardwood forests CUAS_52: Coniferous forests; CUAS_53: Mixed deciduous and coniferous forests; CUAS_61: Natural pasture areas and high-altitude grasslands CUAS_62: Thickets and shrublands; CUAS_63: Areas with sclerophyllous vegetation; CUAS_73: Complex cropping and plot systems |
||
| Not Appropriate |
CUAS_71: Beaches, dunes and sands; CUAS_72: Bare rocks and outcrops; CUAS_91: Urbanised environment and artificial surfaces; CUAS_92: Waters |
||
| Exiting | CUAS_22: Orchards and minor fruits CUAS_23: Olive groves; CUAS_121: Spring-summer arable crops - grain cereals; CUAS_122: Spring-summer arable crops – vegetables; CUAS_931: Protected crops - horticultural and fruit crops; CDM_Miticoltura: Watersheds occupied by livestock facilities | ||
| Green Infrastructure System | ||
|---|---|---|
| Criteria | Some Data collection | Other Data |
| Feasible | CUAS_42: Areas with sparse vegetation BUFFER_CDM_ MITICOLTURA: Waters adjacent to breeding facilities |
Regional and municipality data: Natural Resources, Parks, Landslide Risk, and Faults. |
| Suitable | CLC_243: Land principally occupied by agriculture, with significant areas of natural vegetation; CLC_321: Natural grasslands | |
| Capable | Fruit trees and berry plantations; complex cultivation patterns | |
| Not Appropriate |
CLC_111: Continuous urban fabric; CLC_112: Discontinuous urban fabric; CLC_121: Industrial or commercial units; CLC_123: Port areas | |
| Exiting | CLC_142: Sport and leisure facilities; CLC_311: Broad-leaved forest; CLC_323: Sclerophyllous vegetation; CLC_324: Transitional woodland-shrub; CLC_331: Beaches, dunes, sands; CLC_512: Water bodies; CLC_523: Sea and ocean; Natura 2000 ZSC/ZPS | |
| Industrial Tourism System | ||
|---|---|---|
| Criteria | Data collection | Other Data |
| Feasible | Port areas Water 50 mt buffer UA50000 | Regional, municipality data and participatory mapping: Tourist spots, Minor accommodations, Beaches, Parks; Submerged |
| Suitable | Areas with activities and attractions for tourists; Green urban areas (park, seafront); Sports and leisure facilities | |
| Capable | Accommodation facilities with rate < 8; Discontinuos very low-density urban fabric (S.L.: < 10 %); Discontinuous low-density urban fabric (S.L.: 10 % - 30 %); Submerged Park of Baia | |
| Not Appropriate |
UA11100: Continuos urban fabric (S.L.> 80%); UA11210: Discontinuous dense urban fabric (S.L.: 50 % - 80 %); UA11220: Discontinuous medium density urban fabric (S.L.: 30 % - 50 %); UA11300: Isolated structures; UA12100: Industrial, commercial, public, military and private units; UA12210: Fast transit roads and associated land; UA12220: Other roads and associated land; UA12230: Railways and associated land; UA13300: Construction sites; UA13400: Land without current use Arable land (annual crops); UA22000: Permanent crops (vineyards, fruit trees, olive groves); UA23000: Pastures; UA31000: Forests; UA32000: Herbaceous vegetation associations (natural grassland, moors); UA33000: Open spaces with little or no vegetation | |
| Exiting | Accommodation facilities with rate > o = 8 | |
| Commercial System | ||
|---|---|---|
| Criteria | Data collection | Other Data |
| Feasible | Dense Urban Fabric (S.L.: 50% - 80%) | Regional, municipality data and participatory mapping: Marco industrial/commercial areas; other commercial activities |
| Suitable | Discontinuous medium-density urban fabric (S.L.: 30% - 50%) | |
| Capable | Discontinuous low-density urban fabric (S.L.: 10% - 30%); Open spaces with little or no vegetation; Herbaceous vegetation associations (natural grassland, moors...); Land without current use | |
| Not Appropriate |
Natural park Archeological sites Water sea, rivers and lakes Coast and dunes | |
| Exiting | Bars; Cosmetics shops; Agribusiness; Car washes; Neighbourhood markets; Restaurants; Sports shops; Supermarkets; Toy shops; Industrial activities | |
| Cultural Heritage System | ||
|---|---|---|
| Criteria | Data collection | Other Data |
| Feaseble | buffer 500 mt ZSC/ZPS Sea water | Regional and municipality data: Lake system, Subsurface reticulation, Hydrographic reticulation typology, Hydraulic risk (hazard), Hydraulic risk classification, Hydraulic vulnerability, Crags, Coastal storm surge, Wetlands |
| Suitable | CLC_243: Land principally occupied by agriculture, with significant areas of natural vegetation CLC_321: Natural grasslands |
|
| Capable | Fruit trees and berry plantations Complex cultivation patterns | |
| Not Appropriate |
CLC_111: Continuous urban fabric; CLC_112: Discontinous urban fabric CLC_121: Industrial or commercial units CLC_123: Port areas |
|
| Exiting | CLC_142: Sport and leisure facilities; CLC_311: Broad-leaved forest CLC_323: Sclerophyllous vegetation CLC_324: Transitional woodland-shrub CLC_331: Beaches, dunes, sands CLC_512: Water bodies CLC_523: Sea and ocean Natura 2000 ZSC/ZPS |
|
| Dimension | System | General Variable | Variable |
|---|---|---|---|
| D1. Social and Cultural Function |
S1. Urban | U1. Urban space | 1. Abandoned Port area |
| 2. Unlawful dumps | |||
| U2. Building and Settlement | 1. Settlement in crisis | ||
| 2. Empty or occupied dwelling | |||
| 3. Unlawful buildings | |||
| 4. Potentially contaminated sites | |||
| D2. Environmental | S2. Landscape | L1. Soil | 1. Protect area |
| 2. Area without current destination 3. Volcanic Risk Area 4. Landslide risk area 5. Fallow areas and urban soils 6. Disused quarried 7. Unlawful quarries | |||
| L2. Water | 1. Contaminated water 2. Areas with high hydraulic risk 3. Closed bathing areas |
||
| D3. Service | S3. Infrastructure | T1. Road and railway network |
1. Abandoned infrastructure |
| 2. Interstitial buffer zone | |||
| 3. Abandoned bus and metro station | |||
| T2. Coast area | 1. Abandoned port area |
| Reclaim System | ||
|---|---|---|
| Criteria | Data collection | Other Data |
| Feasible | Main infrastructures Interstitial areas of infrastructure | Regional and municipality data: Areas of particular interest; Polluted water, Illegal building |
| Suitable | Secondary infrastructures, Fragmented landscapes, Degraded urban fabric | |
| Capable | Shacks and ruins Polluted sea Lakes to be reclaimed Beaches to be reclaimed | |
| Not Appropriate |
Lakes Protected landscape | |
| Exiting | Port area Underwater archaeological park | |
| Dimension | System | General Variable | Variable |
|---|---|---|---|
| D1. Social and Cultural Function |
S1. Urban | U1. Urban space | 1. Port area |
| 2. Staging area | |||
| 3. Stopover | |||
| 4. Infopoint | |||
| 5. Mobility hub 6. Dismissed infrastructure | |||
| D2. Environmental | S2. Landscape | L1. Landslide | 1. Landslide hazard |
| L2.Land | 2. Use of land and urban land | ||
| L3. Coast | 3. Coast erosion | ||
| L4. Landscape | 4. Protected landscapes | ||
| D3. Service | S3. Infrastructure | T1. Road network | 1. Length of road network (in km) |
| 2. Road network density(m/km2) | |||
| 3. Speed limits | |||
| 4. Travel times | |||
| 5. Cycle path (in km) | |||
| T2. Railway network | 6. Railway network (in km) | ||
| 1. Railway network density (km/ km2 ) | |||
| 2. Frequency services | |||
| 3. Number of railway and metro station | |||
| T3. Road Network/ UAtlas Railway Network/UAtlas |
1. Capillarity value | ||
| 2. Accessibility degree | |||
| 3. Centrality value | |||
| T4. Maritime network | 1. Average travel times | ||
| 2. Number of Maritime’s lines | |||
| T5. Parking/Urban Atlas | 1. Capacity of parking spaces | ||
| 2. Accessibility degree | |||
| 3. Centrality value | |||
| T6. Port area/Urban Atlas | 1. Number of ports | ||
| 2. Accessibility degree | |||
| 3. Centrality value | |||
| T7. Bus stops/Urban Atlas | 1. Number of buses stop 2. Centrality value 3. Number of lines |
| Transportation System | ||
|---|---|---|
| Criteria | Some Data collection | Other Data |
| Feasible | Accessibility within 1 km of Urban space, bus stop, port area, parking Min% principal road Other roads and associated land Land without current use | Regional and municipality data: Areas of particular interest; Polluted water, Illegal building |
| Suitable | Secondary infrastructures, Fragmented landscapes, Degraded urban fabric | |
| Capable | Shacks and ruins Polluted sea Lakes to be reclaimed Beaches to be reclaimed | |
| Not Appropriate |
Lakes Protected landscape | |
| Exiting | Port area Underwater archaeological park | |
| Group of stakeholders | ||
|---|---|---|
| Number group | Name of Group | Acronimus |
| 1 | Metropolitan administrators | METRO |
| 2 | Cultural heritage conservation | CULT |
| 3 | Developers | DEVE |
| 4 | Tourism | TOUR |
| 5 | Green | GREEN |
| 6 | Farmers | FARM |
| System | n. Projects | n. Policy |
|---|---|---|
| WAT | 7 | 2 |
| AGR | 10 | 3 |
| GRN | 9 | 2 |
| ENE | 5 | 1 |
| TRAN | 25 | 2 |
| INDTOUR | 5 | - |
| MIX | 1 | 1 |
| RCLM | 13 | 1 |
| CULT | 18 | 7 |
| COM | 10 | 3 |
Disclaimer/Publisher’s Note: The statements, opinions and data contained in all publications are solely those of the individual author(s) and contributor(s) and not of MDPI and/or the editor(s). MDPI and/or the editor(s) disclaim responsibility for any injury to people or property resulting from any ideas, methods, instructions or products referred to in the content. |
© 2023 by the authors. Licensee MDPI, Basel, Switzerland. This article is an open access article distributed under the terms and conditions of the Creative Commons Attribution (CC BY) license (http://creativecommons.org/licenses/by/4.0/).


