Submitted:
12 July 2023
Posted:
13 July 2023
You are already at the latest version
Abstract
Keywords:
1. Introduction
2. Materials and methods
2.1. Synthesis
2.2. Characterization methods
2.3. Electrochemical performance tests
3. Results and Discussion
3.1. Development of the morphology during the annealing
3.2. Surface chemistry of the samples
3.3. Effect of GO on ORR performance
3.4. Effect of GO on Li-ion battery application
Conclusions
Supplementary Materials
Acknowledgments
References
- P. Chen, L.K. Wang, G. Wang, M.R. Gao, J. Ge, W.J. Yuan, Y.H. Shen, A.J. Xie, S.H. Yu. Nitrogen-doped nanoporous carbon nanosheets derived from plant biomass: an efficient catalyst for oxygen reduction reaction. Energy Environ. Sci., 2014, 7 (12), 4095–4103. [CrossRef]
- J. Zhao, Y. Liu, X. Quan, S. Chen, H. Yu, H. Zhao. Nitrogen-doped carbon with high degree of graphitization derived from biomass as high-performance electrocatalyst for oxygen reduction reaction. Appl. Surf. Sci. 2017, 396, 986–993. [CrossRef]
- Q. Zhao, Q. Ma, F. Pan, Z. Wang, B. Yang, J. Zhang, J. Zhang. Facile synthesis of nitrogen-doped carbon nanosheets as metal-free catalysts with excellent oxygen reduction performance in alkaline and acidic media. J Solid State Electrochem., 2016, 20, 1469-1479. [CrossRef]
- P. Cheng, T. Li, H. Yu, L. Zhi, Z. Liu, Z. Lei. Biomass-derived carbon fiber aerogel as a binder-free electrode for high-rate supercapacitors. J. Mater. Chem. C, 2016, 120 (4), 2079–2086. [CrossRef]
- ZT You, L Zhao, KH Zhao, HX Liao, SJ Wen, YH Xiao, BC Cheng, SJ Lei. Highly tunable three-dimensional porous carbon produced from tea seed meal crop by-products for high performance supercapacitors. Appl. Surf. Sci. 2023, 607, 155080.
- L. Wang, Z. Schnepp, M.M. Titirici. Rice husk-derived carbon anodes for lithium-ion batteries. J. Mater. Chem. A, 2013, 1 (17), 5269-5273. [CrossRef]
- T. Liu, X. Li. Biomass-derived nanostructured porous carbons for sodium ion batteries: a review. Mater. Technol., 2018, 34 (4), 232–245. [CrossRef]
- H. Li, Z. Cheng, Q. Zhang, A. Natan, Y. Yang, D. Cao, H. Zhu. Bacterial-derived, compressible, and hierarchical porous carbon for high-performance potassium-ion batteries. Nano Lett., 2018, 18 (11), 7407–7413. [CrossRef]
- Z. Sebestyén, E. Jakab, A. Domán, P. Bokrossy, I. Bertóti, J. Madarász, K. László. Thermal degradation of crab shell biomass, a nitrogen-containing carbon precursor. J. Therm. Anal. Calorim., 2020, 142, 301-308. [CrossRef]
- K.M. Zia, S. Tabasum, M. Nasif, N. Sultan, N. Aslam, A. Noreen, M. Zuber. A review on synthesis, properties and applications of natural polymer based carrageenan blends and composites. Int. J. Biol. Macromol., 2017, 96, 282-301. [CrossRef]
- D. Li, Y. Jia, G. Chang, J. Chen, H. Liu, J. Wang, Y. Hu, Y. Xia, D. Yang, X. Yao. A defect-driven metal-free electrocatalyst for oxygen reduction in acidic electrolyte. Chem, 2018, 4, 2345–2356. [CrossRef]
- J. Hou, C. Cao, F. Idrees, X. Ma. Hierarchical porous nitrogen-doped carbon nanosheets derived from silk for ultrahigh-capacity battery anodes and supercapacitors. ACS Nano, 2015, 9 (3), 2556–2564. [CrossRef]
- D.W. Wang, F. Li, M. Liu, G.Q. Lu, H.M. Cheng. 3D aperiodic hierarchical porous graphitic carbon material for high-rate electrochemical capacitive energy storage. Angew. Chem. Int. Ed., 2007, 47 (2), 373–376. [CrossRef]
- Gabe, R. Ruiz-Rosas, C. González-Gaitán, E. Morallón, D. Cazorla-Amorós. Modeling of oxygen reduction reaction in porous carbon materials in alkaline medium. Effect of microporosity. J. Power Sources, 2019, 412, 451-464. [CrossRef]
- Y. Liu, K. Li, B. Ge, L. Pu, Z. Liu. Influence of micropore and mesoporous in activated carbon air-cathode catalysts on oxygen reduction reaction in microbial fuel cells. Electrochim. Acta, 2016, 214, 110-118. [CrossRef]
- J. Cao, C. Zhu, Y. Aoki, H. Habazaki. Starch-derived hierarchical porous carbon with controlled porosity for high performance supercapacitors. ACS Sustainable Chem. Eng., 2018, 6 (6), 7292-7303. [CrossRef]
- T.J. Bandosz. Revealing the impact of small pores in oxygen reduction on carbon electrocatalysts: A journey through recent findings. Carbon, 2022, 188, 289-304. [CrossRef]
- M. Huang, S.J. Yoo, J.S. Lee, T.H. Yoon. Electrochemical properties of an activated carbon xerogel monolith from resorcinol-formaldehyde for supercapacitor electrode applications. RSC Adv., 2021, 11, 33192-33201. [CrossRef]
- X. Feng, Y. Bai, M. Liu, Y. Li, H. Yang, X. Wang, C. Wu. Untangling the respective effects of heteroatom-doped carbon materials in batteries, supercapacitors and the ORR to design high performance materials. Energy Environ. Sci., 2021, 14, 2036-2089. [CrossRef]
- Y. Zhai, Y. Dou, D. Zhao, P.F. Fulvio, R.T. Mayes, S. Dai. Carbon materials for chemical capacitive energy storage. Adv. Mater., 2011, 23, (42), 4828-4850. [CrossRef]
- W. Tang, Y. Zhang, Y. Zhong, T. Shen, X. Wang, X. Xia, J. Tu. Natural biomass-derived carbons for electrochemical energy storage. Mater. Res. Bull., 2017, 88, 234–241. [CrossRef]
- Z. Zhu, Z. Xu. The rational design of biomass-derived carbon materials towards next-generation energy storage: A review. Renewable and Sustainable Energy Reviews, 2020, 134, 110308. [CrossRef]
- J.R. Dahn, T. Zheng, Y.H. Liu, J.S. Xue. Mechanisms for lithium insertion in carbonaceous materials. Science, 1995, 270, 590−593. [CrossRef]
- S. Sun, Q. Yan, M. Wu, X. Zhao. Carbon aerogel based materials for secondary batteries. Sustain. Mater. Technol., 2021, 30, e00342. [CrossRef]
- D. Li, Y. Wang, Y. Sun, Y. Lu, S. Chen, B. Wang, H. Zhang, Y. Xia, D. Yang. Turning gelidium amansii residue into nitrogen-doped carbon nanofiber aerogel for enhanced multiple energy storage. Carbon, 2018, 137, 31–40. [CrossRef]
- Q.Q. Xiong, Z.G. Ji. Controllable growth of MoS2/C flower-like microspheres with enhanced electrochemical performance for lithium ion batteries. J Alloys Compd., 2016, 673, 215–219. [CrossRef]
- M. Enterría, J.L. Figueiredo. Nanostructured mesoporous carbons: Tuning texture and surface chemistry. Carbon, 2016, 108, 79-102. [CrossRef]
- J. Zhang, J. Zhang, F. He, Y. Chen, J. Zhu, D. Wang, M. Shichun, H.Y. Yang. Defect and doping co-engineered non-metal nanocarbon ORR electrocatalyst. Nano-Micro Lett., 2021, 13, 65. [CrossRef]
- X Wang, LW Yang, R Li, YX Chen, ZG Wu, BH Zhong, XD Guo. Heteroatom-doped Ginkgo Folium porous carbon modified separator for high-capacity and long-cycle lithium-sulfur batteries. Appl. Surf. Sci. 2022, 602, 154342.
- B Yan, L. Feng, JJ Zheng, Q. Zhang, YZ Dong, YC Ding, WS Yang, JQ Han, SH Jiang, SJ He. Nitrogen-doped carbon layer on cellulose derived free-standing carbon paper for high-rate supercapacitors. Appl. Surf. Sci. 2023, 608, 155144.
- Z. Duan, G. Henkelman. Identification of active sites of pure and nitrogen-doped carbon materials for oxygen reduction reaction using constant-potential calculations. J. Phys. Chem. C., 2020, 124 (22), 12016-12023. [CrossRef]
- B. Nagy, S. Villar-Rodil, J.M.D. Tascón, I. Bakos, K. László. Nitrogen doped mesoporous carbon aerogels and implications for electrocatalytic oxygen reduction reactions. Microporous and Mesoporous Mater., 2016, 230, 135-144. [CrossRef]
- D. Guo, R. Shibuya, C. Akiba, S. Saji, T. Kondo, J. Nakamura. Active sites of nitrogen-doped carbon materials for oxygen reduction reaction clarified using model catalysts. Science, 2016, 351 (6271), 361–365. [CrossRef]
- Dewang Kong, Wenjing Yuan, Cun Li, Jiming Song, Anjian Xie, Yuhua Shen: Synergistic effect of nitrogen-doped hierarchical porous carbon/graphene with enhanced catalytic performance for oxygen reduction reaction. Appl. Surf. Sci., 2017, 393, 144-150. https://doi.org/10.1016/j.apsusc.2016.10.019.
- K. Lee, L. Shabnam, S.N. Faisal, V.C. Hoang, V.G. Gomes. Aerogel from fruit biowaste produces ultracapacitors with high energy density and stability. J. Energy Storage, 2020, 27, 101152. [CrossRef]
- Gopalakrishnan, S. Badhulika. Effect of self-doped heteroatoms on the performance of biomass-derived carbon for supercapacitor applications. J. Power Sources, 2020, 480, 228830. [CrossRef]
- Donglin He , Wang Zhao, Ping Li, Zhiwei Liu, Haoyang Wu, Luan Liu, Kun Han, Lang Liu, Qi Wan, Faheem K. Butt, Xuanhui Qu: Bifunctional biomass-derived 3D nitrogen-doped porous carbon for oxygen reduction reaction and solid-state supercapacitor. Appl. Surf. Sci., 2019, 465, 303-312.
- HQ Gao, D Zhang, HT Zhou, JC Wu, GJ Xu, ZL Huang, MH Liu, JH Yang, D Chen. Boosting gravimetric and volumetric energy density of supercapacitors by 3D pomegranate-like porous carbon structure design. Appl. Surf. Sci. 2020, 534, 147613.
- S. Ito, T. Murata, M. Hasegawa, Y. Bito, Y. Toyoguchi. Study on CxN and CxS with disordered carbon structure as the anode materials for secondary lithium batteries. J. Power Sources, 1997, 68 (2), 245-248. [CrossRef]
- M. Seredych, K. László, E. Rodríguez-Castellón, T.J. Bandosz. S-doped carbon aerogels/GO composites as oxygen reduction catalysts. J. Energy Chem., 2016, 25 (2), 236-245. [CrossRef]
- J. Liang, Y. Jiao, M. Jaroniec, S.Z. Qiao. Sulfur and nitrogen dual-doped mesoporous graphene electrocatalyst for oxygen reduction with synergistically enhanced performance. Angew. Chem. Int. Ed., 2012, 51 (46), 11496-11500. [CrossRef]
- M. Jiang, X. Yu, H. Yang, S. Chen. Optimization strategies of preparation of biomass-derived carbon electrocatalyst for boosting oxygen reduction reaction: A minireview. Catalysts, 2020, 10, 1472. [CrossRef]
- Y. Zhao, Y. Liu, Y. Chen, X. Liu, X. Li, S. Gao. A treasure map for nonmetallic catalysts: optimal nitrogen and fluorine distribution of biomass-derived carbon materials for high-performance oxygen reduction catalysts. J. Mater. Chem. A, 2021, 9, 18251. [CrossRef]
- Shenghui Jiao, Yutong Yao, Junliu Zhang, Liqiong Zhang, Changwei Li, Huixin Zhang, Xin Zhao, Honglei Chen, Jianchun Jiang: Nano-flower-like porous carbon derived from soybean straw for efficient N-S co-doped supercapacitors by coupling in-situ heteroatom doping with green activation method. Appl. Surf. Sci. 2023, 615, 156365.
- H. Jin, X. Wang, Z. Gu, J. Polin. Carbon materials from high ash biochar for supercapacitor and improvement of capacitance with HNO3 surface oxidation. J. Power Sources, 2013, 236, 285–292. [CrossRef]
- F. Chen, J. Yang, T. Bai, B. Long, X. Zhou. Biomass waste-derived honeycomb-like nitrogen and oxygen dual-doped porous carbon for high performance lithium-sulfur batteries. Electrochim. Acta, 2016, 192, 99–109. [CrossRef]
- Y. Qiu, J. Huo, F. Jia, B.H. Shanks, W. Li. N- and S-doped mesoporous carbon as metal-free cathode catalysts for direct bio renewable alcohol fuel cells. Mater. Chem. A, 2016, 4, 83–95. [CrossRef]
- J-H. Lee, S-J. Park. Recent advances in preparations and applications of carbon aerogels: A review. Carbon, 2020, 163, 1-18. [CrossRef]
- M. Bakierska, M. Lis, J. Pacek, M. Świętosławski, M. Gajewska, A. Tąta, E. Proniewicz, M. Molenda. Bio-derived carbon nanostructures for high-performance lithium-ion batteries. Carbon, 2019, 145, 426–432. [CrossRef]
- B. Jaleh, M. Nasrollahzadeh, M. Eslamipanah, A. Nasri, E. Shabanlou, N.R. Manwar, R. Zboril, P. Fornasiero, M.B. Gawande. The Role of Carbon-Based Materials for Fuel Cells Performance. Carbon, 2022, 198, 301–352. [CrossRef]
- H. Song, R. Na, C. Hong, G. Zhang, X. Li, Y. Kang, Q. Zhang, H. Xie. In situ measurement and mechanism analysis of the lithium storage behavior of graphene electrodes. Carbon, 2022, 188, 146–154. [CrossRef]
- L. Li, D. Zhang, J. Deng, Y. Gou, J. Fang, H. Cui, Y. Zhao, M. Cao. Carbon-based materials for fast charging lithium-ion batteries. Carbon, 2021, 183, 721–734. [CrossRef]
- S. Wu, H. Wu, M. Zou, X. Shi, Y. Yuan, W. Bai, A. Cao. Short-range ordered graphitized-carbon nanotubes with large cavity as high-performance lithium-ion battery anodes. Carbon, 2020, 158, 642–650. [CrossRef]
- J.L. Gómez-Urbano, G. Moreno-Fernández, M. Arnaiz, J. Ajuria, T. Rojo, D. Carriazo. Graphene-coffee waste derived carbon composites as electrodes for optimized lithium ion capacitors. Carbon, 2020, 162, 273–282. [CrossRef]
- T. Zhang, F. Zhang, L. Zhang, Y. Lu, Y. Zhang, X. Yang, Y. Ma, Y. Huang. High energy density Li-ion capacitor assembled with all graphene-based electrodes. Carbon, 2015, 92, 106–118. [CrossRef]
- M.B. Lim, M. Hu, S. Manandhar, A. Sakshaug, A. Strong, L. Riley, P.J. Pauzauskie. Ultrafast sol–gel synthesis of graphene aerogel materials. Carbon, 2015, 95, 616–624. [CrossRef]
- Y. Wu, J. Zhu, L. Huang. A review of three-dimensional graphene-based materials: Synthesis and applications to energy conversion/storage and environment. Carbon, 2019, 143, 610–640. [CrossRef]
- S. Yang, L. Zhi, K. Tang, X. Feng, J. Maier, K. Mullen. Efficient synthesis of heteroatom (N or S)-doped graphene based on ultrathin graphene oxide-porous silica sheets for oxygen reduction reaction. Adv. Funct. Mater., 2012, 22 (17), 3634-3640. [CrossRef]
- Z. Lin, G. Waller, Y. Liu, M. Liu, C.P. Wong. Facile synthesis of nitrogen-doped graphene via pyrolysis of graphene oxide and urea, and its electrocatalytic activity toward the oxygen-reduction reaction. Adv. Energy Mater., 2012, 2 (7), 884-888. [CrossRef]
- Z. Lin, G.H. Waller, Y. Liu, M. Liu, C.P. Wong. 3D nitrogen-doped graphene prepared by pyrolysis of graphene oxide with polypyrrole for electrocatalysis of oxygen reduction reaction. Nano Energy, 2013, 2, 241-248. [CrossRef]
- M. Enterría, F.J. Martí-Jimeno, F. Suárez-García, J.I. Paredes, M.F.R. Pereira, J.I. Martins, A. Martínez-Alonso, J.M.D. Tascón, J.L. Figueiredo. Effect of nanostructure on the supercapacitor performance of activated carbon xerogels obtained from hydrothermally carbonized glucose-graphene oxide hybrids. Carbon, 2016, 105, 474-483. [CrossRef]
- F.J. Martín-Jimeno, F. Suárez-García, J.I. Paredes, A. Martínez-Alonso, J.M.D. Tascón. Activated carbon xerogels with cellular morphology derived from hydrothermally carbonized glucose-graphene oxide hybrids and their performance towards CO2 and dye adsorption. Carbon, 2015, 81, 137-147. [CrossRef]
- M. Canal-Rodríguez, A. Arenillas, N. Rey-Raap, G. Ramos-Fernández, I. Martín-Gullón, J.A. Menéndez. Graphene-doped carbon xerogel combining high electrical conductivity and surface area for optimized aqueous supercapacitors. Carbon, 2017, 118, 291-298. [CrossRef]
- G. Ramos-Fernández, M. Canal-Rodríguez, A. Arenillas, J.A. Menéndez, I. Rodríguez-Pastor, I. Martín-Gullon. Determinant influence of the electrical conductivity versus surface area on the performance of graphene oxide-doped carbon xerogel supercapacitors. Carbon, 2018, 126, 456-463. [CrossRef]
- K. Sato, M. Noguchi, A. Demachi, N. Oki, M. Endo. A mechanism of lithium storage in disordered carbons. Science. 1994, 264, 556−558. [CrossRef]
- J.S. Xue, J.R. Dahn. Dramatic effect of oxidation on lithium insertion in carbons made from epoxy resin. J. Electrochem. Soc. 1995, 142, 3668−3677. [CrossRef]
- D.Y. Pan, S. Wang, B. Zhao, M.H. Wu, H.J. Zhang, Y. Wang, Z. Jiao. Li storage properties of disordered graphene nanosheets. Chem. Mater., 2009, 21, 3136−3142. [CrossRef]
- R. Yazami, M. Deschamps. High reversible capacity carbon-lithium negative electrode in polymer electrolyte. J. Power Sources. 1995, 54, 411−415. [CrossRef]
- J-C. Li, P-X. Hou, M. Cheng, C. Liu, H-M. Cheng, M. Shao. Carbon nanotube encapsulated in nitrogen and phosphorus co-doped carbon as a bifunctional electrocatalyst for oxygen reduction and evolution reactions. Carbon, 2018, 139, 156-163. [CrossRef]
- Y. Li, J. Yang, J. Huang, Y. Zhou, K. Xu, N. Zhao, X. Cheng. Soft template-assisted method for synthesis of nitrogen and sulfur co-doped three-dimensional reduced graphene oxide as an efficient metal free catalyst for oxygen reduction reaction. Carbon, 2017, 122, 237-246. [CrossRef]
- S.K. Samaniego Andrade, I. Bakos, G. Dobos, A. Farkas, G. Kiss, S. Klébert, J. Madarász, K. László. Biomass related highly porous metal free carbon for gas storage and electrocatalytic applications. Materials, 2021, 14 (13), 3488. [CrossRef]
- B. Berke, L. Sós, V. Bérczes, A. Domján, L. Porcar, O. Czakkel, K. László. Graphene derivatives in responsive hydrogels: Effect of concentration and surface chemistry. European Polymer Journal, 2017, 93, 717–725. [CrossRef]
- W.S. Hummers Jr., R.E Offeman. Preparation of graphitic oxide. J. Am. Chem. Soc. 1958, 80, 1339−1339.
- D.C. Marcano, D.V. Kosynkin, J.M. Berlin, A. Sinitskii, Z. Sun, A. Slesarev, et al. Improved synthesis of graphene oxide. ACS Nano 2010, 4, 4806–14. [CrossRef]
- S. Brunauer, P.H. Emmett, E. Teller. Adsorption of gases in multimolecular layers. J. Am. Chem. Soc. 1938, 60 (2), 309–319. [CrossRef]
- M.M. Dubinin, L.V. Radushkevich. The Equation of the characteristic curve of activated charcoal. Dokl. Akad. Nauk. SSSR., 1947, 55, 327-329.
- J. Landers, G.Y. Gor, A.V. Neimark. Density functional theory methods for characterization of porous materials. Colloids Surf. A Physicochem. Eng., 2013, 437, 3-32. [CrossRef]
- Bertóti, M. Mohai, K. László. Surface modification of graphene and graphite by nitrogen plasma: Determination of chemical state alterations and assignments by quantitative X-ray photoelectron spectroscopy. Carbon, 2015, 84, 185-196. [CrossRef]
- M. Mohai. XPS MultiQuant: multimodel XPS quantification software. Surf. Interface Anal., 2004, 36 (8), 828-832. [CrossRef]
- S. Evans, R.G. Pritchard, J.M. Thomas. Relative differential subshell photoionization cross-sections (MgKα) from lithium to uranium. J. Electron Spectrosc. Relat. Phenom., 1978, 14 (5), 341-358. [CrossRef]
- R.F. Reilman, A. Msezane, S.T. Manson. Relative intensities in photoelectron spectroscopy of atoms and molecules. J. Electron Spectrosc. Relat. Phenom., 1976, 8 (5), 389-394. [CrossRef]
- B. Nagy, A. Domán, A. Menyhárd, K. László. Influence of graphene oxide incorporation on resorcinol-formaldehyde polymer and carbon aerogels. Periodica Polytechnica Chemical Engineering, 2018, 62 (4), 441–449. [CrossRef]
- M. Thommes, K. Kaneko, A.V. Neimark, J.P. Oliver, F. Rodriguez-Reinoso, J. Rouquerol, K.S.W. Sing. Physisorption of gases, with special reference to the evaluation of surface area and pore size distribution (IUPAC Technical Report). Pure Appl. Chem., 2015, 87 (9-10), 1051-1069. [CrossRef]
- Y. Wang, D.C. Alsmeyer, R.L. McCreery. Raman spectroscopy of carbon materials: Structural basis of observed spectra. Chem. Mater., 1990, 2 (5), 557-563. [CrossRef]
- M.A. Pimenta, G. Dresselhaus, M.S. Dresselhaus, L.G. Cançado, A. Jorio, R. Saito. Studying disorder in graphite-based systems by Raman spectroscopy. Phys. Chem. Chem. Phys., 2007, 9 (11), 1276-1290. [CrossRef]
- Cuesta, P. Dhamelincourt, J. Laureyns, A. Martínez-Alonso, J.M.D. Tascón. Raman microprobe studies on carbon materials. Carbon, 1994, 32, 1523-1532. [CrossRef]
- S. Claramunt, A. Varea, D. López-Díaz, M.M. Velázquez, A. Cornet, A. Cirera. The importance of interbands on the interpretation of the Raman spectrum of graphene oxide. J. Phys. Chem. C, 2015, 119, 10123-10129. [CrossRef]
- M. Couzi, J-L. Bruneel, D. Talaga, L. Bokobza. A multi wavelength Raman scattering study of defective graphitic carbon materials: The first order Raman spectra revisited. Carbon, 2016, 107, 388-394. [CrossRef]
- J. McDonald-Wharry, M. Manley-Harris, K. Pickering. Carbonization of biomass-derived chars and the thermal reduction of a graphene oxide sample studied using Raman spectroscopy. Carbon, 2013, 59, 383-405. [CrossRef]
- Y-R. Rhim, D. Zhang, D. H. Fairbrother, K. A. Wepasnick, K.J. Livi, R.J. Bodnar, D.C. Nagle. Changes in electrical and microstructural properties of microcrystalline cellulose as function of carbonization. Carbon, 2010, 48 (4), 1012-1024. [CrossRef]
- N. Gavrilov, I.A. Pasti, M. Mitric, J. Trava-Sejdic, G. Ciric-Marjanonic, S.V. Mantus. Electrocatalysis of oxygen reduction reaction on polyaniline-derived nitrogen-doped carbon nanoparticle surfaces in alkaline media. J. Power Sources. 2012, 220, 306-316. [CrossRef]
- D. Yin, N. Lu, Z.-Y. Li, J.-L. Yang. A computational infrared spectroscopic study of graphene oxide. J. Chem. Phys., 2013, 139, 084704. [CrossRef]
- X. Jiao, Y. Qiu, L. Zhangab, X. Zhang. Comparison of the characteristic properties of reduced graphene oxides synthesized from natural graphites with different graphitization degrees. RSC Adv., 2017, 7, 52337–52344. [CrossRef]
- Z. Ling, G. Wang, Q. Dong, B. Qian, M. Zhang, C. Lia, J. Qiu. An ionic liquid template approach to graphene–carbon xerogel composites for supercapacitors with enhanced performance. J. Mater. Chem. A, 2014, 2 (35), 14329–14333. [CrossRef]
- H. Lu, C. Yang, J. Chen, J. Li, H. Jin, J. Wang, S. Wang. Tailoring hierarchically porous nitrogen-, sulfur-codoped carbon for high-performance supercapacitors and oxygen reduction. Small, 2020, 16 (17), 1906584. [CrossRef]
- L. Ge, D. Wang, P. Yang, H. Xu, L. Xiao, G-X. Zhang, X. Lu, Z. Duan, F. Meng, J. Zhang, M. An. Graphite N-C-P dominated three-dimensional nitrogen and phosphorus co-doped holey graphene foams as high-efficiency electrocatalyst for Zn-air batteries. Nanoscale, 2019, 11, 17010-17017. [CrossRef]
- Y. Zhao, S. Huang, M. Xia, S. Rehman, S. Mu, Z. Kou, Z. Zhang, Z. Chen, F. Gao, Y. Hou. N-P-O co-doped high performance 3D graphene prepared through red phosphorus-assisted “cutting-thing” technique: A universal synthesis and multifunctional applications. Nano Energy, 2016, 28, 346-355. [CrossRef]
- J. Tong, W. Ma, W. Wang, J. Ma, W. Li, L. Bo, H. Fan. Nitrogen/phosphorus dual-doped hierarchically porous graphitic biocarbon with greatly improved performance on oxygen reduction reaction in alkaline media. J. Electroanal. Chem., 2018, 809, 163-170. [CrossRef]
- J. Zhang, L. Qu, G. Shi, J. Liu, J. Chen, L. Dai. N, P-codoped carbon networks as efficient metal-free bifunctional catalysts for oxygen reduction and hydrogen evolution reactions. Angew. Chem., 2015, 128 (6), 2270-2274. [CrossRef]
- Y-N. Zhu, C-Y. Cao, W-Y. Jiang, S-L. Yang, J-S. Hu, W-G. Song, L-J. Wan. Nitrogen, phosphorus, and sulfur co-doped ultrathin carbon nanosheets as a metal-free catalyst for selective oxidation of aromatic alkanes and the oxygen reduction reaction. J. Mater. Chem. A, 2016, 4 (47), 18470-18477. [CrossRef]
- J. Wu, X. Zheng, C. Jin, J. Tian, R. Yang. Ternary doping of phosphorus, nitrogen, and sulfur into porous carbon for enhancing electrocatalytic oxygen reduction. Carbon, 2015, 92, 327-338. [CrossRef]
- X. Zheng, X. Cao, J. Wu, J. Tian, C. Jin, R. Yang. Yolk-shell N/P/B ternary-doped biocarbon derived from yeast cells for enhanced oxygen reduction reaction. Carbon, 2016, 107, 907-916. [CrossRef]
- P. Chandran, A. Ghosh, S. Ramaprabhu. High-performance platinum-free oxygen reduction reaction and hydrogen oxidation reaction catalyst in polymer electrolyte membrane fuel cell. Sci. Rep., 2018, 8, 3591. [CrossRef]
- C. Moreno-Castilla, M.B. Dawidziuk, F. Carrasco-Marín, E. Morallón. Electrochemical performance of carbon gels with variable surface chemistry and physics. Carbon, 2012, 50 (9), 3324-3332. [CrossRef]
- B. Lobato, L. Suárez, L. Guardia, T. A. Centeno. Capacitance and surface of carbons in supercapacitors. Carbon, 2017, 122, 434-445.
- Y. Lu, Z. Ye, Y. Zhao, Q. Li, M. He, C. Bai, X. Wang, Y. Han, X. Wan, S. Zhang, Y. Ma, Y. Chen. Graphene supported double-layer carbon encapsulated silicon for high-performance lithium-ion battery anode materials. Carbon, 2023, 201, 962–971. [CrossRef]
- T.J. Yokokura, J.R. Rodriguez, V.G. Pol, Waste biomass-derived carbon anode for enhanced lithium storage, ACS Omega, 2020, 5 (31), 19715–19720. [CrossRef]
- J. Wang, P. Nie, B. Ding, S. Dong, X. Hao, H. Dou, X. Zhang. Biomass derived carbon for energy storage devices. J. Mater. Chem. A, 2017, 5 (6), 2411–2428. [CrossRef]
- A.S. Alex, M.S. Ananda Lekshmi, V. Sekkar, B. John, C. Gouri, S.A. Ilangovan. Microporous carbon aerogel prepared through ambient pressure drying route as anode material for lithium ion cells. Polym. Adv. Technol., 2017, 28 (12), 1945–1950. [CrossRef]
- S. T. Taleghani, B. Marcos, K. Zaghib, G. Lantagne. A study on the effect of porosity and particles size distribution on Li-ion battery performance. J. Electrochem. Soc., 2017, 164, E3179.
- E. Duraisamy, A. Prasath, V.S. Devi, M.N.M. Ansari, P. Elumalai. Sustainably-derived hierarchical porous carbon from spent honeycomb for high-performance lithium-ion battery and ultracapacitors. Energy Storage, 2020, 2 (4), e136. [CrossRef]
- K. Kim, R.A. Adams, P.J. Kim, A. Arora, E. Martinez, J.P. Youngblood, V.G. Pol. Li-ion storage in an amorphous, solid, spheroidal carbon anode produced by dry-autoclaving of coffee oil. Carbon, 2018, 133, 62−68. [CrossRef]
- A.M. Stephan, T.P. Kumar, R. Ramesh, S. Thomas, S.K. Jeong, K.S. Nahm. Pyrolitic carbon from biomass precursors as anode materials for lithium batteries. Mater. Sci. Eng. A, 2006, 430 (1-2), 132− 137. [CrossRef]
- R.R. Gaddam, D. Yang, R. Narayan, KVSN. Raju, N.A. Kumar, X.S. Zhao. Biomass derived carbon nanoparticle as anodes for high performance sodium and lithium ion batteries. Nano Energy, 2016, 26, 346−352. [CrossRef]
- W. Xing, J.S. Xue, J.R. Dahn. Optimizing pyrolysis of sugar carbons for use as anode materials in lithium-ion batteries. J. Electrochem. Soc., 1996, 143, 3046−3052. [CrossRef]
- W. Wang, Y. Sun, B. Liu, S. Wang, M. Cao. Porous carbon nanofiber webs derived from bacterial cellulose as an anode for high-performance lithium-ion batteries. Carbon, 2015, 91, 56–65. [CrossRef]
- Paudics, S. Farah, I. Bertóti, K. László, M. Mohai, A. Szilágyi, M. Kubinyi. Fluorescence probing of binding sites on graphene oxide nanosheets with Oxazine 1 dye. Appl. Surf. Sci. 2021, 541, 148451.

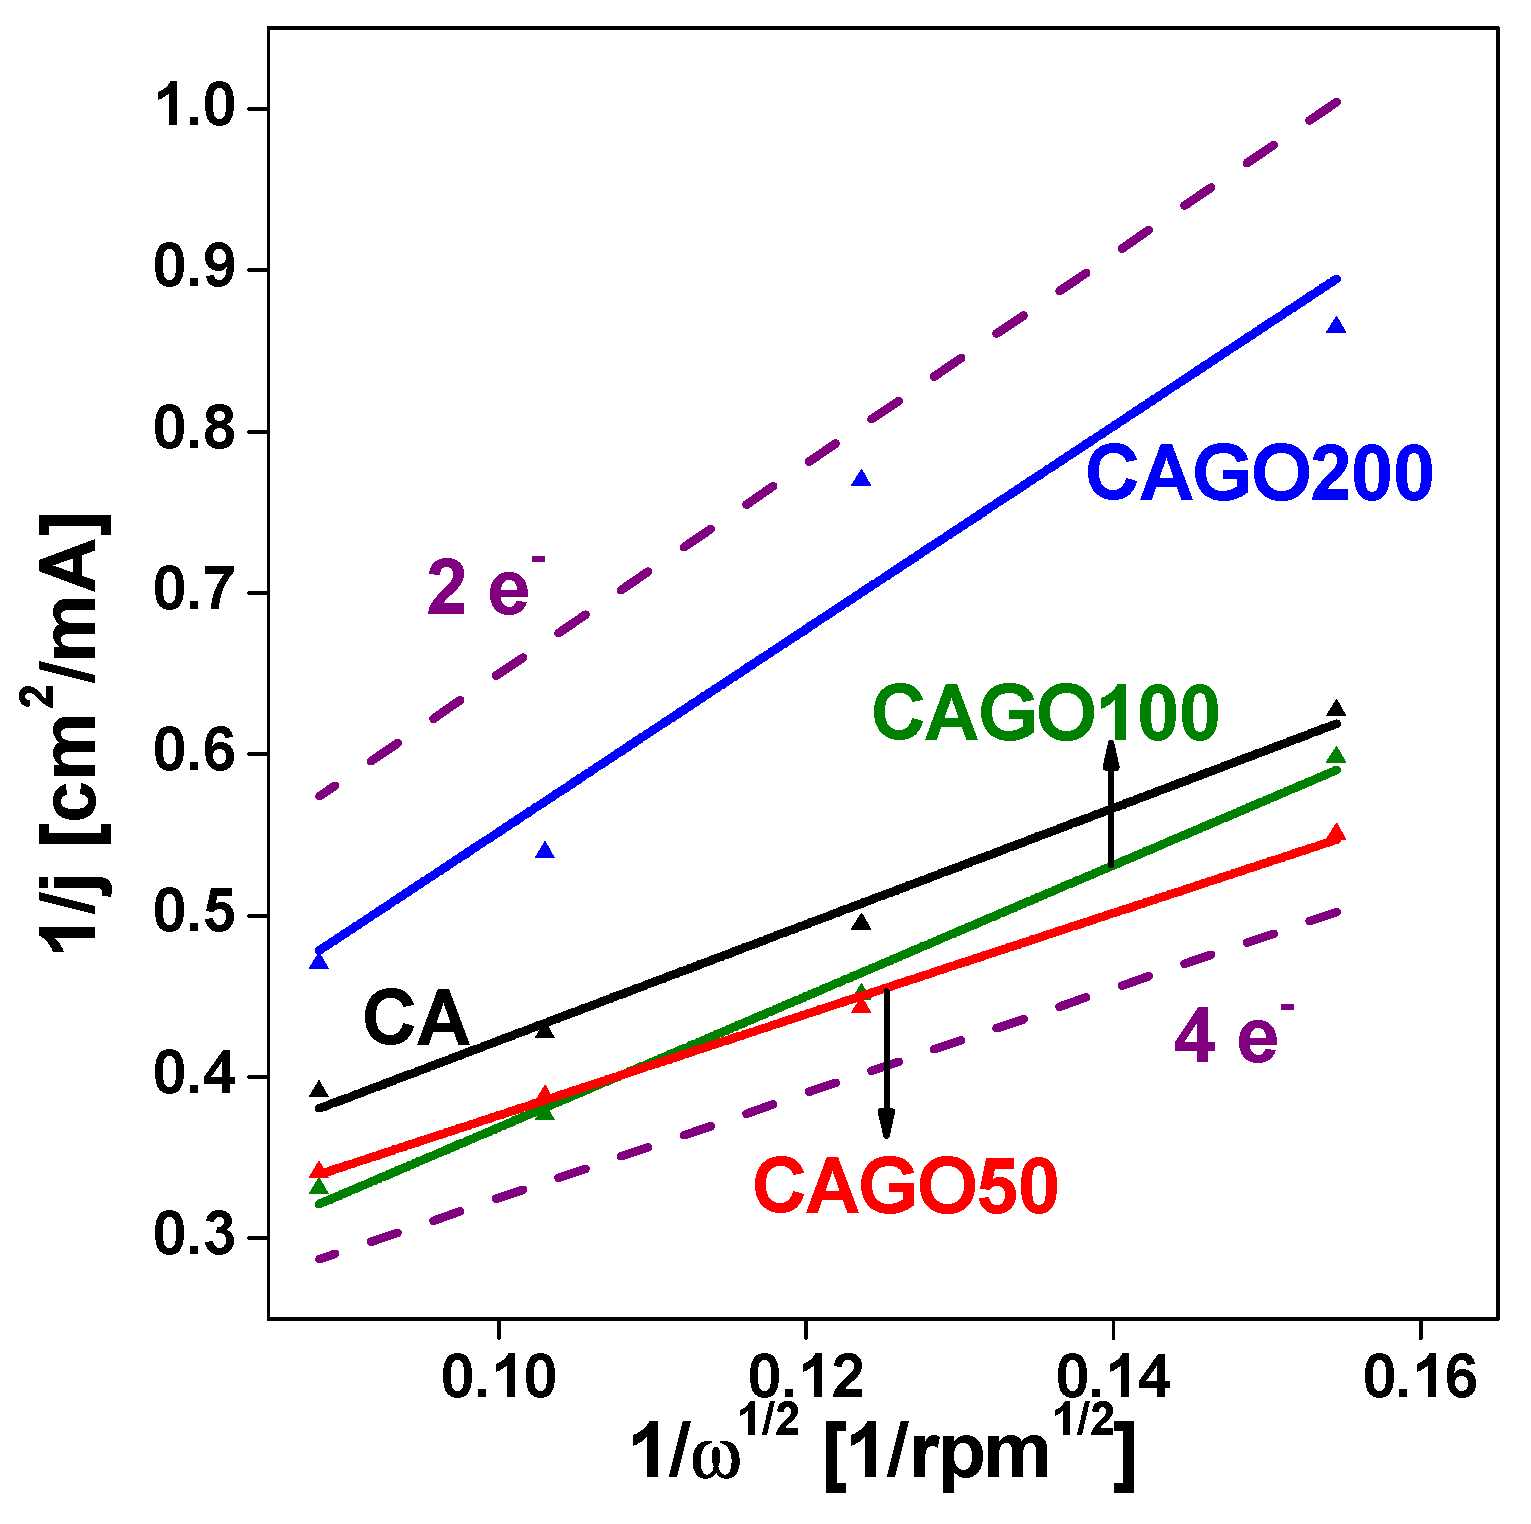

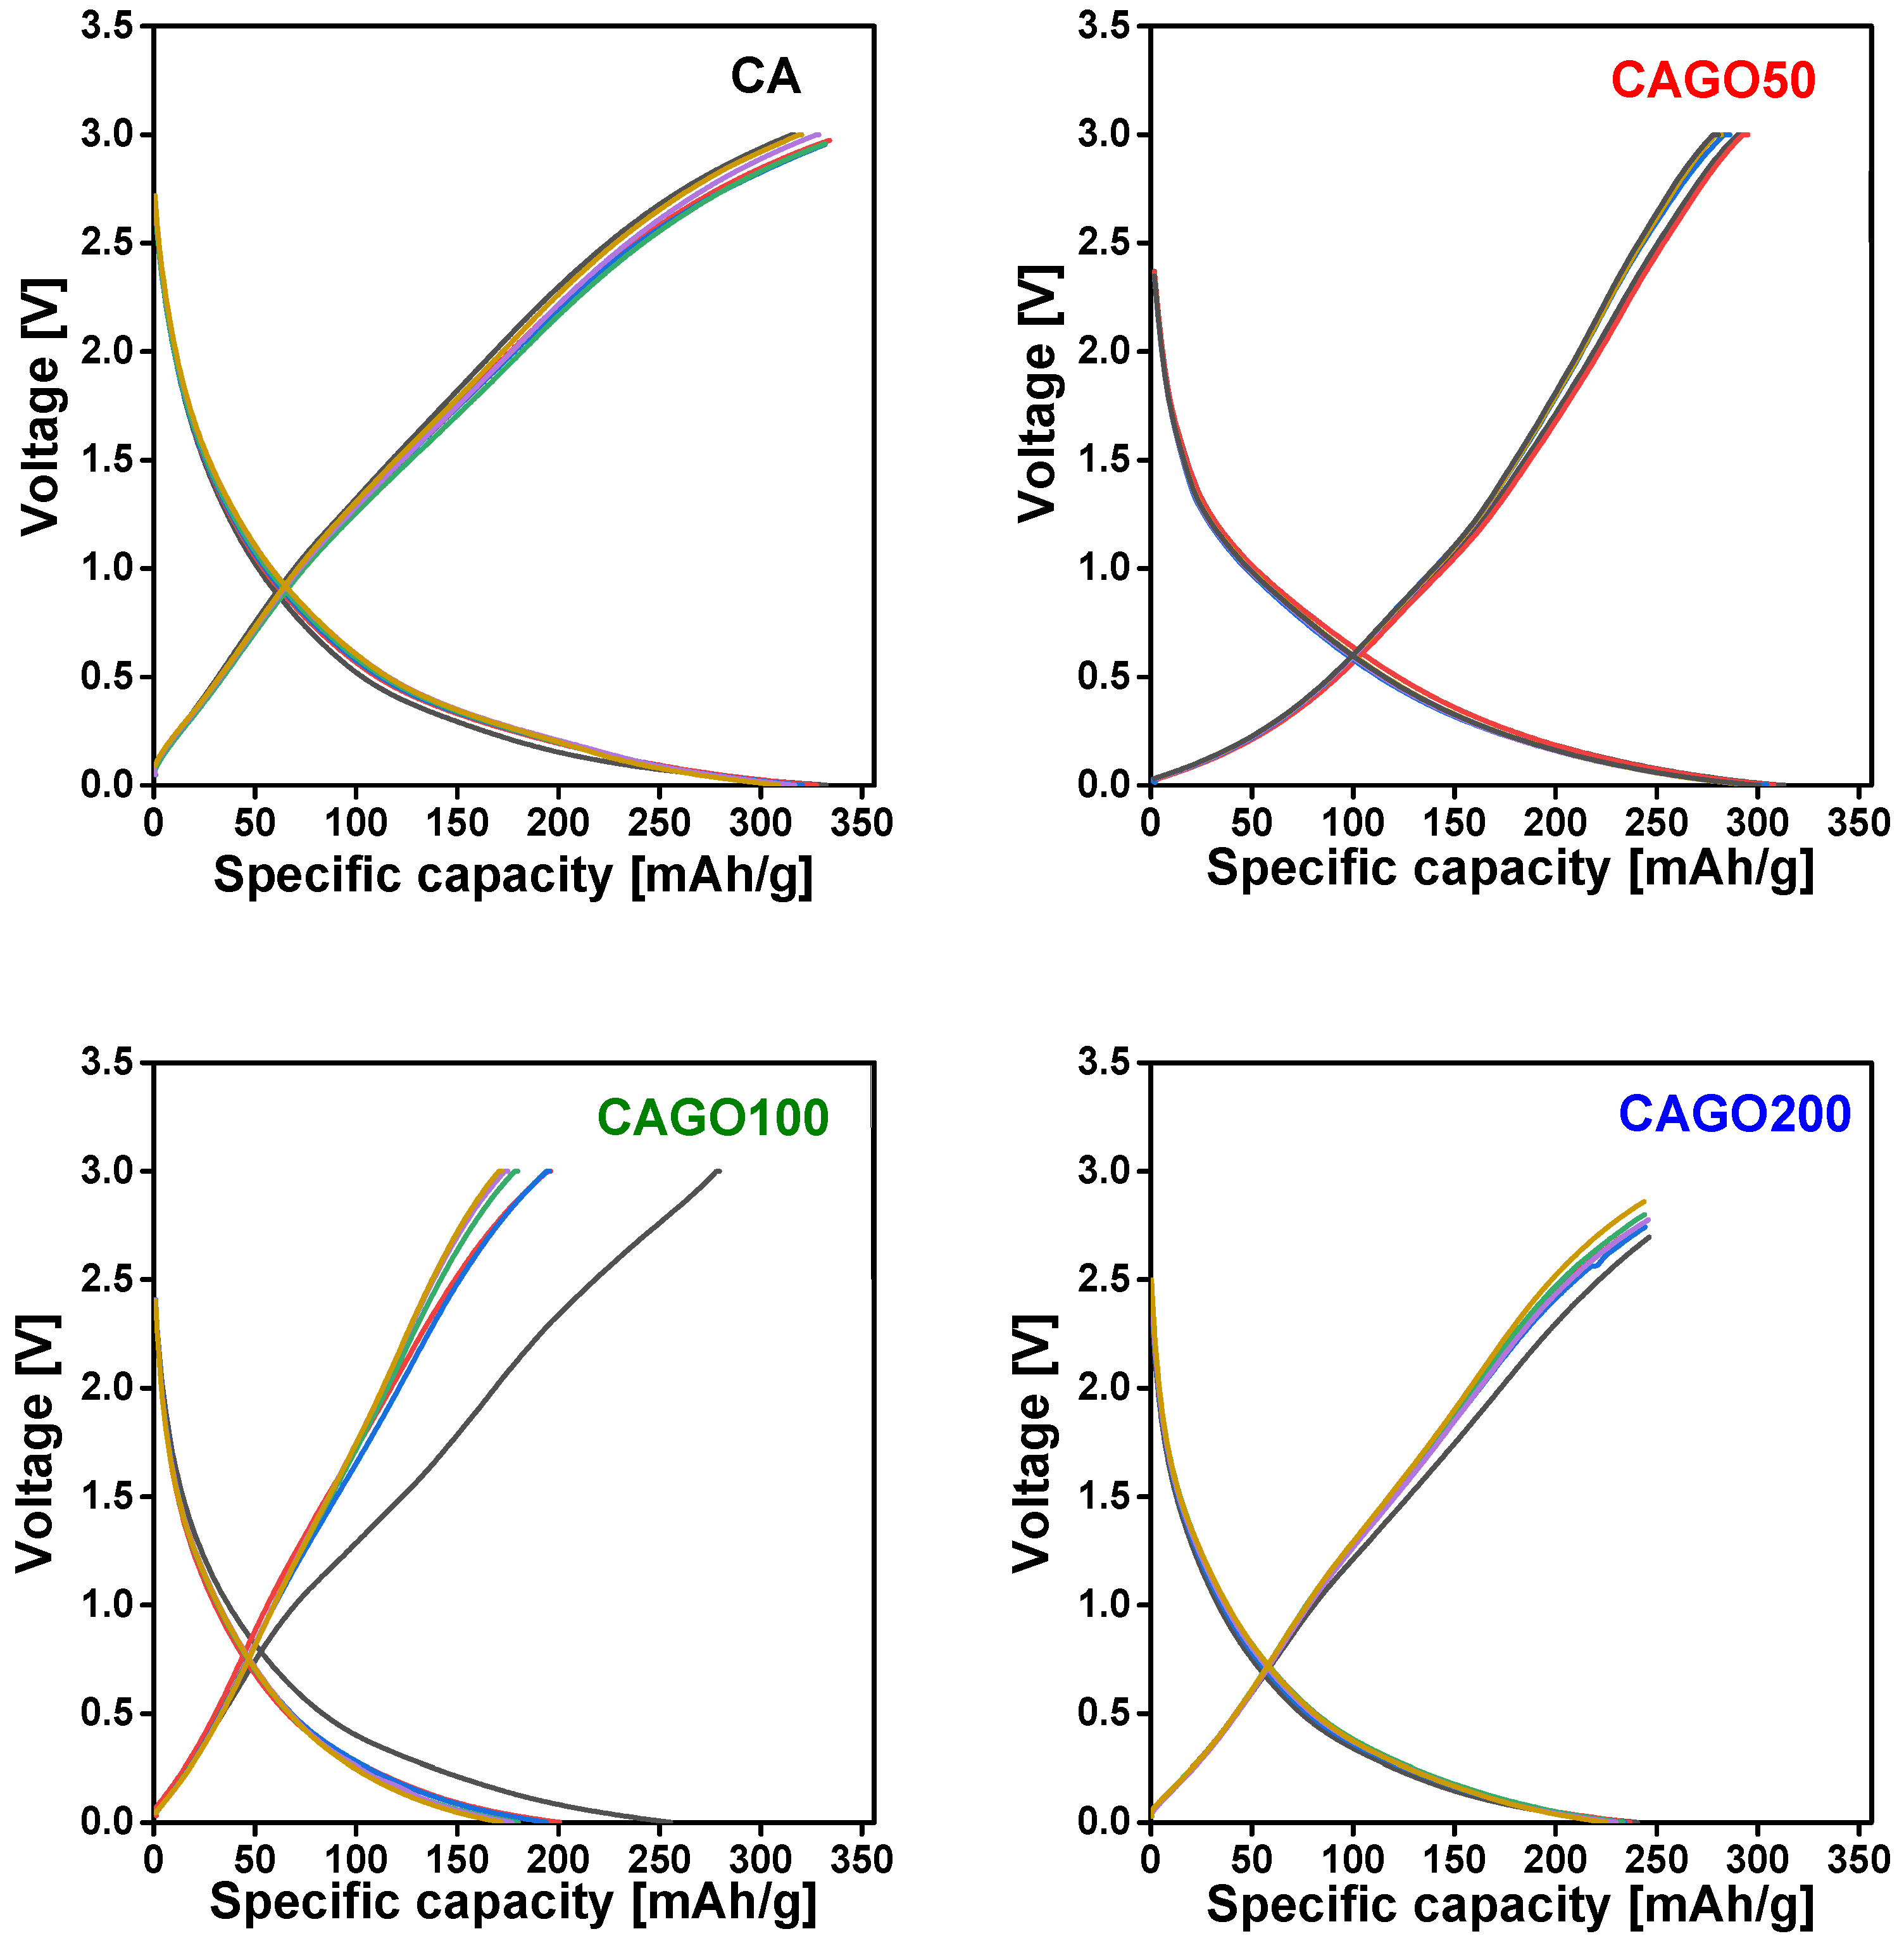
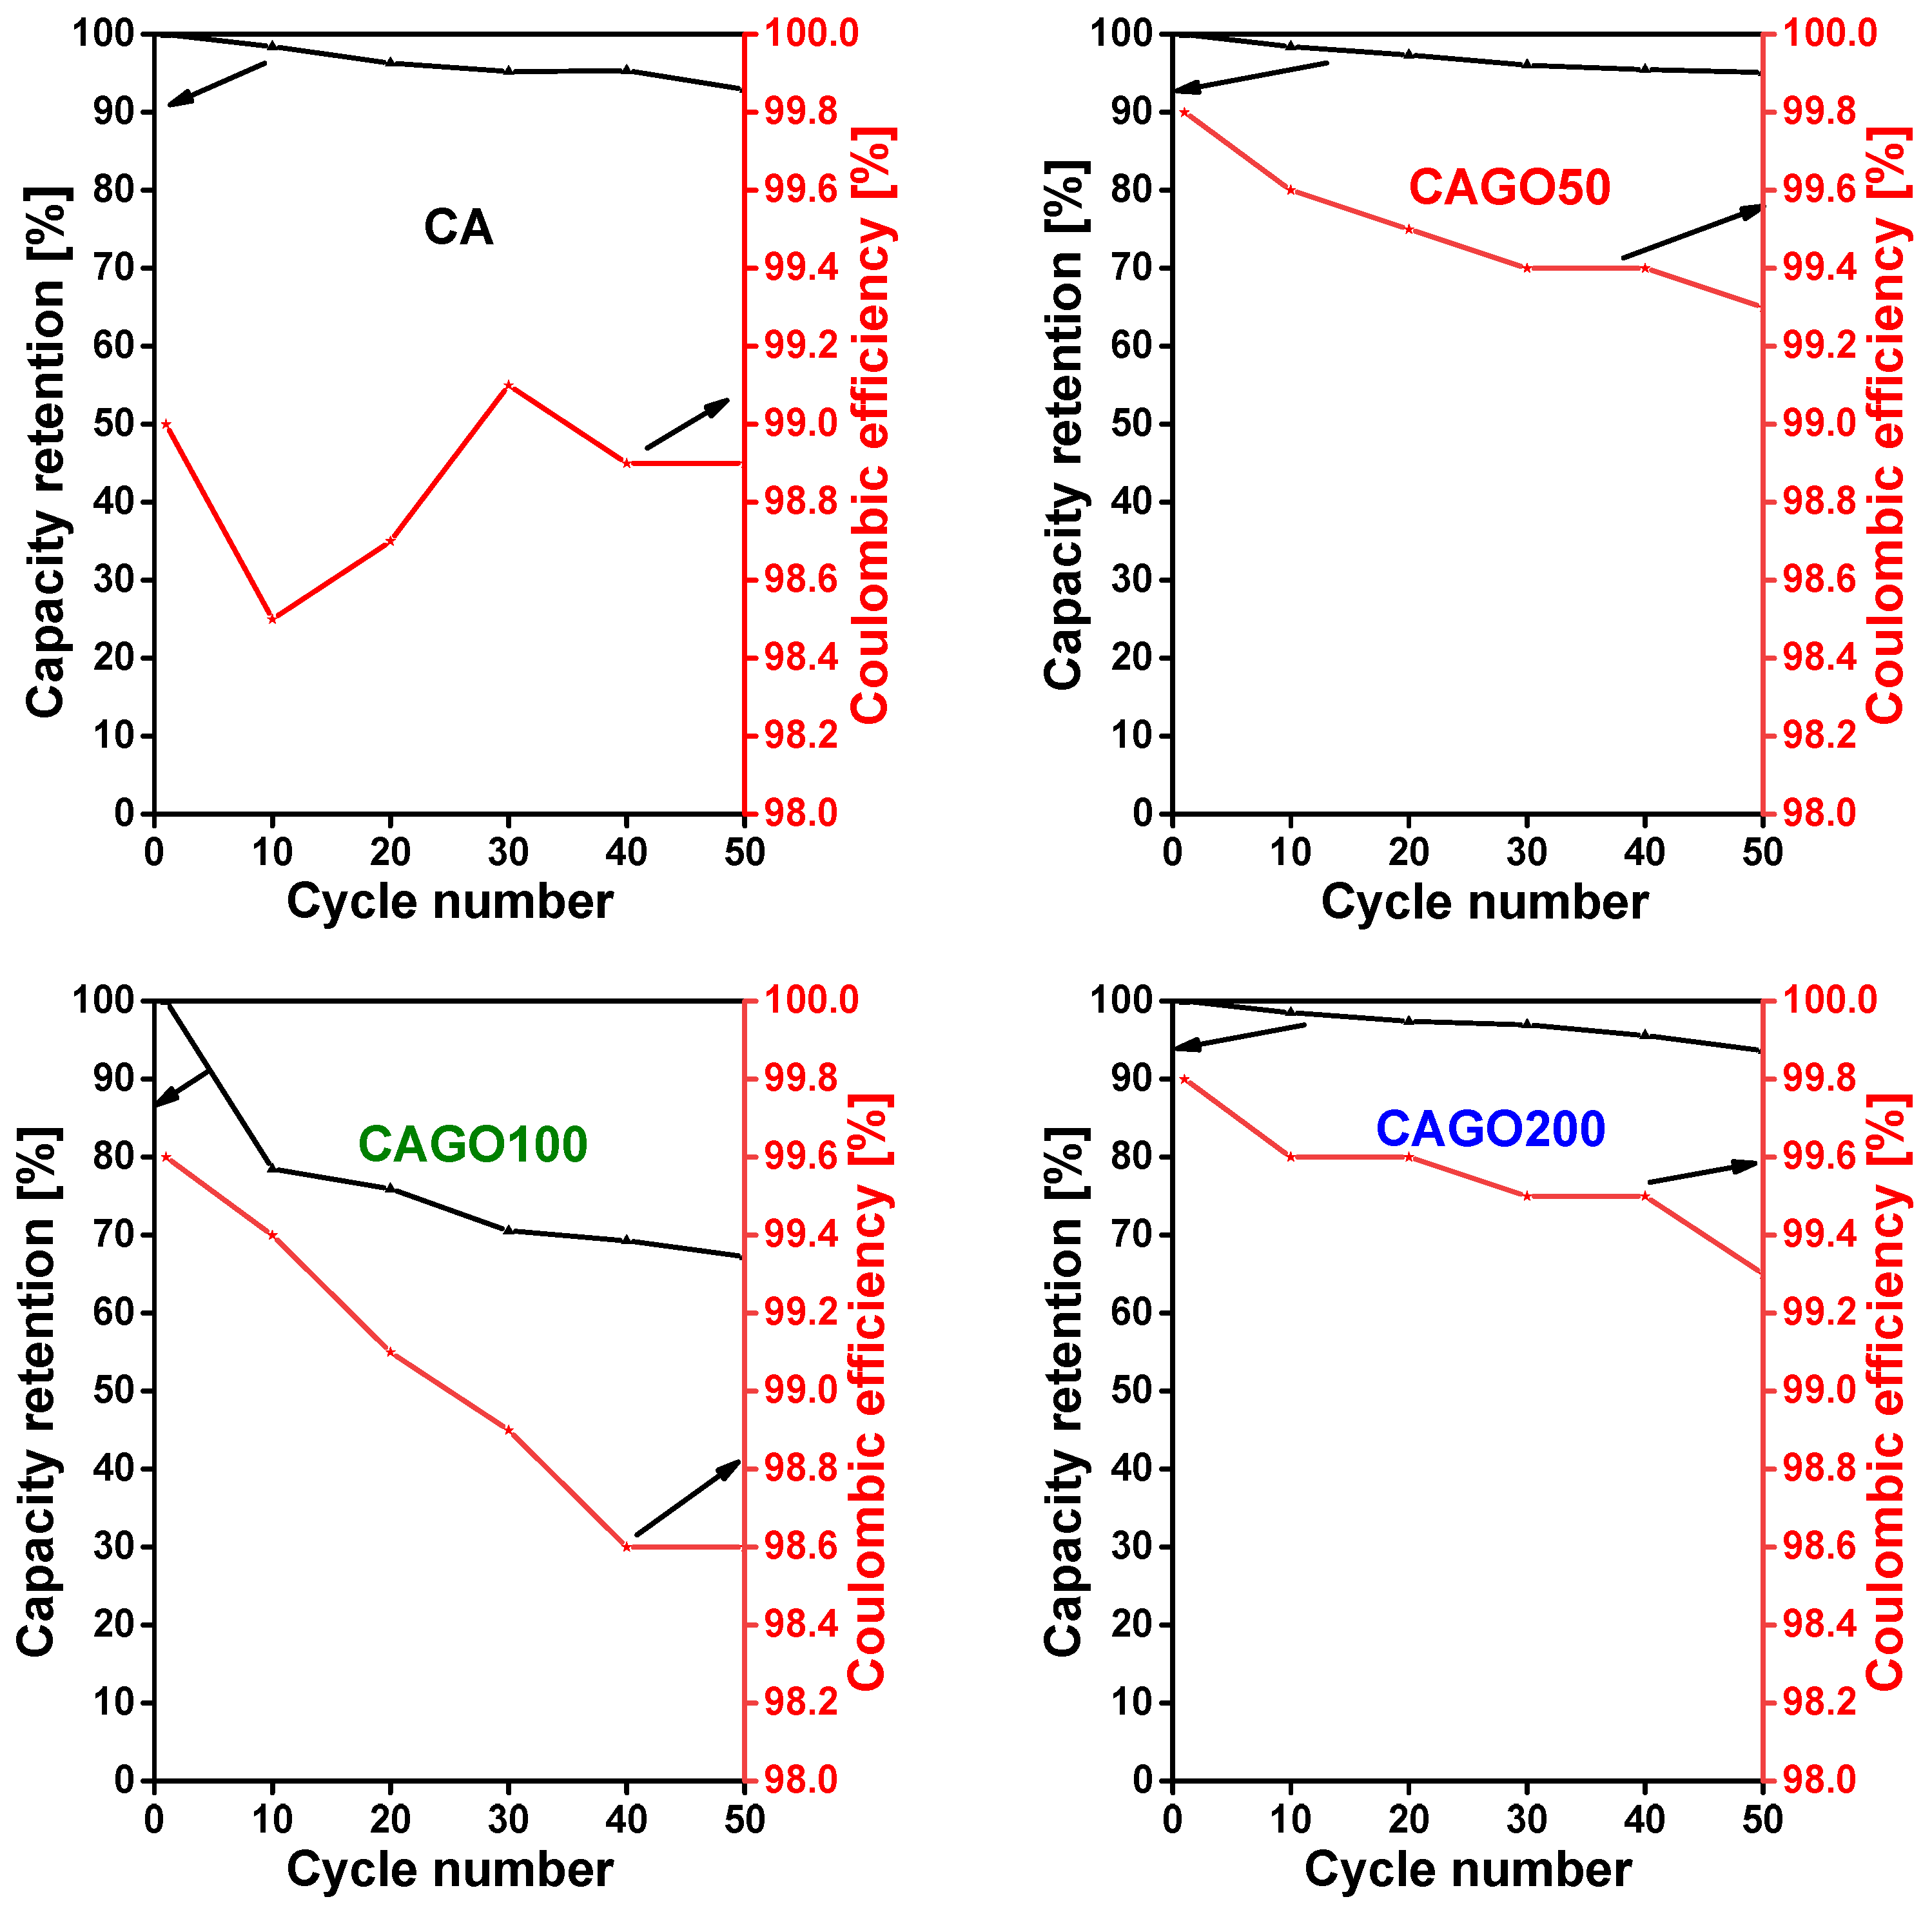
| Method | Parameter | Units | CA | CAGO50 | CAGO100 | CAGO200 |
|---|---|---|---|---|---|---|
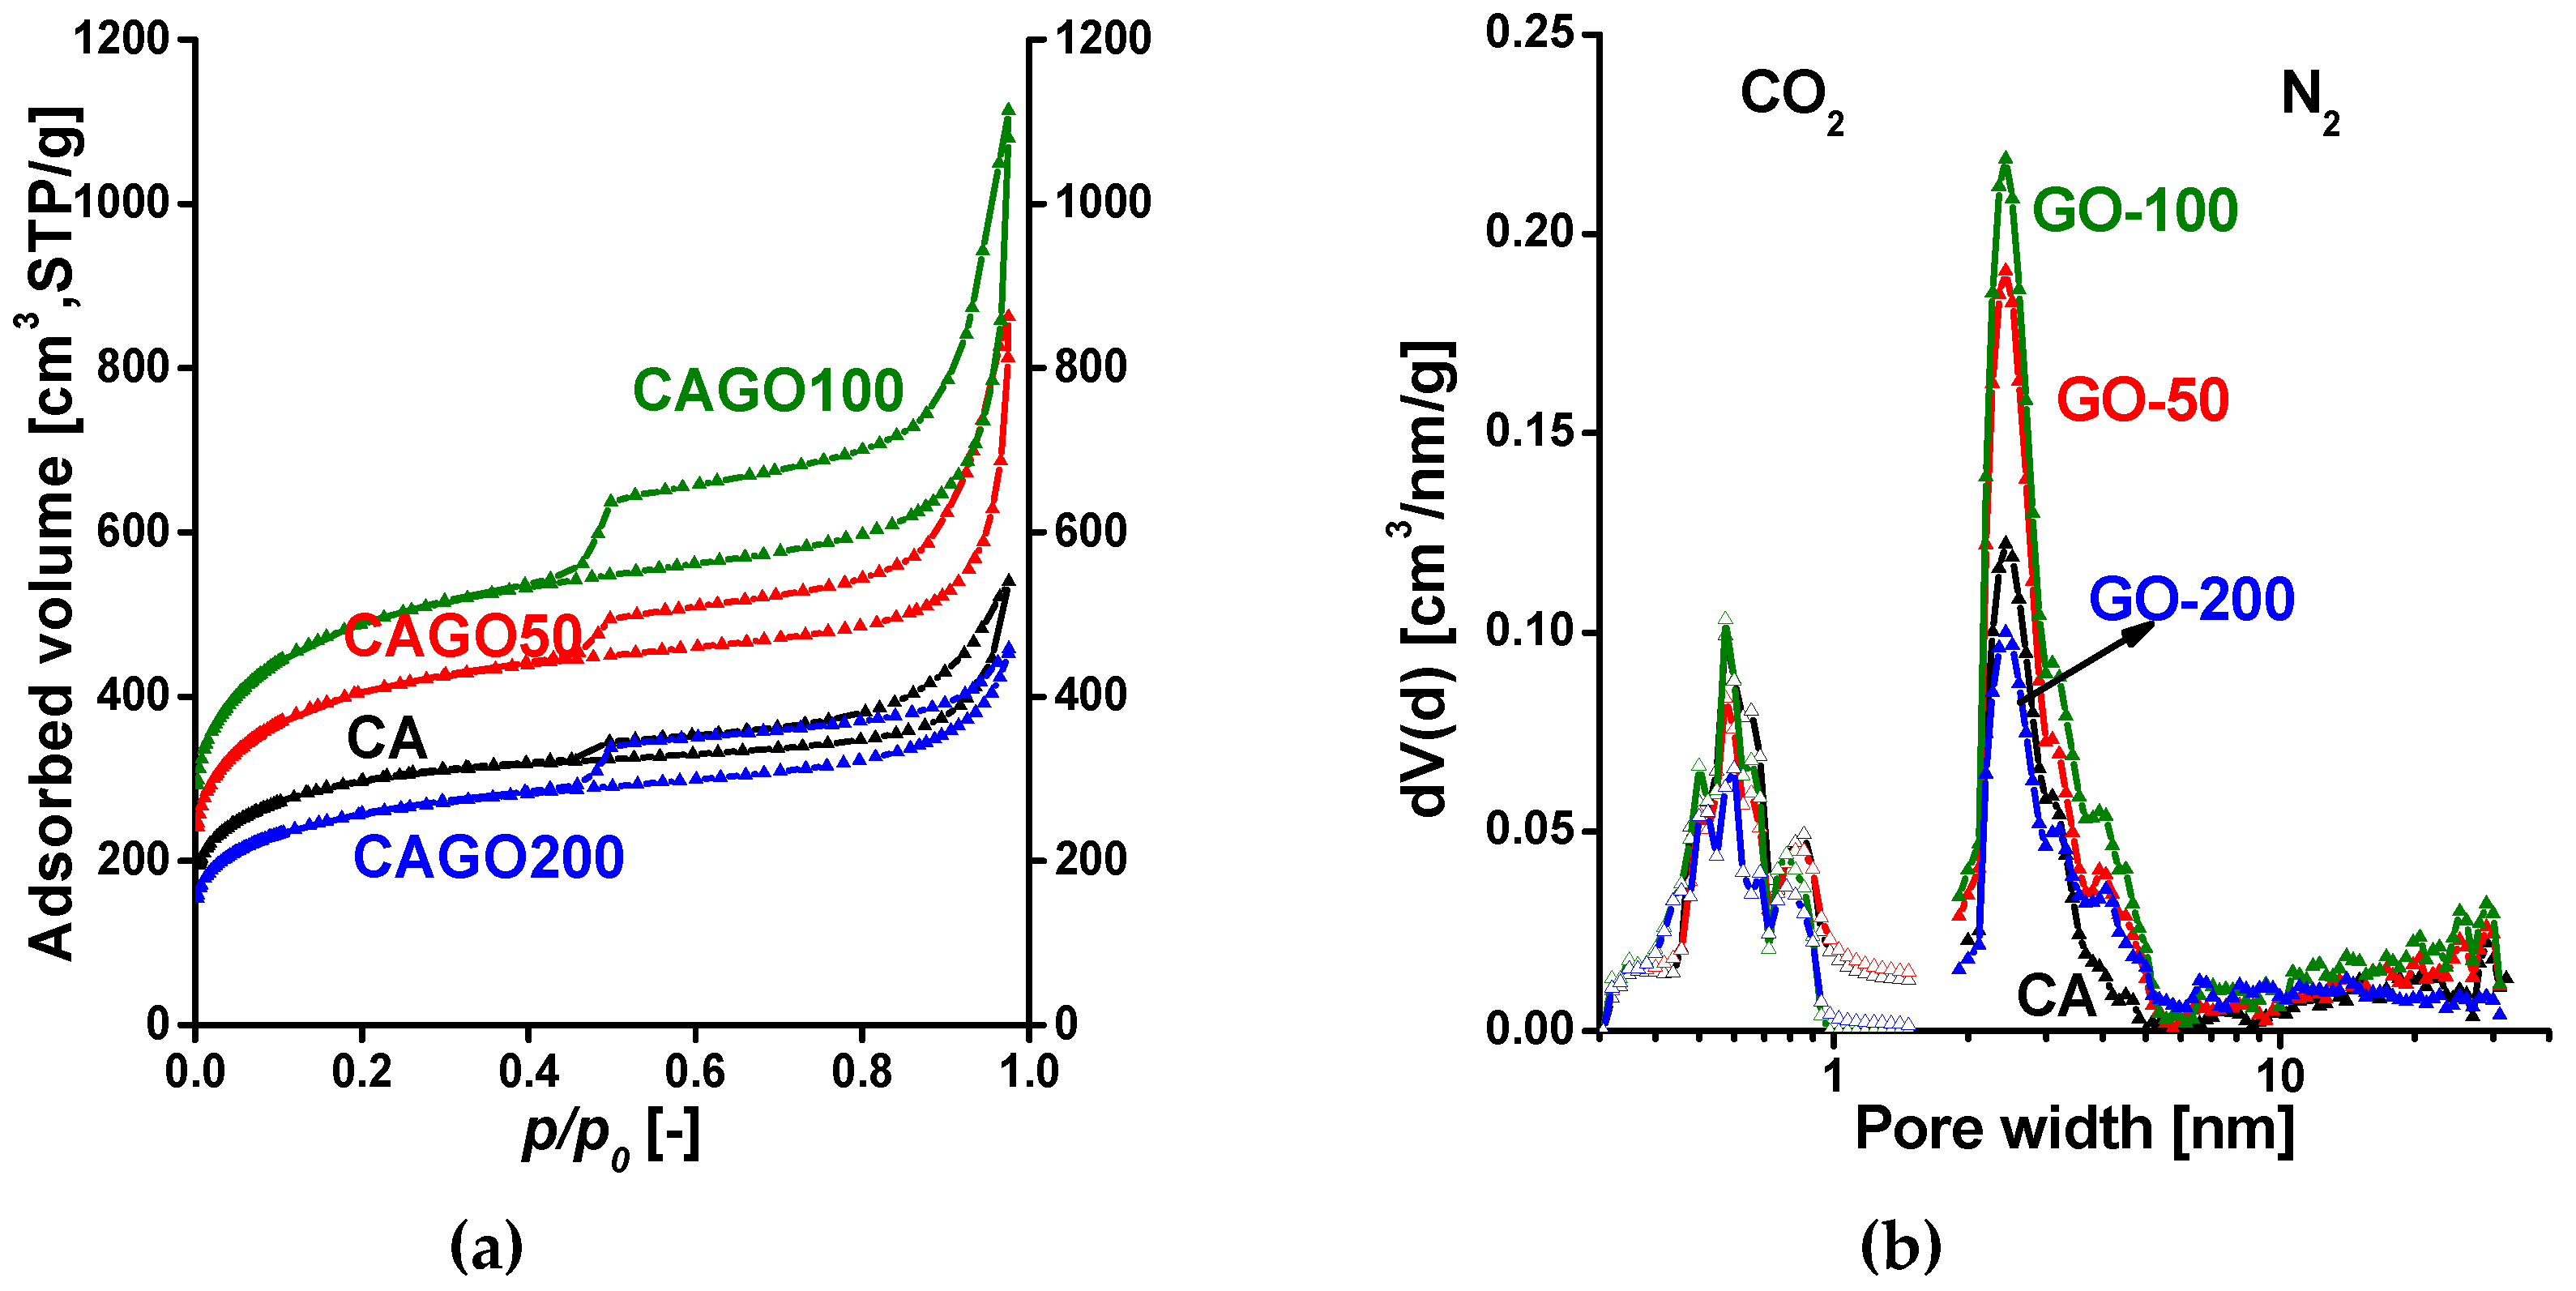
| From N2 | SBET | [m2/g] | 1070 | 1479 | 1779 | 933 |
| V0.98 | [cm3/g] | 0.83 | 1.33 | 1.72 | 0.71 | |
| Vmicro,DR | [cm3/g] | 0.42 | 0.54 | 0.64 | 0.34 | |
| [%] | 51 | 40 | 37 | 48 | ||
| Vmicro,DFT | [cm3/g] | 0.31 | 0.40 | 0.48 | 0.25 | |
| [%] | 37 | 30 | 28 | 35 | ||
| From CO2 | Vumicro,DR | [cm3/g] | 0.073 | 0.062 | 0.059 | 0.041 |
| Vumicro,DFT | [cm3/g] | 0.042 | 0.039 | 0.030 | 0.025 |
| Sample | C | O | N | S | O / C | N / C | S / C | O+N+S C |
S / N |
|---|---|---|---|---|---|---|---|---|---|
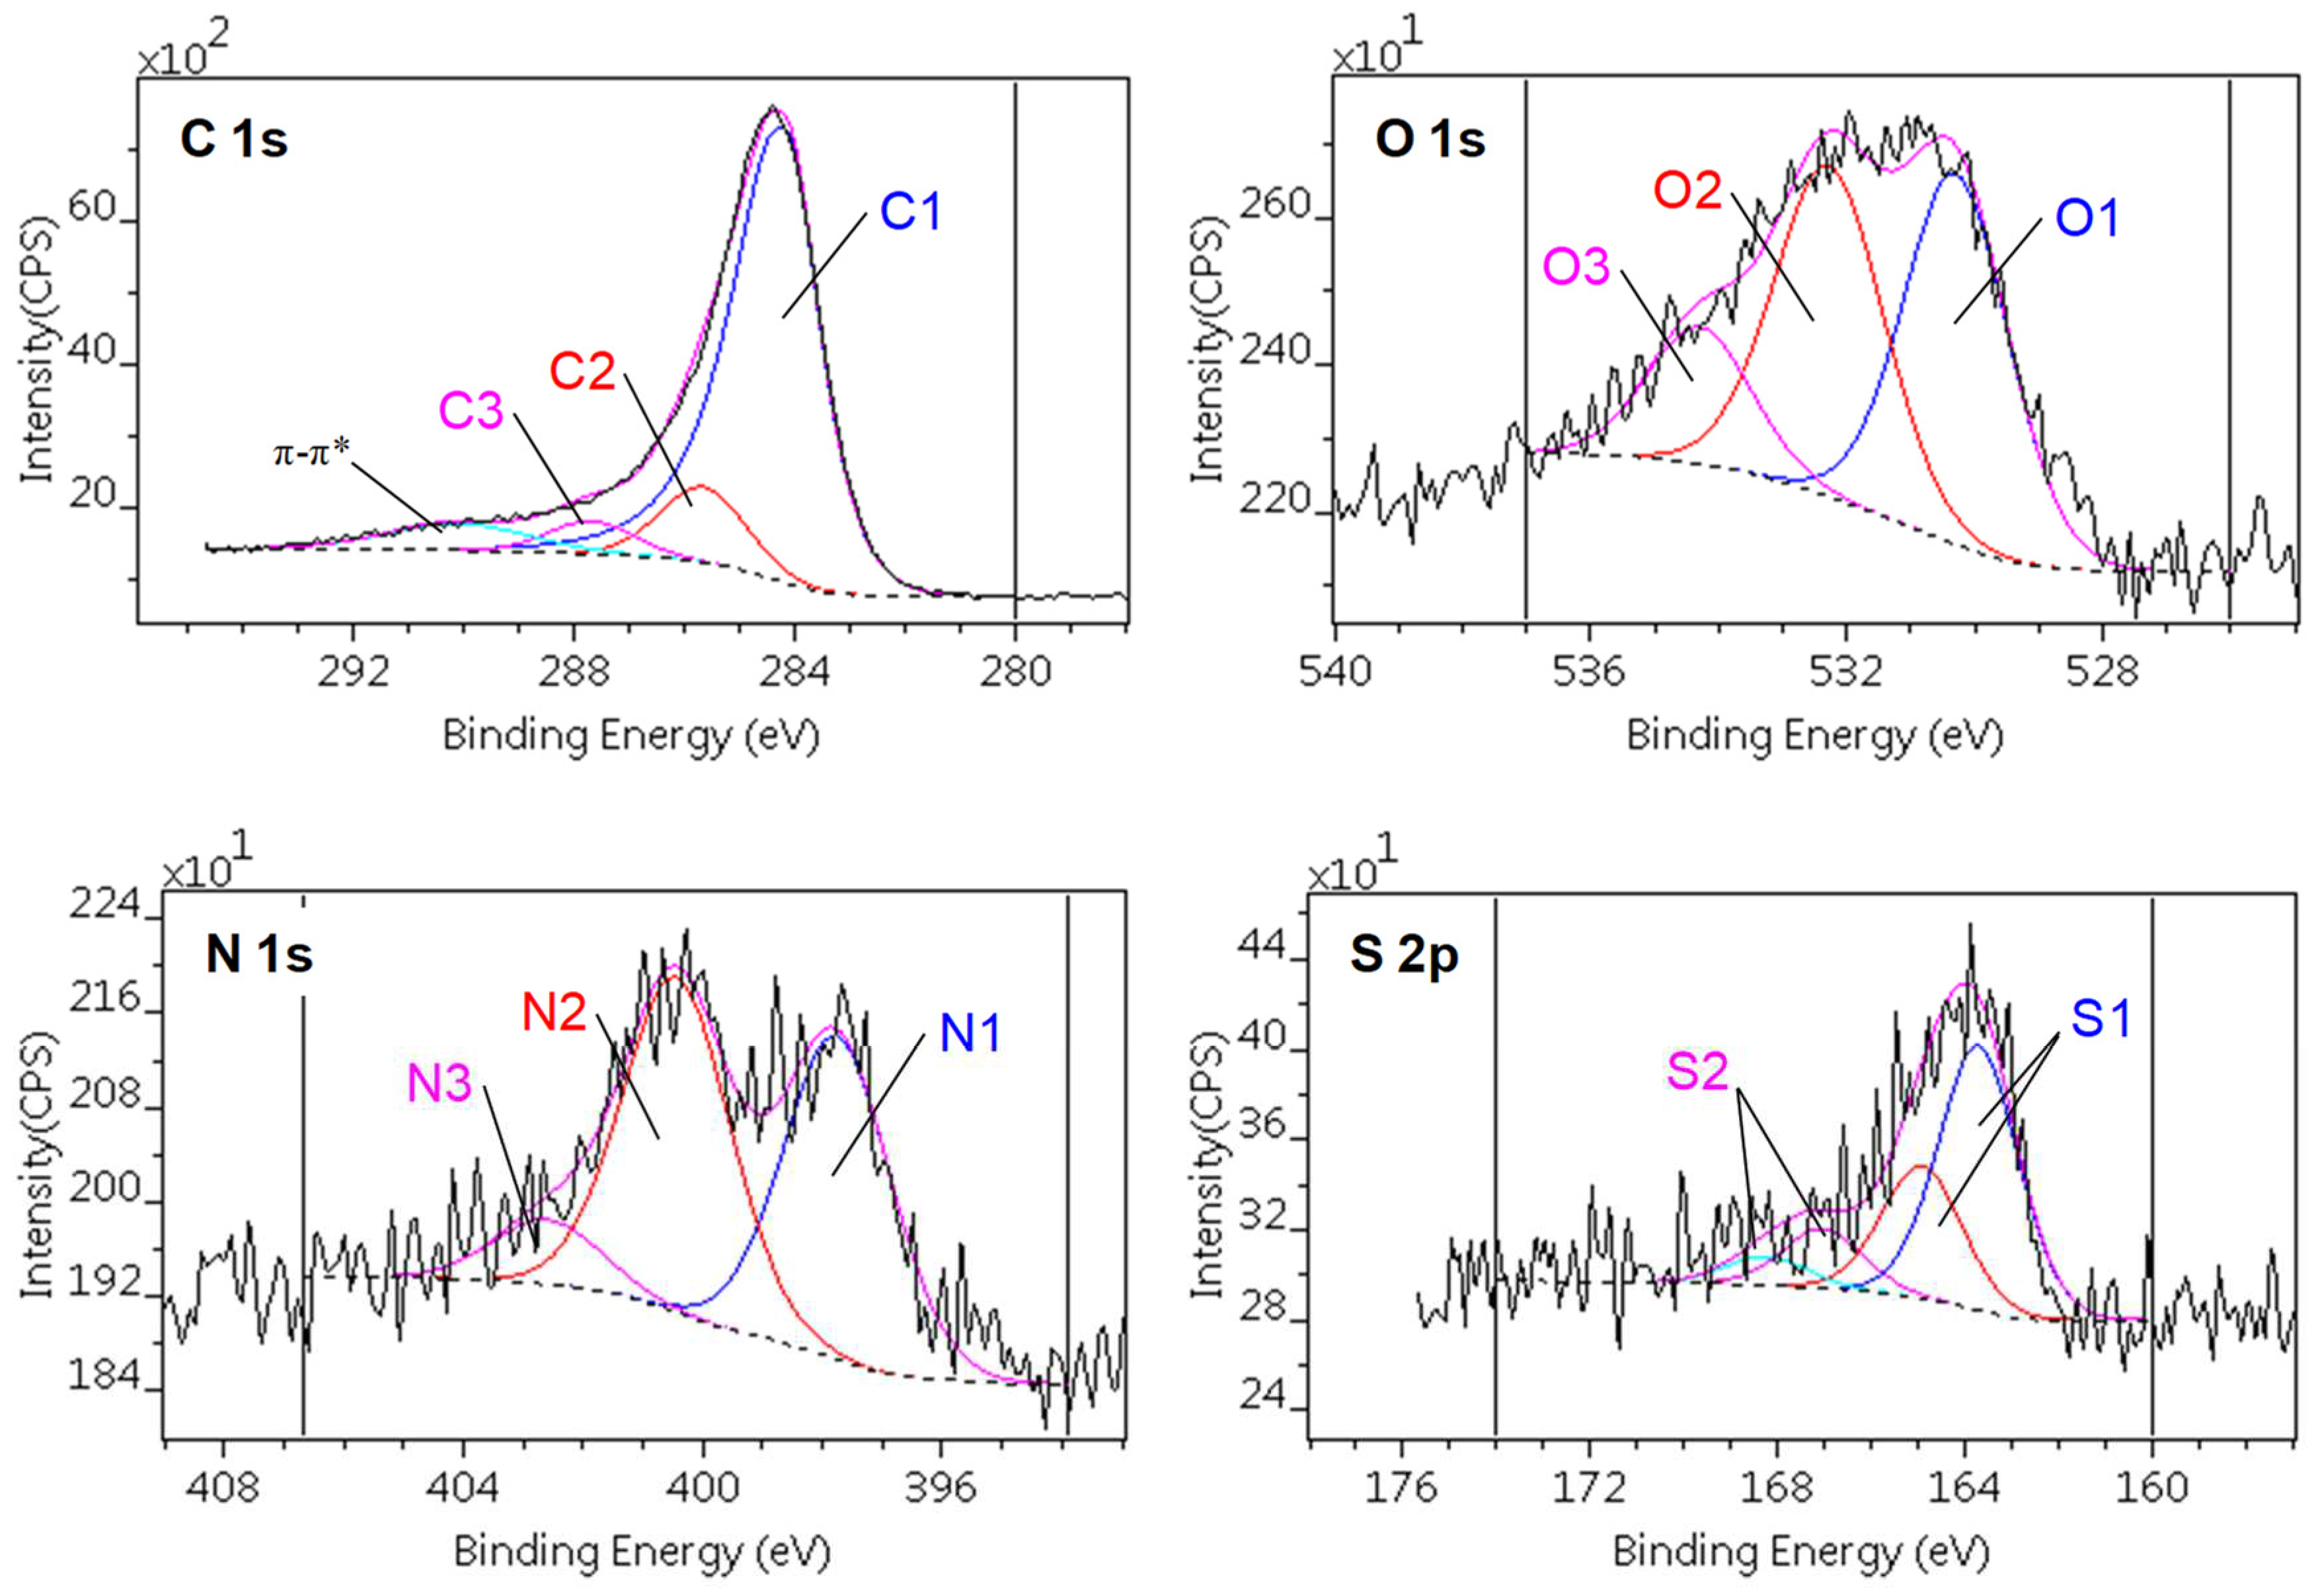
| CA | 90.6 | 3.3 | 5.1 | 1.0 | 0.036 | 0.056 | 0.011 | 0.104 | 0.196 |
| CAGO50 | 92.0 | 3.1 | 3.7 | 1.3 | 0.034 | 0.039 | 0.014 | 0.087 | 0.361 |
| CAGO100 | 90.7 | 4.1 | 4.1 | 1.2 | 0.045 | 0.045 | 0.013 | 0.104 | 0.293 |
| CAGO200 | 90.4 | 3.7 | 4.4 | 1.4 | 0.041 | 0.049 | 0.015 | 0.105 | 0.318 |
| GO-film | 67.4 | 32.1 | - | 0.5 | 0.476 | - | 0.007 | 0.484 | - |
| C1s | O1s | |||||
|---|---|---|---|---|---|---|
| C1 | C2 | C3 | O1 | O2 | O3 | |
| Chemical state | sp2 C=C | C–O C–N C–S |
C=O O–C–O N–C–O |
S–O | C–O–C C–OH C=O |
OC–O–CO (H2O) |
| Binding energy [eV] | 284.3 – 284.4 |
285.7 – 285.8 |
287.5 – 287.9 |
530.2 – 530.6 | 532.1 – 532.5 | 533.9 – 534.3 |
| CA | 74.0 | 10.9 | 5.4 | 1.5 | 1.7 | |
| CAGO50 | 78.8 | 7.4 | 5.5 | 1.9 | 1.3 | |
| CAGO100 | 74.7 | 11.0 | 4.8 | 1.8 | 1.7 | 0.7 |
| CAGO200 | 75.9 | 9.4 | 4.8 | 1.8 | 1.6 | 0.5 |
| N1s | S2p | ||||
|---|---|---|---|---|---|
| N1 | N2 | N3 | S1 | S2 | |
| Chemical state | C–N | OO–C–N | C–N+ | C–S | C–SO3 |
| Binding energy [eV] | 397.8 – 398.0 |
400.4 – 400.5 | 402.4 – 402.7 | 164.9 – 165.0 | 168.3 – 168.6 |
| CA | 2.3 | 2.3 | 0.8 | 0.9 | 0.2 |
| CAGO50 | 1.6 | 1.7 | 0.6 | 1.2 | n.d. |
| CAGO100 | 1.9 | 1.9 | 0.4 | 1.0 | 0.2 |
| CAGO200 | 2.0 | 2.0 | 0.7 | 1.1 | 0.3 |
| Sample | BET surface area [m2/g] |
Onset potential [mV] |
E1/2 [mV] |
Number of e- transferred | Ref. |
|---|---|---|---|---|---|
| SWCNT@N,P doped carbon | 616 | 920 | 850 | 3.91 | [69] |
| N,S co-doped 3D rGO | 392 | 895 | 732 | 3.87 | [70] |
| N,S porous carbon materials | 732 | 940 | 840 | - | [95] |
| N,P-holey graphene foams | 758 | 983 | 865 | 3.70 | [96] |
| 3D-high performance graphene | 1406 | 928 | 836 | 3.83 | [97] |
| N,P porous graphitic biocarbon | 845 | -14 (vs. Ag/AgCl) |
-115 (vs. Ag/AgCl) |
3.9 | [98] |
| N,P co-doped carbon | 375 | 950 | 820 | 3.7 | [99] |
| N,P,S co-doped carbon nanosheets | 1198 | 938 | 800 | 3.8 – 4.0 | [100] |
| P,N,S-porous carbon | 711 | 905 | 780 | 3.68 – 3.96 | [101] |
| N,P,B biocarbon | 1155 | 904 | 790 | 3.78 – 3.90 | [102] |
| Pt/C (20 wt.% Pt on Vulcan XC-72) | - | 960 | 869 | 3.96 | [102] |
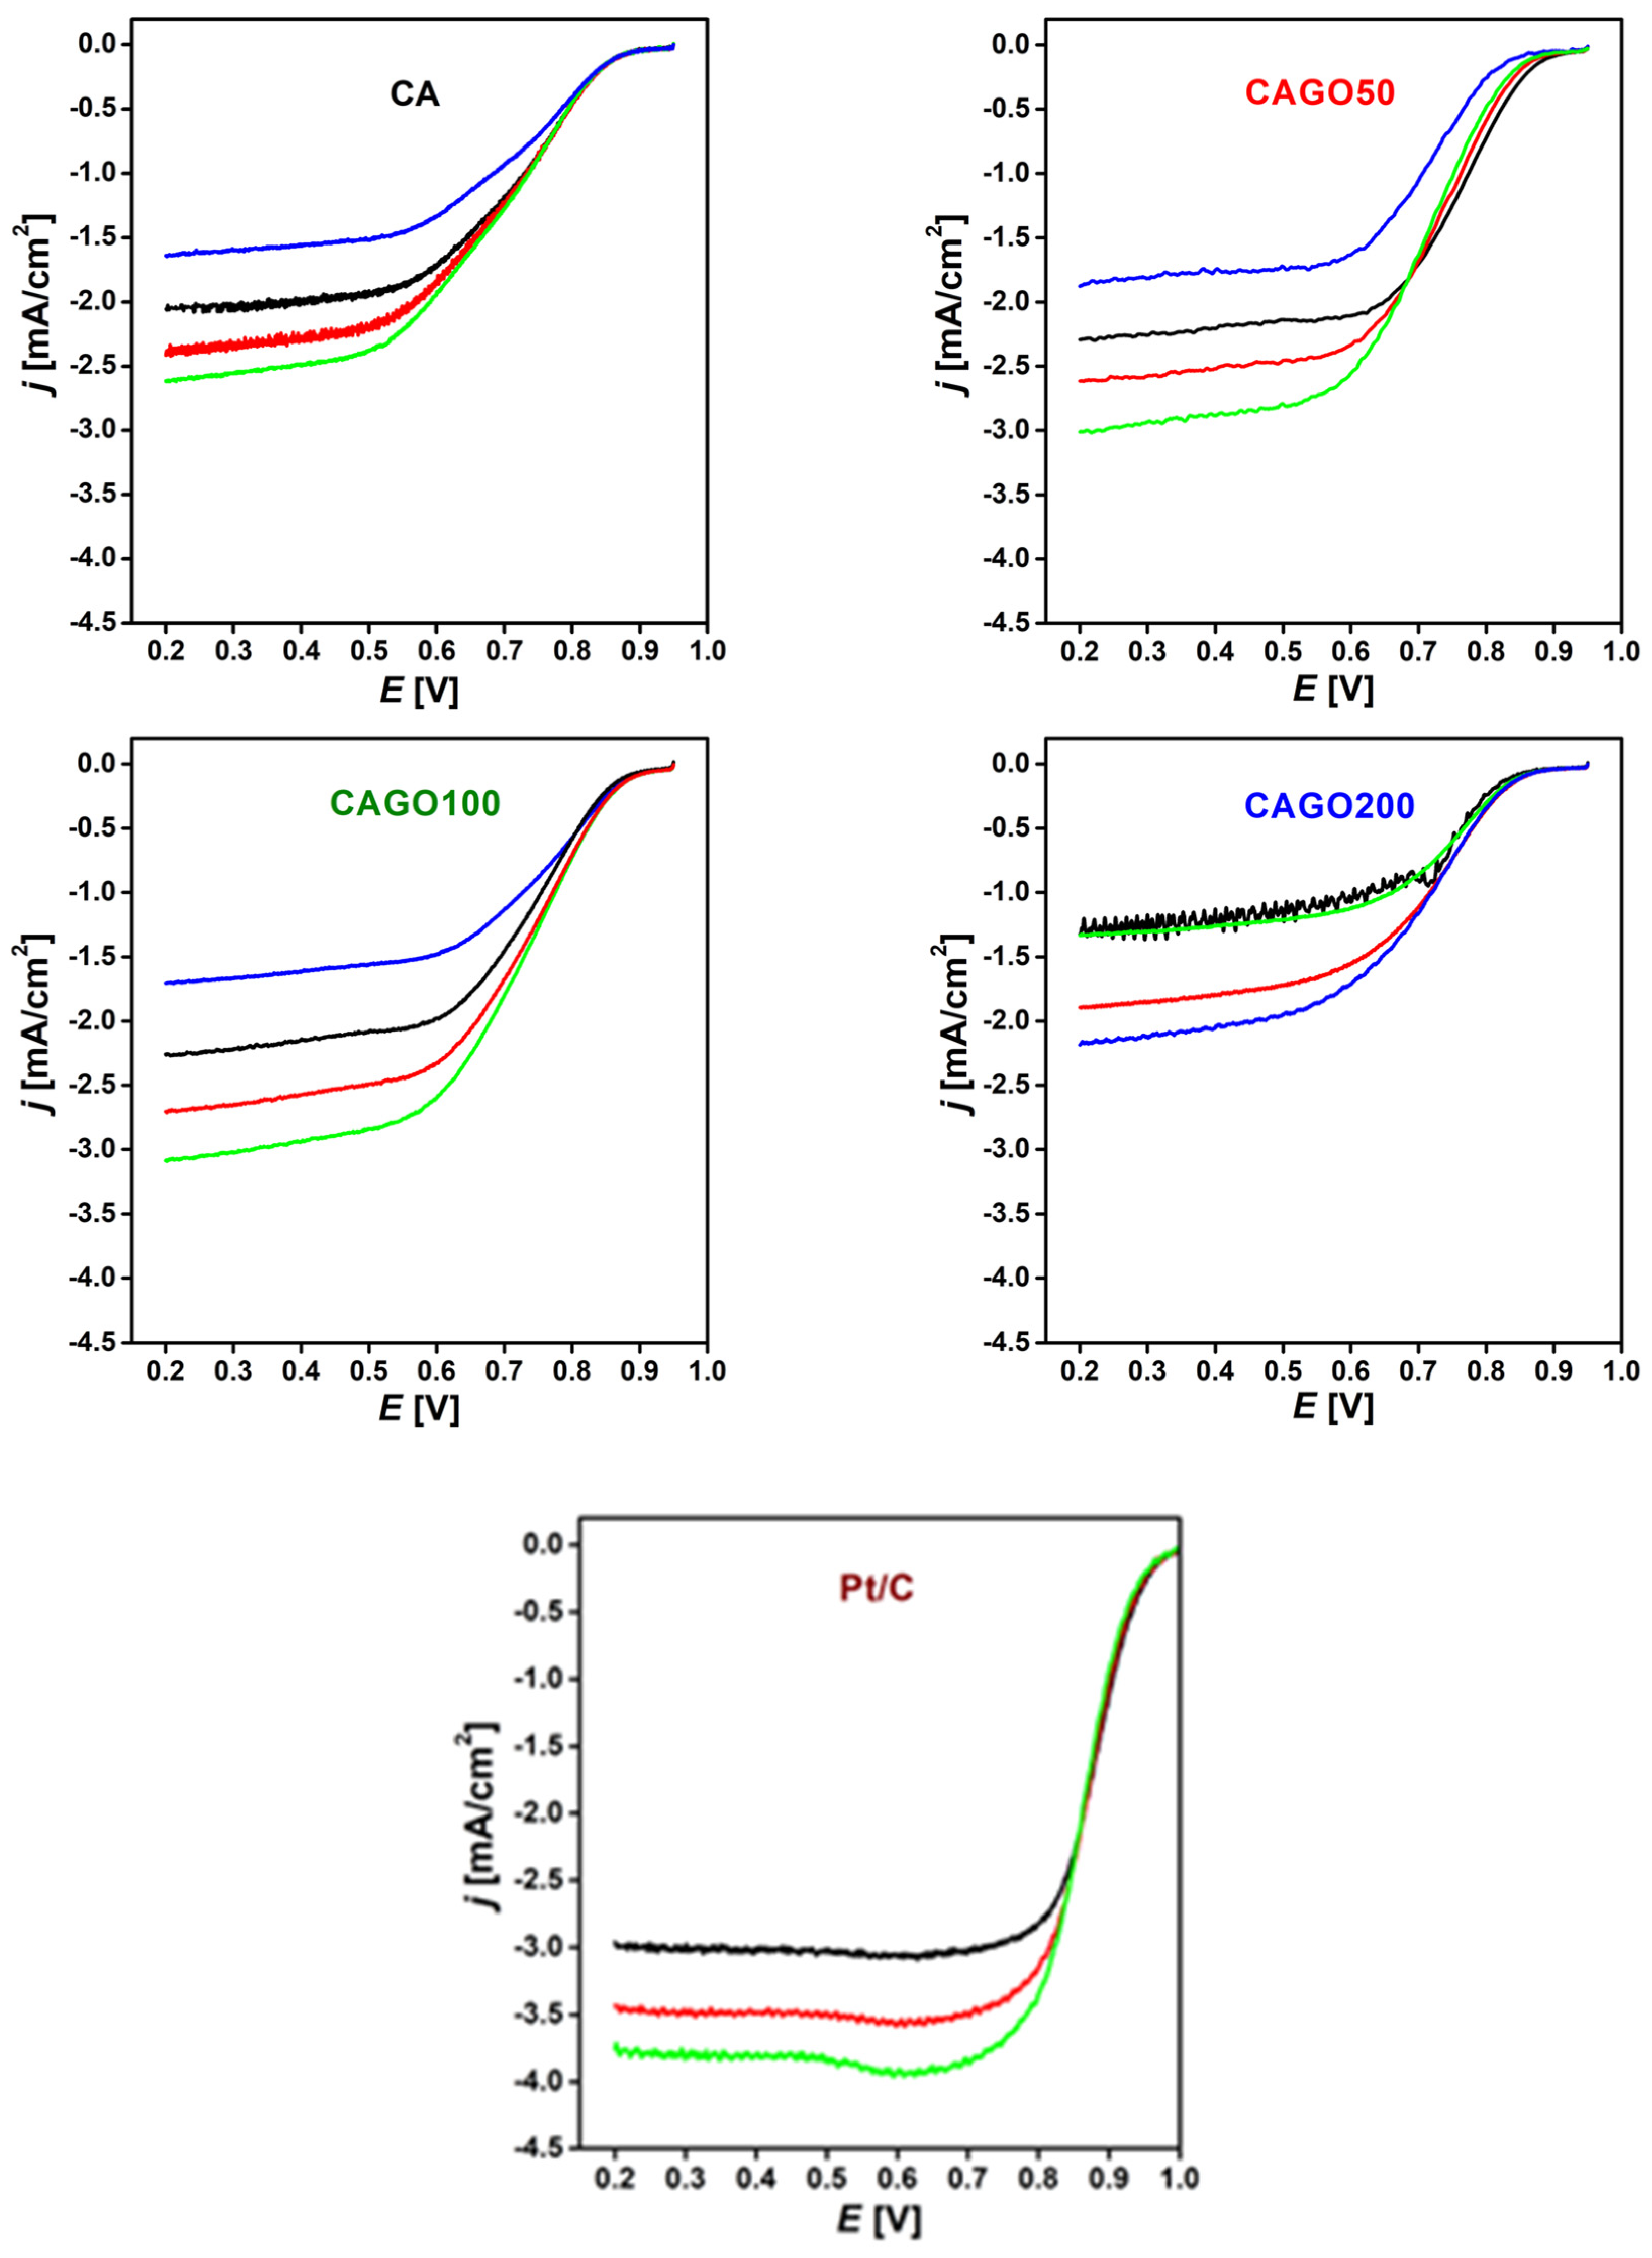
| CA | 1070 | 855 | 700 | 3.5 |
Our work |
| CAGO50 | 1479 | 850 | 760 | 4.0 | |
| CAGO100 | 1779 | 845 | 730 | 3.1 | |
| CAGO200 | 933 | 825 | 700 | 2.0 | |
| Pt/C | 957 | 886 |
Disclaimer/Publisher’s Note: The statements, opinions and data contained in all publications are solely those of the individual author(s) and contributor(s) and not of MDPI and/or the editor(s). MDPI and/or the editor(s) disclaim responsibility for any injury to people or property resulting from any ideas, methods, instructions or products referred to in the content. |
© 2023 by the authors. Licensee MDPI, Basel, Switzerland. This article is an open access article distributed under the terms and conditions of the Creative Commons Attribution (CC BY) license (http://creativecommons.org/licenses/by/4.0/).


