Introduction
In Romania, agriculture is an important branch of the national economy [
1], comprising as a whole, economic entities with different objects of activity and with their own technical base, in which the labour force fluctuates from one period to another and which ensure their income from activities dependent on the object of activity. On the other hand, the financial results obtained by agricultural holdings in Romania depend on the subsidies received, which can make a major leap in terms of profitability, especially in unfavourable agricultural years from an agro-climatic point of view, when production is low and insufficient. To a greater or lesser extent, farmers in countries where agriculture holds a key place in the economy benefit from subsidies. Specialists in the field argue that the granting of subsidies contributes directly to increasing food security, stimulating traditional production and stability in the pricing of agricultural products. [
2,
3,
4]. Over time, food security has been prioritised by policy makers, justifying agricultural subsidies in various regions and countries. [
5]. In the United States, the European Union, Japan, Canada and other regions, a wide range of subsidies have been adopted to help increase agricultural production. [
6] in order to cover the needs of the domestic market and for export. It should be noted that investments and subsidies are important instruments that can effectively contribute to poverty alleviation in rural areas in various countries and to agricultural development [
7]. Widespread use of subsidies, especially in agriculture, is imperative, as the agricultural sector is a central element in the transition to sustainability, and the conditions for granting them must also cover agri-environmental measures. However, there are specialists who claim that the use of subsidies produces inefficiency and negative effects on the economy [
8,
9,
10]. The existence of a high rate of financial assistance in the agricultural sector is evident, especially in high-income countries [
11]. Research on the impact of subsidies in agriculture has also shown that these grants may contribute to reduced productivity, as some farmers have invested in less productive activities [
12]. On Norwegian cereal farms, studies have shown that subsidies have had a positive impact on technical efficiency, but on the other hand have had a negative influence on productivity [
13]. Similar situations in terms of technical efficiency have been reported for dairy farms in Denmark and Sweden [
14]. However, other studies on dairy farms in the European Union have shown that the influence of subsidies on technical efficiency can be specific to individual farms and can be negative, null or positive [
15]. Taking into account the size of farms, research in the European Union has shown that the influence of subsidies on the economic efficiency of farms is greater in larger farms [
16]. But a number of indicators are important in terms of how they develop, and in fair, legal and practical terms, every vegetable farm aims to be as profitable and expanding as possible. From this point of view, it is necessary to highlight the ways in which management, at microeconomic level, achieves them. However, other research carried out on farms in EU member countries has shown that the low share of subsidies contributes to a reduction in competitiveness by increasing the degree of wear and tear and difficulties in increasing the degree of renovation of machinery, leading to the delayed modernisation of the main assets on these farms [
17]. Of course, these aspects can be presented by different analysis models, but referring here to a crop farm of about 3000 ha and a crop farm of about 600 ha, it is necessary to carry out an analysis supported by statistical-economic models. In countries in the European Union, subsidies have had a less favourable influence on productivity recorded at farm level before the implementation of the decoupling reform [
18]. Other studies have highlighted the positive effect of decoupled subsidies on farm-level productivity [
19]. But so far, it has not been possible to give a clear answer to the question of how subsidies impact farm productivity in the European Union, with all the studies done so far [
20,
21]. However, on any crop farm there is, without question, a close correlation between turnover, subsidy income received and profitability, and at crop level, the income it generates contributes differently to the farm's overall profitability. Turnover is higher the more balanced the expenditure incurred, directly influencing profitability. Taking into account that agriculture remains an essential sector for the achievement of sustainable development objectives at EU level, it is recommended to redirect subsidy payments on the one hand, and on the other hand, to increase the efficiency of the monitoring of payments granted under the Common Agricultural Policy [
22]. But the performance of farms is conditioned by a series of variables with different contents [
23,
24], namely natural factors, economic factors, financial factors as well as by various incentives for farmers [
25]. Under these conditions, for farms in Romania, financing plays a special role, as it contributes both to business development through the funds received, and to cover the losses caused by the increasingly evident climate change [
26]. Research carried out at the level of farms specializing in certain crops in Romania has highlighted the positive but differentiated impact of subsidies and other forms of financial support [
27]. Some studies do not consider that subsidies have a positive impact on all types of farms in Romania, as they do not contribute uniformly to increased productivity, but only on medium-sized dairy farms [
28,
29]. However, what is certain is that, for vegetable farms in Romania, the need to pay subsidies per area can ensure the continuity of the activity and the profitability of the business. An example is winter wheat cultivation, which would otherwise incur losses [
30]. To this end, in the current research, using descriptive statistics, visual inspection and comparison methods [
31,
32,
33] the basic parameters for turnover, subsidy income and profitability, the model was presented based on data from the annual balance sheets for the period 2019-2021 of the two farms in Romania under study, and the determination of the parameters for the next period showed that there is a link, so that the projection of the activity at the microeconomic level can be rigorously organized. In order to obtain a holistic understanding of the data, the techniques of descriptive statistics, visual inspection and basic comparisons, as a frame of reference, complemented with visual representation, make it possible to understand the data in depth, with graphs being excellent orientation landmarks, and the exploration of relationships between variables and groups makes the comprehensive analysis carried out feasible. The research carried out led to the derivation of usable parameters that can give consistency to the economic activity planning perspective at the level of vegetable farms included in the size categories referred to, approximately 600 ha and approximately 3000 ha respectively.
Results and Discussions
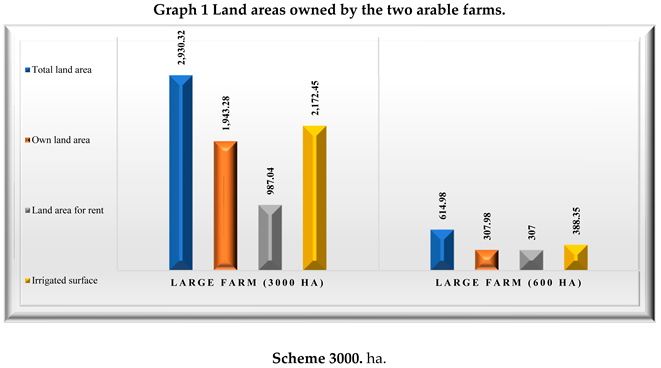
The vegetable farms taken in study are located in Romania, in Ialomita county, one of them is located in Mihail Kogălniceanu commune and was established in 1994, having in exploitation 2930,32 ha in 2022 and the second one, is located in Mărculești commune, being established in 1992 and having in exploitation 614,98 ha in 2022. The agricultural area offers a pedological and climatic potential with high fertility and traditionally agrarian, both holdings having as main activity the cultivation of cereals and oil plants (CAEN code - Classification of Economic Activities in Romania: 0111 Growing of cereals, excluding rice, leguminous plants and oil seed crops. The location of vegetable farms in Ialomita County is an advantage for high-yield agriculture. For the areas of land they own or lease, vegetable farms benefit from various forms of subsidies in the form of direct payments granted by the Romanian Agricultural Payments and Intervention Agency (APIA), as well as an excise duty subsidy for diesel. But maintaining soil quality is a decisive factor for high yields and optimum quality. However, the establishment of a crop can lead to soil degradation and the depletion of nutrients found in the soil, but the practice of crop diversification and crop rotation that conserves organic matter in the soil is the optimal solution for these vegetable farms.
In the vegetable farm of about 3000 ha, the subsidy granted by the Romanian Agency for Payments and Interventions in Agriculture (APIA) in 2019 had a value of 3,455,808 lei, which increased by 3.78% (3,586,326 lei) in 2020 and decreased by 3.78% (3,450,807 lei) in 2021 compared to 2020. The subsidy for diesel excise tax recorded a value of 349,033 lei in 2019 and increased by 3.75% in 2020 compared to 2019 and decreased by 42.03% in 2021 compared to 2020. Existing crops were rapeseed, barley, winter wheat, sunflower, soybean, grain corn, late potatoes, sweet potato, and carrot in 2019, flowers in 2019, 2020 and 2021.
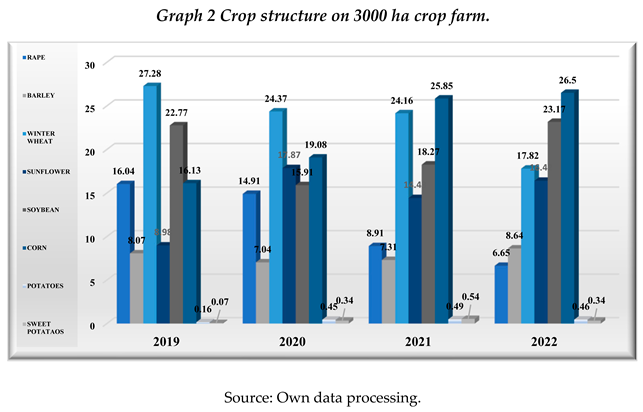
For oilseed rape, we note a decrease in cultivated areas as follows: by 7.55%, representing 36.3 ha in 2020 compared to 2019, by 40.67%, representing 179.31 ha in 2021 compared to 2020, by 25.53%, representing 66.79 ha in 2022 compared to 2021. In barley cultivation, we note an oscillation in the cultivated areas: in 2019 the cultivated area was 240.11 ha. In 2020 compared to 2019, it decreased by 13.31% and in 2021 compared to 2020 the area increased by 3.18% followed by another increase of 17.89% in the year umer. In winter wheat cultivation, we notice a decrease in the cultivated area: in 2019 the area is 811.24 ha. In 2020 compared to 2019 it decreased by 11.17%, in 2021 compared to 2020 it decreased by 1.52%, in 2022 compared to 2021 it decreased by 26.41%. In sunflower cultivation, we note an oscillation in the cultivated areas: in 2020 compared to 2019 it increased by 97.81% and in 2021 compared to 2020 it decreased by 19.79, followed by a further decrease of 13.55% in the following year. For soybean cultivation, there is a fluctuation in the area cultivated: in 2020 compared to 2019, it decreased by 30.53%. Since 2020 we observe an increase in areas: in 2021 it increased by 14.08% compared to 2020 and in 2021 a further increase of 26.54% compared to the previous yearIn the cultivation of grain maize, there is an increase in cultivated areas: in 2020 compared to 2019 by 15.91%, in 2021 compared to 2020 by 34.58% and in 2022 compared to 2021 by 2.28%. In late potato cultivation, the oscillation of cultivated areas in the period under analysis is highlighted: in the period 2019-2021 the cultivated area increases from year to year: in 2020 compared to 2019 by 178.48%, in 2021 compared to 2020 by 10.07%. In the year 2022 we notice a decrease in the cultivated area compared to the previous year by 7.43%. For sweet potato cultivation, we also note the oscillation of cultivated areas: in 2020 compared to 2019, the area increased by 400%, in 2021 compared to 2020 we note an increase by 60%, followed by a decrease in area in 2022 compared to the previous year by 37.5%. For carrot cultivation, the cultivated areas in 2019 are 4.71ha. In flower cultivation, we note a decrease in cultivated areas: in 2020 compared to 2019 by 64.33% and in 2021 compared to 2020 by 24.11%.
The average production of the main agricultural crops, realized by the vegetable farm of about 3000 ha in 2019-2021, is quantitatively higher than both the county, regional and national average production [
34,
35]. We consider that the results recorded by this farm were based on the favorability of natural conditions, soil quality in the presented agricultural area (climatic factors, edaphic factors), the technology used, the type of inputs used (seed, fertilizers and plant protection products), the time of year and their application. The 3000 ha arable farm practises conservation farming: strip-tillage (sowing in prepared strips without intervening on the inter-row interval), minimun tillage (sowing after shallow soil preparation without turning the furrow) as well as crop diversification and rotational sowing to conserve organic matter in the soil and crop irrigation.
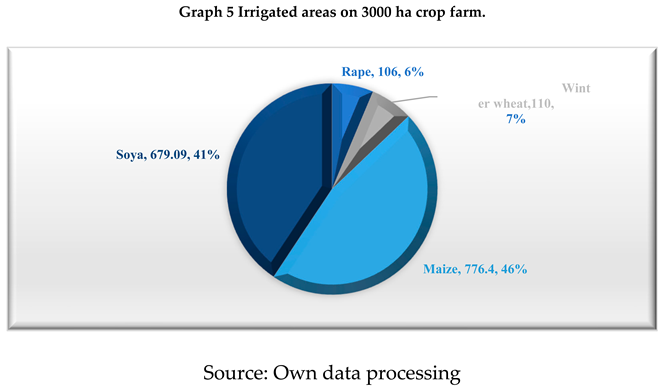
From the cultivated areas, this farm has increased the irrigated area annually, which shows that in 2022, it has 1,671.49 ha irrigated, of which: 106 ha in rapeseed cultivation, 110 ha in winter wheat cultivation, 776.4 ha in maize cultivation and 679.09 ha in soya cultivation.
As regards winter wheat crop, in 2019, the average yields achieved increased compared to the yields recorded at national level by 30.55%, at regional level by 27.65% and at county level by 16.69%. The agricultural year 2020 was an unfavourable agricultural year and for winter wheat crop the average production/ha represented 61.57% of the average winter wheat production recorded in Romania, but exceeded the South-Muntenia Region level by 6.20% and the county level by 93.73%. The year 2021 brought increases in average winter wheat production for the farm analysed, higher than the national average by 136.95%, than the regional average 43.84% and 38.47% higher than the Ialomita county level for this crop.
Analyzing the barley crop, we find that in 2019 average yields increased compared to the national yields, 51% higher, regional 43.75% and county 39.76% higher. In the 2020 crop year, barley production was below the average production recorded at the national level, by 7.39%, but above the level recorded at the regional level, by 62.01% and the county level by 203.03% higher. The year 2021 brought increases in average winter wheat production for this farm, higher than the national average by 138.39%, higher than the regional average 62.98% and higher by 36.03% than the average production recorded in Ialomita county.
In sunflower cultivation, in 2019, average yields increased compared to yields recorded at national level by 29.36%, at regional level by 51.01% and at county level by 31.96%. In the 2020 crop year, yields for this crop were below the average yield recorded at national level, 11.91% lower, but above the level recorded at regional level, 23.79% and county level, 68.62%. The year 2021 brought increases in average production, higher than the national average by 65.37%, higher than the regional average by 26.48% and 21.17% higher than the average production recorded in Ialomita county for this crop.
The absolute record recorded by the farm under study is the maize crop, which, in all the years included in the analysis, the average yields achieved have increased substantially compared to the average yields per hectare recorded at national level (by 101, 48% in 2019, 89.61% in 2020 and 313.58% in 2021) at regional level (118.37% in 2019, 219.34% in 2020 and 130.95% in 2021) and at county level (76.03% in 2019, 434.29% in 2020 and 59.64% in 2021).
Another crop that has brought this farm high average yields per hectare and economic benefits is soybean. We note that in all the years included in the analysis, the average yields achieved have shown substantial increases compared to the average soybean yields per hectare at the national level (by 71.10% in 2019, by 44.70% in 2020 and by 150.29% in 2021) at the regional level (by 58.51% in 2019, by 141.22% in 2020 and by 74.37% in 2021) but also compared to the county level (by 50.70% in 2019, by 127.05% in 2020 and by 46.52% in 2021).
Analysis of Technical Indicators for a Vegetable Farm of about 600 ha
In the vegetable farm of about 600 ha, we note a slight decrease in the amount of subsidies received during the analysis period, thus the subsidies granted by the Agency for Payments and Interventions in Agriculture (APIA) decreased by 9.33% in 2020 compared to 2019 and by 3.66% in 2021 compared to 2020, and the subsidy for diesel excise tax increased by 9.69% in 2020 compared to 2019 and decreased by 33.81% in 2021 compared to 2020.
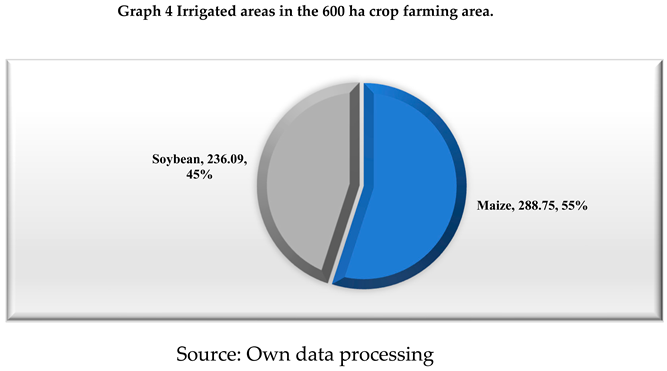
Winter wheat and maize are the predominant crops in 2019 and 2020, together occupying 68.73% (in 2019) and 67.41% (in 2020) of the cultivated area. From 2021 onwards, maize and soybean crops become predominant, together accounting for 64.25% of the cultivated area and the farmer chooses to progressively decrease the areas cultivated with winter wheat (by 32.67% in 2020 compared to 2019, by 45.23% in 2021 compared to 2020 and by 39.54% in 2022 compared to 2021) and the cultivation of rape is abandoned. From 2022 onwards, barley and oats are no longer cultivated, and lucerne cultivation increases slightly in 2021 (by 9.47%) and 2022 (by 11.61%). Crop rotation is practised annually, and from 2021 irrigation for maize and soybean crops will be introduced to increase yields. The farm practises conservation farming: strip-tillage (sowing in prepared strips without intervening between rows) and minimun tillage (sowing after shallow soil preparation without turning the furrow) as well as crop diversification and a rotational sowing system that conserves organic matter in the soil.
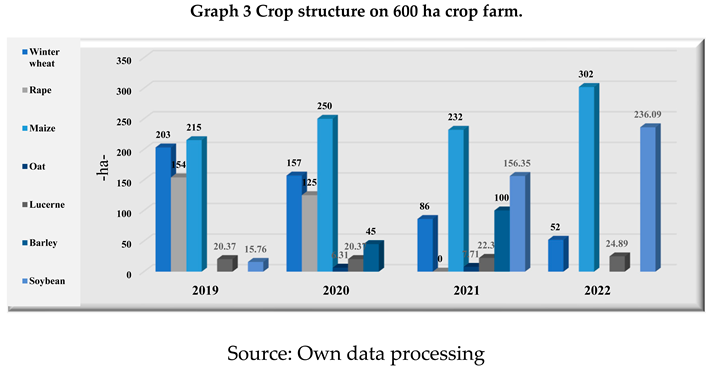
As regards the vegetable farm of about 600 ha, in the winter wheat crop, in 2019 and 2021, the average yields increased compared to the yields recorded at national level by 29.06% (year 2019) and 142.65% (year 2021) regionally by 26.19% (year 2019) and 47.30% (year 2021) and county level by 15.36% (year 2019) and 41.80% (year 2021). Agricultural year 2020 was a poor agricultural year for winter wheat cultivation with an average production/ha of 4.81% of the average winter wheat production recorded in Romania, 8.29% of that recorded at the level of the South-Muntenia Region and 15.13% of that recorded at the level of Ialomita County, which led the farm to reduce the areas cultivated with straw and to introduce crop irrigation in 2021 for corn and soybean crops.
For barley, we note that this crop is found in the 2020 and 2021 soils, and the average yields per hectare were in 2020 below those recorded at national (23.35%), regional (40.85%) and county (76.40%) level and above them in 2021 (by 134.35% compared to the national level, 60.22% compared to the regional level and 33.73% compared to the county average for these yields).
In oat cultivation, we note that this crop was introduced in the 2020 and 2021 asolation, and the average yields per hectare were lower in both years than those recorded at national (in 2020: 26.89%, in 2021: 95.07%), regional (in 2020: 30.30%, in 2021: 95.98%) and county (in 2020: 35.93%, in 2021: 55.20%) levels. In view of these aspects, the farm stopped growing oats in the 2022 agricultural year.
In maize cultivation, we note the following situation: in 2019, the average production achieved was close to those recorded at national level, representing 95% of it, to those recorded at regional level, 2.97% higher than them and 17% lower than the average yields/ha recorded at county level. The agricultural year 2020 was an unfavourable agricultural year for maize cultivation, the farm being below the average production per hectare in Romania (by 47.39%) and South-Muntenia Region (by 11.39%) and compared to the county average for this crop, it recorded an average production/ha 48.25% higher. The record average production/ha of maize in 2022, i.e. 14,309 kg/ha, the year in which the vegetable farm introduced irrigation to this crop, was much higher than the average production recorded in Romania (by more than 341.64%), in the South-Muntenia Region (by more than 146.62%) and in Ialomita County (by more than 70.47%), which led the 600 ha vegetable farm to increase the area under maize.
In Romania, in the South-Muntenia Region in soybean cultivation, irrigation is necessary for crop production and cultivation of late and semi late soybean varieties is recommended. The vegetable farm cultivated soybean in 2019 and 2021, the year of introduction of irrigation. Soybean has relatively high soil requirements, and the soils of Ialomita county, Cernoziom calcareous, class Cernisols and Alluviosols, class Protisols are suitable for this crop. As regards this crop, we note a decrease in the average production per hectare in 2019 compared to the average production per hectare recorded in Romania (34.90% lower), South-Muntenia Region (39.70% lower) and Ialomita County (42.67% lower). But we note that in 2021, after the introduction of irrigation of this crop, the average production per hectare was significantly higher than that recorded at national level (139.56% higher), South-Muntenia Region (66.89% higher) and Ialomița County (40.24% higher).
The agropedoclimatic conditions in the South Muntenia Region and implicitly in Ialomita County are favourable for rapeseed cultivation. In oilseed rape cultivation, the best pre-seeding plants are those that release the soil early and, as the seed is small, it must be well chopped. From the analysis period, the medium-sized vegetable farm grew oilseed rape in 2019 and 2020, years in which the average yield/ha exceeded the averages of the yields recorded at national (by 17.89% in 2019 and 16.28% in 2020), regional (by 12.95% in 2019 and 14.42% in 2020) and county (by 17.32% in 2019 and 25.63% in 2020) levels. However, as of 2021, the farm has excluded oilseed rape from the cropping plan.
But the economic efficiency of farms, regardless of size, plays a key role in decision making, representing an important criterion in terms of assessing economic activity. [
36,
37]. Considering that the financial performance is a goal for each farm, and its measurement requires the use of a series of representative indicators [
38,
39]. The analysis of the profitability of farm activity aimed to determine rates of return, highlighting the extent to which capital, in its entirety, generates profit. These rates, determined as the ratio between output indicators (profit or loss) and indicators reflecting a flow of activity or stock (net turnover or resources consumed, total assets or equity), provide information on the extent to which capital generates profit, and are considered the most synthetic indicators for highlighting the economic efficiency of the activity.
Analysis of Income and Profitability for the Vegetable Farm of Approximately 3000 ha
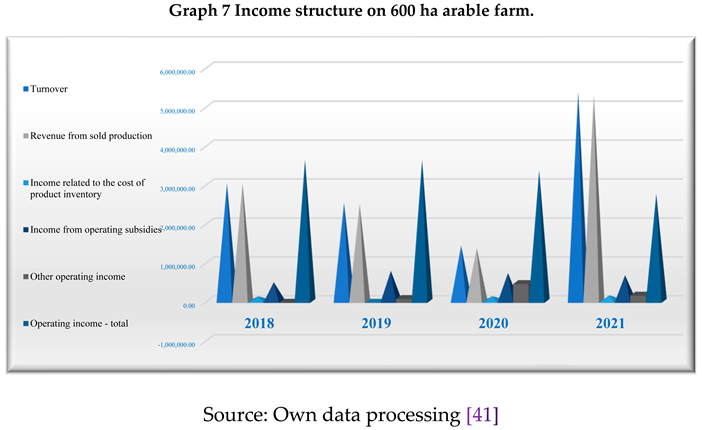
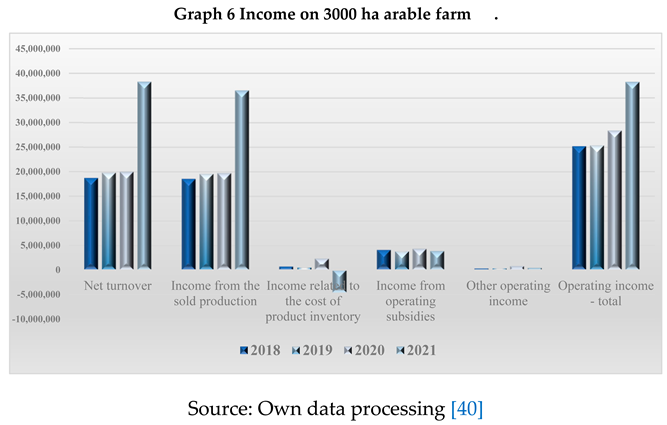
Analyzing the income structure in the vegetable farm of about 3000 ha, it indicates that the share of turnover in total income in 2020 and 2021 is 70.34%, and next to it, we note the existence of income related to stocks of products held with a share of 8.11% in 2020. In 2021 we note the decrease in the value of the stock of products compared to the beginning of the period, as well as the contribution of income from subsidies to the formation of total income with shares of 16.17% in 2018 and 10.10% in 2021.
In order to validate the efficiency of the management of the activity on the farm of about 3000 ha, the commercial profitability rate was determined, which showed that the commercial activity was profitable in the years under review, a situation characterized by positive values recorded, resulting in an increase in the market image of the large-scale vegetable farm. The values of this indicator have been increasing, except in 2019, where a decrease is noted, as follows: in 2018, 29.92%, in 2019, 27.81%, in 2020, 30.7%, and in 2021, 31.32%. We note the year 2021 with the highest value of commercial profitability for the large-scale vegetable farm in the analysis period.
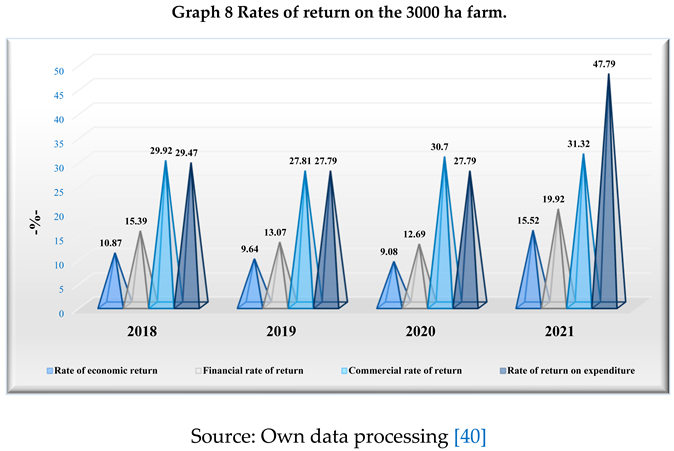
The economic rate of return reflects the ratio between the gross operating surplus or deficit and the economic means employed to obtain it, and is advantageous in the analysis because it is independent of the financial structure of the crop farm, the state tax policy for taxing profits and the policy on depreciation of fixed assets. At the level of the agricultural holding of about 3000 ha it is 9.08% in 2020. In 2021, the situation recovers, the maximum value of the indicator in the analyzed period being 15.52%. The financial rate of return expresses the efficiency of the associates' capital investments and how they are maintained, taking into account the net result of the financial year and the equity held. With this rate, we assess the position of the 3000 ha vegetable farm on the market as follows: the activity in the years 2018-2021 is financially profitable, with a slight downward trend of this indicator in the period 2018-2020, but the recovery is felt in the year 2021, when the value of financial profitability was 19.92%. The consumption of resources is accounted for by recording them in the expenditure accounts and, in order to assess their efficiency, the balances of these accounts are compared with the results obtained. In the case of the 3 000 ha arable farm, the rate of return on resources consumed or costs - an indicator directly influenced by the financial result of the operating activity, with fluctuating trends over the period under analysis - has positive values, which indicates the profitability of the operating expenditure incurred.
Income and Profitability Analysis for a Vegetable Farm of about 600 ha
On the vegetable farm of about 600 ha, total income is made up of turnover, income from stocks of products held and income from subsidies, the latter having a share of 23.03% in 2019 and 16.35% in 2021.
In order to assess the management of the activity on the 600 ha farm, the commercial profitability rate was determined, which showed that in 2018 (commercial profitability of 25.75%) and 2021 (commercial profitability of 40.46%) this indicator had increased values and in 2019 (commercial profitability of 12.80%) and 2020 (commercial profitability of 0.13%), the commercial activity was less profitable, a situation imposed by the recording of losses. The years 2018 and 2021 positive and high values of the commercial profitability rate signify the increase in the market image of the medium-sized vegetable farm.
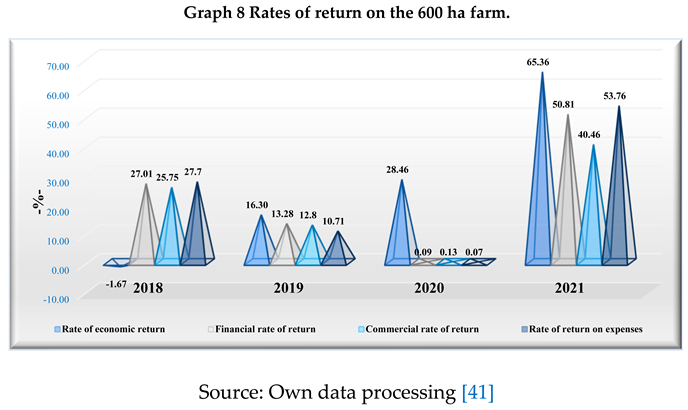
The economic rate of return at the level of this holding has positive values in 2018 (13%) and 2021 (17.85%), with favourable connotations in the use of total assets held, while in the following period, i.e. financial years 2019 and 2020, the return on the use of economic assets held for gross operating surplus decreases: 5.51% (in 2019), 0.03% (in 2020). The financial rate of return can help to identify the position of this farm on the market, as follows: the activity is profitable throughout the analysis period, more favourable in 2021 (50.81%) and 2018 (27.01%)) on the back of the increase in both net profit and equity held, and less favourable in 2019 (13.28%) and especially in 2020 (0.09%). The increase in return on invested capital facilitates access to new financial resources, due to the confidence of the associates to reinvest in the business, but also the possibility of attracting other potential investors, with implications for the future development of the agricultural company. The rate of return on costs shows the following values; year 2018 (27.70%), year 2019 (10.71%), year 2020 (0.07%) and year 2021 (53.76%) which denotes a profitable operation that covered the expenses, but the low value in year 2020 denotes that the company hardly met the operating expenses incurred.
Presentation of the Statistical Model for the 3000 ha Crop Farm
In order to highlight the valuable contribution of production to the income of the 3000 ha crop farm, specific information on each crop is presented, highlighting the impact of subsidies on the profitability of the various crops in the farm's own farming environment. The analysis complements the wider assessment of the effect of subsidies on techno-economic indicators on farms of different sizes, providing a deeper understanding of how the income from different crops is supplemented by subsidies in order to make a profit. Following the principles of methodological consistency, the analysis presents a reliable approach, using descriptive statistics, visual inspection and basic comparison as means of investigation [
31,
32,
33]. By integrating these methods into the study, the validity of the overall findings is increased. By providing empirical evidence indicating the influence of subsidies on crop profitability, the research contributes to the main objective of the article, namely to examine how subsidies affect the main techno-economic indicators in crop farms of different sizes. Further inclusion of such findings will strengthen the suggestions and conclusions of the research conducted. Identifying the impact of subsidies on crop profitability through a crop-level analysis can be an essential benchmark for decision-makers (farm managers at the microeconomic level and the relevant ministry through its policy at the macroeconomic level). Integrating this analysis into the present research can facilitate better policy-making in terms of agricultural support policies and equitable resource allocation. The expected outcome of the analysis is to quantify the contribution that subsidies bring to the farm under study to achieve positive financial results.
Table 1.
Value of on-farm agricultural production of about 3000 ha.
Table 1.
Value of on-farm agricultural production of about 3000 ha.
| Specify |
N |
Minimum |
Maximum |
Mean |
Std. Deviation |
| -lei- |
|---|
| Production value of winter wheat crop |
3 |
1815912.00 |
5337052.02 |
3641743.3400 |
1764194.96760 |
| Production value of barley crop |
3 |
763114.56 |
1440811.32 |
1075598.1600 |
341911.58141 |
| Production value of maize crop |
3 |
4334721.88 |
10476960.18 |
6728054.3533 |
3287849.93129 |
| Value of soybean production |
3 |
3808520.32 |
5822761.00 |
4835731.1067 |
1007721.31931 |
| Production value of sunflower crop |
3 |
1442178.00 |
3159554.56 |
2303467.8533 |
858700.10292 |
| Valid N (listwise) |
3 |
- |
- |
- |
- |
The result obtained presents descriptive statistics for the value, in lei, of production for five existing crops on this farm, namely winter wheat, barley, maize, soybean and sunflower, in the years 2019, 2020 and 2021. The statistics are based on three data points for each crop. Analysis of this data, reveals the following: maize has the highest average production value (6,728,054.35 lei), followed by soybean (4,835,731.11 lei), winter wheat (3,641,743.34 lei), sunflower (2,303,467.85 lei) and barley (1,075,598.16 lei). Maize also shows the highest variability in production value, with a standard deviation of 3,287,849.93 lei, while barley has the lowest variability, with a standard deviation of 341,911.58 lei. The range of production values is highest for maize (from 4,334,721.88 lei to 10,476,960.18 lei) and lowest for barley (from 763,114.56 lei to 1,440,811.32 lei).
Table 2.
Value of subsidies on farms of about 3000 ha.
Table 2.
Value of subsidies on farms of about 3000 ha.
| Specify |
N |
Minimum |
Maximum |
Mean |
Std. Deviation |
| -lei- |
|---|
| Amount of subsidies for winter wheat cultivation |
3 |
933404.20 |
1047361.87 |
1008970.6600 |
65445.29813 |
| Amount of barley subsidies |
3 |
282525.70 |
309637.22 |
298238.2500 |
14061.07601 |
| Amount of maize subsidies |
3 |
627514.75 |
998474.95 |
815266.0567 |
185521.81175 |
| Amount of subsidies for soybean cultivation |
3 |
683735.73 |
873305.65 |
754313.7633 |
103644.17272 |
| The value of sunflower subsidies |
3 |
344403.86 |
767861.88 |
556553.9200 |
211730.26596 |
| Valid N (listwise) |
3 |
- |
- |
- |
- |
This analysis presents the results of descriptive statistics for the value, in lei, of subsidies received by the farm for the same five different crops, namely winter wheat, barley, maize, soybean and sunflower, for the years 2019, 2020 and 2021. The statistics are based on three data points for each crop. The analysis of the results points to the following: winter wheat has the highest average subsidy (1,008,970.66 lei), followed by maize (815,266.06 lei), soya (754,313.76 lei), sunflower (556,553.92 lei) and barley (298,238.25 lei). Barley has the lowest variability in the value of the subsidy, with a standard deviation of 14,061.08 lei, while sunflower has the highest variability, with a standard deviation of 211,730.27 lei. The range of variation in the value of the subsidy is highest for maize (from 627,514.75 lei to 998,474.95 lei) and lowest for barley (from 282,525.70 lei to 309,637.22 lei).
Table 3.
Value of net income/deficit on farm of about 3000 ha.
Table 3.
Value of net income/deficit on farm of about 3000 ha.
| Specify |
N |
Minimum |
Maximum |
Mean |
Std. Deviation |
| -lei- |
|---|
| Net income/deficit value of winter wheat crop |
3 |
-1139219.57 |
1200341.95 |
175151.6933 |
1196288.53853 |
| Net income/deficit value of barley crop |
3 |
-88453.84 |
190846.89 |
50248.3233 |
139660.02185 |
| Net income/deficit value of maize crop |
3 |
2088882.43 |
4661668.70 |
3182893.0467 |
1328849.27582 |
| Net income/deficit value of soya crop |
3 |
1652523.38 |
2982916.09 |
2243242.5533 |
677588.91850 |
| Net income/deficit value of sunflower crop |
3 |
151261.82 |
1050025.49 |
544577.8233 |
459754.46281 |
| Valid N (listwise) |
3 |
- |
- |
- |
- |
The analysis of the results presents the descriptive statistics for the value of the net income, in lei, of the five different crops existing in the analyzed farm, namely winter wheat, barley, corn, soybean and sunflower, in the years 2019, 2020 and 2021. The statistics are based on three data points for each crop. Maize has the highest average net income (3,182,893.05 lei), followed by soybean (2,243,242.55 lei), sunflower (544,577.82 lei), winter wheat (175,151.69 lei) and barley (50,248.32 lei). Winter wheat has the highest variability of net income, with a standard deviation of 1,196,288.54 lei, while soya has the lowest variability, with a standard deviation of 677,588.92 lei. The range of net income values is highest for winter wheat (from -1,139,219.57 lei to 1,200,341.95 lei) and lowest for barley (from -88,453.84 lei to 190,846.89 lei).
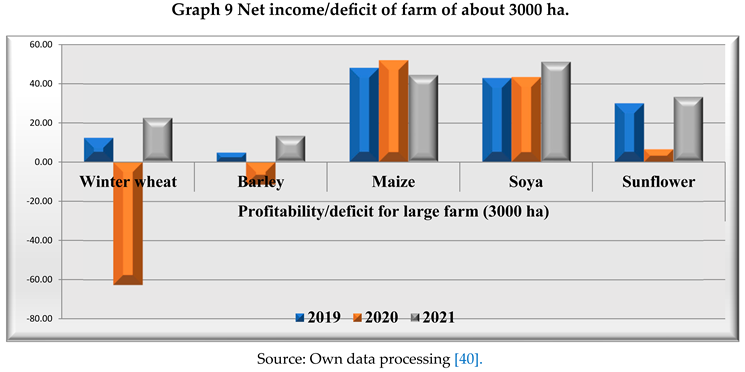
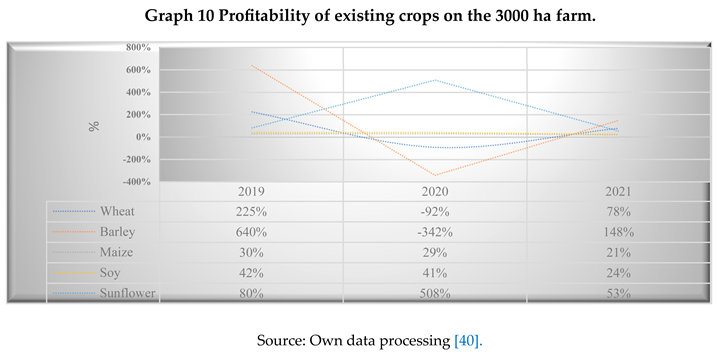
The impact of subsidies for each crop helps us to understand how effectively these grants are used to generate profit. The ratio of subsidy for each crop to net profit made revealed the following: in 2019, in maize cultivation, subsidies contributed 30% to gross profit, in soybean cultivation 42% and in sunflower cultivation 80%, which means that 30% of the profit made by maize cultivation is due to subsidies, 42% of the profit made by soybean cultivation is also due to subsidies and 80% of the profit made by sunflower cultivation is due to subsidies.
Analysing the profitability of the crops, the following can be noted: barley had the highest share in 2019 (640%) and the lowest in 2020 (-342%); sunflower had a considerable share of subsidies in the profit obtained in 2020 (508%); maize had relatively stable values in the three years, of 30%, 29% and 21% in 2019, 2020 and 2021 respectively, winter wheat had a significant negative value in 2020 (-92%), and positive in 2021 with a share of 78%. Soybean had relatively stable shares in 2019 and 2020 (42% and 41% respectively) and a lower value in 2021 (24%).
Determining the profitability of each crop, based on the net profit margin in total revenue, identified the crop with significant profitability, information needed in the decision-making process for future crop planning and resource allocation. From the analysis of returns and the impact of subsidies on profit, the crops that generate the maximum profit are maize, soybean and sunflower.
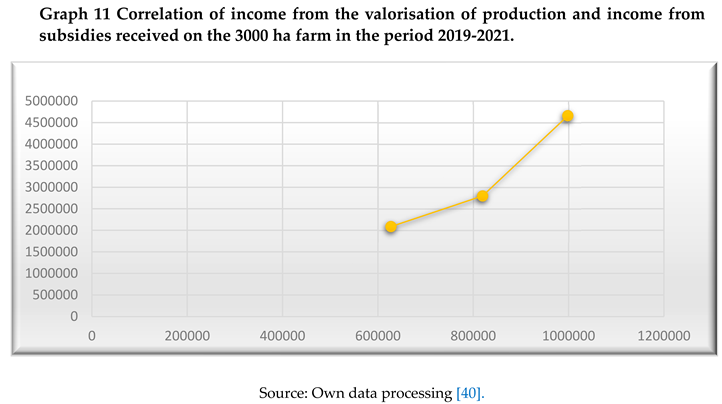
In conclusion, it can be seen that, for each crop, during the analysis period, there is an upward trend in terms of income from the valorisation of production as well as income from subsidies received, but for maize there is also a correlation between these types of income.


