1. Introduction
Land utilization serves as a direct and objective reflection of human activities impacting the natural ecology, representing the intricate interplay between humans and nature [
1]. Alterations in land utilization have profound effects on regional ecology, production, climate, and biodiversity [
2,
3]. The rapid pace of urbanization and industrialization has precipitated swift changes in the spatial arrangement of land utilization, exacerbating the imbalances in its structure. Consequently, conflicts between various land utilization types, such as production, ecology, and habitation, have intensified [
4]. Land use conflict primarily pertains to the clashes arising from irrational land utilization patterns, uncoordinated spatial configurations and quantities, resulting in varying degrees of ecological and environmental degradation [
5]. Early research on land use conflict predominantly focused on current situation analysis, employing qualitative analysis methods, comprehensive land use conflict index methods [
6,
7], map factor superposition methods [
8,
9], and other modeling approaches [
10,
11]. However, studies predicting changes in conflict patterns were relatively scarce [
12]. As the issue of land use conflict continues to escalate, researchers have shifted their attention towards potential future conflicts [
13]. This entails collecting spatial data on land use value and demand through Public Participation Geographic Information Systems (PPGIS) to simulate potential conflicts among land types [
14]. Additionally, the suitability of different land use types is employed to assess potential conflicts and synergies [
15]. Furthermore, studies have emerged that combine land use prediction models to simulate and forecast the spatial and temporal evolution of regional conflicts [
16,
17,
18].
The future prediction of land use relies on quantitative structure projections and spatial distribution pattern simulations across various scenarios. Multi-scenario simulations effectively unveil the potential correlation between habitat quality and future land use changes. The Shared Socioeconomic Pathways (SSP) scenario framework, developed by Schmitz et al., defines five scenarios that encompass key drivers of land use change, encompassing diverse climates and socioeconomic futures [
19,
20,
21,
22]. The sixth phase of the Coupled Model Intercomparison Project (CMIP6) model offers researchers multiple future development scenarios, coupling shared socioeconomic pathways (SSPs) with representative concentration pathways (RCPs) to address global climate change [
23]. Regarding quantitative structure prediction of land use, the system dynamics (SD) model surpasses other models by considering climate change and achieving multiple scenarios of land use demand prediction at different regional scales. This model better captures the nonlinear, dynamic, and systematic characteristics of land use change [
24]. However, the SD model alone cannot predict the spatial pattern of land use. By combining the SD model with a land use simulation model, it becomes possible to more accurately simulate the spatial distribution of land use [
25]. In terms of spatial distribution pattern simulation, previous studies [
26] have not been able to dynamically and spatially simulate land use patches of natural land use types. Commonly used models include the CA model [
27,
28], CLUE-S model [
29,
30], and FLUS [
31,
32,
33]. However, the emerging patch-generating land use simulation model (PLUS) not only retains the advantages of adaptive inertia competition and roulette competition mechanisms found in existing future land use simulation models but also utilizes the random forest algorithm to determine the development potential of each land use type. This allows for a more accurate simulation of changes in land use spatial distribution [
34,
35,
36].
Relevant studies indicate a positive correlation between spatial land use conflict and ecological environment quality. Both climate change and human activities directly impact habitat quality by altering the land use process. To analyze the influence of habitat quality on land use, it is essential to quantify the degree of land use quantitatively. Additionally, by employing dynamic spatiotemporal simulation of natural land use types, the spatial characteristics of land use conflicts can be revealed through a constructed model based on landscape indices. This approach enables accurate identification of conflict locations and the performance of land use conflicts within the spatial structure [
37]. Furthermore, in the realm of dynamic modeling of land use change, numerous scholars have utilized land use data to assess habitat quality. This assessment is primarily conducted through hierarchical analysis (AHP) [
38], artificial neural network methods (ANN) [
39], principal component analysis [
40], the InVEST model [
41], RS-GIS unified ecological and environmental quality evaluation index method [
42], and other similar approaches. Notably, the InVEST model offers a concise method to estimate habitat quality based on land use data and habitat threat data. It proves particularly useful when available data are limited, and sampling areas are not feasible [
43].
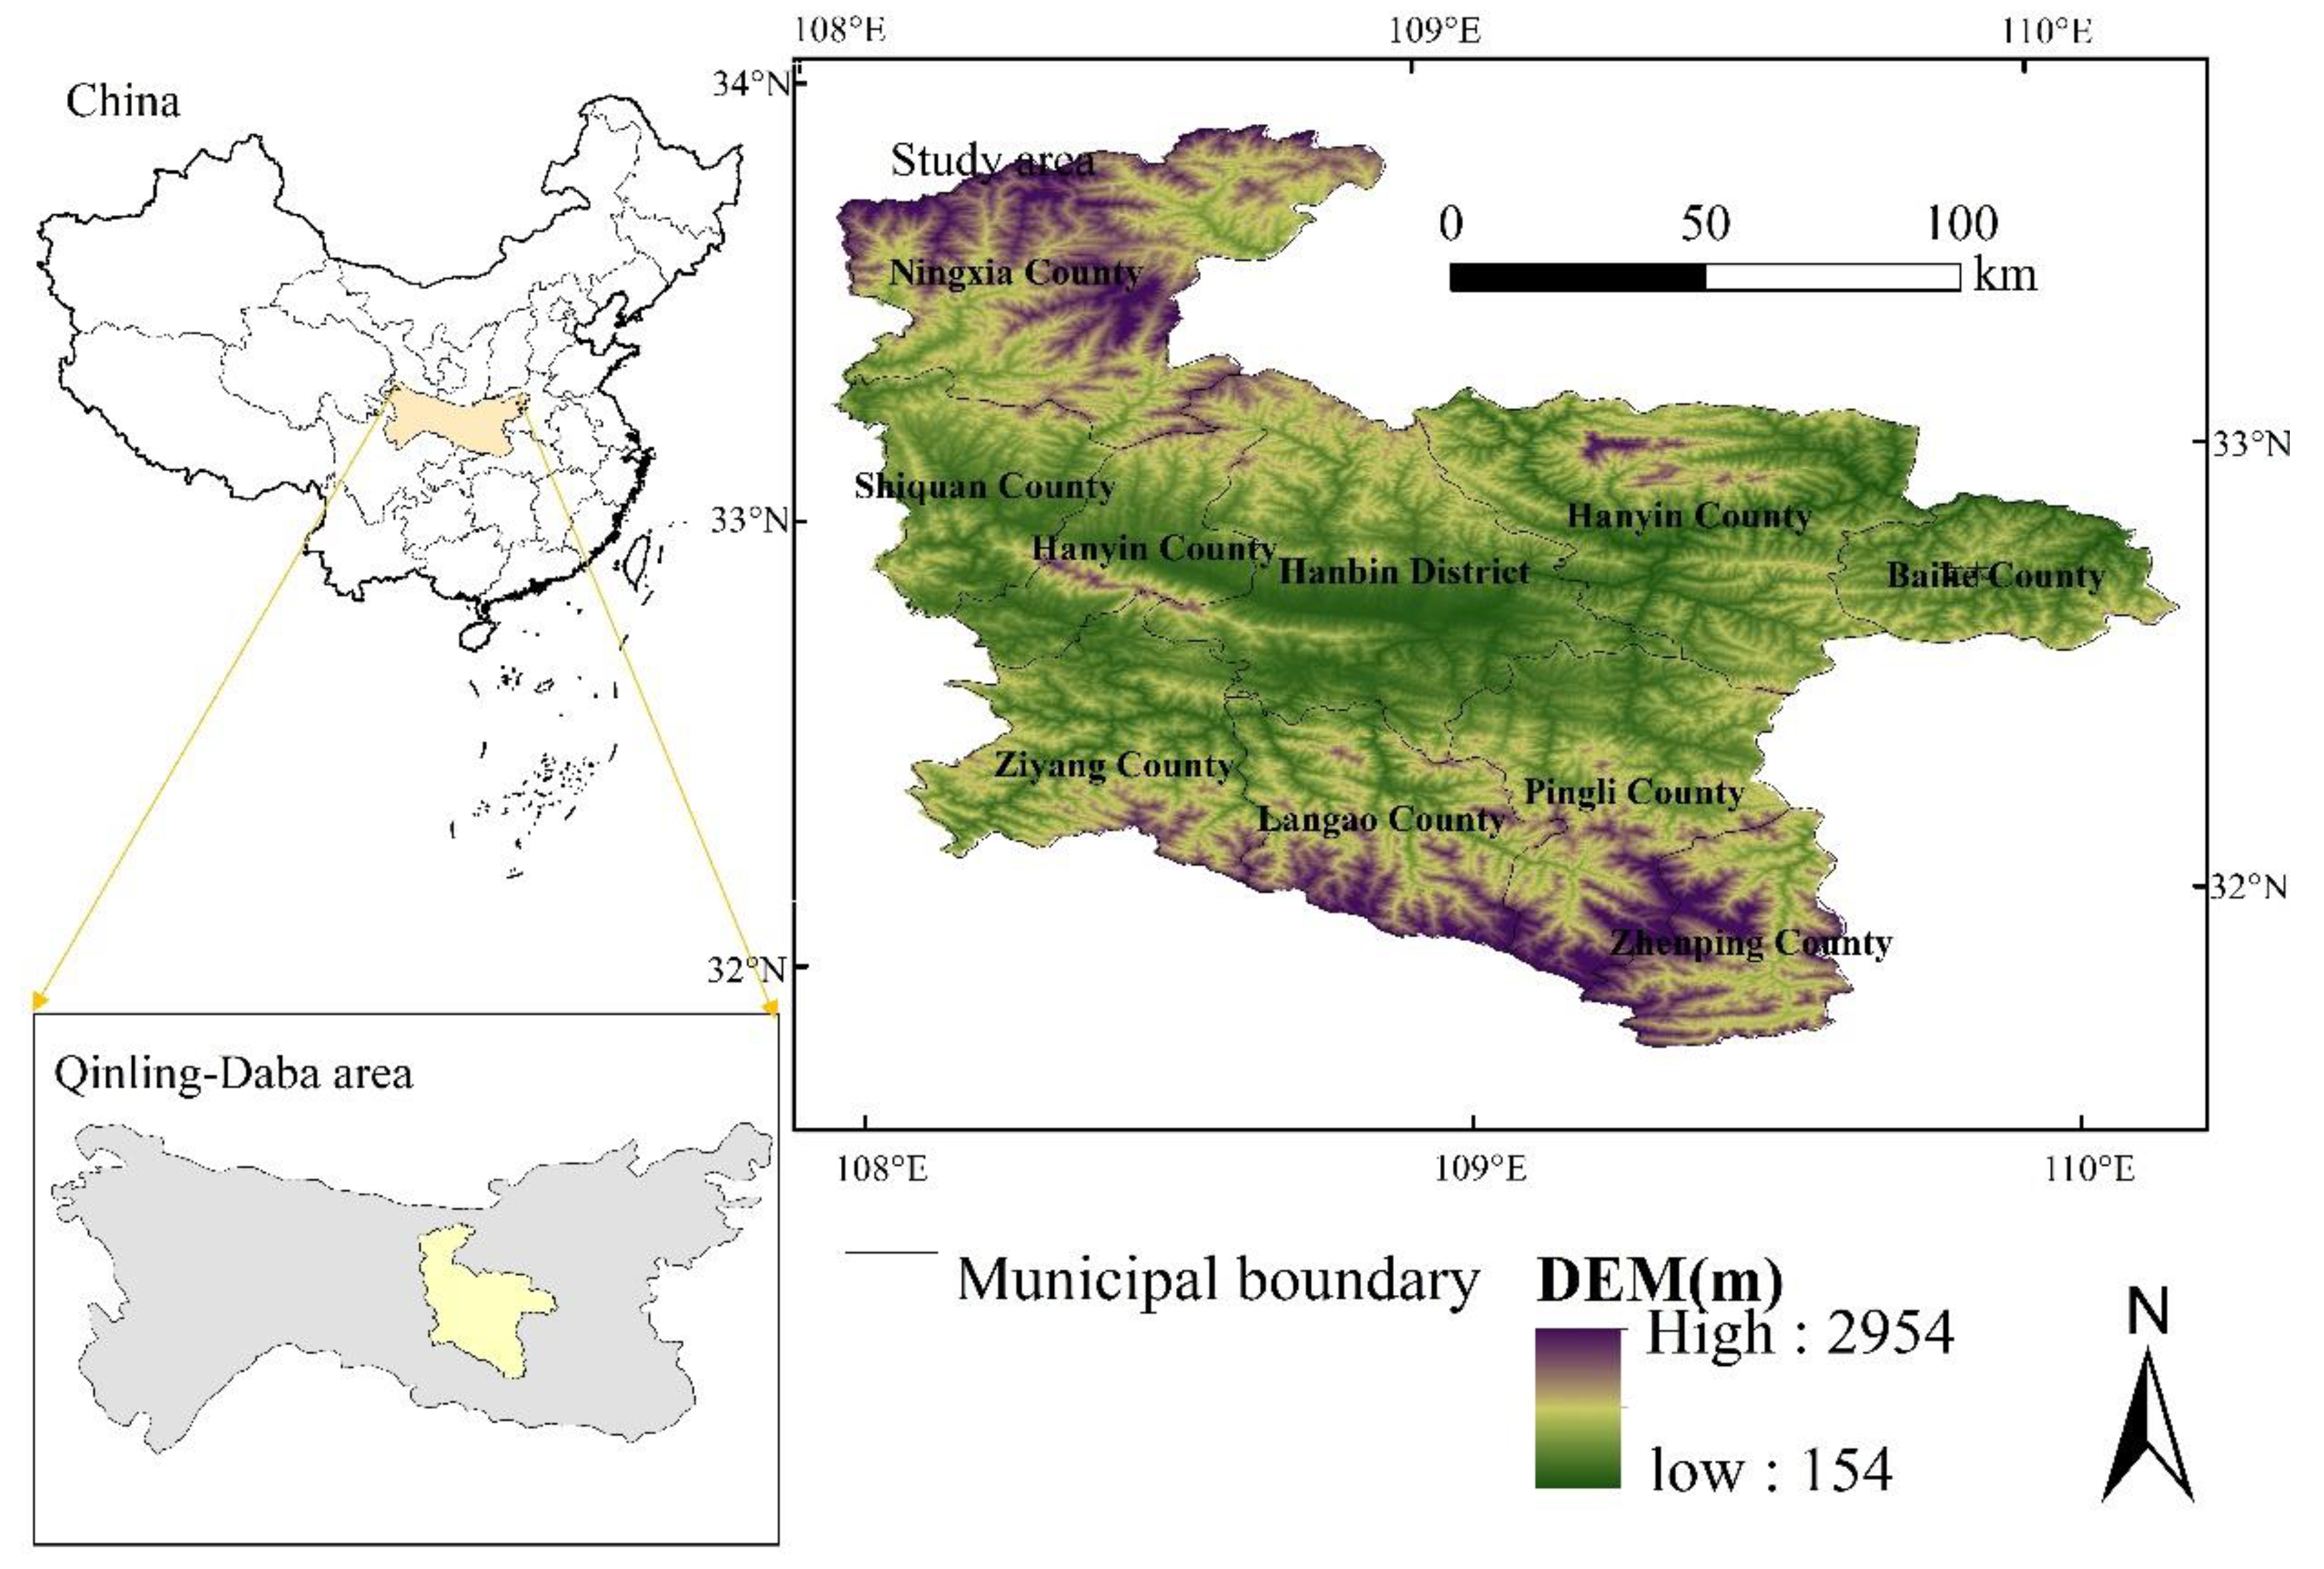
Nevertheless, prior research primarily concentrates on land use conflicts and ecological impacts in urban areas, primarily influenced by social and economic factors. There is a dearth of studies examining the effects of land use on habitat quality in mountainous eco-cities or small-scale cities. This paper assesses the evolving patterns of habitat quality in Ankang, a city located in the Qin-Ba Mountain region with ecological preservation, considering future climate scenarios and the ongoing development of land conflicts. The findings hold substantial importance for Ankang's ecological city in achieving a harmonious balance between environmental conservation and economic progress.
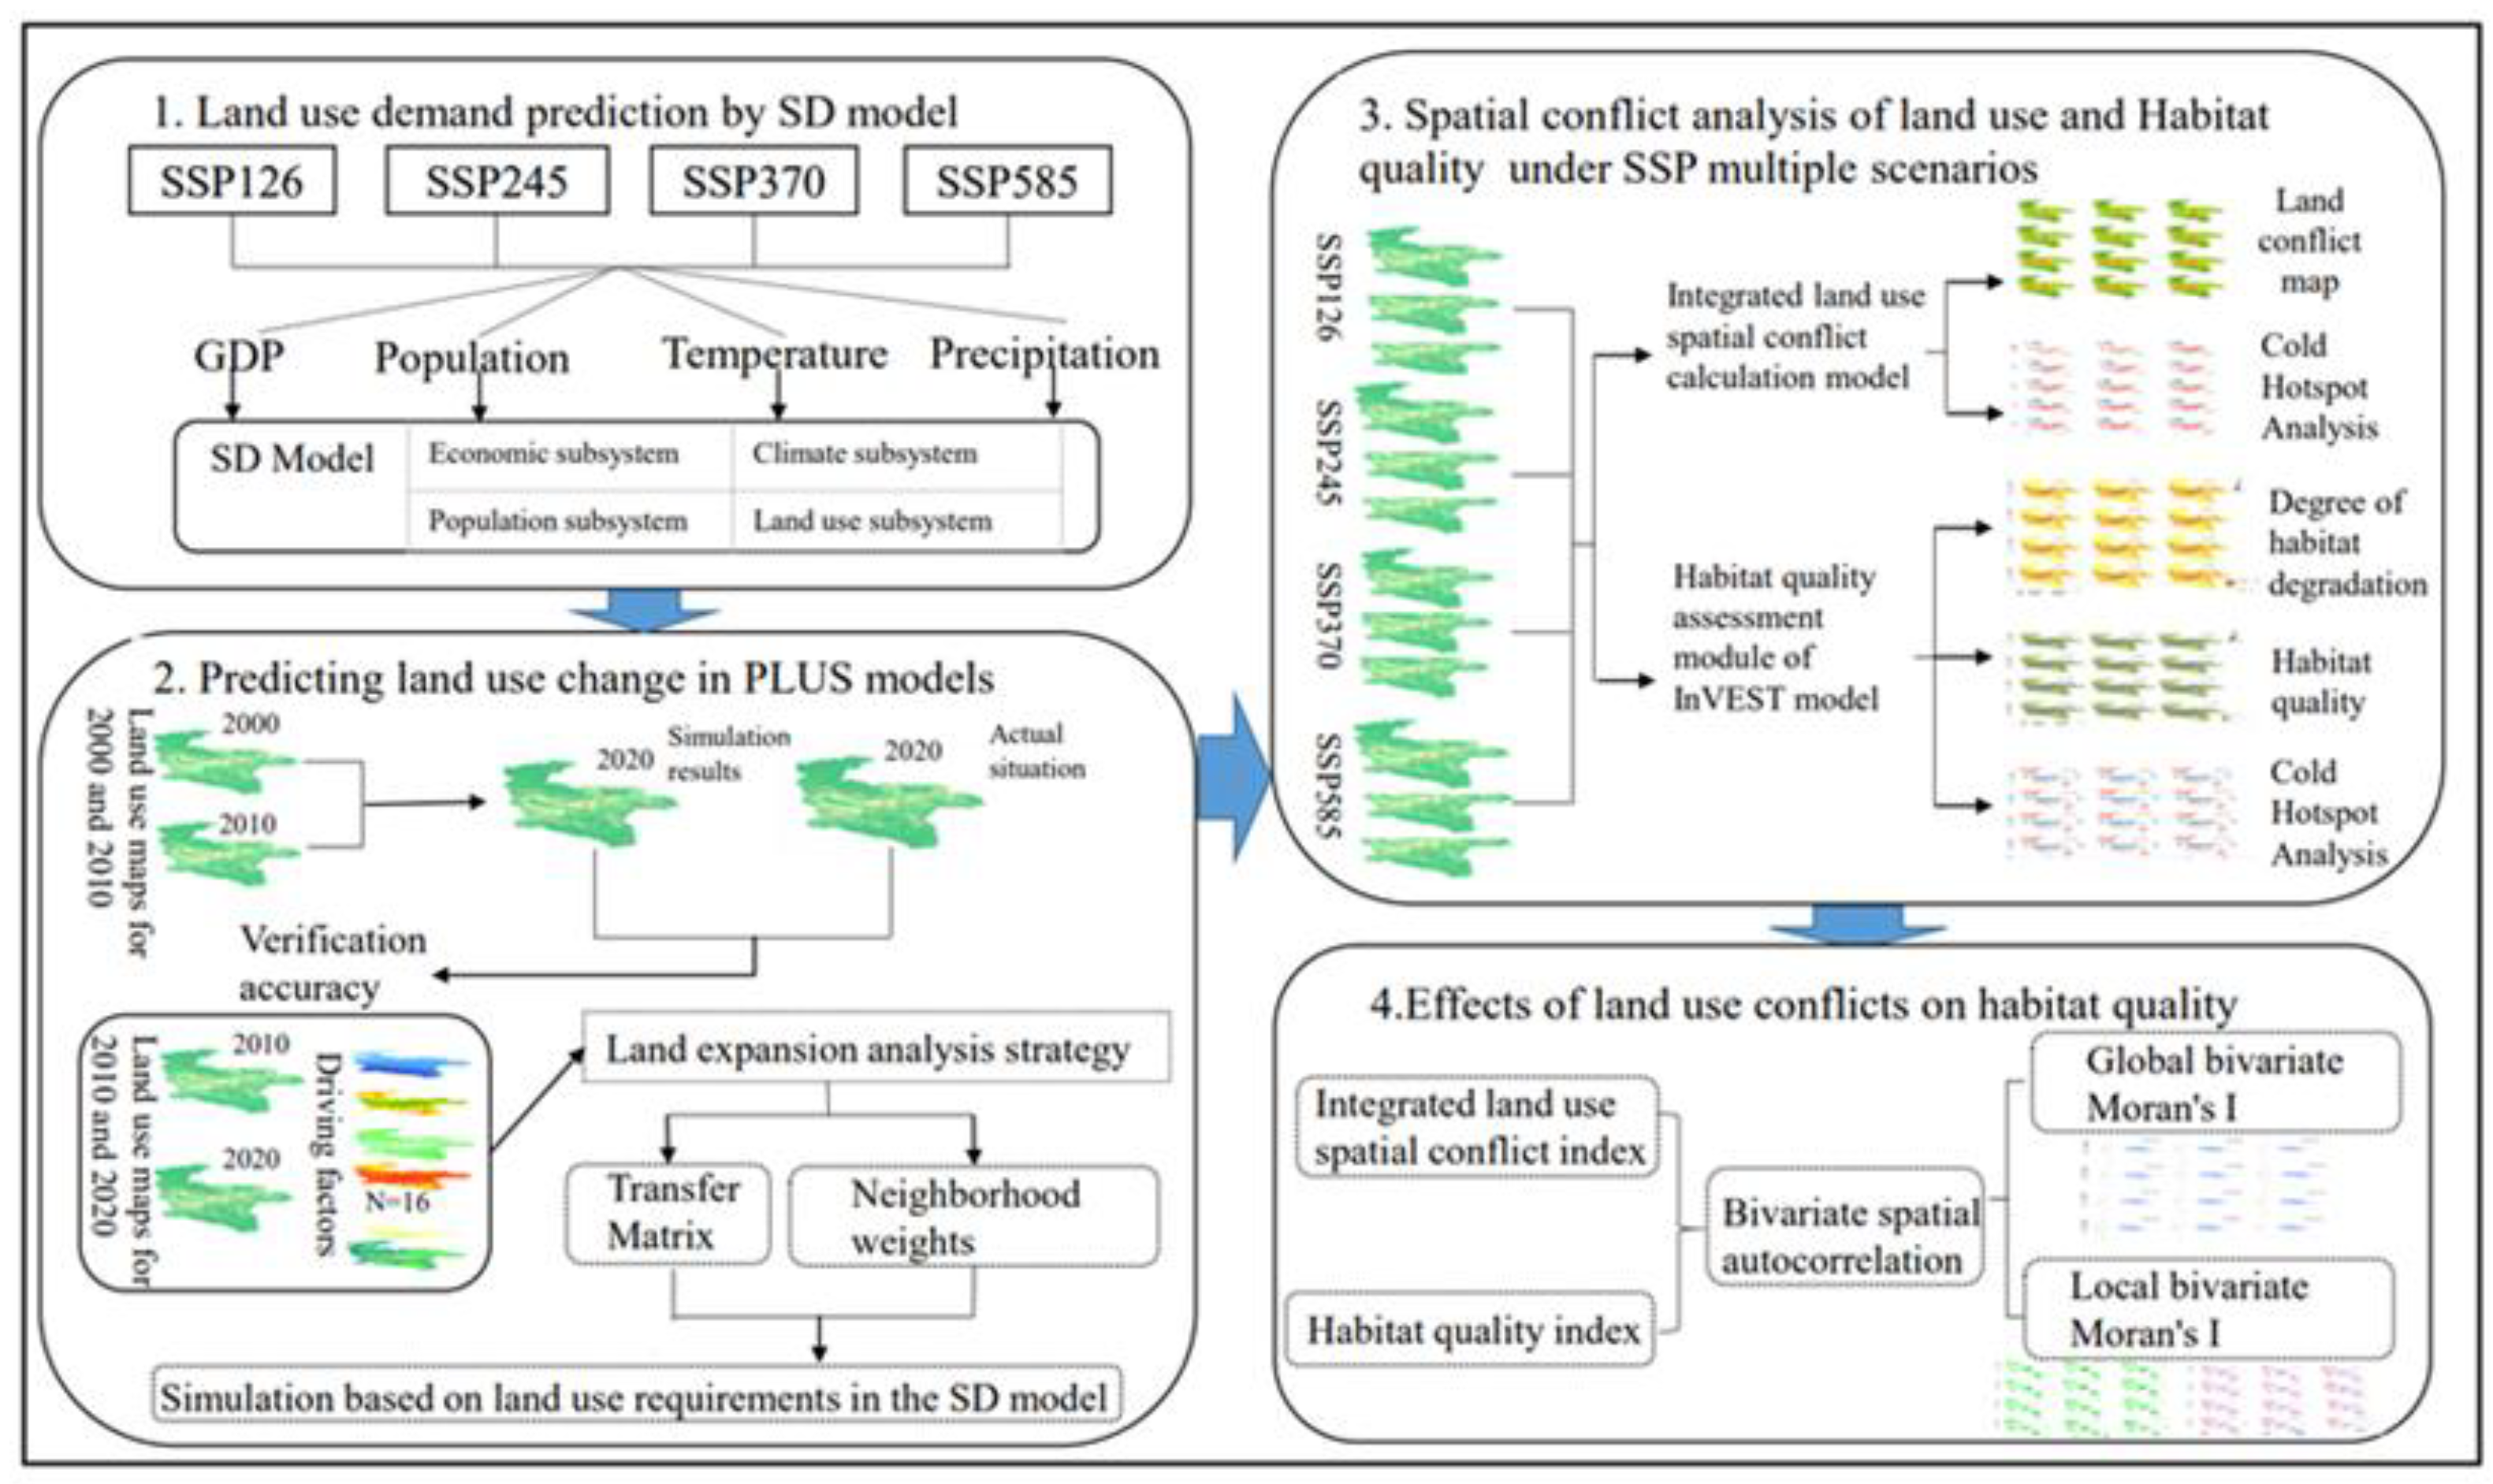
In summary, the study presents a framework that integrates the Sustainable Development (SD) model, PLUS model, InVEST model, and land use conflict evaluation model. This framework aims to examine future land conflicts within the constraints of ecology and urban economic development, using the city of Ankang in the Qin-Ba Mountains as a case study. The study aims to accomplish the following: (1) Determine the direction and scale of land use changes in Ankang City under different scenarios, namely SSP126 (low forcing scenario), SSP245 (medium forcing scenario), SSP370 (medium to high forcing scenario), and SSP585 (high forcing scenario). (2) Analyze the evolutionary process of land use conflicts and habitat quality in Ankang City over the next 30 years, including their spatial patterns. (3) Investigate the potential relationship between habitat quality and land use extent in Ankang, considering future environmental changes and development patterns. This analysis aims to provide guidance for the sustainable utilization of land resources and the establishment of harmonious human-land relationships in similar cities. Additionally, it aims to offer a scientific basis for the formulation of optimal land use policies.
4. Discussion
4.1. Reasonableness validation
The SD model encompasses a simulation period from 2000 to 2050, with a yearly time step. The historical simulation phase covers the years 2000 to 2020, during which historical data from the Statistical Yearbook was utilized to evaluate the simulation results. The accuracy of the simulation model was assessed using historical data specifically from 2020. Once the accuracy of the system dynamics model was verified, the base year for each scenario simulation was set as 2020, and different scenario parameters were inputted to simulate changes in future land use demand. The 2010 land use data serves as the base map for the simulation in the SD model, and the resulting land use simulation data for 2020 is compared and validated with the actual land use data from that year using the PLUS model to evaluate the accuracy of the simulation. After confirming that the simulation accuracy meets the requirements of the study, the land use demand for 2030, 2040, and 2050 in Ankang City, under each scenario simulated by the SD model, is sequentially inputted into the PLUS model to predict the future spatial and temporal dynamics of land use patterns. The results indicate an overall classification accuracy of 0.96 and a Kappa coefficient of 0.94 in the PLUS model, demonstrating a high level of simulation accuracy and effectiveness in simulating land use changes. Wang et al. [
58] confirmed the applicability of using a land conflict measurement model based on landscape index in mountainous cities. Therefore, this study predicts the spatial and temporal patterns of land conflict levels and habitat quality in Ankang from 2030 to 2050. Analyzing the predicted results of different land use scenarios in Ankang City from 2030 to 2050, it is determined that the SSP126 scenario would lead to improvements in habitat quality and better control of land use conflicts.
4.2. Shifting land types leading to increased land use conflicts
In the context of rapid urbanization, the pursuit of high-quality economic growth, and the increasing significance of ecological preservation, urban land expansion in Ankang, situated in the Qin-Ba Mountains, has primarily concentrated on the areas surrounding the valley basin along the Han River. This has resulted in encroachment upon agricultural and forested land within the river basin valley, leading to detrimental effects on both the living environment and ecological space. The underlying cause of this issue lies in the conflict between land utilization for construction purposes and agricultural activities, which stems from the limited availability of land resources in the face of growing demands. Conflicts frequently arise between agricultural and construction land, with agricultural land often being at a disadvantage in proximity to construction sites. This is due to the prioritization of urban construction activities for food production and the creation of favorable conditions for economic development, which, in turn, yield greater economic benefits. Consequently, agricultural production is negatively impacted, hindering the achievement of sustainable development goals. Overall, the spatial arrangement characterized by a mixture of land uses and high heterogeneity surrounding the Ankang municipality has resulted in the aggregation of land use conflicts. In contrast, the corresponding Qin-Ba Mountains, located far from human activities and subject to stringent ecological protection measures, contribute to the preservation of high-quality habitats. Within the Han River basin valley, the unique geographical position of Ankang, coupled with its predominantly hilly terrain, severely limits the availability of development space. As a result, construction land in Ankang primarily encroaches upon agricultural and forested land, expanding outward from the core urban area. This, in turn, leads to a more significant reduction in agricultural land around the downtown region. Consequently, rural development land is squeezed and pushed further away from the urban periphery, resulting in fragmentation and ultimately exacerbating conflicts. From an ecological perspective, the pattern of the river valley significantly influences the land use pattern in Ankang, further intensifying land use conflicts within the city and exerting a profound impact on its urban development.
4.3. Habitat quality response to land type change
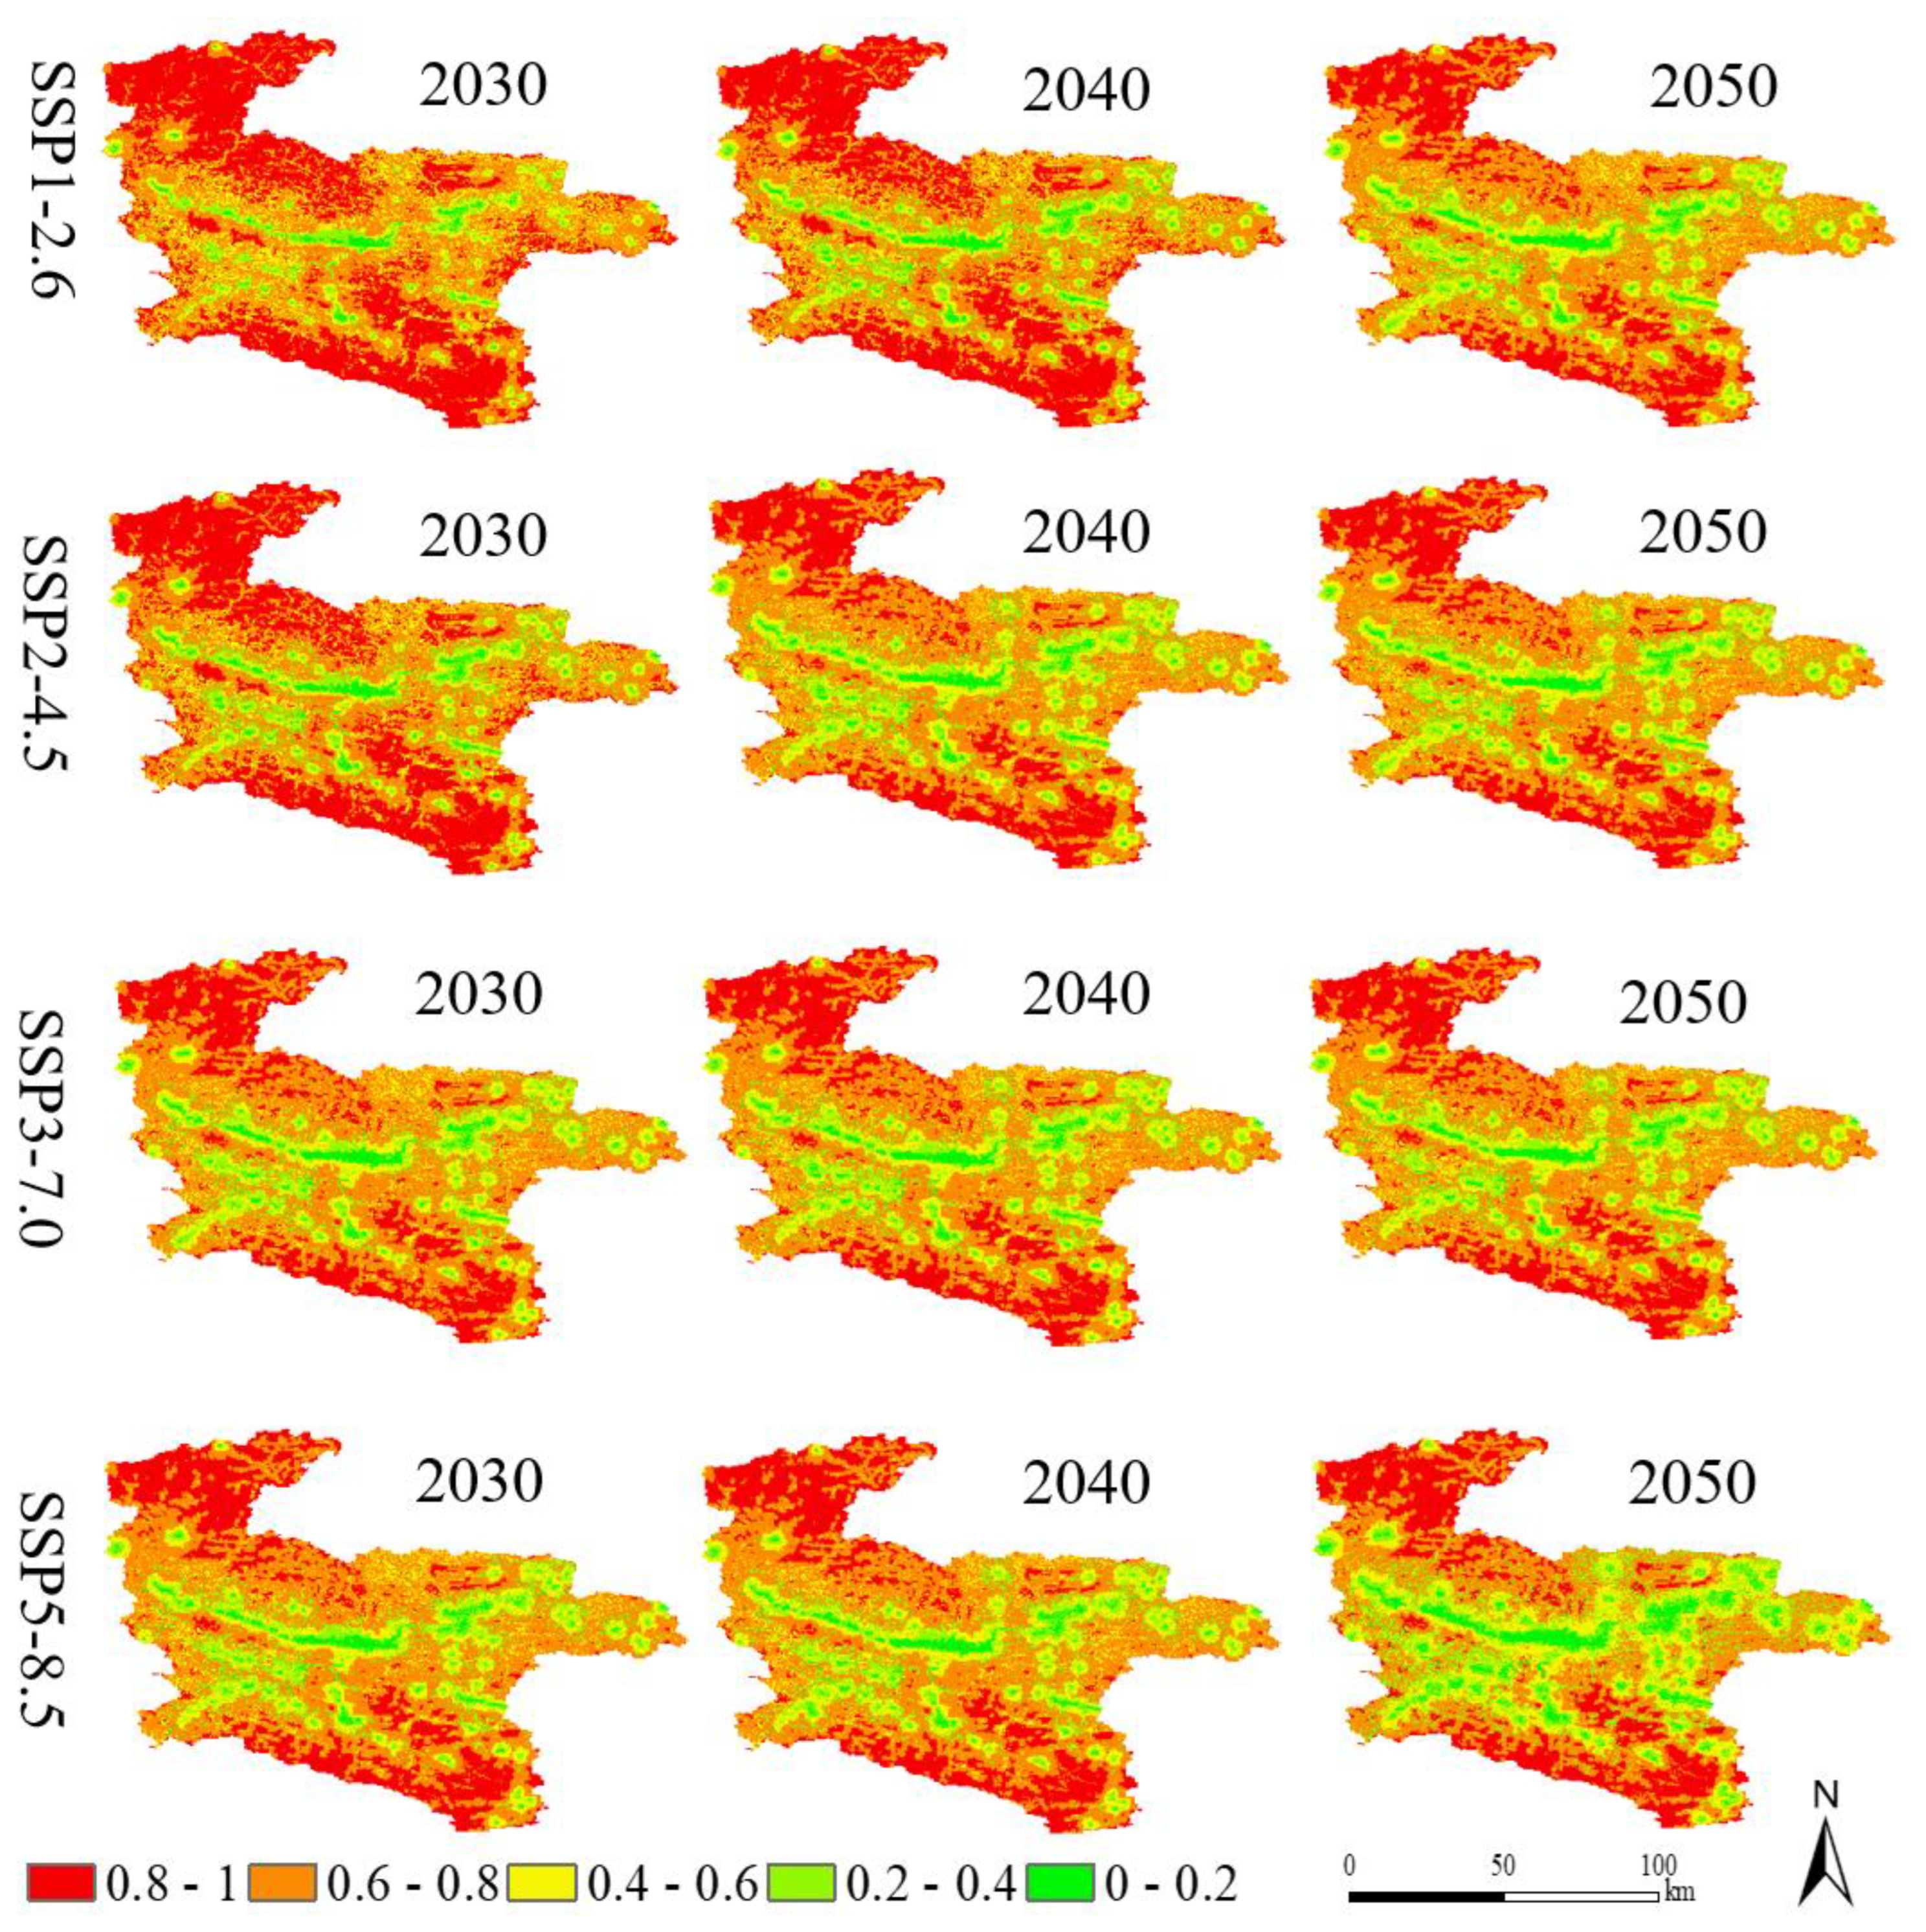
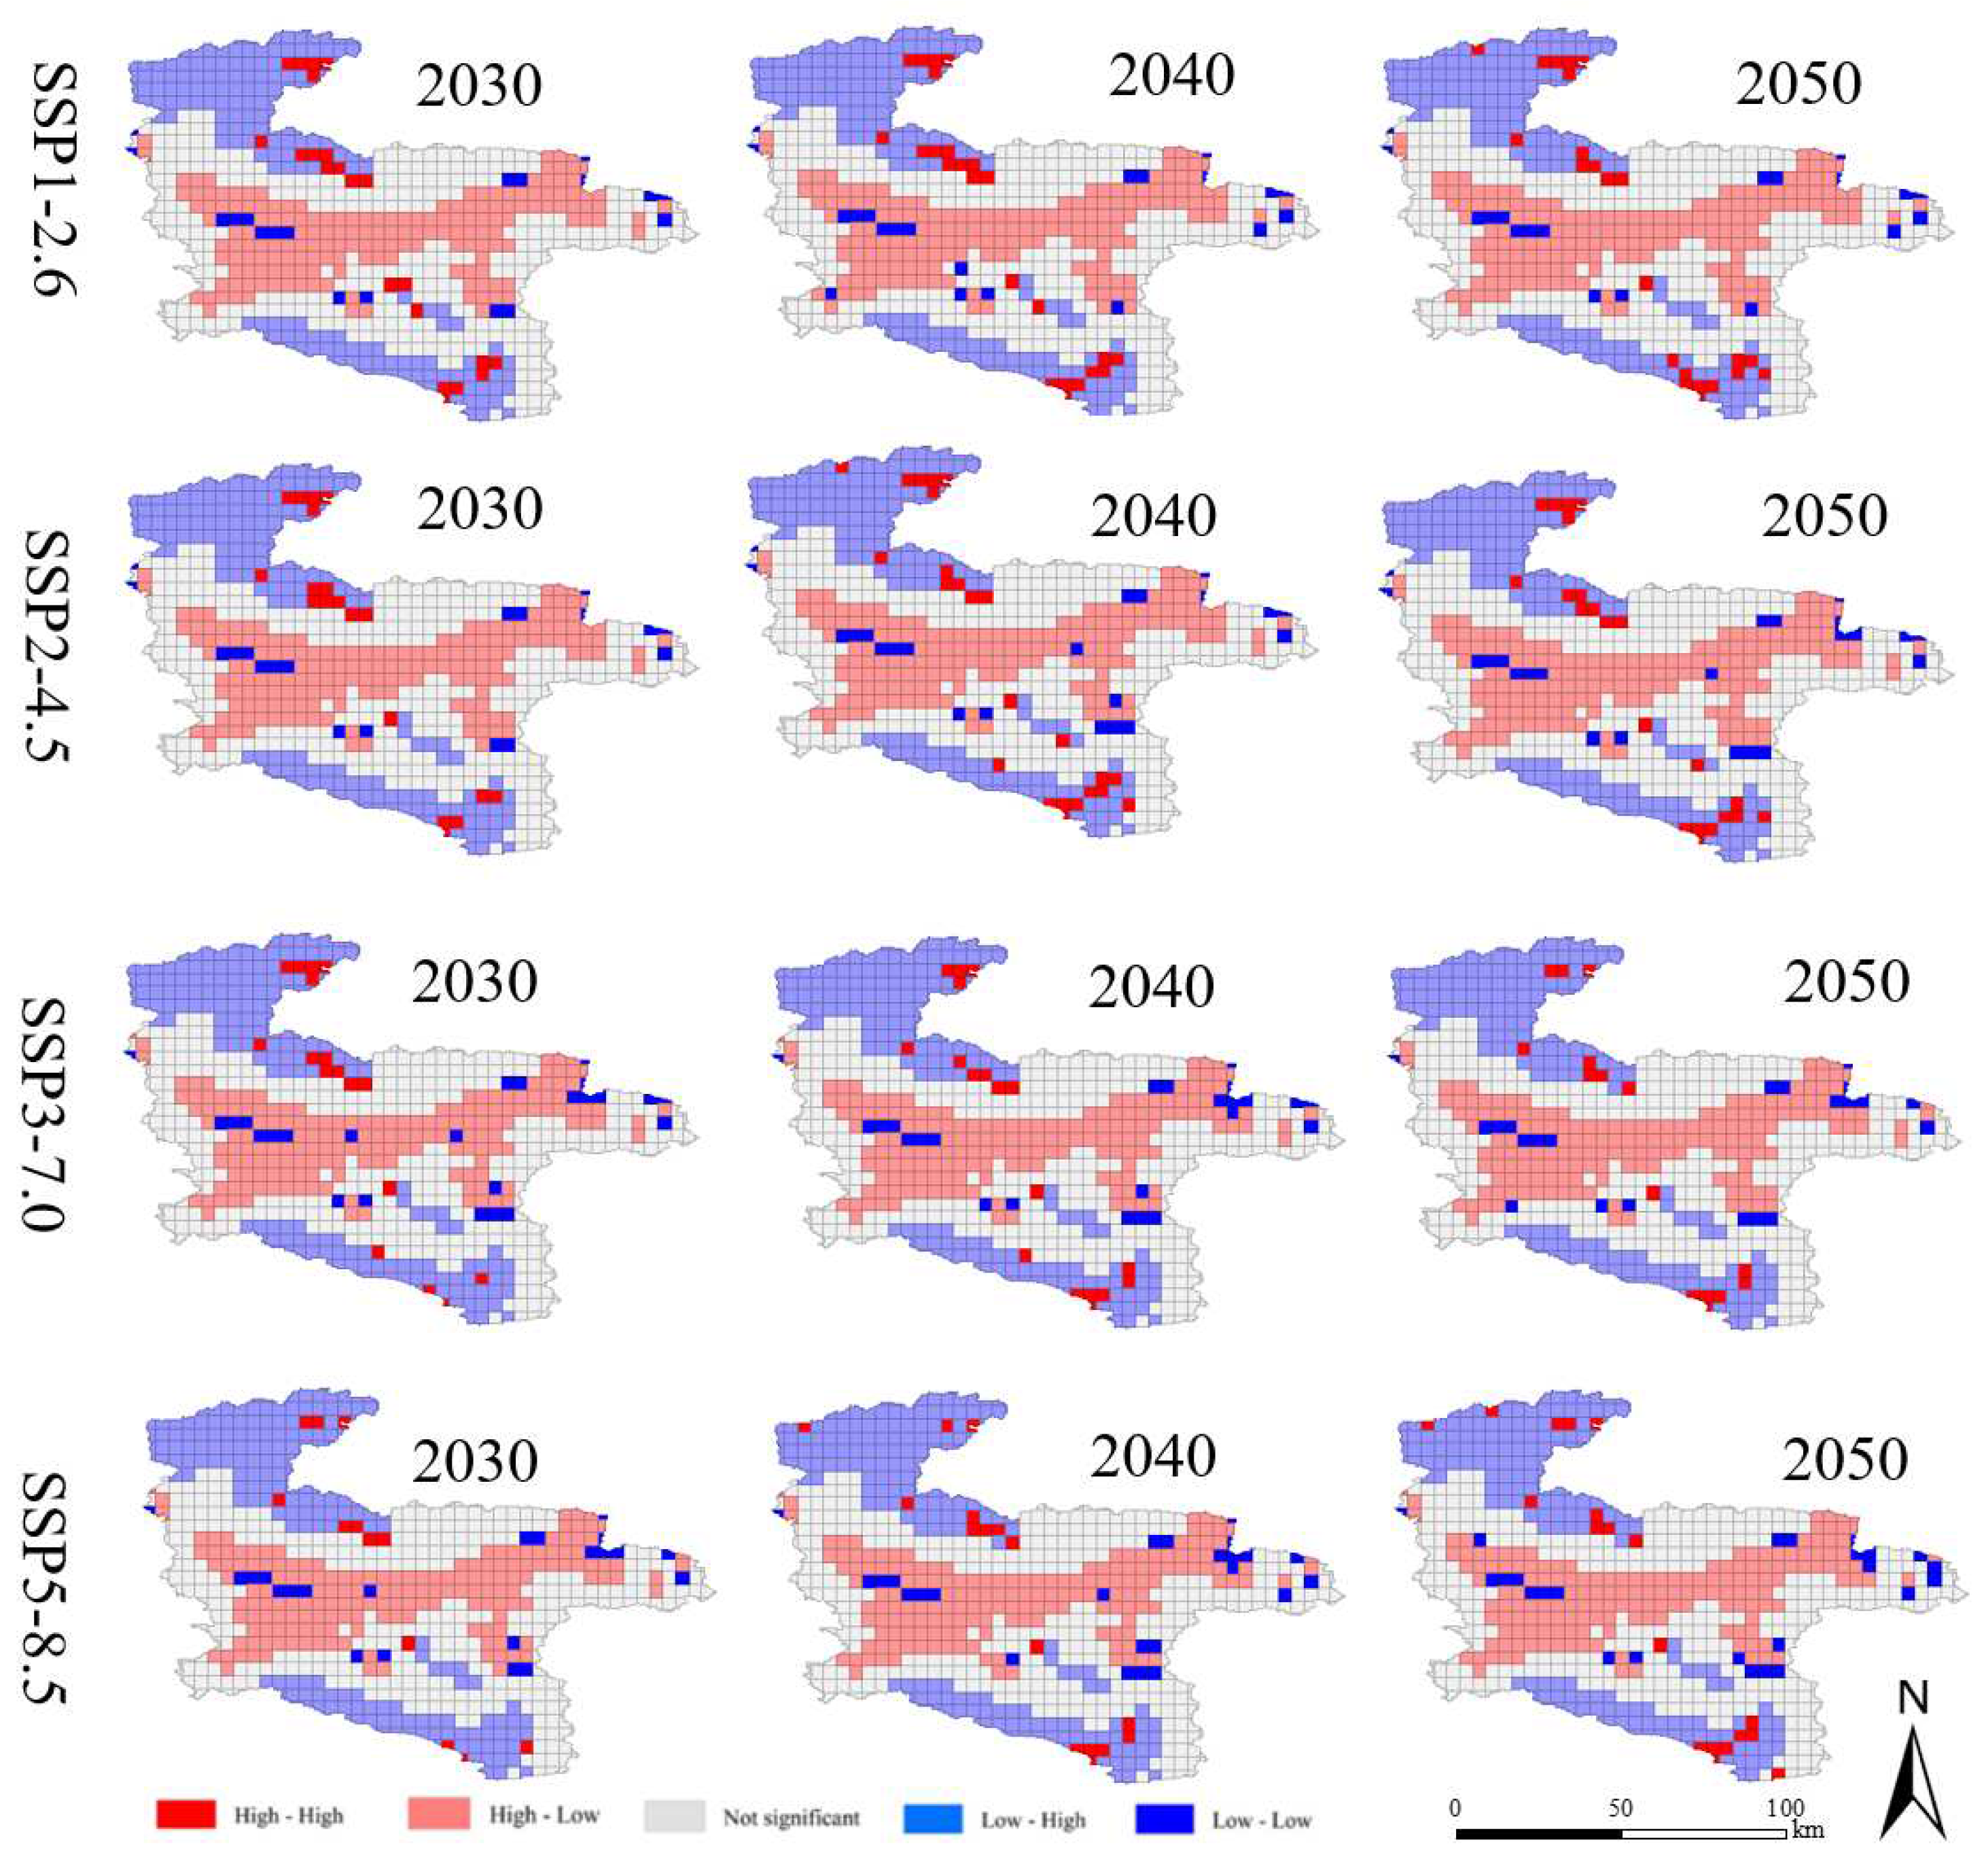
There are disparities in the alteration of habitat quality in Ankang across the four distinct future development scenarios, and the overall trajectory of habitat quality aligns with the patterns of land utilization. The Qinling region and the Bashan Mountains exhibit superior habitat quality compared to the central region, owing to their extensive forest and grassland coverage and minimal human-induced activities. Conversely, the Han River Valley basin experiences relatively diminished habitat quality due to socio-economic progress, expansion of construction land, and the degradation of habitats threatened by agricultural practices. In the SSP126 scenario, regulated construction land results in a deceleration of economic growth, leading to an expansion of woodland and grassland areas, which in turn enhances habitat quality. In contrast, the SSP585 scenario exhibits the lowest habitat quality among all scenarios, attributed to unregulated economic development and reduced ecological protection. Consequently, alterations in land utilization patterns have a discernible impact on habitat quality, contingent upon changes in response to climatic, economic, and governmental factors. The findings suggest that habitat quality exhibits a notable response in areas characterized by concentrated land use changes (conflict zones), while displaying less significant changes in regions with limited land use alterations (non-conflict zones).
4.4. Effects between land use and habitat quality
The interaction between land use and changes in ecosystem services has a significant impact on human well-being. However, numerous studies indicate that land use change often results in negative effects on ecosystem services [
60]. This aligns with the findings of a study on the detrimental relationship between land use and habitat quality [
61]. Wei et al. demonstrated that alterations in various land use types can influence habitat quality in arid inland regions. Similarly, Chen et al. revealed that urbanization can impair environmental facilities due to the interference of urbanization levels with ecosystem services. Conversely, the capacity of environmental facilities can also limit urbanization. Simulations were conducted to analyze land use patterns and habitat quality under multiple scenarios, which yielded notable spatial effects. The results obtained from these simulations align with the evaluation findings of Wu et al. [
63]. Specifically, the SSP126 scenario indicates an increasing trend in habitat quality, while the SSP585 scenario shows a degradation trend. The SSP245 and SSP370 scenarios demonstrate moderate habitat quality. It is worth noting that the development model focused solely on economic benefits, as observed in the related study [
64], inevitably increases ecological risks compared to the results obtained under the SSP585 scenario in this study. Research conducted on land use and habitat quality in significant ecosystems such as the Qinling Mountains and Han River indicates that urban construction land expansion and economic development should be restricted to ecological protection areas. Fragmentation of production and livelihood land poses a threat to ecological land, leading to habitat degradation, which is consistent with previous studies [
65]. These findings suggest that land use change directly influences changes in ecological quality. Human activities associated with land use contribute to environmental changes, which subsequently impact ecosystems, aligning with the conclusions drawn by Zhao et al. [
66] regarding the trade-offs between human activities and ecosystem services. Across all scenarios, there is a tendency for construction land and agricultural land areas to increase and concentrate around the town center in Ankang and the Han River valley, resulting in a decline in habitat quality. These results confirm the effects of changes in construction land and agricultural land areas on habitat quality. Notably, the construction of land has the most pronounced impact on habitat quality, while alterations in unused land and agricultural land areas directly influence changes in habitat quality.
5. Conclusions
5.1. Conclusions
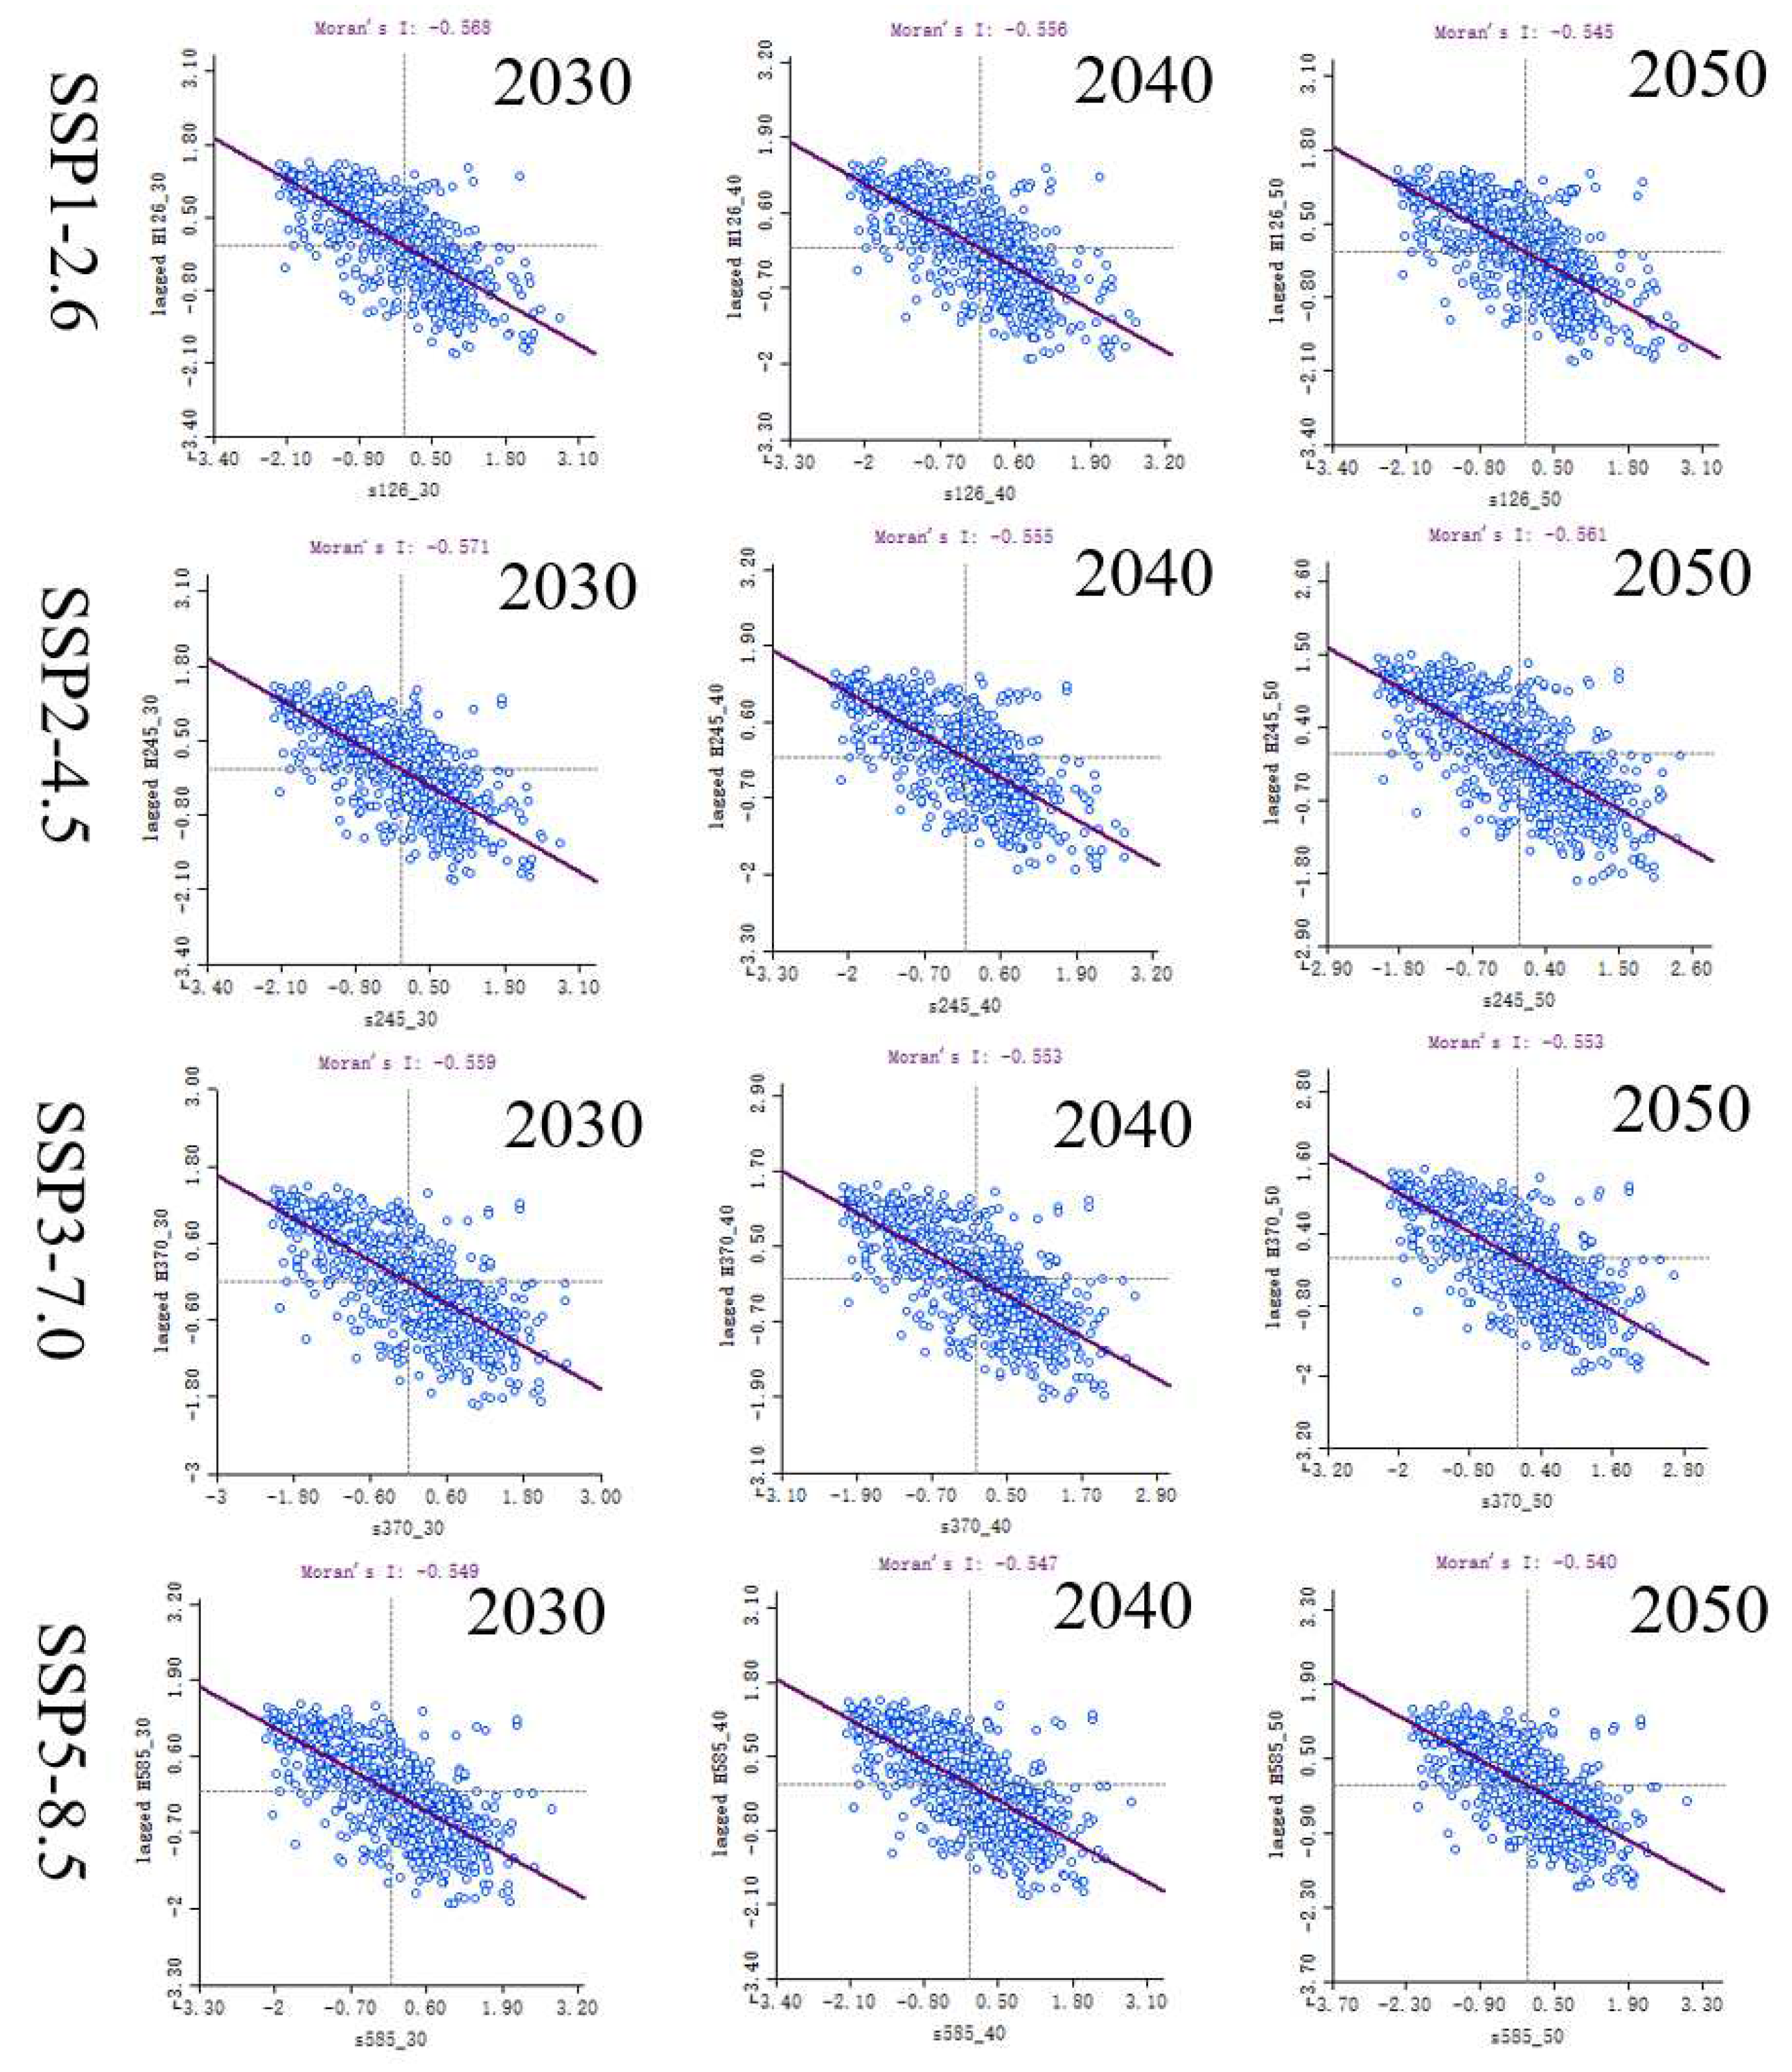
Based on the system dynamics and PLUS model for forecasting future land use, four scenarios (SSP126, SSP245, SSP370, and SSP585) with distinct socio-economic development patterns have been selected to project future land use intensity, evaluate future land conflict levels, and assess habitat quality in the region. The objective is to examine the spatial and temporal effects on the future state of land conflicts and habitat quality under different climate and socio-economic change scenarios. The findings reveal that the primary spatial clustering patterns for land use and habitat quality exhibit a high-low type (high land use and low habitat quality) and a low-high type (low land use and high habitat quality), demonstrating a significant negative correlation. In conclusion, the impact on habitat quality under different future land use scenarios will rely on effective land use governance and planning, as well as external factors such as climate change. The achievement of ecological conservation and sustainable economic development necessitates prudent planning and management. Even in Ankang, where ecological development is prioritized, the city will gradually encounter conflicts between ecological conservation and economic development in future scenarios. Ankang boasts a favorable geographical location, excellent transportation infrastructure, abundant tourism resources, and a green industrial base. However, its overall development lags behind neighboring cities in terms of scale and progress. Therefore, for ecological cities or small cities, it is imperative to strike an optimal balance between socio-economic development and ecological protection by promoting high-level preservation and high-quality advancement to effectively safeguard the ecological environment and establish a comprehensive ecological civilization system. The results suggest that the future development space in Ankang will be constrained within the context of ecological conservation, leading to heightened land use conflicts in urban areas, which will result in ecosystem degradation and ultimately diminished habitat quality. The findings indicate that Ankang must reconcile economic development and ecological protection based on ecological conservation principles. Sufficient room for economic development should be allocated without encroaching upon areas designated for environmental protection, thereby fostering harmonious human-land relationships while ensuring robust economic progress.
5.2. Limitations
Firstly, the comprehensive exploration of future land use changes on habitat quality remains incomplete. Our current study focused solely on the dynamic changes in land use conflict and habitat quality in Ankang, an ecologically oriented city, from 2030 to 2050. We established their spatial correlation but did not consider other perspectives such as mathematical or physical models, which should be incorporated in future studies for a more comprehensive analysis.
Secondly, our study only examined the spatial association between land use and habitat quality, neglecting the impacts of land use on other elements of ecosystem services. In future studies, we will delve deeper into exploring these impacts to gain a more thorough understanding.
Thirdly, there is a need to further enrich and improve the indicator construction system. Additionally, it is crucial to incorporate other factors that influence human activities and socio-economic development to enhance the simulation of land use demand, land use change, and habitat quality change.
Lastly, our study selected only four typical climate scenarios and social development models, which introduces uncertainty in the predictions made by the SD-PLUS model. To mitigate this uncertainty, future studies should refine scenario parameters to better measure the future effects of land use change on habitat quality. It is also important to target areas with different social service orientations to accommodate sustainable future development.
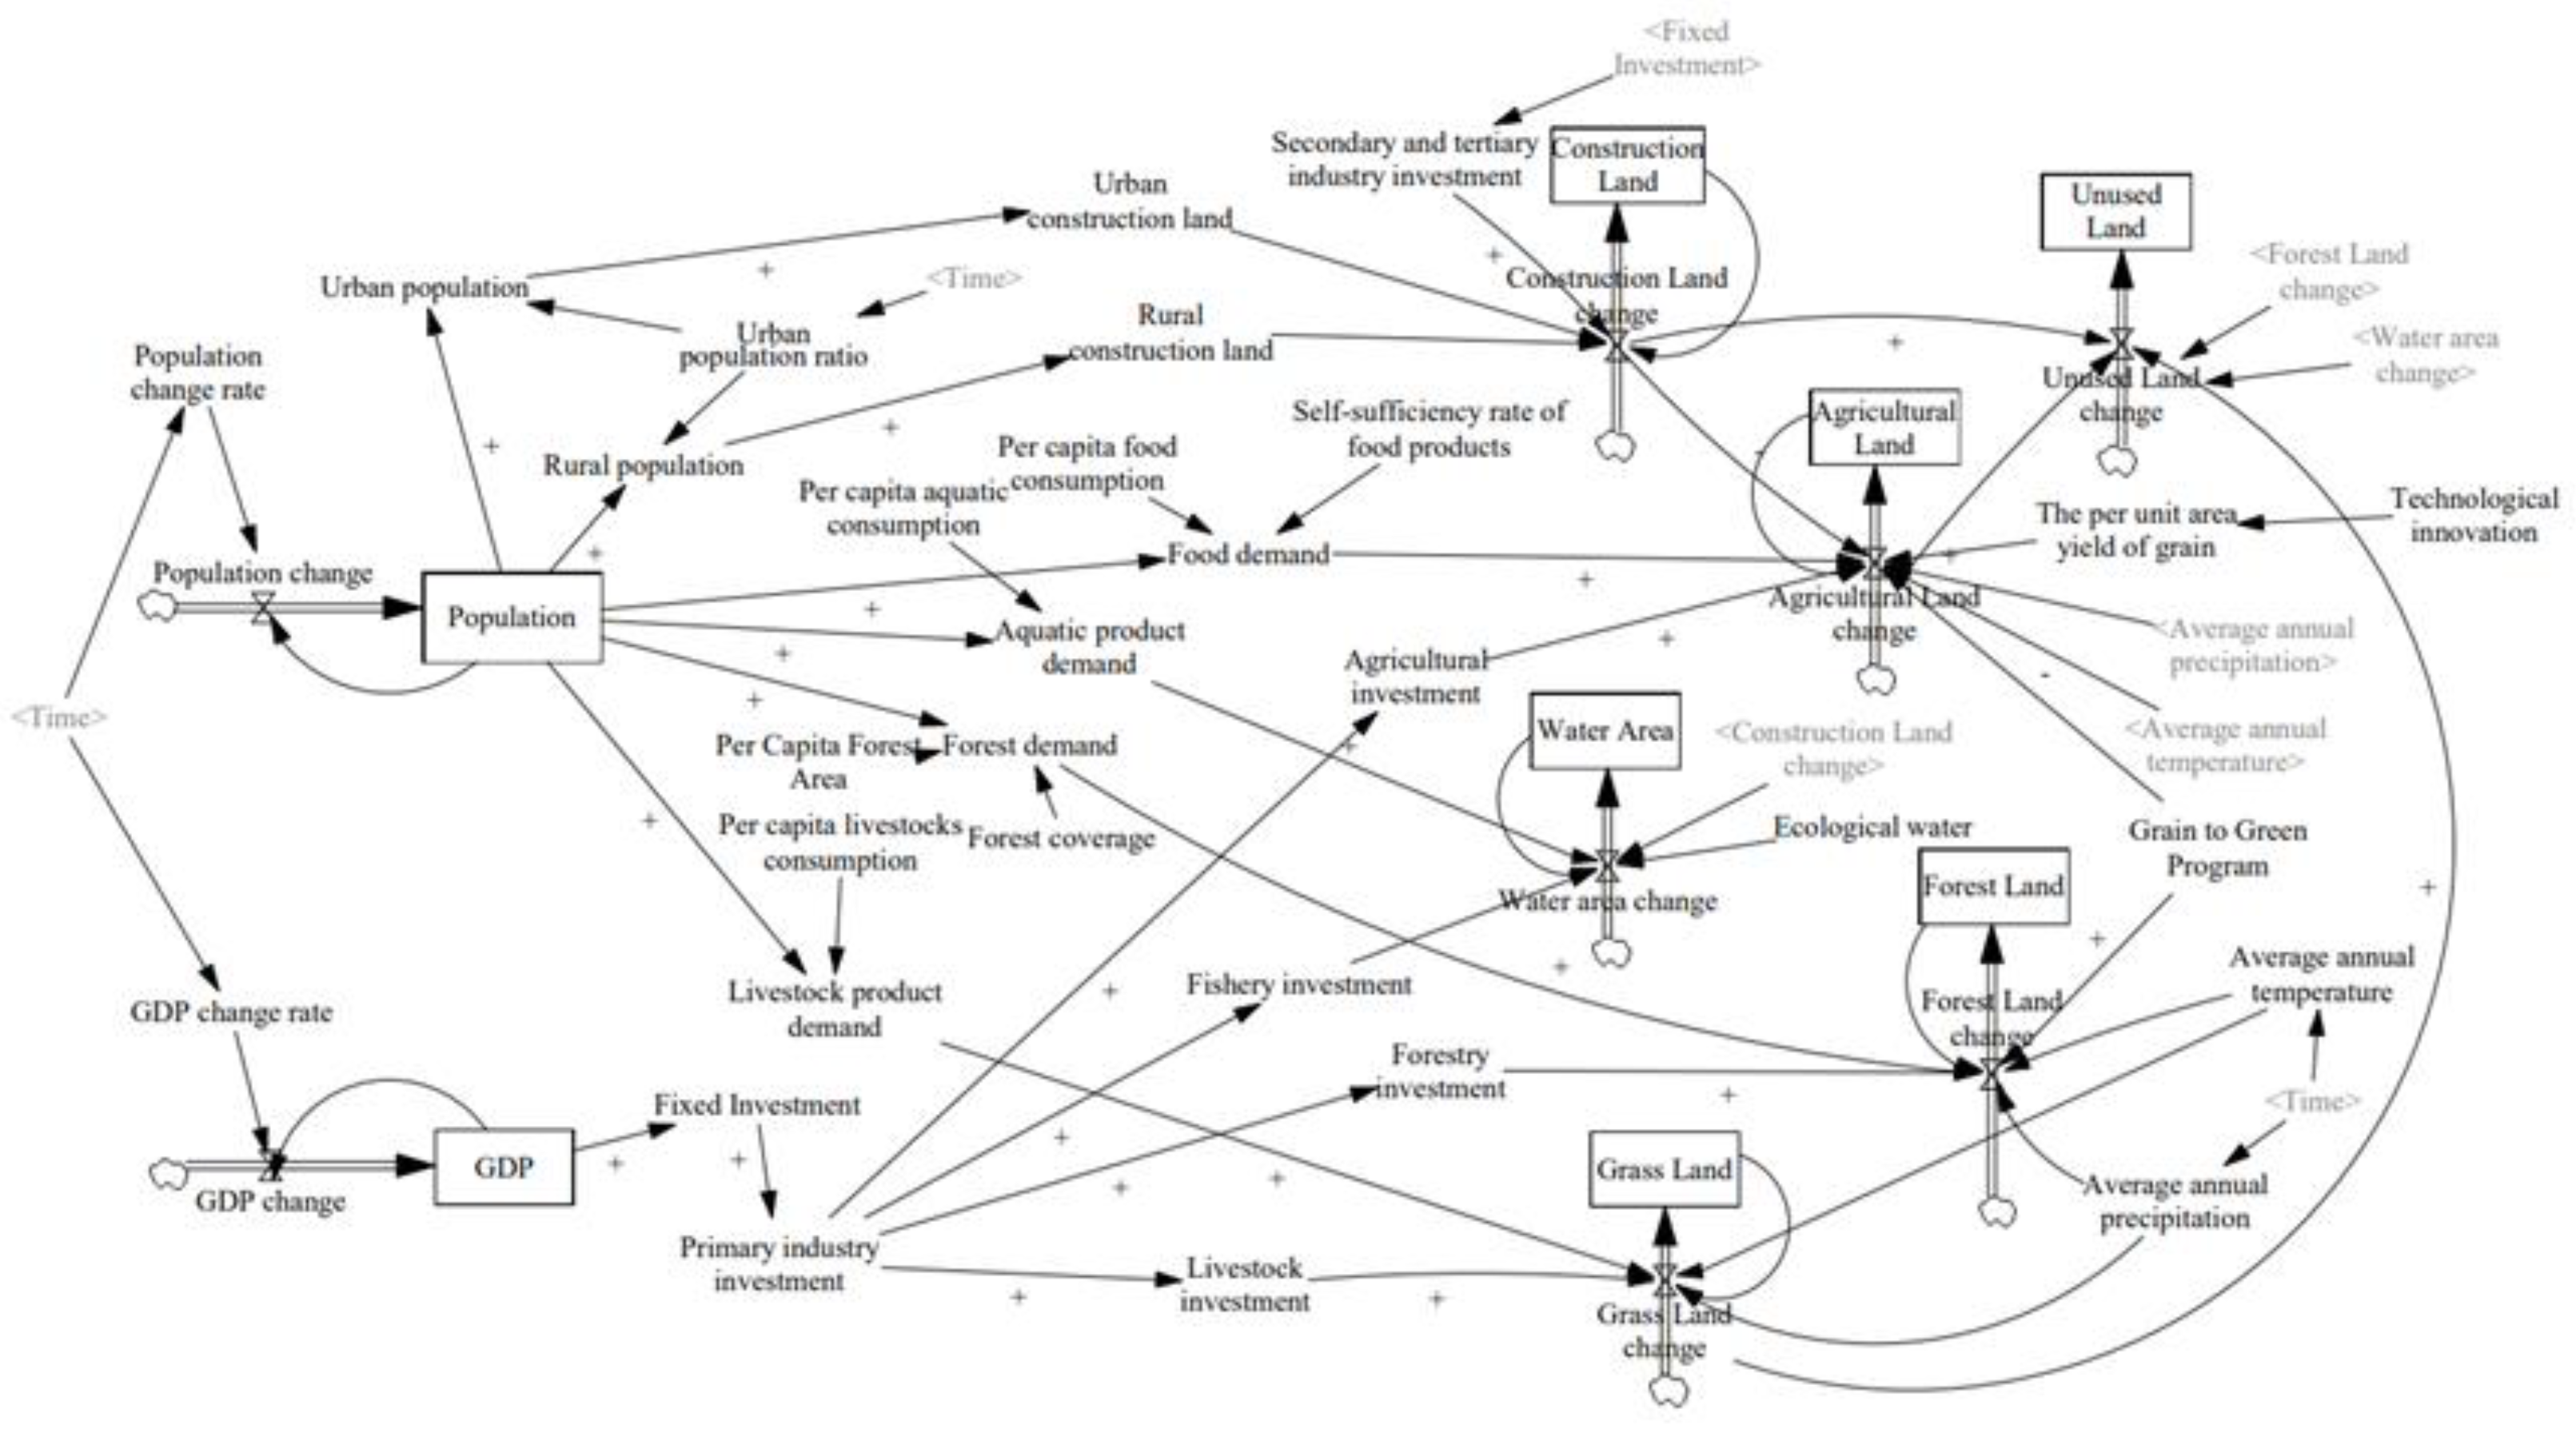
Figure 3.
SD model of land use demand in Ankang.
Figure 3.
SD model of land use demand in Ankang.
Figure 4.
Ankang land use map for 2000, 2010 and 2020.
Figure 4.
Ankang land use map for 2000, 2010 and 2020.
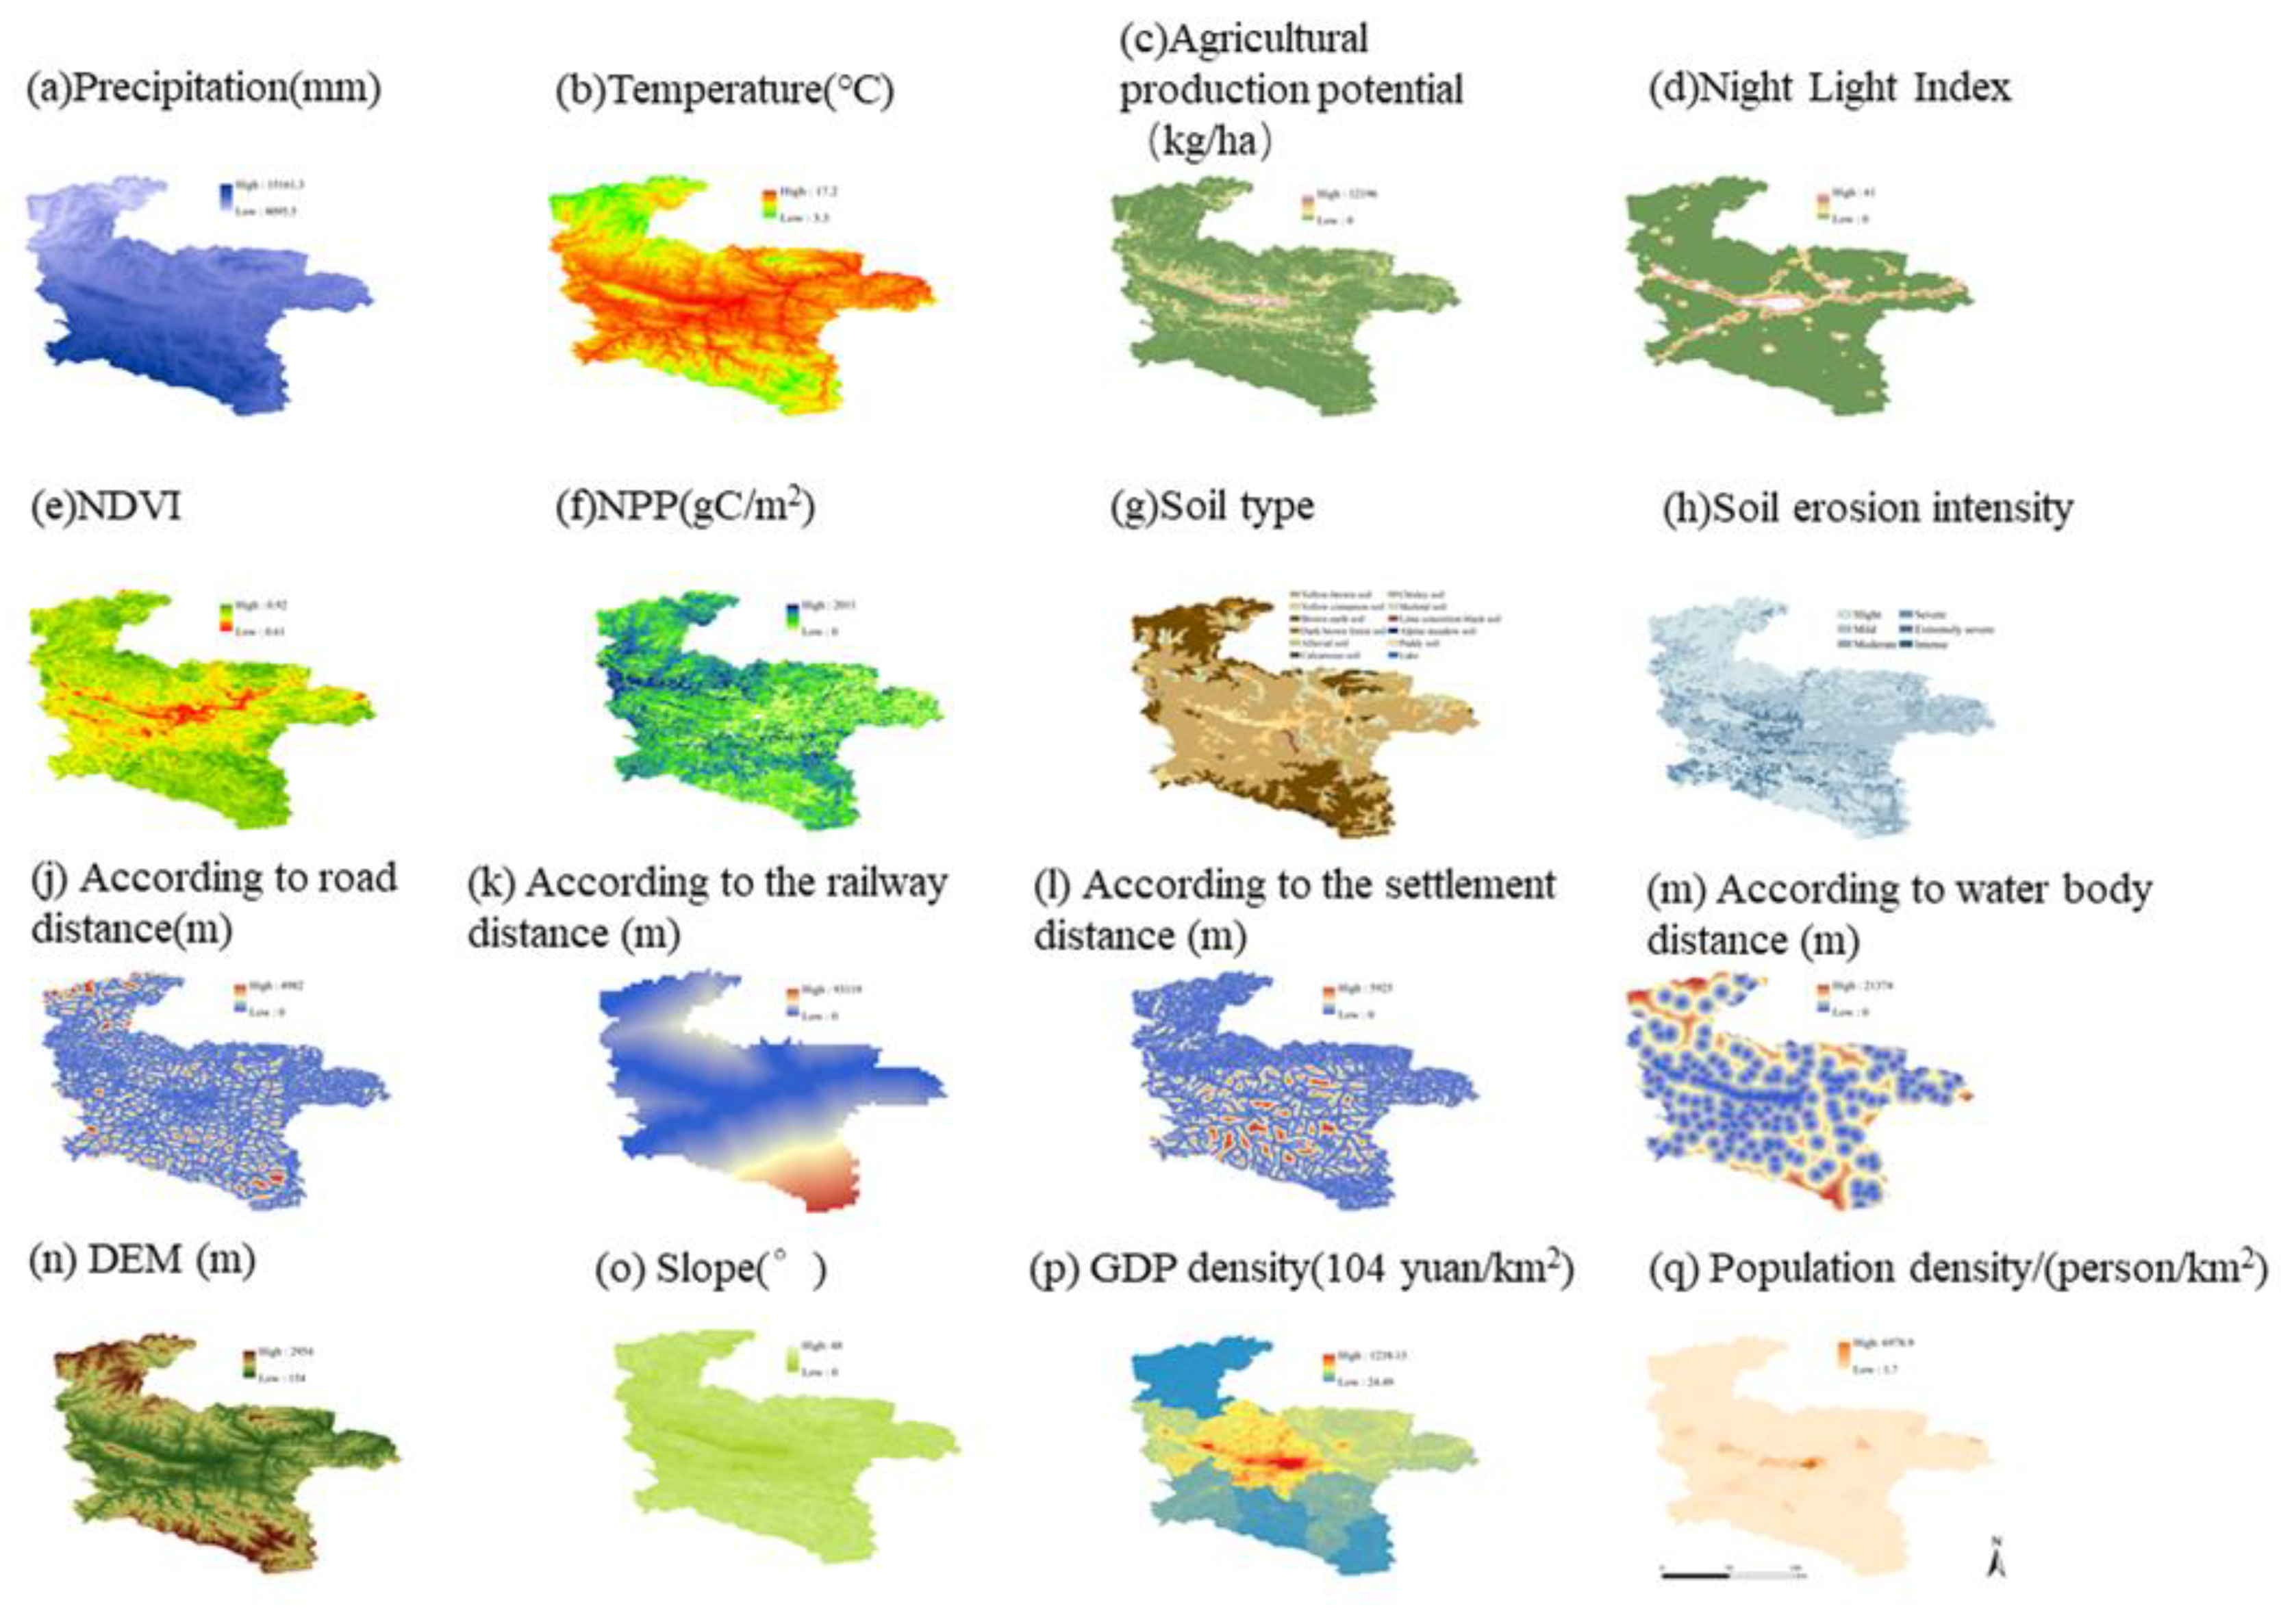
Figure 5.
Driving factor indicators.
Figure 5.
Driving factor indicators.
Figure 6.
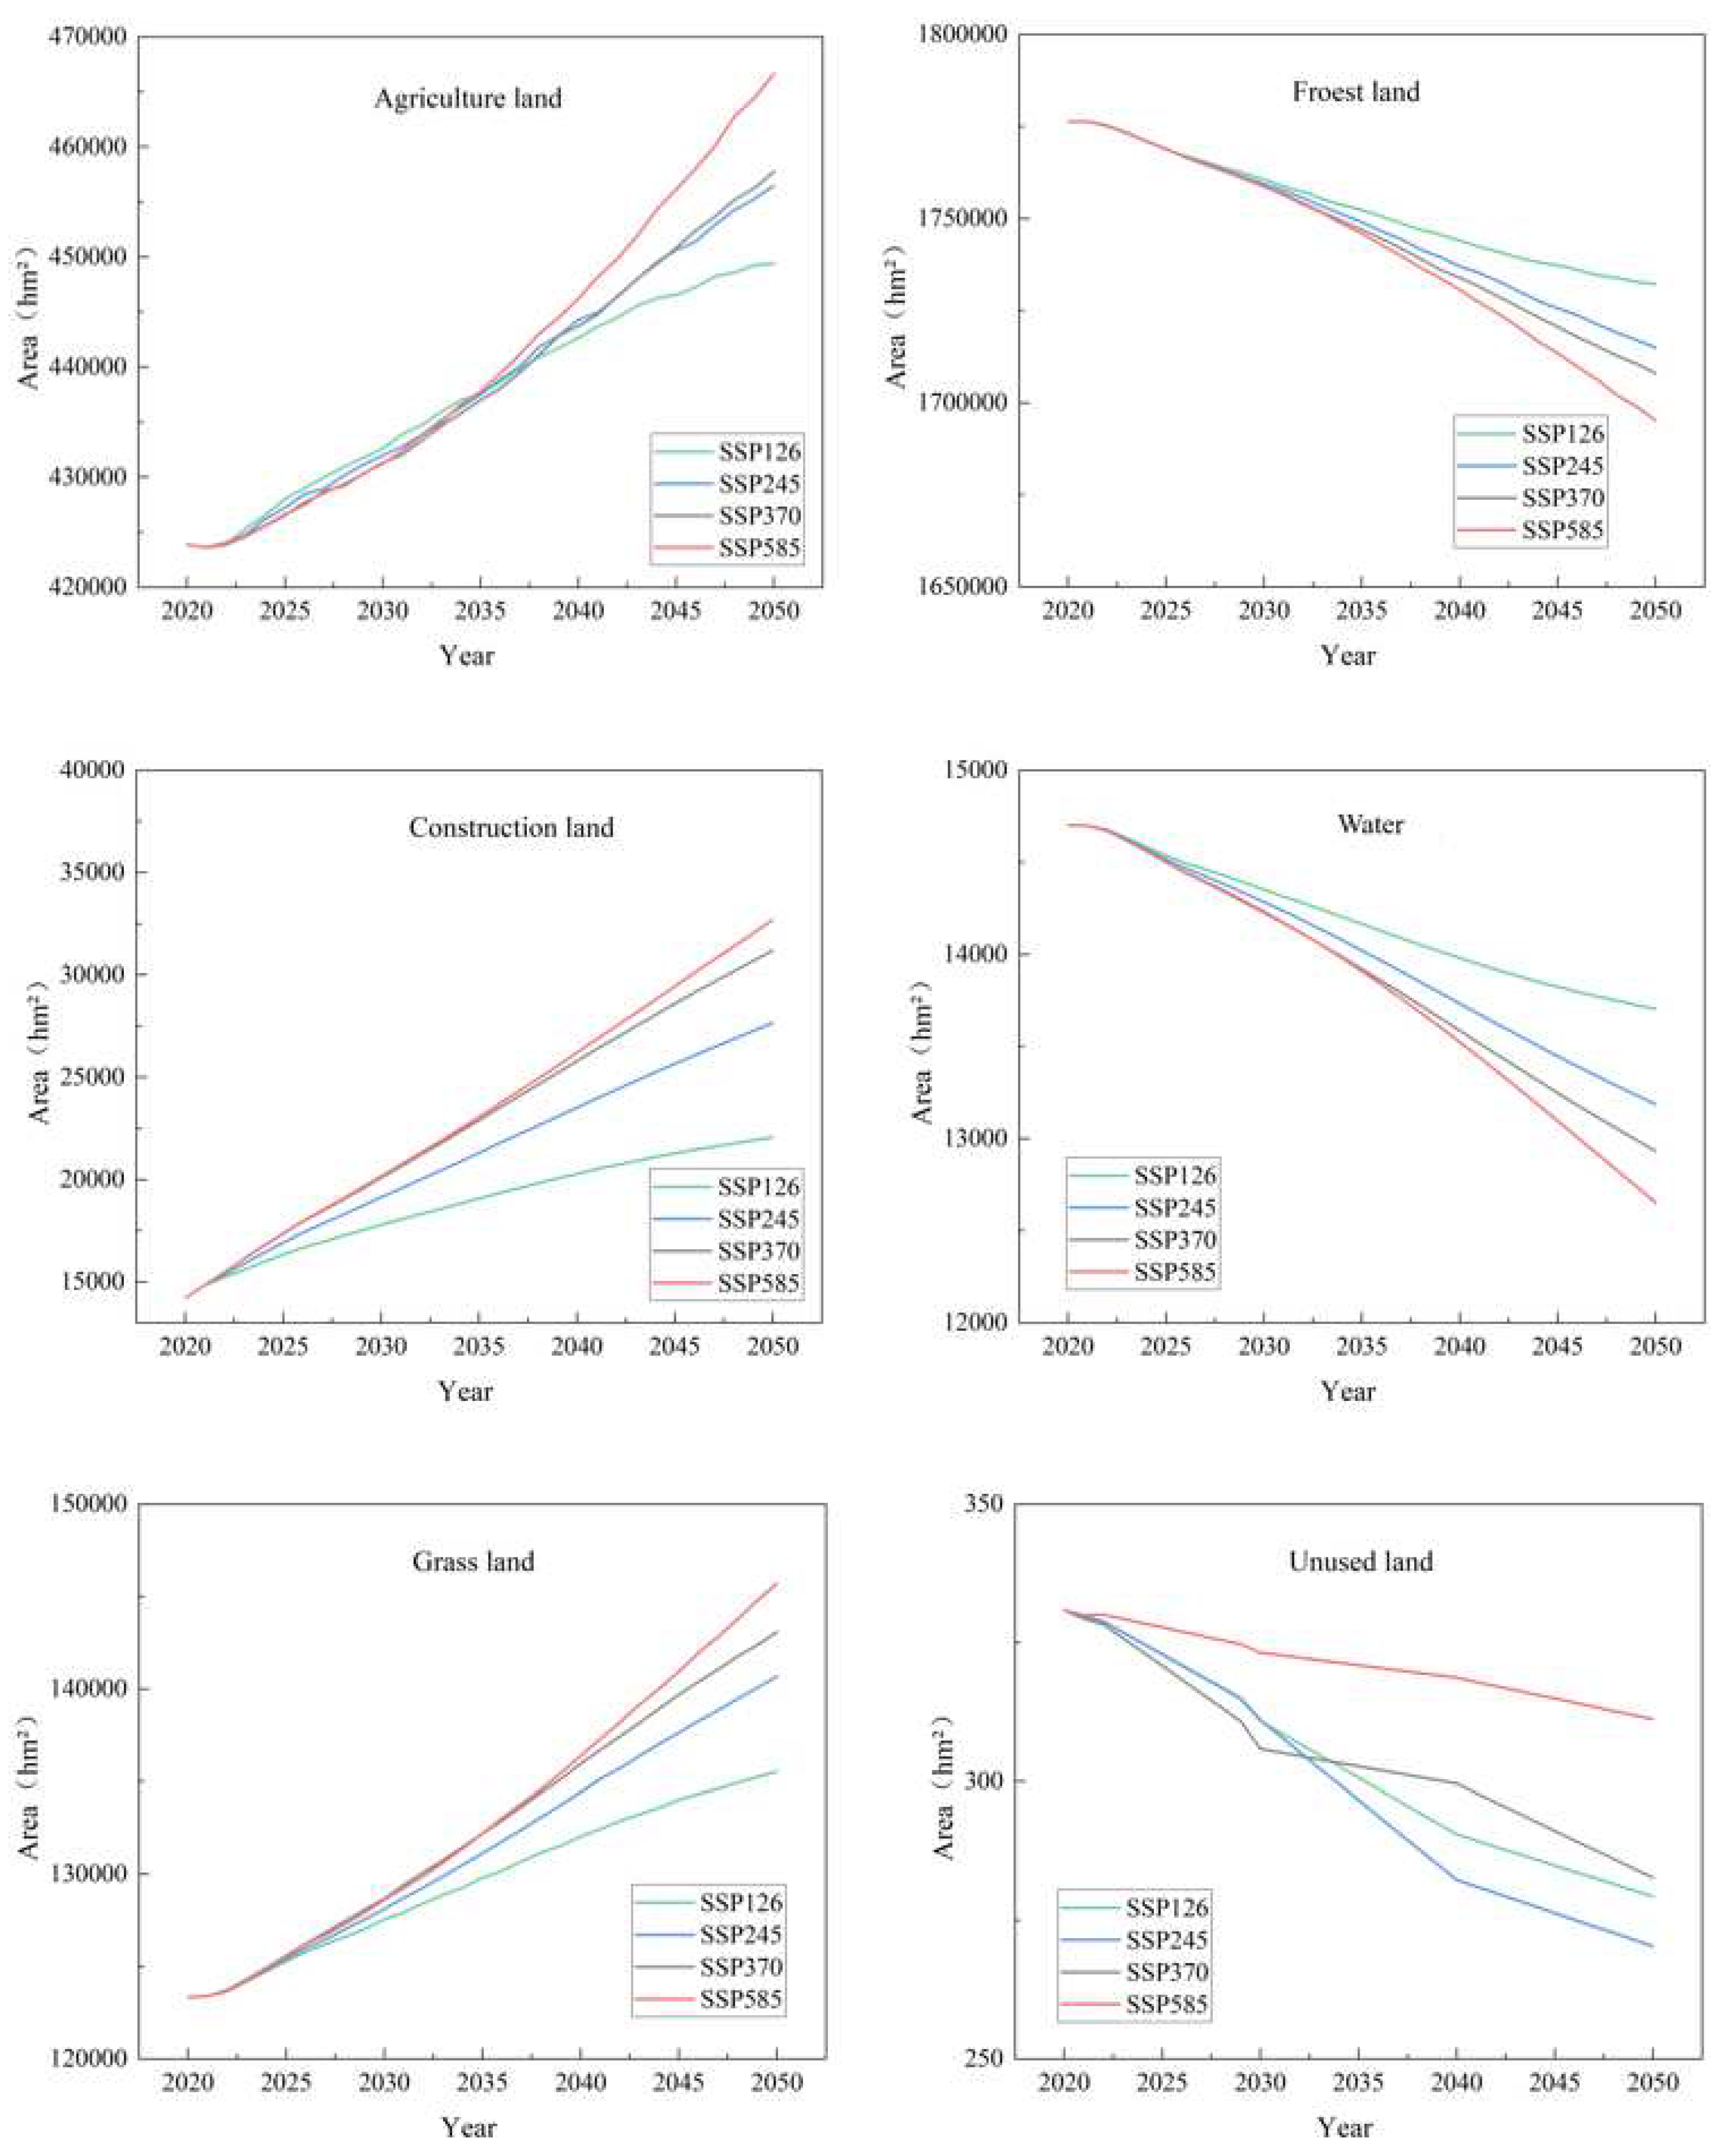
Land use demand obtained from SD model simulation.
Figure 6.
Land use demand obtained from SD model simulation.
Figure 7.
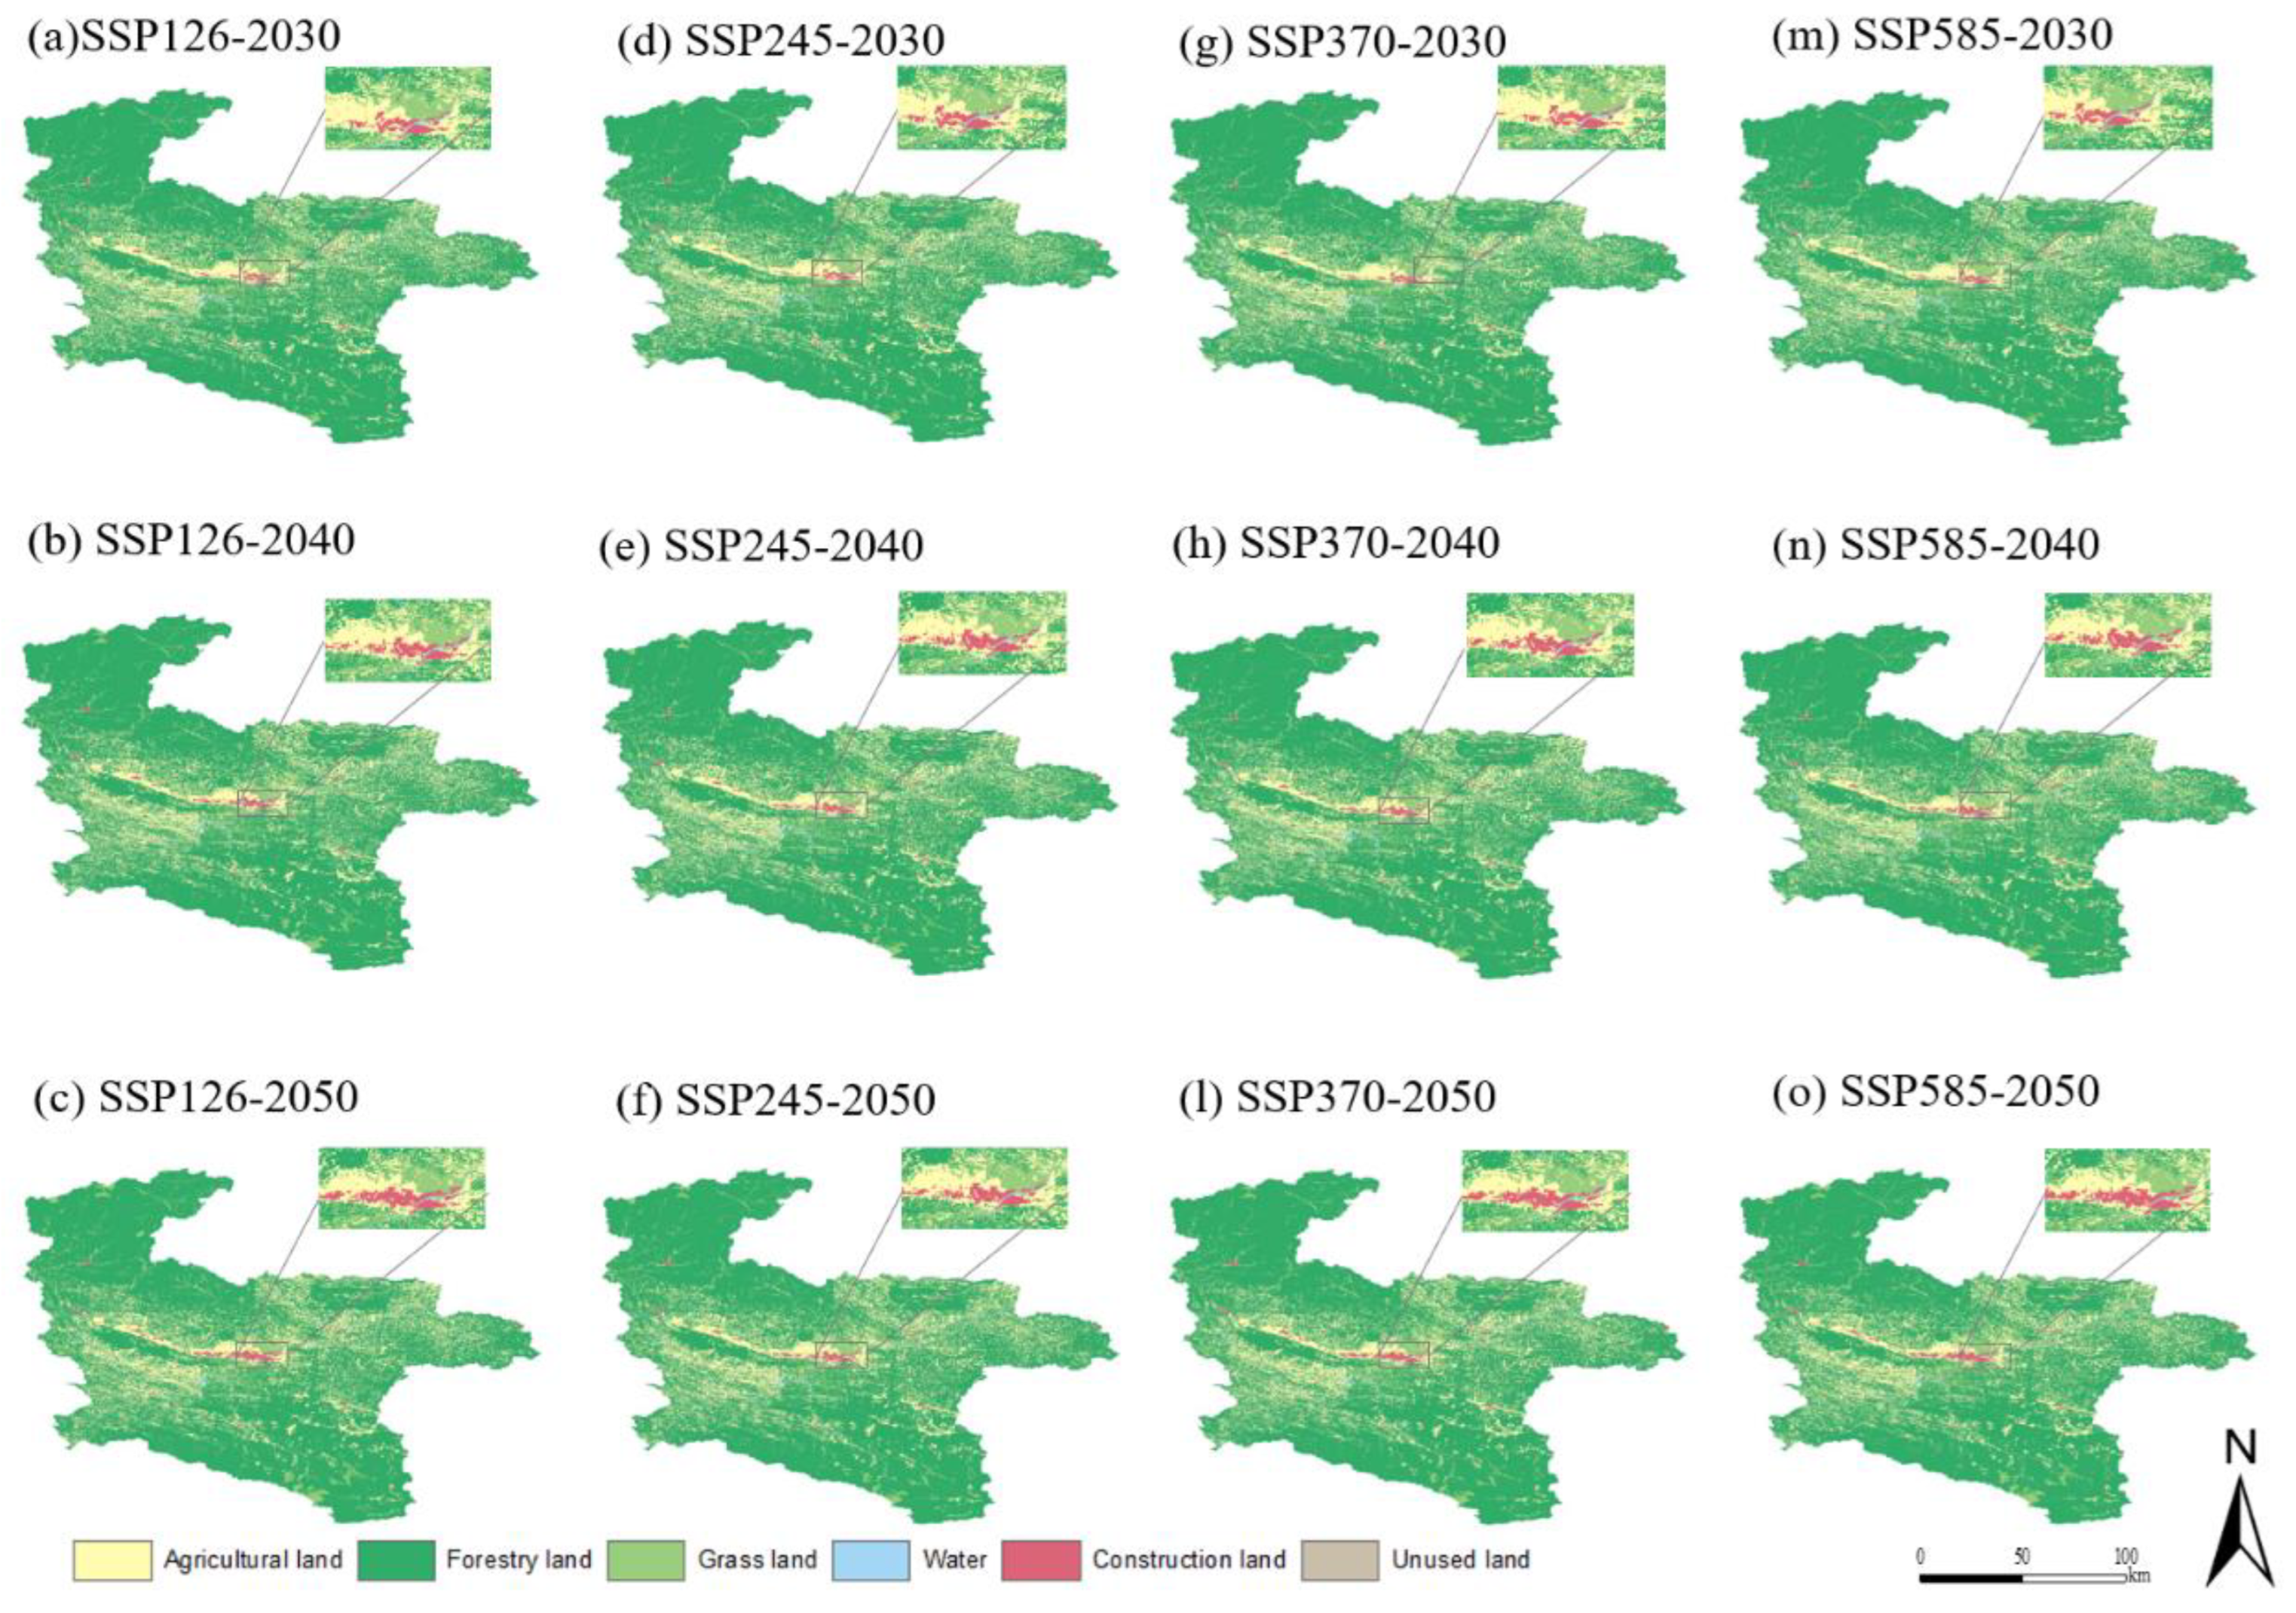
Land use in 2030, 2040 and 2050 from PLUS model simulations.
Figure 7.
Land use in 2030, 2040 and 2050 from PLUS model simulations.
Figure 8.
Land use conflict for 2000, 2010 and 2020.
Figure 8.
Land use conflict for 2000, 2010 and 2020.
Figure 9.
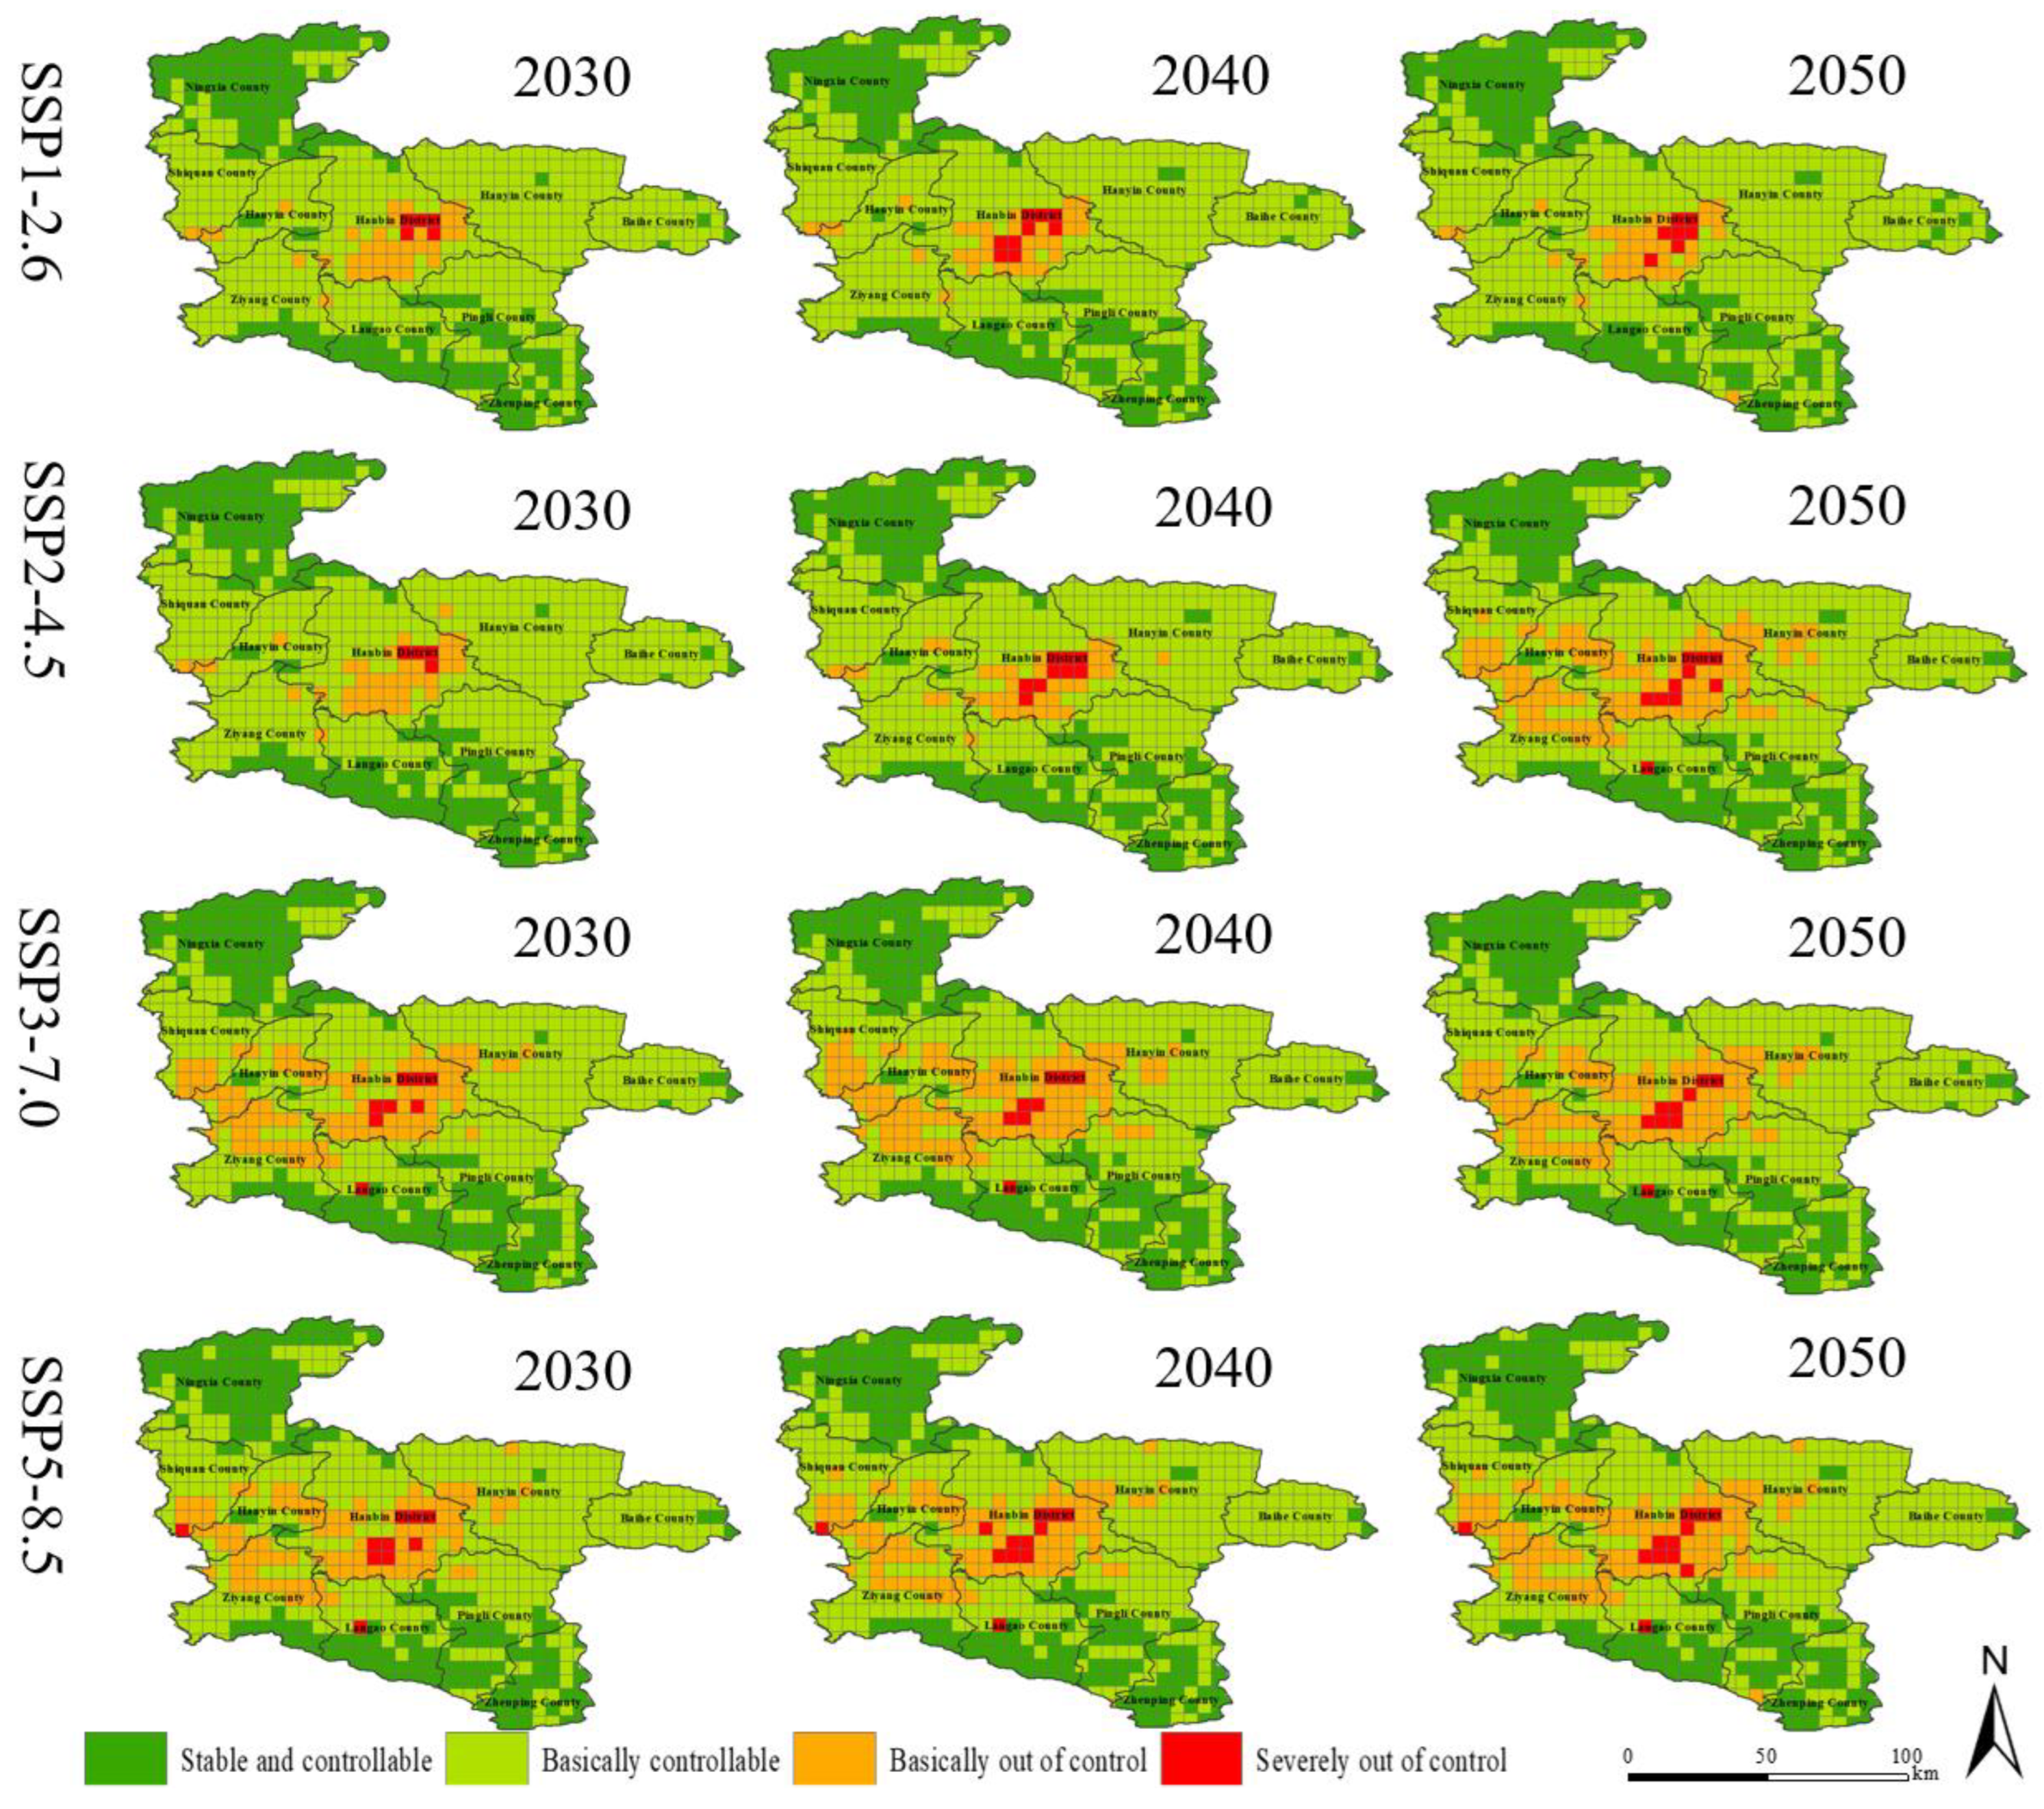
Future land use conflict maps for 2030, 2040 and 2050.
Figure 9.
Future land use conflict maps for 2030, 2040 and 2050.
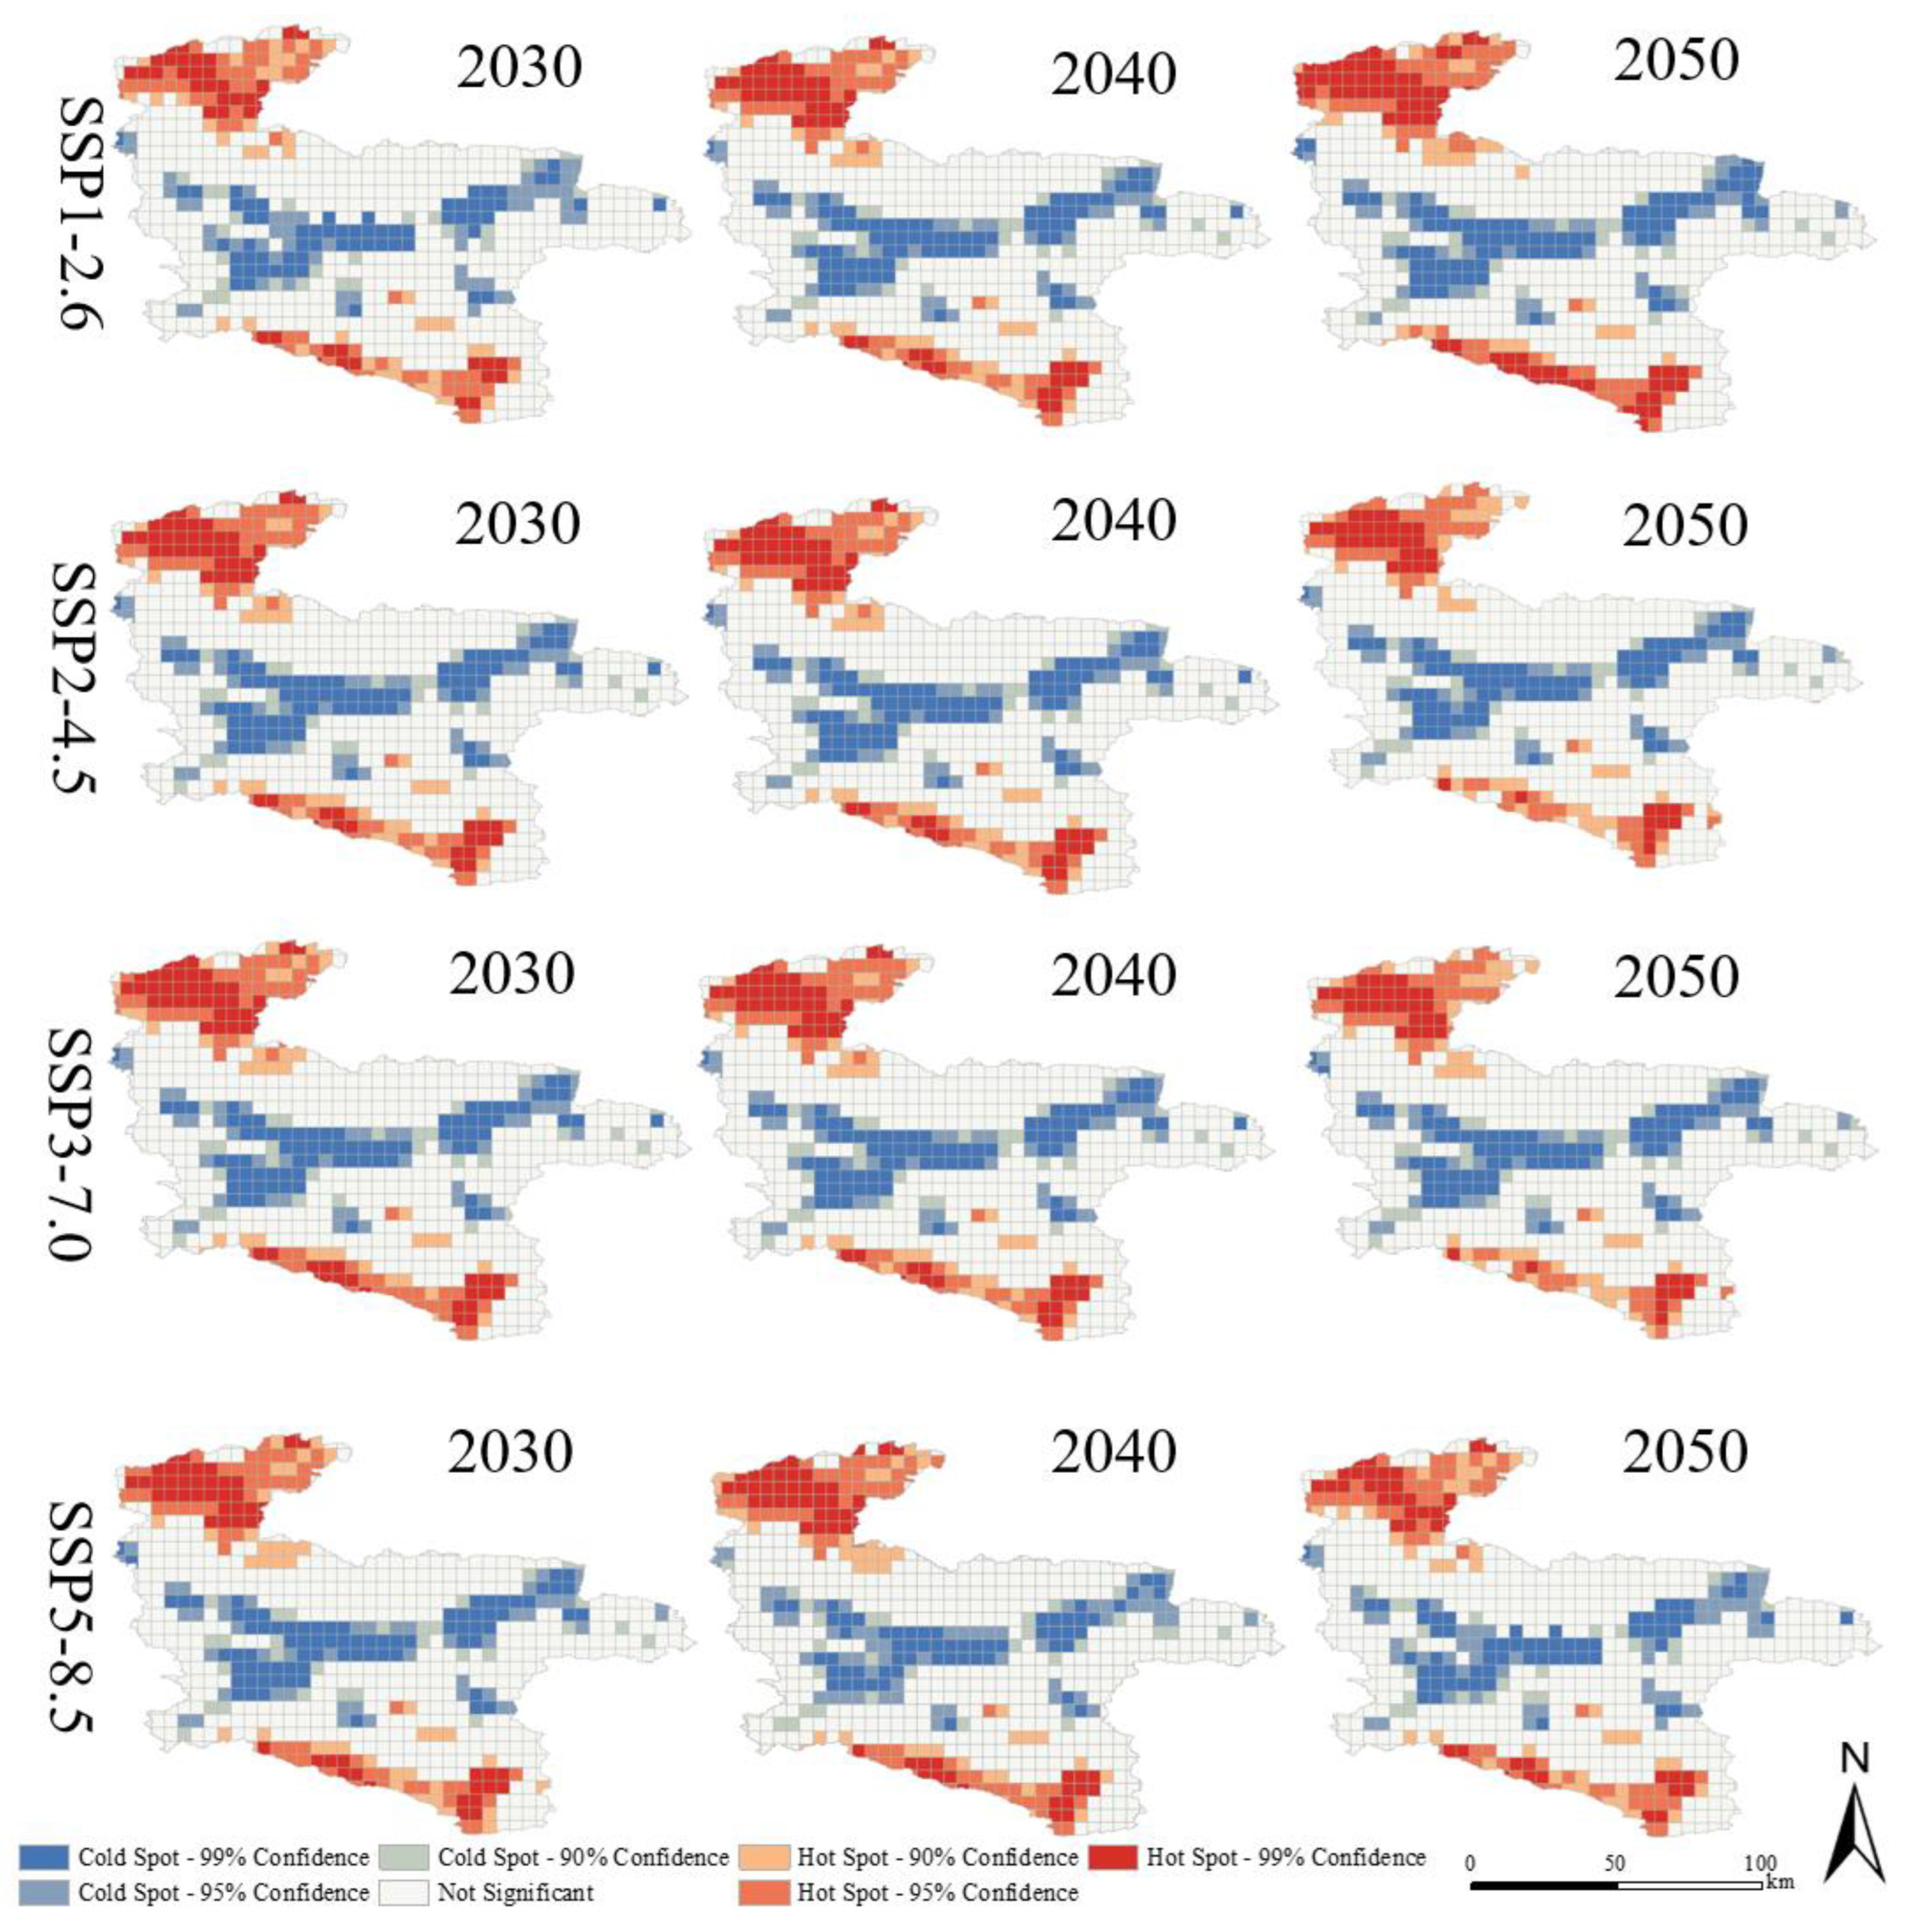
Figure 10.
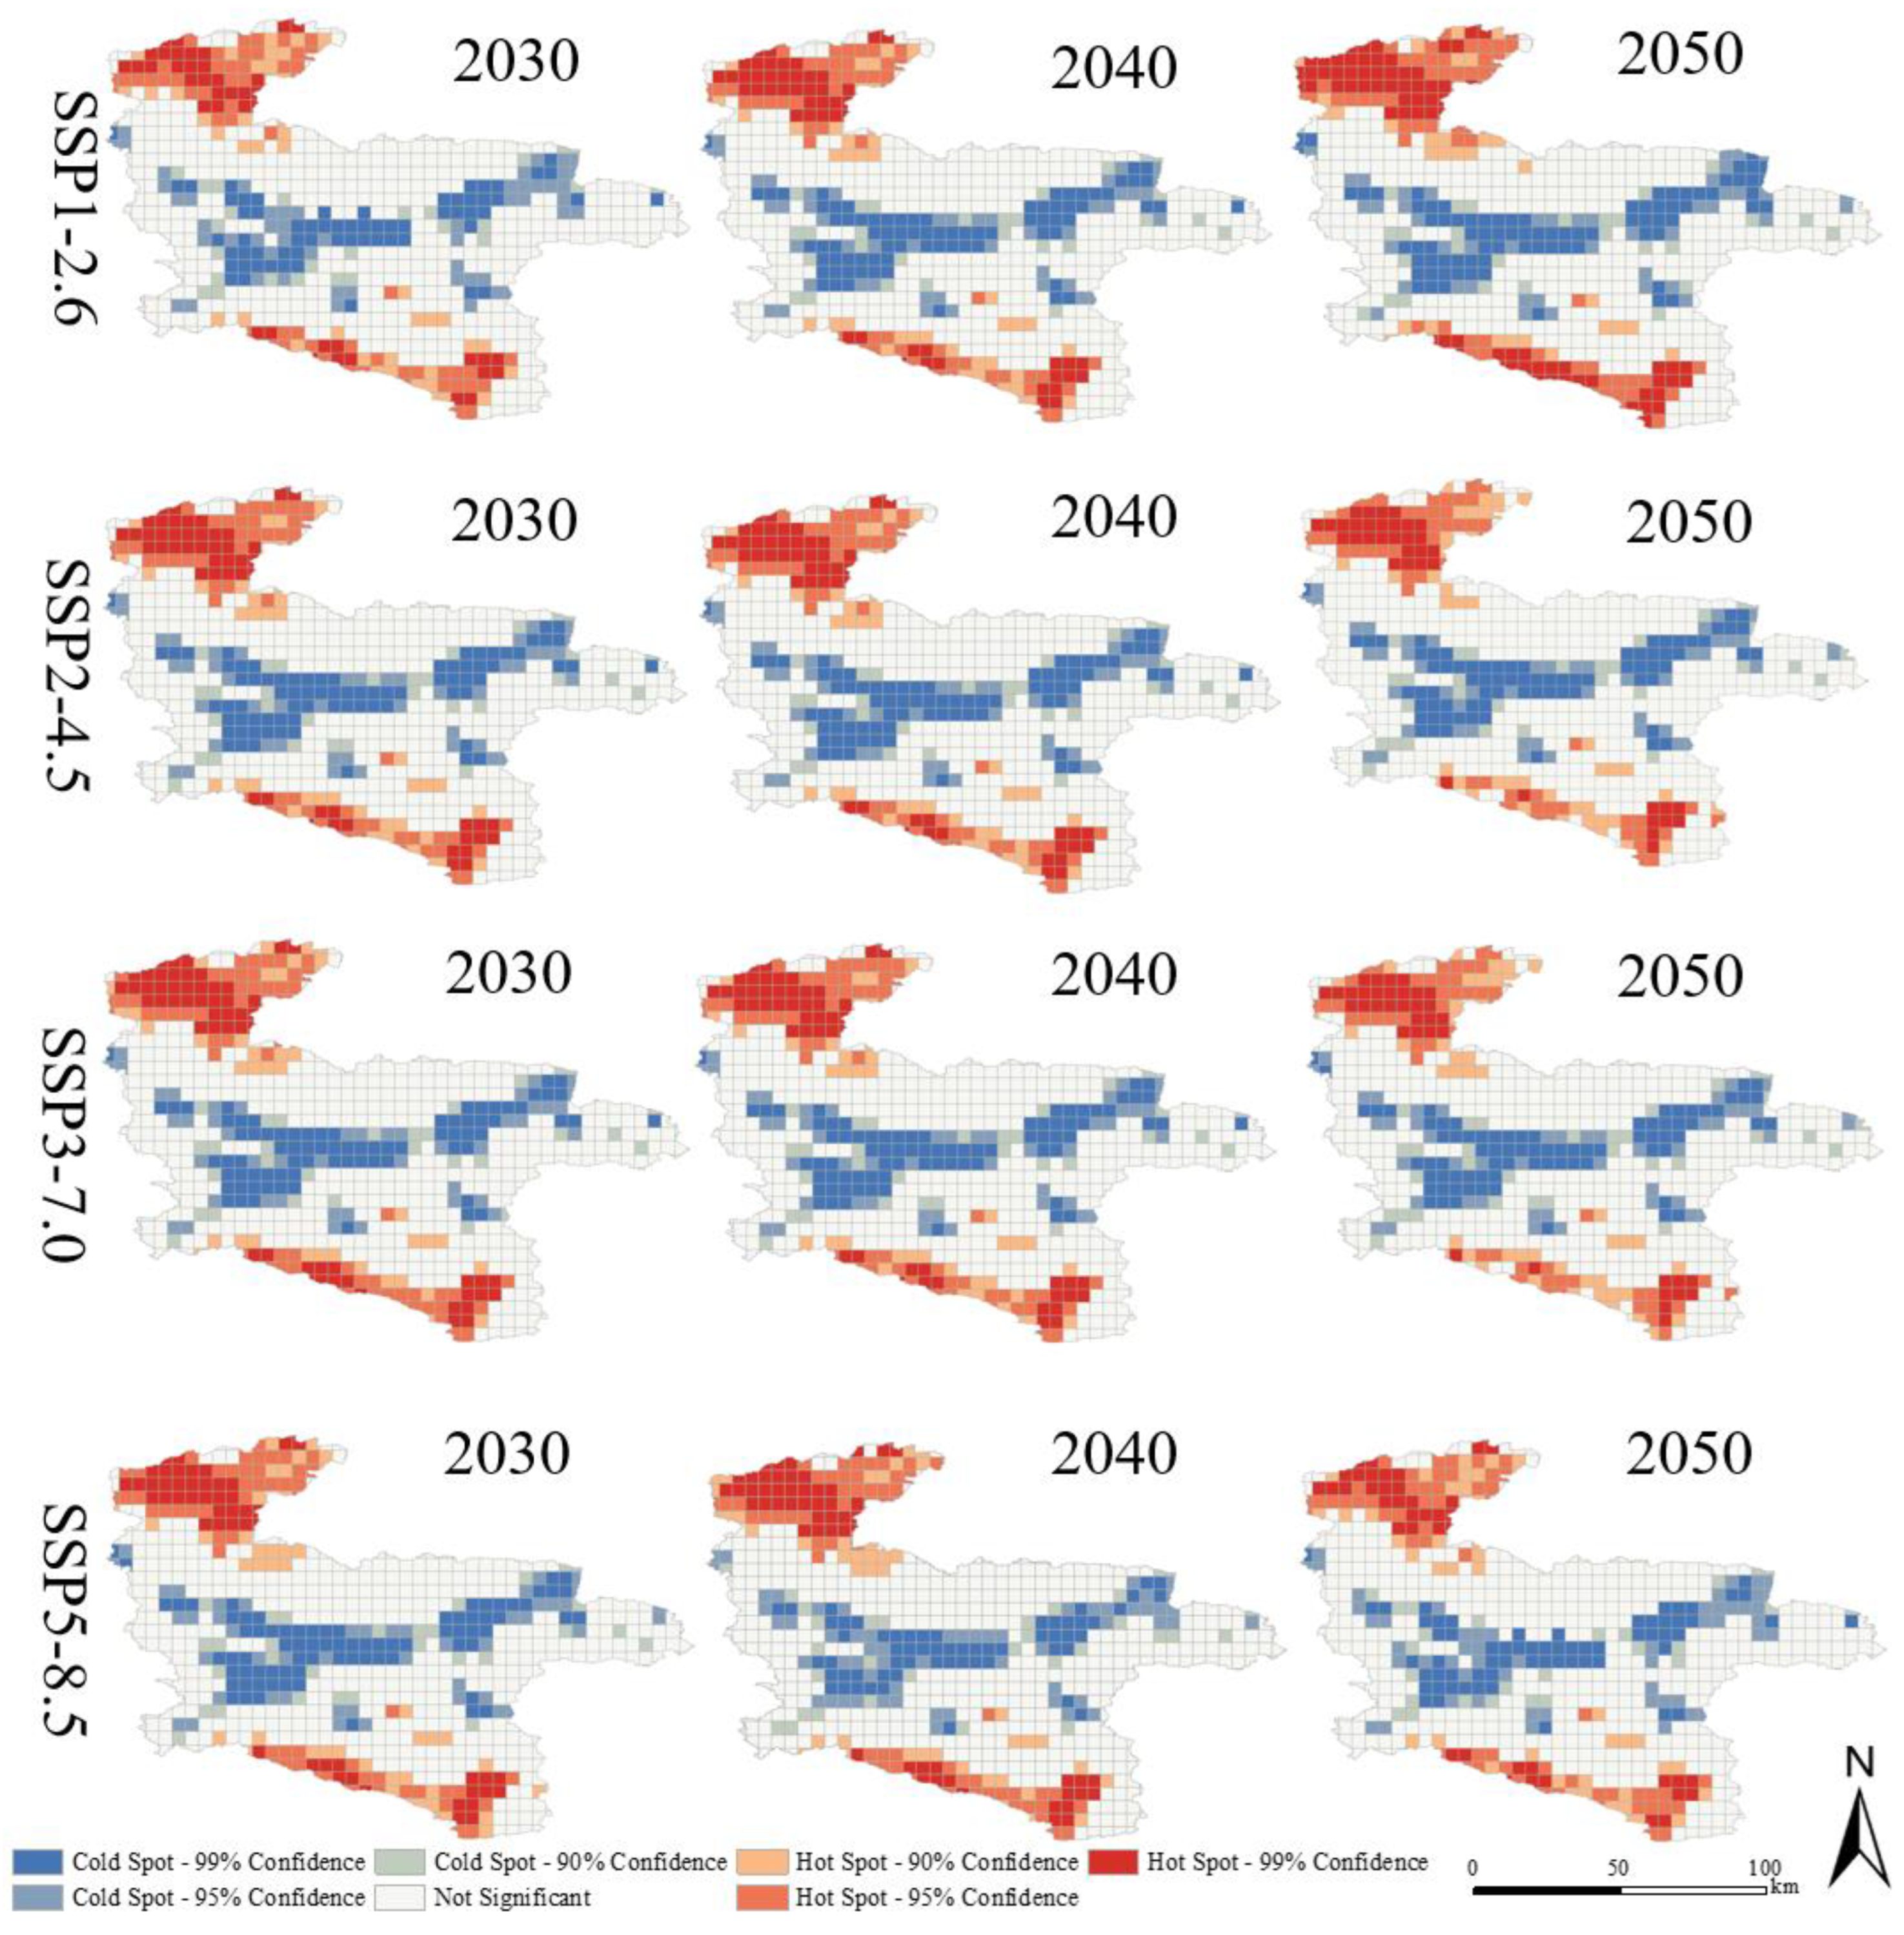
Spatial clustering hotspot analysis under scenarios simulation.
Figure 10.
Spatial clustering hotspot analysis under scenarios simulation.
Figure 11.
Habitat quality classes in Ankang under various scenarios.
Figure 11.
Habitat quality classes in Ankang under various scenarios.
Figure 12.
Spatial clustering diagram under scenarios simulation.
Figure 12.
Spatial clustering diagram under scenarios simulation.
Figure 13.
Bivariate Moran's l scatter plot for land use conflict and habitat quality.
Figure 13.
Bivariate Moran's l scatter plot for land use conflict and habitat quality.
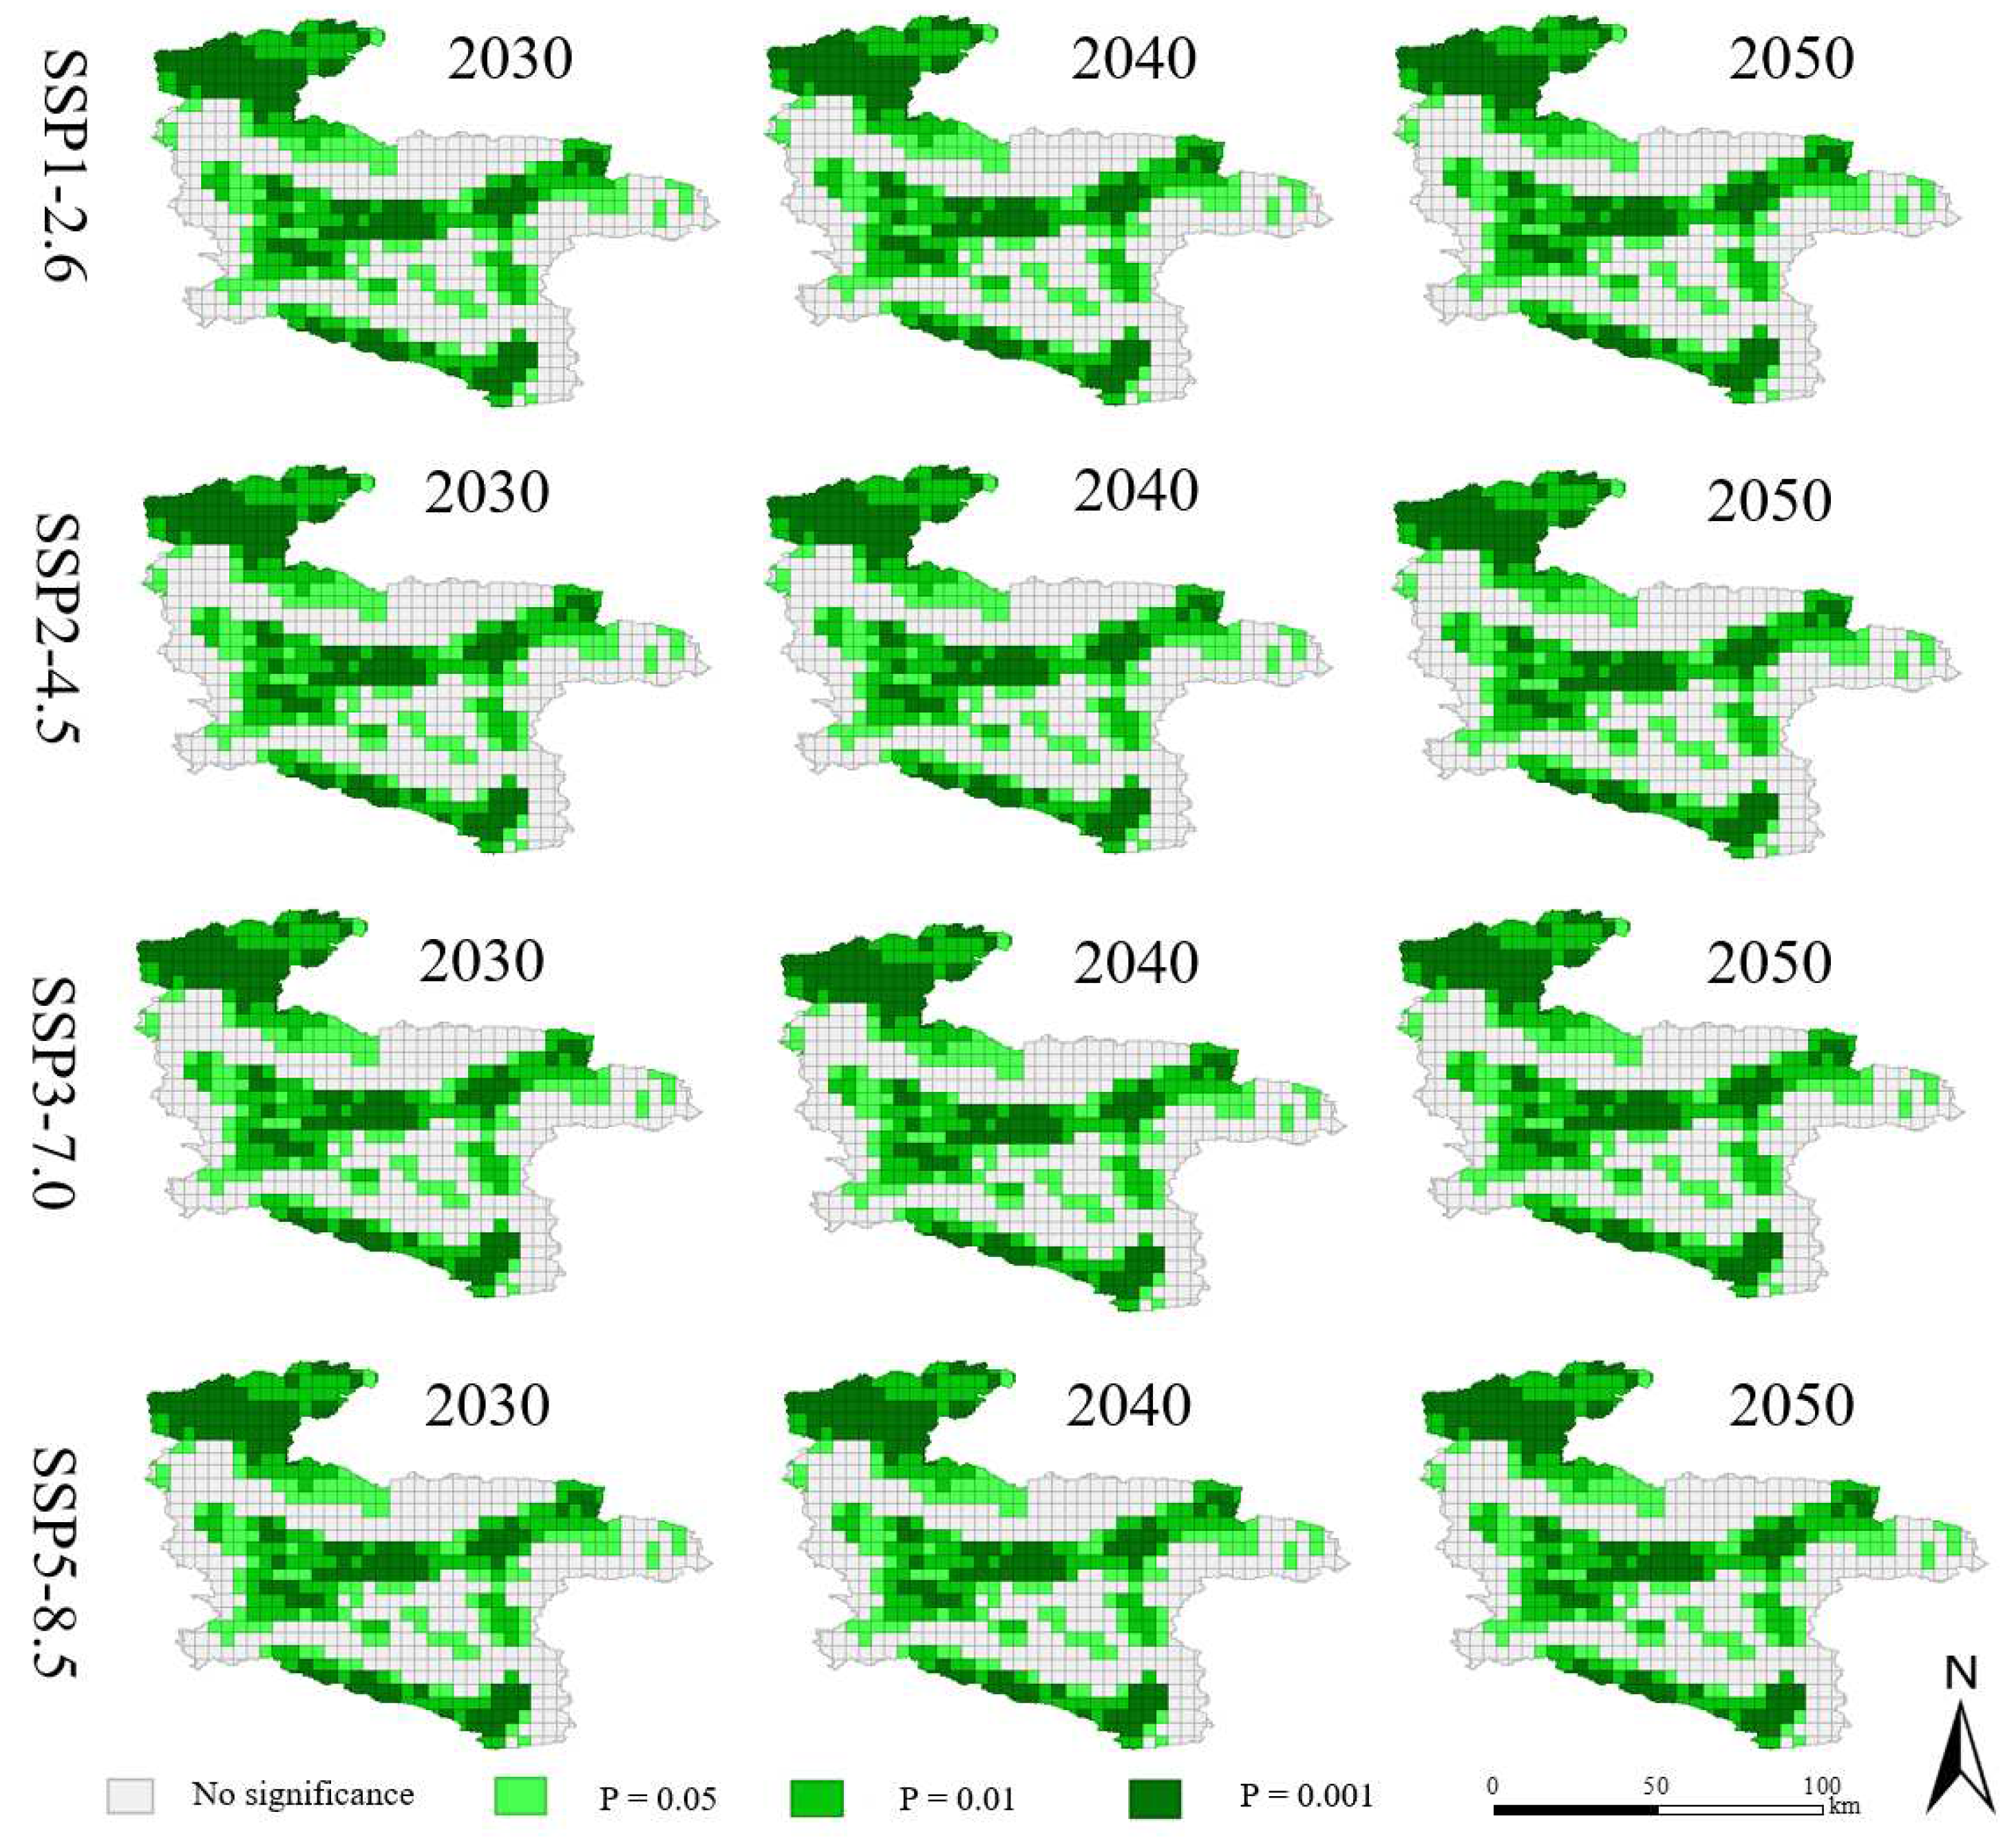
Figure 14.
Bivariate LISA Significance Map for Land Use Conflict and Habitat Quality.
Figure 14.
Bivariate LISA Significance Map for Land Use Conflict and Habitat Quality.
Figure 15.
Bivariate LISA clustering map for land use conflict and habitat quality.
Figure 15.
Bivariate LISA clustering map for land use conflict and habitat quality.
Table 1.
Research data and sources
Table 1.
Research data and sources
| Data type |
Data name |
Resolution |
Source |
| Land use data |
Land use data |
30m |
National Geographic Information Resources Catalogue Service System https://www.webmap.cn/
|
| Socio-economic data |
Statistical data |
—— |
Shaanxi Statistical Yearbook, Ankang Statistical Yearbook, Ankang Annual Statistical Bulletin |
| GDP |
1 km |
Resource and Environment Science and Data Centre
https://www.resdc.cn/
|
| Population density |
1 km |
| Night lights |
500m |
Earth Observation Group (EOG)
https://eogdata.mines.edu
|
| Roads, Railways |
—— |
National Geographic Information Resources Catalogue Service https://www.webmap.cn/
|
| Natural factors data |
Soil dryness |
1 km |
Chinese Academy of Sciences Resource and Environmental Science and Data Centre https://www.resdc.cn/
|
| Soil type |
1 km |
| Soil erosion type |
1 km |
| Soil erosion intensity |
1 km |
| NDVI |
1 km |
| NPP |
1 km |
| Agricultural production potential |
1 km |
| River Water Resources |
—— |
National Geographic Information Resources Catalogue Service https://www.webmap.cn
|
| DEM |
30m |
National Geographic Information Resources Catalogue Service https://www.webmap.cn
|
| Meteorological data |
—— |
National Geophysical Data Center https://www.ncdc.noaa.gov/
|
Table 2.
Study area setting scenario parameters and sources
Table 2.
Study area setting scenario parameters and sources
| Scenarios |
Forcing category |
Parameter Data |
source |
| SSP126 [45] |
Low forcing scenario |
GDP |
GDP forecast data [49] |
| SSP245 [46] |
Medium forcing scenario |
Population |
China’s future population km-scale grid data [50] |
| SSP370 [47] |
Medium to high forcing scenario |
Temperature |
World Climate Research Program [22] (WCRP)https://esgf-node.llnl.gov/cmip6 |
| SSP585 [48] |
High forcing scenario |
Rainfall |
Table 3.
Parameter settings for different climate scenarios from 2020 to 2050
Table 3.
Parameter settings for different climate scenarios from 2020 to 2050
| Scenarios |
2030 |
2040 |
2050 |
| GGR |
PGR |
TCR |
PCR |
GGR |
PGR |
TCR |
PCR |
GGR |
PGR |
TCR |
PCR |
| SSP126 |
5.08% |
0.01% |
3.13% |
12.25% |
3.05% |
0.14% |
4.92% |
19.84% |
1.70% |
0.36% |
2.70% |
25.20% |
| SSP245 |
4.78% |
-0.10% |
3.08% |
26.30% |
2.79% |
0.02% |
3.70% |
17.16% |
1.58% |
0.19% |
4.39% |
25.84% |
| SSP370 |
4.09% |
-0.20% |
5.20% |
18.57% |
2.00% |
-0.09% |
4.49% |
19.40% |
0.80% |
-0.02% |
5.78% |
17.06% |
| SSP585 |
5.37% |
0.01% |
7.78% |
14.77% |
3.58% |
0.14% |
4.93% |
18.43% |
2.32% |
0.36% |
5.97% |
26.42% |
Table 4.
Land use conflict measurement model construction.
Table 4.
Land use conflict measurement model construction.
| Land use conflict measurement model |
Equation |
Number |
| Land use conflict Comprehensive Index [53] |
LUCI= LUAWMPFD+ LUFI −LUSI
|
(1) |
| Land use complexity index (LUAWMPFD) [54] |
|
(2) |
| Land use vulnerability index (LUFI) |
|
(3) |
| Land Use Stability Inde (LUSI) |
LUSI = 1 – PD |
(4) |
Table 7.
Comparison between Projected results and Actual data in 2020(ha)
Table 7.
Comparison between Projected results and Actual data in 2020(ha)
| Land use type |
Actual value in 2020 |
Projected value in 2020 |
Simulation error(%) |
| Agricultural land |
423669.7 |
423601.3 |
-0.02% |
| Forest land |
1778084.1 |
1776178.2 |
-0.11% |
| Grassland |
123596.8 |
123553.3 |
-0.04% |
| Water |
14707.7 |
14682.4 |
-0.17% |
| Construction land |
14829.1 |
14828.1 |
-0.01% |
| Unused land |
330.8 |
337.6 |
2.04% |
Table 8.
PLUS model simulation land use results (ha).
Table 8.
PLUS model simulation land use results (ha).
| Land use type |
SSP126 |
SSP245 |
SSP370 |
SSP585 |
| 2030 |
2040 |
2050 |
2030 |
2040 |
2050 |
2030 |
2040 |
2050 |
2030 |
2040 |
2050 |
| Agricultural land |
420631 |
416496 |
411507 |
420599 |
416411 |
411331 |
420941 |
416774 |
411202 |
420562 |
416318 |
411169 |
| Forest land |
1772098 |
1769306 |
1769371 |
1770209 |
1762461 |
1755524 |
1768101 |
1755610 |
1747139 |
1771303 |
1757337 |
1743319 |
| Grassland |
127924 |
133320 |
137483 |
128550 |
136148 |
144063 |
129533 |
140031 |
151506 |
129106 |
138774 |
151369 |
| Water |
14313.7 |
13847.3 |
13500.7 |
14238.9 |
13555.4 |
12847.4 |
14136 |
13170.2 |
12100.6 |
14282.7 |
13285.3 |
12107.6 |
| Construction land |
18014.2 |
20015.9 |
21148.7 |
19872.4 |
24430.1 |
29243.5 |
20648 |
27858.6 |
31069.3 |
20419.6 |
27290.7 |
35049.2 |
| Unused land |
305.8 |
299.6 |
282.7 |
311.1 |
287.1 |
274.6 |
310.9 |
278.8 |
274.2 |
310.5 |
279.9 |
274.2 |
Table 9.
Habitat quality classes (%) and mean and standard deviation in Ankang.
Table 9.
Habitat quality classes (%) and mean and standard deviation in Ankang.
| Level |
SSP126-HQ |
SSP245-HQ |
SSP370-HQ |
SSP585-HQ |
| 2030 |
2040 |
2050 |
2030 |
2040 |
2050 |
2030 |
2040 |
2050 |
2030 |
2040 |
2050 |
| 0-0.2 |
2.62 |
2.58 |
2.53 |
2.56 |
2.69 |
2.64 |
2.54 |
2.85 |
3.02 |
4.54 |
4.80 |
4.88 |
| 0.2-0.4 |
13.40 |
13.35 |
13.60 |
13.21 |
13.12 |
13.59 |
13.57 |
13.78 |
13.89 |
11.02 |
11.31 |
12.15 |
| 0.4-0.6 |
16.70 |
16.83 |
16.57 |
16.74 |
16.78 |
16.72 |
16.85 |
16.81 |
16.77 |
23.17 |
24.18 |
32.76 |
| 0.6-0.8 |
48.14 |
47.79 |
47.86 |
48.05 |
48.12 |
47.71 |
47.81 |
47.50 |
47.38 |
44.05 |
43.32 |
34.78 |
| 0.8-1 |
19.13 |
19.45 |
19.43 |
19.45 |
19.30 |
19.33 |
19.22 |
19.06 |
18.94 |
17.21 |
16.37 |
15.42 |
| Mean |
0.6421 |
0.6428 |
0.6429 |
0.6436 |
0.6427 |
0.6415 |
0.6407 |
0.6401 |
0.6397 |
0.5615 |
0.5592 |
0.5360 |
| StdDev |
0.1974 |
0.1971 |
0.1969 |
0.1967 |
0.1974 |
0.1978 |
0.1979 |
0.1973 |
0.1991 |
0.1927 |
0.1943 |
0.1958 |
