0. Introduction
The diffusion of calcium ions from the pore solution to the surrounding water occurs when cementitious materials are subjected to water with calcium concentrations below the equilibrium concentration. Hydraulic structures and nuclear waste containment may have a high risk of calcium leaching due to a pore solution’s relatively high pH value in concrete. Thus, the long-term durability of concrete structures in aggressive water is of great concern [
1,
2].
Generally, the leaching kinetics of cementitious materials is influenced by the cement composition, mineral admixtures, water-to-cement ratio, interfacial transition zone, characteristics of pores, aggressive water, temperature, et al. Using mineral admixtures, such as fly ash (FA) and silica nanoparticles, is reported to reduce calcium leaching [
3,
4,
5,
6]. Catinaud et al. [
7] investigated the influence of limestone powder on the calcium leaching of cementitious materials. They found that calcite directly influences the mechanism of calcium leaching in cementitious materials. Under certain environmental conditions, calcium leaching of hydration products is mainly related to cementitious materials’ interfacial transition zone and pore structure [
8,
9]. Although calcium leaching, which consists of a progressive dissolution of hydration products due to the diffusion of calcium ions to the aggressive water, is a well-known phenomenon, the degradation mechanism of 3D printed cement pastes (3DPC) has not been investigated yet.
In 3DPC, mesostructure and pores’ characteristics are very different from that of cast ones. Owning to the spatial distribution characteristics of the weak interfaces between layers, the 3DPC shows a laminated mesostructured [
10,
11]. The weak interface makes it of low strength and easy to leach in aggressive water. Furthermore, the air is inevitably exposed to the interface during printing, which can easily cause small flaws and air voids in the 3DPC. Because of the relatively porous mesoscale structure of the 3DPC, the ions could easily diffuse in or out, which would exacerbate the deterioration of materials. In addition to porosity, pore size, morphology, orientation, and spatial distribution also significantly influence the performances of 3D printed concrete [
12,
13,
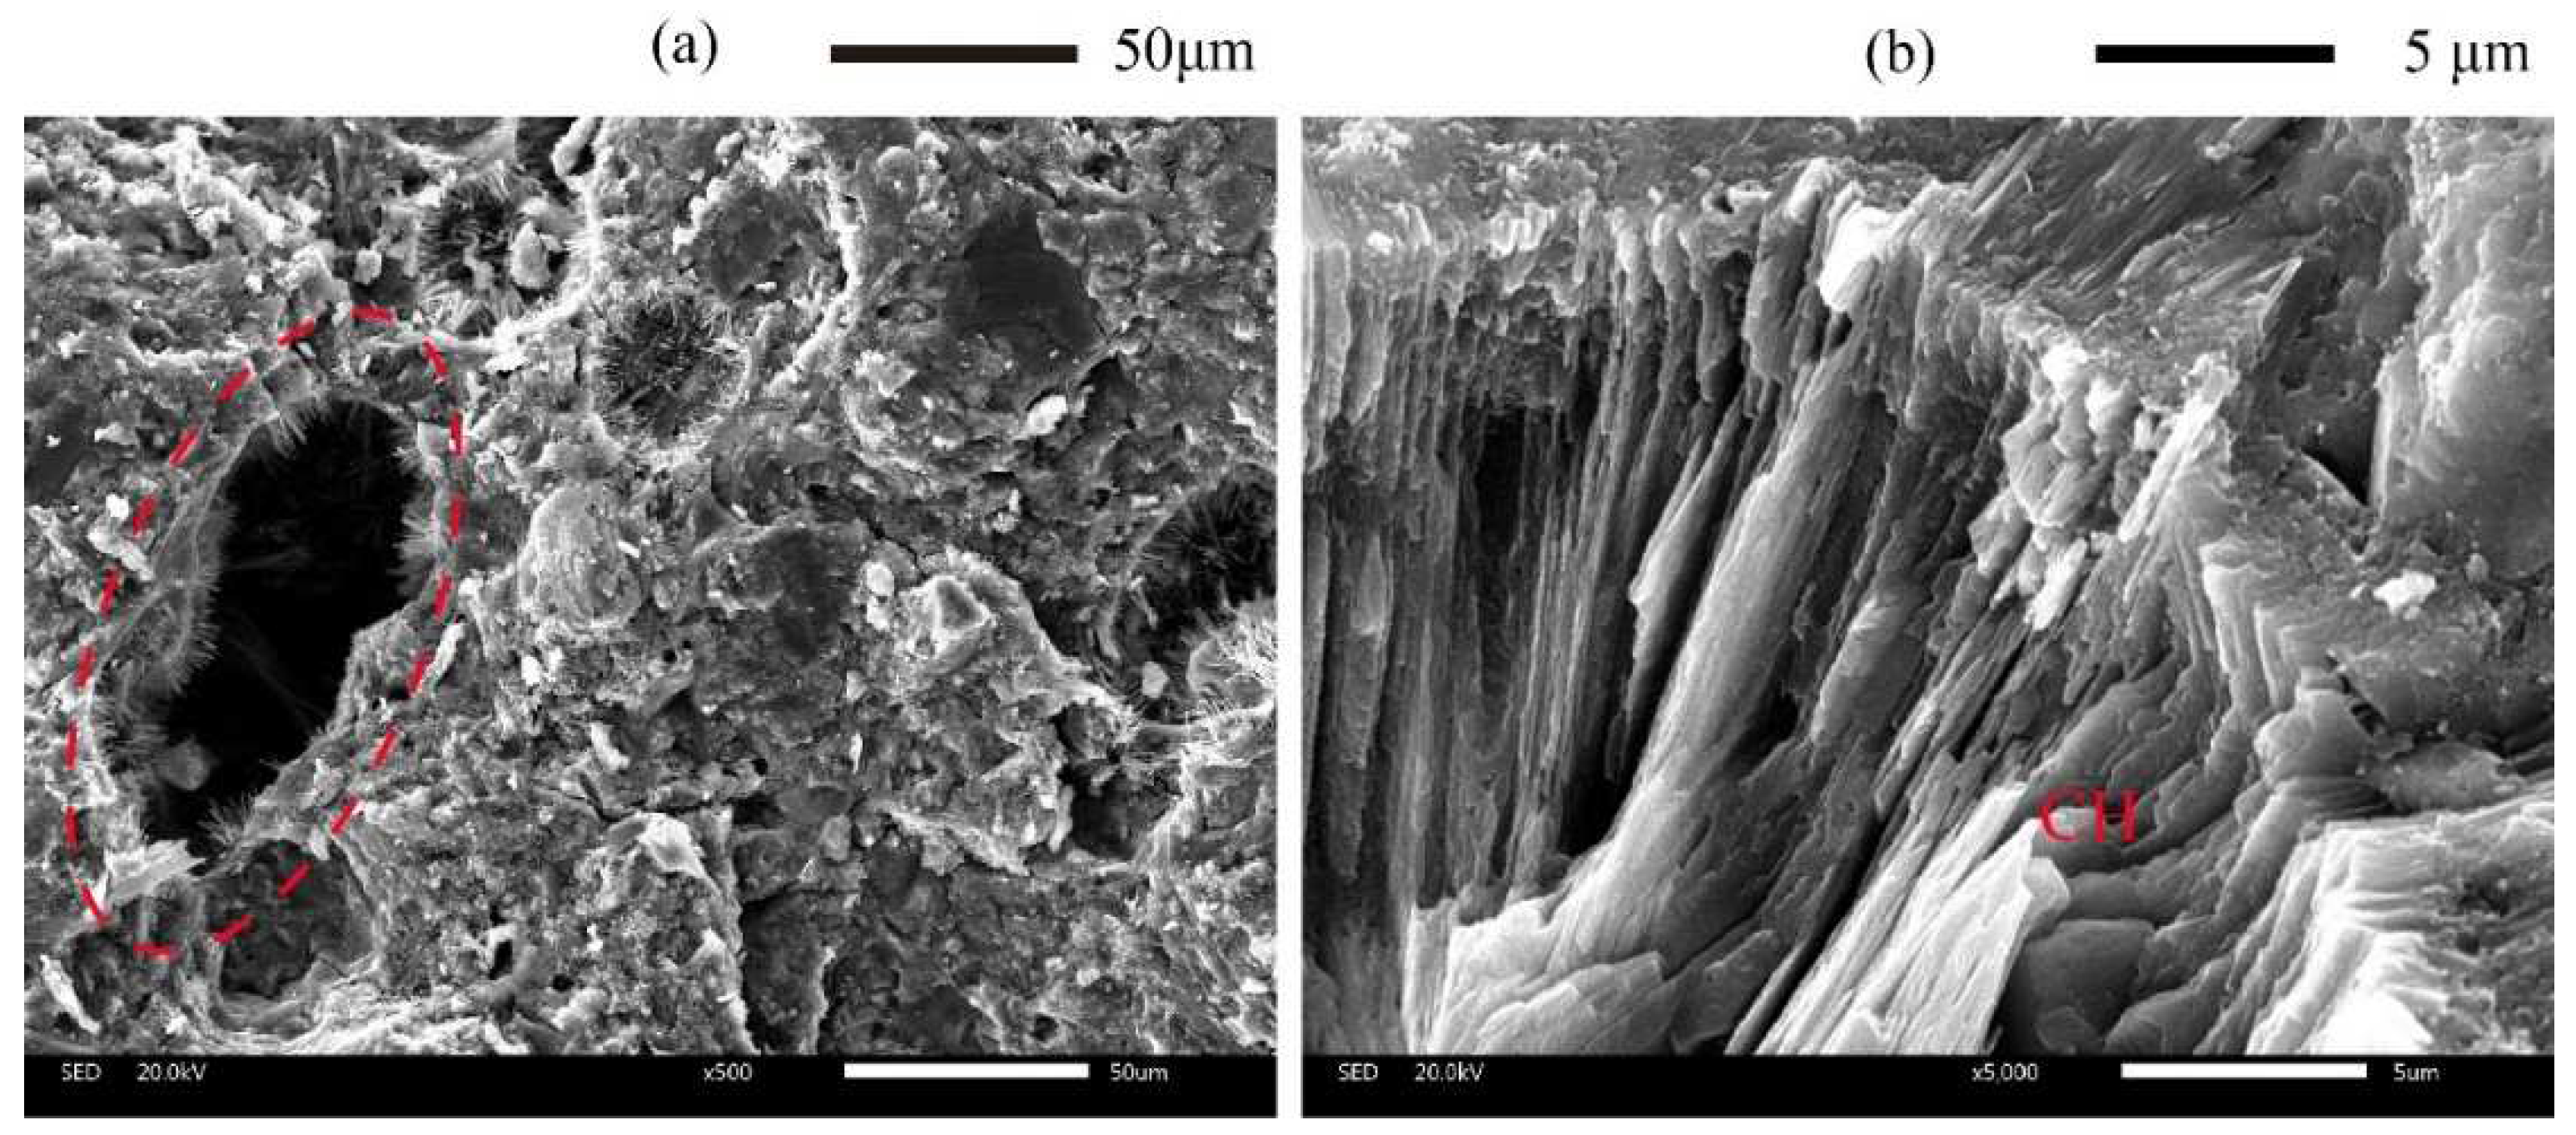
14]. These characteristics of pores, with a large size and long striped morphology, hence also have a high-volume fraction of portlandite (CH) and other hydration products in pores shown in
Figure 1a,b. The dissolution of hydration products in pores results in an increase in porosity and changes in pore characteristics. In addition, the dissolution fronts propagate through the pore defects sharply due to the locally quasi-instantaneous dissolution of CH in pores. Thus, these hydration products in pores play a fundamental role in the transport process of ions within the cement matrix.
Generally, the pore solution of cementitious materials is in thermodynamic equilibrium with the C-S-H resulting from the hydration of unhydrated clinker [
15]. Calcium ions diffuse from the pore solution to the aggressive water due to the concentration gradients between the pore solution and external water when cementitious materials expose to aggressive water. The diffusion modifies the chemical equilibrium of the hydration products. The depletion of CH and then decalcification of C-S-H results in the increased porosity and changes in the pore structure of cementitious materials, consequently resulting in a porosity gradient from the core to the surface altered layer [
16,
17,
18,
19]. The depletion of CH and then decalcification of C-S-H results in the increased porosity and changes in the pore structure of cementitious materials, consequently resulting in a porosity gradient from the core to the surface altered layer. Thus, the alteration of the hydration products and the pore characteristics is the intrinsic reason for the degradation of cementitious materials [
20]. Though the degradation of cementitious materials in aggressive water due to calcium leaching has been subjected to first studies [
21], little is known about the evolution of hydration products and pore defects of leached 3DPC in ammonium chloride solution.
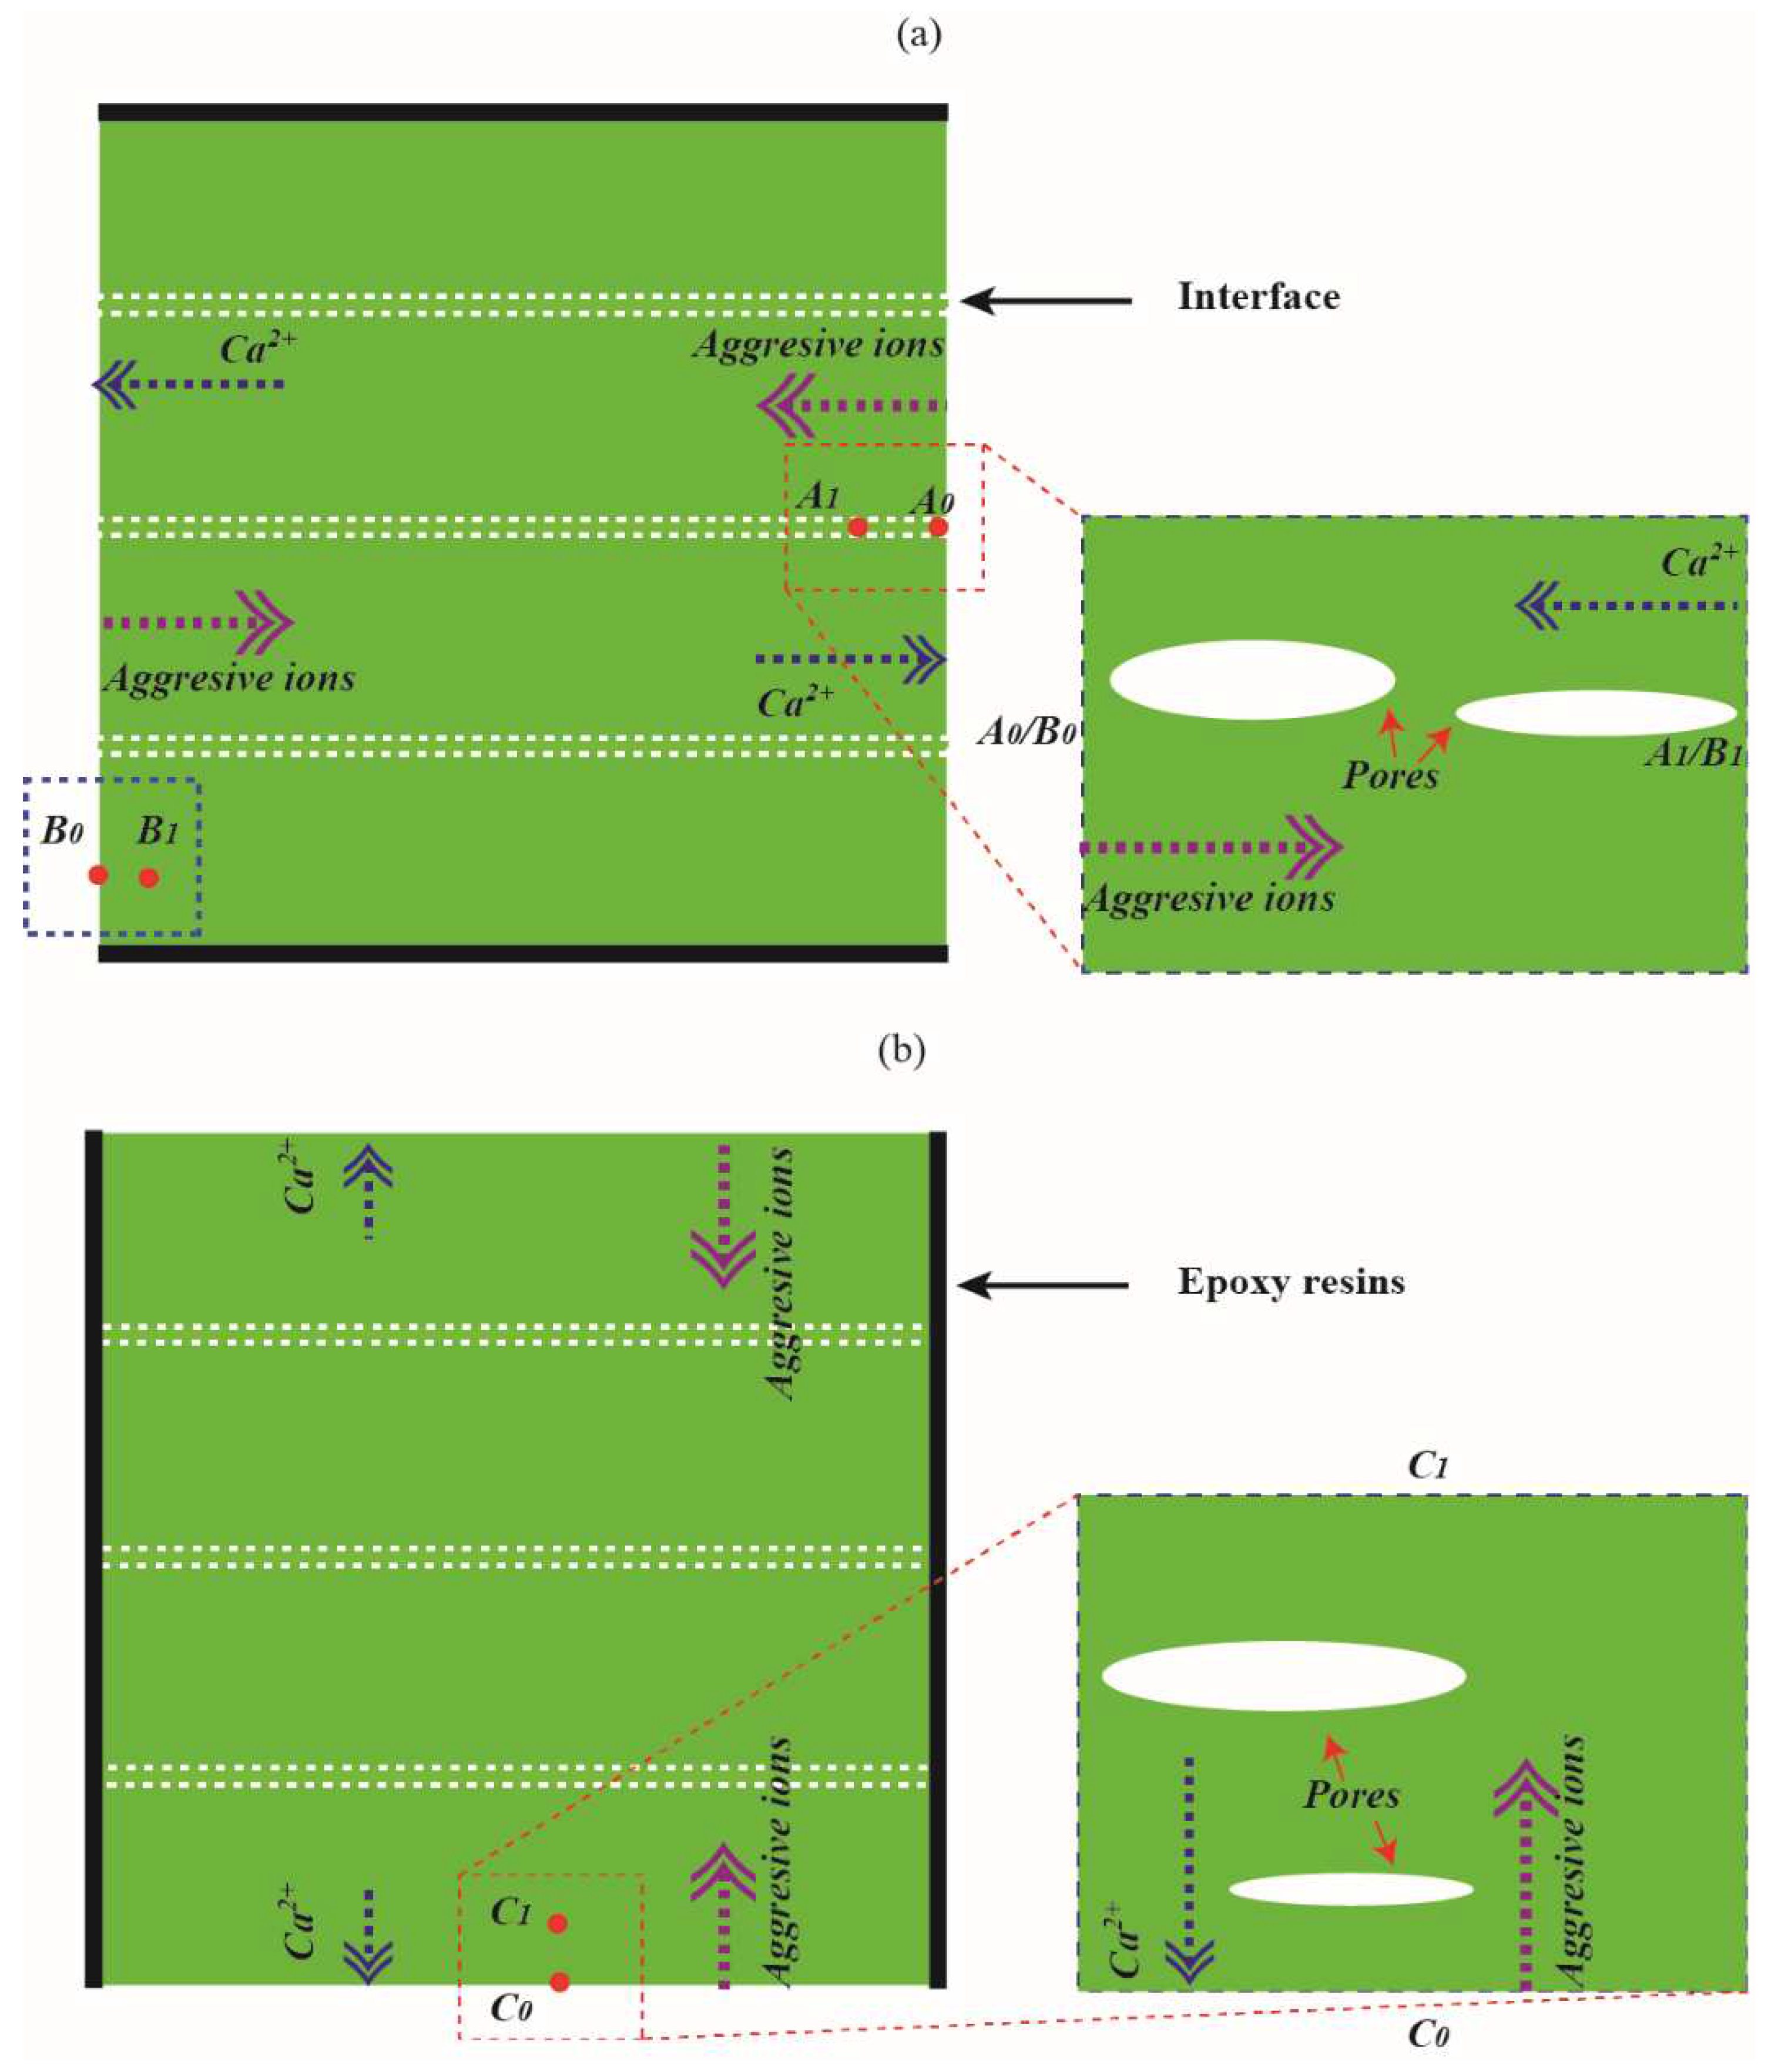
As aforementioned, the transport process of calcium ions in 3DPC will be modified by pore defects with relatively large sizes and long striped morphology. The calcium leaching process of 3DPC due to CH dissolution and C-S-H decalcification may differ from that of cast ones. As shown in
Figure 2a,b, a hypothesis described the degradation process of the 3DPC during leaching. The calcium leaching process in the X or Y direction significantly differs from that in the Z direction. It can be seen from the figure that calcium ions concentration gradients parallel to the X direction or Y direction are ascribed to the long-striped voids. In contrast, the calcium ions concentration gradients are perpendicular to the Z direction, for 3DPC leached in the X or Y direction, early dissolution of CH. Thus, additional porosity can occur even at a certain depth from the surface due to the long-striped voids. Regarding 3DPC leached in the Z direction, hydration products’ dissolution occurs mainly at the dissolution fronts. Therefore, calcium ions could easily diffuse out from the pore solution in the X or Y direction but relatively difficult in the Z direction. On the other hand, calcium ions leached in the X or Y direction are more likely to be partially compensated via weak interfaces than in the Z direction due to the continued hydration of unhydrated clinker inside the materials. These additional alkali ions are reported to significantly reduce the solubility of CH in pores [
22]. The increase in the concentration of calcium ions in the pore solution may be retarded by the decalcification of C-S-H in the surface layer of materials. This indicates that the surface layer of 3DPC leached in the Z direction may lose more hydration products than in the X or Y direction.
3DPC has a higher environmental impact than conventional cementitious materials due to its high cement content. To increase the materials’ sustainability, aggregate micro fines (AMF) and FA replaced Portland cement in 3DPC. The preparation of 3DPC by incorporating environmentally friendly AMF and FA can decrease the consumption of Portland cement, reducing the burden on the environment and decreasing the cost of raw materials. This work investigates the calcium leaching anisotropy of 3DPC with AMF and FA. We compare the performances, such as bulk density, water absorption, leaching depths, and compressive strength of 3DPC in different calcium leaching directions. The evolution of hydration products and pore defects of 3DPC in different calcium leaching directions are also analyzed.
2. Materials and Experimental Methods
2.1. Materials and Mix Designs
The 3DPC, as well as reference samples in this paper, was prepared using the following raw materials: P·I 42.5 Portland cement (PC), AMF, FA, nano silica (NS), superplasticizer (SP), hydroxypropyl methylcellulose (HPMC), and deionized water. The chemical composition analyzed by the X-ray fluorescence spectrometry of the PC, AMF, and FA is given in
Table 1.
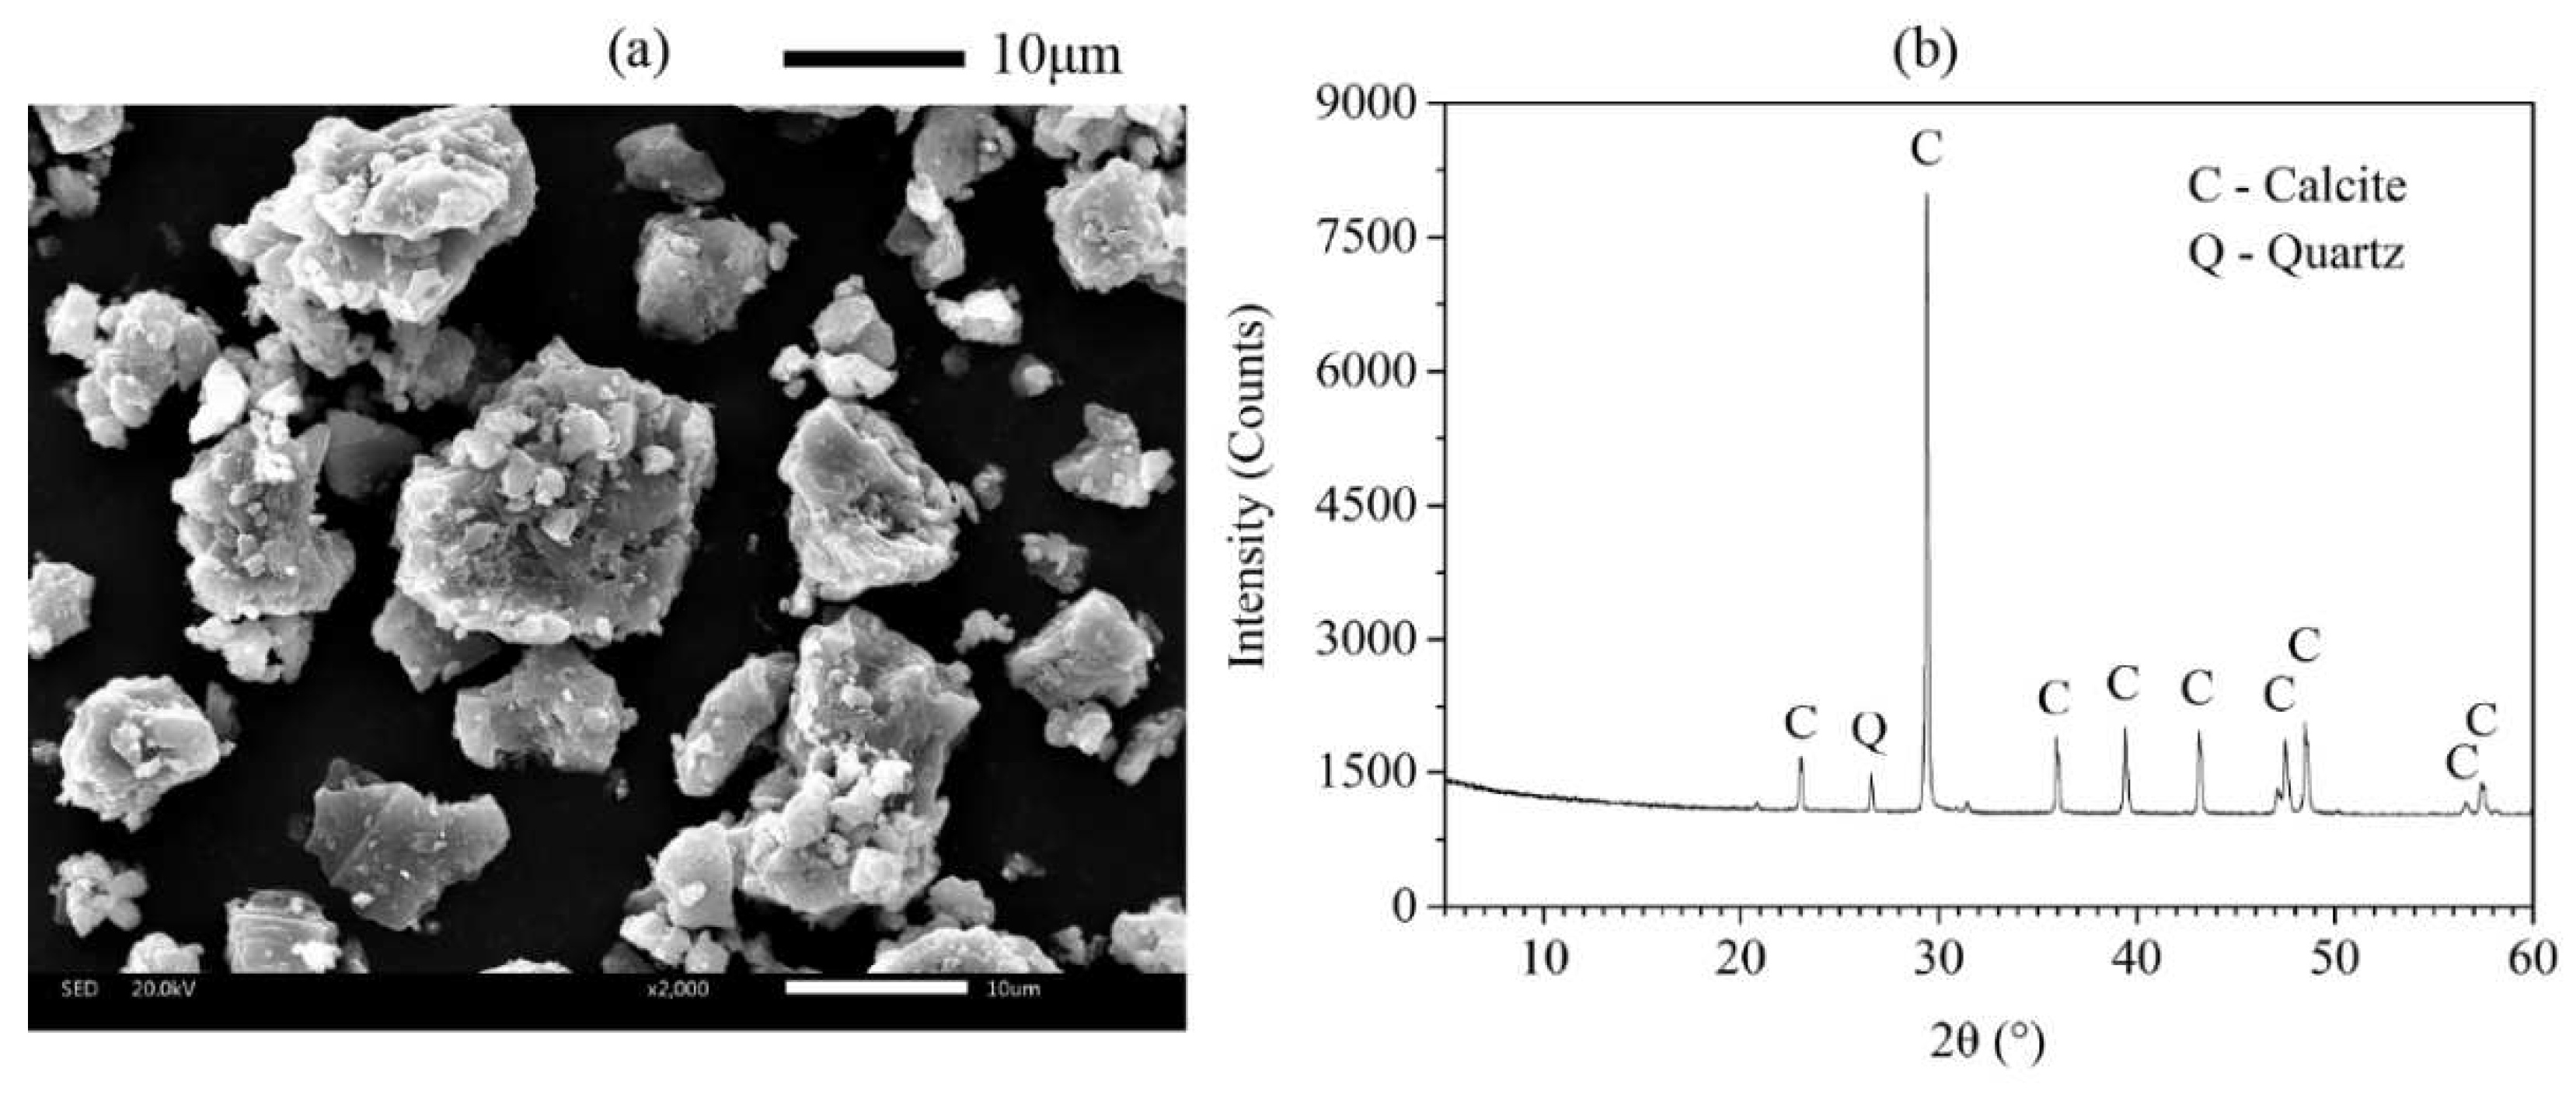
Figure 3 and
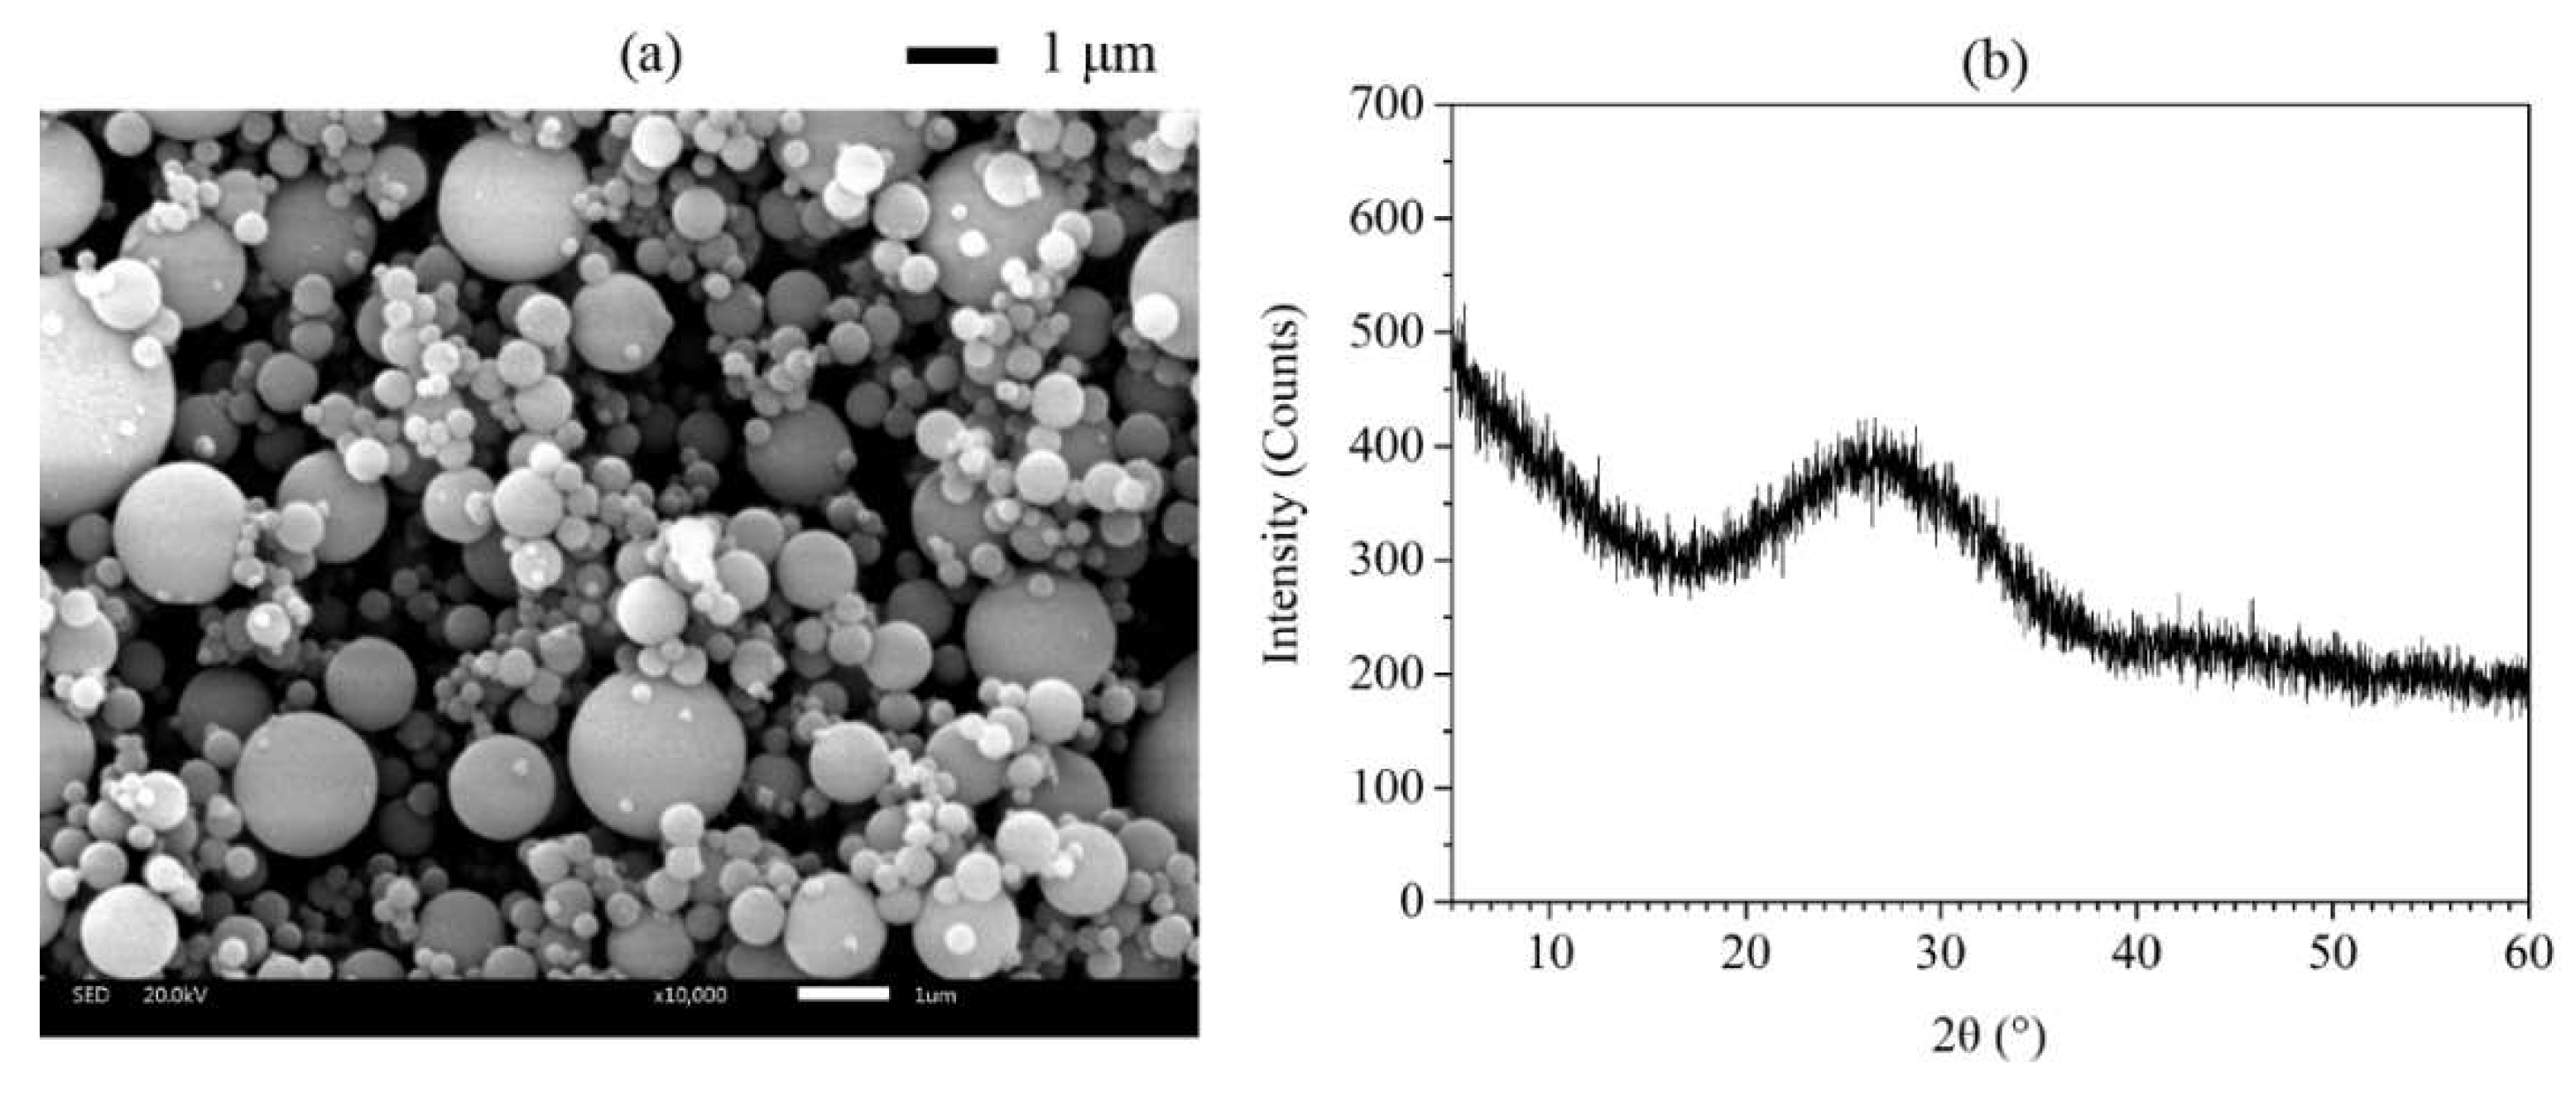
Figure 4 showed the SEM image and XRD pattern of FA and AMF, respectively. As shown in
Figure 3a and
Figure 4a, the morphology of AMF particles is very different from that of FA, which contains sharp corners and irregular edges.
Figure 3b and
Figure 4b confirmed that AMF is calcite and FA is amorphous. Using mineral admixtures such as fly ash and calcium carbonate significantly improves printability, mechanical strength, and resistance to leaching [
5,
7]. The addition of fly ash results in a reduced Ca-Si molar ratio of C-S-H, more stable than the Portland C-S-H, by the pozzolanic effect [
6]. The SP was used for improving the flowability of the fresh cement pastes with NS.
The proportions of mixtures were presented in
Table 2, and the mixtures with 0 and 10 wt% AMF were presented as AMF0FA20 and AMF10FA10. The cement pastes were prepared at a water-to-binder ratio of 0.27. Various contents of SP were used to ensure that all samples had approximately the same flowability. It was achieved after several times of trials and errors in the lab to attain suitable flowability. The flowability of AMF0FA20 and AMF10FA10 was 26 mm and 25 mm, respectively. HPMC was added to the mix with a content of 0.15% with respect to the mass of binders.
2.2. Samples and Leaching Procedure
Samples were prepared according to the following procedure. SP and HPMC were mixed with deionized water thoroughly. PC, AMF, FA, and NS have well blended for 60 s in a rotary mixer. Then, the resulting mixture and water with SP and HPMC were mixed for 120 s at low speed, followed at high speed for 120 s.
The 3D printer used in this work uses a gantry-type concrete 3D printing system. The effective printing volume of the printer is 600 mm (L) × 600 mm (W) × 600 mm (H), and the circle nozzle has a diameter of 35 mm. The printing parameter with a printing speed of 10 mm/s and a layer height of 10 mm were selected for this study. The extrusion speed was adjusted to the printing speed and layer height.
After 24 h, the samples were cured in tap water for 28 days at 20 ± 2℃. Before being tested, the samples were saw into cubes with a side length of 40 mm. Then, the samples were subjected to calcium leaching. Since the calcium leaching process in deionized water is very slow, we use a solution of 6 mol/L NH
4Cl to accelerate the aggressivity of the environment. This accelerated calcium leaching process has the same effect on physiochemical performances as the long-term erosion in deionized water [
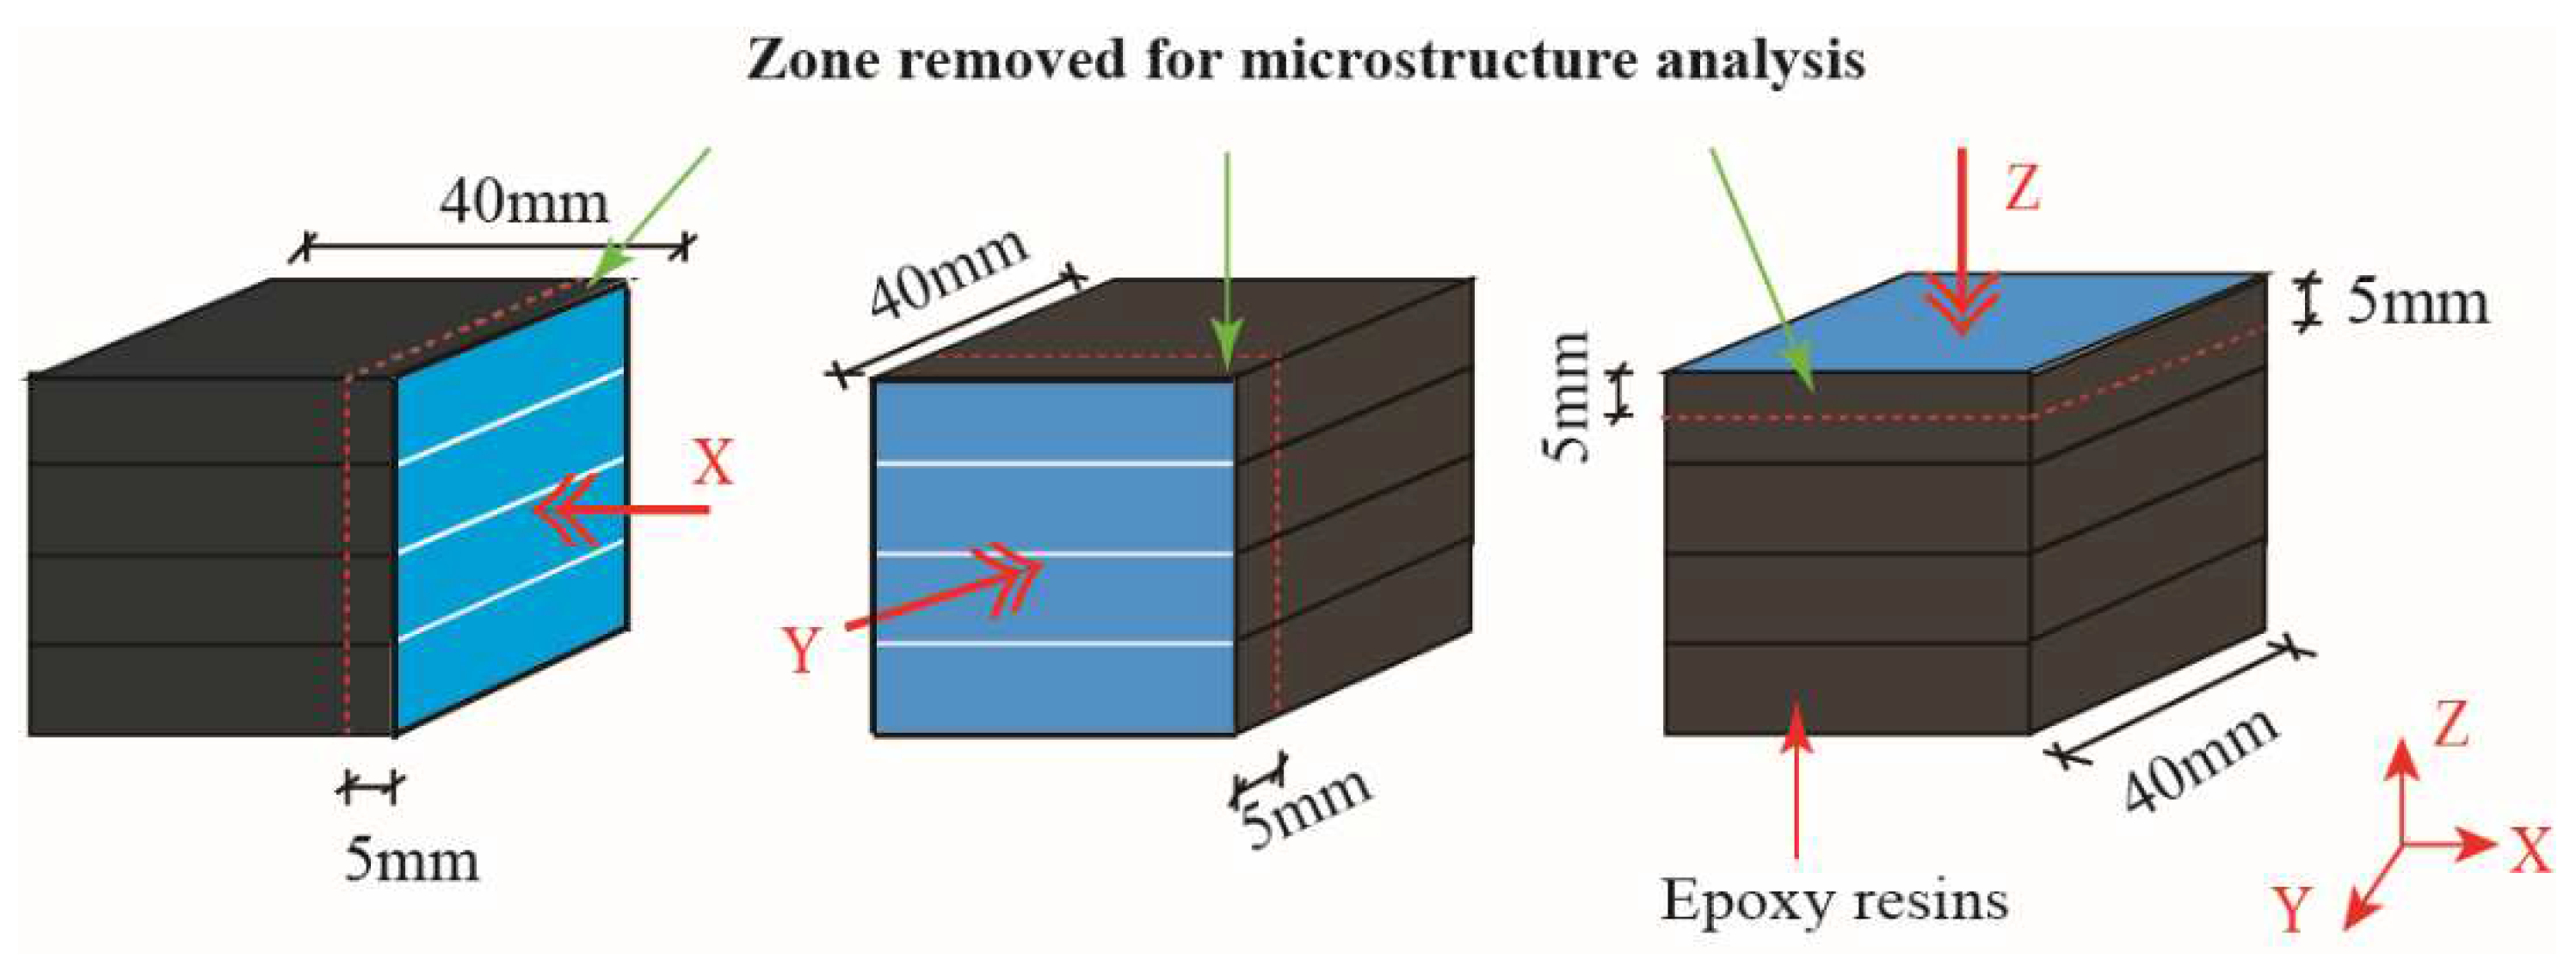
23]. Two opposite side surfaces of the samples were selected as the testing surfaces. The lateral sides of cubes were coated with epoxy resin to ensure the calcium leaching was carried out along the X direction or Y direction, or Z direction (see
Figure 5). Then, samples were immersed in a sealed container filled with 6 mol/L NH
4Cl solution for calcium leaching at a room temperature of 20 ± 2℃. The aggressive water was replaced every 7 days until the end of the experiment. After leaching for particular durations, samples were taken out for bulk density, water absorption, leaching depths, compressive strength, and microstructure tests.
2.3. Test Methods
2.3.1. Bulk Density and Water Absorption
During the calcium leaching process, Ca
2+ is diffused from the 3DPC continually, leading to increased porosity and decreased sample weight. Hence, bulk density and water absorption can be regarded as indicators of the deterioration degree of calcium leaching. In this work, bulk density of samples in a specific leaching duration was measured as equation (1):
Where
m and
V are the mass and volume of samples just taken out from the NH
4Cl solution, water absorption of samples in a specific leaching duration was determined as equation (2):
Where m1 is the mass of the sample, and m0 is the mass of the same sample placed in an oven at 105℃ for 24 hours.
2.3.2 Leaching Depths
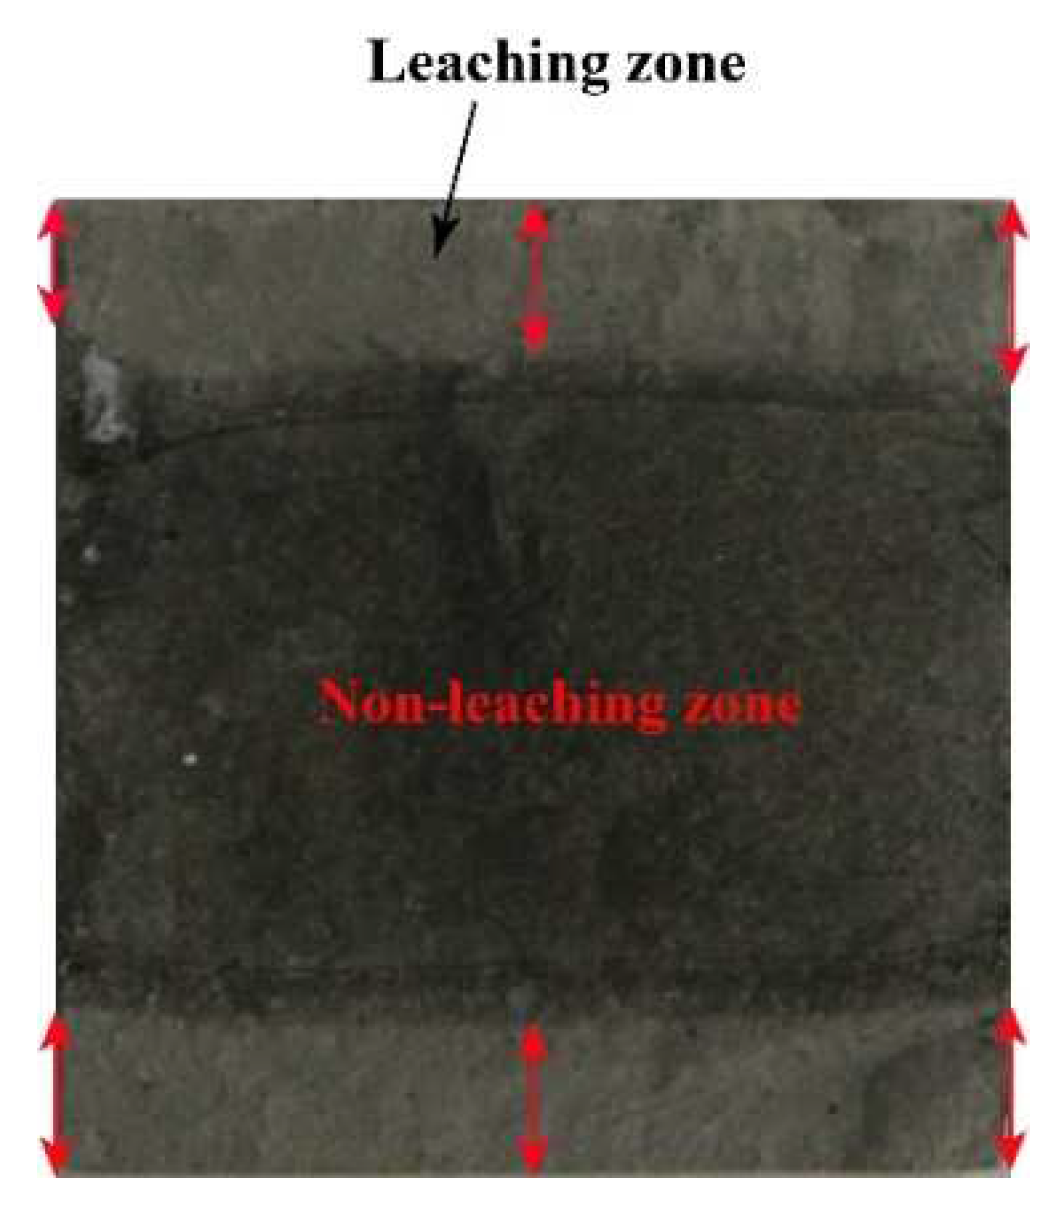
The leaching depth was the distance from the diffusion front to the sample’s surface. There is a strong correlation between the pore defects and the deterioration degree of leached samples. The samples were split into two blocks along the leaching direction, then the leaching depths of the cross-section of samples were measured. As shown in
Figure 6, the leaching depth is the mean value of 6 points for one sample. The results of leaching depth are the average value of three samples.
2.3.3. Compressive Strength
Compressive strength is an essential mechanical performance to quantify the deterioration degree of leached samples. After a certain calcium leaching interval, samples were conducted the compressive strength test. The loading rate of compressive strength tests was controlled by 2.4 kN/s. Compressive strength was tested at each age on three duplicated samples, and the average values were reported. The compressive strength anisotropy coefficient of samples in a specific leaching duration was calculated as equation (3) [
24]:
where
IDirection represents the compressive strength anisotropy coefficient at a specific loading direction. For instance, the
IX refers to the compressive strength anisotropy coefficient of samples subjected to the X loading direction.
fDirection represents the compressive strength at a specific direction.
fX,
fY, and
fZ represent the compressive strength of samples subjected to the X, Y, and Z directions, respectively.
2.3.4. XRD, DTG-TG, and MIP
The intrinsic reason for the degradation of cementitious materials in aggressive water is their microstructural changes. Therefore, x-ray diffraction (XRD), differential thermal gravity and thermogravimetric analysis (DTG-TG), and mercury intrusion porosimetry (MIP) analysis were carried out on a representative volume of the sample from the specimen edge, as shown in
Figure 5.
XRD determined the mineralogical characterization of the samples on an Empyrean X-ray diffractometer. The diffraction pattern was obtained with Cu-kα radiation operating at 40 kV and 40 mA, and the samples were scanned in the range of 5 ° to 60 ° (2θ) at a step of 0.02 °.
An STA 449 F3 Jupiter determined the DTG-TG of the samples. It was performed at a temperature range from room temperature to 1000℃ and a heating rate of 10℃/min under a nitrogen atmosphere. The DTG figures the thermal decompositions of hydration products in the samples, while TG simultaneously records the weight loss due to the decomposition of hydration products. According to Taylor’s formula, the CH and bound water amount was calculated from the TG curves [
6].
MIP, a common method for evaluating the pore structure of cementitious materials, was performed on the 3DPC subjected to calcium leaching. MIP test determined porosity, total pore area, total intrusion volume, average pore diameter, median pore diameter, and pore size distribution using MicroActive AutoPore V 9600 with a pressure ranging between 0.0007 MPa and 420 MPa.
3. Results and Discussion
3.1. Decrease in Bulk Density
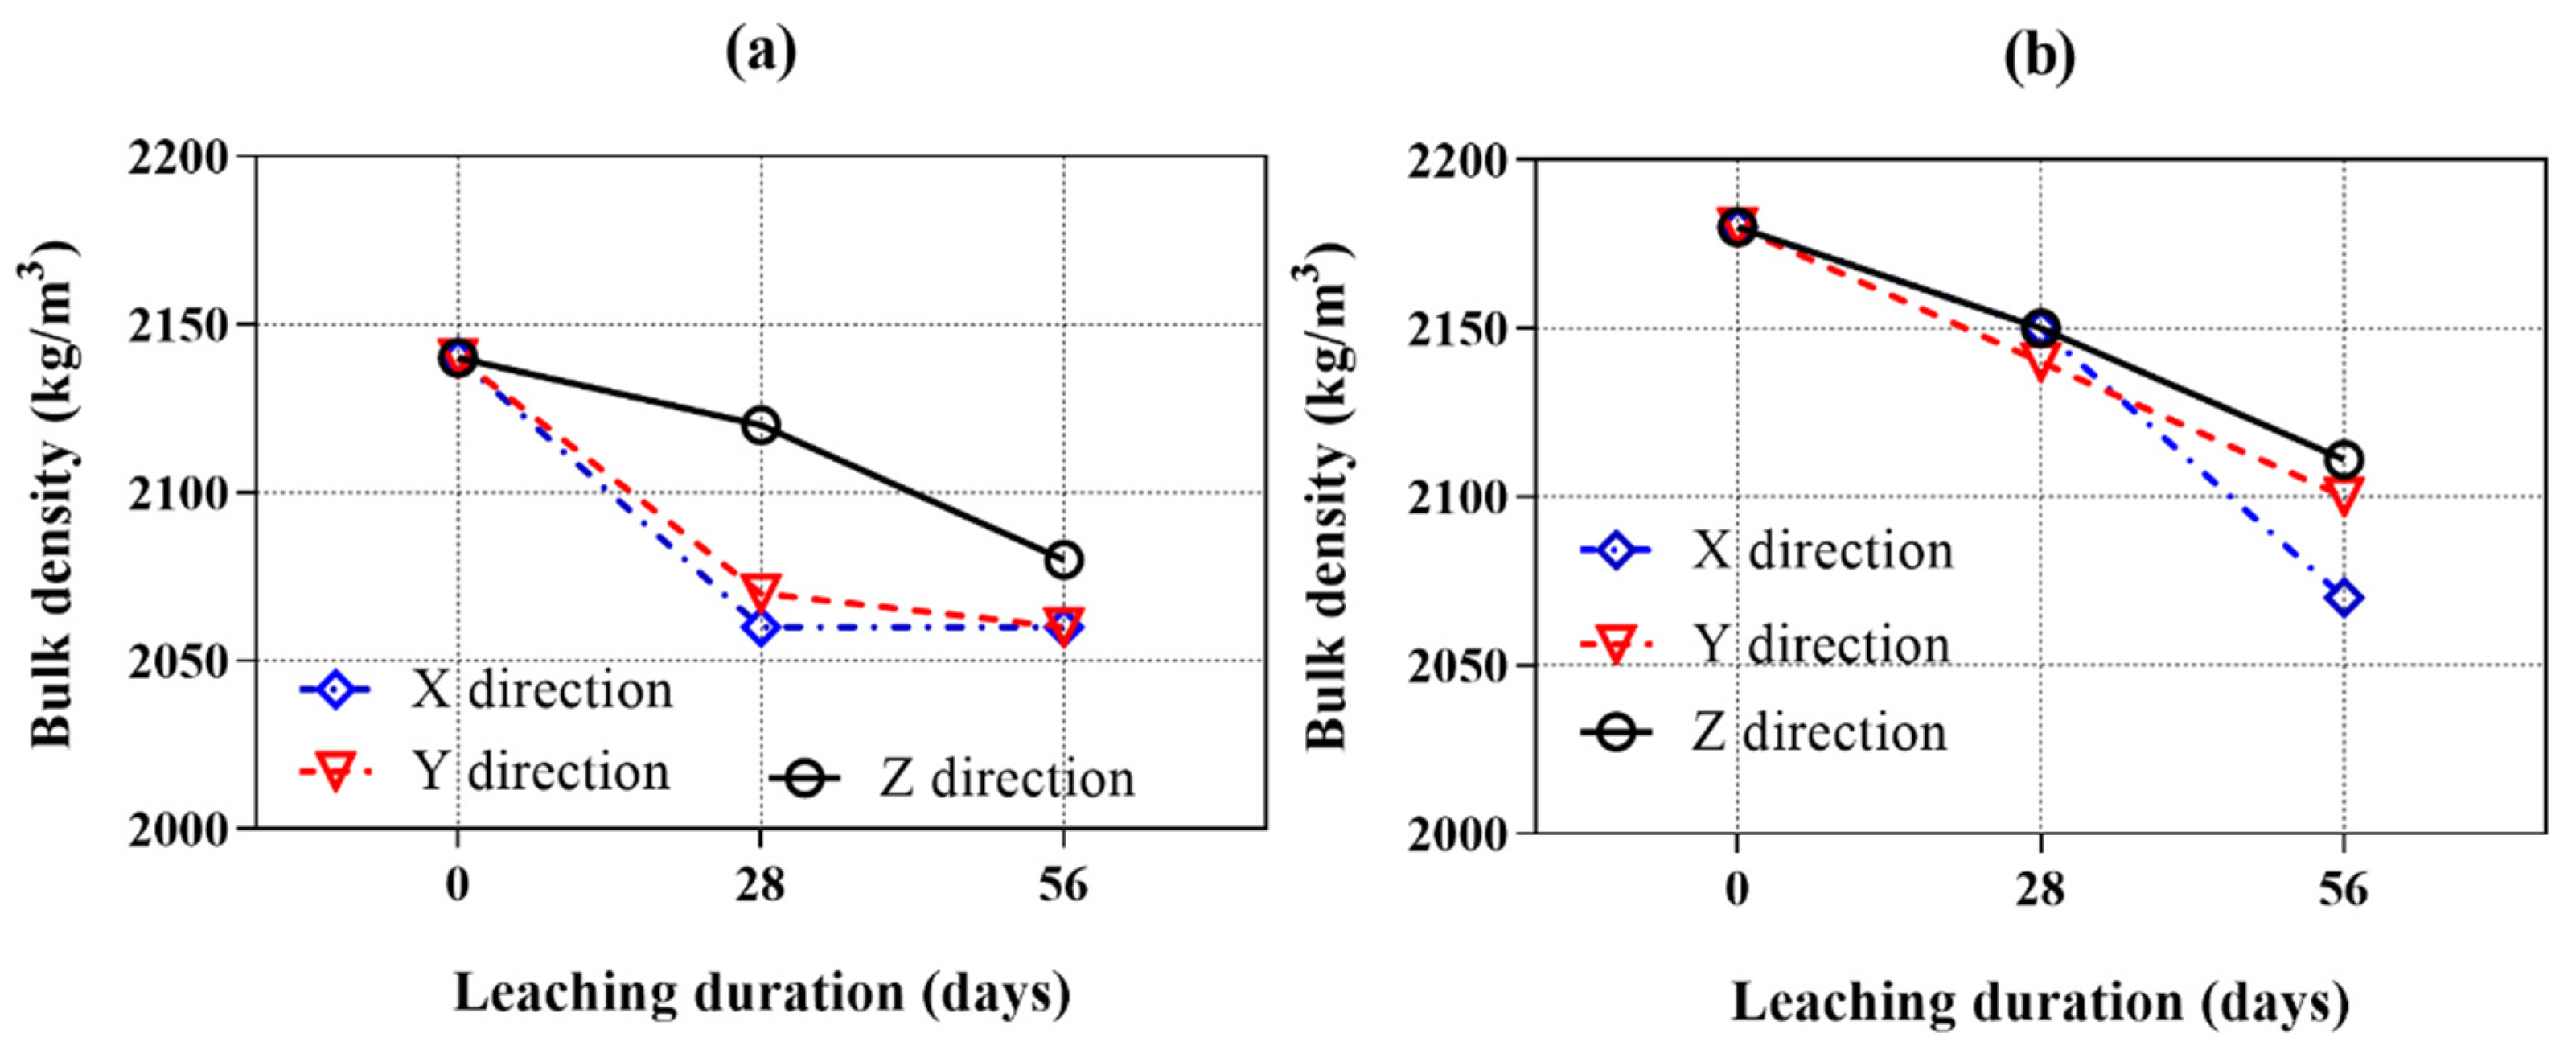
Figure 7a,b show the bulk density of the samples cured in water for 28 days and those leached for 28 and 56 days in ammonium chloride solution. The initial bulk density of samples with AMF is higher than that of the samples without AMF because of the higher specific gravities of the AMF than the FA.
As expected, the bulk density of all samples decreased with calcium leaching duration. The longer the calcium leaching duration, the greater the reduction in bulk density. These results indicate that the dissolution of hydration products progressed gradually with the leaching period. It is also shown that the bulk density of AMF0FA20 leached in the Z direction is higher than that in the X and Y directions. After 28 days of calcium leaching, the bulk density of AMF0FA20 leached in the X, Y, and Z directions decreased by 3.7%, 3.3%, and 0.9%, respectively. Then, the bulk density gradually decreased over calcium leaching time. After 56 days of calcium leaching, the bulk density of the sample leached in the Z direction was still higher than the samples leached in the X and Y direction. As for AMF10FA10, the bulk density of samples leached in the X and Y direction was equal to or less than that in the Z direction at 28 days of calcium leaching. After 56 days of calcium leaching, the bulk density of samples leached in the X and Y direction was lower than the sample leached in the Z direction by 1.9% and 0.5%. Overall, the bulk density of samples leached in the Z direction significantly differed from those leached in the X and Y directions. This demonstrates the calcium leaching anisotropy of 3DPC.
Compared to the AMF0FA20, the AMF10FA10 leached both in the X and Y directions and exhibited a lower calcium leaching speed. This implies that AMF positively affects the calcium leaching anisotropy of 3DPC.
3.2. Water Absorption
The resistivity of calcium leaching mainly depends on the water absorption of the cementitious materials. Thus, variation in water absorption is an important parameter for investigating the calcium leaching behaviors of 3DPC.
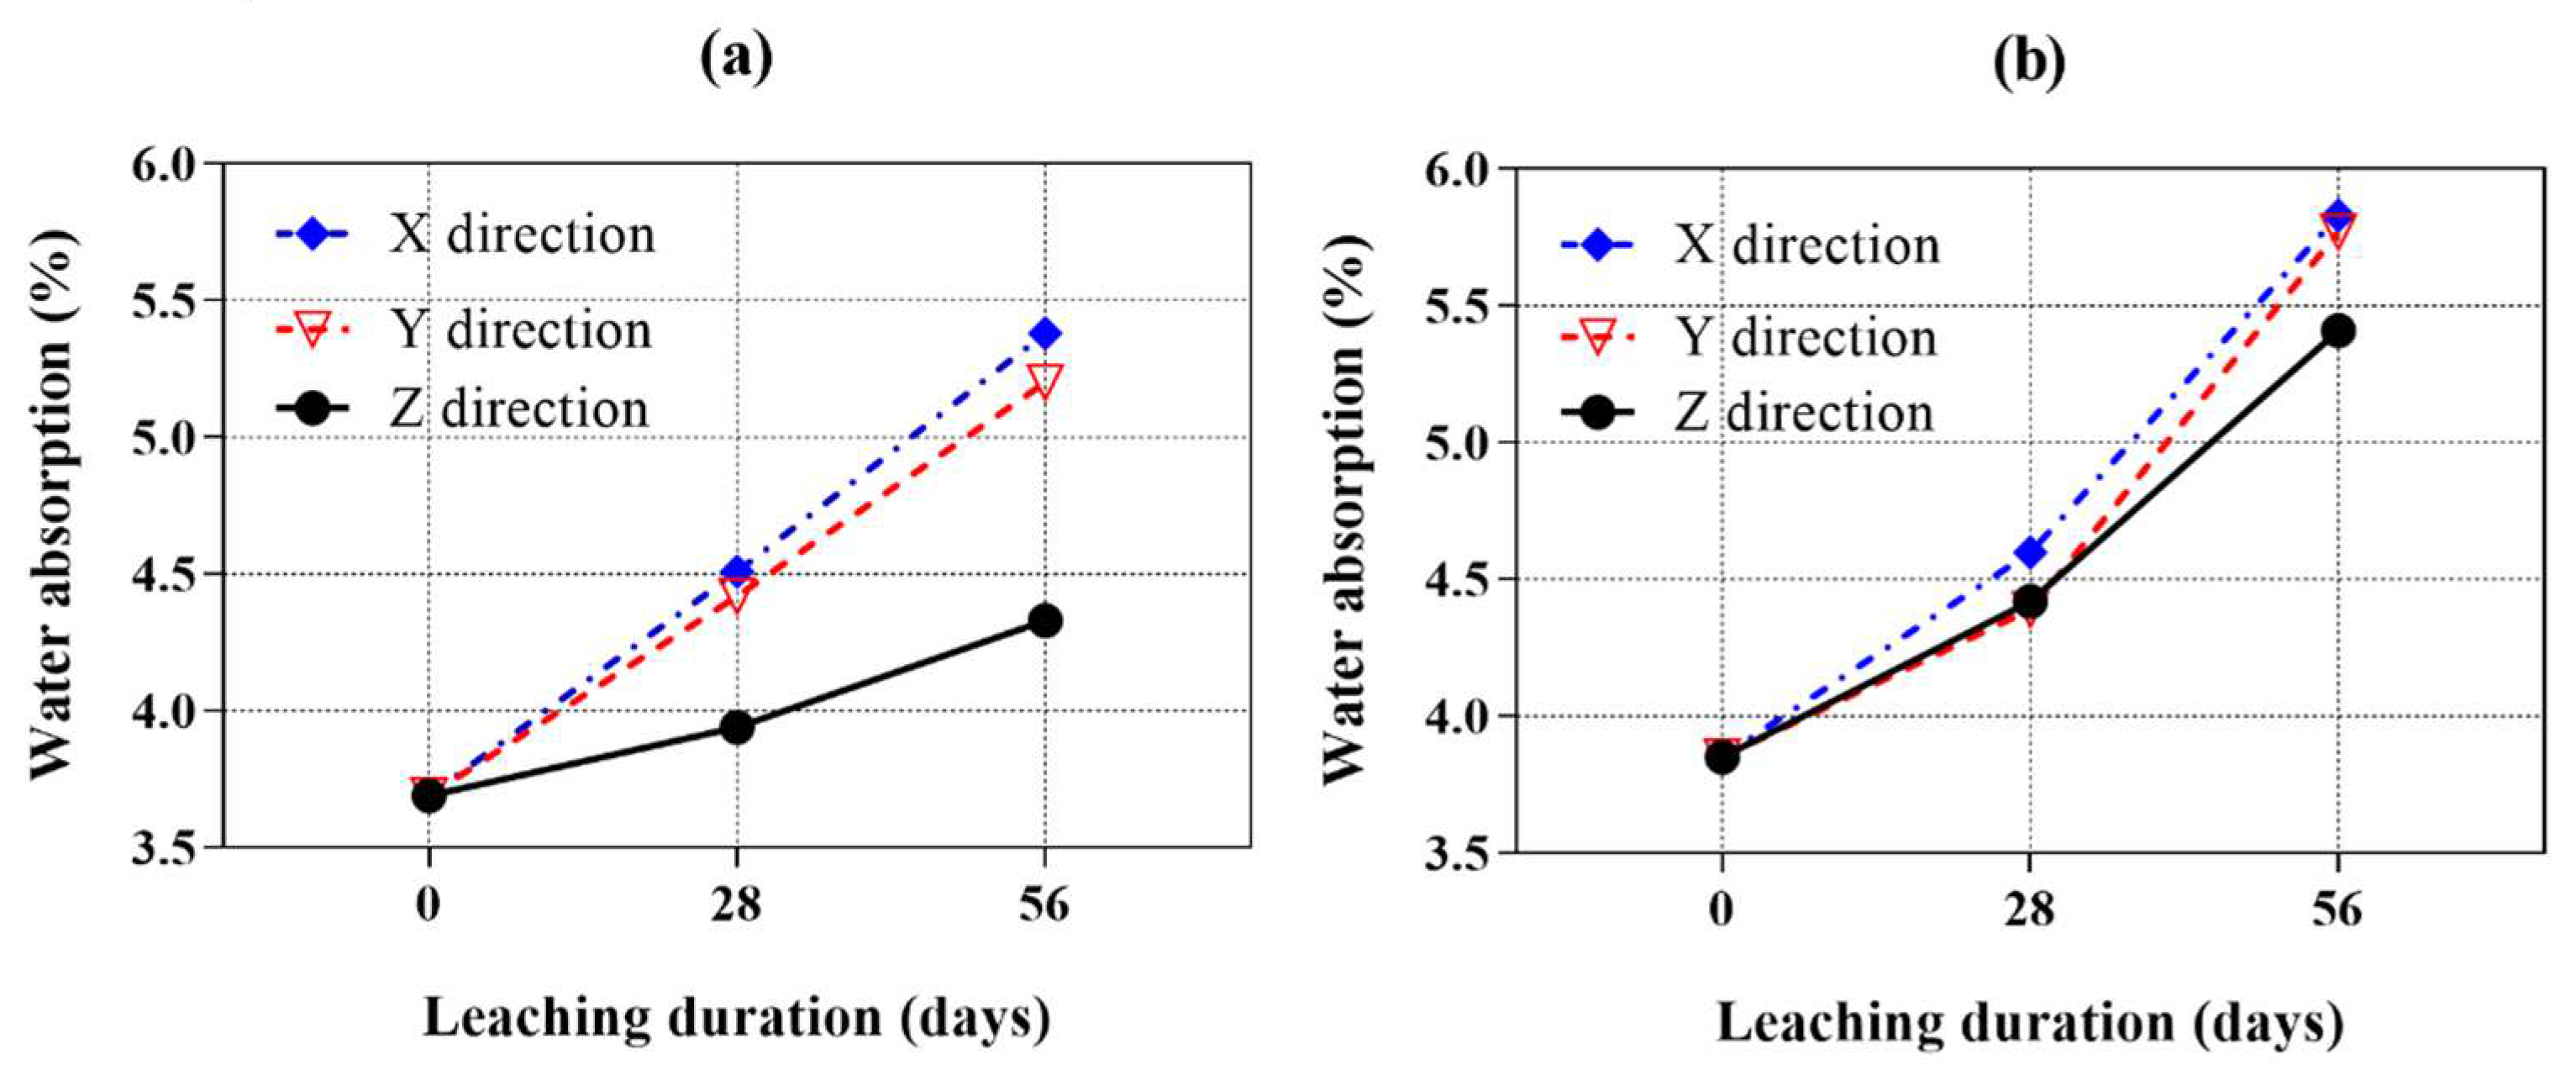
Figure 8a,b show the water absorption of all samples after exposure to ammonium chloride solution for 28 and 56 days. It generally showed an opposite trend as the bulk density curves illustrated previously. With exposure, the water absorption increased in all samples due to the ingress of ammonium chloride. The water absorption of samples leached in the X and Y directions are similar. However, all samples leached in the Z direction showed significantly lower water absorption than those leached in the X and Y direction, which is consistent with the bulk density results.
The AMF0FA20 leached in the X direction showed comparable water absorption with respect to the Y direction. At 28 days of calcium leaching, the water absorption of the samples leached in the X and Y direction increased by about 14.5% and 12.2% more than that of leached in the Z direction. At 56 days of calcium leaching, the water absorption of samples leached in the X and Y direction showed a 24.2% and 20.1% increase, respectively, compared to that of leached in the Z direction. A similar phenomenon was also observed for AMF10FA10 in
Figure 8b. Among all the calcium leaching directions, the AMF10FA10 leached in the Z direction showed the least increase in water absorption value under ammonium chloride solution at 28 and 56 days. In addition, compared to AMF0FA20, AMF10FA10 showed less calcium leaching anisotropy after exposure to ammonium chloride solution for 28 and 56 days.
3.3. Leaching Depths
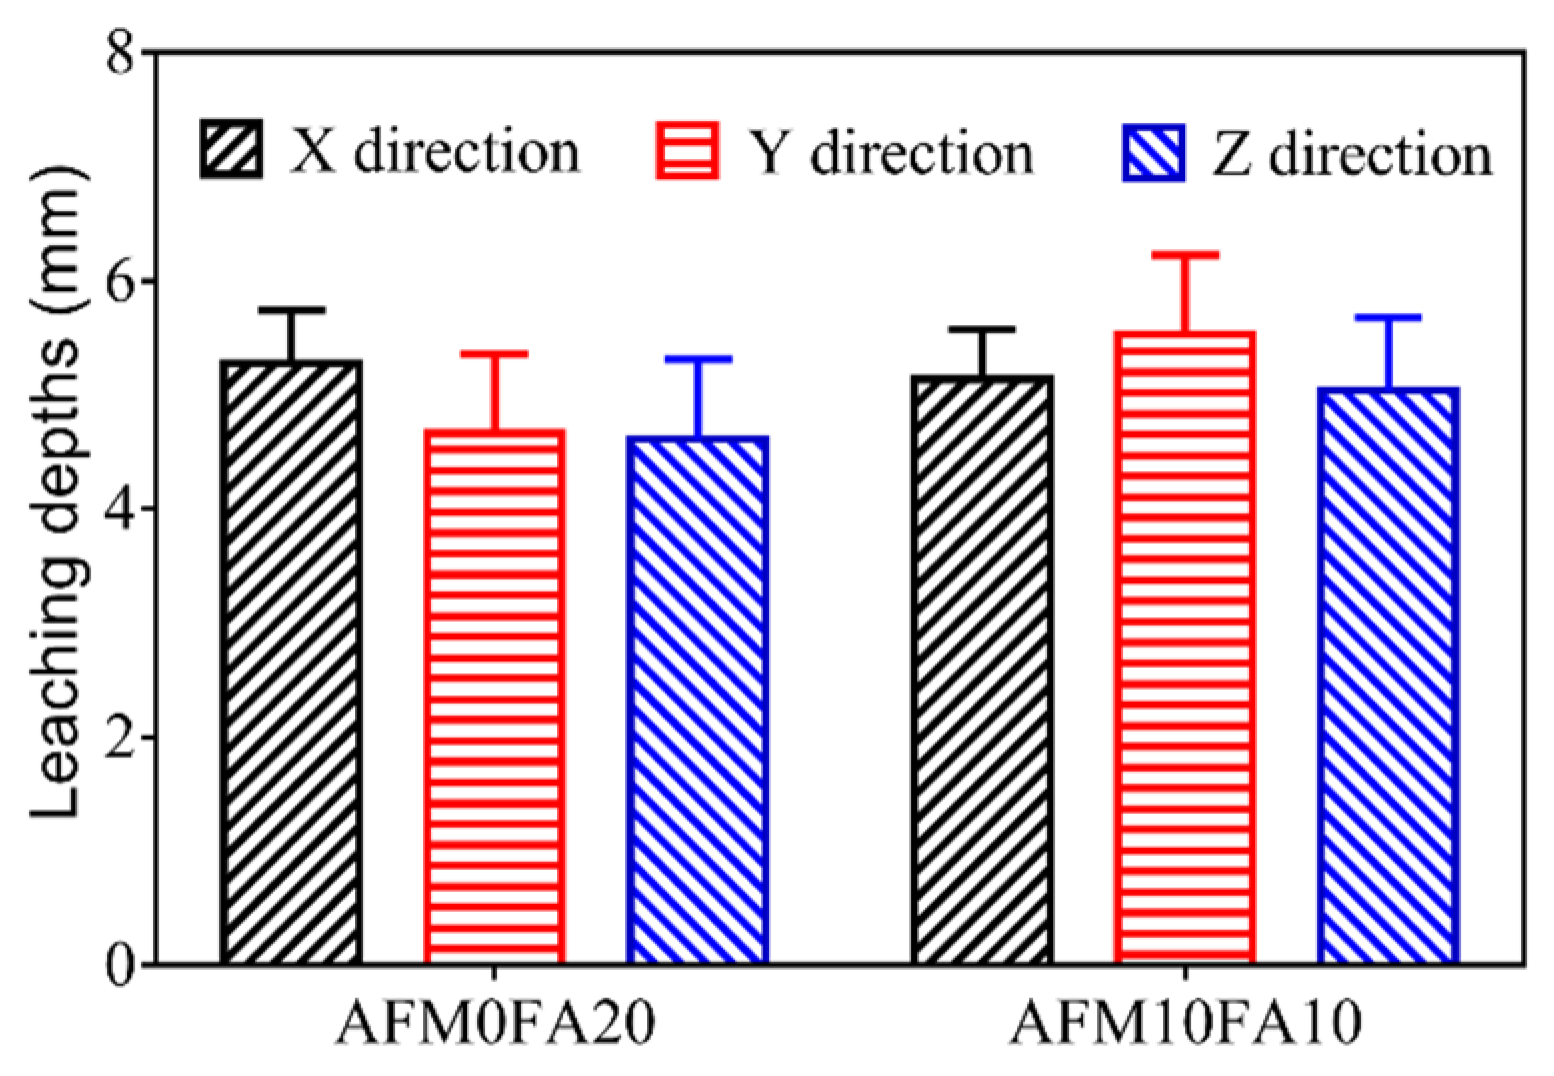
Figure 9 shows the leaching depths for the AMF0FA20 and AMF10FA10 after 56 days of leaching. A leaching depth of 4.6 mm to 5.5 mm is obtained for the samples after 56 days of leaching, which is much higher than the values previously reported for cast cement pastes [
6]. This phenomenon can be attributed to the higher porosity of 3DPC than cast ones. The AMF10FA10 shows higher leaching depths in all three directions than AMF0FA20, indicating higher leaching resistance for the AMF0FA20. The reason for this observation could be the pozzolanic effects of FA, resulting in the generation of C-S-H with a low Ca-Si molar ratio, then densifying the microstructure of materials. In addition, all samples in the Z direction show smaller leaching depths than in the X and Y direction, indicating the calcium leaching anisotropy of 3DPC.
3.4. Mechanical Anisotropy
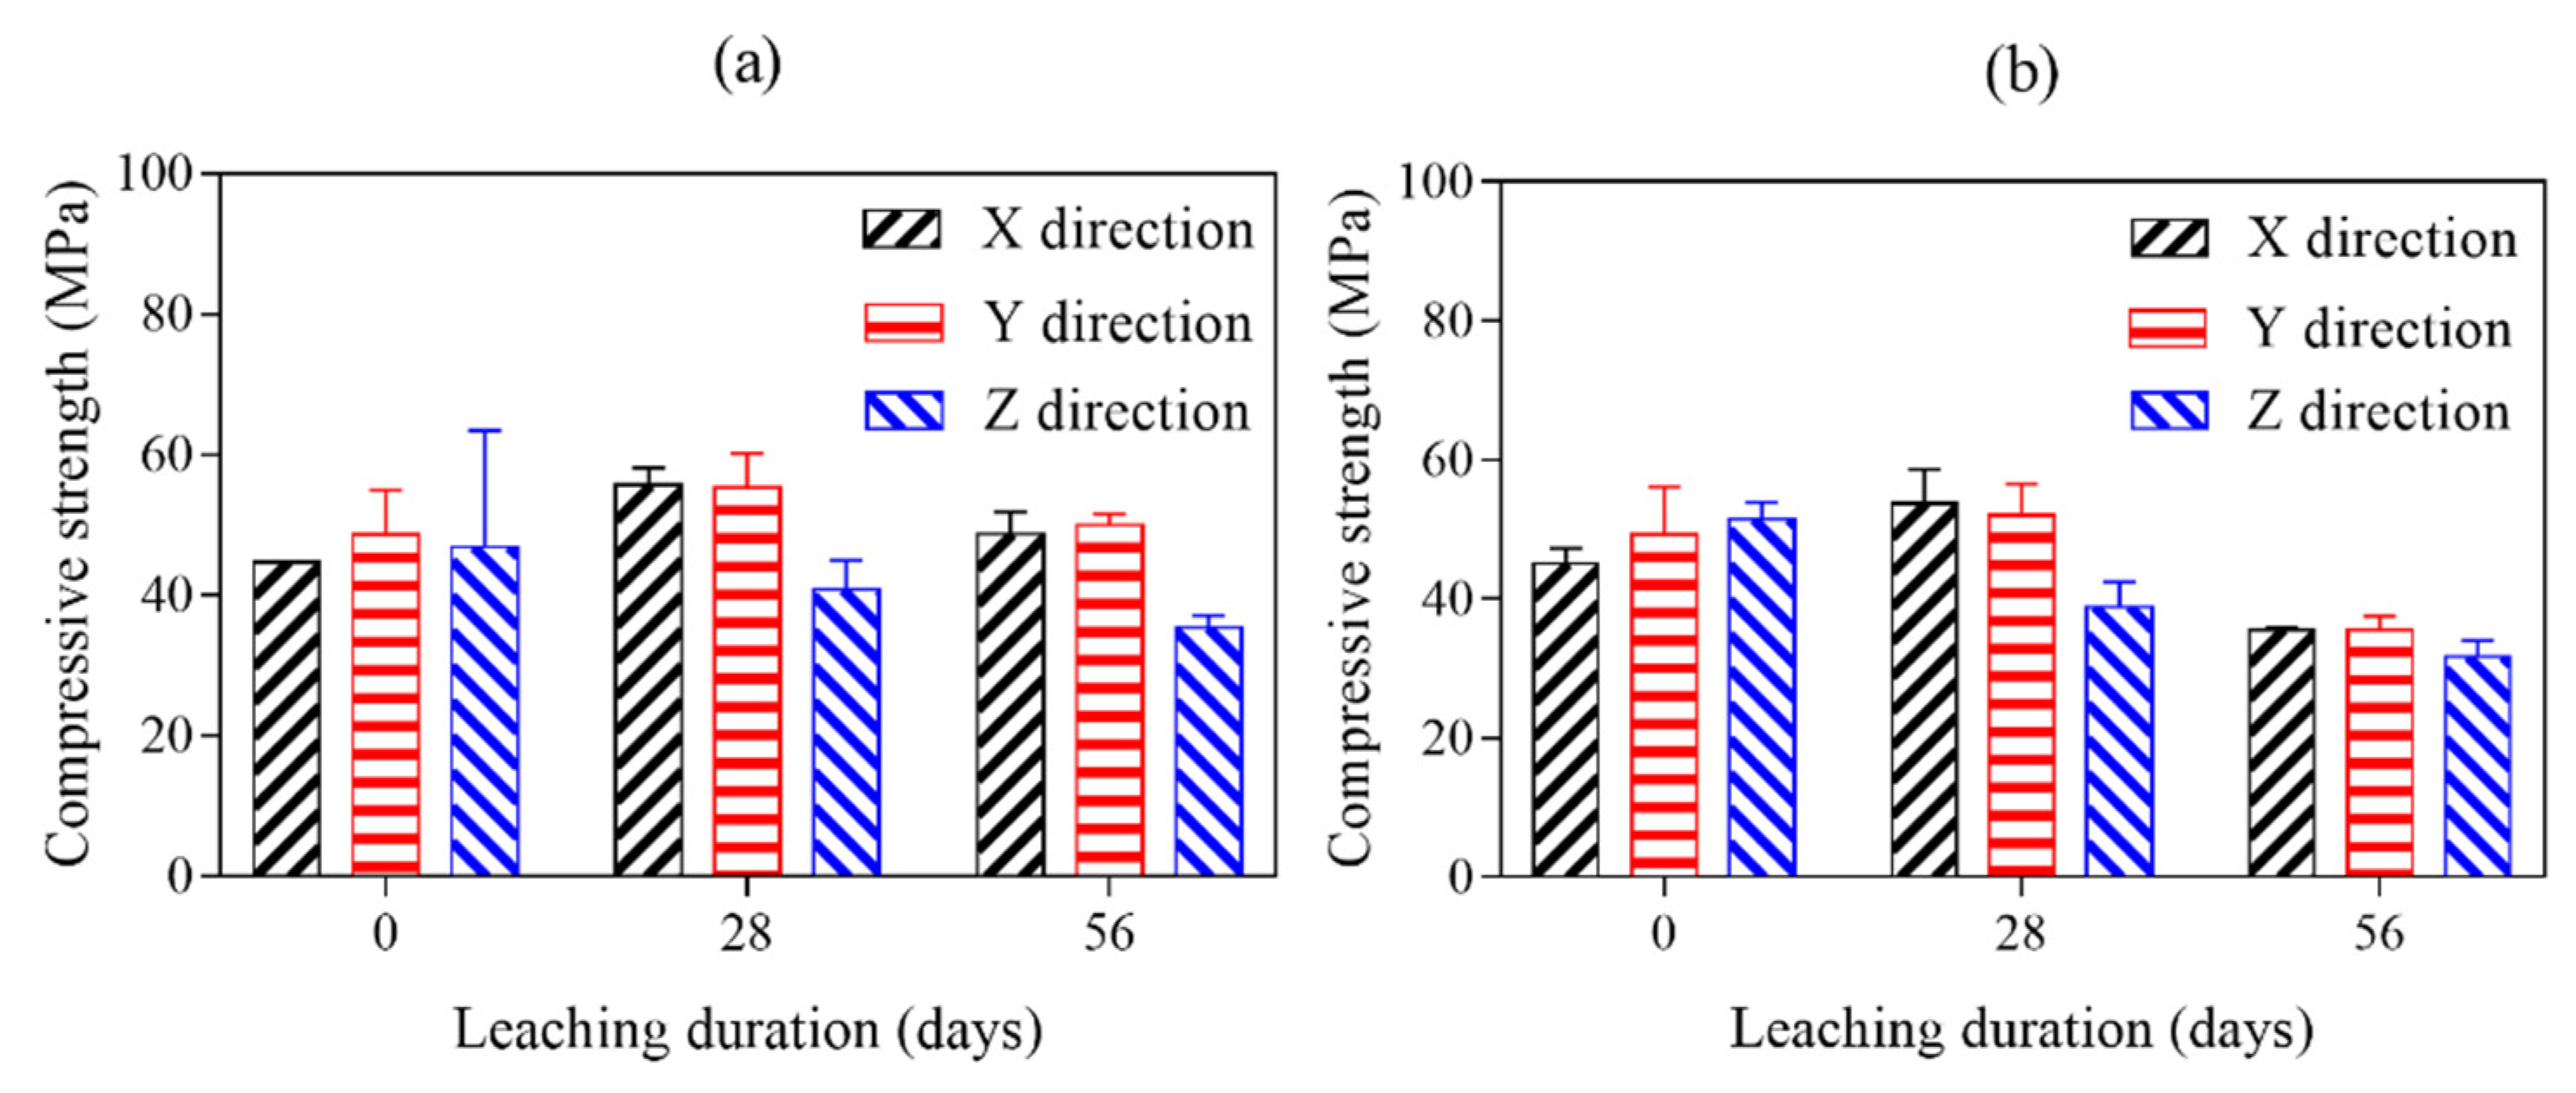
The compressive strength test is the usual way to evaluate the mechanical anisotropy of 3D printed cement pasts exposed in ammonium chloride solution. The compressive strength results of 28 days cured and 28- and 56-days ammonium chloride exposed AMF0FA20 and AMF10FA10 are given in
Figure 10a,b. Compared to reference samples (28 days cured and before ammonium chloride exposed 3DPC), the compressive strength of all samples leached in the X and Y direction is still increasing after exposure to an aggressive environment for 28 days. Unreacted clinker, detected in the samples by XRD analysis (see
Figure 11), is one of the main reasons for the increased compressive strength after 28 days of calcium leaching. The new hydration products filled the pores of samples, making it more difficult for the ammonium chloride solution to get into them.
All samples leached in X or Y direction showed the highest compressive strength at 28 days of calcium leaching. AMF0FA20 leached in the X and Y direction are still higher compressive strength than references even after 56 calcium leaching days. It can be confirmed that the increase in compressive strength of samples leached in the X direction or Y direction due to the hydration of cement is higher than that of the decrease in compressive strength due to the erosion of the ammonium chloride before 28 days of calcium leaching. After that, the compressive strength of the samples leached in the X direction or Y direction decreases so rapidly that its growth can no longer compensate for its decrease. As for samples leached in the Z direction, the compressive strength consistently decreased with calcium leaching duration. Among all the calcium leaching directions, samples leached in the Z direction showed the least reduction in compressive strength value under ammonium chloride exposure at 28 and 56 days. It is indicated that the increase in compressive strength of samples leached in the Z direction due to the hydration of cement is lower than that of the decrease in compressive strength due to the erosion of the ammonium chloride during calcium leaching.
In order to get a clear picture of variations in mechanical anisotropy of 3DPC after long-term exposure to ammonium chloride solution, the mechanical anisotropy coefficients of all samples after calcium leaching for 28 and 56 days are given in
Table 3. The mechanical anisotropy coefficients of 28 days of cured samples before calcium leaching are also listed in this table.
The first thing that becomes apparent from
Table 3 is the samples’ significantly different mechanical anisotropy coefficients before and after calcium leaching. As shown in this table,
IX,
IY, and
IZ of AMF0FA20 increased due to the ingress of ammonium and chloride ions in the ammonium chloride solution. Compared to the
IX and
IY of AMF0FA20,
IZ showed the least value before calcium leaching. After exposure to ammonium chloride solution for up to 28 days, all directions showed a progressive increase in compressive strength anisotropy coefficient. The Z direction showed the highest compressive strength anisotropy coefficient. Further, during exposure to ammonium chloride solution,
IZ maintained the highest compressive strength anisotropy coefficient for up to 56 days among all the calcium leaching directions. As for AMF10FA10, the Z direction showed a comparable compressive strength anisotropy coefficient with respect to the X and Y direction before calcium leaching. After 28 days of calcium leaching, the compressive strength anisotropy coefficient in the X, Y, and Z direction increased marginally by 64.7%, 160%, and 292.3%, respectively. However, all three directions showed a decline in compressive strength anisotropy coefficient after 56 days of exposure.
3.5 XRD Analysis
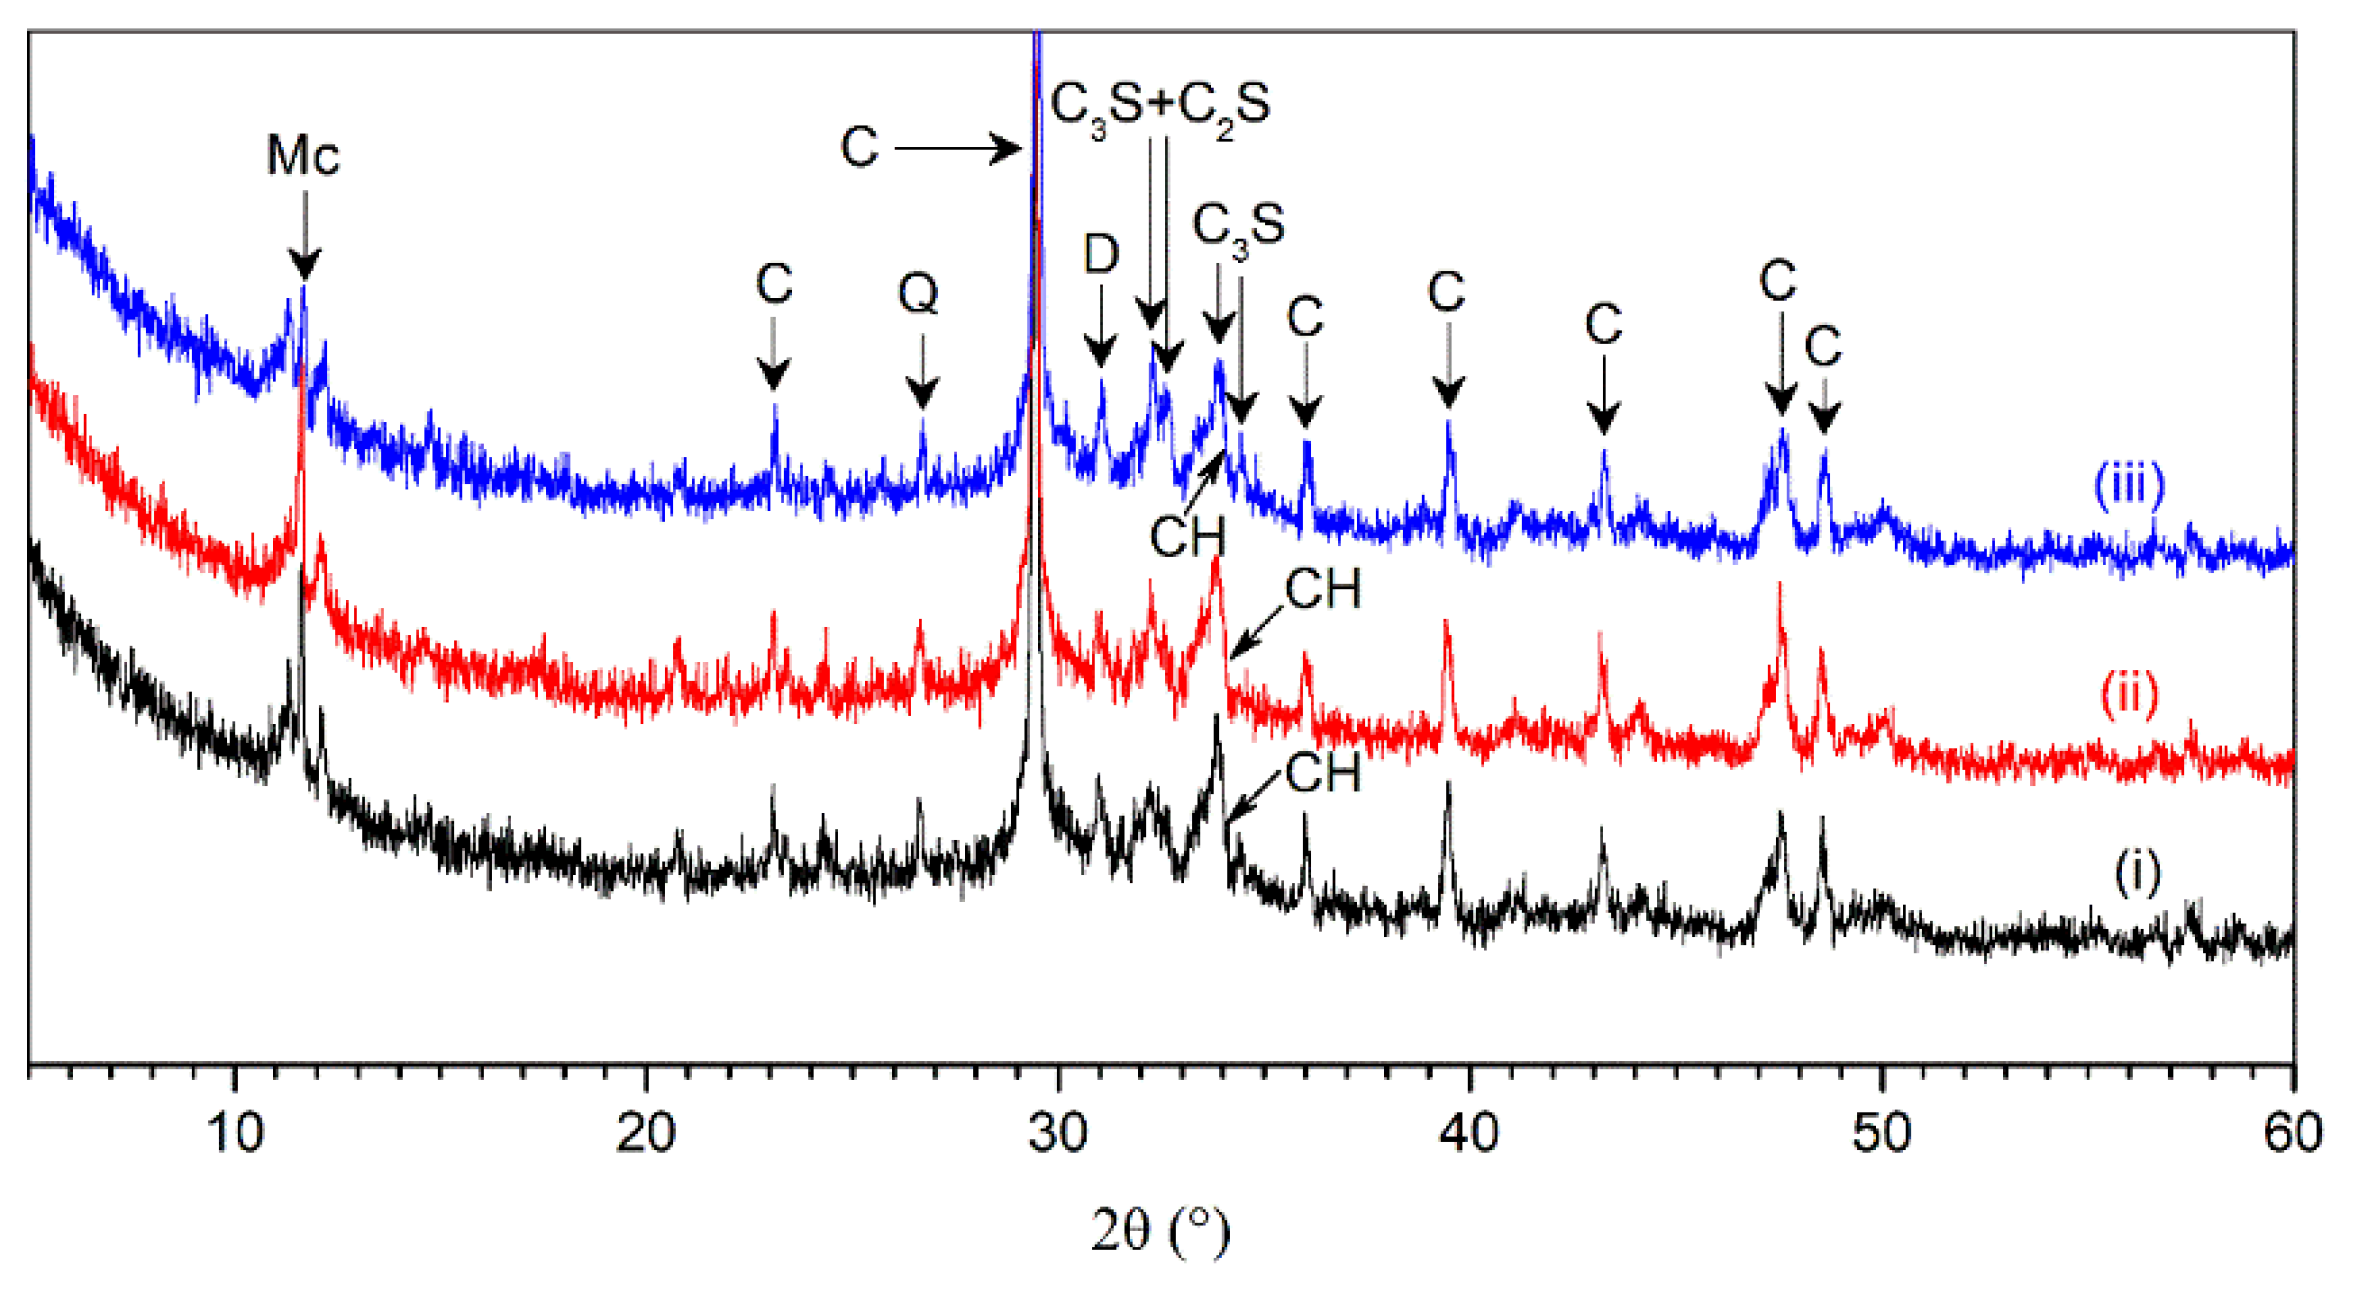
Figure 11 shows the X-ray diffractogram of AMF10FA10 leached in X, Y, and Z directions after exposure to the ammonium chloride solution for 56 days. The diffraction spectra analysis in samples indicated the following mineral compounds: calcite (C), quartz (Q), dolomite (D), C
3S (alite), C
2S (belite), portlandite (CH), and monocarbonate (Mc). The monocarbonate was found since AMF, mainly composed of calcite, was present in the AMF10FA10. The presence of monocarbonate indicates a reaction between calcite and aluminum phases in cement [
25], which prevents the conversion of AFt into AFm [
26]. Catinaud et al. have reported that the formation of monocarbonate is due to the depletion of CH [
7]. The diffraction peaks for monocarbonate in all samples are relatively high, which implies it has high stability in the ammonium chloride solution. The remaining C
3S and C
2S in the samples indicate that the Portland cement is not fully hydrated even after 56 days of leaching.
The CH peaks during calcium leaching were considered the primary indicator of hydration product stability in 3DPC in this work. It can be observed that the intensity height for CH located at the 2-theta angle of 34.07° was relatively low after exposure, which indicates that the hydration products in samples were substantially decomposed due to the calcium leaching.
The peaks for AMF10FA10 leached in the X, Y, and Z directions appeared similar. However, the intensity height for CH at a 2-theta angle of 34.07° in the Z direction is lower by 24.2% and 10.1% than in the X and Y direction, respectively. It is interesting to note that the results were the opposite of what we had expected. This phenomenon is also found in DTG-TG analysis, as shown in the next section. In addition, the results in this figure also showed a relatively lower intensity height of monocarbonate in the Z direction than that in the X and Y direction. These observations indicate the calcium leaching anisotropy of 3DPC in ammonium chloride solution.
3.6. DTG-TG Analysis
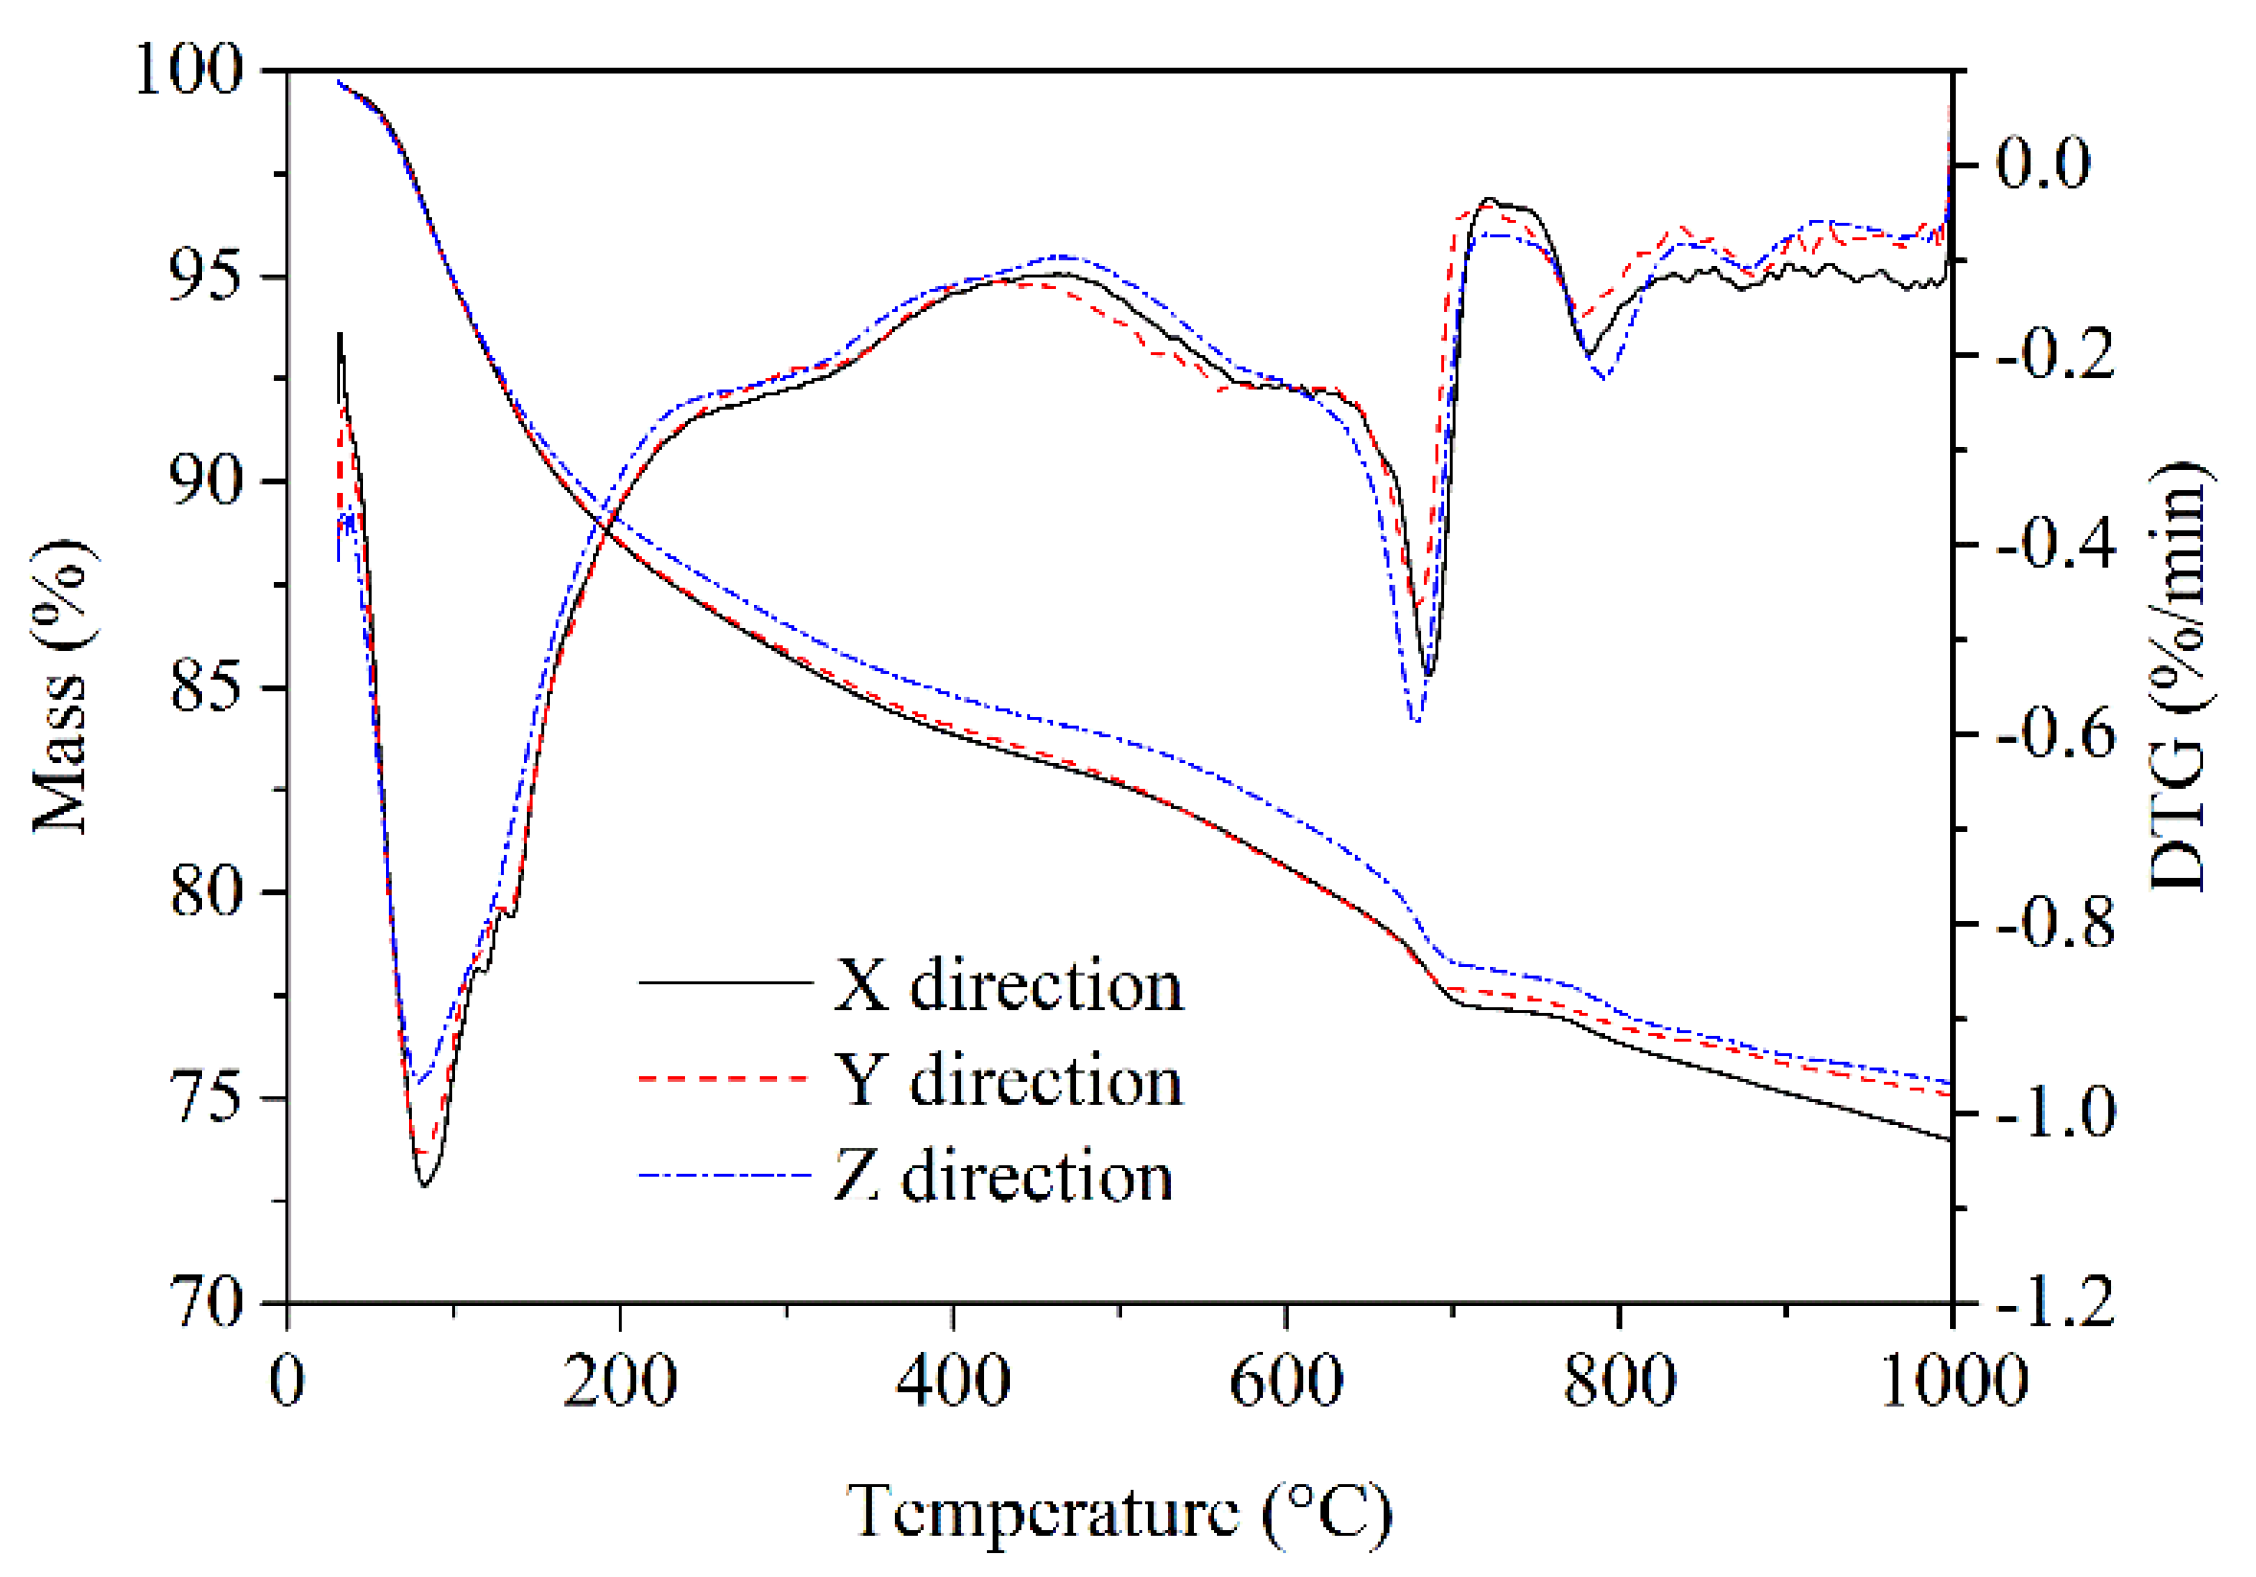
DTG-TG curves of 56 days leached AMF10FA10 gave details on the mass loss due to the decomposition of CH, decomposition of C-S-H, and decarbonization of CaCO
3, as shown in
Figure 12. It is interpreted from the DTG curve that the first endothermal peak at about 80–90℃ is related to the dehydration of C-S-H and the second endothermal peak at around 600–700℃ corresponds with the decomposition of CaCO
3. The typical endothermal peak at approximately 400–500℃, which represents the decomposition of CH, can hardly be observed. This indicates that many hydration products, particularly CH, have been leached out after 56 days. Furthermore, the TG curves were almost identical for samples of calcium leached in the X and Y directions. However, the mass loss for sample calcium leached in the Z direction is lower than that of calcium leached in the other two directions, suggesting that more hydration products have been leached from the Z direction than the other two.
CH generated by cement hydration is critical for the stability of C-S-H in aggressive water, and the dissolution of CH is essential for the increase in porosity and the decrease in strength [
21].
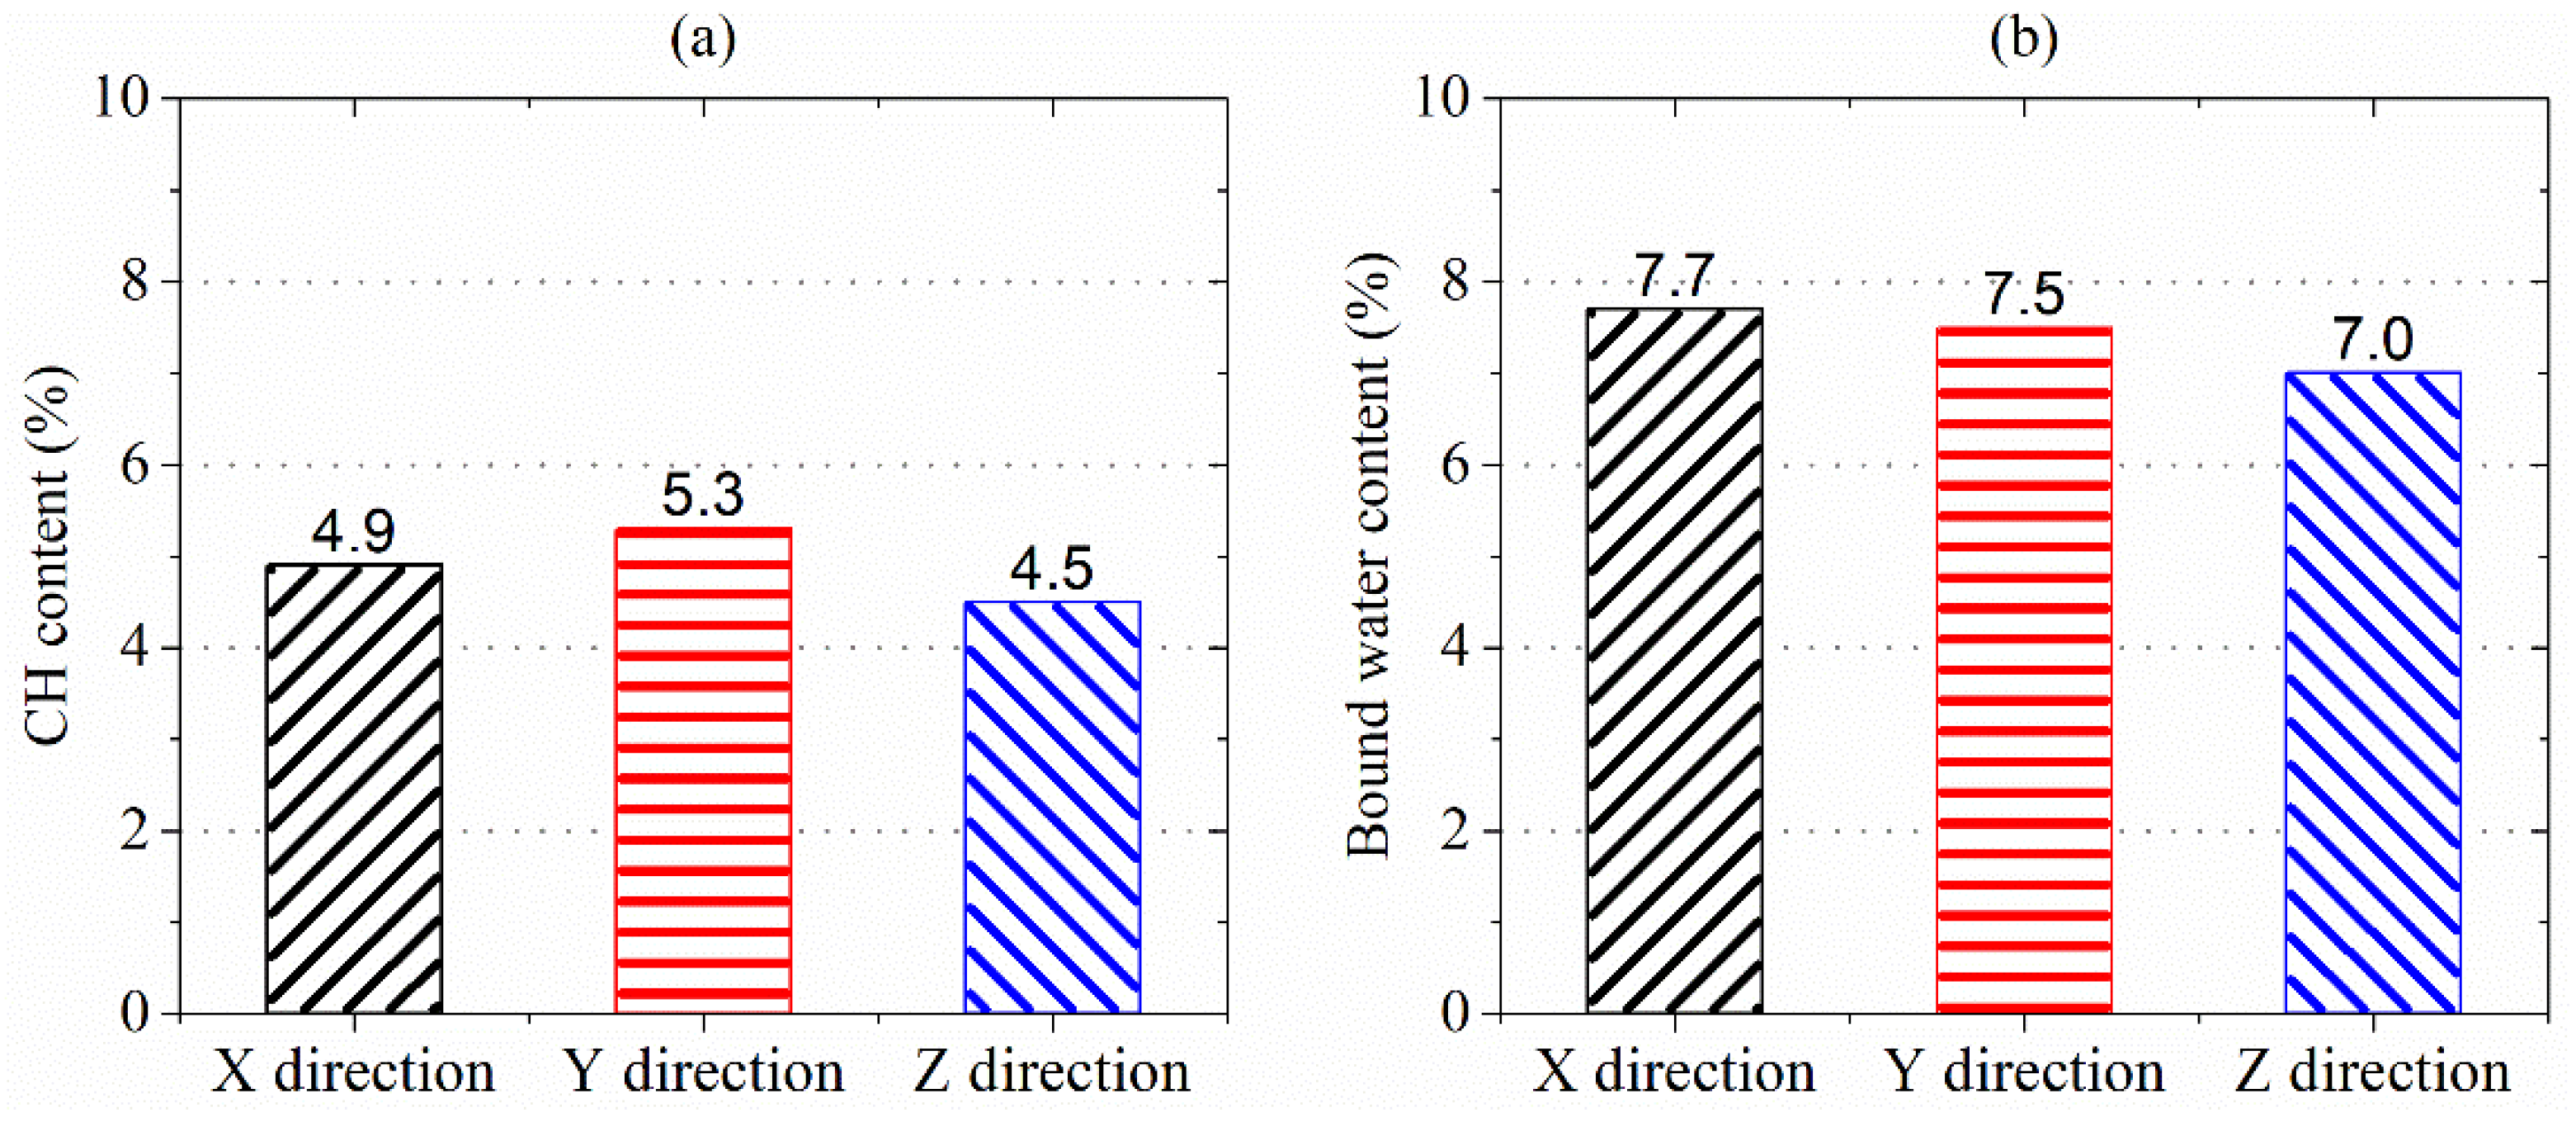
Figure 13a,b) show the percentage of CH and bound water content remaining in the AMF10FA10 exposure to ammonium chloride solution for 56 days, as determined from the TG curves. As shown in these figures, CH content in samples leached in the Z direction was lower, 8.9% and 17.8%, than in the X and Y directions. The bound water content in samples leached in the Z direction lowers by 10.0% and 7.1% more than in the X and Y direction. This indicates that the samples leached in the Z direction lost more hydration products, such as C-S-H, than those leached in other directions during the calcium leaching duration. The greater bound water content reduction in the Z direction may be due to the lower lime concentration at the zone for microstructure analysis, as indicated in
Figure 5. A lack of CH content results in the decomposition of C-S-H and is likely a contributing factor to the reduced compressive strength in Z direction calcium leached at 28 and 56 days. Therefore, the calcium leaching direction greatly influences the CH and bound water content of 3DPC.
3.7. MIP Analysis
Because of the nature of calcium leaching, pores in 3DPC play a fundamental role in the transport process of Ca
2+ due to its relatively porous structure. Thus, the characterization of the pores is necessary to understand the calcium leaching behavior of 3DPC.
Table 4 shows the results from the MIP test conducted after 56 days of calcium leaching. The porosity, total pore area, total intrusion volume, average pore diameter, and median pore diameter are listed for the AMF10FA10 leached in the X, Y, and Z directions. Compared to the sample leached in the Z direction, it is visible that the sample leached in the X and Y direction exhibited a lower porosity, total pore area, and total intrusion volume but a higher average pore diameter and median pore diameter. The reason for the porosity, pore area, and total intrusion volume of the sample leached in the Z direction to be lower could be associated with the lower porosity before calcium leaching compared to the other directions. The increments in average pore diameter and median pore diameter of the sample leached in the Z direction suggest that more calcium was leached in this direction than in the other two directions. The increased pore size is related to the dissolution of CH in pores. The reduction of CH content is also found in XRD and DTG-TG analysis, as discussed in the previous section. In addition, the results indicate the calcium leaching anisotropy of 3DPC in ammonium chloride solution.
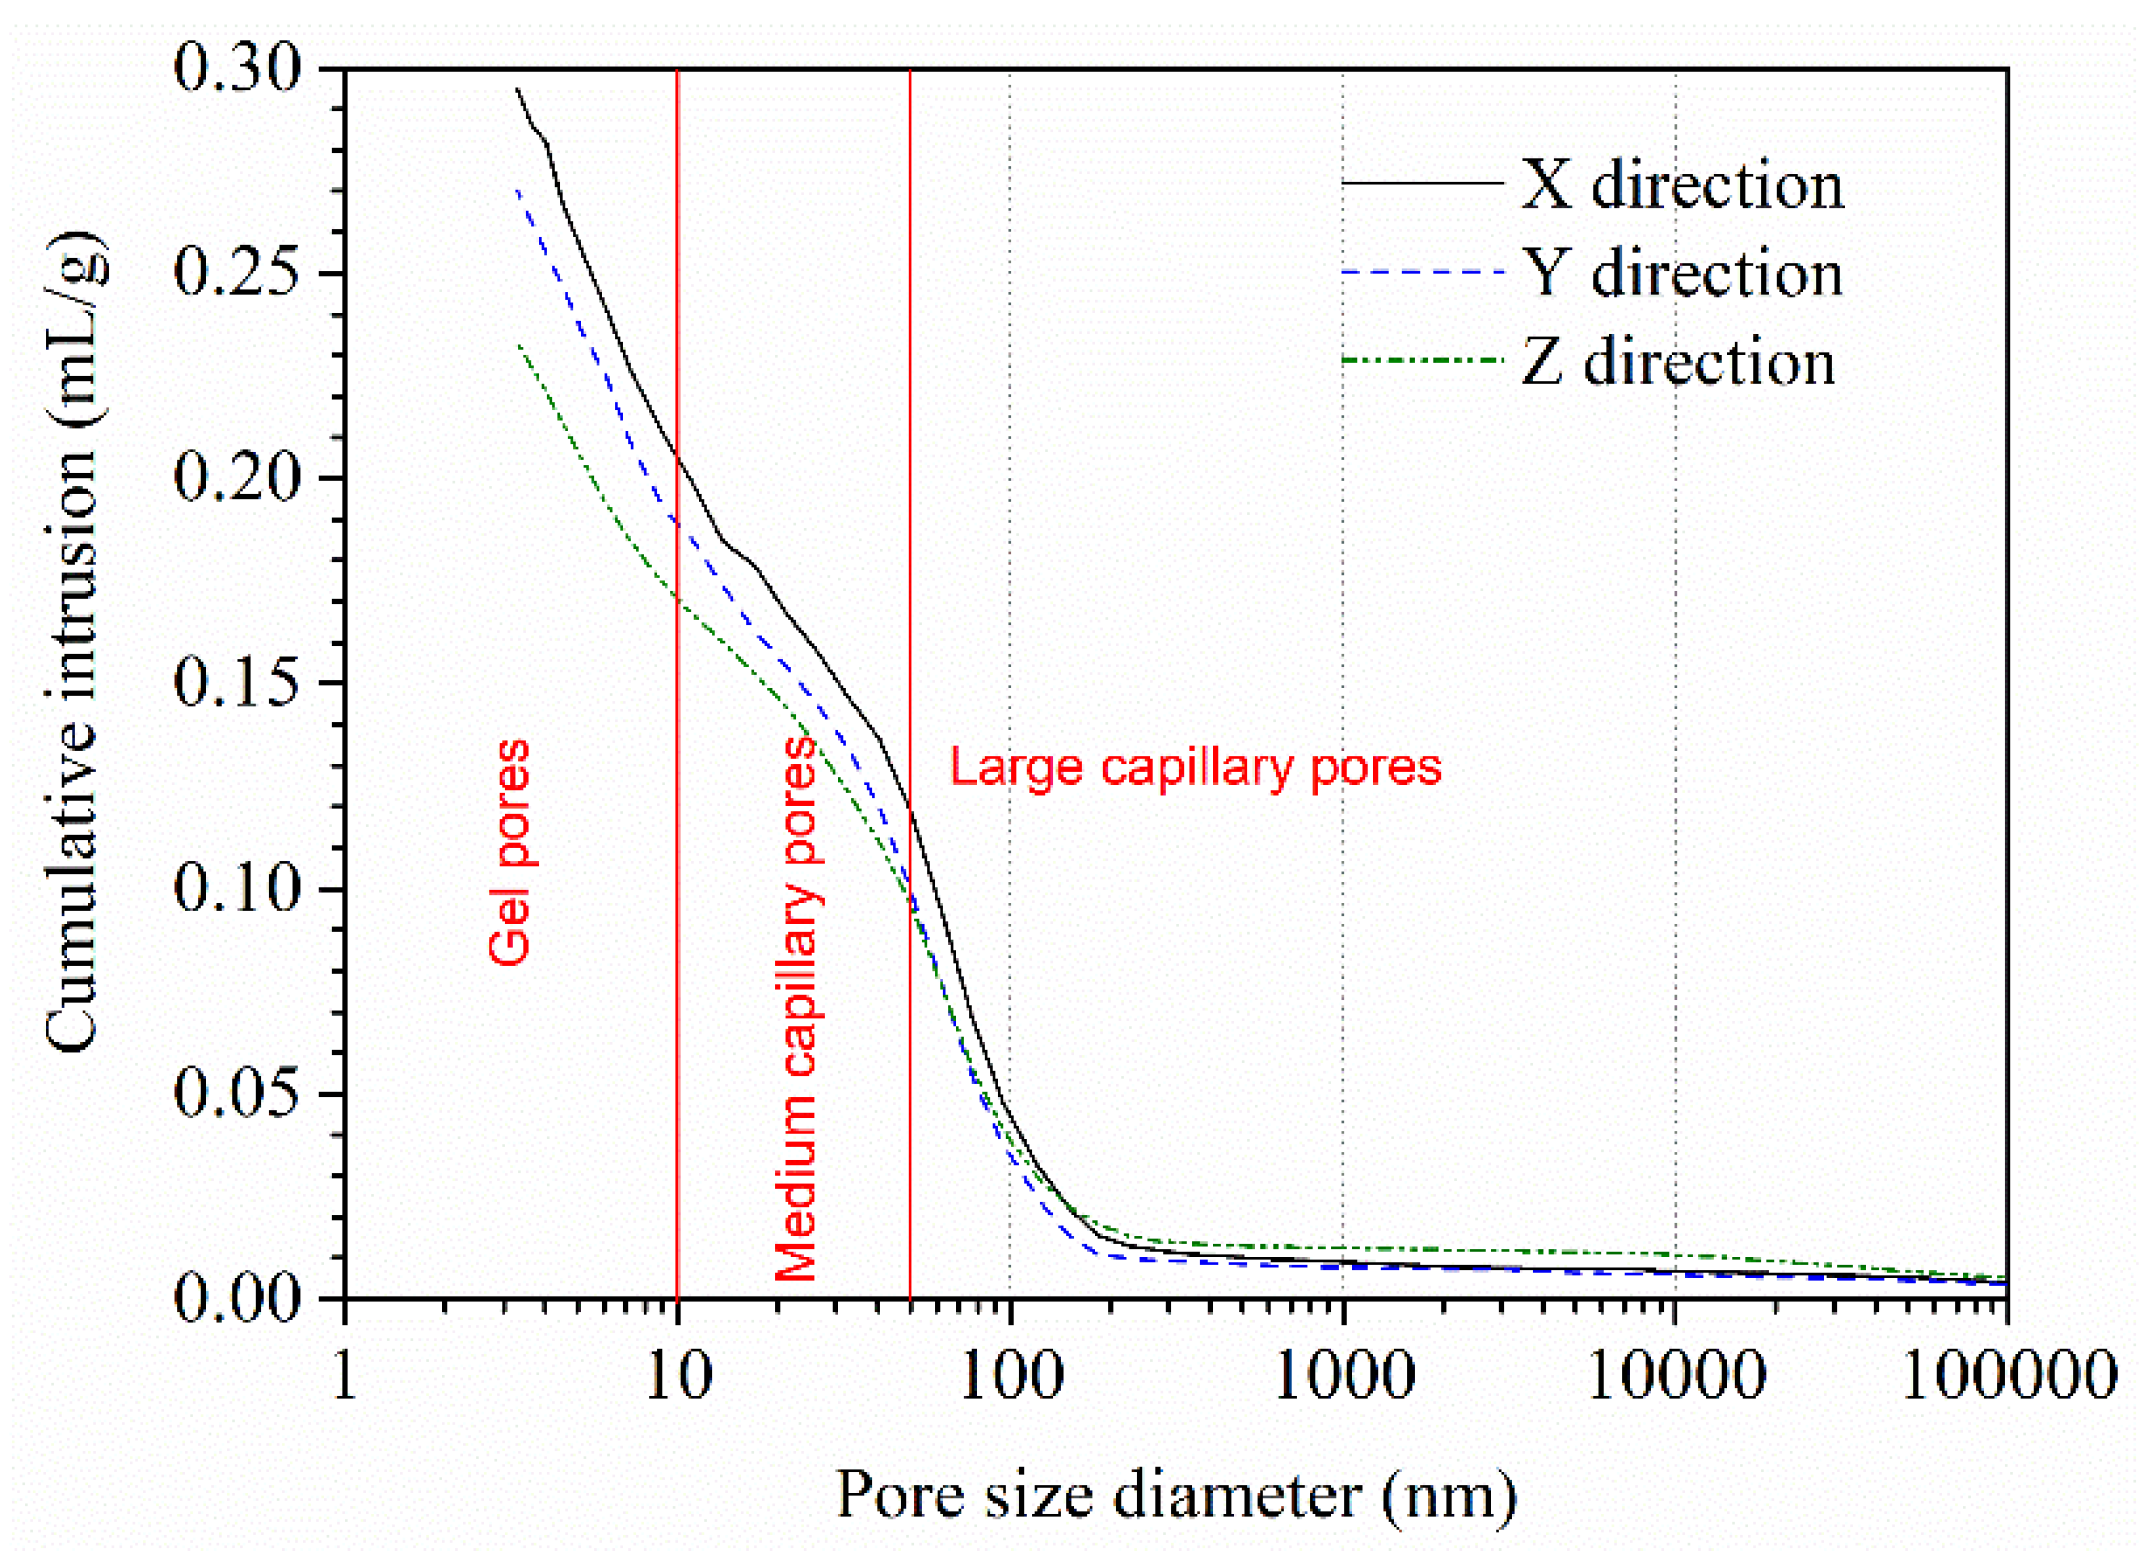
The cumulative intrusion curves of AMF10FA10 after calcium leaching for 56 days are presented in
Figure 14. It shows the relationship between cumulative intrusion and pore diameter in the 1–100000 nm range. Pores in concrete smaller than 10 nm, 10–50 nm, and greater than 50 nm are classified as gel, medium, and large capillary pores [
27]. The appearance of macro-pores, whose size is about the capillary pores, is due to the depletion of CH, while the appearance of micropores can be ascribed to the decalcification of C-S-H [
16]. As shown in this figure, the cumulative intrusion curves of all samples have the same general shape, and the initial pore entry diameter is no distinct difference. However, the total intrusion volume of the sample leached in the Z direction is about 0.233 mL/g, which is lower than 26.6% and 15.9% that of the sample leached in the X and Y direction, respectively. In addition, it is also observed that the gel pores and medium capillary pores of the sample leached in the Z direction are lower than that of the other two directions, while the large capillary pores larger than 150 nm are higher than that of the other two directions. More hydration products, such as CH and C-S-H, have been leached from the Z direction than from the other two. These results also confirmed the XRD and DTG/TG results showing less residual CH content in the Z direction than in the other two.
As discussed formerly, the test results of the XRD and DTG-TG analysis supported these conclusions. Furthermore, the more hydration products are leached, the greater the large capillary pores and, consequently, a lower compressive strength. The test results of MIP and compressive strength also confirmed this phenomenon.
5. Conclusions
This paper reported the test results of the 3DPC with AMF and FA exposed to NH4Cl solution. The influences of calcium leaching direction on the bulk density, water absorption, and leaching depths of 3DPC were examined, and the reason for the anisotropic performances was investigated by XRD, DTG-TG, and MIP analysis. The following conclusions are drawn from this investigation:
- (1)
The bulk density of 3DPC decreased with the leaching duration, and water absorption increased with the leaching duration.
- (2)
The 3DPC displays noteworthy calcium leaching anisotropic behavior in NH4Cl solution. 3DPC leached in the X direction shares a similar performance with that in the Y direction. The bulk density in the Z direction was higher than the X and Y direction, while the water absorption in the Z direction was lower than the other two directions; the leaching depths in the Z direction were lower than the X and Y direction; the compressive strength of samples unleached in the Z direction was higher than the X and Y direction. However, the compressive strength of samples leached in the Z direction was lower than in the other two directions; the compressive anisotropy coefficients of all leached samples showed a significantly increased trend.
- (3)
Hydration products, such as CH and C-S-H, leached from the pore defects, fundamentally contribute to the performance anisotropy of 3DPC.
- (4)
XRD analysis showed that the surface layer of 3DPC leached in the Z direction has less CH than that leached in the X or Y direction. DTG-TG analysis confirmed these results.
- (5)
The porosity of 3DPC leached in the Z direction is less than that of leached in the X and Y directions. In contrast, the average and median pore diameter leached in the Z direction is higher than in the other two directions. This is the fundamental reason for the mechanical anisotropy of 3DPC after exposure to the NH4Cl solution.
Author Contributions
Conceptualization, Huashan Yang; methodology, Yujun Che; investigation, Huashan Yang; resources, Jie Luo; writing—original draft preparation, Huashan Yang and Yujun Che; writing—review and editing, Huashan Yang. All authors have read and agreed to the published version of the manuscript.
Funding
This research was funded by the Guizhou Provincial Science and Technology Foundation, grant number [2020]1Y251, the Guizhou Key Laboratory of Inorganic Nonmetallic Functional Materials, grant number [2022]012, and the National Natural Science Foundation of China, grant number 51669004.
Data Availability Statement
Data will be made available on request.
Conflicts of Interest
The authors declare no conflict of interest.
References
- Heukamp, F.H.; Ulm, F.J.; Germaine, J.T. Poroplastic properties of calcium-leached cement-based materials. Cem Concr Res 2003, 33, 1155–1173. [Google Scholar] [CrossRef]
- Zhang, W.; Shi, D.; Shen, Z.; Shao, W.; Gan, L.; Yuan, Y.; et al. Reduction of the calcium leaching effect on the physical and mechanical properties of concrete by adding chopped basalt fibers. Constr Build Mater 2023, 365, 1–18. [Google Scholar] [CrossRef]
- Matte, V.; Moranville, M. Durability of reactive powder composites: Influence of silica fume on the leaching properties of very low water/binder pastes. Cem Concr Compos 1999, 21, 1–9. [Google Scholar] [CrossRef]
- Gaitero, J.J.; Campillo, I.; Guerrero, A. Reduction of the calcium leaching rate of cement paste by addition of silica nanoparticles. Cem Concr Res 2008, 38, 1112–1118. [Google Scholar] [CrossRef]
- C. R. Lu, H. Yang, W.B. Liu, G.X. Mei, H. Wang, X.L. Ge, Effect of fly ash on compressive strength degradation due to calcium leaching procedure. Adv Cem Res 2014, 26, 137–144. [Google Scholar] [CrossRef]
- Jain, J.; Neithalath, N. Analysis of calcium leaching behavior of plain and modified cement pastes in pure water. Cem Concr Compos 2009, 31, 176–185. [Google Scholar] [CrossRef]
- Catinaud, S.; Beaudoin, J.J.; Marchand, J. Influence of limestone addition on calcium leaching mechanisms in cement-based materials. Cem Concr Res 2000, 30, 1961–1968. [Google Scholar] [CrossRef]
- Seetharam, S.C.; Patel, R.A.; Perko, J.; Jacques, D. Quantification of leaching kinetics in OPC mortars via a mesoscale model. Constr Build Mater 2018, 180, 614–628. [Google Scholar] [CrossRef]
- Haga, K.; Shibata, M.; Hironaga, M.; Tanaka, S.; Nagasaki, S. Change in pore structure and composition of hardened cement paste during the process of dissolution. Cem Concr Res 2005, 35, 943–950. [Google Scholar] [CrossRef]
- Xiao, J.Z.; Liu, H.R.; Ding, T. Finite element analysis on the anisotropic behavior of 3D printed concrete under compression and flexure. Addit Manuf 2021, 39, 1–17. [Google Scholar] [CrossRef]
- Wang, L.; Tian, Z.H.; Ma, G.W.; Zhang, M. Interlayer bonding improvement of 3D printed concrete with polymer modified mortar: Experiments and molecular dynamics studies. Cem Concr Compos 2020, 110, 1–13. [Google Scholar] [CrossRef]
- Kruger, J.; Plessis, A.D.; van Zijl, G. An investigation into the porosity of extrusion-based 3D printed concrete. Addit Manuf 2021, 37, 1–13. [Google Scholar] [CrossRef]
- Liu, H.; Liu, C.; Wu, Y.; Bai, G.; He, C.; Yao, Y.; et al. 3D printing concrete with recycled coarse aggregates: The influence of pore structure on interlayer adhesion. Cem Concr Compos 2022, 134, 1–18. [Google Scholar] [CrossRef]
- Liu, H.; Liu, C.; Wu, Y.; Bai, G.; He, C.; Zhang, R.; et al. Hardened properties of 3D printed concrete with recycled coarse aggregate. Cem Concr Res 2022, 159, 1–18. [Google Scholar] [CrossRef]
- Dangla, P.; Thiery, M.; Morandeau, A. Thermodynamic of incongruent solubility of C-S-H. Adv Cem Res 2015, 27, 601–609. [Google Scholar] [CrossRef]
- Carde, C.; Francois, R.; Torrenti, J.M. Leaching of both calcium hydroxide and C-S-H from cement paste: Modeling the mechanical behavior. Cem Concr Res 1996, 26, 1257–1268. [Google Scholar] [CrossRef]
- Mainguy, M.; Tognazzi, C.; Torrenti, J.M.; Adenot, F. Modelling of leaching in pure cement paste and mortar. Cem Concr Res 2000, 30, 83–90. [Google Scholar] [CrossRef]
- Mainguy, M.; Coussy, O. Propagation fronts during calcium leaching and chloride penetration. J Eng Mech-ASCE 2000, 126, 250–257. [Google Scholar] [CrossRef]
- Kamali, S.; Gerard, B.; Moranville, M. Modelling the leaching kinetics of cement-based materials - influence of materials and environment. Cem Concr Compos 2003, 25, 451–458. [Google Scholar] [CrossRef]
- Tri, P.Q.; Maes, N.; Jacques, D.; De Schutter, G.; Ye, G. Investigation of the changes in microstructure and transport properties of leached cement pastes accounting for mix composition. Cem Concr Res 2016, 79, 217–234. [Google Scholar] [CrossRef]
- Carde, C.; Francois, R. Effect of the leaching of calcium hydroxide from cement paste on mechanical and physical properties. Cem Concr Res 1997, 27, 539–550. [Google Scholar] [CrossRef]
- Duchesne, J.; E. J. Reardon, Measurement and prediction of portlandite solubility in alkali solutions. Cem Concr Res 1995, 25, 1043–1053. [Google Scholar] [CrossRef]
- Song, Z.J.; Liu, Y.Q.; Jiang, L.H.; Guo, M.Z.; Chen, J.G.; Wang, W.Y.; Xu, N. Determination of calcium leaching behavior of cement pastes exposed to ammonium chloride aqueous solution via an electrochemical impedance spectroscopic approach. Constr Build Mater 2019, 196, 267–276. [Google Scholar] [CrossRef]
- Ye, J.H.; Cui, C.; Yu, J.T.; Yu, K.Q.; Dong, F.Y. Effect of polyethylene fiber content on workability and mechanical-anisotropic properties of 3D printed ultra-high ductile concrete. Constr Build Mater 2021, 281, 1–14. [Google Scholar] [CrossRef]
- Bonavetti, V.L.; Rahhal, V.F.; Irasser, E.F. Studies on the carboaluminate formation in limestone filler-blended cements. Cem Concr Res 2001, 31, 853–859. [Google Scholar] [CrossRef]
- Sawicz, Z.; Heng, S.S. Durability of concrete with addition of limestone powder. Mag Concr Res 1996, 48, 131–137. [Google Scholar] [CrossRef]
- Zhang, M.H.; Islam, J.; Peethamparan, S. Use of nano-silica to increase early strength and reduce setting time of concretes with high volumes of slag. Cem Concr Compos 2012, 34, 650–662. [Google Scholar] [CrossRef]
Figure 1.
Typical scanning electron microscopy (SEM) images of 3DPC. (a) High-volume fraction of hydration products in pores, (b) CH in pores with large size.
Figure 1.
Typical scanning electron microscopy (SEM) images of 3DPC. (a) High-volume fraction of hydration products in pores, (b) CH in pores with large size.
Figure 2.
Degradation process of 3DPC. (a) X direction or Y direction and (b) Z direction.
Figure 2.
Degradation process of 3DPC. (a) X direction or Y direction and (b) Z direction.
Figure 3.
(a) SEM image and (b) X-ray diffractogram of AMF.
Figure 3.
(a) SEM image and (b) X-ray diffractogram of AMF.
Figure 4.
Figure 4. (a) SEM image and (b) X-ray diffractogram of FA.
Figure 4.
Figure 4. (a) SEM image and (b) X-ray diffractogram of FA.
Figure 5.
Calcium leaching/loading direction and the representative zone used for XRD, DTG-TG, and MIP analysis.
Figure 5.
Calcium leaching/loading direction and the representative zone used for XRD, DTG-TG, and MIP analysis.
Figure 6.
A typical cross-section of a sample after calcium leaching for 56 days.
Figure 6.
A typical cross-section of a sample after calcium leaching for 56 days.
Figure 7.
Bulk density of samples as a function of the calcium leaching duration (samples cured for 28 days before calcium leaching). (a) AMF0FA20 and (b) AMF10FA10.
Figure 7.
Bulk density of samples as a function of the calcium leaching duration (samples cured for 28 days before calcium leaching). (a) AMF0FA20 and (b) AMF10FA10.
Figure 8.
Water absorption of cement pastes as a function of the calcium leaching duration (samples cured for 28 days before calcium leaching). (a) AMF0FA20 and (b) AMF10FA10.
Figure 8.
Water absorption of cement pastes as a function of the calcium leaching duration (samples cured for 28 days before calcium leaching). (a) AMF0FA20 and (b) AMF10FA10.
Figure 9.
Leaching depths of samples after 56 days of leaching.
Figure 9.
Leaching depths of samples after 56 days of leaching.
Figure 10.
Compressive strength of samples as a function of the calcium leaching duration (samples cured for 28 days before calcium leaching). (a) AMF0FA20 and (b) AMF10FA10.
Figure 10.
Compressive strength of samples as a function of the calcium leaching duration (samples cured for 28 days before calcium leaching). (a) AMF0FA20 and (b) AMF10FA10.
Figure 11.
X-ray diffractogram of AMF10FA10 after calcium leaching for 56 days. (i) X direction, (ii) Y direction, and (iii) Z direction.
Figure 11.
X-ray diffractogram of AMF10FA10 after calcium leaching for 56 days. (i) X direction, (ii) Y direction, and (iii) Z direction.
Figure 12.
DTG-TG curves of AMF10FA10 after calcium leaching for the 56 days.
Figure 12.
DTG-TG curves of AMF10FA10 after calcium leaching for the 56 days.
Figure 13.
CH contents and bound water contents of AMF10FA10 after calcium leaching for 56 days.
Figure 13.
CH contents and bound water contents of AMF10FA10 after calcium leaching for 56 days.
Figure 14.
Cumulative intrusion curves of AMF10FA10 after 56 days of calcium leaching.
Figure 14.
Cumulative intrusion curves of AMF10FA10 after 56 days of calcium leaching.
Table 1.
Chemical composition of materials used.
Table 1.
Chemical composition of materials used.
| Composition |
PC (%) |
AMF (%) |
FA (%) |
| SiO2
|
18.24 |
4.45 |
49.90 |
| Al2O3
|
4.20 |
1.21 |
18.90 |
| Fe2O3
|
3.70 |
0.44 |
4.16 |
| CaO |
64.23 |
50.99 |
13.47 |
| MgO |
2.60 |
0.57 |
1.71 |
| Na2O |
0.11 |
0.03 |
1.87 |
| K2O |
0.77 |
0.08 |
3.28 |
| TiO2
|
0.37 |
0.08 |
0.89 |
| SO3
|
3.53 |
0.08 |
0.20 |
| P2O5
|
0.07 |
0.02 |
1.37 |
| CO2
|
1.92 |
41.99 |
2.78 |
| Others |
0.27 |
0.03 |
1.48 |
Table 2.
Mix proportion of mixtures.
Table 2.
Mix proportion of mixtures.
| Mixture |
AMF0FA20 |
AMF10FA10 |
| PC (%) |
80 |
80 |
| FA (%) |
20 |
10 |
| AMF (%) |
0 |
10 |
| NS (%) |
1 |
1 |
| SP (%) |
0.025 |
0.06 |
| HPMC (%) |
0.15 |
0.15 |
| W/C |
0.27 |
0.27 |
Table 3.
Mechanical anisotropy coefficients of 3DPC after calcium leaching for the 28 and 56 days.
Table 3.
Mechanical anisotropy coefficients of 3DPC after calcium leaching for the 28 and 56 days.
| Mixture |
Calcium Leaching Duration (days) |
Compressive Strength Anisotropy Coefficient |
| IX |
IY |
IZ |
| AMF0FA20 |
0 |
0.10 |
0.09 |
0.06 |
| AMF0FA20 |
28 |
0.27 |
0.26 |
0.51 |
| AMF0FA20 |
56 |
0.27 |
0.29 |
0.56 |
| AMF10FA10 |
0 |
0.17 |
0.10 |
0.13 |
| AMF10FA10 |
28 |
0.28 |
0.26 |
0.51 |
| AMF10FA10 |
56 |
0.11 |
0.11 |
0.17 |
Table 4.
Pore structures of AMF10FA10 after calcium leaching for the 56 days.
Table 4.
Pore structures of AMF10FA10 after calcium leaching for the 56 days.
| Item |
X direction |
Y direction |
Z direction |
| Porosity (%) |
37.74 |
36.00 |
31.99 |
| Total pore area (m2/g) |
89.42 |
81.14 |
64.57 |
| Total intrusion volume (mL/g) |
0.295 |
0.270 |
0.233 |
| Average pore diameter (nm) |
13.20 |
13.32 |
14.44 |
| Median pore diameter (nm) |
31.98 |
31.99 |
36.93 |
|
Disclaimer/Publisher’s Note: The statements, opinions and data contained in all publications are solely those of the individual author(s) and contributor(s) and not of MDPI and/or the editor(s). MDPI and/or the editor(s) disclaim responsibility for any injury to people or property resulting from any ideas, methods, instructions or products referred to in the content. |
© 2023 by the authors. Licensee MDPI, Basel, Switzerland. This article is an open access article distributed under the terms and conditions of the Creative Commons Attribution (CC BY) license (http://creativecommons.org/licenses/by/4.0/).
