Preprint
Article

Cuban Policosanol (Raydel®) Exhibited Potent Anti-inflammatory Activity in the Liver and Protection of the Ovary and Testis with an Improvement of Blood Lipid Profile by 12 Weeks Supplementation in Hyperlipidemic Zebrafish: Comparison Study of Efficacy with Three Chinese Policosanols

Altmetrics

Downloads

200

Views

139

Comments

0

This version is not peer-reviewed

Submitted:

13 July 2023

Posted:

14 July 2023

You are already at the latest version

Alerts
Abstract
Although many policosanols from different sources, such as sugar cane, rice bran, and insects, have been marketed worldwide, there has been no comparative study of the in vivo efficacy using a hyperlipidemic animal model. This study compared the efficacy of treating dyslipidemia with four different policosanols, including one sugar cane wax alcohol from Cuba (Raydel®) and three policosanols from China (Xi’an Natural sugar cane, Xi’an Realin sugar cane, and Shaanxi rice bran) in hyperlipidemic zebrafish. After 12 weeks of consumption of each policosanol (final 0.1% in diet, wt/wt) and high cholesterol diet (HCD, final 4%, wt/wt) in a tetrabit, the Raydel policosanol group and Xi’an Natural policosanol group showed the highest survivability of approximately 81%, whereas the Xi’an Realin policosanol group and Shaanxi policosanol group showed 57% and 67% survivability, respectively. Among five HCD groups, the Raydel policosanol group showed the lowest serum total cholesterol (TC, p<0.001 versus HCD control) and triglyceride (TG, p<0.001 versus HCD control) with the highest percentage of high-density lipoproteins (HDL)-C in TC. The Raydel policosanol group also showed the lowest serum aspartate aminotransferase (AST) and alanine aminotransferase (ALT) levels with the least infiltration of inflammatory cells and interleukin-6 production in hepatocytes. In the ovary, the Raydel policosanol group also showed the highest contents of mature vitellogenic oocytes with the lowest production of reactive oxygen species and cellular apoptosis in ovarian cells. In the testis, the Raydel policosanol group also showed the healthiest morphology for spermatogenesis with the least interstitial area and reactive oxygen species (ROS) production in testicular cells. In conclusion, 12 weeks of Raydel policosanol consumption resulted in remarkable improvement of the blood lipid profile, amelioration of inflammation in the liver, and enhancement of the cell morphology in the ovary and testis with the highest survivability under the HCD.
Keywords: 
Subject: Biology and Life Sciences  -   Life Sciences

1. Introduction

A higher HDL-C quantity and improved HDL quality have been associated with healthy human longevity [1,2] through enhanced antioxidant and anti-inflammatory activities in the blood [3,4]. Dyslipidemia, however, particularly low levels of serum high-density lipoproteins cholesterol (HDL-C), is a major risk factor for metabolic syndrome [5], combination of hypertension [6] and diabetes [7], and dementia [8]. Dyslipidemia and diabetes are also frequently linked with oxidative stress and glycation stress [9], chronic inflammation [10], and sexual dysfunction [11]. In particular, erectile dysfunction [12] and unexplained female infertility [13] have shown strong associations with dyslipidemia and diabetes, such as low HDL-C.
Many pharmaceuticals, such as CETP inhibitors [14], and functional foods [15], such as policosanol, have been developed and marketed to increase the HDL-C levels [16]. Policosanol is a mixture of aliphatic alcohols, ranging from 24–34 carbon atoms [17], such as octacosanol, triacontanol, dotriacontanol, hexacosanol, and tetratriacontanol as the major components, which were purified from sugar cane (Saccharum officinarum L.) wax [18] or various plants, such as oats [19] and barley [20], insects [21], and bees wax [22]. Many policosanols have been purified from various plant sources, such as sugar cane, rice bran [23,24], wheat germ [20], and barley sprouts [20]. Despite the diversity of policosanols, there are no reports comparing the efficacy in treating dyslipidemia and anti-inflammatory activities among the various sources and origins of policosanol.
Cuban policosanol (Raydel®) has been used to treat blood dyslipidemia, hypercholesterolemia [25,26], hypertension [27,28], and Alzheimer’s disease [29] by increasing the HDL-C and lowering the LDL-C with the removal of amyloid plaque in the brain [29]. In the preceding paper [30], a reconstituted HDL containing Cuban policosanol exhibited the largest particle size and the highest antioxidant, anti-glycation, and anti-inflammatory activity. In contrast, three Chinese policosanols did not exhibit beneficial activity [30]. Except for Cuban policosanol, there is insufficient information on the physiological effects of policosanol on the lipid profile and the extent of inflammation in hyperlipidemic animal models. Furthermore, no information is available on the hidden toxicities and influences on the hepato-endocrinological system and reproduction system by policosanol consumption under hyperlipidemia.
A zebrafish (Danio rerio) model displaying induction of hypercholesterolemia by a high-cholesterol diet (HCD) supplementation were used to mimic dyslipidemia and hepatic inflammation, as suggested by a previous report, and compare the physiological efficacy [31,32]. Adult zebrafish consuming a HCD for several weeks showed the induction of atherosclerosis symptoms, including hypercholesterolemia, lipoprotein oxidation, and fatty streak formation [33]. Hypercholesterolemic zebrafish is a useful experimental model to display liver damage [34], infiltration of neutrophils in hepatocytes, and fatty liver change, which can be ameliorated by consuming Cuban policosanol. Interestingly, hyperlipidemia and hepatic damage were linked with the impairment of the reproduction system with abrupt changes in sperm motility [35] and an increase in immature oocytes [36].
It is very interesting that there has been no study to compare the in vivo efficacy of various policosanols from different sources and origins regarding improving dyslipidemia, hepatic inflammation, and the reproduction system. Therefore, the current study was designed to compare the in vivo physiological effects of various policosanol under hyperlipidemia because there has been no sufficient information on policosanol efficacy on the lipid profile, antioxidant, and anti-inflammatory activities in the liver and other organs, such as the ovary and testis.

2. Results

2.1. Change of Survivability and Body Weight.

After 12 weeks of consumption, the normal diet (ND) group showed 97% survivability, whereas the HCD group, with high cholesterol in the diet (final 4%, wt./wt.), showed 61% survivability, suggesting that 4% cholesterol supplementation induced more acute death via progression of hyperlipidemia and hyperinflammation (Table 1). On the other hand, the PCO1 (Raydel) group and PCO2 (Xi’an Natural) group showed the highest survivability of approximately 81%, while the PCO3 (Xi’an Realin) group and PCO4 (Shaanxi) group showed lower survivability of 57% and 67%, respectively.
As shown in Table 1, the ND and HCD alone group showed a 1.8-fold and 2.3-fold increase in body weight (BW), respectively, after the 12 weeks of consumption from the baseline (week 0). Under HCD, the PCO1 group and PCO4 group showed a 1.9-fold (p<0.001) and 1.8-fold (p<0.001) increase in BW, while the PCO2 and PCO3 groups showed a 2.3-fold increase in BW. These results suggest that the Raydel policosanol group showed the highest survivability and the second lowest increase in BW during the 12 weeks. Interestingly, the PCO4 group showed the lowest increase in BW with lower survivability than the PCO1 group, suggesting that lower body weight was not associated with higher survivability.

2.2. Change in Blood Lipid Levels

After 12 weeks, the HCD control group showed the highest total cholesterol (TC, Figure 1A) and triglyceride (TG, Figure 1B), 794±18 mg/dL and 889±46 mg/dL, respectively, while the ND group showed 341±12 mg/dL and 244±10 mg/dL, respectively, suggesting that 4% cholesterol supplementation induced a 2.3-fold and 3.6-fold increase in blood TC and TG levels. On the other hand, the PCO1 group showed the lowest TC (425±7 mg/dL) and TG (518±15 mg/dL) levels up to 47% and 32% lower than the HCD alone group, respectively, while other policosanol groups showed up to 32% lower TC (PCO3 group) and 30% lower TG levels (PCO2 group). The Chinese policosanol groups showed weaker blood lipid lowering profiles in TC and TG than in the Cuban policosanol (PCO1) group.
The HCD group and ND group showed similar HDL-C levels of 217±4 mg/dL and 253±6 mg/dL, respectively (Figure 2A). On the other hand, the HCD group showed 50% lower HDL-C/TC (%) than the ND group (Figure 2B), because the ND group and HCD group showed 64% and 32% of HDL-C in the TC, respectively. Although the PCO1 group showed the 2nd highest serum HDL-C level (299±6 mg/dL, Figure 2A), it showed the highest percentage of HDL-C/TC of approximately 68% (Figure 2B). The PCO2 and PCO3 groups showed an adequate increase ratio of HDL-C/TC (%) of approximately 53% and 55%, respectively, while the PCO4 group showed the lowest HDL-C/TC (%) of 41%.
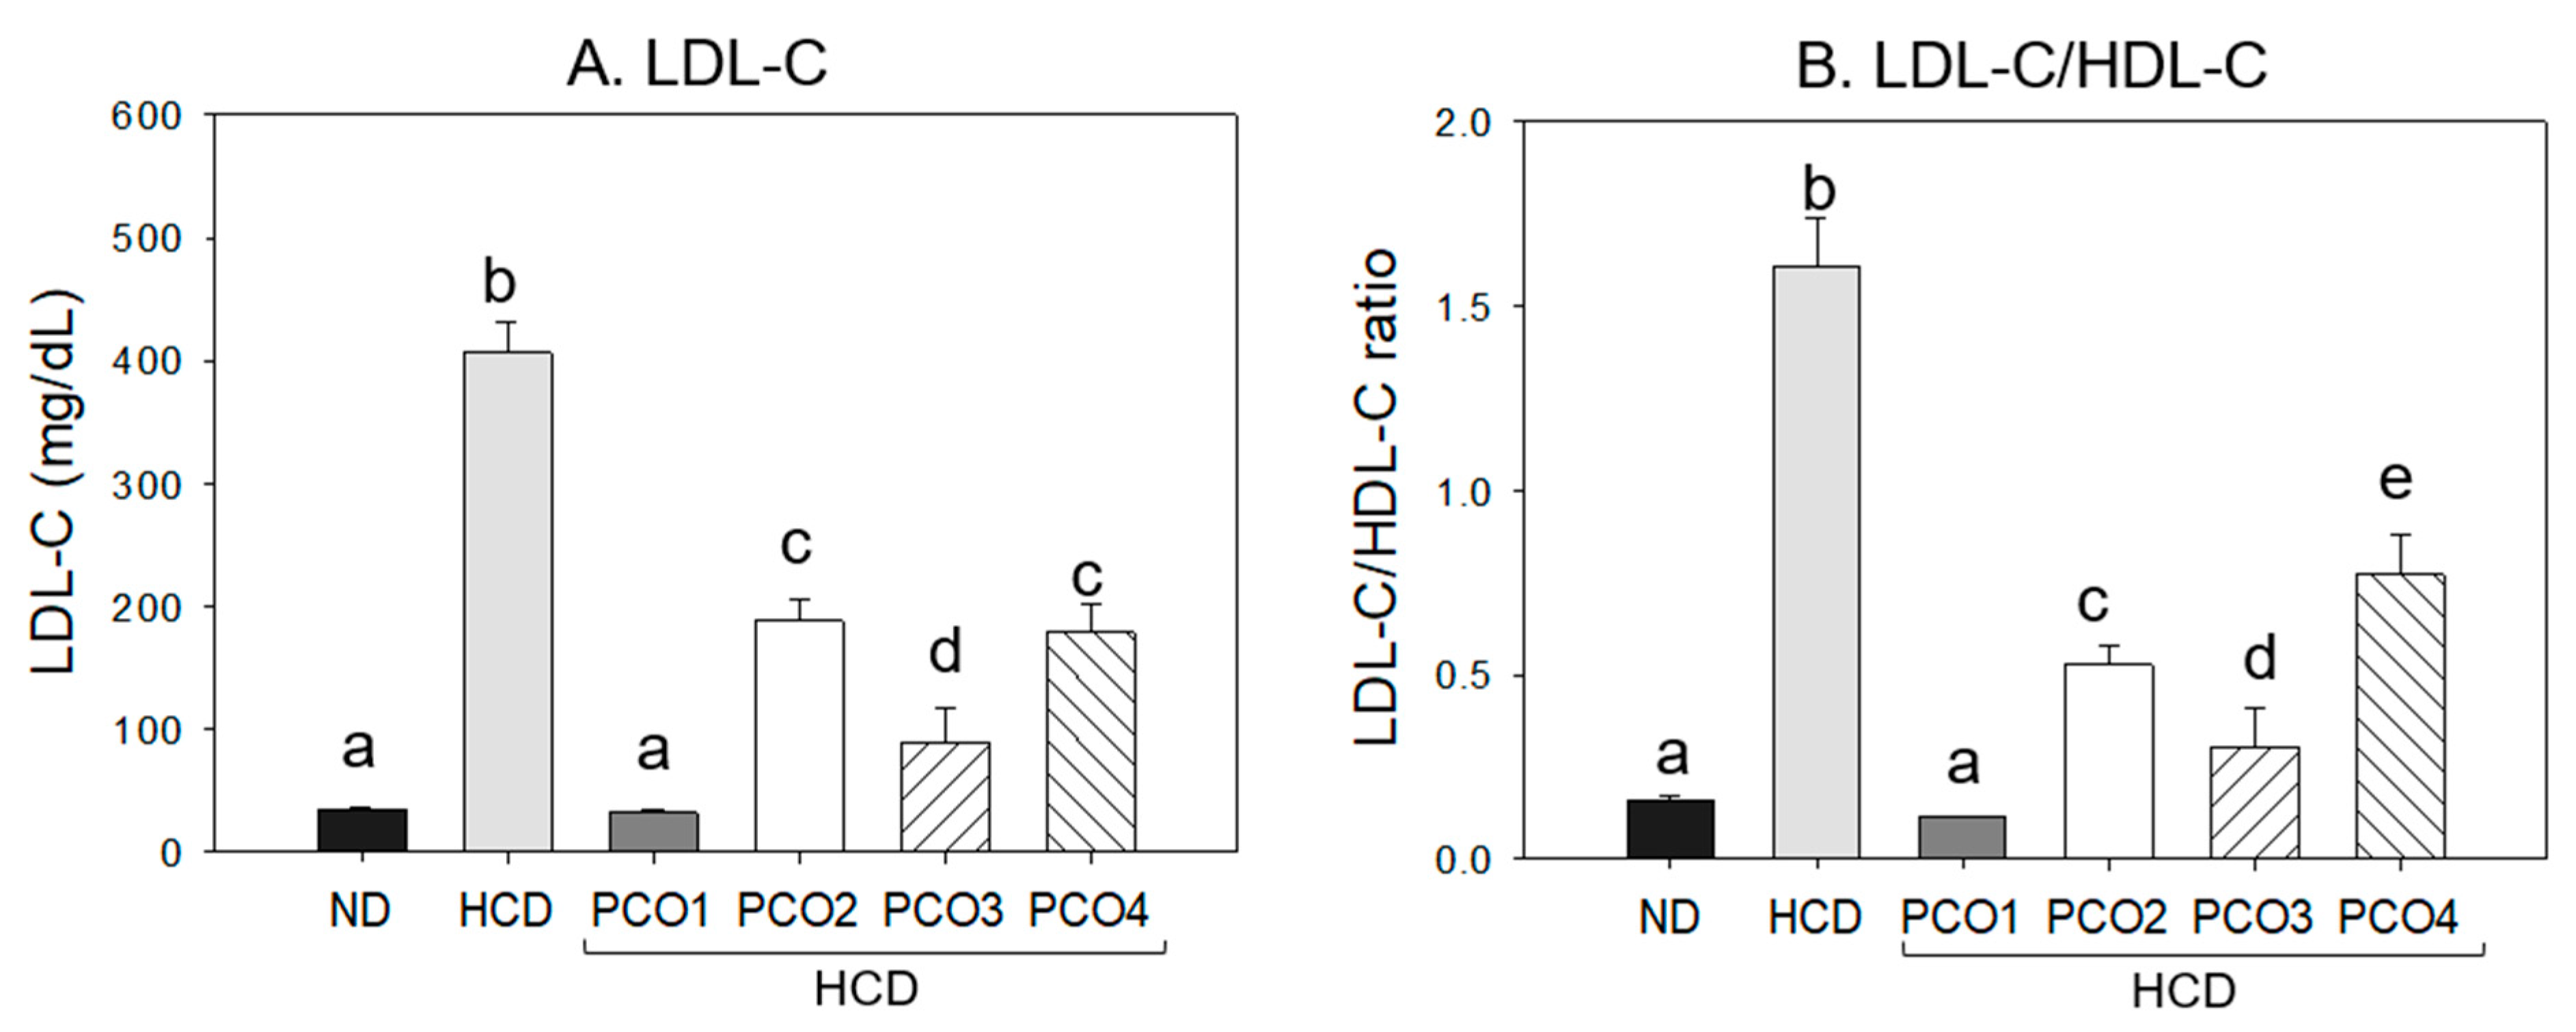
As shown in Figure 3A, the LDL-C level was elevated remarkably in the HCD group at approximately 406±24 mg/dL, while the ND group showed 34±3 mg/dL, suggesting that 4% cholesterol supplementation elevated the LDL-C level. Interestingly, the PCO1 group showed a remarkable decrease in LDL-C of approximately 32±2 mg/dL. This level is similar to the ND group, which showed the lowest level among the HCD-consumed groups. The other policosanol groups showed adequate activity to lower the LDL-C levels to around 90–187 mg/dL. The LDL-C:HDL-C (L:H) ratio was elevated in the HCD control group by approximately 1.6, while the ND group showed approximately 0.2 (Figure 3B), suggesting that HDL-C was the dominant lipid profile in zebrafish. On the other hand, the cholesterol supplementation caused an eight-fold increase in the L:H ratio, which was the LDL-C dominant lipid profile in zebrafish similar to the human lipid profile. After 12 weeks of consumption, the PCO1 group showed the lowest L:H of approximately 0.1, while the PCO2, PCO3, and PCO4 groups showed around 0.5, 0.3, and 0.8, respectively (Figure 3B).
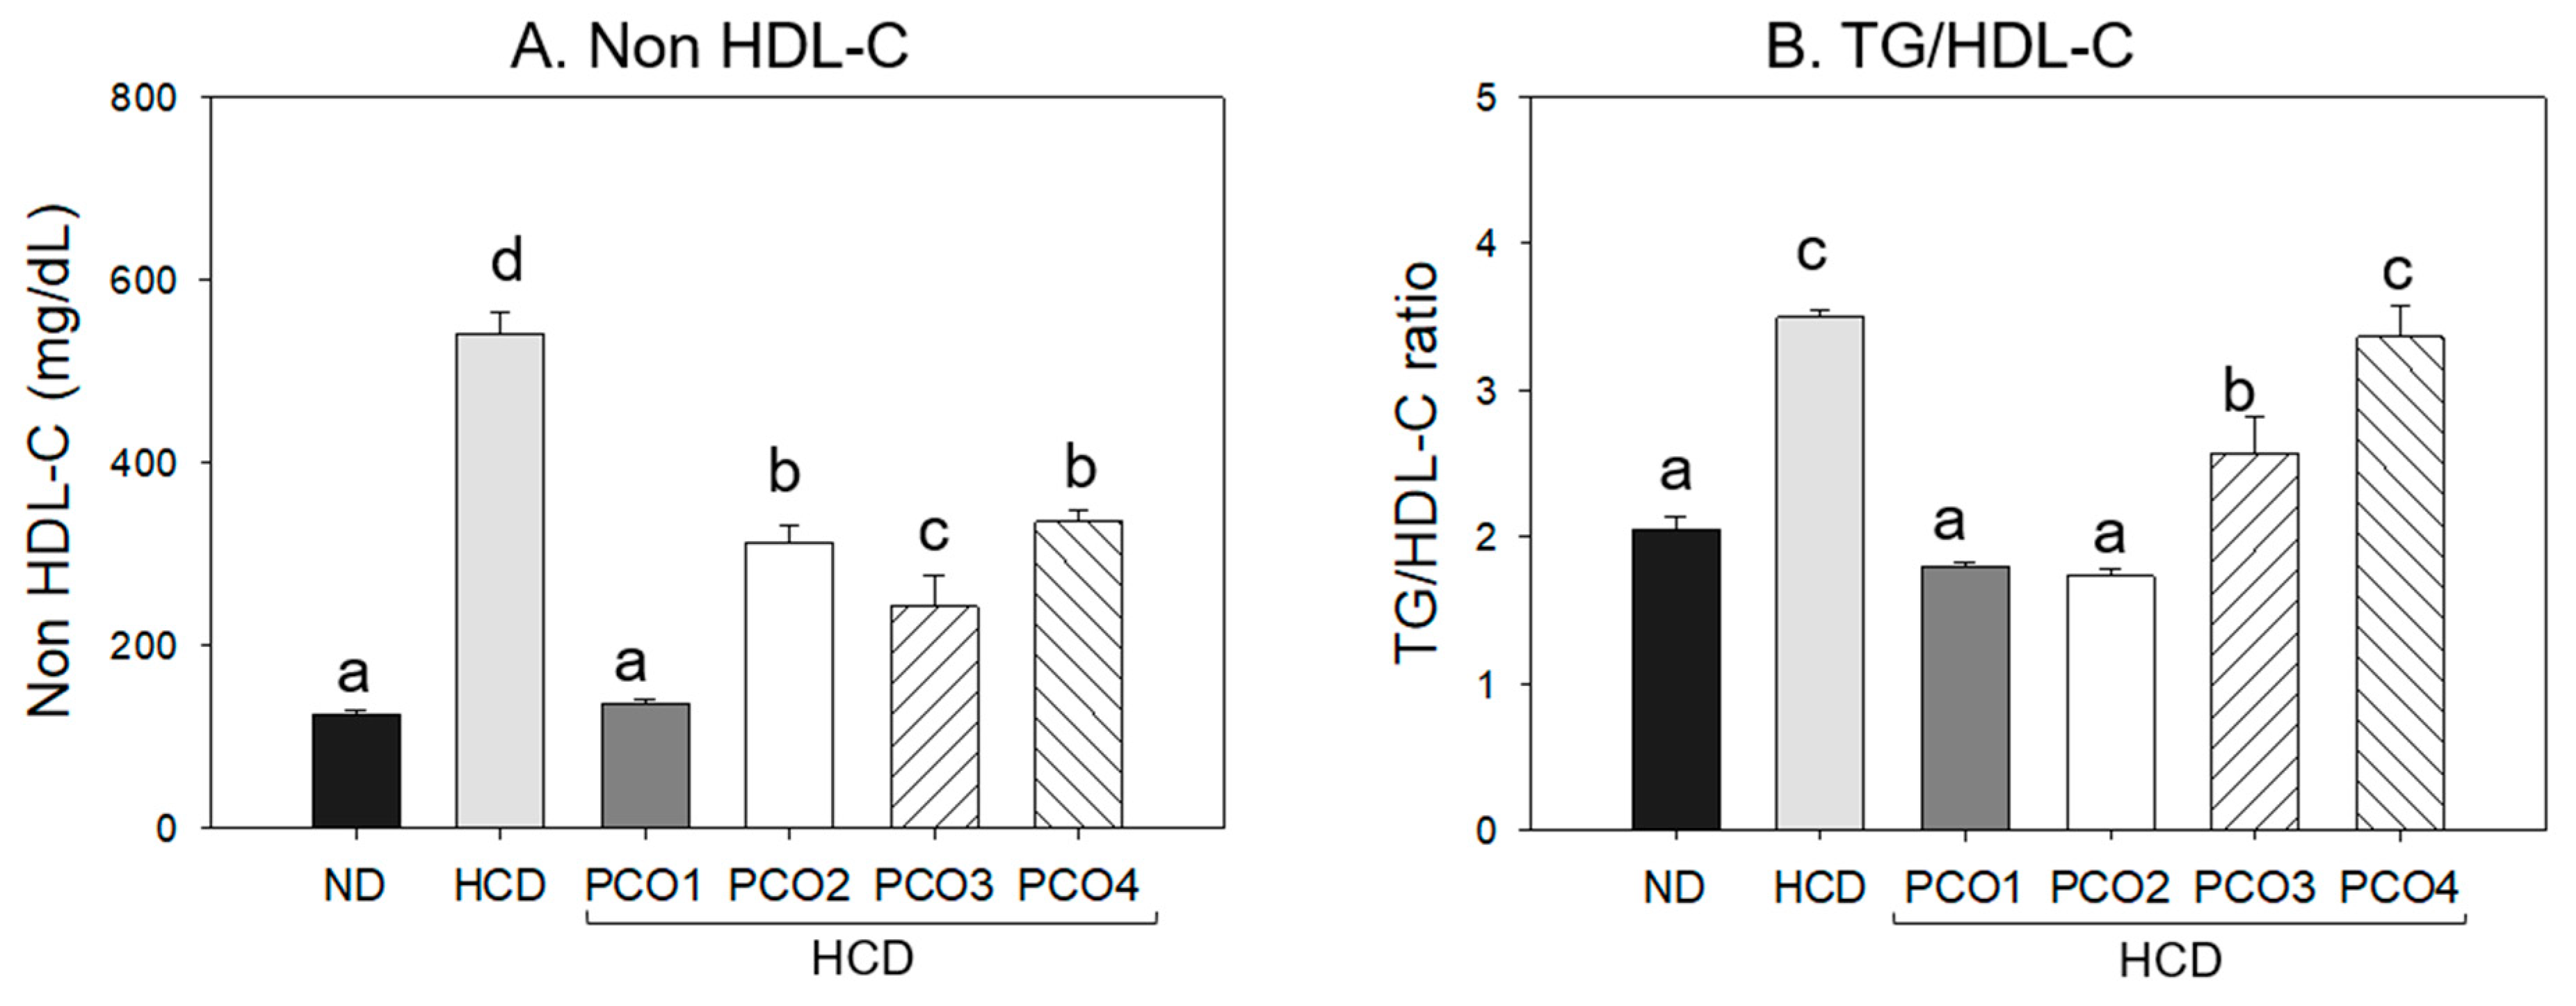
A calculation of the total amount of non-HDL-C showed that the HCD control group had a 4.4-fold higher level than the ND control group, suggesting that the cholesterol supplementation caused the elevation of non-HDL-C (Figure 4A). Interestingly, the PCO1 group showed the lowest level of non-HDL-C around 136±5 mg/dL. In contrast, the PCO4 group showed the highest non-HDL-C of approximately 335±13 mg/dL. The PCO2 and PCO3 group showed a higher non-HDL-C level than the PCO1 group, around 312±18 mg/dL and 242±34 mg/dL, respectively. These results suggest that only the Cuban policosanol group showed the most remarkable reduction of non-HDL-C (~75% lower than the HCD group). The other Chinese policosanol groups showed an adequate reduction of HDL-C, approximately 38–56% lower than that of the HCD control.
Calculations of the TG/HDL-C level showed that the PCO4 policosanol group showed the highest ratio of TG/HDL-C, around 3.4. In contrast, the HCD control group showed a similar level of approximately 3.5 (Figure 4B). The PCO1 and PCO2 groups showed the lowest TG/HDL-C level (~1.7–1.8), whereas the ND control group showed a TG/HDL-C ratio of approximately 2.1. The PCO3 group showed an approximately 2.6 lower TG/HDL-C ratio than the HCD control group, but the PCO4 group showed a similar level to the HCD control (~3.4). These results suggest that Cuban policosanol (Raydel®) consumption resulted in the highest HDL-C content in TC with the lowest L:H ratio and TG:HDL-C ratio. In contrast, the other Chinese policosanols showed weaker effects in increasing the HDL-C and HDL-C/TC (%).

2.3. Change of Hepatic Function Parameters

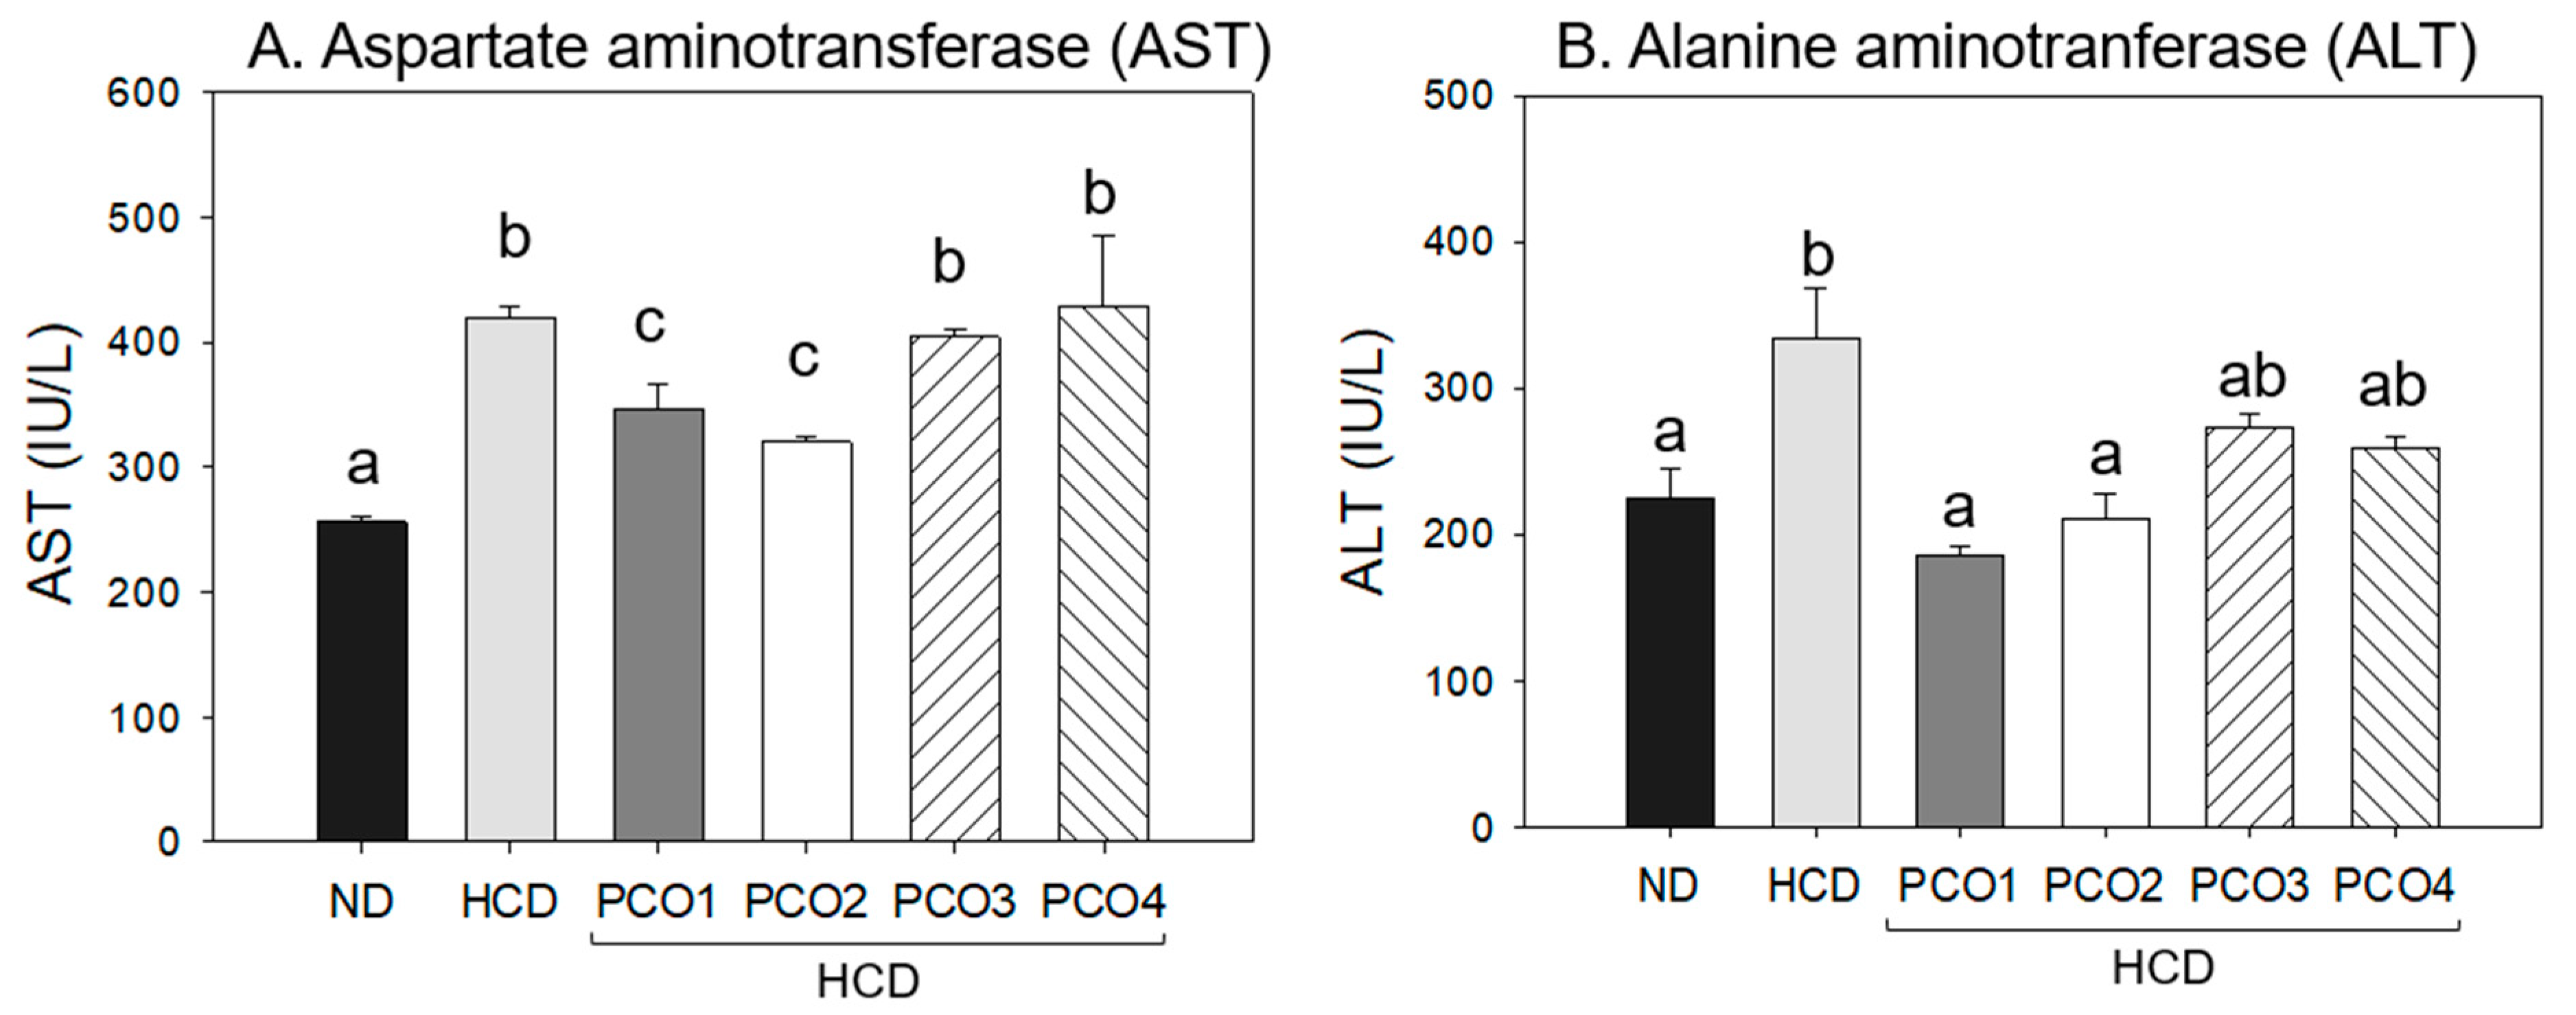
After 12 weeks consumption, the HCD control group showed 1.6-fold (p=0.024) and 1.5-fold (p=0.044) higher blood AST and ALT levels than those of the ND control group (Figure 5), suggesting that cholesterol (final 4%) supplementation-associated damage occurred in the liver and muscle. In the AST level, the three sugar cane policosanol groups (PCO1, PCO2, and PCO3) showed similar levels, which were lower than the rice bran policosanol group. The PCO1 and PCO2 policosanol groups showed 18% and 24% lower AST levels than the HCD control, and the PCO4 group showed higher levels than the HCD control (Figure 5A).
Although the HCD control group showed the highest blood ALT level, the PCO1 group showed the lowest level: 45% lower (p=0.010) than the HCD control (Figure 5B). The PCO2, PCO3, and PCO4 groups showed 27% (p=0.026), 18%, and 23% lower levels than the HCD control, respectively. Although all policosanol groups showed lower ALT levels than the HCD control group, the extent of the serum ALT levels differed according to the origins, suggesting that the hepatic protection activity of policosanol may vary depending on the composition of long-chain aliphatic alcohols. Cuban policosanol showed remarkably higher protection activity against hepatic damage from high cholesterol consumption, whereas Chinese policosanols, particularly Xi’an Realin and Shaanxi, did not show the protection activity.

2.4. Histopathological Analysis with Liver

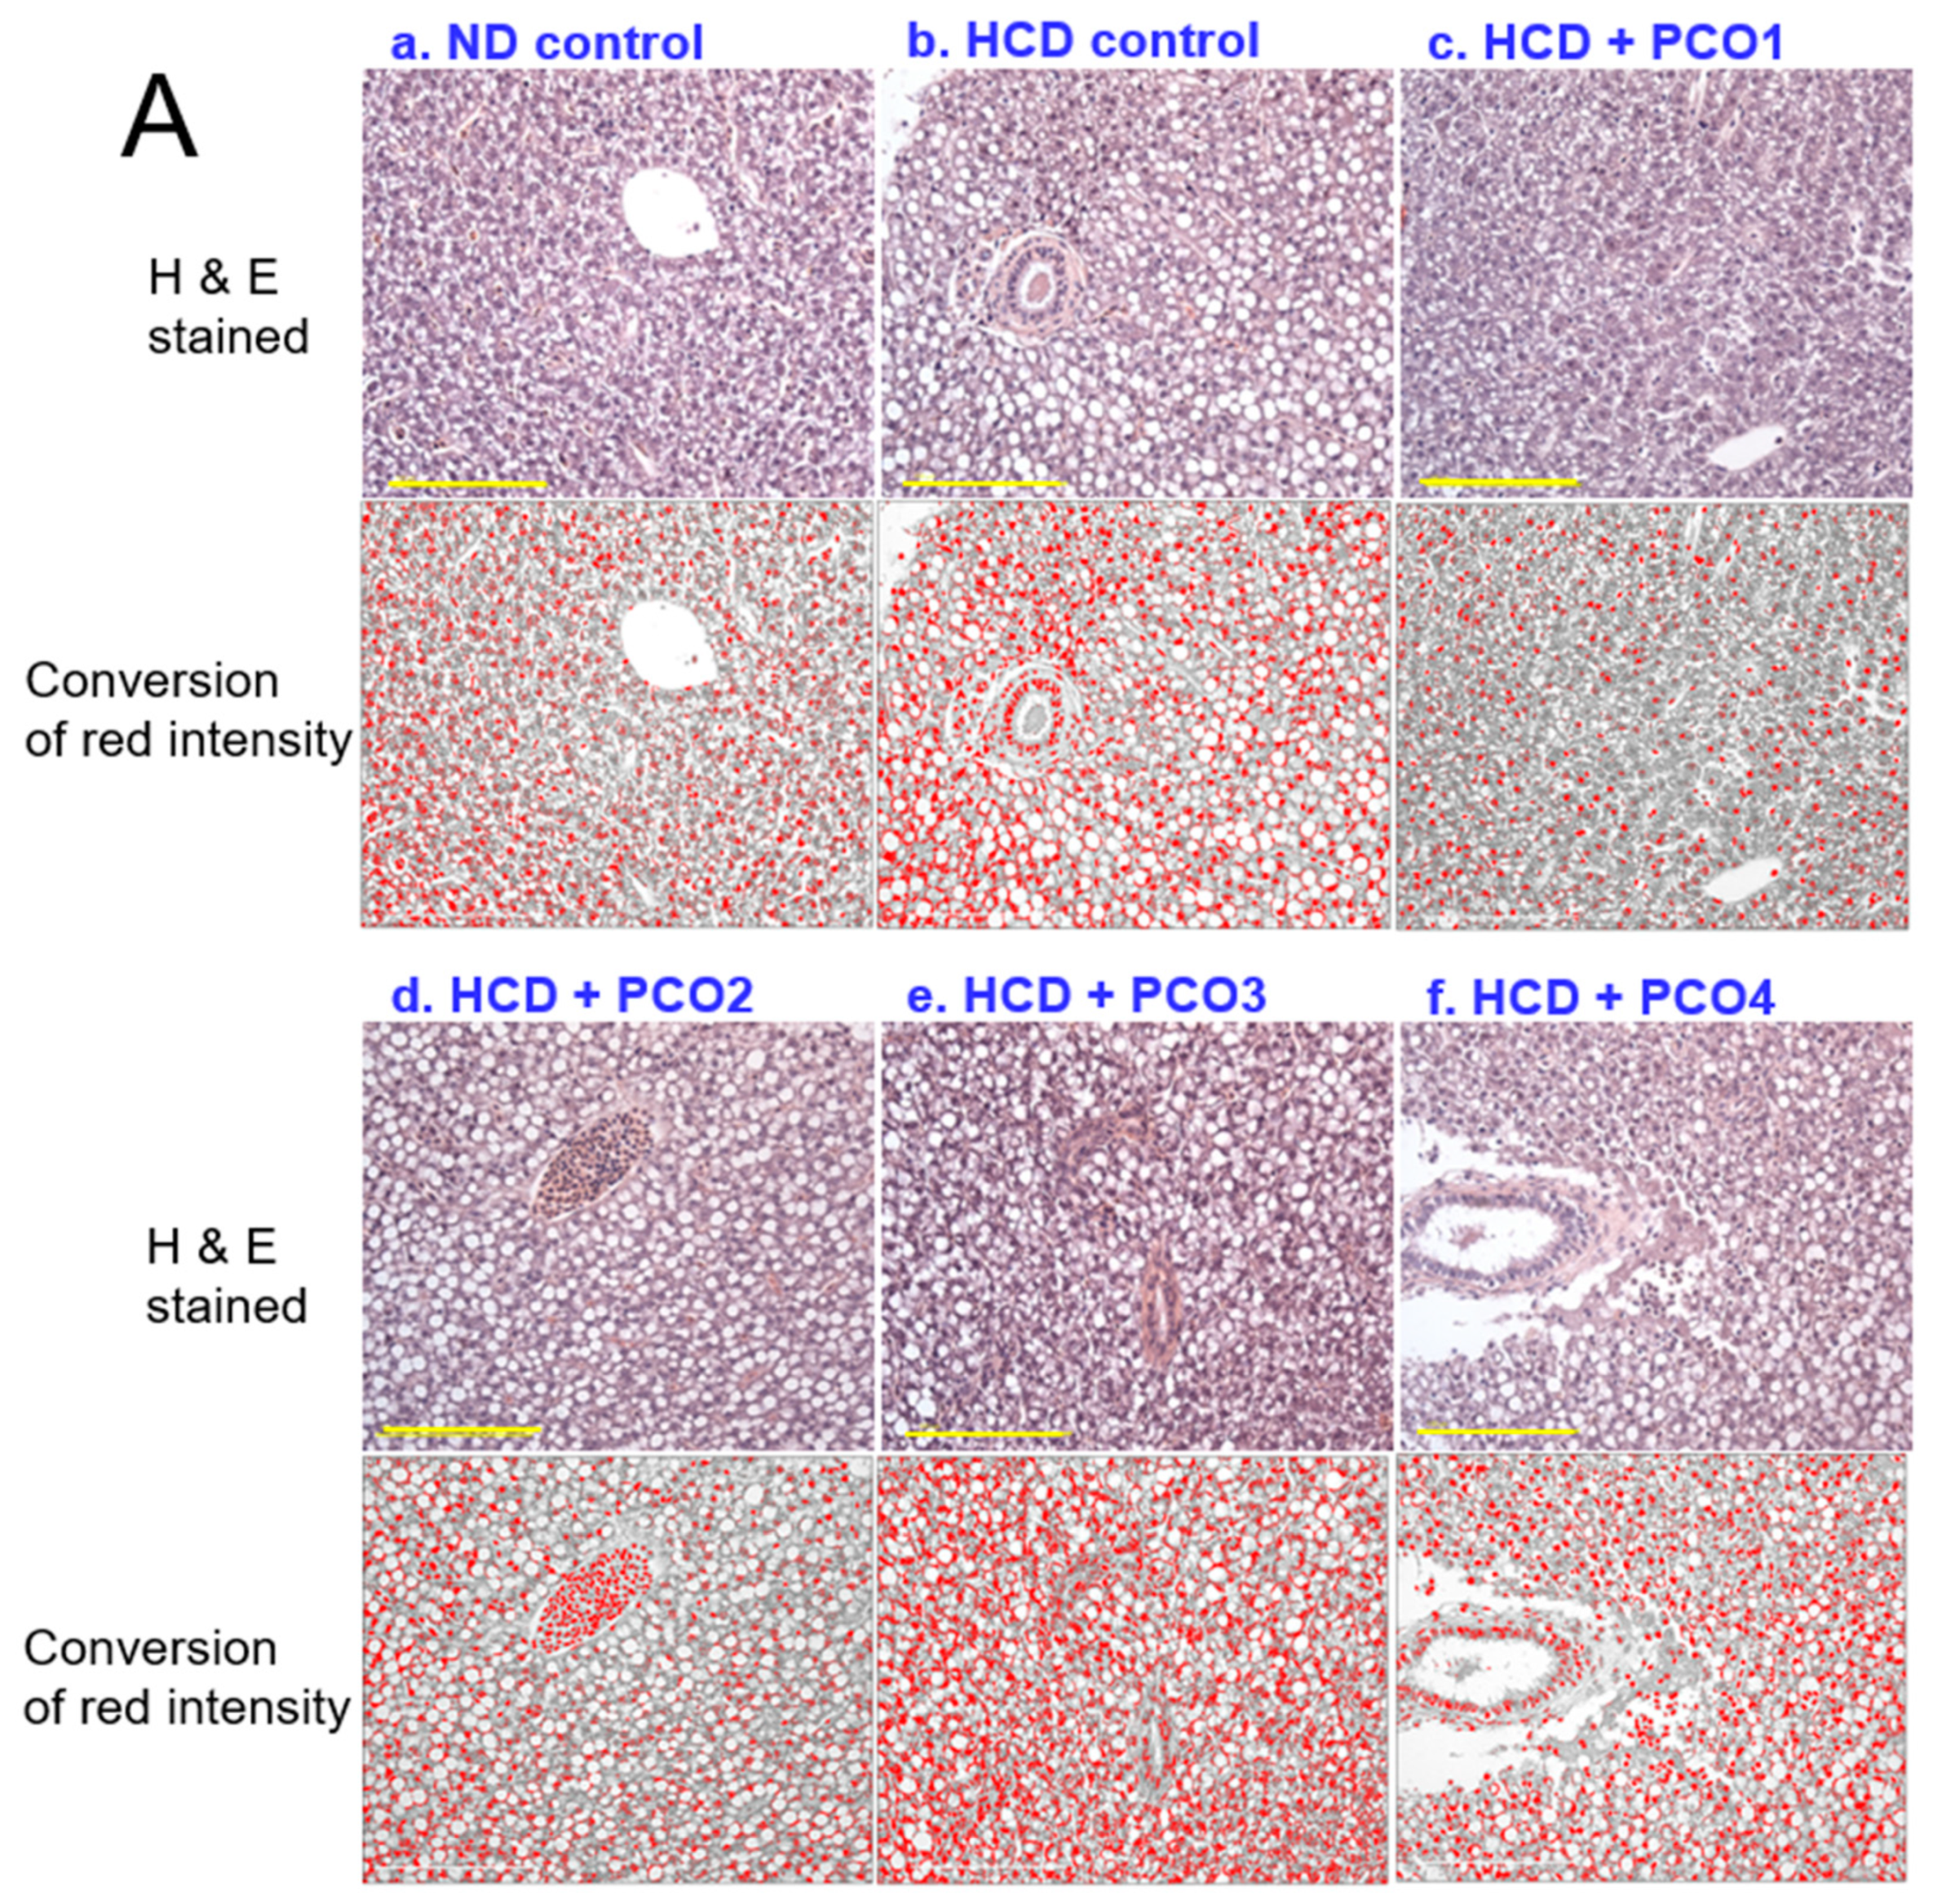
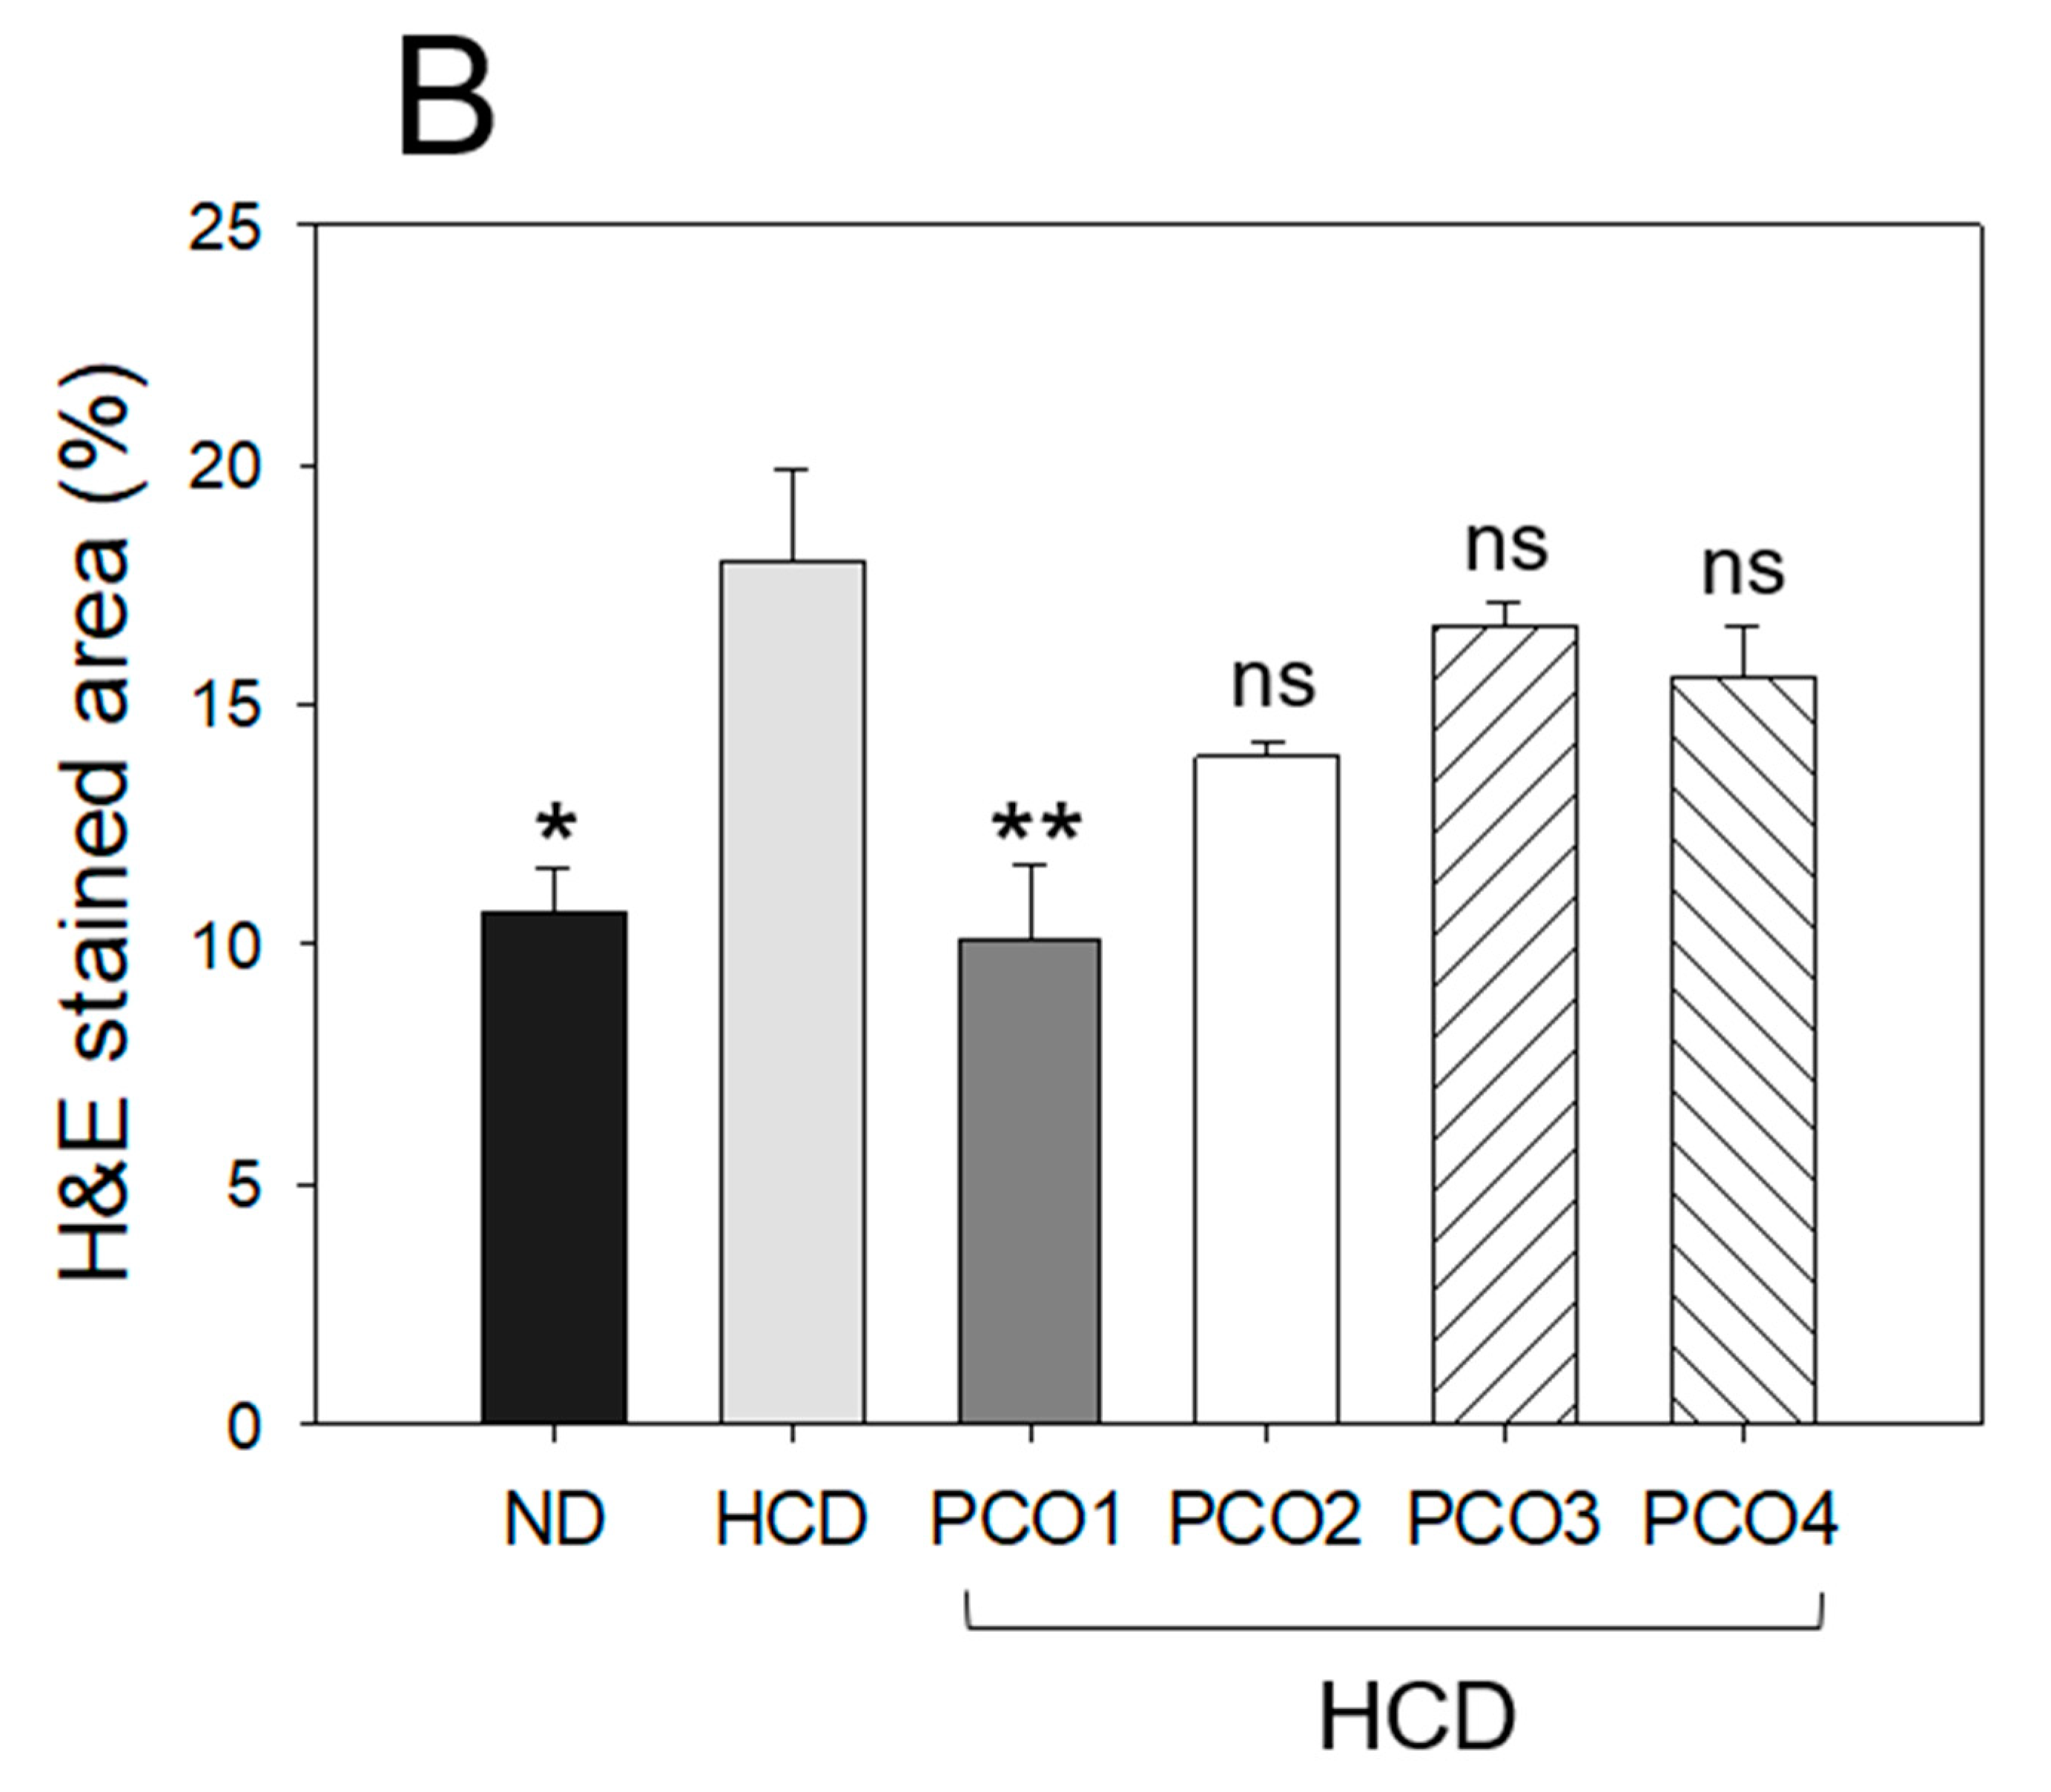
Histological analysis with H&E staining showed that the HCD control group (photograph b) exhibited the strongest H&E stained area and red intensity (Figure 6A), 1.7-fold higher (p=0.008) than the ND control group (photograph a), indicating the highest number of infiltrated neutrophils in the HCD control group. In contrast, the PCO1 group (photograph c) showed the lowest number of neutrophils, ~48% lower than the HCD control group (p=0.005), as shown in Figure 6B. The other policosanol groups showed a similar H&E-stained pattern: approximately 23% (p=0.018), 8% (p=0.022), and 14% (p=0.034) lower than the HCD control group, respectively. The PCO1 group showed the smallest H&E-stained area (~10.2±1.5%), whereas the PCO2, PCO3, and PCO4 groups showed a 13.9± 0.3%, 16.6±0.5%, and 15.9±1.0% stained area, respectively (Figure 6B). The larger H &E stained area in the PCO3 and PCO4 group correlated well with the higher AST and ALT level than the PCO1 group.
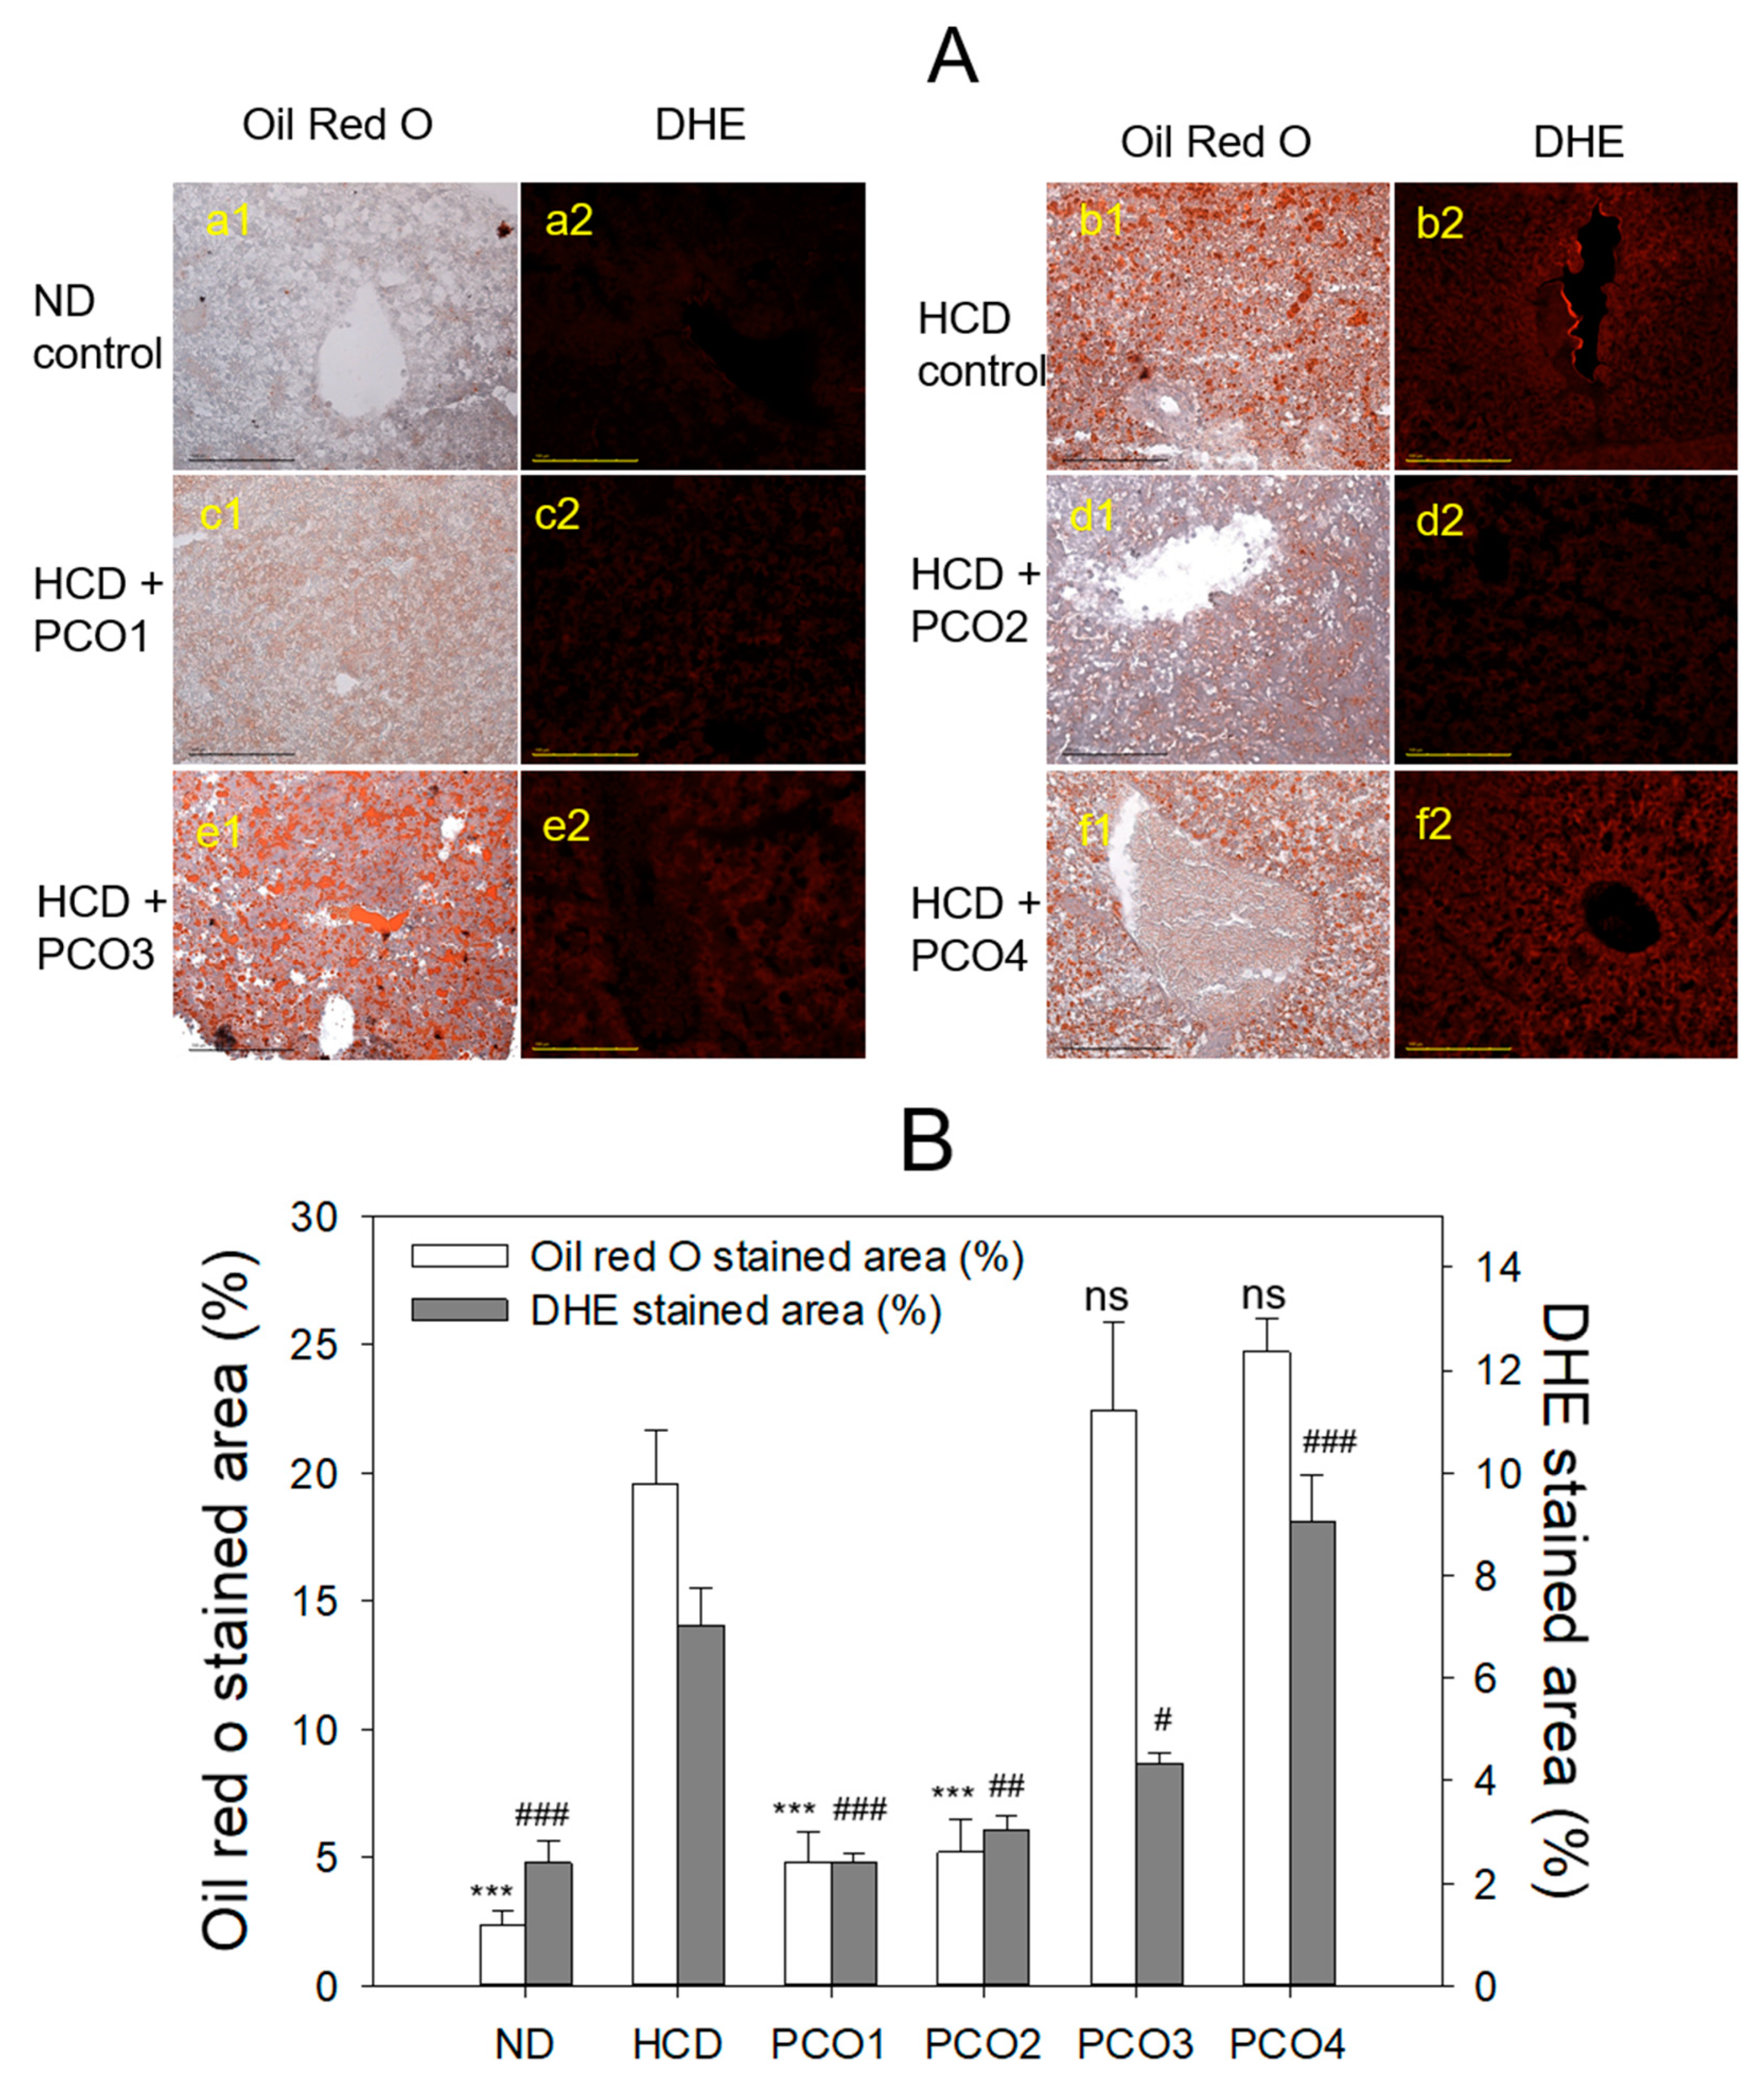
Oil red O staining with hepatic section showed that the HCD control group (photo b1) had an 8.1-fold higher red intensity and area than the ND group (photo a1), as shown in Figure 7A, suggesting that severe fatty liver change occurred by the cholesterol supplementation. Under HCD consumption, the PCO1 group (photo c1) and PCO2 (photo d1) had the lowest oil red O-stained area, up to 75% and 73% lower, respectively, than the HCD control group (Figure 7B). On the other hand, the PCO3 group (photo e1) and PCO4 group (photo f1) showed 14% and 26% higher stained area than the HCD control group.
DHE staining revealed the HCD control group (photo b2) to have a 3.0-fold stronger red intensity than the ND group (photo a2), suggesting that cholesterol consumption was associated with ROS production. Among the HCD groups, the PCO1 group (photo c2), PCO2 (photo d2), and PCO3 (photo e2) groups showed a 68%, 58%, and 39% smaller DHE stained area, respectively, than the HCD control group (Figure 7B). On the other hand, the PCO4 group (photo f1) showed the highest stained area, approximately 28% higher than the HCD control group, indicating the most severe fatty liver change and ROS production.

2.5. Immunohistochemical Analysis with Liver Tissue

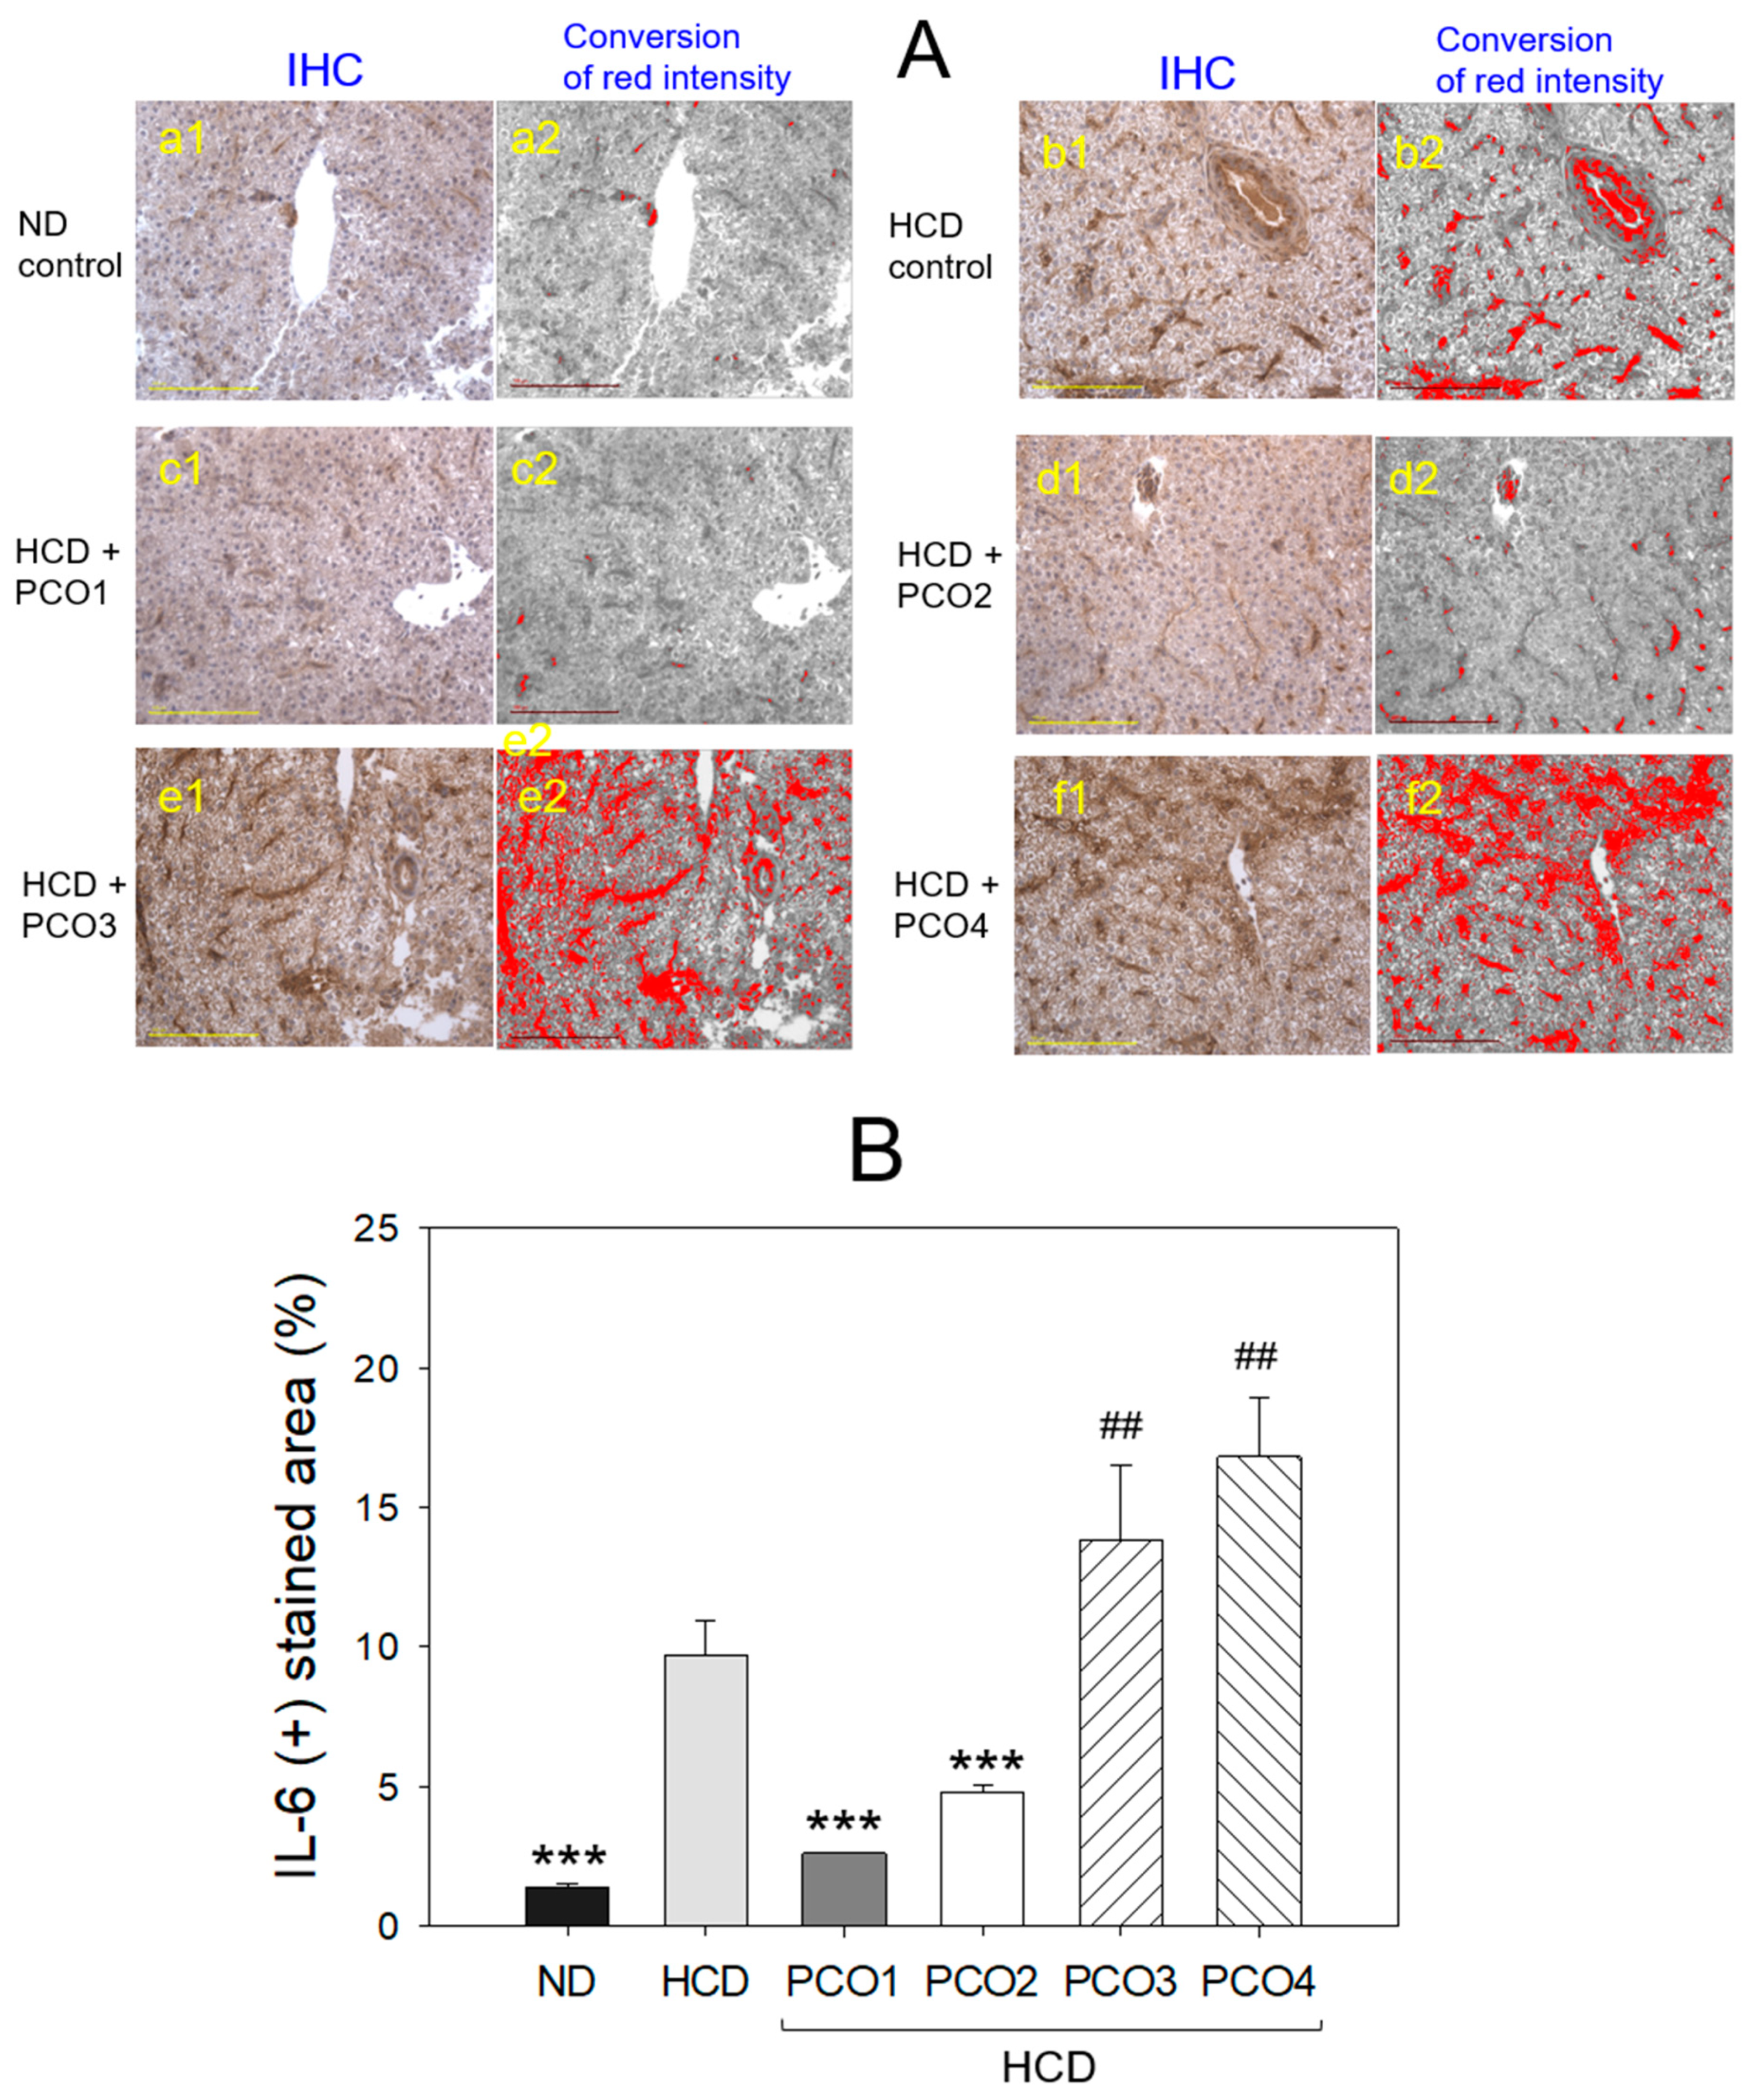
As shown in Figure 8A, immunohistochemistry detection of IL-6 with hepatic tissue revealed the HCD control group to have a larger stained area (photo b, around 9.7±1.2%), which was 6.8 times higher (p=0.008) than that of the ND control group (photo a). Hence, these results indicate that cholesterol supplementation for 12 weeks caused severe IL-6 accumulation in hepatic tissue. The PCO1 group (photo c) showed the least IL-6 stained area around 2.6±0.1%, which was 74% (p=0.002) of that of the HCD control, whereas the PCO2 group (photo d) showed the 2nd lowest IL-6 stained area, approximately 4.8±0.3%, 50% lower (p=0.008) than that of the HCD control. In contrast, the PCO3 and PCO4 groups showed the largest IL-6 stained area of 13.8±3.1% and 16.8±2.9%, respectively, which was 1.4-fold (p<0.001) and 1.7-fold higher (p<0.001) than the HCD control (Figure 8B). These results suggest that the anti-inflammatory activity of policosanol might vary according to the sources and country of origin: PCO1 and PCO2 policosanol showed potent anti-inflammatory activity to inhibit IL-6 production, whereas PCO3 and PCO4 did not (Figure 8B). These differences in the IL-6 stained area showed good agreement with the different serum AST/ALT levels, fatty liver changes, and ROS production in the liver.

2.6. Histological Analysis with Ovary

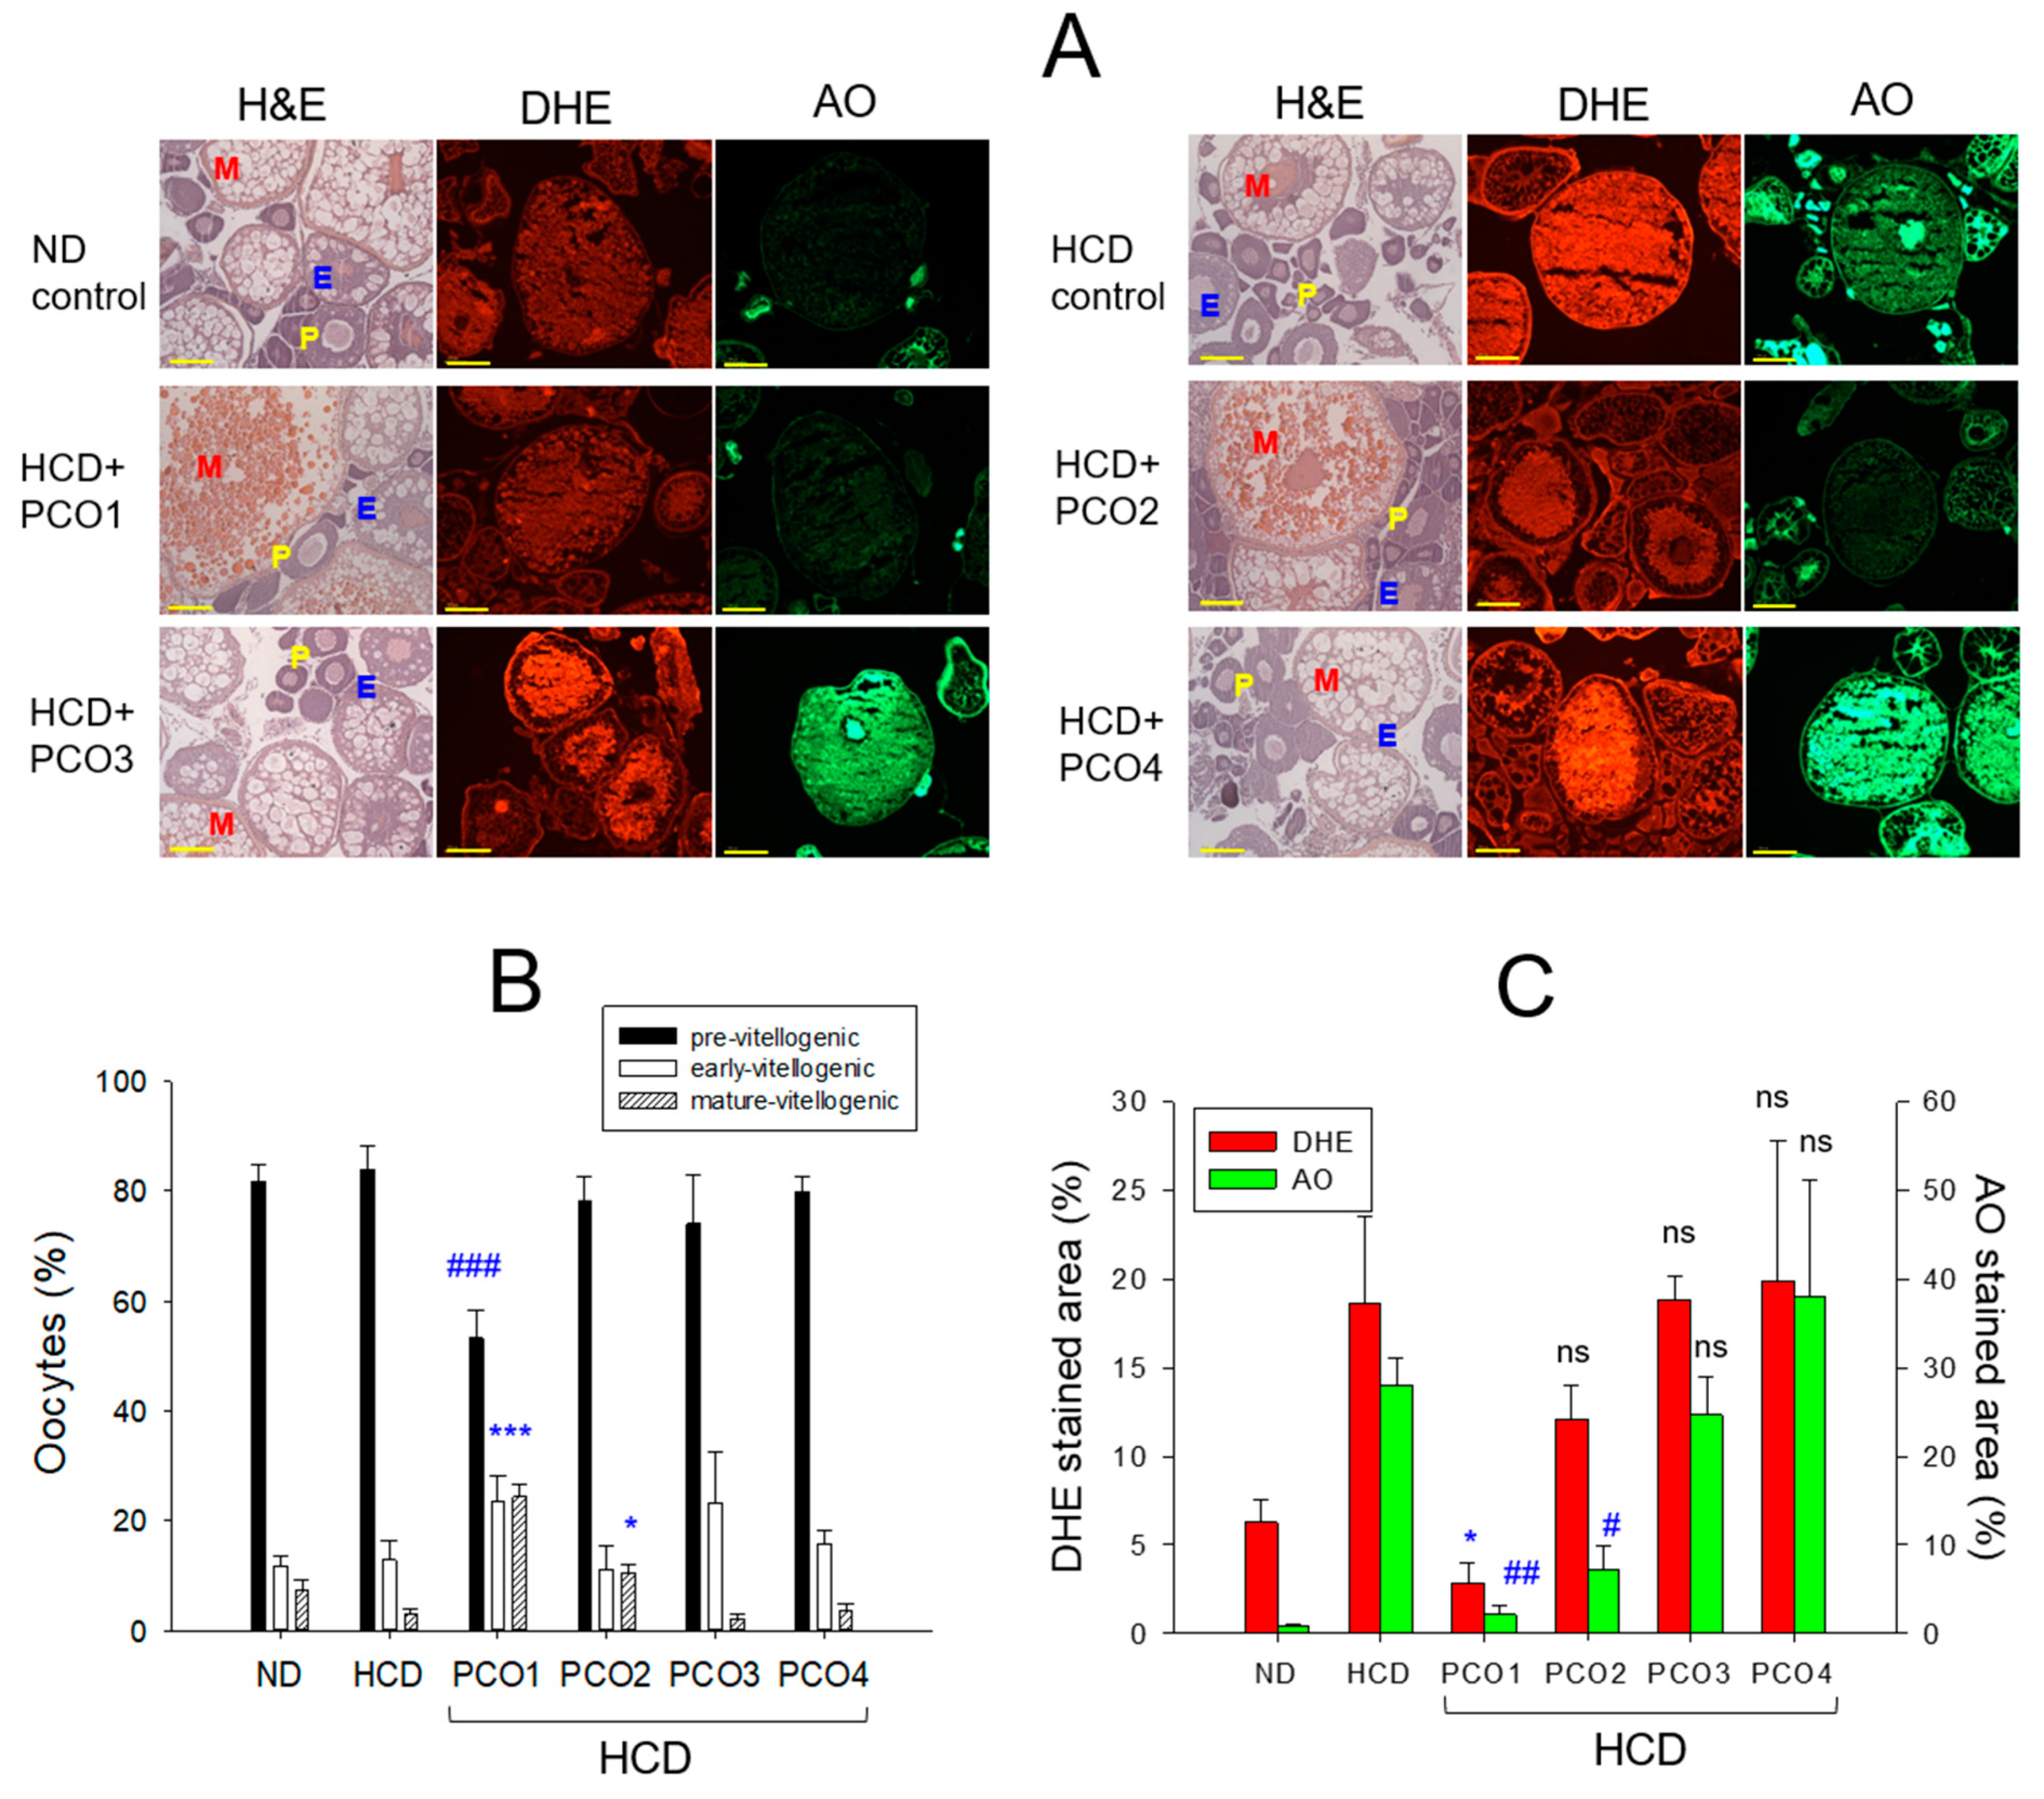
H&E staining (Figure 9A,B) showed that the HCD group had the highest previtellogenic oocyte content (~83%) and the lowest content of early and mature vitellogenic oocytes (~13% and 3%, respectively), with a smaller size than the ND group. On the other hand, the PCO1 group showed the highest ratio of early and mature vitellogenic oocytes, approximately 47%, with the lowest ratio of premature oocytes (~53%), whereas the three Chinese policosanols showed a much larger ratio of premature oocytes (~74–80%) with a lower content of early and mature vitellogenic oocyte (~20–26%).
DHE staining showed that the HCD group had a 2.9-fold stronger red intensity than the ND group, indicating that higher ROS production in oocytes was associated with HCD consumption (Figure 9A,C). The PCO1 group showed the weakest red intensity, 85% lower than the HCD group. Although the PCO2 group showed a 33% lower DHE-stained area than the HCD control group, the PCO3 and PCO4 groups showed similar and 7% higher DHE-stained areas, respectively, than the HCD control group (Figure 9C).
AO staining revealed the HCD group to have a 23-fold higher green intensity than the ND group (Figure 9A,C), suggesting that high cholesterol consumption is also linked with increased cellular apoptosis. The PCO1 and PCO2 groups showed 93% and 75% lower green intensity, respectively, than the HCD control group. In contrast, the PCO3 and PCO4 groups showed a similar or 35% higher AO-stained area, respectively, than the HCD control group, suggesting that the greatest extent of cellular apoptosis in oocytes occurred in the PCO4 group. These results suggest that PCO1 consumption resulted in the highest content of mature oocytes with the least extent of cellular apoptosis and ROS production in ovarian cells.

2.9. Histological Analysis with Testis

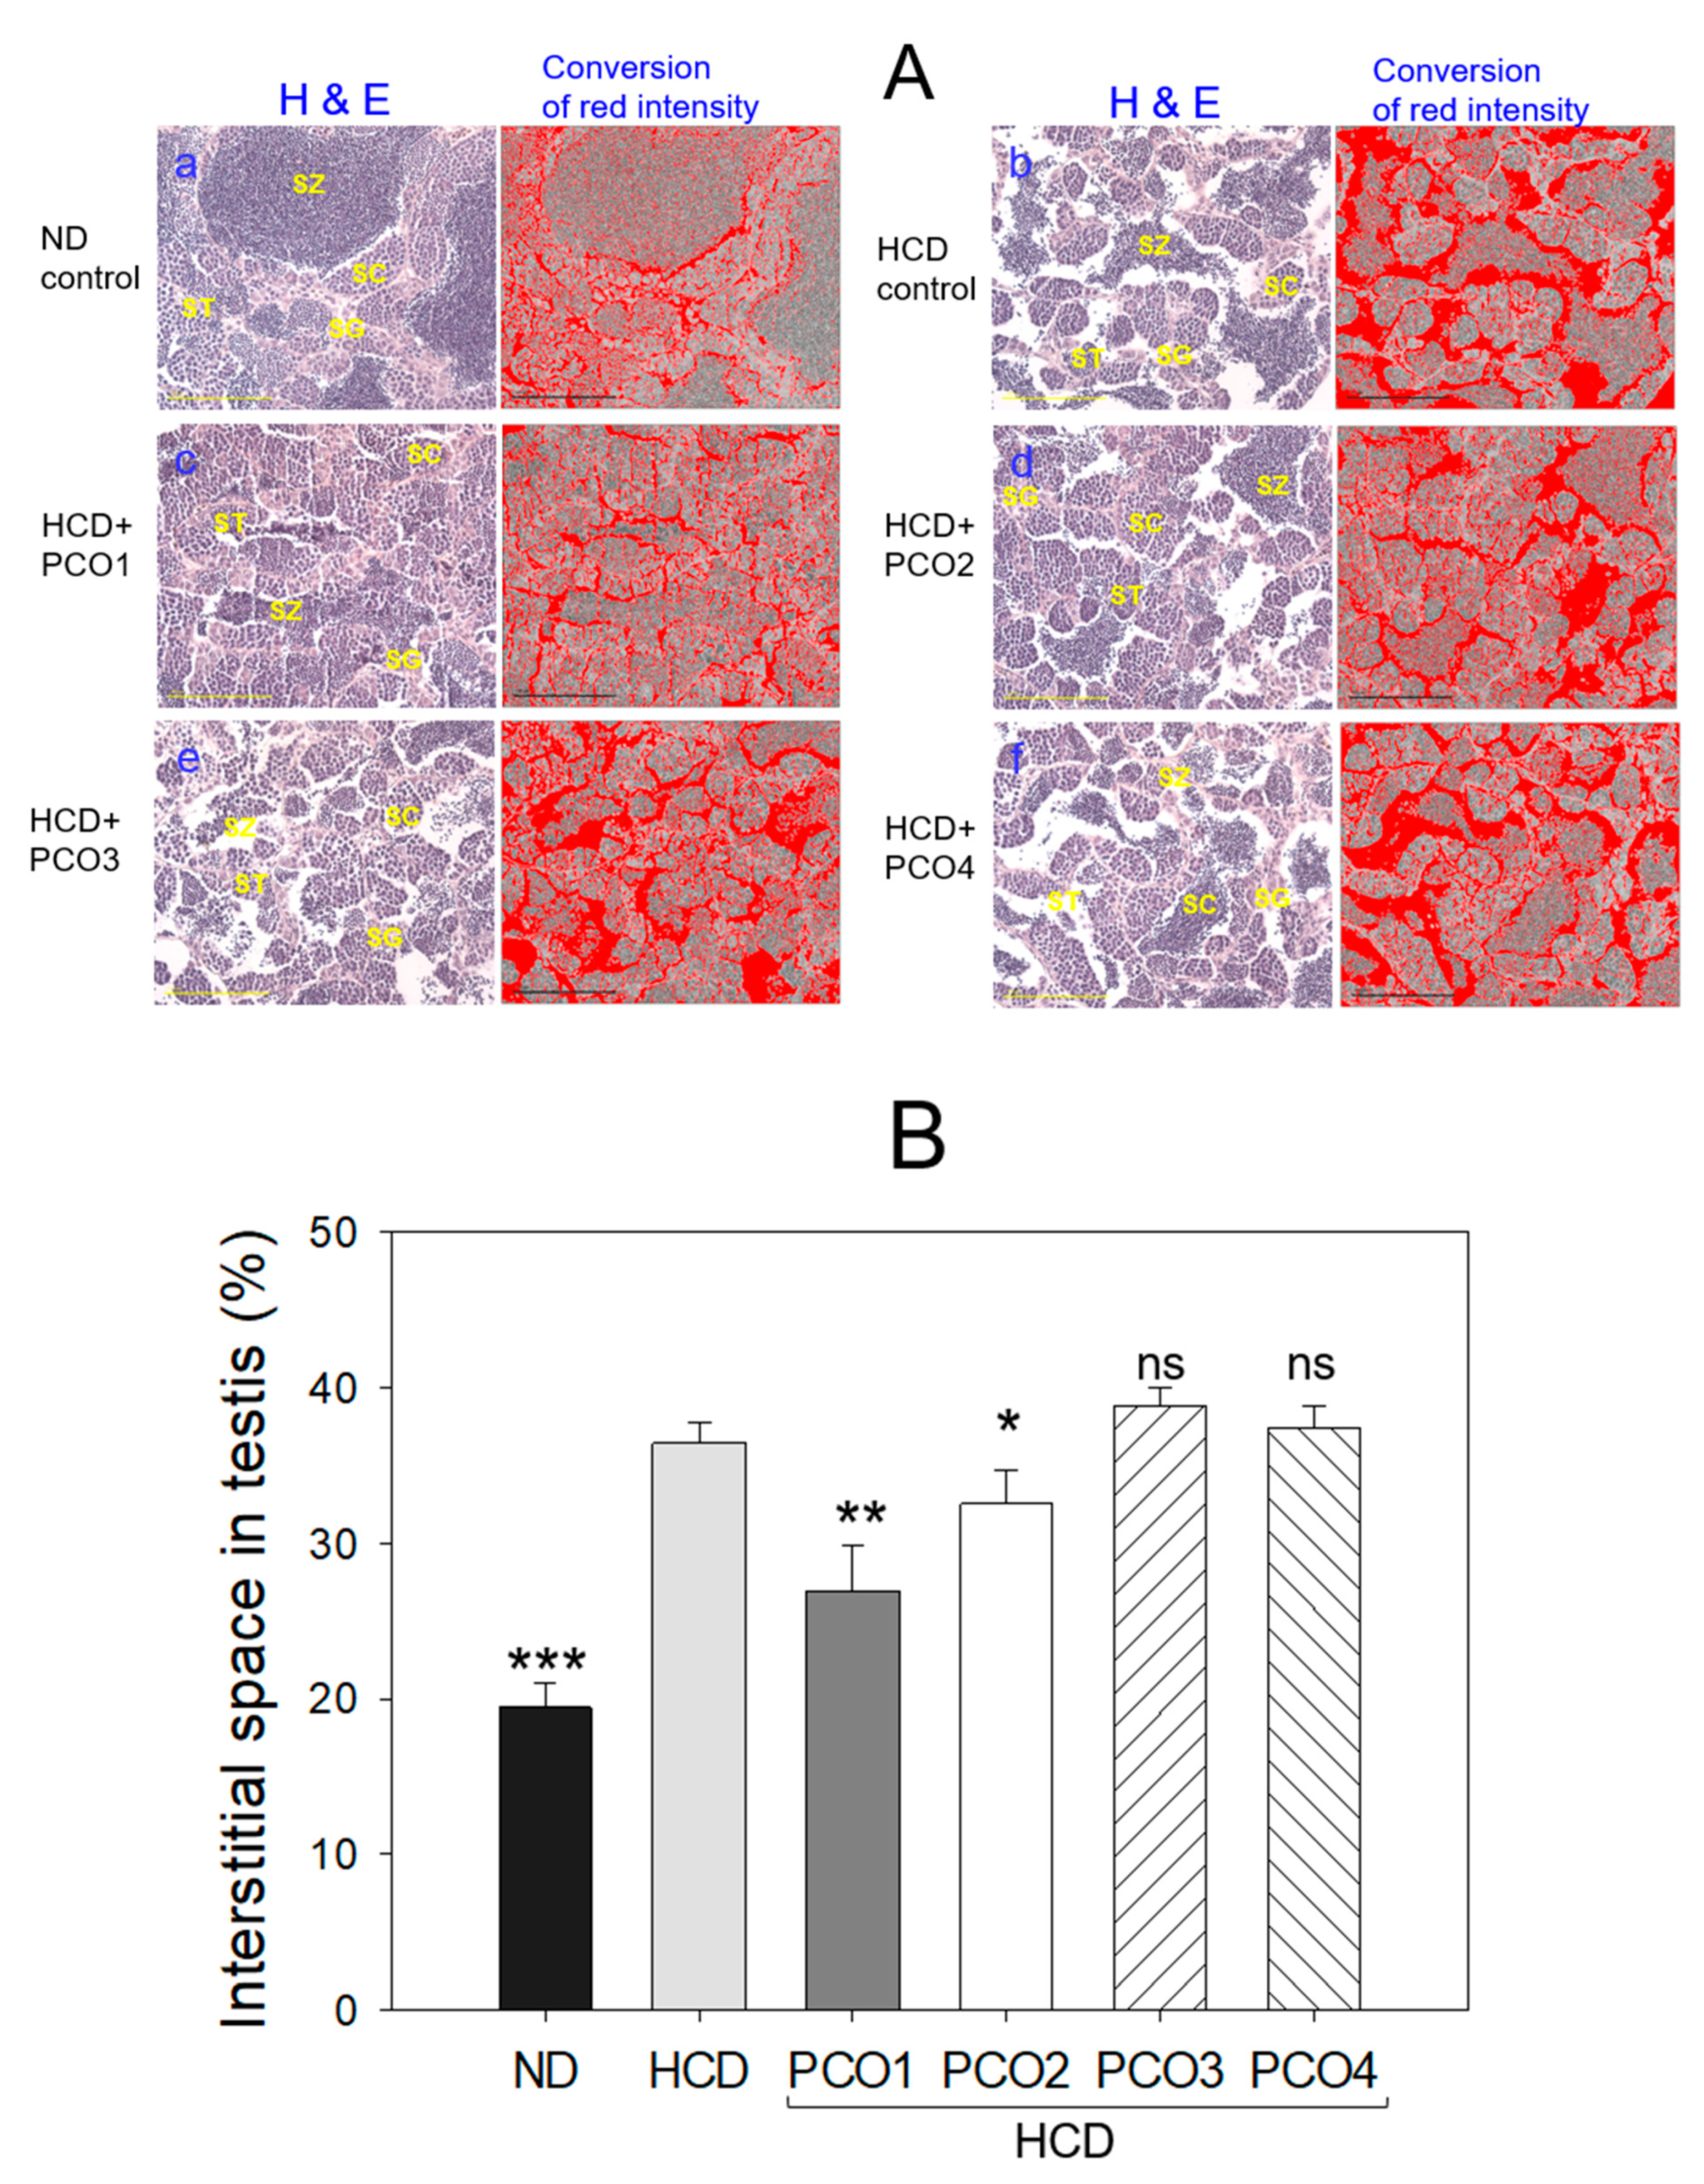
H&E staining (Figure 10A) analysis with a testis section showed that the ND group (photo a) had healthy seminiferous tubules with a full cell population adherent to the basal membranes without any notable gaps between the membranes and interstitium, approximately 19% of interstitial area (Figure 10B). On the other hand, the HCD control group displayed irregularly outlined seminiferous tubules with disarranged cellular layers as well as a broken lamina basal membrane with the largest interstitial area of approximately 36%, indicating impaired ability of spermatogenesis. The morphometric results of spermatogenesis in the HCD group (photo b) showed that spermatids and sperm (mature forms) were smaller than the ND group (photo a). In contrast, the PCO1 group showed the largest increase in the area of spermatids, as shown in Figure 10A (photo c), with the smallest interstitial area among HCD groups. The average interstitial areas of the PCO1 and PCO2 groups were approximately 26% and 32% smaller than the HCD control group, respectively (p<0.001). In contrast, the PCO3 and PCO4 groups showed 39% and 37% of the average interstitial areas, respectively, which was higher than that of the HCD control group (Figure 10B).
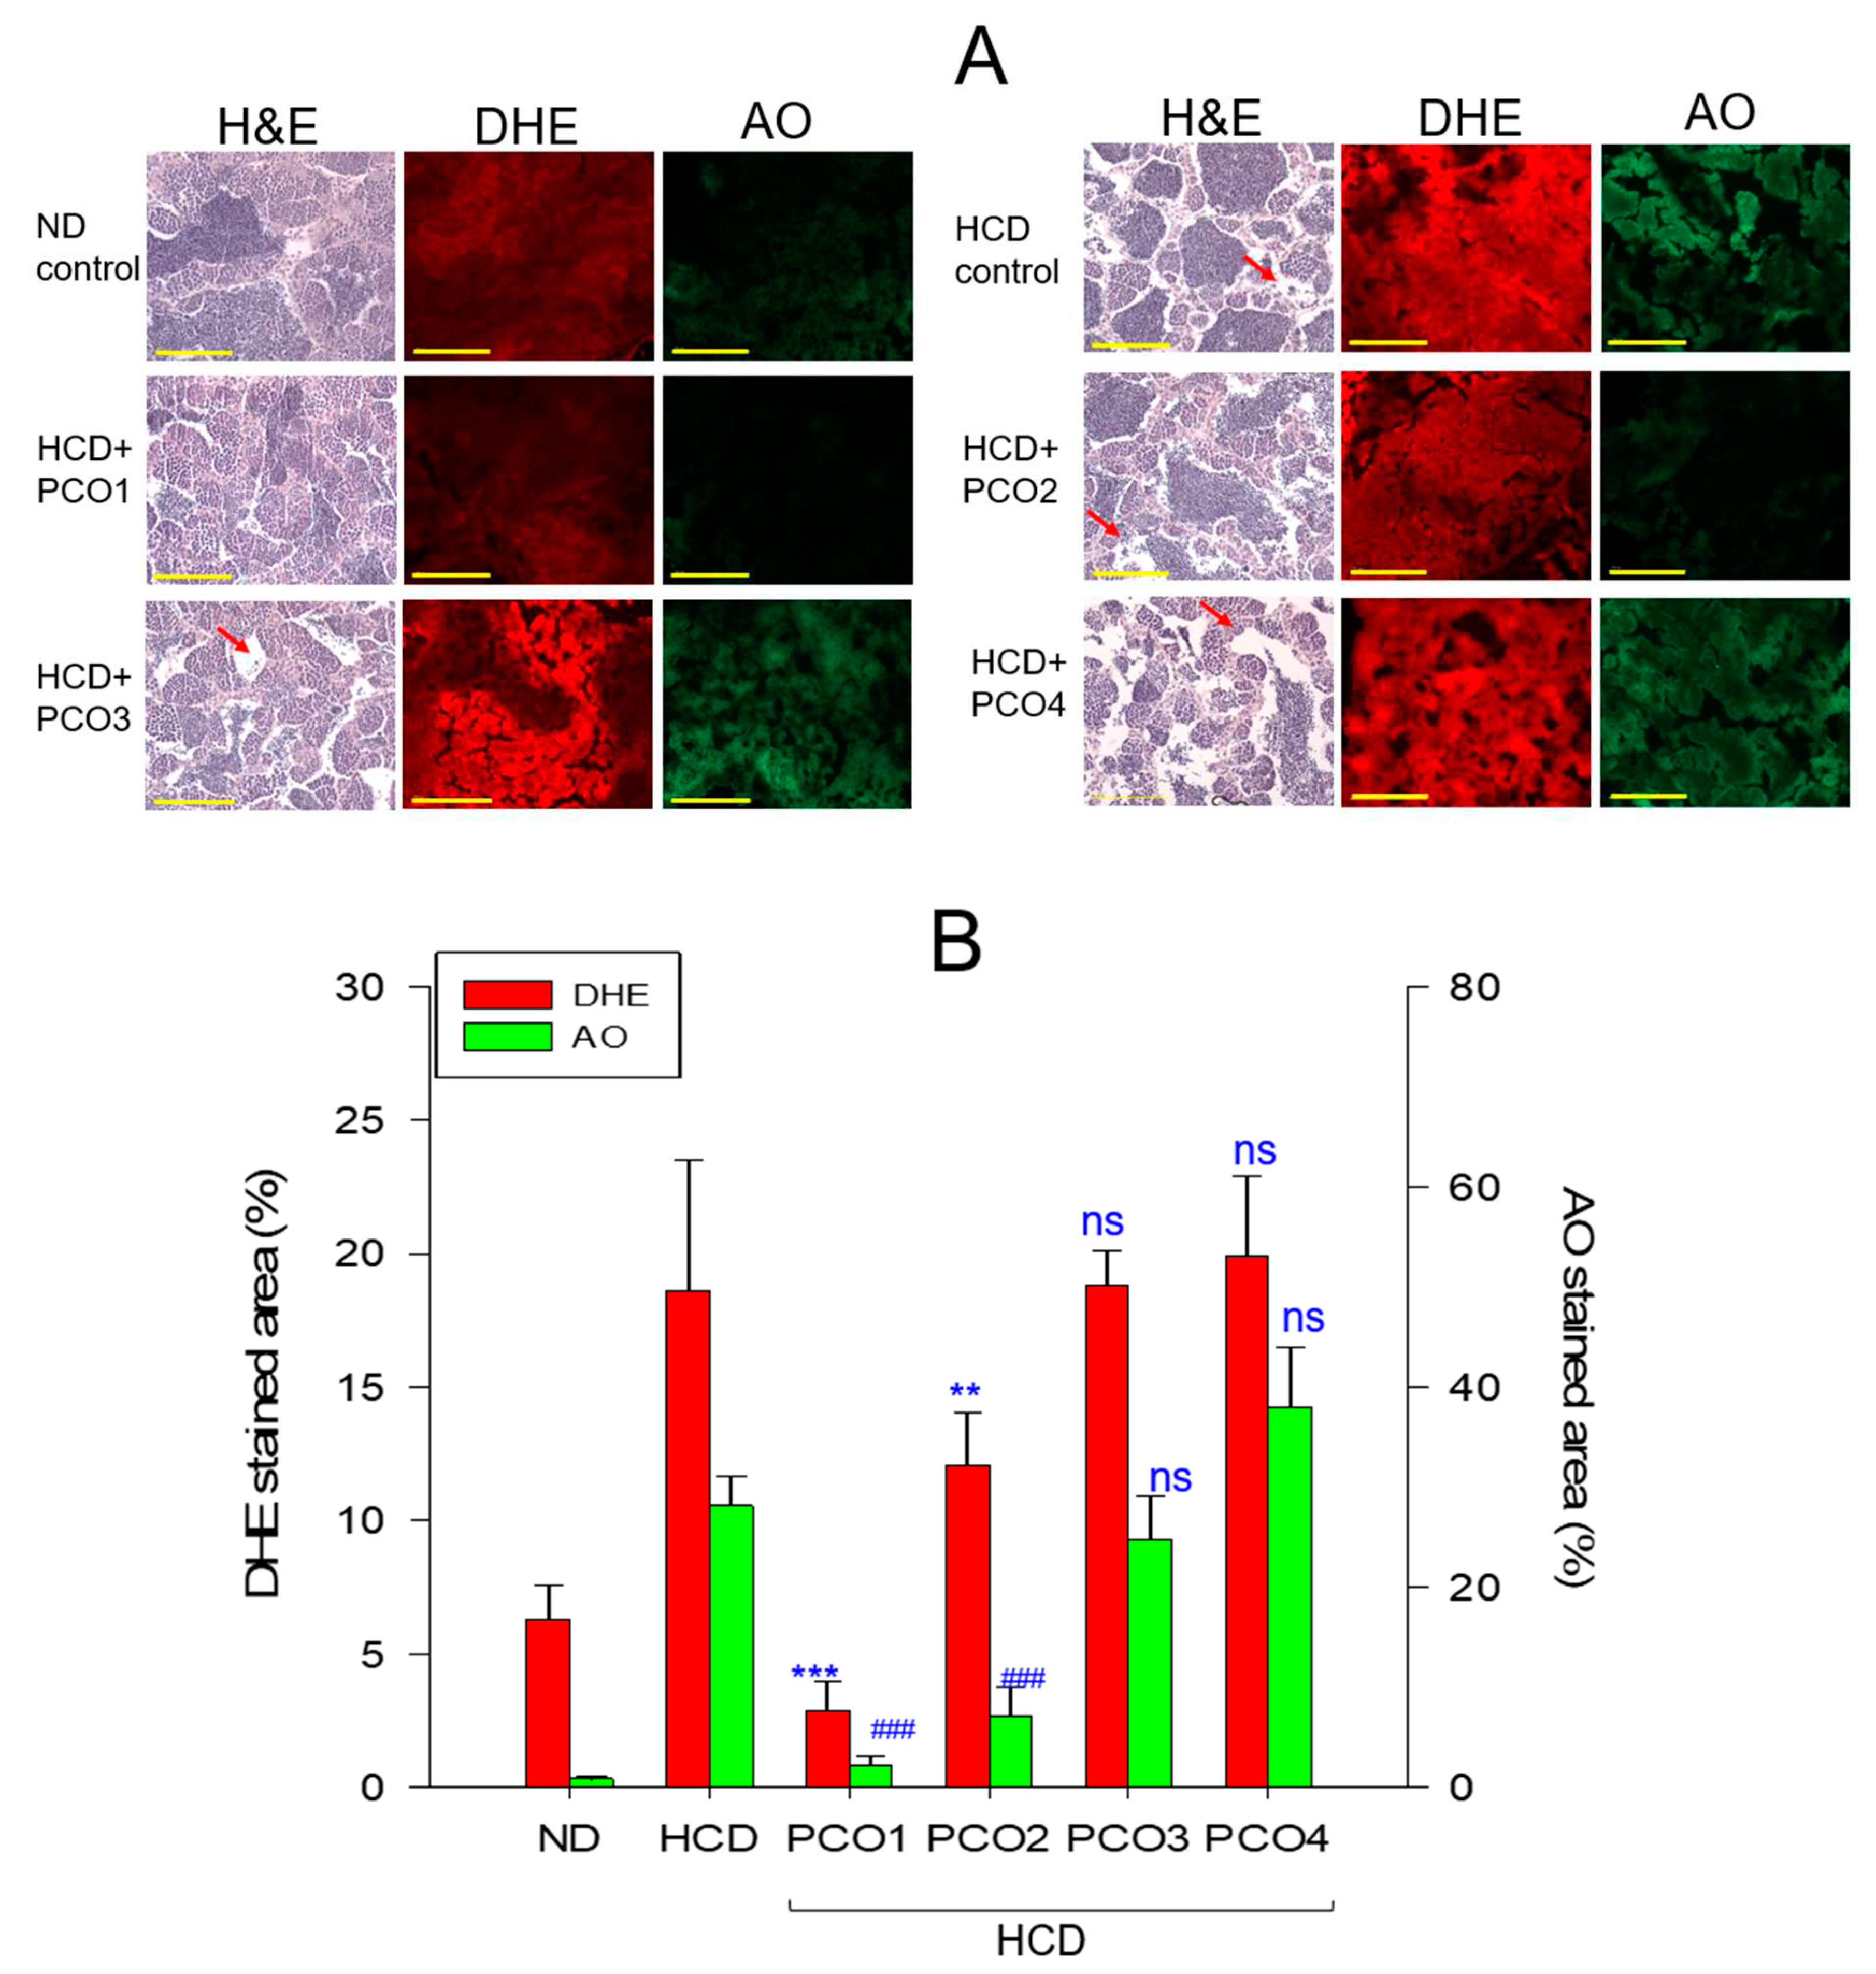
DHE staining showed that the HCD control group had 19% red-stained area, indicating three times higher ROS production than the ND control group (~6% red-stained area) (Figure 11A). The PCO1 group showed the lowest ROS production (~3% red-stained area), whereas the PCO2 policosanol group showed the 2nd lowest ROS production (~12% red-stained area) (Figure 11B). On the other hand, the PCO3 and PCO4 groups showed similarly higher ROS production than the HCD group (~18% and 20% red stained area, respectively).
AO staining showed that the HCD group had 33-fold higher green intensity than the ND group (Figure 11), suggesting that high cholesterol consumption caused a remarkable increase in cellular apoptosis in the testis. The PCO1 and PCO2 policosanol groups showed 93% and 75% lower green intensity, respectively, than the HCD control group. In contrast, the PCO3 and PCO4 groups showed 15% lower or 35% higher AO stained area, respectively, than the HCD control group, suggesting that the highest extent of cellular apoptosis in the testis occurred in the PCO4 group. These results suggest that the PCO1 group had the highest protective activity with the least extent of cellular apoptosis and ROS production in spermatogenesis.
Spermatogenesis and testicular abnormalities were examined to determine the effects of the HCD consumption on male fertility, as shown in Figure 10 and Figure 11. The histological examination of the testes from zebrafish fed an ND revealed a normal morphology of seminiferous tubules with a full cell population adherent to the basal membrane with a few gaps between them and the interstitium (photo a, Figure 10A). The testis section of the ND group showed well-developed spermatogonia (SG), spermatocytes (SC), spermatids (ST), and spermatozoa (SZ) with a normal size and distributions. On the other hand, however, zebrafish fed HCD (Photo b, Figure 10A) displayed irregularly outlined seminiferous tubules with disarranged cellular layers and a broken lamina basal membrane, indicating reduced spermatogenesis ability. The morphometric spermatogenesis results of zebrafish fed a HCD showed that the spermatids, spermatozoa, and spermatocytes were smaller in area than those of the ND group. On the other hand, co-supplementation of PCO1 resulted in a remarkably improved morphology (photo c, Figure 10A) with a smaller interstitial area up to 27% lower than the HCD control (Figure 10B). The other Chinese policosanols did not show notable improvement in testicular cell morphology (photo d, e, f of Figure 10A); PCO2 group showed an 11% smaller interstitial area, whereas the PCO3 and PCO4 group showed 6% and 2% larger interstitial area, respectively. The average size of the seminiferous tubules decreased significantly.
The degeneration of the seminiferous tubules with empty spaces was observed in the inter- and intra-seminiferous tubules (red arrows, Figure 11A). Areas of these empty spaces increased significantly in the three Chinese policosanol groups as indicated by red arrowhead. Tissue tearing occurred during H&E staining in the cryosection slides for tissues treated with HCD because of the fragile testicular interstitium. Interestingly, the interstitial space of the PCO3 and PCO4 group with HCD was larger than that of the HCD-alone group (Figure 10B). These significant impairments of the ovary and testis in the PCO3 and PCO4 groups correlated well with the higher inflammation and fatty liver change in the liver (Figure 6, Figure 7 and Figure 8), elevation of AST and ALT (Figure 5), and lower HDL-C and HDL-C/TC (%) (Figure 2).

3. Discussion

The current study was designed to compare the in vivo efficacy of various policosanols on the blood lipid-lowering effect, anti-inflammatory activity, and enhancement of reproduction system, such as ovarian and testicular tissue in hyperlipidemic zebrafish. The current results showed that 12 weeks of Cuban policosanol (Raydel®) consumption resulted in the highest survivability (Table 1) and potent efficacy to lower the blood TC, LDL-C, and TG with higher HDL-C/TC (%) under HCD supplementation (Figure 1, Figure 2, Figure 3 and Figure 4). In the liver function, the Cuban policosanol group (PCO1) showed the lowest blood AST and ALT level (Figure 5) with the least infiltration of neutrophils in hepatocytes (Figure 6). Histology analysis of the liver revealed the PCO1 group to have the least fatty liver change and ROS production (Figure 7) with the smallest IL-6 production (Figure 8). In ovarian tissue, the PCO1 group showed the highest percentage of mature vitellogenic stage oocytes with the least ROS production and cellular apoptosis (Figure 9). In the testis tissue, PCO1 group showed the least damage to the spermatogenesis cell morphology with the smallest interstitial area (Figure 10), ROS production, and apoptosis (Figure 11).
The current results showed that hyperlipidemia, which was induced by a high cholesterol diet (final 4%), was associated with damage to the hepatic function, and the elevation of ROS production and inflammation in the liver (Figure 5, Figure 6, Figure 7 and Figure 8), and impairment of male and female reproduction system, such as the testis and ovary (Figure 9, Figure 10 and Figure 11). The HCD control group showed the highest serum AST and ALT levels with severe fatty liver changes and ROS production after 8 weeks of consumption, which was also reported in a previous study [34]. Interestingly, the HCD control group showed a remarkable increase in IL-6 production in the liver, a severe decrease in mature vitellogenic oocytes, and severe enlargement of the interstitial area in the testis. These results suggest that dyslipidemia is associated with hepatic inflammation and infertility, which is in good agreement with previous reports showing that high cholesterol-consuming mice for 12 weeks showed impairment of sperm maturation and capacitation [37].
In contrast, the co-supplementation of Cuban policosanol in the HCD (final 0.1%, wt./wt.) improved the lipid profile and liver functions. These results concur with previous clinical studies of healthy Japanese participants [38,39]. Twelve weeks of Cuban policosanol (Raydel®) consumption offered some protection of the liver functions via lowered the AST, ALT, g-GTP, and alkaline phosphatase (ALP) levels. In addition, the serum antioxidant abilities were elevated by policosanol consumption at week 12; 37% increase in ferric ion reduction ability (FRA) and 29% increase in paraoxonase (PON) activity [38]. Interestingly, the purified HDL2 and HDL3 from the policosanol group also showed enhanced FRA and PON ability, approximately 1.3–1.6-fold higher than the placebo group [39]. Similarly, 12 weeks of Cuban policosanol consumption (5 mg and 10 mg per day) by hypercholesterolemic patients resulted in a significant decrease in ALT and g-GTP, and a decrease in TC, LDL-C, and an increase in HDL-C [40]. Furthermore, the in vitro comparison of antioxidant ability showed that Cuban policosanol had the highest potent inhibition ability of LDL oxidation in the presence of cupric ions [30]. Under the in vitro treatment of fructose, Cuban policosanol showed the highest inhibition activity of the extent of glycation with prevention of apoA-I degradation [30]. Furthermore, the clinical study with healthy Japanese participants showed that the policosanol group had 4% lower glycated hemoglobin (HbA1c) levels than at week 0 and the placebo group at week 12 [38,39]. These enhanced serum antioxidant abilities and hepatic function parameters might help improve the hepatic function and reproductive organs, testis, and ovary.
It has been well established that oxidative stress promotes inflammation in the ovaries and causes ovarian aging and infertility [41]. The consumption of a high-cholesterol diet for 21 weeks in zebrafish caused a remarkable increase in AST and ALT with an impairment of the testicular morphology; the HCD group showed 1.7-fold greater enlargement of the interstitial area than the ND group [42]. To the best of the authors’ knowledge, the current study is the first to show that Cuban policosanol (Raydel®) consumption could ameliorate damage to the liver and reproduction system, ovary and testis, under high cholesterol consumption. The alleviation of hepatic inflammation and ROS production is based on the increase in HDL-C and the enhancement of HDL functionality, as shown in previous reports with hyperlipidemic zebrafish [34] and spontaneously hypertensive rats (SHR) [43]. In hyperlipidemic zebrafish, eight weeks of policosanol consumption ameliorated the elevated infiltration of neutrophils, ROS production, and fatty liver changes with a significant reduction of AST and ALT [34]. In the SHR, elevated oxidized species in hepatic tissue and C-reactive protein in the blood were reduced by eight weeks of policosanol consumption in a dosage-dependent manner [43].
A previous study reported that policosanol did not impair the male reproduction system without genetic defects from long-term supplementation (5, 50, and 500 mg/kg of body weight/day) throughout three successive generations [44]. In the female reproduction ability, there were no teratogenic effects in the rats and rabbits given 500–1000 mg/kg of body weight/day two weeks before mating and throughout mating and pregnancy to day 21 of lactation [45]. Although no reports describe the improvement in the reproduction ability by policosanol consumption, these results showed that treatment of dyslipidemia with Cuban policosanol is associated with an improved ovarian cell and testicular cell morphology and functions.
Increased oxidative stress in hyperlipidemia has been associated with fatty liver change and pro-inflammatory response in hepatic tissue [46]. On the other hand, the current results showed that hyperlipidemia and fatty liver change are also linked with severe impairments of the reproduction system (Figure 9, Figure 10 and Figure 11). HCD supplementation caused a decrease in the mature vitellogenic stage of approximately 2.7%, while the ND group showed 6.5%, indicating that elevated oxidative stress by hyperlipidemia inhibited oocyte maturation, as reported elsewhere [47,48]. In the current study, however, co-supplementation of Cuban policosanol resulted in the largest increase in early-vitellogenic and mature-vitellogenic oocytes, indicating enhanced oocyte maturation and folliculogenesis.
In conclusion, 12 weeks of Cuban policosanol consumption under HCD resulted in remarkable improvements in the blood lipid profile, amelioration of liver inflammation, and enhanced cell morphology in the ovary and testis. These results showed how Cuban policosanol differs from Chinese policosanols regarding the in vivo efficacy in treating hyperlipidemia, hepatic inflammation, and impairments of the reproduction system.

4. Materials and Methods

4.1. Materials

Policosanol (PCO) 1, Raydel® sugar cane wax alcohol, was obtained from National Center for Scientific Research (CNIC), Habana, Cuba. PCO2 and PCO3 were acquired from sugar cane and supplied by Xi’an Natural Field Biotechnique Co, Ltd. (Xi’an, China) and Xi’an Realin Biotechnology Co, Ltd. (Xi’an, China), respectively. PCO4, from rice bran, was purchased from Shaanxi Pioneer Biotech (Xi’an, China). All raw materials of each policosanol were analyzed using the same gas chromatography (GC, HP-5890A GC, Agilent, Palo Alto, CA, USA) procedure with a GC-flame ionization detector and a Zebron ZB-5 column (30 m × 0.53 mm × 1.50 μm) from Phenomenex (Torrance, CA, USA) at the Korea Advanced Food Research Institute (Uiwang-si, Republic of Korea), as described elsewhere [30].

4.2. Zebrafish and Policosanol Supplementation

Zebrafish and embryos were maintained using the standard protocols [49] according to the Guide for the Care and Use of Laboratory Animals [50]. The procedures using zebrafish were approved by the Committee of Animal Care and the Use of Raydel Research Institute (approval code RRI-20-003, Daegu, Republic of Korea). The fish were maintained in a system cage at 28°C during treatment under a 14:10 hr. light cycle with the consumption of normal tetrabit (TetrabitGmbh D49304, 47.5% crude protein, 6.5% crude fat, 2.0% crude fiber, 10.5% crude ash, containing vitamin A [29770 IU/kg], vitamin D3 [1860 IU/kg], vitamin E [200 mg/kg], and vitamin C [137 mg/kg]; Melle, Germany).
Zebrafish around 10 weeks old were randomly divided into six groups, as shown in Table 1; each group had 70 zebrafish and were supplemented with one of each policosanol (final 0.1%, wt./wt.) with HCD (final 4% cholesterol, wt./wt.) in the zebrafish diet (Tetrabit, Gmbh D49304, Melle, Germany) for 12 weeks. The groups were as follows: exposed to normal diet group (ND, control, n=70), exposed to 4% high-cholesterol diet group (HCD, n=70), PCO1 (exposed to Cuban policosanol, Raydel®, with HCD, n=70), PCO2 (exposed to Xi’an Natural policosanol with HCD, n=70), PCO3 (exposed to Xi’an Realin policosanol with HCD, n=70), and PCO4 (exposed to Shaanxi policosanol with HCD, n=70). Before feeding each policosanol, all groups were acclimated to HCD for four weeks except the ND control group. Subsequently, the zebrafish were supplemented each 0.01 mg of policosanol in 10 mg of Tetrabit, fed twice daily at 9 am and 6 pm with 20 mg of the designated diet, containing 0.02 mg of policosanol/day, per zebrafish.

4.3. Blood Collection and Analysis

After 12 weeks of supplementation, blood (2 μL) was drawn from the hearts of the adult zebrafish, combined with 3 mL of phosphate-buffered saline (PBS)-ethylenediaminetetraacetic acid (EDTA, final concentration, 1 mM) and collected in EDTA-treated tubes as reported elsewhere [51]. The plasma of each group was collected after centrifugation (5,000 ⅹg) for 15 min. The total cholesterol (TC) and triglyceride (TG) levels in the plasma were determined using a commercial assay kit (cholesterol, T-CHO, and TGs, Cleantech TS-S; Wako Pure Chemical, Osaka, Japan). HDL-C (AM-202), aspartate transaminase (AST), and alanine transaminase (ALT) were measured using a commercially available assay kit using AM-202, AM-103K, and AM102-K (Asan Pharmaceutical, Hwasung, Korea), correspondingly.

4.4. Histopathology Analysis

For the morphological tissue observations using Hematoxylin and Eosin (H & E) staining, some hepatic tissues were fixed with a 10% formaldehyde solution for 24 hr. The samples were then exchanged twice with the same solution, dehydrated with double ethanol, and formatted in paraffin, producing a 5 μm thick tissue slice treated with poly-L-lysine. For morphological analysis, the prepared tissue sections were stained with H & E for the liver tissue at ×400 and ×1,000 magnification with an optical microscope (Motic microscopy PA53MET, Hong Kong, China). The nucleus area was quantified using Image J software (http://rsb.info.nih.gov/ij/accessed on 15 September, 2022) to convert the red intensity from H&E staining.
For oil red O staining, the stained liver samples were entrenched in Tissue-Tek OCT compound (Thermo, Walldorf, Germany) and frozen. Subsequently, 7 μm sections of these tissues were mounted on 3-aminopropyltriethoxysilane (3-APS)-coated slides and viewed under a Leica microcryotome (model CM1510s, Heidelberg, Germany). Seven consecutive sectioned slides of each zebrafish were first stained with Oil Red O (Cat # O0625, Sigma, St. Louis, MO) and then counterstained with hematoxylin, highlighting the fatty streak lesions. The extent of oxidative stress in these tissues was compared by observing the totality of reactive oxygen species (ROS) with dihydroethidium (DHE, cat # 37291; Sigma, St. Louis, MO) using a Nikon Eclipse TE2000 microscope (Tokyo, Japan), as described elsewhere [52]. The section fluorescence was quantified using Image J software (http://rsb.info.nih.gov/ij/accessed on 16 September 2022).
Immunohistochemistry analysis was carried out with the anti-human IL-6 antibody (ab9324, Abcam, London, UK), as the primary antibody and horseradish peroxidase conjugated-anti mouse immunoglobulin G antibody, as the secondary antibody using an Envision+ system (K4001, Dako, Denmark), as in a previous report [53].

4.5. Histological Analysis with Ovarian Cell

The pre-vitellogenic, early-vitellogenic, and mature-vitellogenic stages of the ovary were differentiated manually, as described previously [54,55]. The classification criteria were as follows. For the pre-vitellogenic stage, follicles measuring 250 μm diameter or smaller were categorized as such, including the smallest pre-vitellogenic follicles and those in the perinucleolar stage. Follicles, 250–500 μm in diameter, were classified as being in the early-vitellogenic stage. This encompassed the largest pre-vitellogenic follicles and those at the peripheral cortical alveolar stage. Follicles, 500 μm in diameter or larger, were assigned to the mature-vitellogenic stage. This stage included follicles characterized by yolk-filled alveoli distributed throughout the ooplasm and vitellogenic follicles. The ovary follicles were effectively categorized into their respective stages of development using these classification criteria.

4.6. Histological Analysis with Testicular Cell

The testes were collected from zebrafish fed a HCD (4%) for 16 weeks or HCD + policosanol for 12 weeks. The tissues were fixed in Bouin solution for two days and then dehydrated in 30% sucrose solution for two days. Frozen testes in OCT cryo-embedding compound were freshly sectioned to a thickness of 6 μm and stained using the standard H&E staining protocol. H&E staining was also performed on formalin-fixed, paraffin-embedded 3 μm sections after deparaffinization, as described previously [42,56]. Testicular abnormalities were examined by measuring spermatogenesis, the size of seminiferous tubules, and the size of the interstitial space in the testis slides from at least three fish per group. Spermatogenic defects were examined by measuring the area of each spermatogenic cell, as defined elsewhere [42,57].

4.7. Statistical Analysis

The data are expressed as the mean±SEM from at least three independent experiments with duplicate samples. For the blood cholesterol determination and histopathology study, multiple treatments were compared using a one-way analysis of variance (ANOVA) using a Tukey’s test as a post-hoc analysis. Statistical analysis was carried out using the SPSS software program (version 28.0; SPSS, Inc., Chicago, IL, USA). A p-value < 0.05 was considered significant.

Author Contributions

Conceptualization, K.-H.C.; methodology, S.H.B., J.-E.K.; investigation, K.-H.C.; writing—original draft preparation, K.-H.C.; writing—review and editing, K.-H.C.; supervision, K.-H.C.; All authors have read and agreed to the published version of the manuscript.

Funding

This research received no external funding.

Institutional Review Board Statement

The animal study protocol was approved by the Committee of Animal Care and Use of Raydel Research Institute (approval code RRI-20-003, approval date 3 January 2020). The protocol of human blood donation was conducted according to the guidelines of the Declaration of Helsinki and approved by the Institutional Review Board of Yeungnam University (approval code 7002016-A-2016-021, approval date 4 July 2016).

Informed Consent Statement

Informed consent was obtained from all subjects involved in the study.

Data Availability Statement

The data used to support the findings of this study are available from the corresponding author upon reasonable request.

Conflicts of Interest

The author declares no conflict of interest.

References

  1. Cho K. H. (2022). The Current Status of Research on High-Density Lipoproteins (HDL): A Paradigm Shift from HDL Quantity to HDL Quality and HDL Functionality. International journal of molecular sciences, 23(7), 3967. https://doi.org/10.3390/ijms23073967. [CrossRef]
  2. Wang J, Shi L, Zou Y, Tang J, Cai J, Wei Y, Qin J, Zhang Z. Positive association of familial longevity with the moderate-high HDL-C concentration in Bama Aging Study. Aging (Albany NY). 2018 Nov 28;10(11):3528-3540. https://doi.org/10.18632/aging.101663. PMID: 30485248; PMCID: PMC6286851. [CrossRef]
  3. Milman S, Atzmon G, Crandall J, Barzilai N. Phenotypes and genotypes of high density lipoprotein cholesterol in exceptional longevity. Curr Vasc Pharmacol. 2014;12(5):690-7. https://doi.org/10.2174/1570161111666131219101551. PMID: 24350928; PMCID: PMC4087084. [CrossRef]
  4. Barter, P. J., Nicholls, S., Rye, K. A., Anantharamaiah, G. M., Navab, M., & Fogelman, A. M. (2004). Antiinflammatory properties of HDL. Circulation research, 95(8), 764–772. https://doi.org/10.1161/01.RES.0000146094.59640.13. [CrossRef]
  5. Gotto A. M., Jr (2001). Low high-density lipoprotein cholesterol as a risk factor in coronary heart disease: a working group report. Circulation, 103(17), 2213–2218. https://doi.org/10.1161/01.cir.103.17.2213. [CrossRef]
  6. Cho, K. H., Park, H. J., & Kim, J. R. (2020). Decrease in Serum HDL-C Level Is Associated with Elevation of Blood Pressure: Correlation Analysis from the Korean National Health and Nutrition Examination Survey 2017. International journal of environmental research and public health, 17(3), 1101. https://doi.org/10.3390/ijerph17031101. [CrossRef]
  7. Denimal, D., Monier, S., Bouillet, B., Vergès, B., & Duvillard, L. (2023). High-Density Lipoprotein Alterations in Type 2 Diabetes and Obesity. Metabolites, 13(2), 253. https://doi.org/10.3390/metabo13020253. [CrossRef]
  8. Zimetti, F., Adorni, M. P., Marsillach, J., Marchi, C., Trentini, A., Valacchi, G., & Cervellati, C. (2021). Connection between the Altered HDL Antioxidant and Anti-Inflammatory Properties and the Risk to Develop Alzheimer's Disease: A Narrative Review. Oxidative medicine and cellular longevity, 2021, 6695796. https://doi.org/10.1155/2021/6695796. [CrossRef]
  9. Peppa, M., & Manta, A. (2023). Sexual Dysfunction in Diabetic Patients: Τhe Role of Advanced Glycation End Products. Current diabetes reviews, 10.2174/1573399819666230407095522. Advance online publication. https://doi.org/10.2174/1573399819666230407095522. [CrossRef]
  10. Tangvarasittichai S. Oxidative stress, insulin resistance, dyslipidemia and type 2 diabetes mellitus. World J Diabetes. 2015 Apr 15;6(3):456-80. https://doi.org/10.4239/wjd.v6.i3.456. PMID: 25897356; PMCID: PMC4398902. [CrossRef]
  11. Cipriani, S., & Simon, J. A. (2022). Sexual Dysfunction as a Harbinger of Cardiovascular Disease in Postmenopausal Women: How Far Are We?. The journal of sexual medicine, 19(9), 1321–1332. https://doi.org/10.1016/j.jsxm.2022.06.007. [CrossRef]
  12. Nikoobakht, M., Pourkasmaee, M., & Nasseh, H. (2005). The relationship between lipid profile and erectile dysfunction. Urology journal, 2(1), 40–44.
  13. Verit FF, Yildiz Zeyrek F, Zebitay AG, Akyol H. Cardiovascular risk may be increased in women with unexplained infertility. Clin Exp Reprod Med. 2017 Mar;44(1):28-32. https://doi.org/10.5653/cerm.2017.44.1.28. Epub 2017 Mar 31. PMID: 28428941; PMCID: PMC5395549. [CrossRef]
  14. Tall, A. R., & Rader, D. J. (2018). Trials and Tribulations of CETP Inhibitors. Circulation research, 122(1), 106–112. https://doi.org/10.1161/CIRCRESAHA.117.311978. [CrossRef]
  15. Luna-Castillo KP, Lin S, Muñoz-Valle JF, Vizmanos B, López-Quintero A, Márquez-Sandoval F. Functional Food and Bioactive Compounds on the Modulation of the Functionality of HDL-C: A Narrative Review. Nutrients. 2021 Apr 1;13(4):1165. https://doi.org/10.3390/nu13041165. PMID: 33916032; PMCID: PMC8066338. [CrossRef]
  16. Askarpour, M., Ghaedi, E., Roshanravan, N., Hadi, A., Mohammadi, H., Symonds, M. E., & Miraghajani, M. (2019). Policosanol supplementation significantly improves blood pressure among adults: A systematic review and meta-analysis of randomized controlled trials. Complementary therapies in medicine, 45, 89–97. https://doi.org/10.1016/j.ctim.2019.05.023. [CrossRef]
  17. Arruzazabala ML, Carbajal D, Mas R, Garcia M, Fraga V. Effects of Policosanol on platelet aggregation in rats. Thrombosis research. 1993;69(3):321-7.
  18. Valdes S, Arruzazabala ML, Fernandez L, Mas R, Carbajal D, Aleman C, et al. Effect of policosanol on platelet aggregation in healthy volunteers. International journal of clinical pharmacology research. 1996;16(2-3):67-72.
  19. Lee HG, Woo SY, Ahn HJ, Yang JY, Lee MJ, Kim HY, Song SY, Lee JH, Seo WD. Comparative Analysis of Policosanols Related to Growth Times from the Seedlings of Various Korean Oat (Avena sativa L.) Cultivars and Screening for Adenosine 5'-Monophosphate-Activated Protein Kinase (AMPK) Activation. Plants (Basel). 2022 Jul 14;11(14):1844. https://doi.org/10.3390/plants11141844. [CrossRef]
  20. Muthusamy M, Kim JH, Kim SH, Kim JY, Heo JW, Lee H, Lee KS, Seo WD, Park S, Kim JA, Lee SI. Changes in Beneficial C-glycosylflavones and Policosanol Content in Wheat and Barley Sprouts Subjected to Differential LED Light Conditions. Plants (Basel). 2020 Nov 6;9(11):1502. https://doi.org/10.3390/plants9111502. PMID: 33172036; PMCID: PMC7694615. [CrossRef]
  21. Zhang X, Ma C, Sun L, He Z, Feng Y, Li X, Gan J, Chen X. Effect of policosanol from insect wax on amyloid β-peptide-induced toxicity in a transgenic Caenorhabditis elegans model of Alzheimer's disease. BMC Complement Med Ther. 2021 Mar 30;21(1):103. https://doi.org/10.1186/s12906-021-03278-2. PMID: 33785017; PMCID: PMC8011155. [CrossRef]
  22. Venturelli A, Brighenti V, Mascolo D, Pellati F. A new strategy based on microwave-assisted technology for the extraction and purification of beeswax policosanols for pharmaceutical purposes and beyond. J Pharm Biomed Anal. 2019 Aug 5;172:200-205. https://doi.org/10.1016/j.jpba.2019.04.015. Epub 2019 Apr 9. PMID: 31060032. [CrossRef]
  23. Wong WT, Ismail M, Tohit ER, Abdullah R, Zhang YD. Attenuation of Thrombosis by Crude Rice (Oryza sativa) Bran Policosanol Extract: Ex Vivo Platelet Aggregation and Serum Levels of Arachidonic Acid Metabolites. Evid Based Complement Alternat Med. 2016;2016:7343942. https://doi.org/10.1155/2016/7343942. Epub 2016 Oct 5. PMID: 27800004; PMCID: PMC5069368. [CrossRef]
  24. Ishaka A, Umar Imam M, Mahamud R, Zuki AB, Maznah I. Characterization of rice bran wax policosanol and its nanoemulsion formulation. Int J Nanomedicine. 2014 May 9;9:2261-9. https://doi.org/10.2147/IJN.S56999. [CrossRef]
  25. Saavedra, D., Añé-Kourí, A. L., Barzilai, N., Caruso, C., Cho, K. H., Fontana, L., Franceschi, C., Frasca, D., Ledón, N., Niedernhofer, L. J., Pereira, K., Robbins, P. D., Silva, A., Suarez, G. M., Berghe, W. V., von Zglinicki, T., Pawelec, G., & Lage, A. (2023). Aging and chronic inflammation: highlights from a multidisciplinary workshop. Immunity & ageing : I & A, 20(1), 25. https://doi.org/10.1186/s12979-023-00352-w. [CrossRef]
  26. Cho, K. H., Kim, S. J., Yadav, D., Kim, J. Y., & Kim, J. R. (2018). Consumption of Cuban Policosanol Improves Blood Pressure and Lipid Profile via Enhancement of HDL Functionality in Healthy Women Subjects: Randomized, Double-Blinded, and Placebo-Controlled Study. Oxidative medicine and cellular longevity, 2018, 4809525. https://doi.org/10.1155/2018/4809525. [CrossRef]
  27. Park HJ, Yadav D, Jeong DJ, Kim SJ, Bae MA, Kim JR, Cho KH. Short-Term Consumption of Cuban Policosanol Lowers Aortic and Peripheral Blood Pressure and Ameliorates Serum Lipid Parameters in Healthy Korean Participants: Randomized, Double-Blinded, and Placebo-Controlled Study. Int J Environ Res Public Health. 2019 Mar 5;16(5):809. https://doi.org/10.3390/ijerph16050809. PMID: 30841655; PMCID: PMC6427682. [CrossRef]
  28. Cho, K. H., Kim, S. J., Yadav, D., Kim, J. Y., & Kim, J. R. (2018). Consumption of Cuban Policosanol Improves Blood Pressure and Lipid Profile via Enhancement of HDL Functionality in Healthy Women Subjects: Randomized, Double-Blinded, and Placebo-Controlled Study. Oxidative medicine and cellular longevity, 2018, 4809525. https://doi.org/10.1155/2018/4809525. [CrossRef]
  29. Kim JH, Lim DK, Suh YH, Chang KA. Long-Term Treatment of Cuban Policosanol Attenuates Abnormal Oxidative Stress and Inflammatory Response via Amyloid Plaques Reduction in 5xFAD Mice. Antioxidants (Basel). 2021 Aug 23;10(8):1321. https://doi.org/10.3390/antiox10081321. PMID: 34439569; PMCID: PMC8389325. [CrossRef]
  30. Cho, K. H., Baek, S. H., Nam, H. S., Kim, J. E., Kang, D. J., Na, H., & Zee, S. (2023). Cuban Sugar Cane Wax Alcohol Exhibited Enhanced Antioxidant, Anti-Glycation and Anti-Inflammatory Activity in Reconstituted High-Density Lipoprotein (rHDL) with Improved Structural and Functional Correlations: Comparison of Various Policosanols. International journal of molecular sciences, 24(4), 3186. https://doi.org/10.3390/ijms24043186. [CrossRef]
  31. Jin, S., & Cho, K. H. (2011). Water extracts of cinnamon and clove exhibits potent inhibition of protein glycation and anti-atherosclerotic activity in vitro and in vivo hypolipidemic activity in zebrafish. Food and chemical toxicology : an international journal published for the British Industrial Biological Research Association, 49(7), 1521–1529. https://doi.org/10.1016/j.fct.2011.03.043. [CrossRef]
  32. Yoon, J. H., & Cho, K. H. (2012). A point mutant of apolipoprotein A-I (V156K) showed enhancement of cellular insulin secretion and potent activity of facultative regeneration in zebrafish. Rejuvenation research, 15(3), 313–321. https://doi.org/10.1089/rej.2011.1246. [CrossRef]
  33. Stoletov, K., Fang, L., Choi, S. H., Hartvigsen, K., Hansen, L. F., Hall, C., Pattison, J., Juliano, J., Miller, E. R., Almazan, F., Crosier, P., Witztum, J. L., Klemke, R. L., & Miller, Y. I. (2009). Vascular lipid accumulation, lipoprotein oxidation, and macrophage lipid uptake in hypercholesterolemic zebrafish. Circulation research, 104(8), 952–960. https://doi.org/10.1161/CIRCRESAHA.108.189803. [CrossRef]
  34. Lee, E. Y., Yoo, J. A., Lim, S. M., & Cho, K. H. (2016). Anti-Aging and Tissue Regeneration Ability of Policosanol Along with Lipid-Lowering Effect in Hyperlipidemic Zebrafish via Enhancement of High-Density Lipoprotein Functionality. Rejuvenation research, 19(2), 149–158. https://doi.org/10.1089/rej.2015.1745. [CrossRef]
  35. Su, Y., He, L., Hu, Z., Li, Y., Zhang, Y., Fan, Z., Zhao, K., Zhang, H., & Liu, C. (2021). Obesity Causes Abrupt Changes in the Testicular Microbiota and Sperm Motility of Zebrafish. Frontiers in immunology, 12, 639239. https://doi.org/10.3389/fimmu.2021.639239. [CrossRef]
  36. Verit, F. F., Yildiz Zeyrek, F., Zebitay, A. G., & Akyol, H. (2017). Cardiovascular risk may be increased in women with unexplained infertility. Clinical and experimental reproductive medicine, 44(1), 28–32. https://doi.org/10.5653/cerm.2017.44.1.28. [CrossRef]
  37. Whitfield, M., Guiton, R., Rispal, J., Acar, N., Kocer, A., Drevet, J. R., & Saez, F. (2017). Dyslipidemia alters sperm maturation and capacitation in LXR-null mice. Reproduction (Cambridge, England), 154(6), 827–842. https://doi.org/10.1530/REP-17-0467 Reproduction (2017) 154: 827–842]. [CrossRef]
  38. Cho, K.-H.; Kim, J.-E.; Komatsu, T.; Uehara, Y. Protection of Liver Functions and Improvement of Kidney Functions by Twelve Weeks Consumption of Cuban Policosanol (Raydel®) with a Decrease of Glycated Hemoglobin and Blood Pressure from a Randomized, Placebo-Controlled, and Double-Blinded Study with Healthy and Middle-Aged Japanese Participants. Life 2023, 13, 1319. https://doi.org/10.3390/life13061319. [CrossRef]
  39. Cho, K. H., Nam, H. S., Baek, S. H., Kang, D. J., Na, H., Komatsu, T., & Uehara, Y. (2023). Beneficial Effect of Cuban Policosanol on Blood Pressure and Serum Lipoproteins Accompanied with Lowered Glycated Hemoglobin and Enhanced High-Density Lipoprotein Functionalities in a Randomized, Placebo-Controlled, and Double-Blinded Trial with Healthy Japanese. International journal of molecular sciences, 24(6), 5185. https://doi.org/10.3390/ijms24065185. [CrossRef]
  40. Ramiro Zardoya, Leonel Tula, Gladys Castaño, Rosa Más, Jose Illnait, Julio C. Fernández, Eduardo Díaz, Lilia Fernández, Effects of policosanol on hypercholesterolemic patients with abnormal serum biochemical indicators of hepatic function, Current Therapeutic Research, Volume 57, Issue 7, 1996, Pages 568-577, ISSN 0011-393X, https://doi.org/10.1016/S0011-393X(96)80068-3. [CrossRef]
  41. Yan, F., Zhao, Q., Li, Y., Zheng, Z., Kong, X., Shu, C., Liu, Y., & Shi, Y. (2022). The role of oxidative stress in ovarian aging: a review. Journal of ovarian research, 15(1), 100. https://doi.org/10.1186/s13048-022-01032-x. [CrossRef]
  42. Lee, E. Y., & Cho, K. H. (2016). High-dose consumption of NaCl resulted in severe degradation of lipoproteins associated with hyperlipidemia, hyperglycemia, and infertility via impairment of testicular spermatogenesis. Toxicology research, 5(2), 557–569. https://doi.org/10.1039/c5tx00059a. [CrossRef]
  43. Cho, K. H., Yadav, D., Kim, S. J., & Kim, J. R. (2018). Blood Pressure Lowering Effect of Cuban Policosanol is Accompanied by Improvement of Hepatic Inflammation, Lipoprotein Profile, and HDL Quality in Spontaneously Hypertensive Rats. Molecules (Basel, Switzerland), 23(5), 1080. https://doi.org/10.3390/molecules23051080. [CrossRef]
  44. Rodríguez, M. D., Sánchez, M., & García, H. (1997). Multigeneration reproduction study of policosanol in rats. Toxicology letters, 90(2-3), 97–106. https://doi.org/10.1016/s0378-4274(96)03844-1. [CrossRef]
  45. Rodríguez, M. D., & García, H. (1994). Teratogenic and reproductive studies of policosanol in the rat and rabbit. Teratogenesis, carcinogenesis, and mutagenesis, 14(3), 107–113. https://doi.org/10.1002/tcm.1770140302. [CrossRef]
  46. Klisic, A., Isakovic, A., Kocic, G., Kavaric, N., Jovanovic, M., Zvrko, E., Skerovic, V., & Ninic, A. (2018). Relationship between Oxidative Stress, Inflammation and Dyslipidemia with Fatty Liver Index in Patients with Type 2 Diabetes Mellitus. Experimental and clinical endocrinology & diabetes : official journal, German Society of Endocrinology [and] German Diabetes Association, 126(6), 371–378. https://doi.org/10.1055/s-0043-118667. [CrossRef]
  47. Gonnella, F., Konstantinidou, F., Di Berardino, C., Capacchietti, G., Peserico, A., Russo, V., Barboni, B., Stuppia, L., & Gatta, V. (2022). A Systematic Review of the Effects of High-Fat Diet Exposure on Oocyte and Follicular Quality: A Molecular Point of View. International journal of molecular sciences, 23(16), 8890. https://doi.org/10.3390/ijms23168890. [CrossRef]
  48. Ruebel, M. L., Cotter, M., Sims, C. R., Moutos, D. M., Badger, T. M., Cleves, M. A., Shankar, K., & Andres, A. (2017). Obesity Modulates Inflammation and Lipid Metabolism Oocyte Gene Expression: A Single-Cell Transcriptome Perspective. The Journal of clinical endocrinology and metabolism, 102(6), 2029–2038. https://doi.org/10.1210/jc.2016-3524. [CrossRef]
  49. Nusslein-Volhard, C.; Dahm, R. Zebrafish: A Practical Approach, 1st ed.; Oxford University Press: Oxford, UK, 2002.
  50. National Research Council of the National Academy of Sciences. Guide for the Care and Use of Laboratory Animals; National Academy Press: Washington, DC, USA, 2010.
  51. Cho, K. H., Nam, H. S., Kim, J. E., Na, H. J., Del Carmen Dominguez-Horta, M., & Martinez-Donato, G. (2023). CIGB-258 Exerts Potent Anti-Inflammatory Activity against Carboxymethyllysine-Induced Acute Inflammation in Hyperlipidemic Zebrafish via the Protection of Apolipoprotein A-I. International journal of molecular sciences, 24(8), 7044. https://doi.org/10.3390/ijms24087044. [CrossRef]
  52. Owusu-Ansah, E.; Yavari, A.; Mandal, S.; Banerjee, U., Distinct mitochondrial retrograde signals control the G1-S cell cycle checkpoint. Nature genetics 2008, 40, (3), 356-361.
  53. Cho, K. H., Kim, J. E., Bahuguna, A., & Kang, D. J. (2023). Long-Term Supplementation of Ozonated Sunflower Oil Improves Dyslipidemia and Hepatic Inflammation in Hyperlipidemic Zebrafish: Suppression of Oxidative Stress and Inflammation against Carboxymethyllysine Toxicity. Antioxidants (Basel, Switzerland), 12(6), 1240. https://doi.org/10.3390/antiox12061240. [CrossRef]
  54. Patel, U. N., Patel, U. D., Khadayata, A. V., Vaja, R. K., Modi, C. M., & Patel, H. B. (2022). Long-term exposure of the binary mixture of cadmium and mercury damages the developed ovary of adult zebrafish. Environmental science and pollution research international, 29(29), 44928–44938. https://doi.org/10.1007/s11356-022-18988-4. [CrossRef]
  55. Sutha, J., Anila, P. A., Gayathri, M., & Ramesh, M. (2022). Long term exposure to tris (2-chloroethyl) phosphate (TCEP) causes alterations in reproductive hormones, vitellogenin, antioxidant enzymes, and histology of gonads in zebrafish (Danio rerio): In vivo and computational analysis. Comparative biochemistry and physiology. Toxicology & pharmacology : CBP, 254, 109263. https://doi.org/10.1016/j.cbpc.2021.109263. [CrossRef]
  56. Sabaliauskas, N. A., Foutz, C. A., Mest, J. R., Budgeon, L. R., Sidor, A. T., Gershenson, J. A., Joshi, S. B., & Cheng, K. C. (2006). High-throughput zebrafish histology. Methods (San Diego, Calif.), 39(3), 246–254. https://doi.org/10.1016/j.ymeth.2006.03.001. [CrossRef]
  57. N. D. Koc, N. Teksöz, M. Ural and C. Akbulut, Elixir Aquacult., 2012, 46, Histological structure of zebrafish (Danio rerio, Hamilton, 1822) testicles 8117–8120.
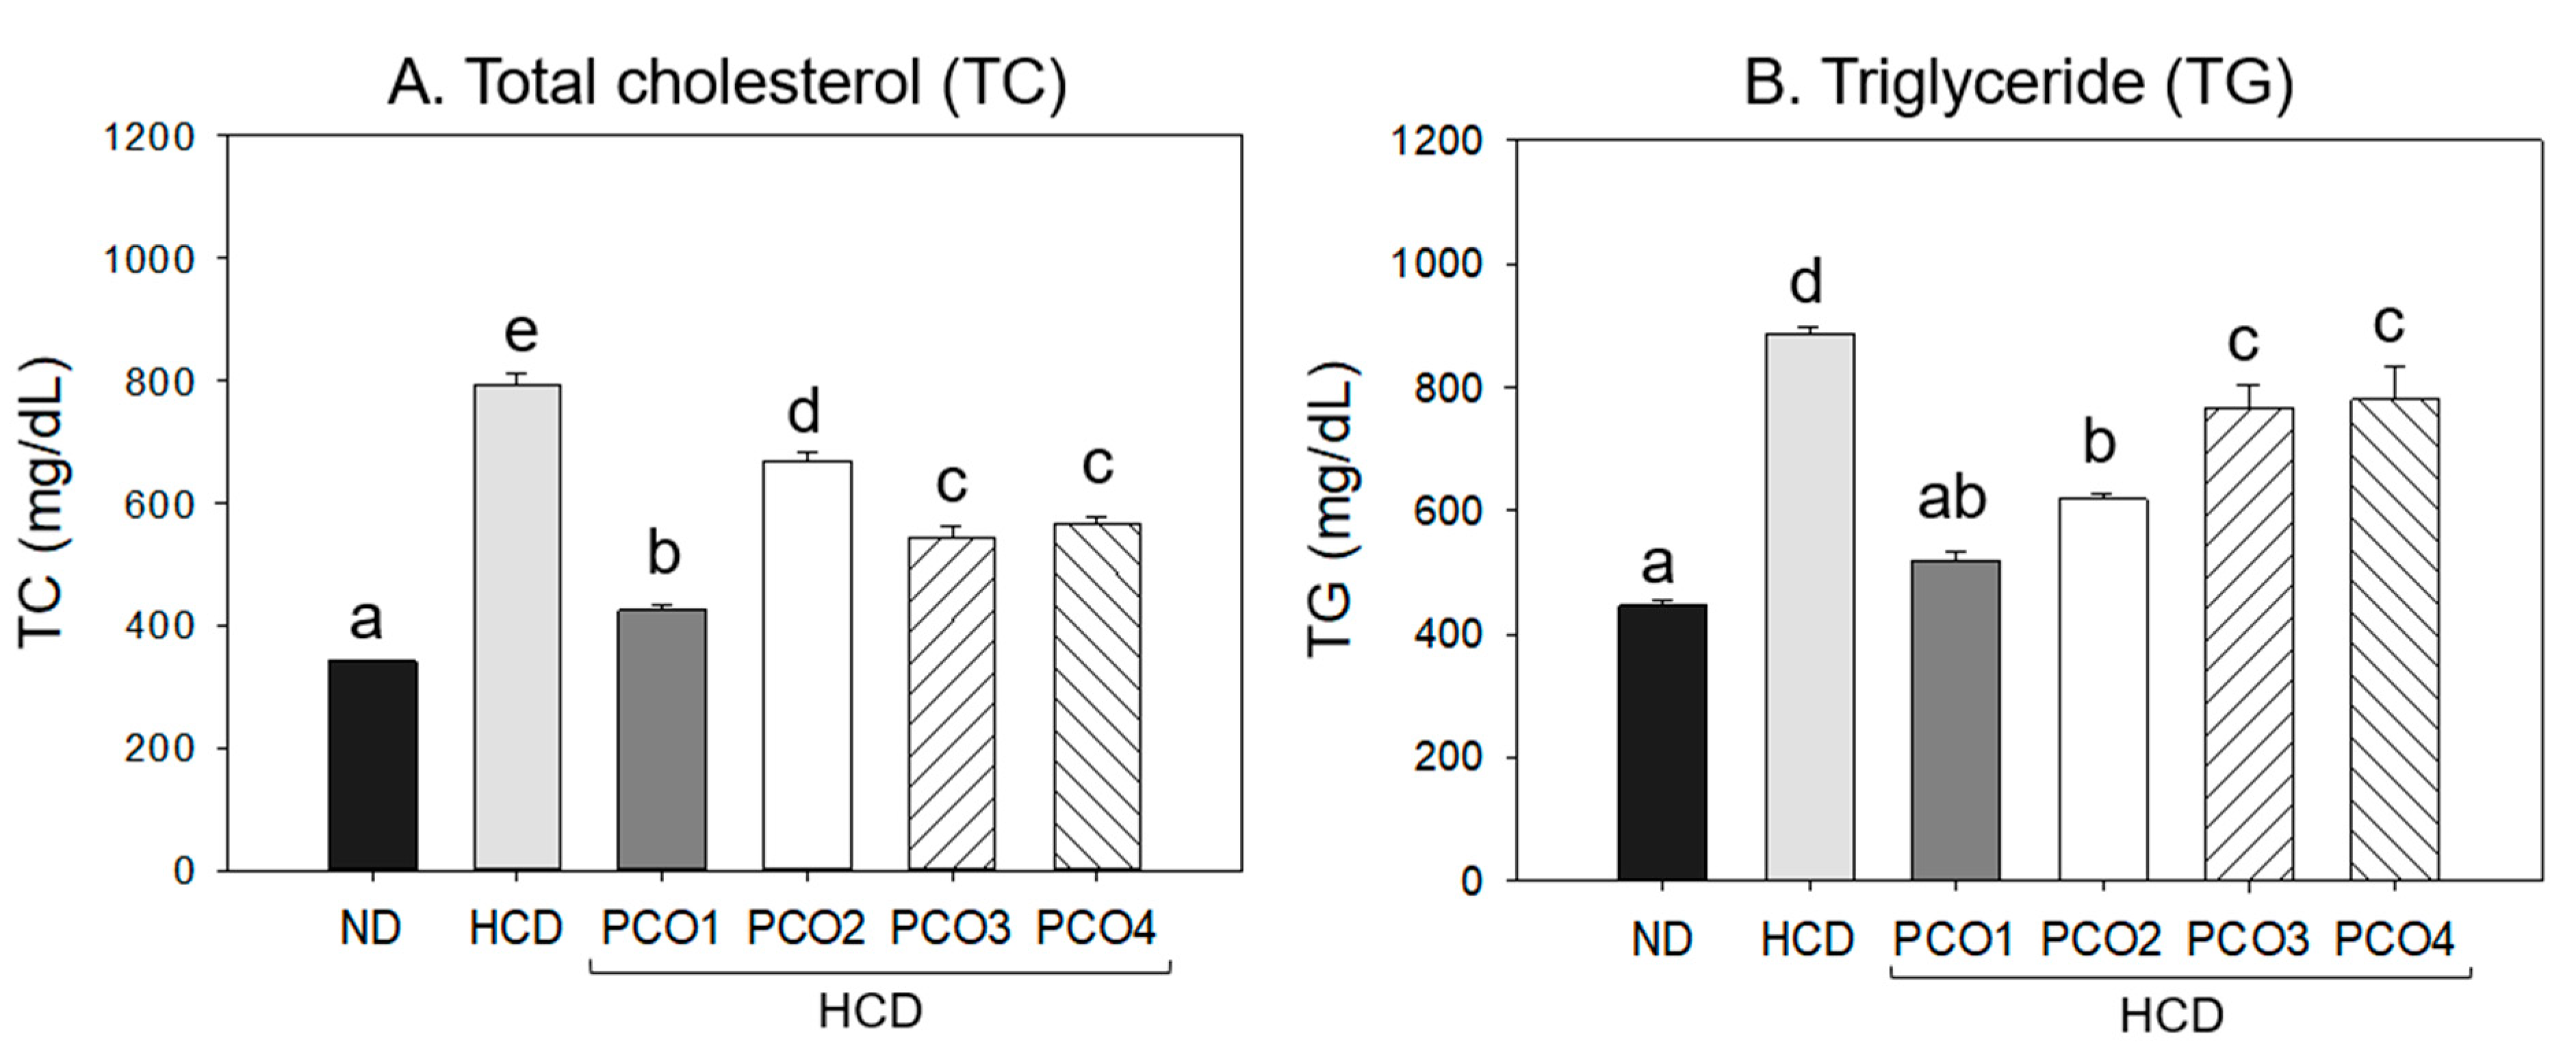
Figure 1. Total cholesterol (TC) and triglyceride (TG) contents in the blood after 12 weeks of supplementation of each policosanol (PCO) under high-cholesterol diet consumption. HCD, high cholesterol diet; ND, normal diet; PCO1, Raydel policosanol; PCO2, Xi’an Natural policosanol; PCO3, Xi’an Realin policosanol; PCO4, Shaanxi policosanol. The different letters on each bar indicate the significant differences between the groups (p<0.05).
Preprints 79436 g001
Figure 2. High-density lipoproteins cholesterol (HDL-C) and HDL-C in the total cholesterol (HDL-C/TC, %) contents in the blood after 12 weeks supplementation of each policosanol (PCO) under high cholesterol diet consumption. HCD, high cholesterol diet; ND, normal diet; PCO1, Raydel policosanol; PCO2, Xi’an Natural policosanol; PCO3, Xi’an Realin policosanol; PCO4, Shaanxi policosanol. The different letters on each bar indicate significant differences between the groups (p<0.05).
Preprints 79436 g002
Figure 3. Low-density lipoproteins cholesterol (LDL-C) contents and LDL-C/HDL-C ratio in blood after 12 weeks supplementation of each policosanol (PCO) under high cholesterol diet consumption. HCD, high cholesterol diet; ND, normal diet; PCO1, Raydel policosanol; PCO2, Xi’an Natural policosanol; PCO3, Xi’an Realin policosanol; PCO4, Shaanxi policosanol. The different letters on each bar indicate a significant differences between the groups (p<0.05).
Preprints 79436 g003
Figure 4. Change in the non-HDL-C and the triglyceride (TG)/HDL-C ratio in the blood after 12 weeks of supplementation of each policosanol (PCO) under high cholesterol diet consumption. The different letters on each bar indicate a significant differences between the groups (p<0.05). (A)Non-high-density lipoproteins cholesterol (non-HDL-C). (B) TG/HDL-C ratio. HCD, high cholesterol diet; ND, normal diet; PCO1, Raydel policosanol; PCO2, Xi’an Natural policosanol; PCO3, Xi’an Realin policosanol; PCO4, Shaanxi policosanol.
Preprints 79436 g004
Figure 5. Comparison of the blood hepatic damage parameters of aspartate aminotransferase (AST) and alanine aminotransferase (AST) after 12 weeks supplementation of each policosanol under high-cholesterol diet consumption. HCD, high cholesterol diet; ND, normal diet; PCO1, Raydel policosanol; PCO2, Xi’an Natural policosanol; PCO3, Xi’an Realin policosanol; PCO4, Shaanxi policosanol. The different letters on each bar indicate a significant difference between the groups (p<0.05).
Preprints 79436 g005
Figure 6. Histology analysis of the hepatic tissue from zebrafish after 12 weeks of supplementation of each policosanol (PCO) under high cholesterol diet consumption. HCD, high cholesterol diet; ND, normal diet; PCO1, Raydel policosanol; PCO2, Xi’an Natural policosanol; PCO3, Xi’an Realin policosanol; PCO4, Shaanxi policosanol. (A) Photographs showing the infiltration of neutrophils by Hematoxylin & Eosin (H&E) staining after converting the Hematoxylin stained area into a red intensity. The yellow scale bar indicates 100 m. (B) Quantification of the nucleus area from the H&E staining using Image J software (http://rsb.info.nih.gov/ij/accessed on 16 May 2023). The statistical significance of the groups was indicated as p values at the top of the graph. *, p <0.05 versus HCD control; **, p<0.01 versus HCD control; ns, not significant.
Preprints 79436 g006aPreprints 79436 g006b
Figure 7. Comparisons of the fatty liver changes and reactive oxygen species (ROS) by Oil red O staining and dihydroethidium (DHE) staining, respectively, in zebrafish after 12 weeks supplementation of each policosanol (PCO) under high cholesterol diet consumption. HCD, high cholesterol diet; ND, normal diet; PCO1, Raydel policosanol; PCO2, Xi’an Natural policosanol; PCO3, Xi’an Realin policosanol; PCO4, Shaanxi policosanol. (A) Representative image of oil red O stained and DHE stained hepatic tissue at 180 min post-injection. The scale bar indicates 100 μm. (B) Quantification of the oil red O intensity and DHE fluorescence (Ex=585 nm, Em=615 nm) intensity using Image J software (http://rsb.info.nih.gov/ij/accessed on 16 May 2023). ***, p<0.001 versus HCD from the DHE-stained area; #, p<0.05 versus HCD from the AO-stained area; ##, p<0.01 versus HCD from the AO-stained area; ###, p<0.001 versus HCD from the AO-stained area ns, not significant.
Preprints 79436 g007
Figure 8. Comparison of the interleukin (IL)-6 stained area of immunohistochemistry (IHC) with hepatic tissue from zebrafish after 12 weeks supplementation of each policosanol (PCO) under high cholesterol diet consumption. HCD, high cholesterol diet; ND, normal diet; PCO1, Raydel policosanol; PCO2, Xi’an Natural policosanol; PCO3, Xi’an Realin policosanol; PCO4, Shaanxi policosanol. (A) Representative image of IL-6 stained hepatic tissue at 180 min post-injection. The scale bar indicates 100 μm. (B)Quantification of the oil red O intensity and DHE fluorescence (Ex=585 nm, Em=615 nm) intensity using Image J software (http://rsb.info.nih.gov/ij/accessed on 16 May 2023). ***, p < 0.001 versus HCD; ##, p < 0.01 versus HCD
Preprints 79436 g008
Figure 9. Comparisons of the ovarian cell morphology according to Hematoxylin and Eosin (H & E) staining, extent of reactive oxygen species (ROS) by dihydroethidium (DHE) staining, and extent of apoptosis by acridine orange (AO) staining in zebrafish after 12 weeks supplementation of each policosanol (PCO) under high cholesterol diet consumption. HCD, high cholesterol diet; ND, normal diet; PCO1, Raydel policosanol; PCO2, Xi’an Natural policosanol; PCO3, Xi’an Realin policosanol; PCO4, Shaanxi policosanol. (A) Representative image of H & E stained, DHE stained, and AO stained image of ovarian cells. The scale bar indicates 100 μm. E, early vitellogenic oocytes; M, mature vitellogenic oocytes; P, pre-vitellogenic oocytes. (B) Percentage distribution of the stages in oocytes depends on the developmental stage. ***, p < 0.001 versus HCD in early and mature vitellogenic; ###, p < 0.01 versus HCD in pre-vitellogenic; *, p<0.05 versus HCD in mature-vitellogenic. (C) Quantification of the DHE fluorescence (Ex=585 nm, Em=615 nm) intensity and acridine orange fluorescence in oocytes (Ex=505 nm, Em=535 nm) using Image J software (http://rsb.info.nih.gov/ij/accessed on 16 May 2023). *, p<0.05 versus HCD from the DHE-stained area; ##, p<0.01 versus HCD from AO-stained area; #, p<0.05 versus HCD from the AO-stained area; ns, not significant.
Preprints 79436 g009
Figure 10. Comparison of the testicular histology in zebrafish after 12 weeks supplementation of each policosanol (PCO) under high cholesterol diet consumption. HCD, high cholesterol diet; ND, normal diet; PCO1, Raydel policosanol; PCO2, Xi’an Natural policosanol; PCO3, Xi’an Realin policosanol; PCO4, Shaanxi policosanol. (A) Representative image of a H & E stained testicular section and red conversion image to show empty intra/interspaces in seminiferous tubules. The red area indicates empty space. The scale bar indicates 100 μm. SC, spermatocytes; SG, spermatogonia; ST, spermatid; SZ, spermatozoa. (B) Quantification of the red area to compare the interstitial space in the testis using Image J software (http://rsb.info.nih.gov/ij/accessed on 16 May 2023). *, p<0.05 versus HCD; **, p<0.01 versus HCD; ***, p<0.001 versus HCD; ns, not significant.
Preprints 79436 g010
Figure 11. Comparison of the testicular cell morphology by Hematoxylin and Eosin (H & E) staining, the extent of reactive oxygen species (ROS) by dihydroethidium (DHE) staining, and the extent of apoptosis by acridine orange (AO) staining in zebrafish after 12 weeks supplementation of each policosanol (PCO) under a high cholesterol diet. HCD, high cholesterol diet; ND, normal diet; PCO1, Raydel policosanol; PCO2, Xi’an Natural policosanol; PCO3, Xi’an Realin policosanol; PCO4, Shaanxi policosanol. (A) Representative image of H & E stained, DHE stained, and AO stained image of a testicular cell. The red arrow indicates increased interstitial area. The scale bar indicates 100 μm. (B) Quantification of the DHE fluorescence intensity (Ex=585 nm, Em=615 nm) and AO fluorescence intensity (Ex=505 nm, Em=535 nm) using Image J software (http://rsb.info.nih.gov/ij/accessed on 16 May 2023). **, p<0.01 versus HCD from DHE-stained area; ***, p<0.001 versus HCD from DHE-stained area; ###, p<0.001 versus HCD from the AO-stained area; ns, not significant.
Preprints 79436 g011
Table 1. Diet composition and change of body weight and survivability during 12 weeks consumption of policosanol under high cholesterol diet (HCD).
HCD
Groups ND
control
Control PCO1
Raydel
Sugarcane
wax alcohol
PCO2
Xi’an Natural
Sugarcane
PCO3
Xi’an
Realin
Sugarcane
PCO4
Shaanxi
Rice bran
Diet composition
(%)
Tetrabits 100 96 95.9 95.9 95.9 95.9
Cholesterol
(%, wt./wt.)
- 4 4 4 4 4
PCO
(%, wt./wt.)
- - 0.1 0.1 0.1 0.1
Body weight
(mg)
0 276 ±13 275±9 278±12 265±8 262 ±7 271 ±5
12 507±14a 635 ±31 c 547±17 ab 605±23 bc 602±24bc 509±13 a
p - - < 0.001 ns ns < 0.001
Survi-vability
(%)
0 100
(n=70)
100
(n=70)
100
(n=70)
100
(n=70)
100
(n=70)
100
(n=70)
12 97
(n=68)
61
(n=43)
81
(n=53)
81
(n=53)
57
(n=40)
67
(n=47)
Data of body weight are expressed as mean±SEM. The p value indicates whether the ANCOVA is statistically significant between the HCD control group at week 0 and each group. ns, not significant. The letters in superscript indicate a statistical difference between the different groups (p<0.05). ND, normal diet; HCD, high cholesterol diet; PCO, policosanol.
Disclaimer/Publisher’s Note: The statements, opinions and data contained in all publications are solely those of the individual author(s) and contributor(s) and not of MDPI and/or the editor(s). MDPI and/or the editor(s) disclaim responsibility for any injury to people or property resulting from any ideas, methods, instructions or products referred to in the content.
Copyright: This open access article is published under a Creative Commons CC BY 4.0 license, which permit the free download, distribution, and reuse, provided that the author and preprint are cited in any reuse.
Prerpints.org logo

Preprints.org is a free preprint server supported by MDPI in Basel, Switzerland.

Subscribe

© 2024 MDPI (Basel, Switzerland) unless otherwise stated