1. Introduction
In cardiovascular diseases (CVDs), plaque builds up in the coronary artery, affecting blood flow [
1,
2]. CVD causes a lack of oxygen or nutrition in the heart and can lead to death. Annually, the American Heart Association releases statistical reports on heart disease, stroke, and cardio-vascular risk factors, and considerable research efforts are devoted to CVD [
3], including artificial polymer bypass graft transplants [
4,
5], stent material innovations, anti-thrombosis medicine studies [
6,
7], tissue engineering for artificial vascular grafts [
5], tissue-repair medicine for ischemia [
8], and the creation of biomarkers for detection [
1,
9,
10,
11].
Myocardial infarction (MI) describes myocardial cell death due to ischemia or the unbalanced supply within coronary arteries. Six types of MI exist [
11]. Except for type 3, which is cardiac arrest, all the other types of MI can be evaluated based on the biomarkers in blood circulation. What is a “good” cardiac biomarker? Cardiac biomarkers should comprise a protein that has a high concentration only in the myocardium, is rapidly released into the circulation system, and is present for a sufficiently long time while myocardial necrosis occurs [
11]. Practically, a biomarker needs to be easily detectable via a relatively inexpensive and straightforwardly designable assay.
In 2000, the European Society of Cardiology (ESC) and American College of Cardiology (ACC) employed cardiac troponin, a cardiac biomarker, for MI diagnosis. In contrast to many cardiac biomarkers employed for point-of-care testing [
11], cardiac troponins are regulatory proteins that control the calcium-mediated interaction of actin and myosin [
1]. Since the diagnosis of MI requires the increase or decrease in the troponin concentration, designing a detector that records dynamic troponin patterns is very useful and can assist in determining the diagnosis. In other words, the detection of troponin patterns can help differentiate MI from other etiologists of elevated troponins, thereby preventing diagnostic misclassification [
11,
12,
13]. Although numerous researchers have created simple and quantifiable sensors to detect cardiac troponins [
14], most researchers have focused on accuracy. No existing sensor can distinguish cardiac troponins based on the color change of the pattern. Furthermore, most sensors require readers, machines, and a careful reagent and structural arrangement [
10,
11,
15]. For example, an electrochemical chip requires a fine arrangement of nanostructures or quantum dots and has a long fabrication process, high costs, and long detection time. Second, a fluorescent chip has slightly shorter detection time than an electrochemical chip, but it requires a costly fluorescent detector. In comparison, a colorimetric chip employing horseradish peroxidase and 3,3′,5,5′-tetramethylbenzidine (HRP-TMB) as an enzyme-chromophore pair is more convenient, has shorter analysis time, and lower cost. However, traditional HRP-TMB platforms require costly UV–Vis detectors. In contrast traditional HRP-TMB platforms, by investigating the coating times and amounts for different layers, the proposed test strip developed herein using HRP-TMB does not require a detector. This study aims to create a device for detecting cardiac troponin I (cTnI) based on “naked-eye detection.” This device is easy to use, is low cost, and uses color patterns for diagnosis.
MI is a comparable matured disease that can be identified via clinical symptoms, such as electrocardiogram and cTnI biomarkers [
1,
10,
11,
15]. However, some diseases are unknown still unknown and require the recording of cTnI biomarker patterns. Thus, the proposed portable cTnI diagnosis test strip can be used to study pharmacokinetic and pharmacodynamic in clinical studies.
To design a naked-eye cTnI protein testing strip, the sandwich-ELISA-based model is used: bottom layer of primary cTnI antibody, middle layer of cTnI standard protein, and top layer of secondary cTnI antibody. The best binding time and amount of each layer are analyzed.
2. Materials and Methods
2.1. Fabricate cTnI Naked-Eye Detection Well Strips
Coat the cTnI primary antibody (1Ab) at the bottom of each well for the first layer. Assemble the 96 well plate (SIWARD LSPR02 or Corning 3596 clear bottom high bind 96 well plate). More plates can be assembled and more solutions can be prepared. Prepare the cTnI primary antibody (1Ab) stock solution as follows: dissolve monoclonal mouse anti-cTnI (HyTest 4T21cc, 25 kDa) 2 μg/mL in phosphate buffered saline (PBS). Use a multi-channel pipette and add 100 μL/well. Incubate using the super adsorption machine (SIWARD Crystal) at 15 W for 20 min. Rotate the 96 well plate 180° after 10 min to prevent uneven coating on the edge wells. Alternately, this procedure can be performed via incubation at room temperature for over 1 h. The 1Ab coating goal is approximately 0.1 μg/well, that is, for 0.07065 cm2 per well, the area coverage is 7.065 ng/cm2. The maximum loading quantity is 1 μg/well; a value higher than this will cause oversaturation and yield a highly detached second layer since the antibody-protein binding requires space. Next, remove the solution and wash each well 3–4 times with 1X PBS tween (PBST, Sigma-Aldrich 3563) using a well wash machine (Thermo Fisher Wellwash).
Block and prevent non-specific binding. Prepare a blocking buffer, 5% (w/v) bovine serum albumin (BSA)/PBST, and add 100 μL blocking butter into each well through a multi-channel pipette. Cover the plate with aluminum foil and incubate at room temperature for 1 h. Remove the solution and wash each well 3–4 times with 1X PBST.
Coat standard protein cTnI as the second layer. Prepare a standard cTnI protein stock solution in PBS buffer, 1 μg/mL cTnI (recombinant protein human cTnI, HyTest/8RT17, 24 kDa), and series dilute to 8, 1.6, 0.32, and 0.064 ng/mL. Take one strip of the well, including eight wells. From the top to the bottom well, i.e., well A–H, add 8, 1.6, 0.32, 0.064, 0, 0, 0, and 0 ng/mL of cTnI protein solution, respectively. This step can be expanded from 1 strip to 12 strips (or more) according to requirements. Cover the plate with aluminum foil and incubate at room temperature for 2 h. Remove the solution and wash each well 3–4 times with 1X PBST.
Airtight package for storage. Remove the solution from the well and place three well strips into a vacuum bag. That is, three strips in a bag sealed and packed under −76 cmHg for 10 s.
2.2. cTnI Naked-Eye Detection Well Strips for Test Patients and Healthy Human Serum
Prepare healthy human serum (Millipore S1-100 mL) 15 mL. Prepare three spike samples (patient samples) as follows: dissolve and series dilute cTnI standard protein in healthy human serum in three concentrations: T1 = 0.08 ng/mL, T2 = 0.64 ng/mL, and T3 = 1.28 ng/mL.
Open the cTnI naked-eye detection strip wells package and take one strip. On the strip, from the top well A to well E, add healthy human serum 100 μL per well (only the PBS buffer can also be added)(Reagent A = PBS). For wells F, G, and H, add T1, T2, and T3, respectively (pricking blood sample within PBS 100 μL can also be added). Incubate for 30 min. Wash the wells using PBST three times (deionized or normal water can also be used). *Another “10X dilute human serum” is the patient sample that is diluted 10 times by PBS, that is, the concentrations is T1′ = 0.008 ng/mL, T2′ = 0.064 ng/mL, and T3′=0.128 ng/mL.
Prepare cTnI secondary antibody linked by the HRP stock solution (2Ab-HRP). Dissolve monoclonal mouse anti-cTnI (HyTest 16A11) into 0.37 μg/mL (Reagent B). Use a multi-pipette and add 100 μL into each well. Incubate at room temperature for 30 min, and then wash the well with 1X PBST 3–4 times (deionized or normal water can also be used).
Add TMB. Add 100 μL of 1X TMB (3,3’, 5,5”-tetramethylbenzidine from sigma-Aldrich) into each well, incubate for 10 min, and then quench with 50 μL of 2N H2SO4. Check the intensity of the yellow color and compare with the standard color to track the patient serum’s cTnI concentration pattern. To compute the amount, multiply the color code value with the conversion factor 15±7.14 for human serum and 1.84±0.76 for 10X dilute human serum. Compare the color pattern between the sample and reference to determine the diagnosis.
Measure UV absorbance. To measure the exact amount of cTnI, use a UV detector to measure the absorbance at 450 and 620 nm. Subtract A620 from A450 and plot it against the cTnI concentration. Establish the calibration curve and record the value for each well.
Design to use for public. Reagent A = PBS or deionized water; Reagent B = 2Ab-HRP; Reagent C = TMB; Reagent D = 2N H2SO4; Washing buffer = PBST
3. Results and Discussion
The secondary antibody. Gold nanoparticles and HRP can both serve as a secondary antibody and are good tools for application in the naked-eye detection of cTnI since they both have color changing properties. Lin et al. [
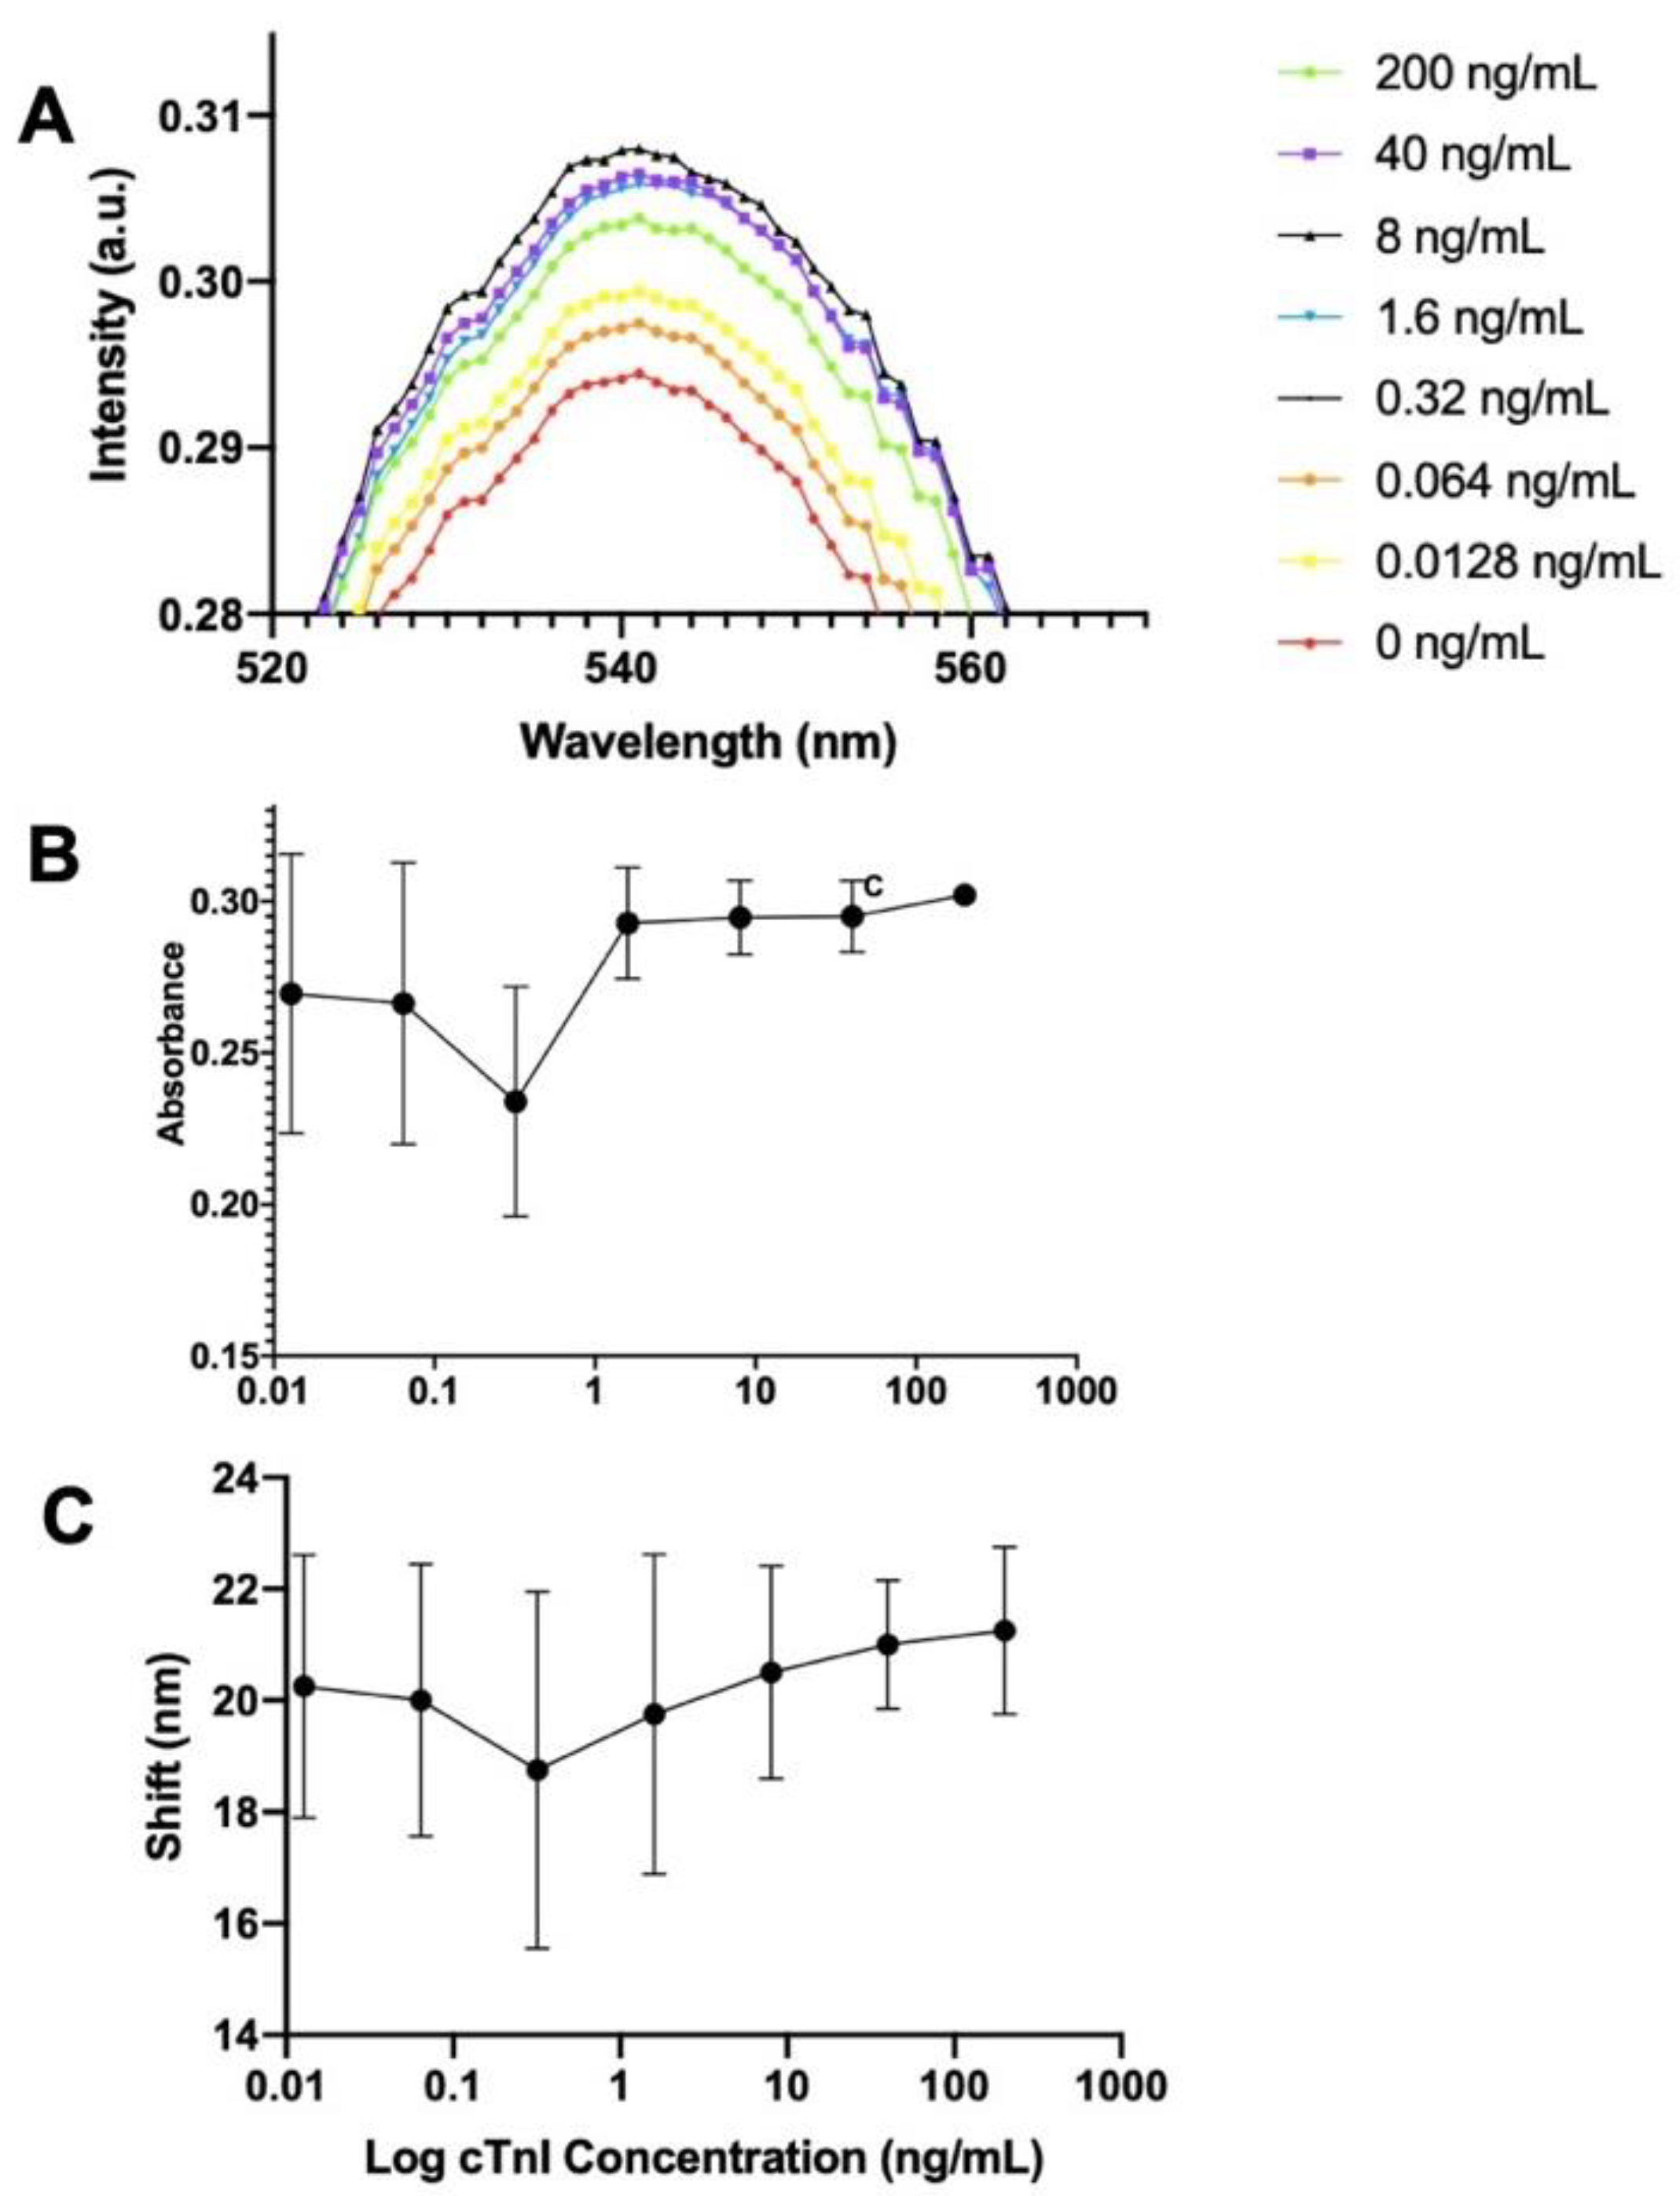
13] developed the gold hot spot method, wherein Au nanoparticles (approximately 15 nm in diameter) are aggregated and clustered on the top of an antibody, which increased the Au particles’ diameter. When the bottom of the wells is coated by another layer of Au particles, these two layers of Au lead a wavelength shift. This is called the localized surface plasmon resonance (LSPR) effect. The standard cTnI protein increases with the absorbance of the 540 nm signal, as shown in
Figure 1A. The quantity non-linearly changes in this wavelength, which complicates the data analysis. The same situation remains after the background correction of absorbance (
Figure 1B). In order to analyze correctly, we change the analyzing method: 550 nm is considered as the origin point, and the wavelength shift is plotted against the logarithm of the cTnI concentration. This analysis method successfully got a linear slope with dynamic range around 0.5 to 1000 ng/mL cTnI. The red shift peak trend proves the existence of the LSPR signal (
Figure 1C). In other words, the cTnI protein concentration increases as the wavelength changes. However, the difference in color of the wavelength is still not large enough to distinguish by the naked eye, which is our main goal in this study. Thus, the secondary antibody HRP-2Ab is selected as candidate for our work instead. In addition, seeing the evidence of error bar decreasing in
Figure 1B (note c) can prove that studying the dilution ratio can be a way to increase the resolution in this ELISA system. This helps establish our study plan. Even though HRP is selected as secondary antibody in this study, gold-nanoparticle-secondary-antibody with LSPR signal is a good preliminary experimental tool to reveal details for establishing analysis plan. That is, it can see through details and is more sensitive than other method.
HRP is employed as the secondary antibody candidate. A bottom-up, layer-by-layer method, is used for creating our rapid-test kit.
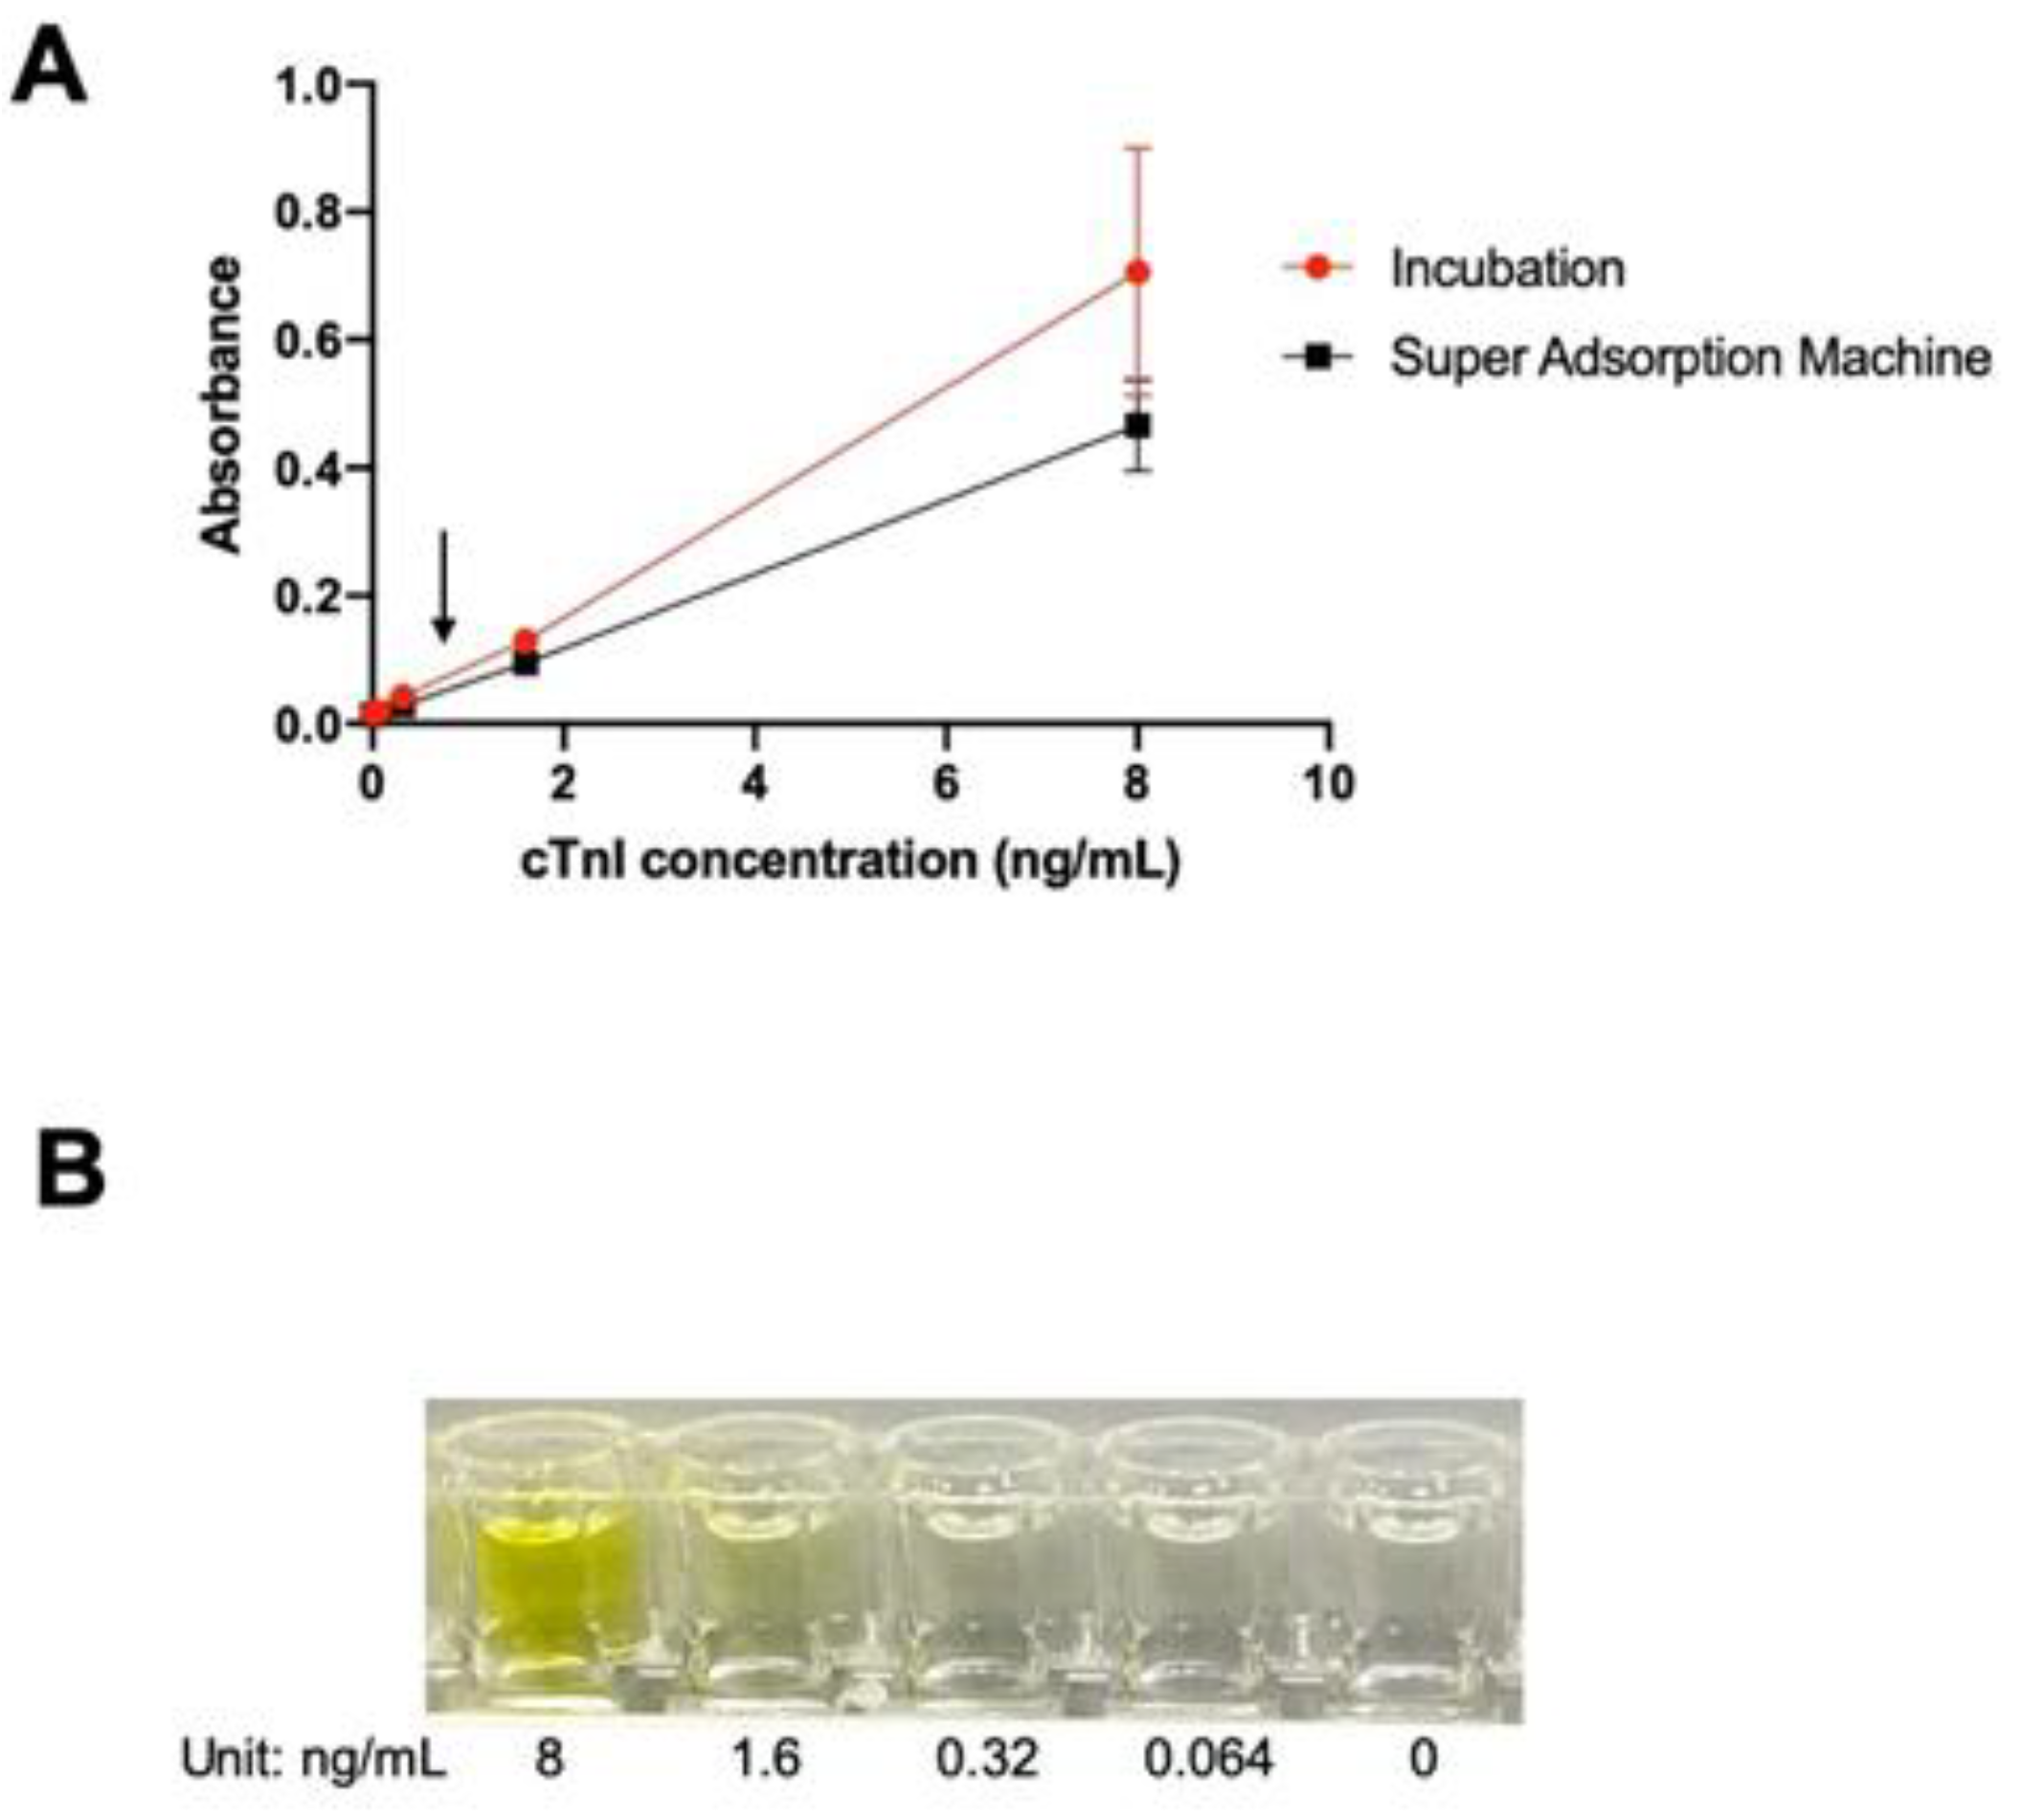
The bottom layer concentration. Two increase the resolution, the coating method is studied by two ways. The bottom layer, which is coated by the primary cTnI antibody, is coated by incubation for 1 hour in room temperature or by super-absorption-machine which is similar as microwave method for 15 mins (
Figure 3A).
Room temperature incubation suffers a high error bar even though it has a more sensitive response dynamic range comparing to super-absorption-machine. Super-adsorption-machine method is used for the bottom layer coating. The arrow in
Figure 3A indicates the area which is our main focus to increase the resolution for being seen by human eyes. To focus on “this cTnI traces testing can be seen”, a picture of well row before white background is taken (
Figure 3B). This well row will be design into a white paper test strip in the future. Concentrations of 0.32–8.00 ng/mL can be detected with the human eyes. Although not shown in the figure, the yellow color is distinguishable till the maximum concentration of 200 ng/mL. The lowest limit of detection (LOD) by the naked eye is 0.32 ng/mL.
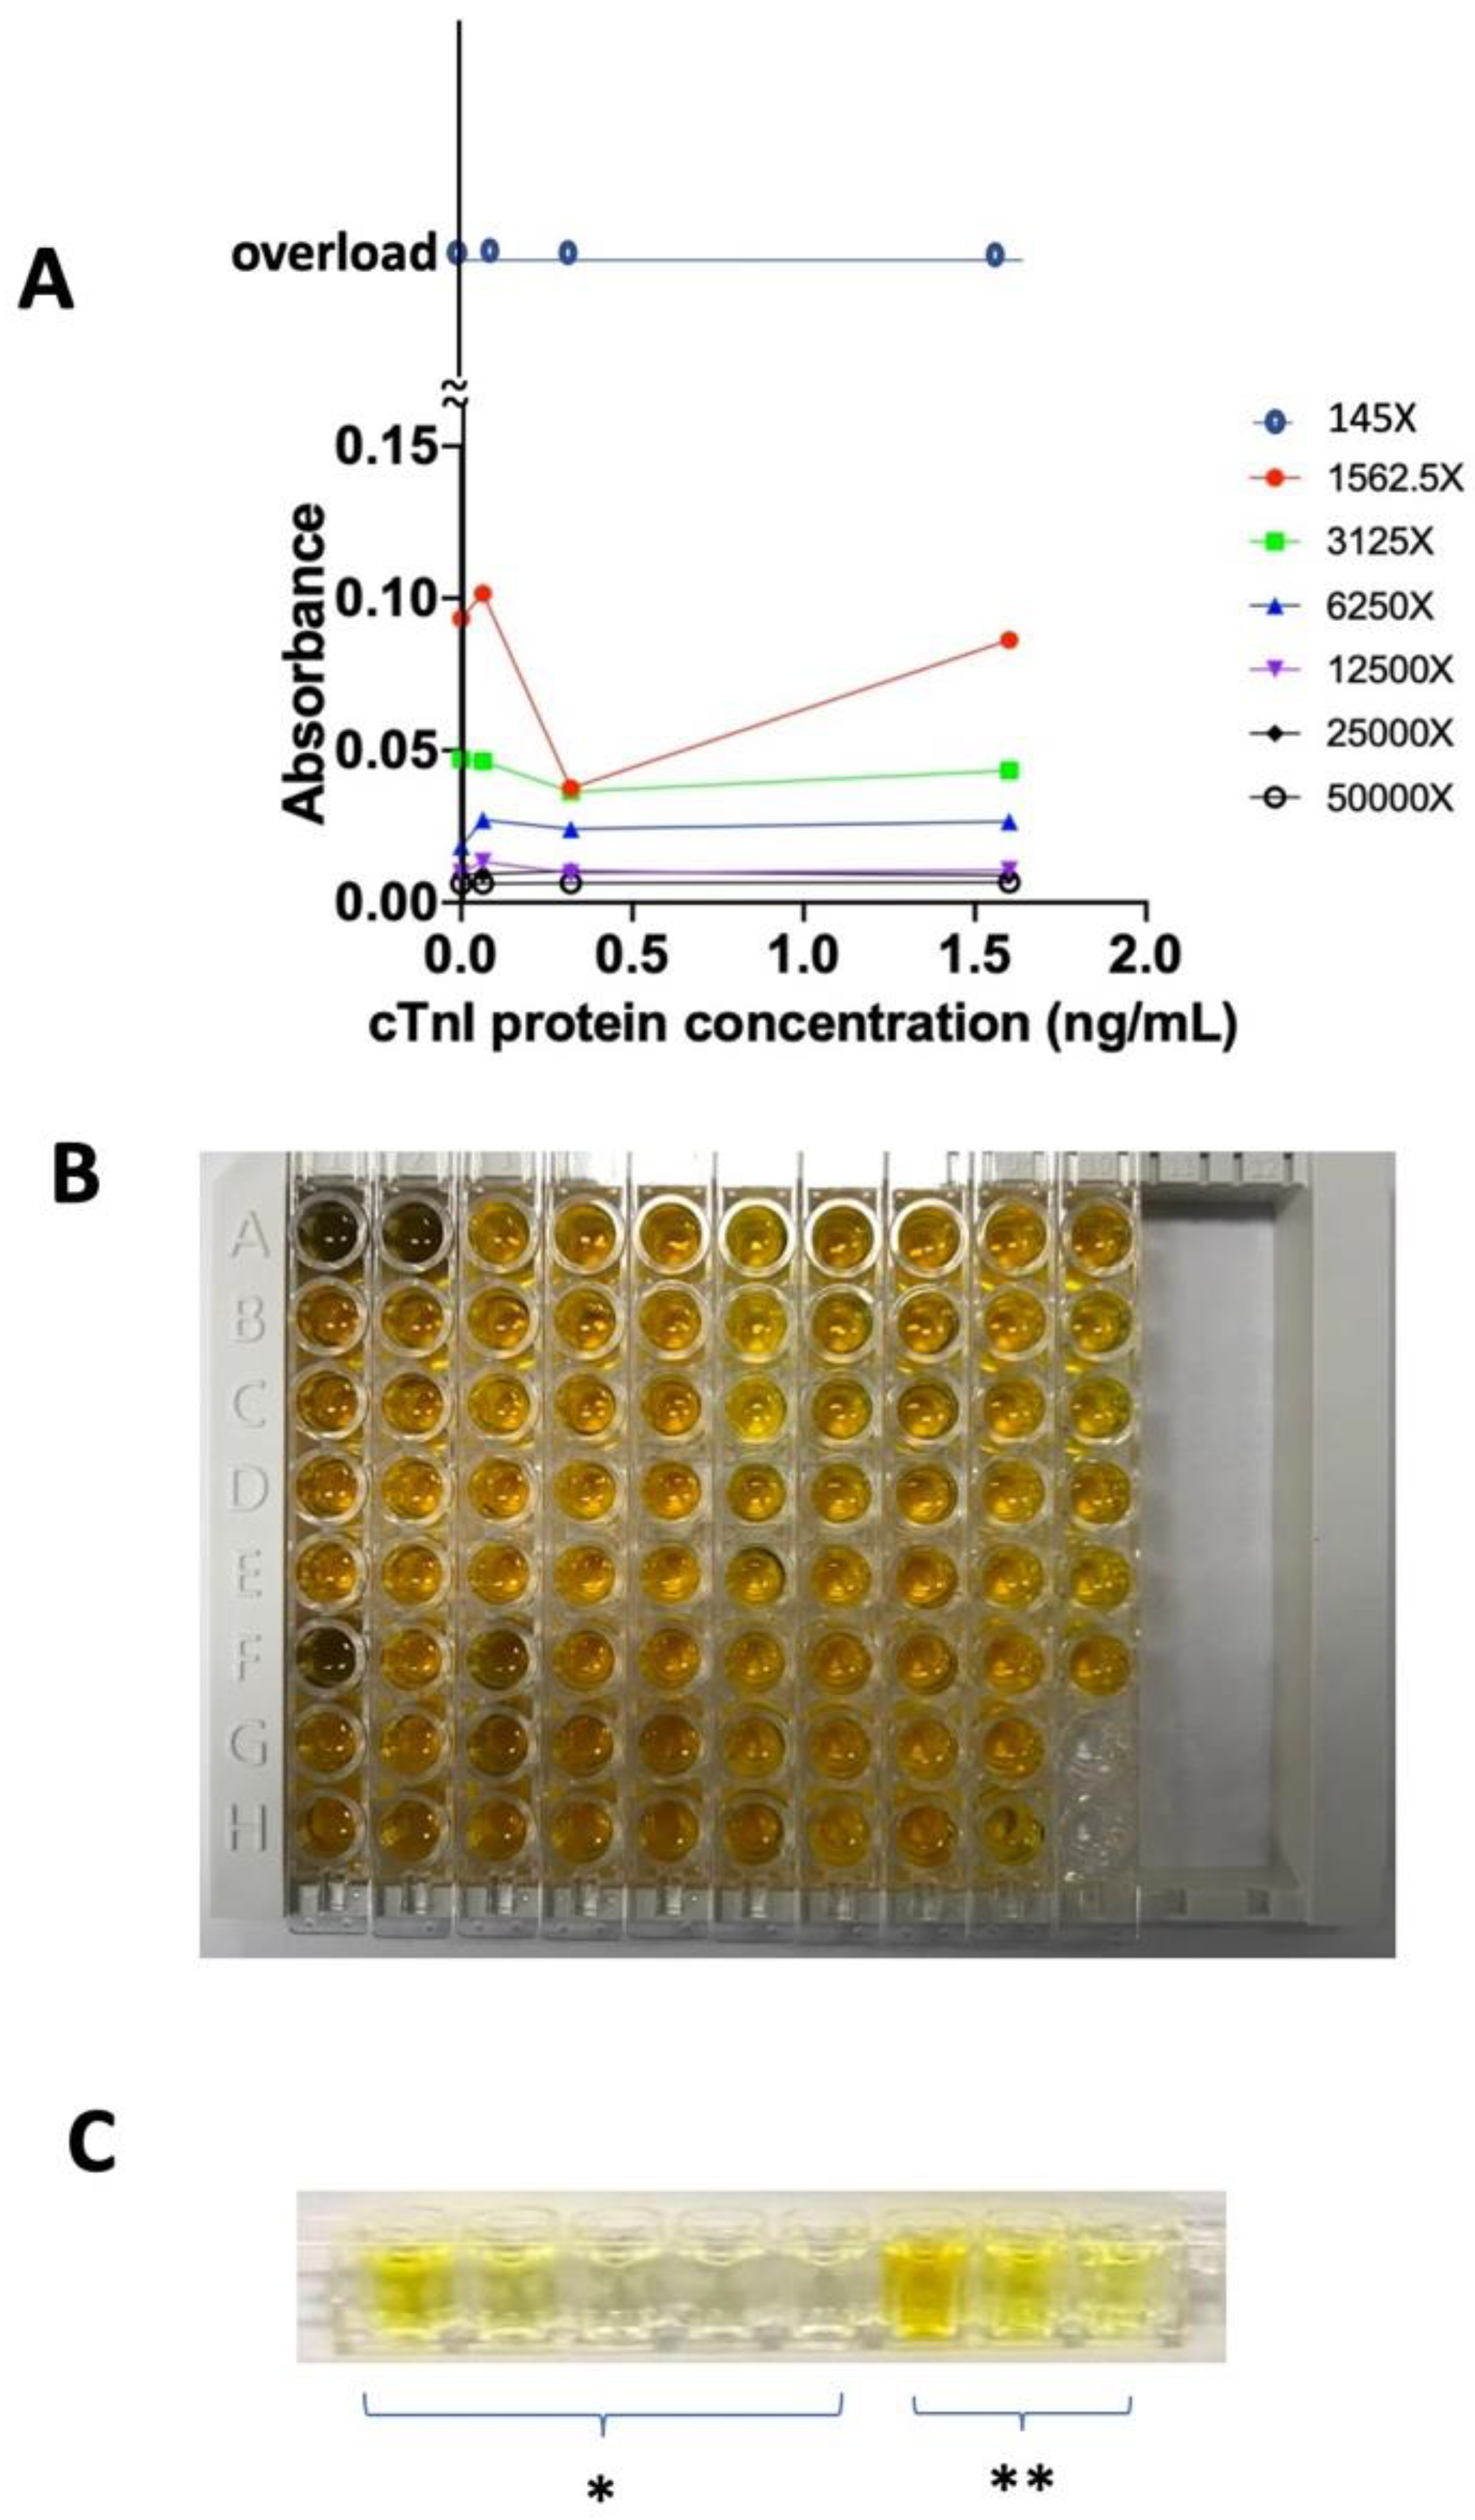
The top layer concentration. The best concentration of the top layer, which is the secondary-cTnI-antibody-HRP which serves as a converting agent of chromophore, is studied under different dilution ratio. Different dilution ratios of secondary-cTnI-antibody-HRP are studied with the cTnI protein concentration under 0, 0.064, 0.32, and 1.6 ng/mL. The secondary antibody from the stock solution is diluted by 145X, 1562.5X, 3125X, 6250X, 12500X, 25000X, and 50000X. In
Figure 4, the 1562.5X dilution with LOD 0.32 ng/mL, which is considered having good responding dynamic. The condensed solution of 145X has non-distinguishable dark yellow color which is consider as overload (
Figure 4B), in addition, 145X also has no resolution under 450 nm detection (
Figure 4A). Coincidentally, the LOD is also 0.32 ng/mL. This proves that our test trip has sensitivity and naked-eye detection properties with LOD of 0.32 ng/mL that is the minimum concentration of cTnI this device can detect both under UV or human naked-eyes. This work used 1562.5X as secondary antibody dilution ratio to keep studying the following.
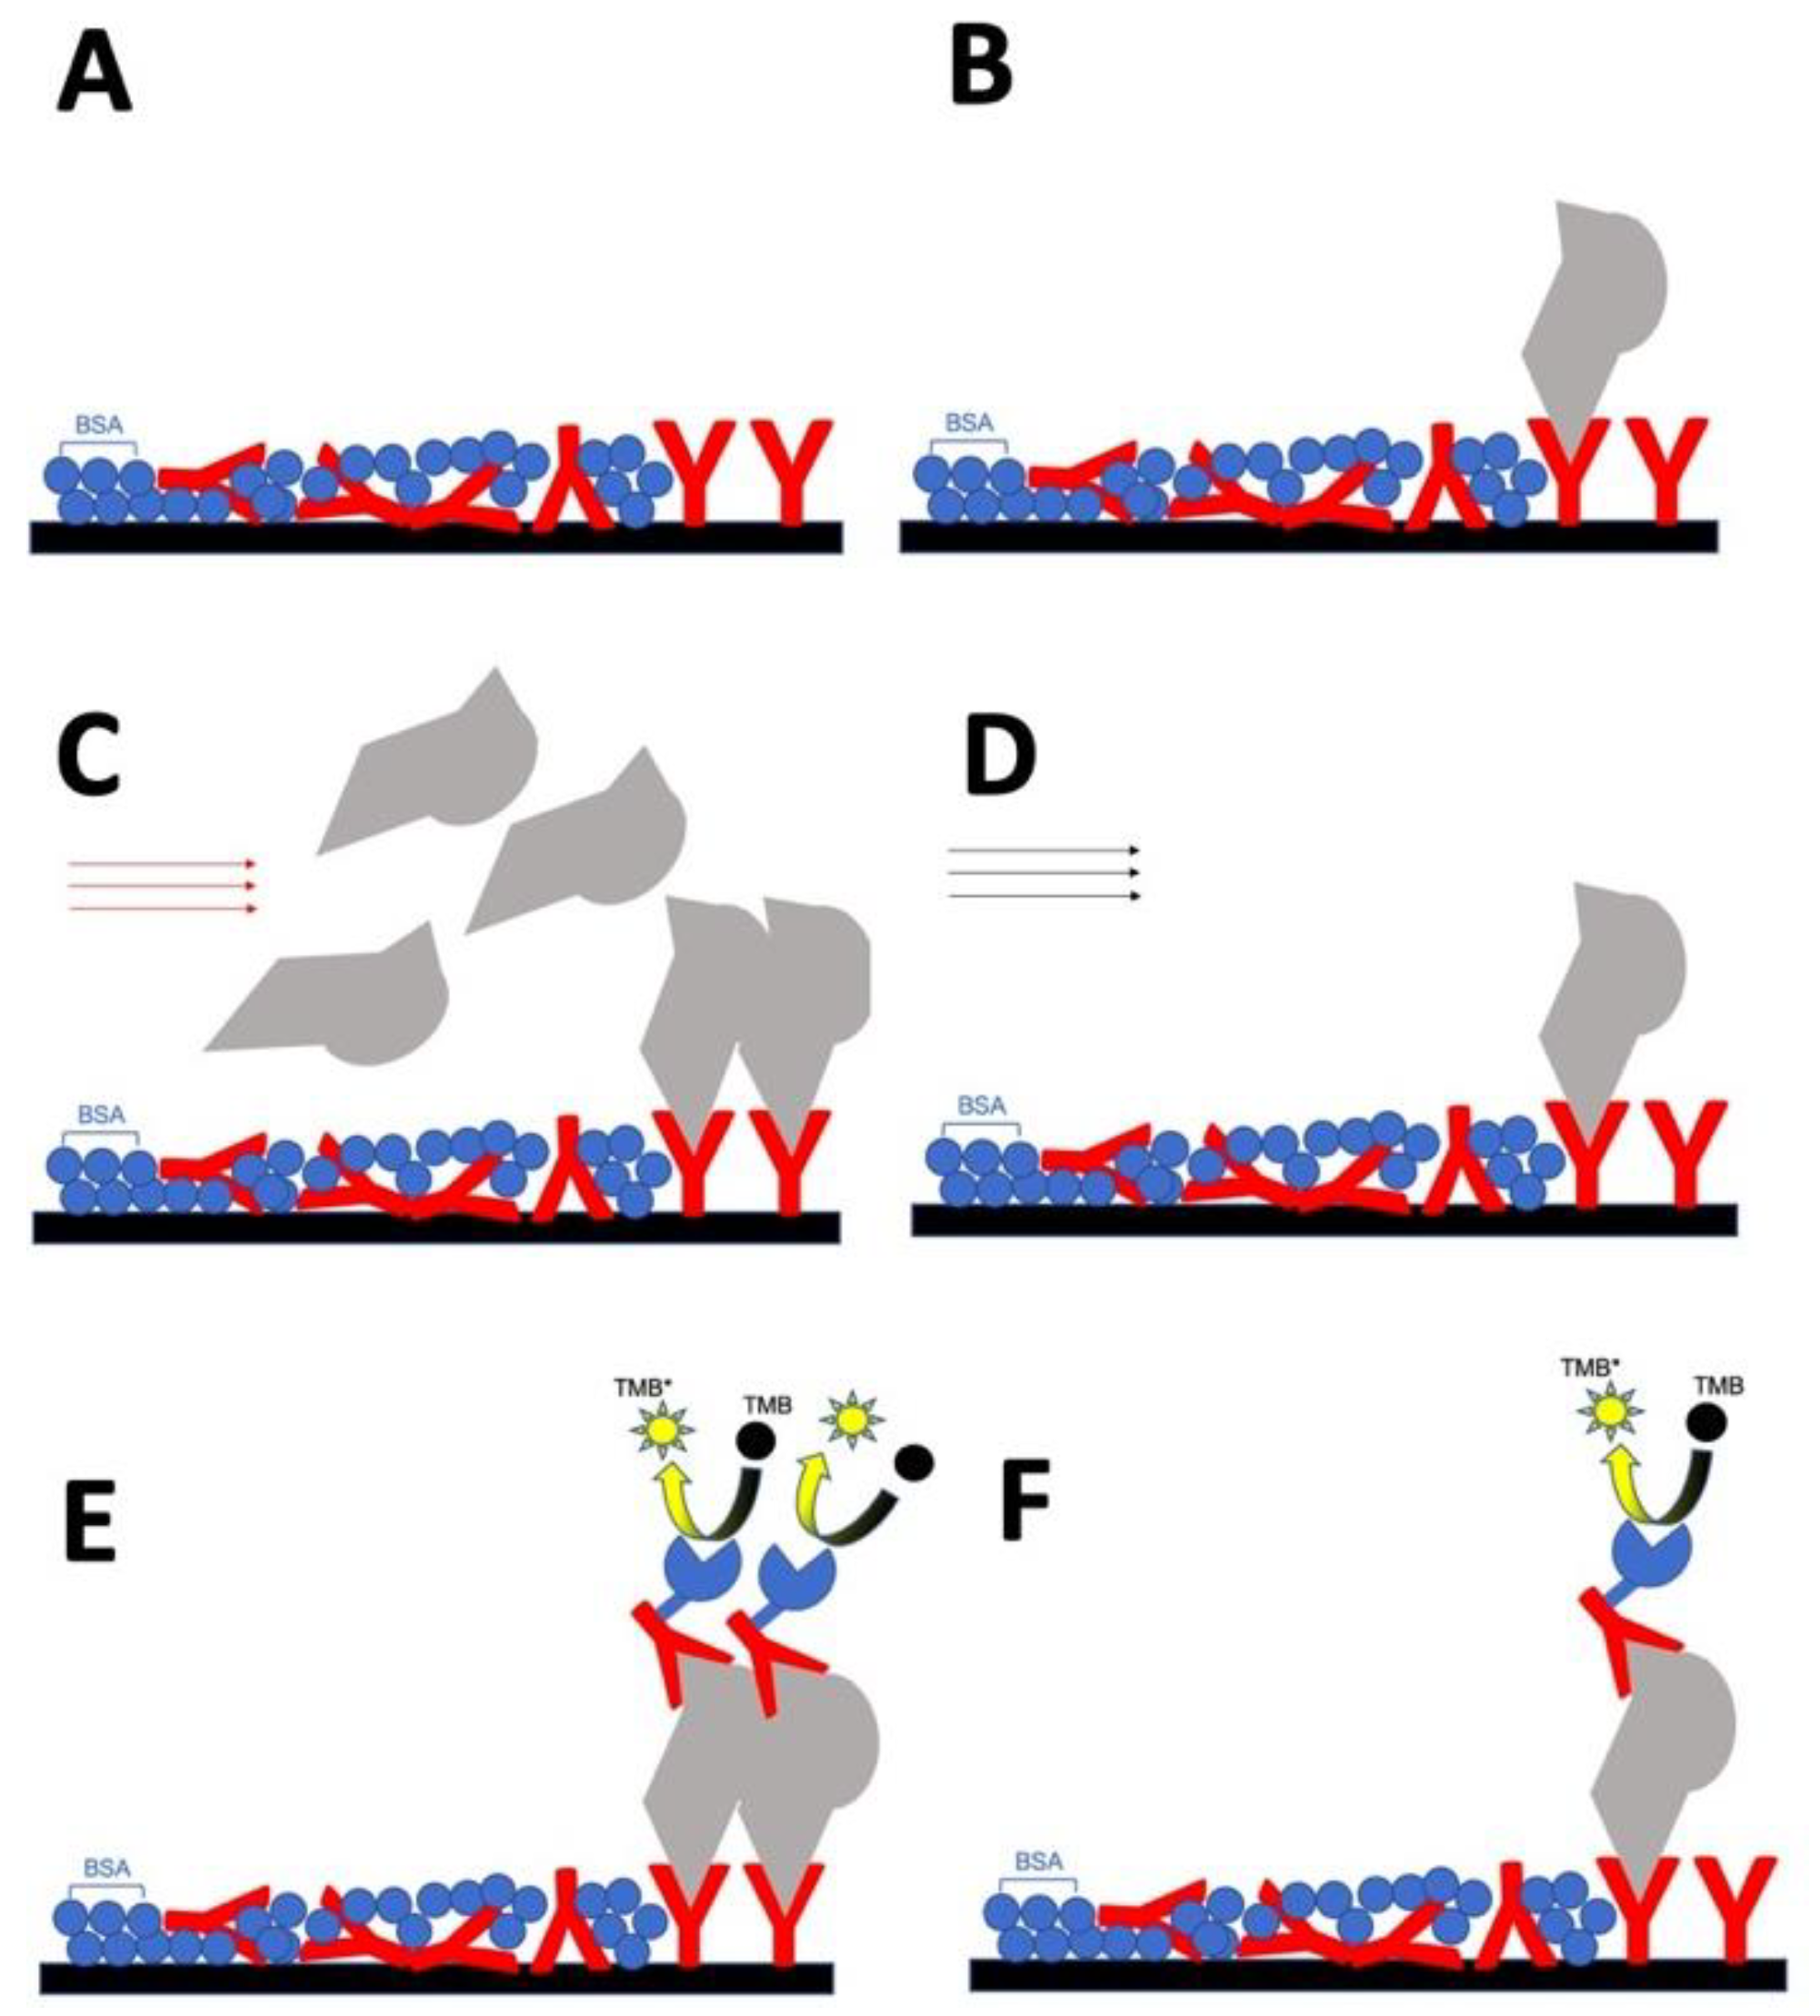
The well row design. In sum, our device is bottom up, layer by layer, designed and used in order by: (1) primary antibody mixing with Bovine Serum Albumin (BSA) for background blocking, (2) standard cTnI protein from 0 to 8 ng/mL is coated in the reference wells but not coated in the sample wells, and then, after patient blood applying, (3) HRP-labeled secondary antibody solution loading and chromophore TMB in solution forming yellow color, shown in
Figure 5.
In addition, there are 5 reference wells on the left of 3 sample wells. These 8 wells are designed in one well row (
Figure 4C). This well row is our device model, an original model which can further transformer into test strip paper in the future.
Use and device. This device uses the yellow color “pattern” to denote the MI diagnosis. The comparison of the yellow color patterns of the sample wells to reference wells tells patient if their cTnI protein in blood increase. Since the diagnosis of MI is “cTnI protein in circulation system increases through a period of time”, three sample wells should load test blood in three time points which have same time interval. For example, test blood test after dinner in 0.5hr, 1hr, and 1.5hr. There three-time-point blood load into three sample wells separately. After three-time-point blood loaded, using PBS to wash, and then loading the HRP-labeled secondary antibody solution together. After washing away the non-binding secondary antibody, loading TMB solution to transform both sample and reference wells into color signal together. The same concept and procedure will apply to test strip paper too. In
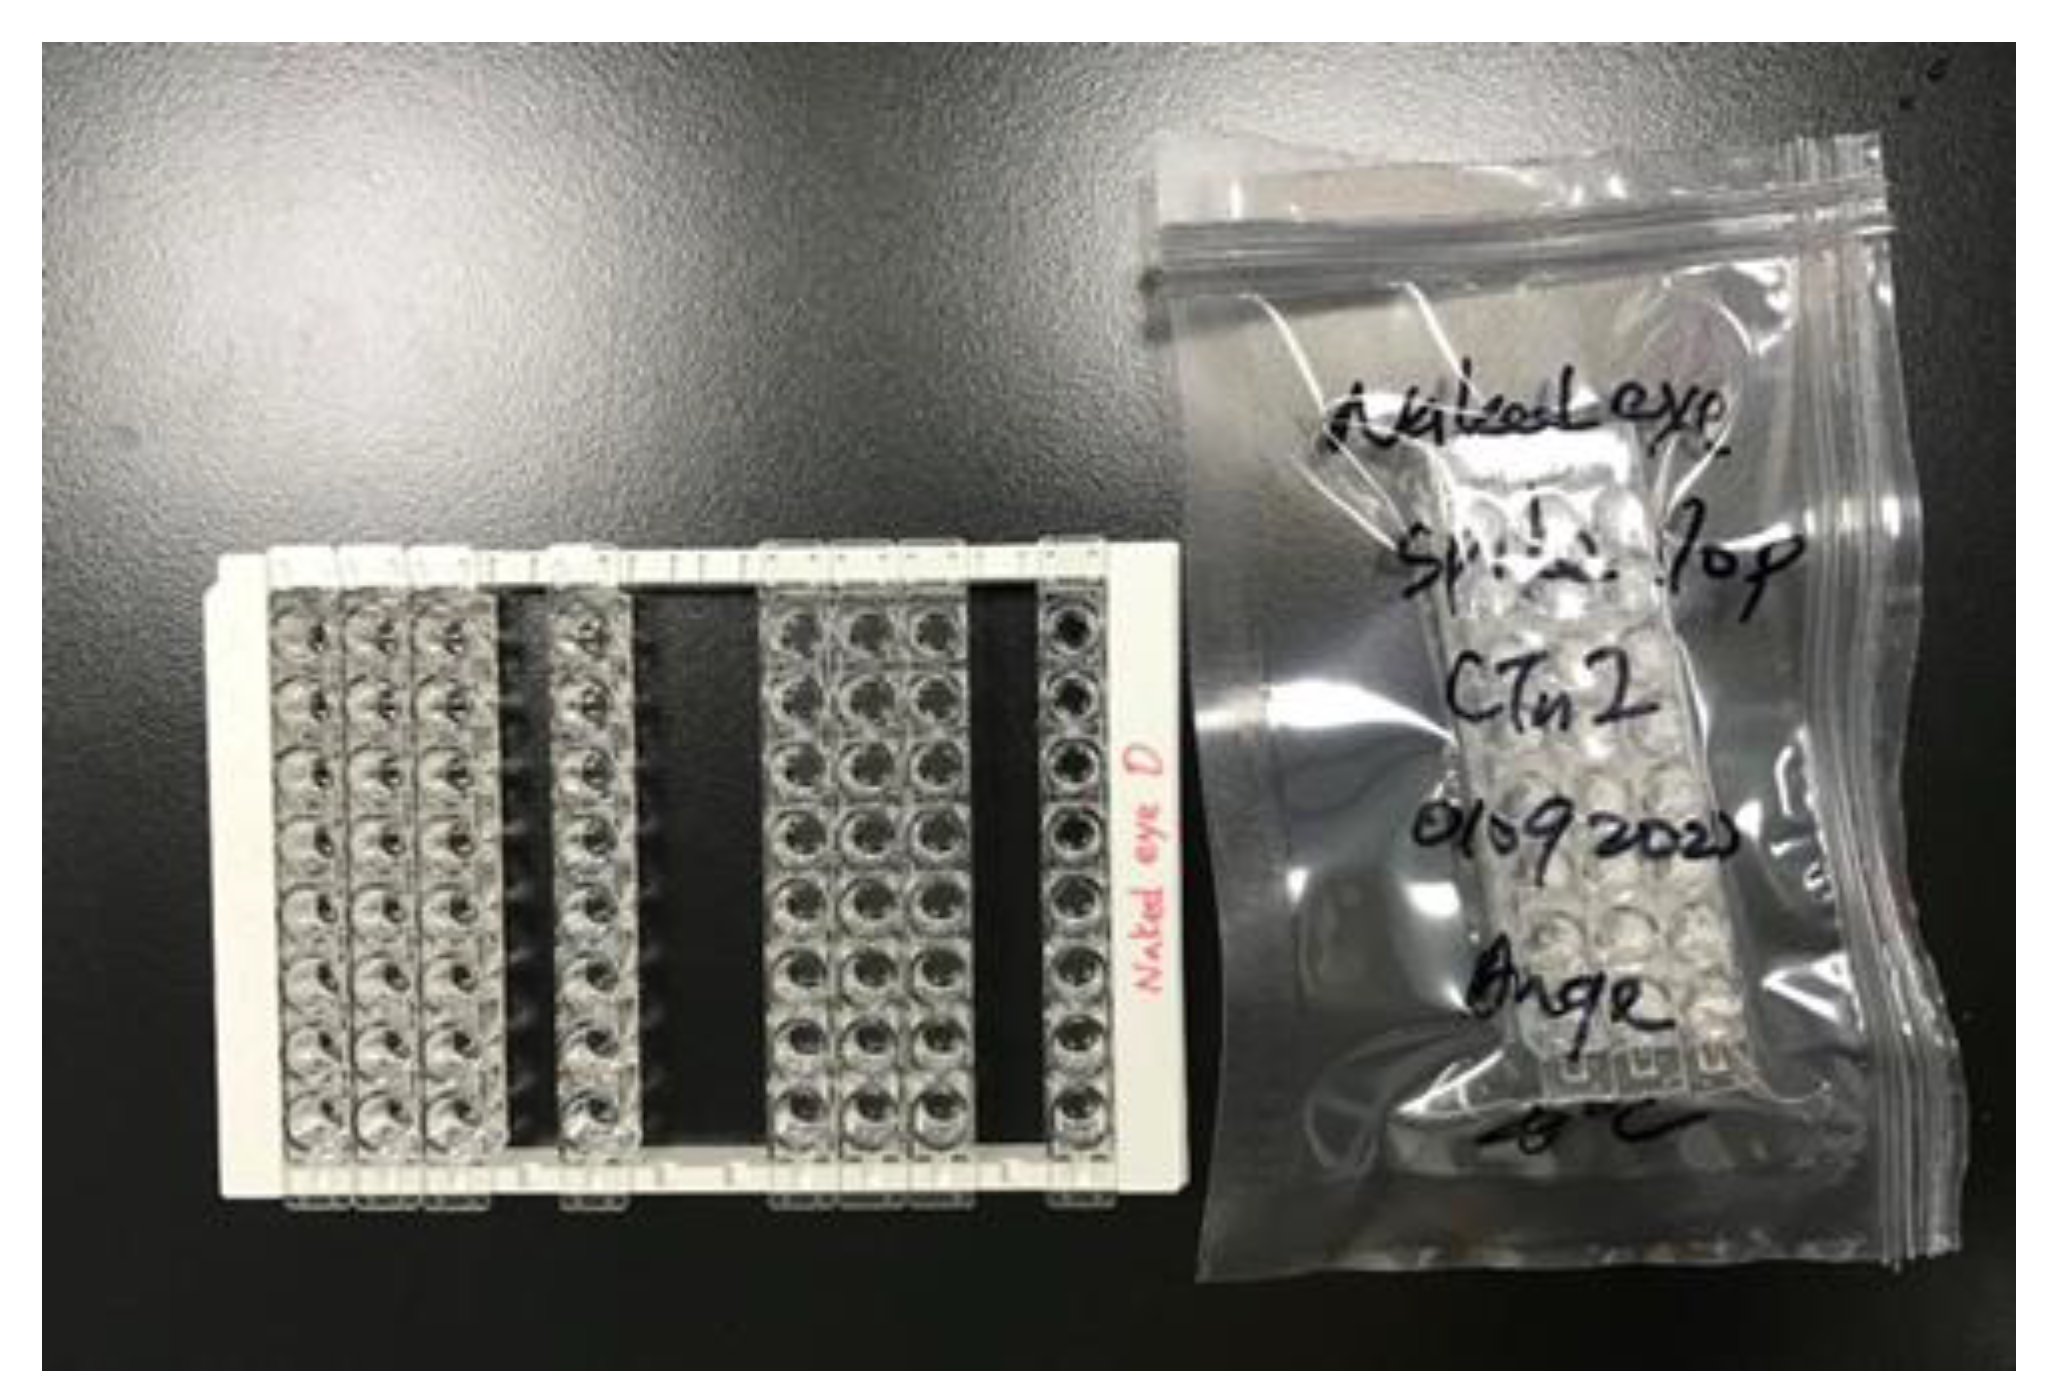
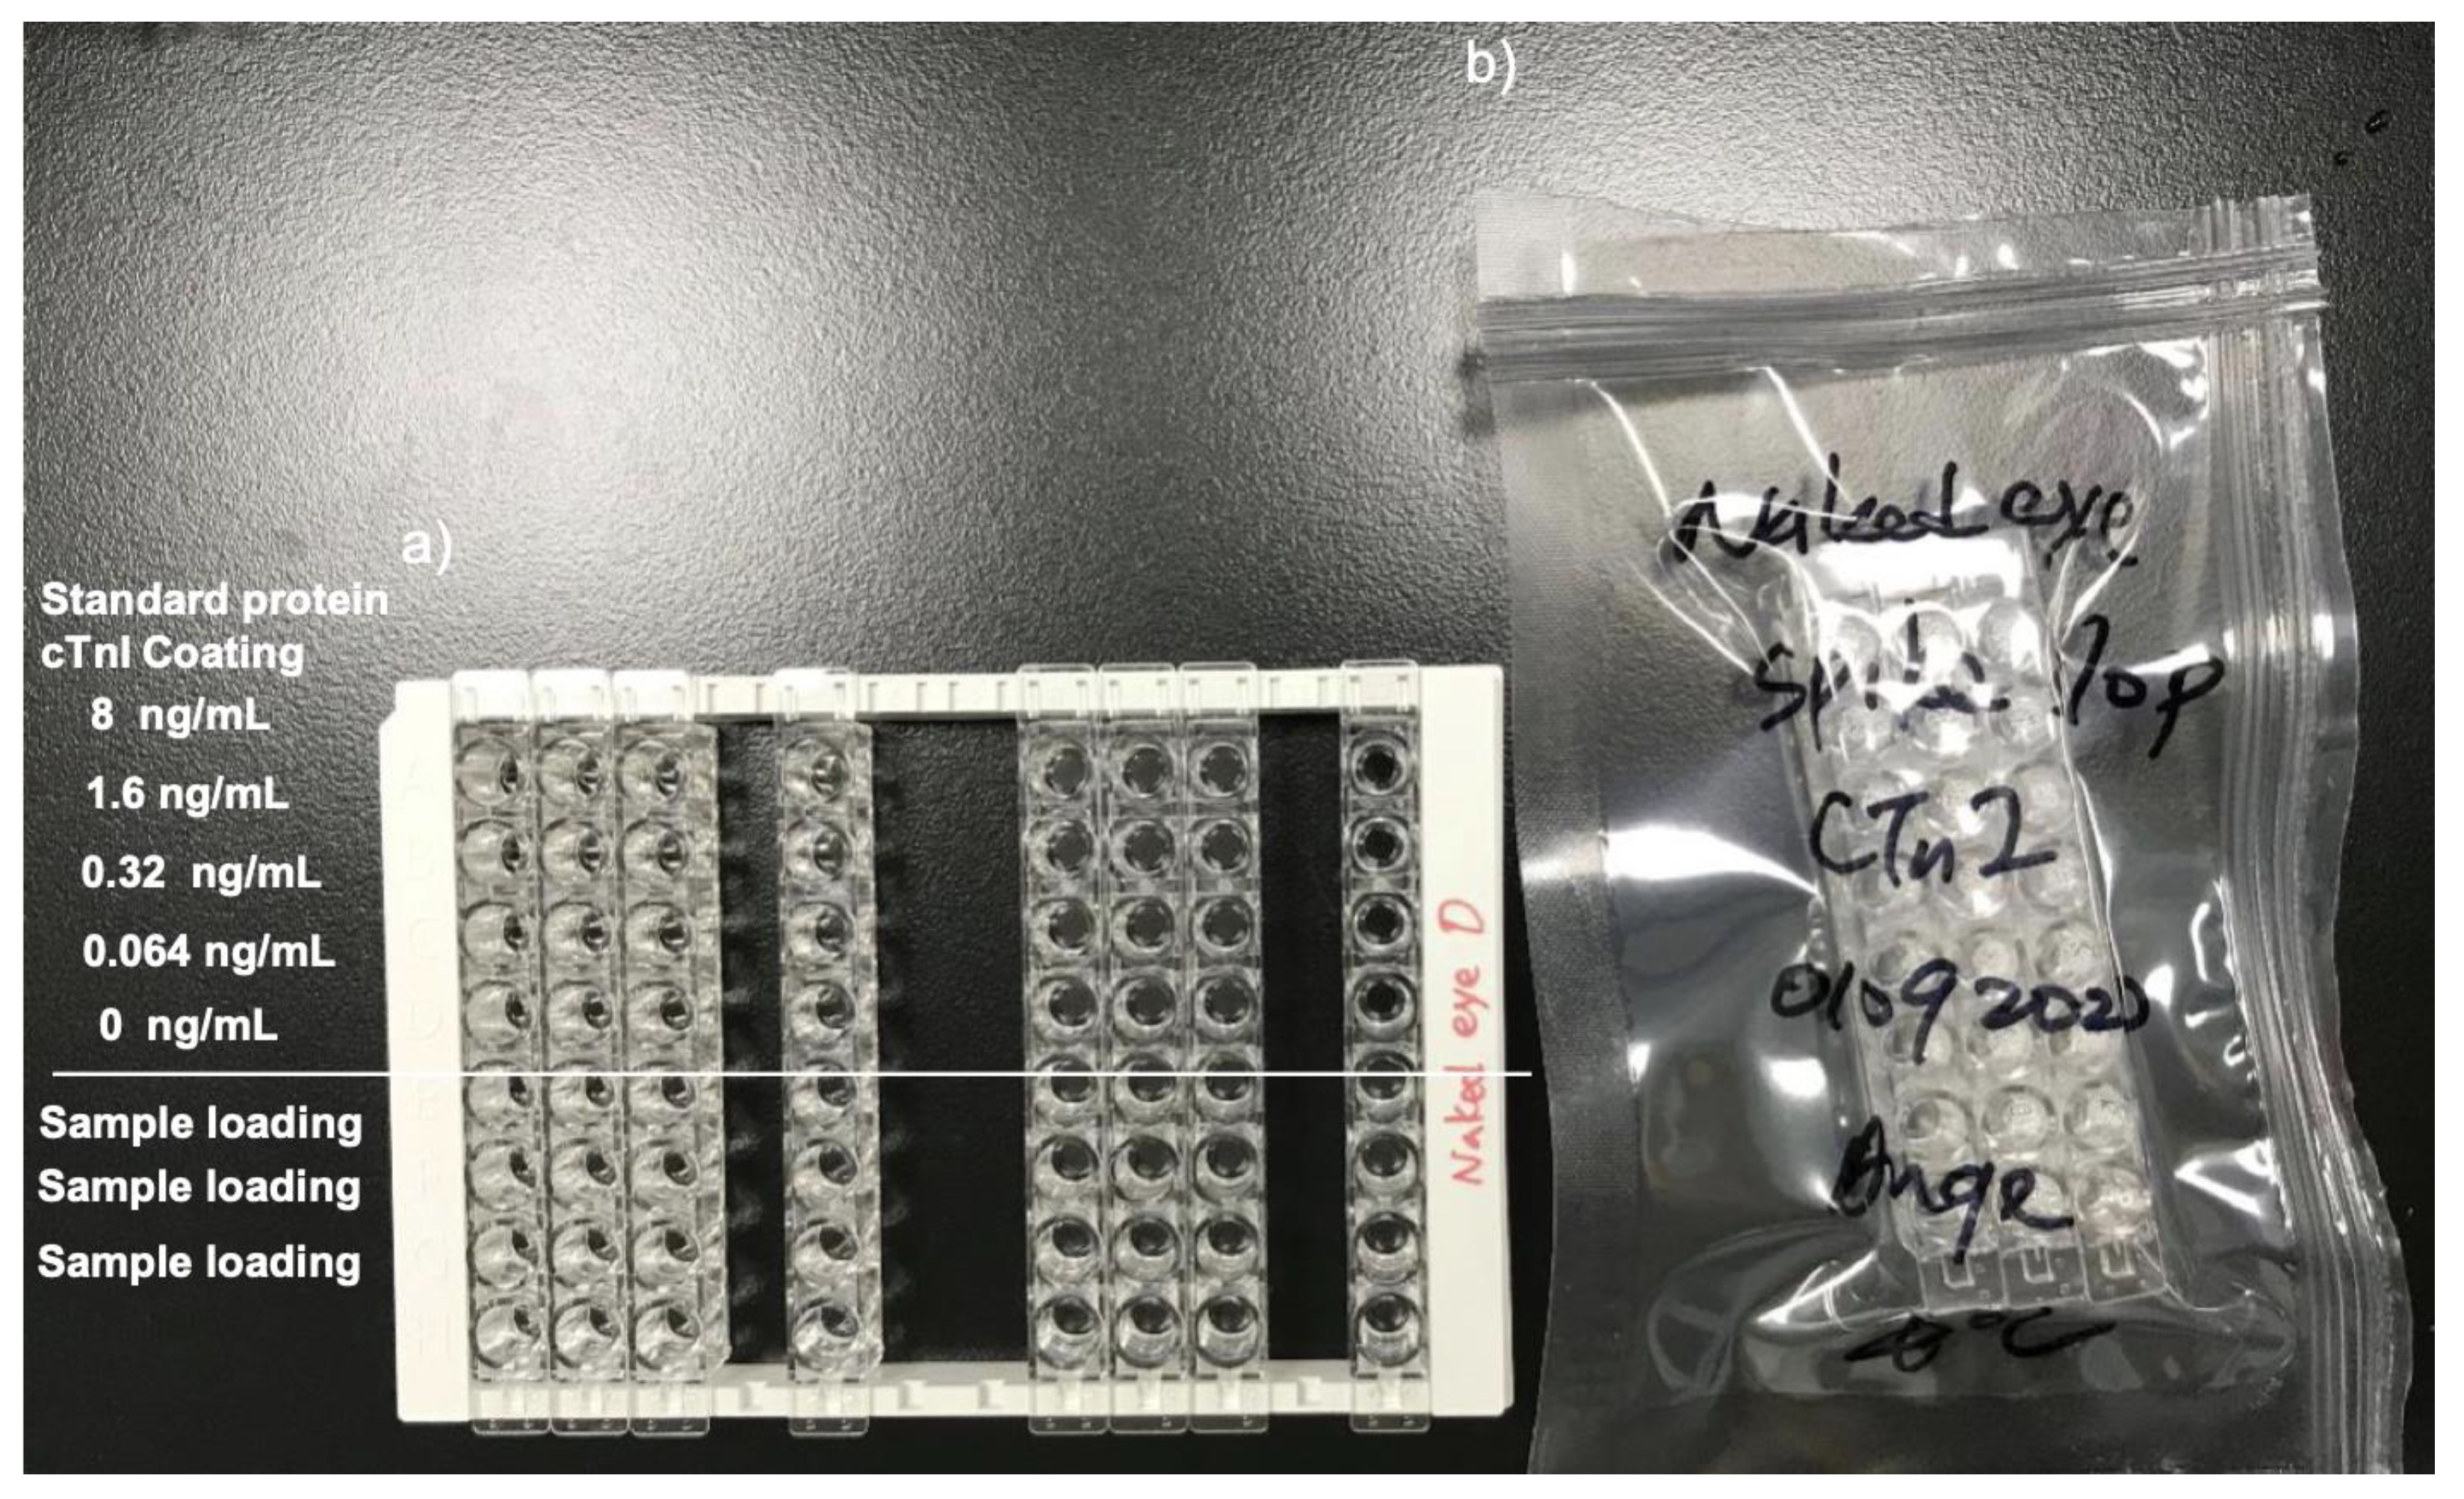
Figure 6, the three-time-point wells denote the increase of the intensity of the yellow color, signifying positive MI diagnosis. This device can be self-diagnosis at home. Furthermore, if the three time points show no color, the diagnosis of MI is negative, signifying a healthy human. This well row can be air-tight packed and preserved for a few months in the fridge. The package should be stored at 4 °C and used upon opening (
Figure 7).
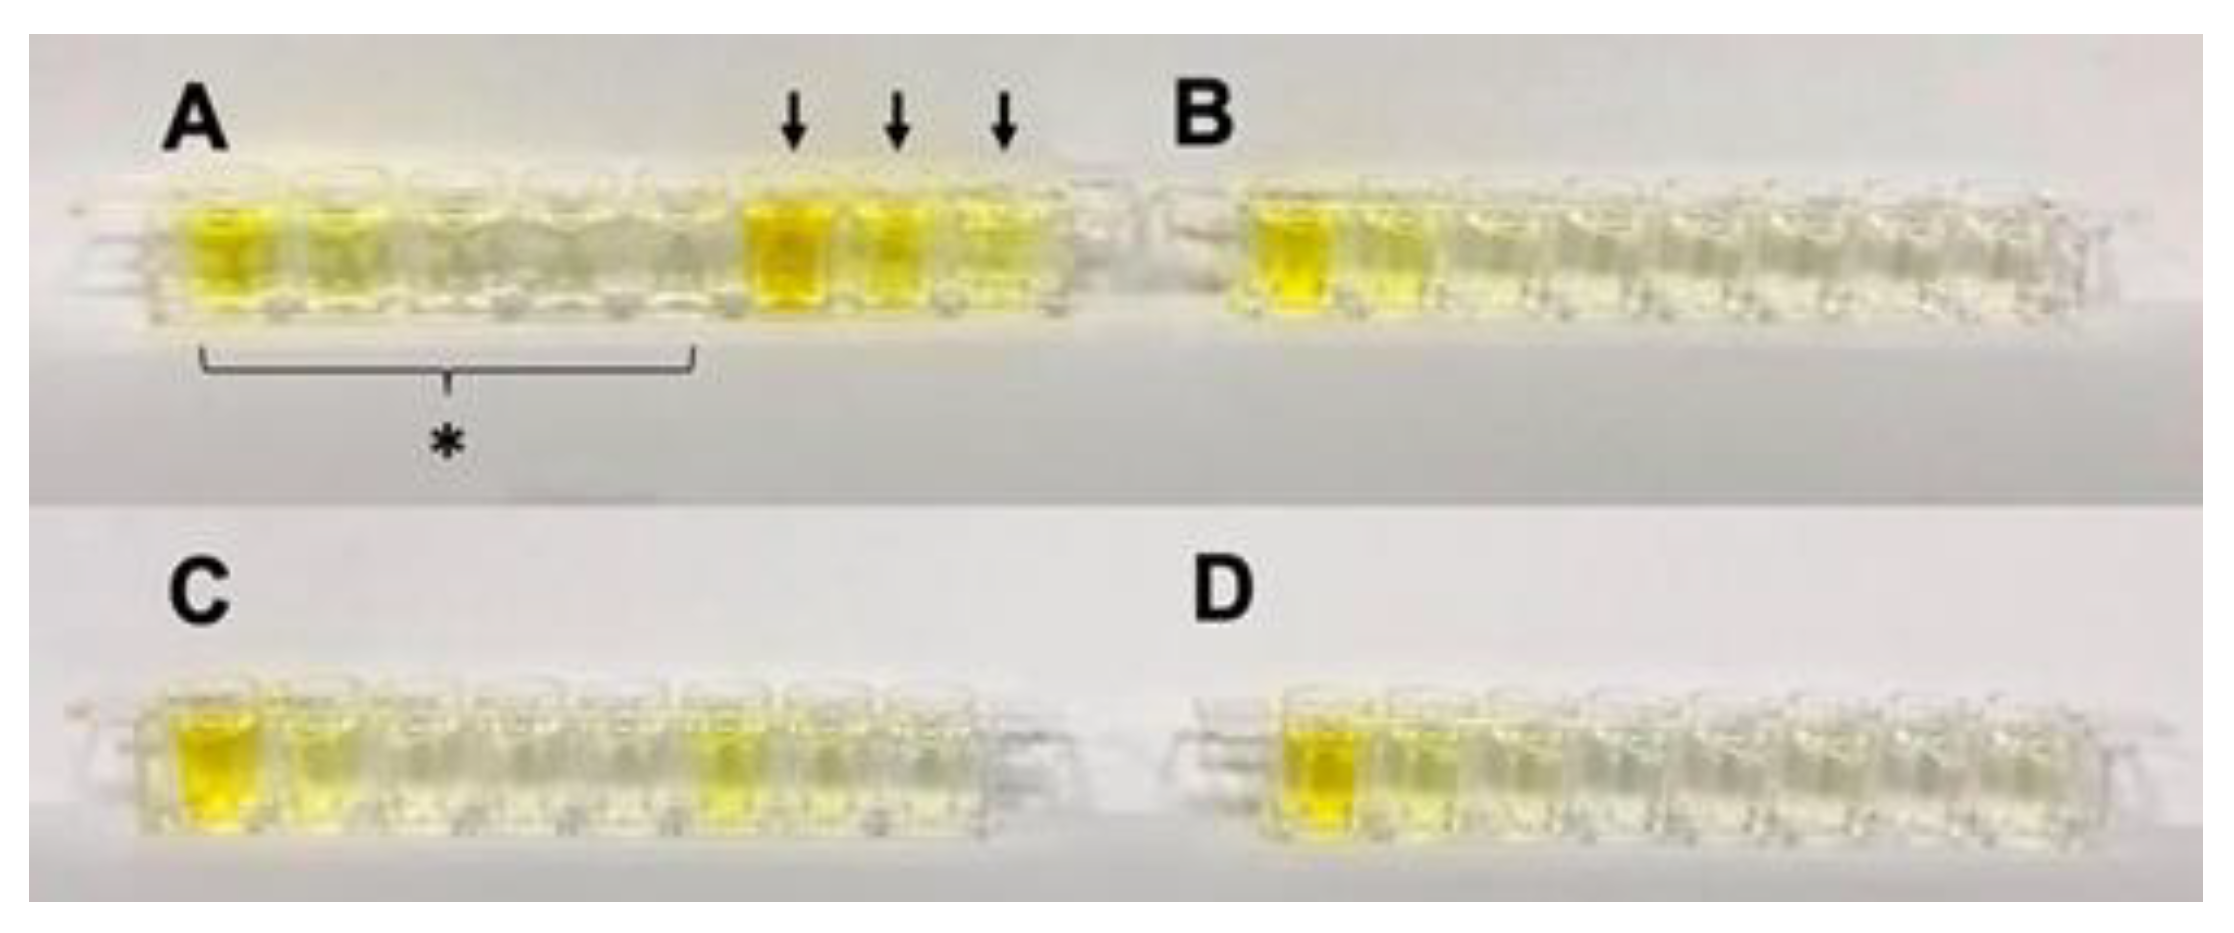
Test under human serum. To study the matrix effect. This device is tested under human serum (
Figure 8A) and human serum with 10 times dilution by PBS (v/v) (
Figure 8C). Compared to a healthy human sample (
Figure 8B), the human serum sample without dilution exhibits higher intensity and color changes (
Figure 8A). That is, the patient samples spiked with cTnI in concentrations of 0.08, 0.64, and 1.28 ng/mL exhibit a change in the yellow color pattern. For reference, in
Figure 8B, the healthy human sample, which was not spiked with cTnI, shows no color change. However, sometimes diagnosis needs to be performed under circumstances where the patient blood samples are lacking. To determine if the test strip is effective for diluted samples, the test strip is employed for a patient sample that is 10 times diluted by PBS (v/v) (
Figure 8C). Although the yellow color change is not as dark as that in
Figure 8A, it is yellow color change is still distinguishable, allowing for MI diagnosis. In summary, the test strip can be clinically ap-plied for detection using a human serum matrix and with limited patient samples or diluted patient samples.
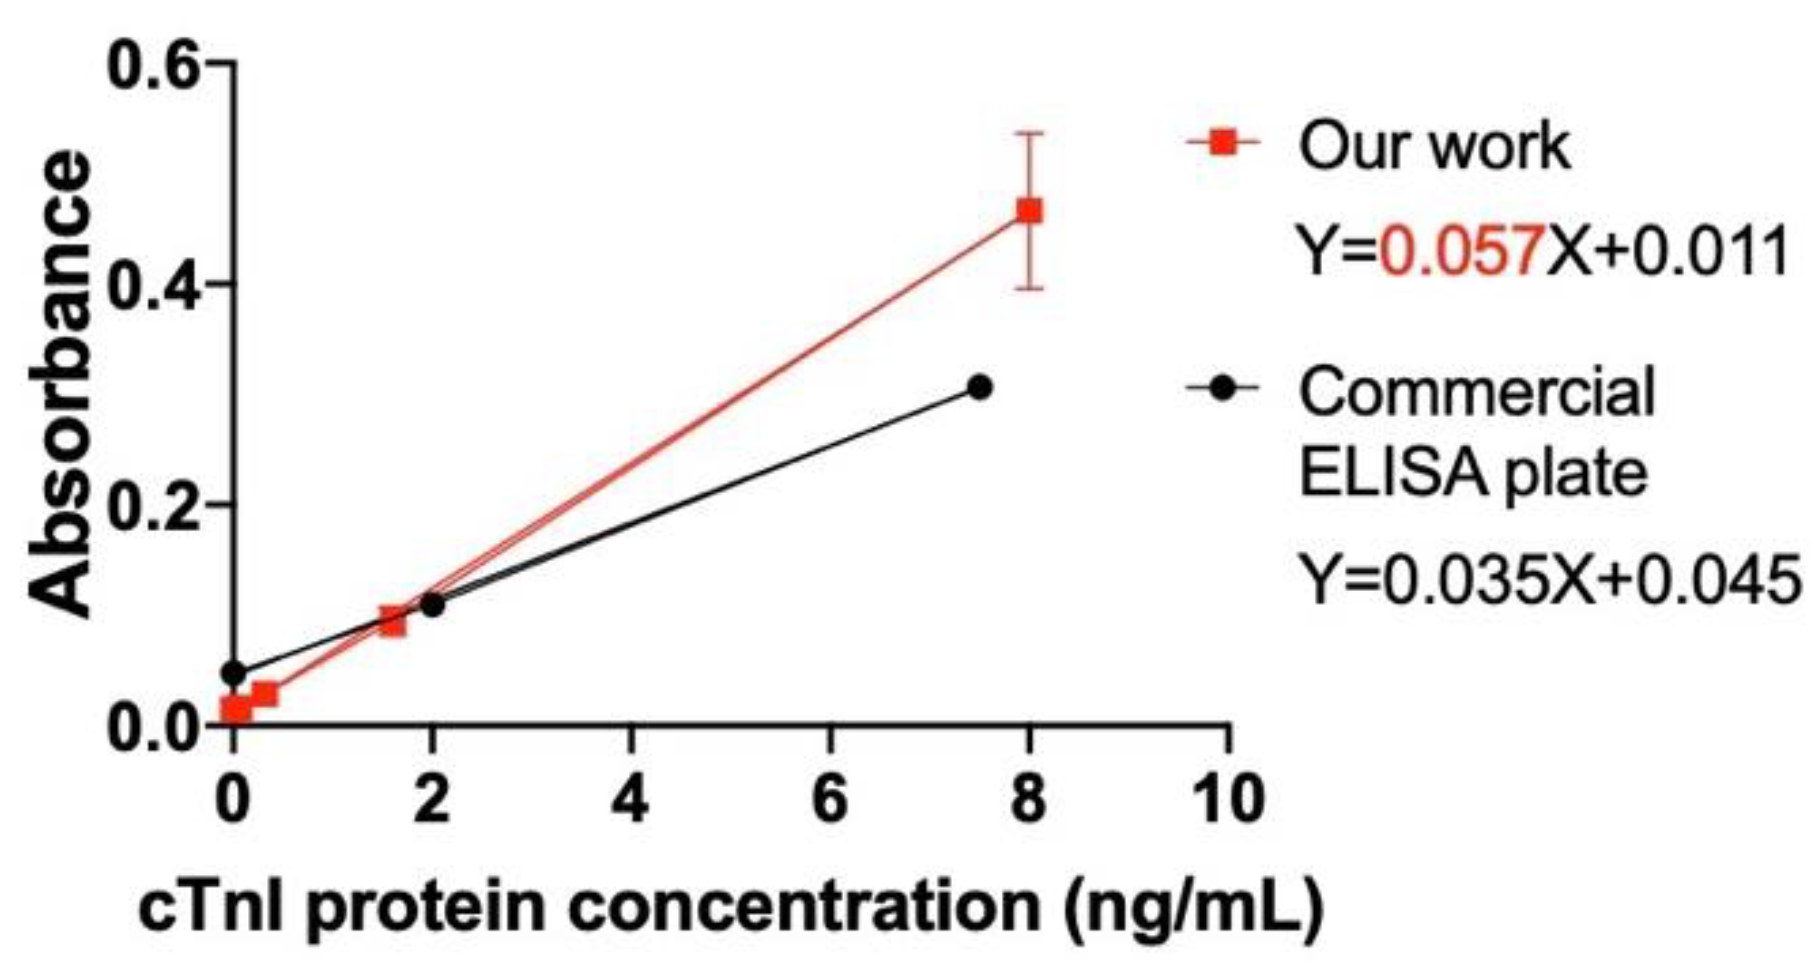
Comparison of our device (the test strip) with the commercial cTnI ELISA plate. The proposed test strip is compared with the commercial cTnI ELISA plate manufactured by BioCheck, Inc. As shown in
Table 1, compared to the commercial plate, the proposed test strip has better LOD, has shorter detection time, and is easy to use in clinic and at home. The proposed test strip has the following advantages: (1) no detector is required, (2) portability, and (3) small reagent volume. Moreover, compared to the commercial plate that involves a UV–Vis detector, the application of the proposed test strips is easier, and is enabling self-diagnosis.
A proposal of clinical usage in pharmacokinetic and pharmacodynamic study. With pharmacokinetic and pharmacodynamic study, the airtight-package of finished test strips can be used in the following (
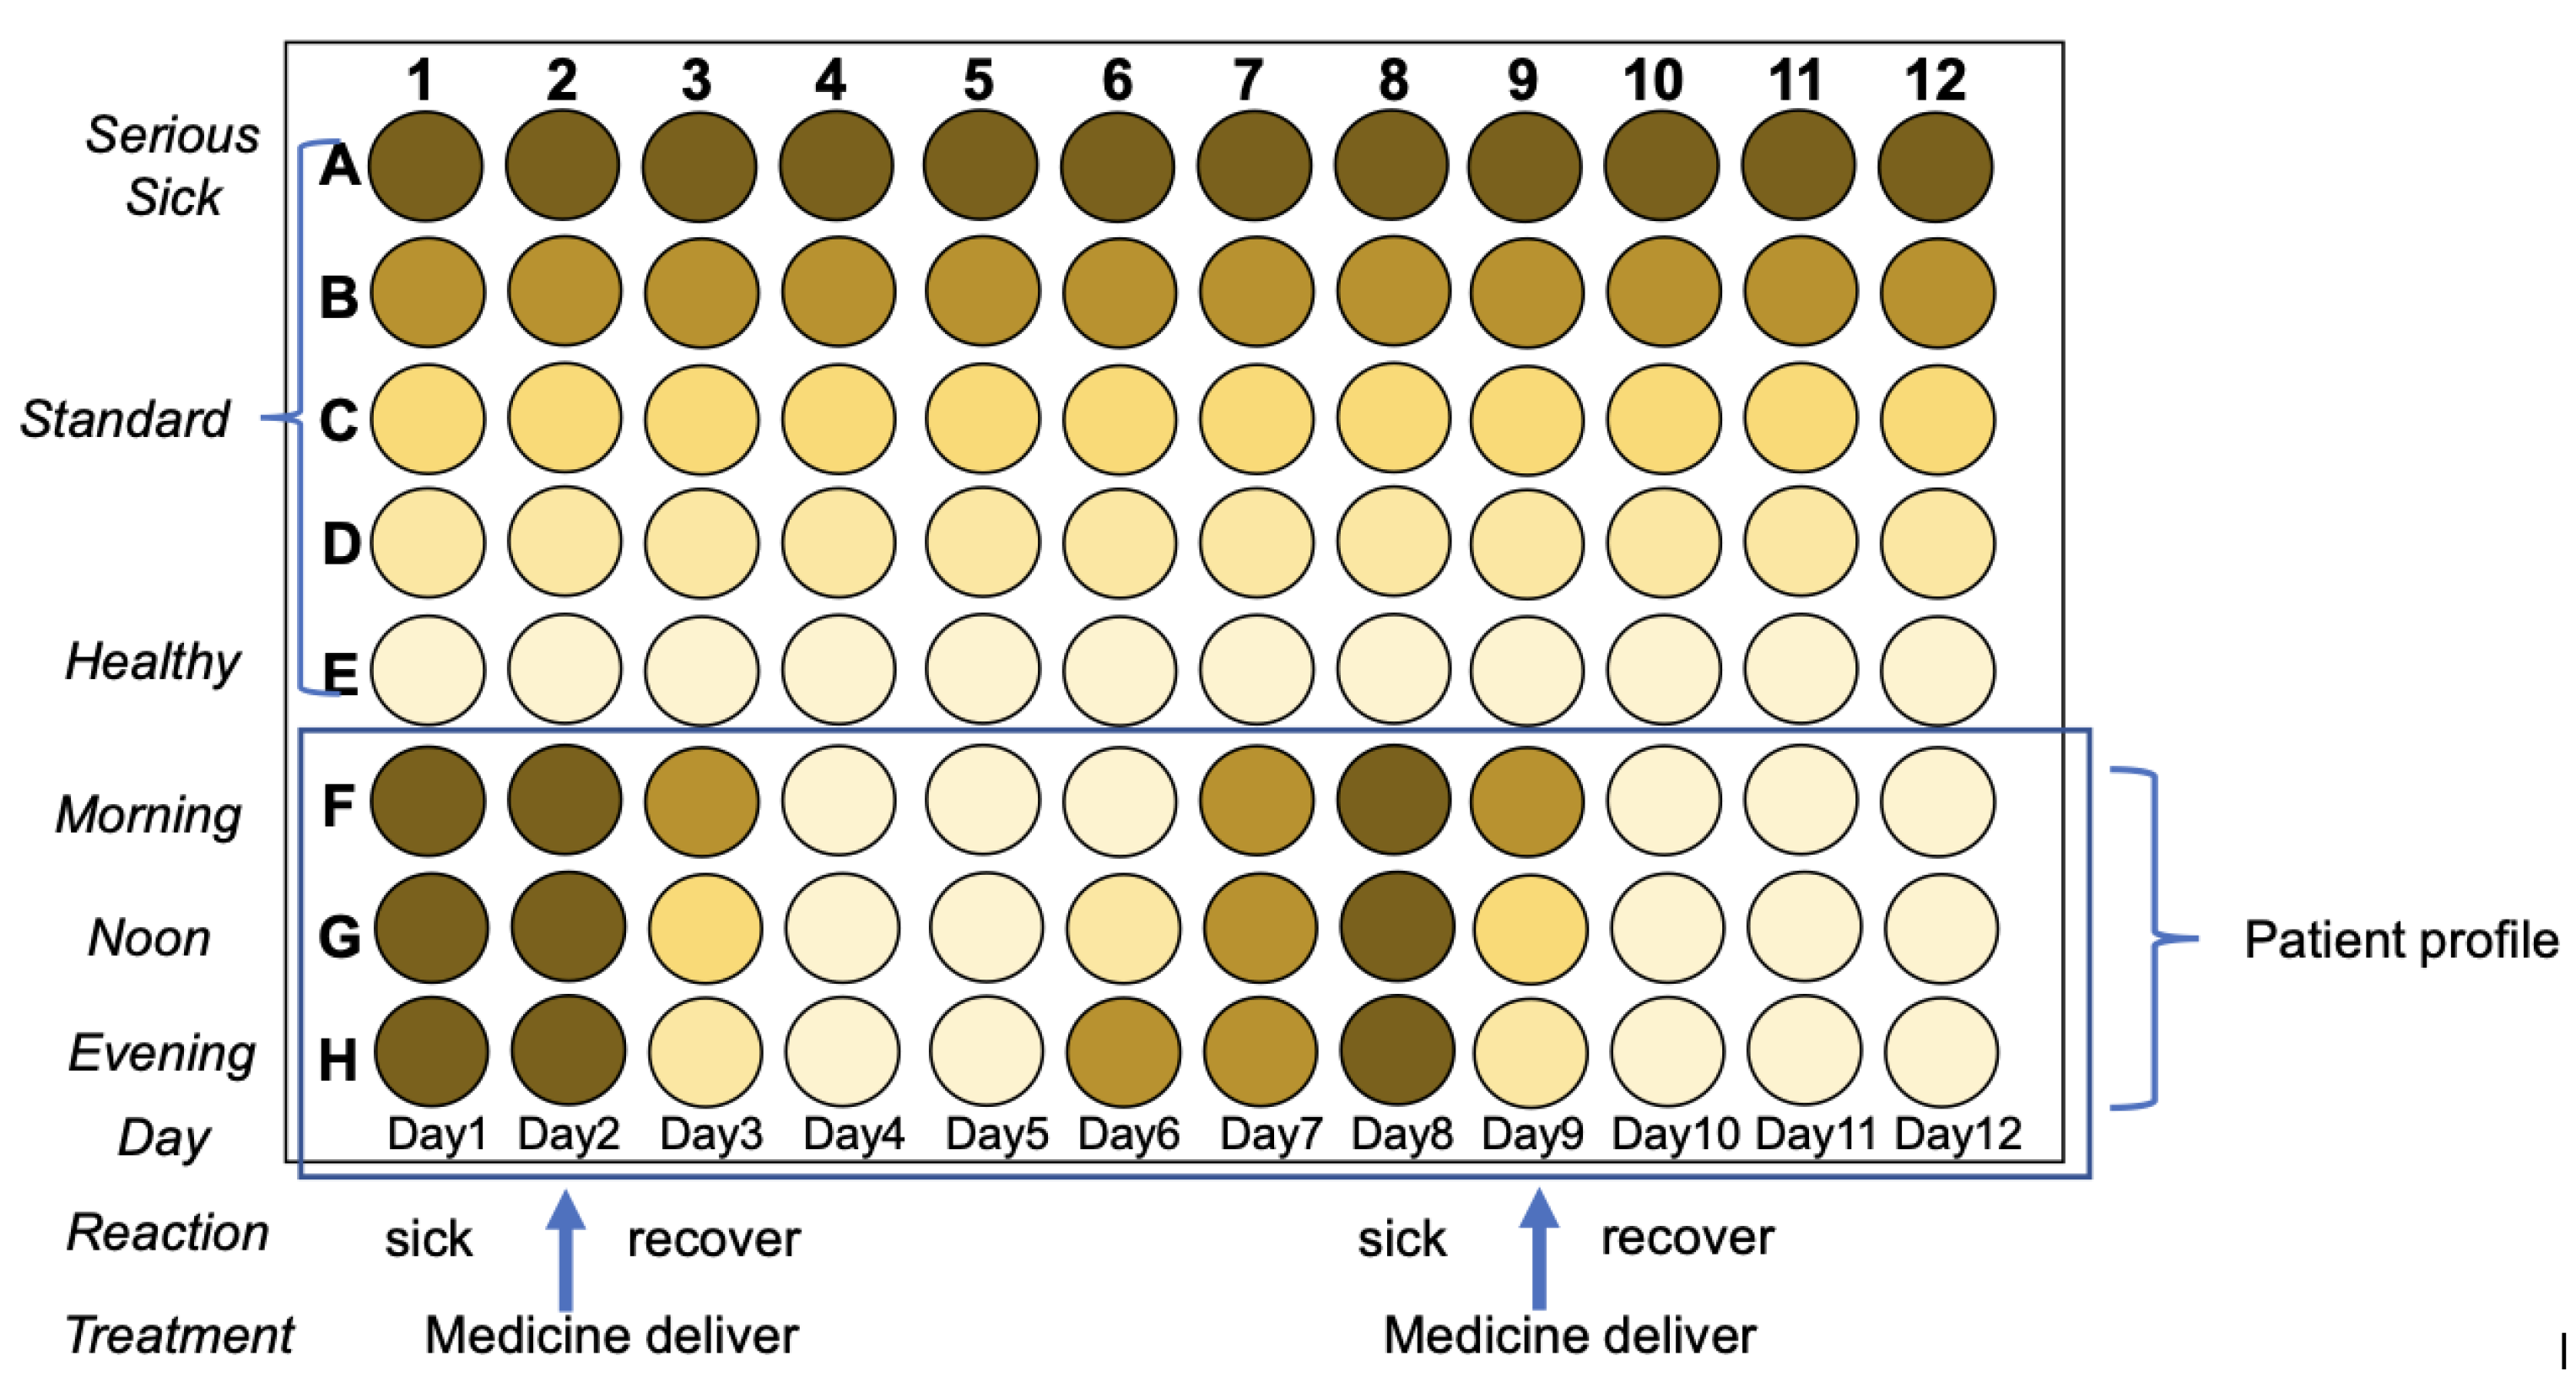
Figure 10). Tracking pharmaceutical kinetic and patient profile as shown in
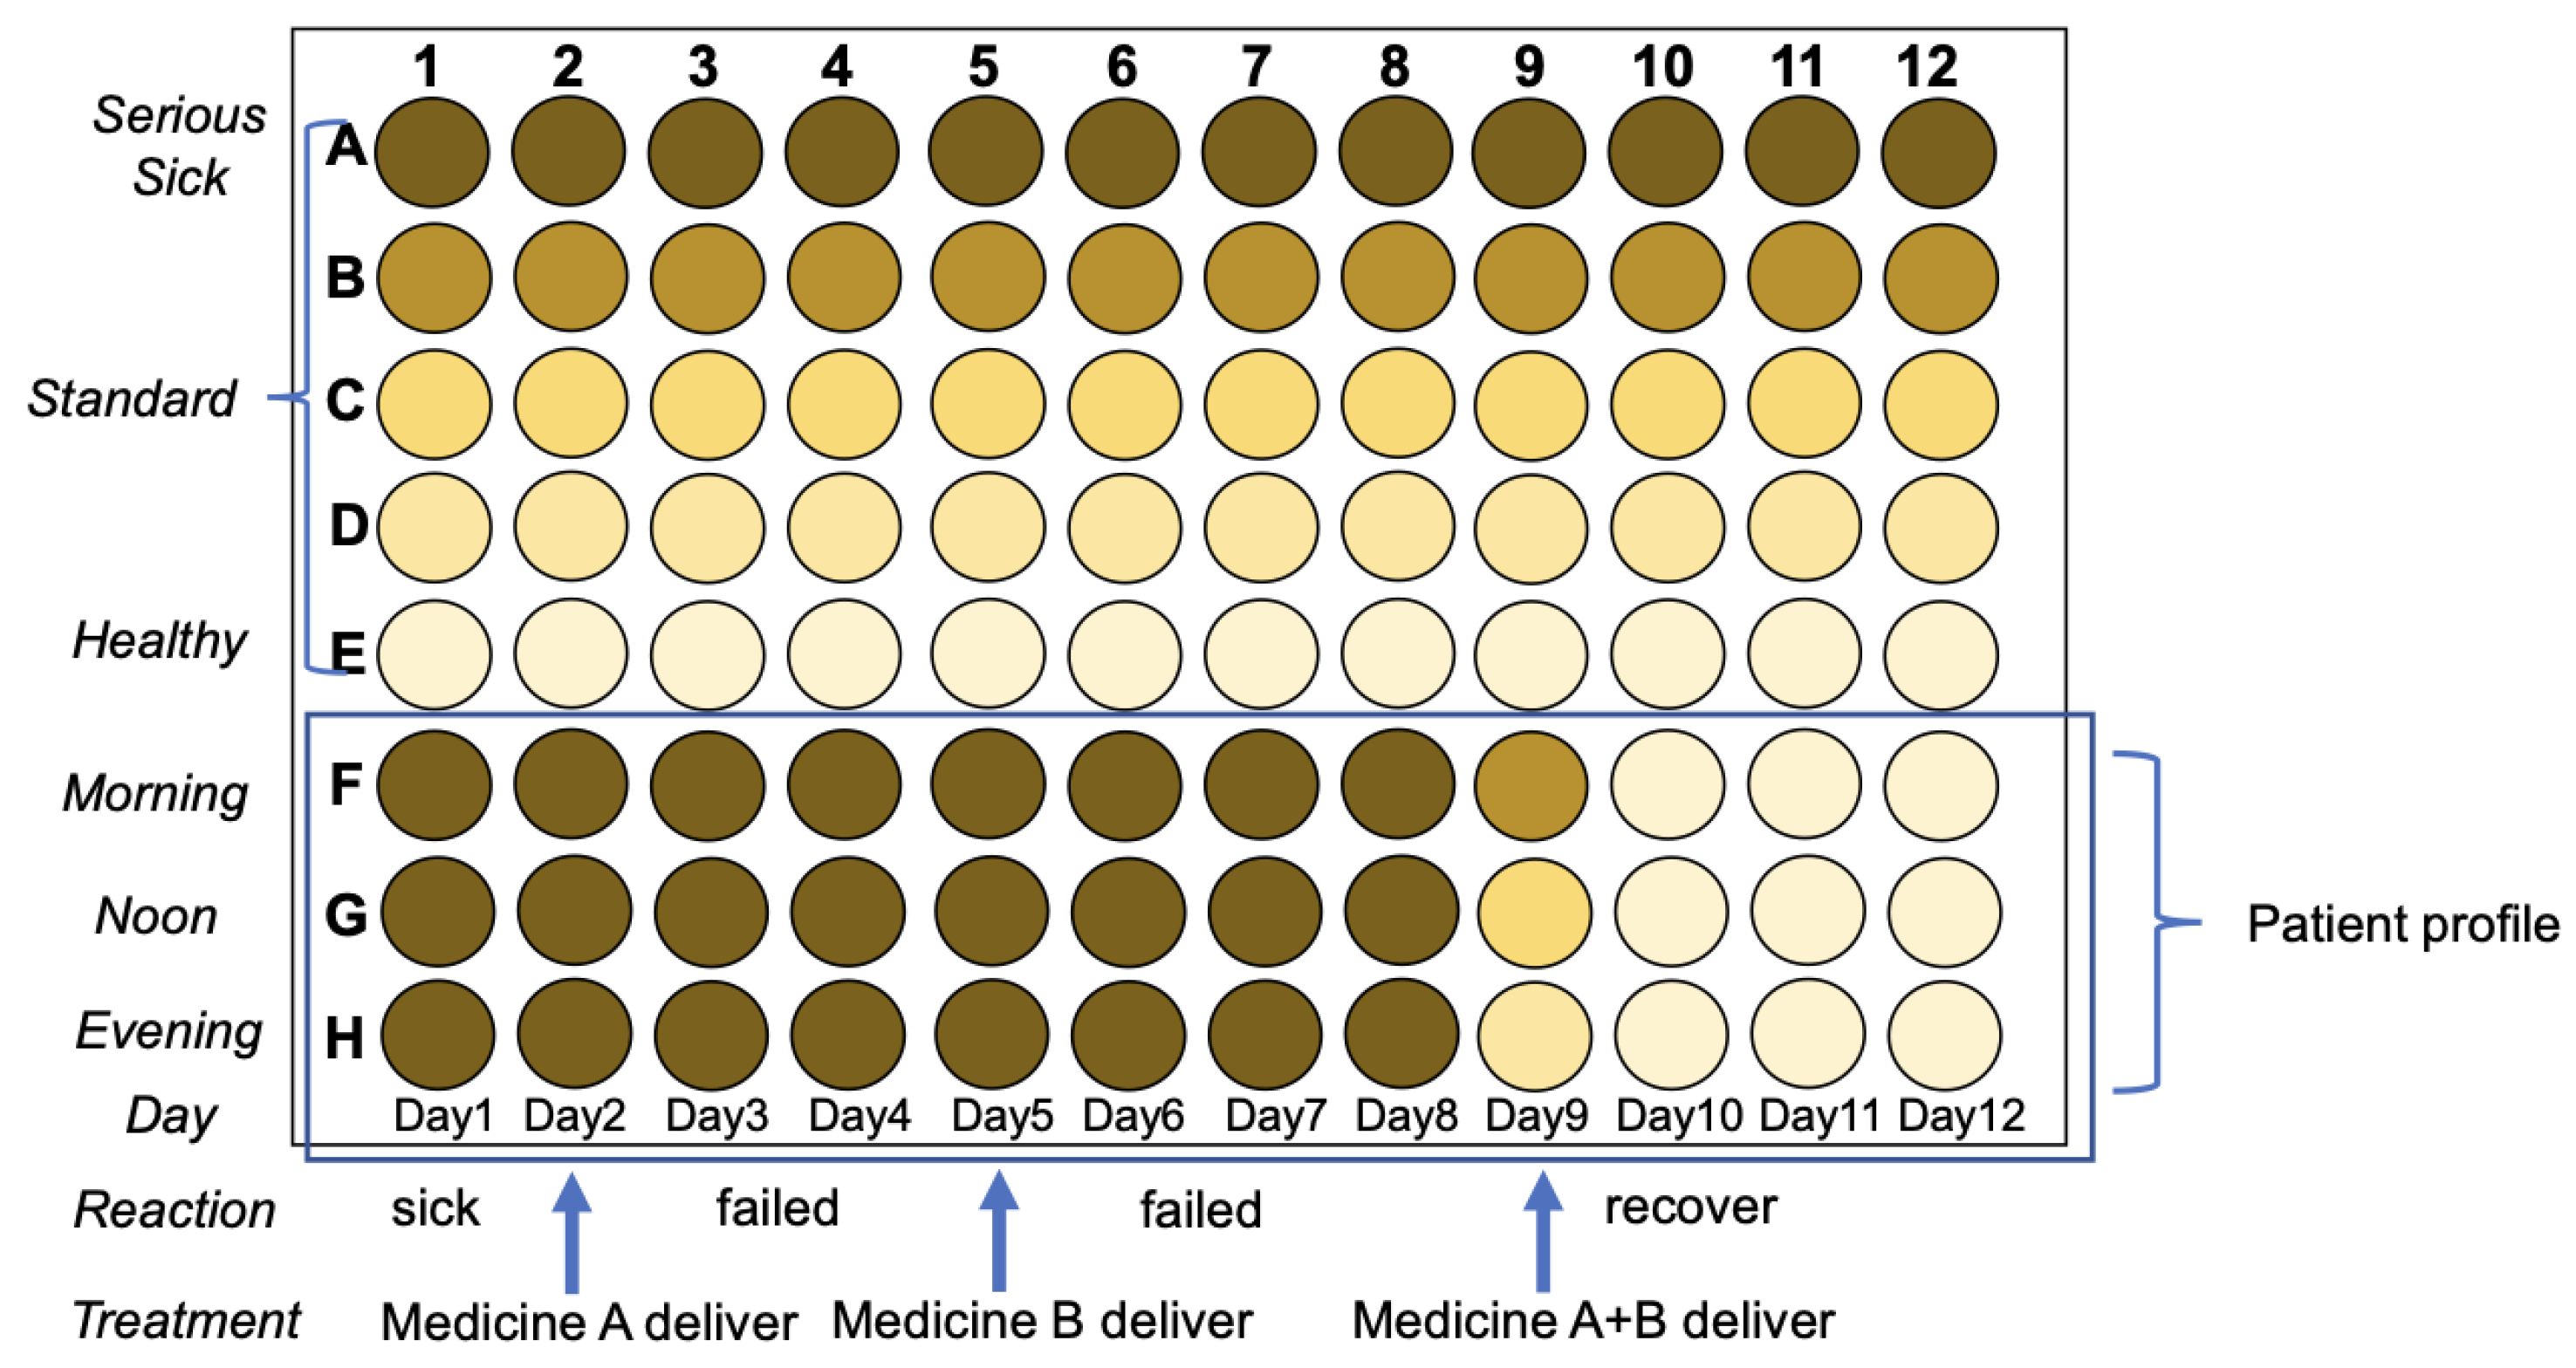
Figure 11. The idea is to establish medicine profile for selecting the right medicine based on Pharmacodynamics, in case to precisely targeting, showed in
Figure 12.
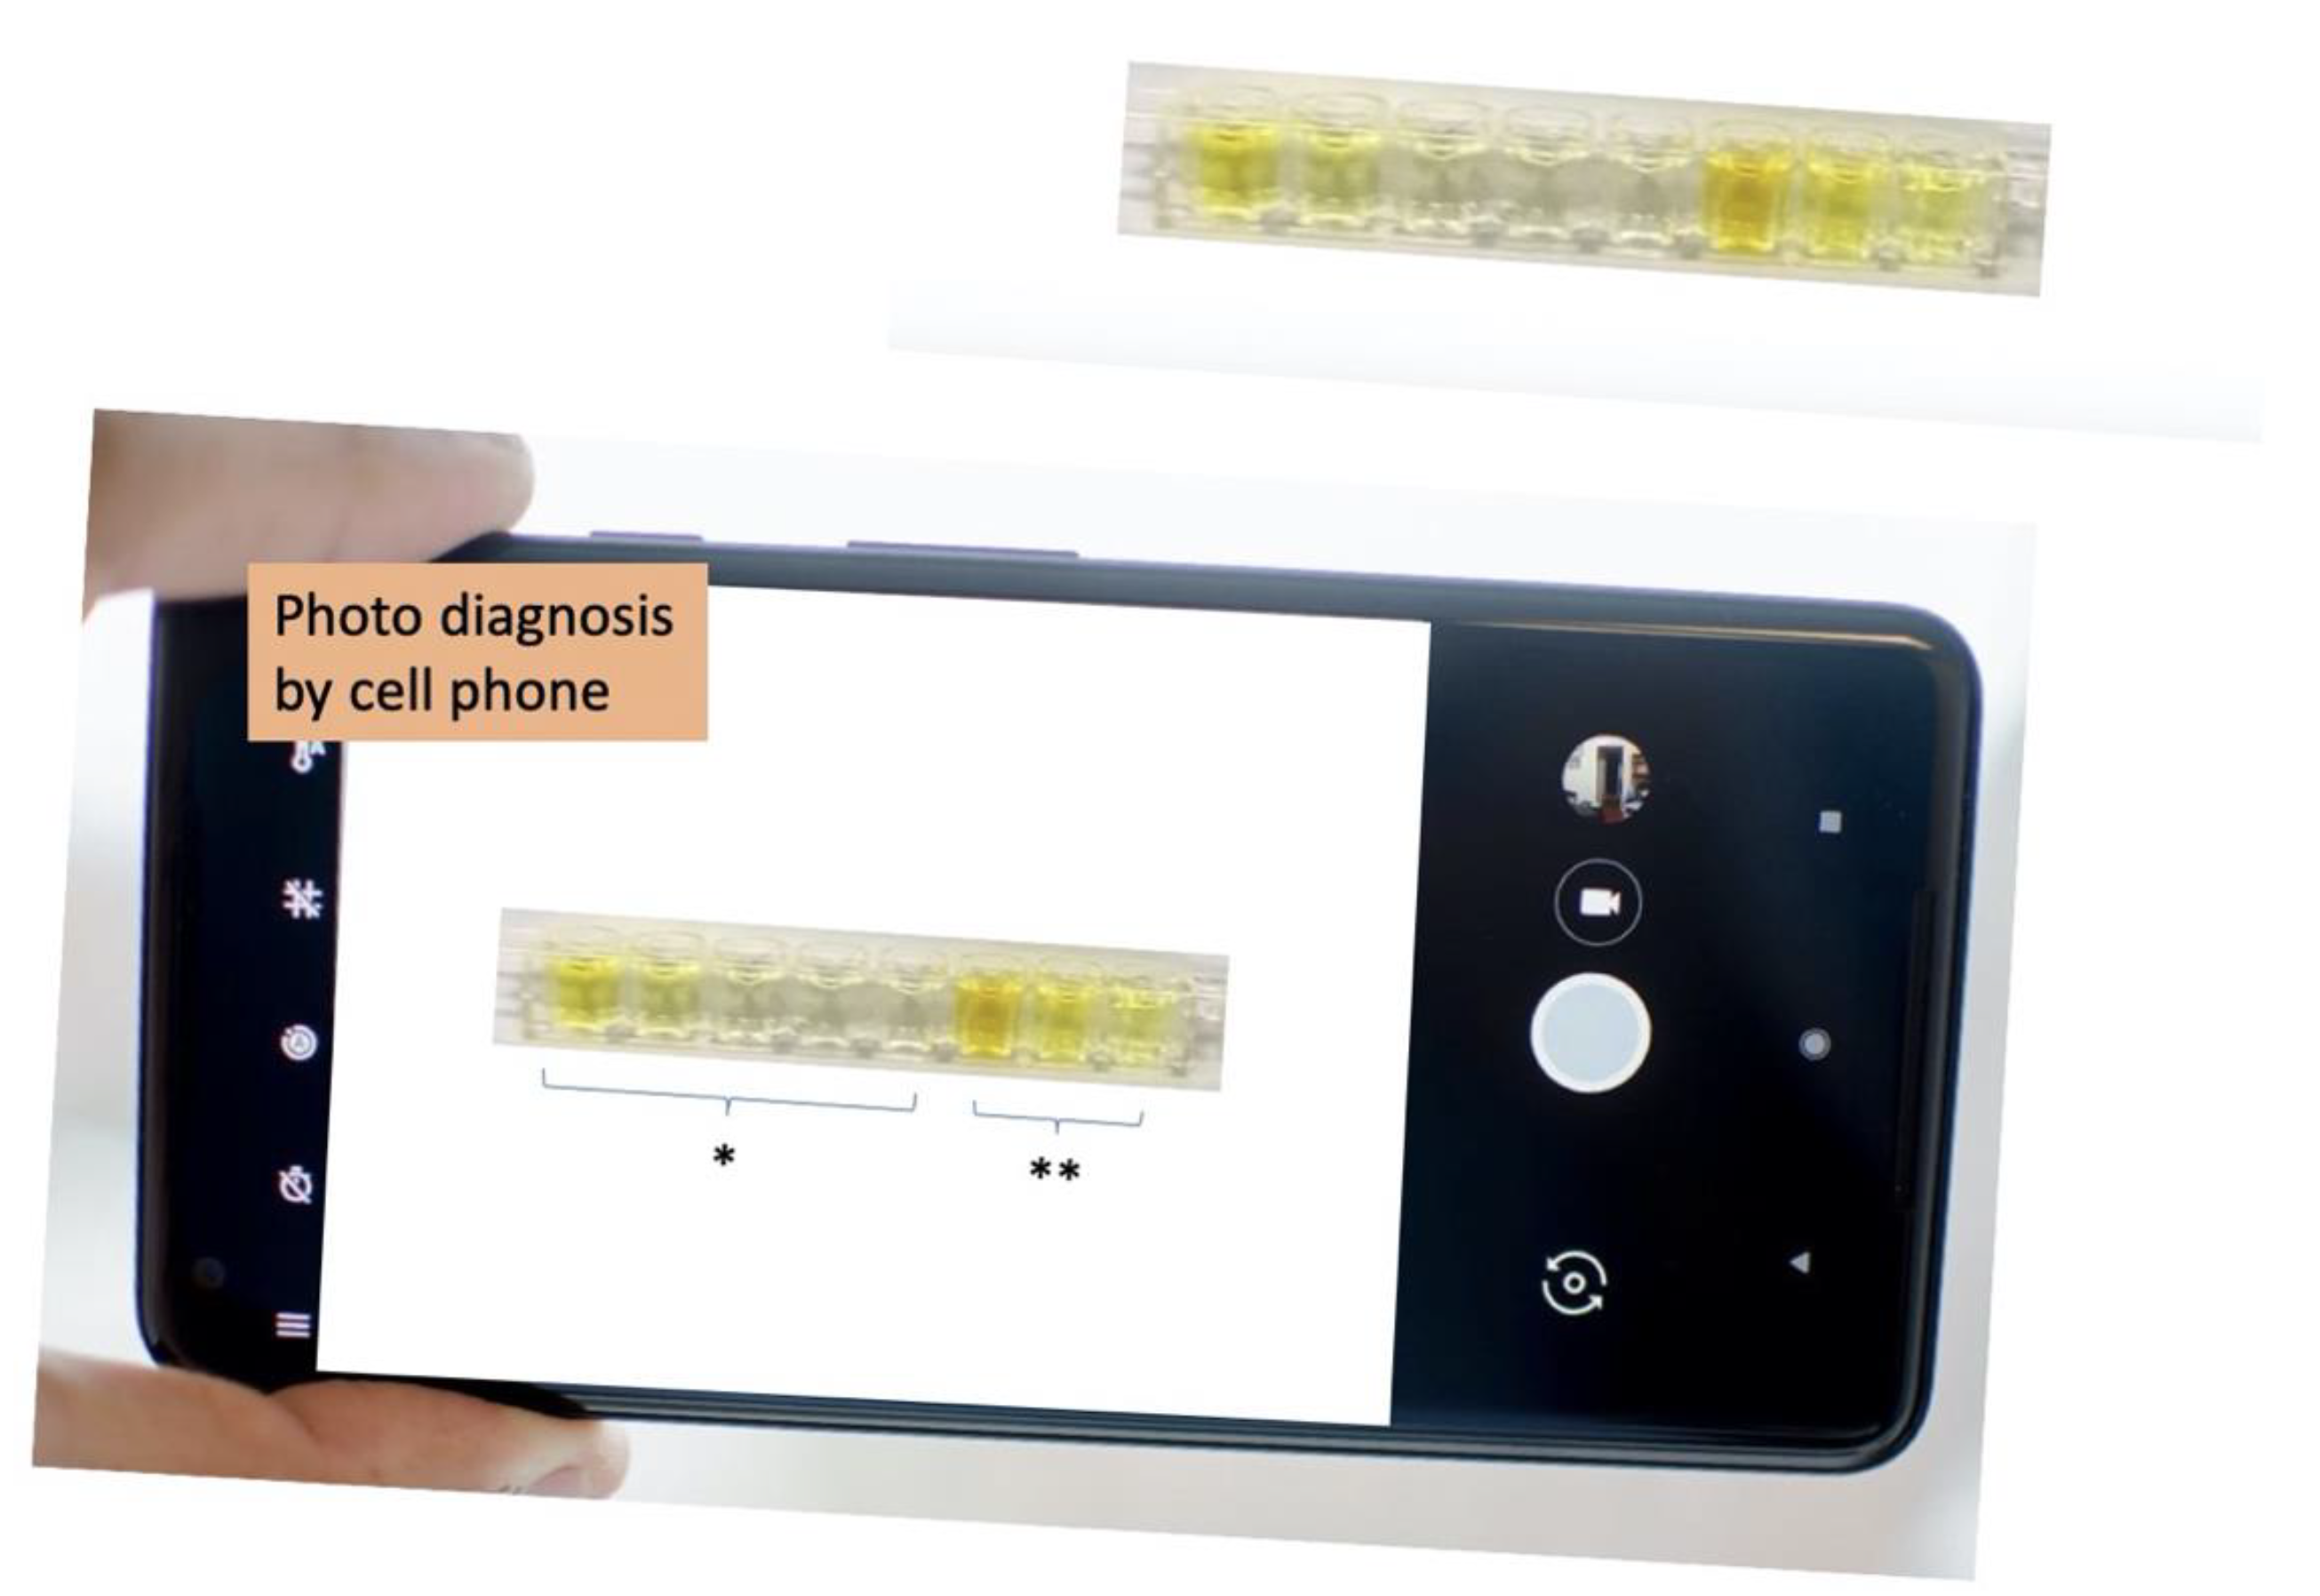
For daily usage as rapid-test kid, with compatible diagnosis app, taking pictures and applying onto diagnosis app, daily usage procedure can be available for public. Analyzing, recording, and tracking the result for public health improvement application.
Figure 1.
Gold secondary antibody is employed for cTnI detection. Plot of the (A) whole spectrum absorption, (b) absorption after blank-plate background correction, and (c) red shift vs. Log cTnI concentration. Note c: the error bar decreases with the increase of cTnI concentration indicates studying dilution ratio of antibody can be a way for increasing resolution. The study results shown in Figure 4.
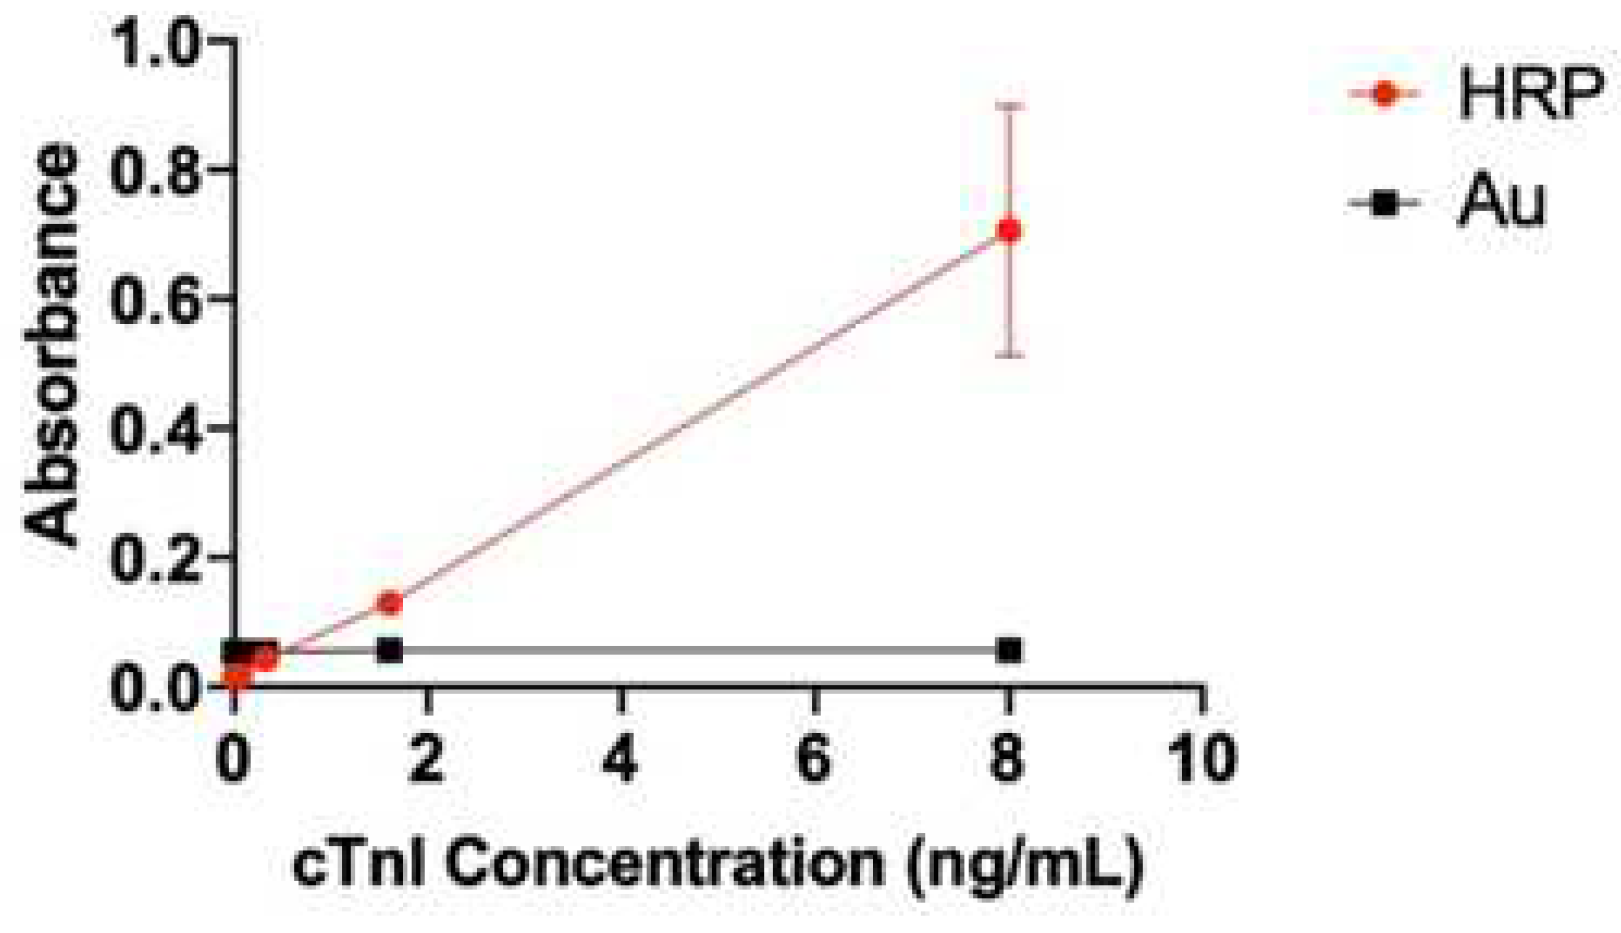
Figure 2.
Gold hot spot 2Ab vs. HRP 2Ab. Compared to the Au-2Ab method, HRP 2Ab has a better linear response and calibration line.
Figure 2.
Gold hot spot 2Ab vs. HRP 2Ab. Compared to the Au-2Ab method, HRP 2Ab has a better linear response and calibration line.
Figure 3.
cTnI detection model. (a) Standard curve calibrated at 450 nm absorbance. The arrow indicates the area which is our main focus to increase the resolution; (b) Color change can be seen by naked-eye, gradually changes in response to the increase of the cTnI concentration from 0.064 to 8.00 ng/mL.
Figure 4.
Dilution ratio of the secondary antibody with (A) different ratios, (B) 145X dilution, and (C) 1562.5X dilution. * denotes that the reference wells contain standard cTnI protein from 0 to 8 ng/mL, and ** denotes that the sample wells contain human serum spiked with standard cTnI protein in three concentrations.
Figure 5.
Schematic illustrating the procedure of naked-eye cTnI detection device in (A) sample wells; (B) reference wells; (C) blood loading on the sample well, with the red arrow representing the blood flow; (D) PBS loading on the reference well, with the black arrow denoting the PBS flow; (E) (F) secondary antibody loading and chromophore acting. Different items indicate as antibody (Red Y shape), BSA (blue ball), cTnI protein (grey), HRP (blue pistachio), and TMB chromophore (black ball). A, C, and E represent sample wells, while B, D, and F represent reference wells. The difference between sample wells and reference wells is: the reference wells in the first step already coated with standard cTnI protein which serves as calibration wells.
Figure 6.
Schematic illustrating the pricking of blood in the clinic or at home for the self-diagnosis of MI: (A) Prick the finger and add 1 drop of blood into one sample well in every 30 mins, and totally add three wells in order. * indicates reference wells. (B) Add the reagents. (C) Self-diagnose MI based on the yellow color pattern, where the yellow color pattern for the sample wells denotes positive diagnosis. After comparing to the reference well, the doctor can know the concentration of cTnI protein in each time point.
Figure 7.
cTnI naked-eye detection device are three rows in a bag which is portable, disposable, and can be assembled onto a 96 well frame. Strips are sealed packed in an airtight package.
Figure 7.
cTnI naked-eye detection device are three rows in a bag which is portable, disposable, and can be assembled onto a 96 well frame. Strips are sealed packed in an airtight package.
Figure 8.
Naked-eye cTnI detection device testing under human serum matrix effect. (A) spiked and (B) non-spiked with cTnI protein. The 10X dilution of the human serum of (C) spiked and (D) non-spiked with cTnI protein. A spiked sample represents a patient sample, while a non-spiked sample represents a healthy sample. Black arrows represent the timing points of 0.5 h/1 h/1.5 h (from right to left) after patient arriving in the emergency room. * indicates reference from right to left of 0, 0.064, 0.32, 1.60, and 8.00 ng/mL. This device can successfully tell MI patient from healthy human.
Figure 9.
Standard curve of cTnI protein between the proposed test strip and commercial ELISA plate.
Figure 9.
Standard curve of cTnI protein between the proposed test strip and commercial ELISA plate.
Figure 10.
For pharmaceutical study. (a) Portable and can be assembled in 96 well frame for high-throughput screening; (b) Sealed package. Advantages of this methodology: 1) easy fabrication line, can easily apply mass production; 2) portable, easy to carry and use.
Figure 10.
For pharmaceutical study. (a) Portable and can be assembled in 96 well frame for high-throughput screening; (b) Sealed package. Advantages of this methodology: 1) easy fabrication line, can easily apply mass production; 2) portable, easy to carry and use.
Figure 11.
Tracking pharmaceutical kinetic and patient profile. Advantages: 1) easy to track patient profile; 2) easy to check medicine pharmacokinetic; 3) Portable and easy to apply; 4) little sample loading amount; 5) deliver medicine accurately; 6) medicine economic.
Figure 11.
Tracking pharmaceutical kinetic and patient profile. Advantages: 1) easy to track patient profile; 2) easy to check medicine pharmacokinetic; 3) Portable and easy to apply; 4) little sample loading amount; 5) deliver medicine accurately; 6) medicine economic.
Figure 12.
Establish medicine profile for medicine selection based on Pharmacodynamics. Advantages: easy to establish medicine profile with different doses, medicine selections, age of examiners, and combinational drugs.
Figure 12.
Establish medicine profile for medicine selection based on Pharmacodynamics. Advantages: easy to establish medicine profile with different doses, medicine selections, age of examiners, and combinational drugs.
Figure 13.
By taking picture by cell phone, with app and color comparison code, people can diagnosis and gathering pre-clinic daily data for tracking patient’s disease progress for myocardial infarction, medicine dose record, and medicine digestion.
Figure 13.
By taking picture by cell phone, with app and color comparison code, people can diagnosis and gathering pre-clinic daily data for tracking patient’s disease progress for myocardial infarction, medicine dose record, and medicine digestion.
Table 1.
Comparison between the proposed test strip and Traditional cTnI ELISA plate.
Table 1.
Comparison between the proposed test strip and Traditional cTnI ELISA plate.
| |
Proposed test strip |
Traditional cTnI ELISA plate |
| Accessibility
|
Can be used at home |
Can only be used by a trained scientist |
|
Naked-eye detection
|
More convenient
Reader is not required |
Reader is required |
|
Sensitivity*
|
High
(Slop = 0.057) |
Low
(Slop = 0.035) |
|
Trace detection
|
Better
LOD: 0.32 ng/mL |
LOD: 2 ng/mL |
|
Detection range
|
Larger
0.32–200 ng/mL |
2.0–75 ng/mL |
|
Detection time
|
Faster
70 min |
120 min |
|
Storage temperature
|
4°C |
−20°C |
