Submitted:
14 July 2023
Posted:
17 July 2023
You are already at the latest version
Abstract
Keywords:
1. Introduction
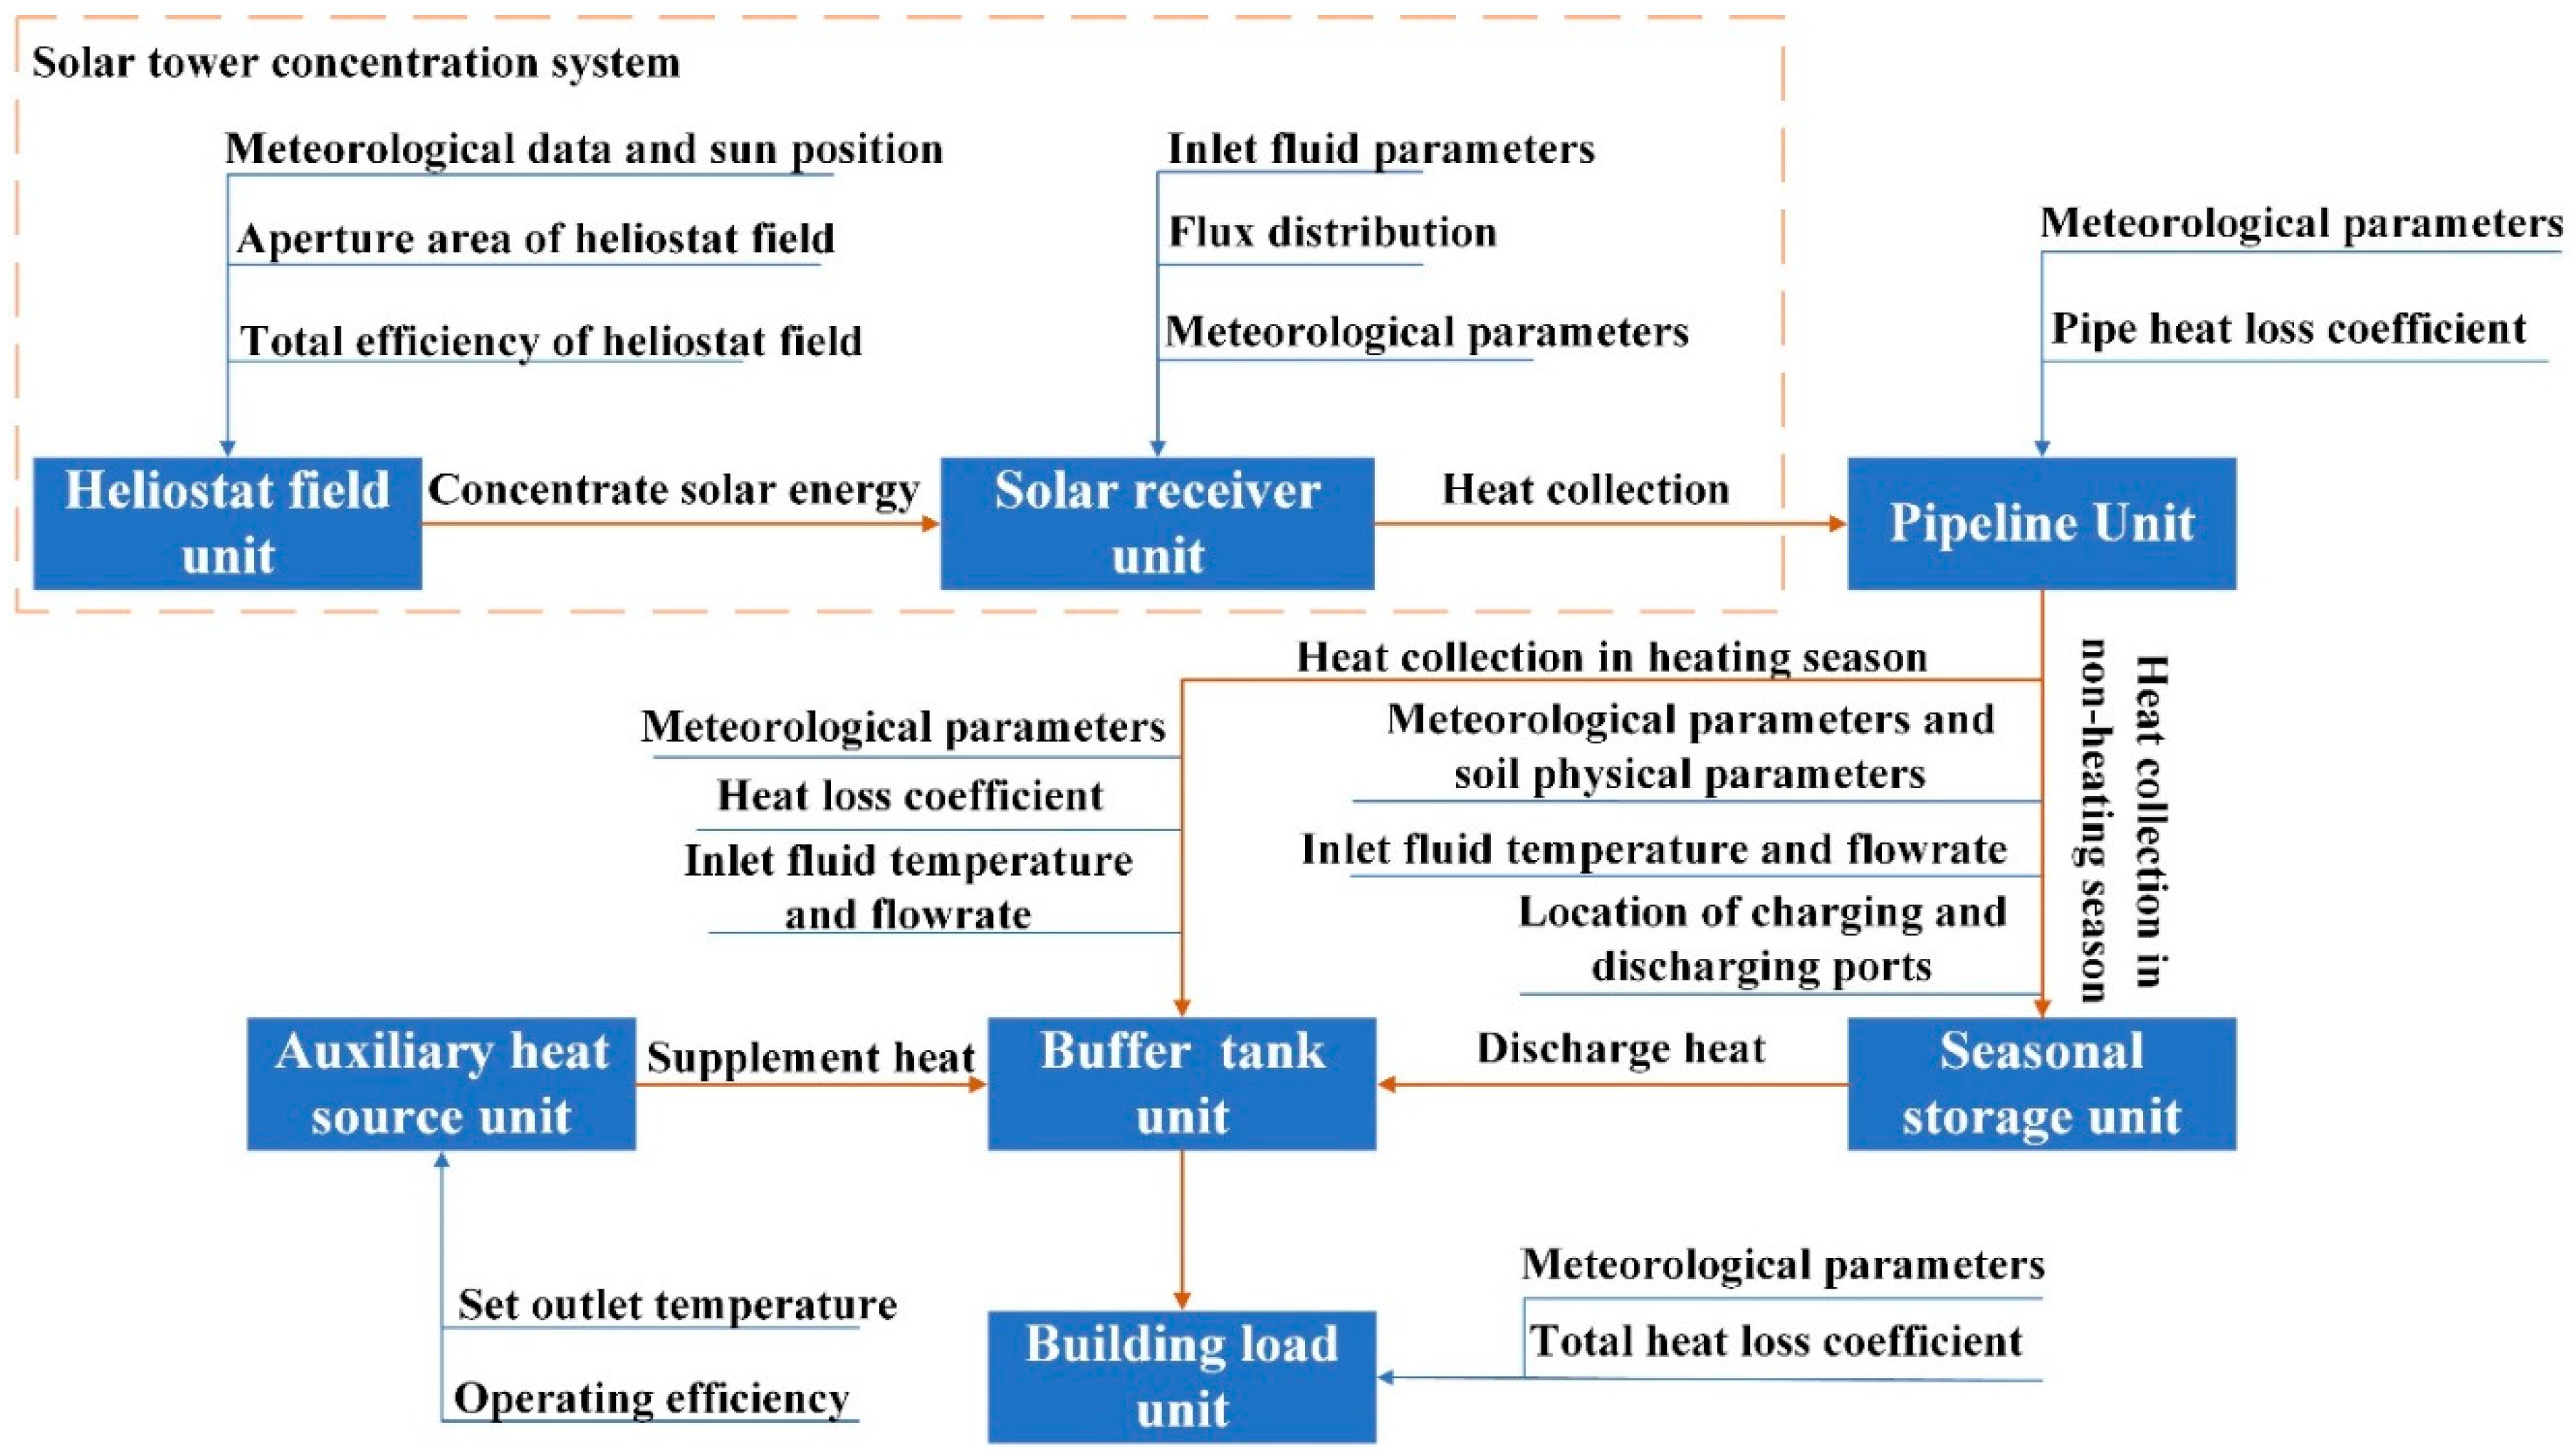
2. System description
3. Methodology
3.1. System model
3.1.1. The model of STS and the solar receiver model
3.1.2. Circulation pump model
3.1.3. Buffer tank model
3.1.4. Building load model
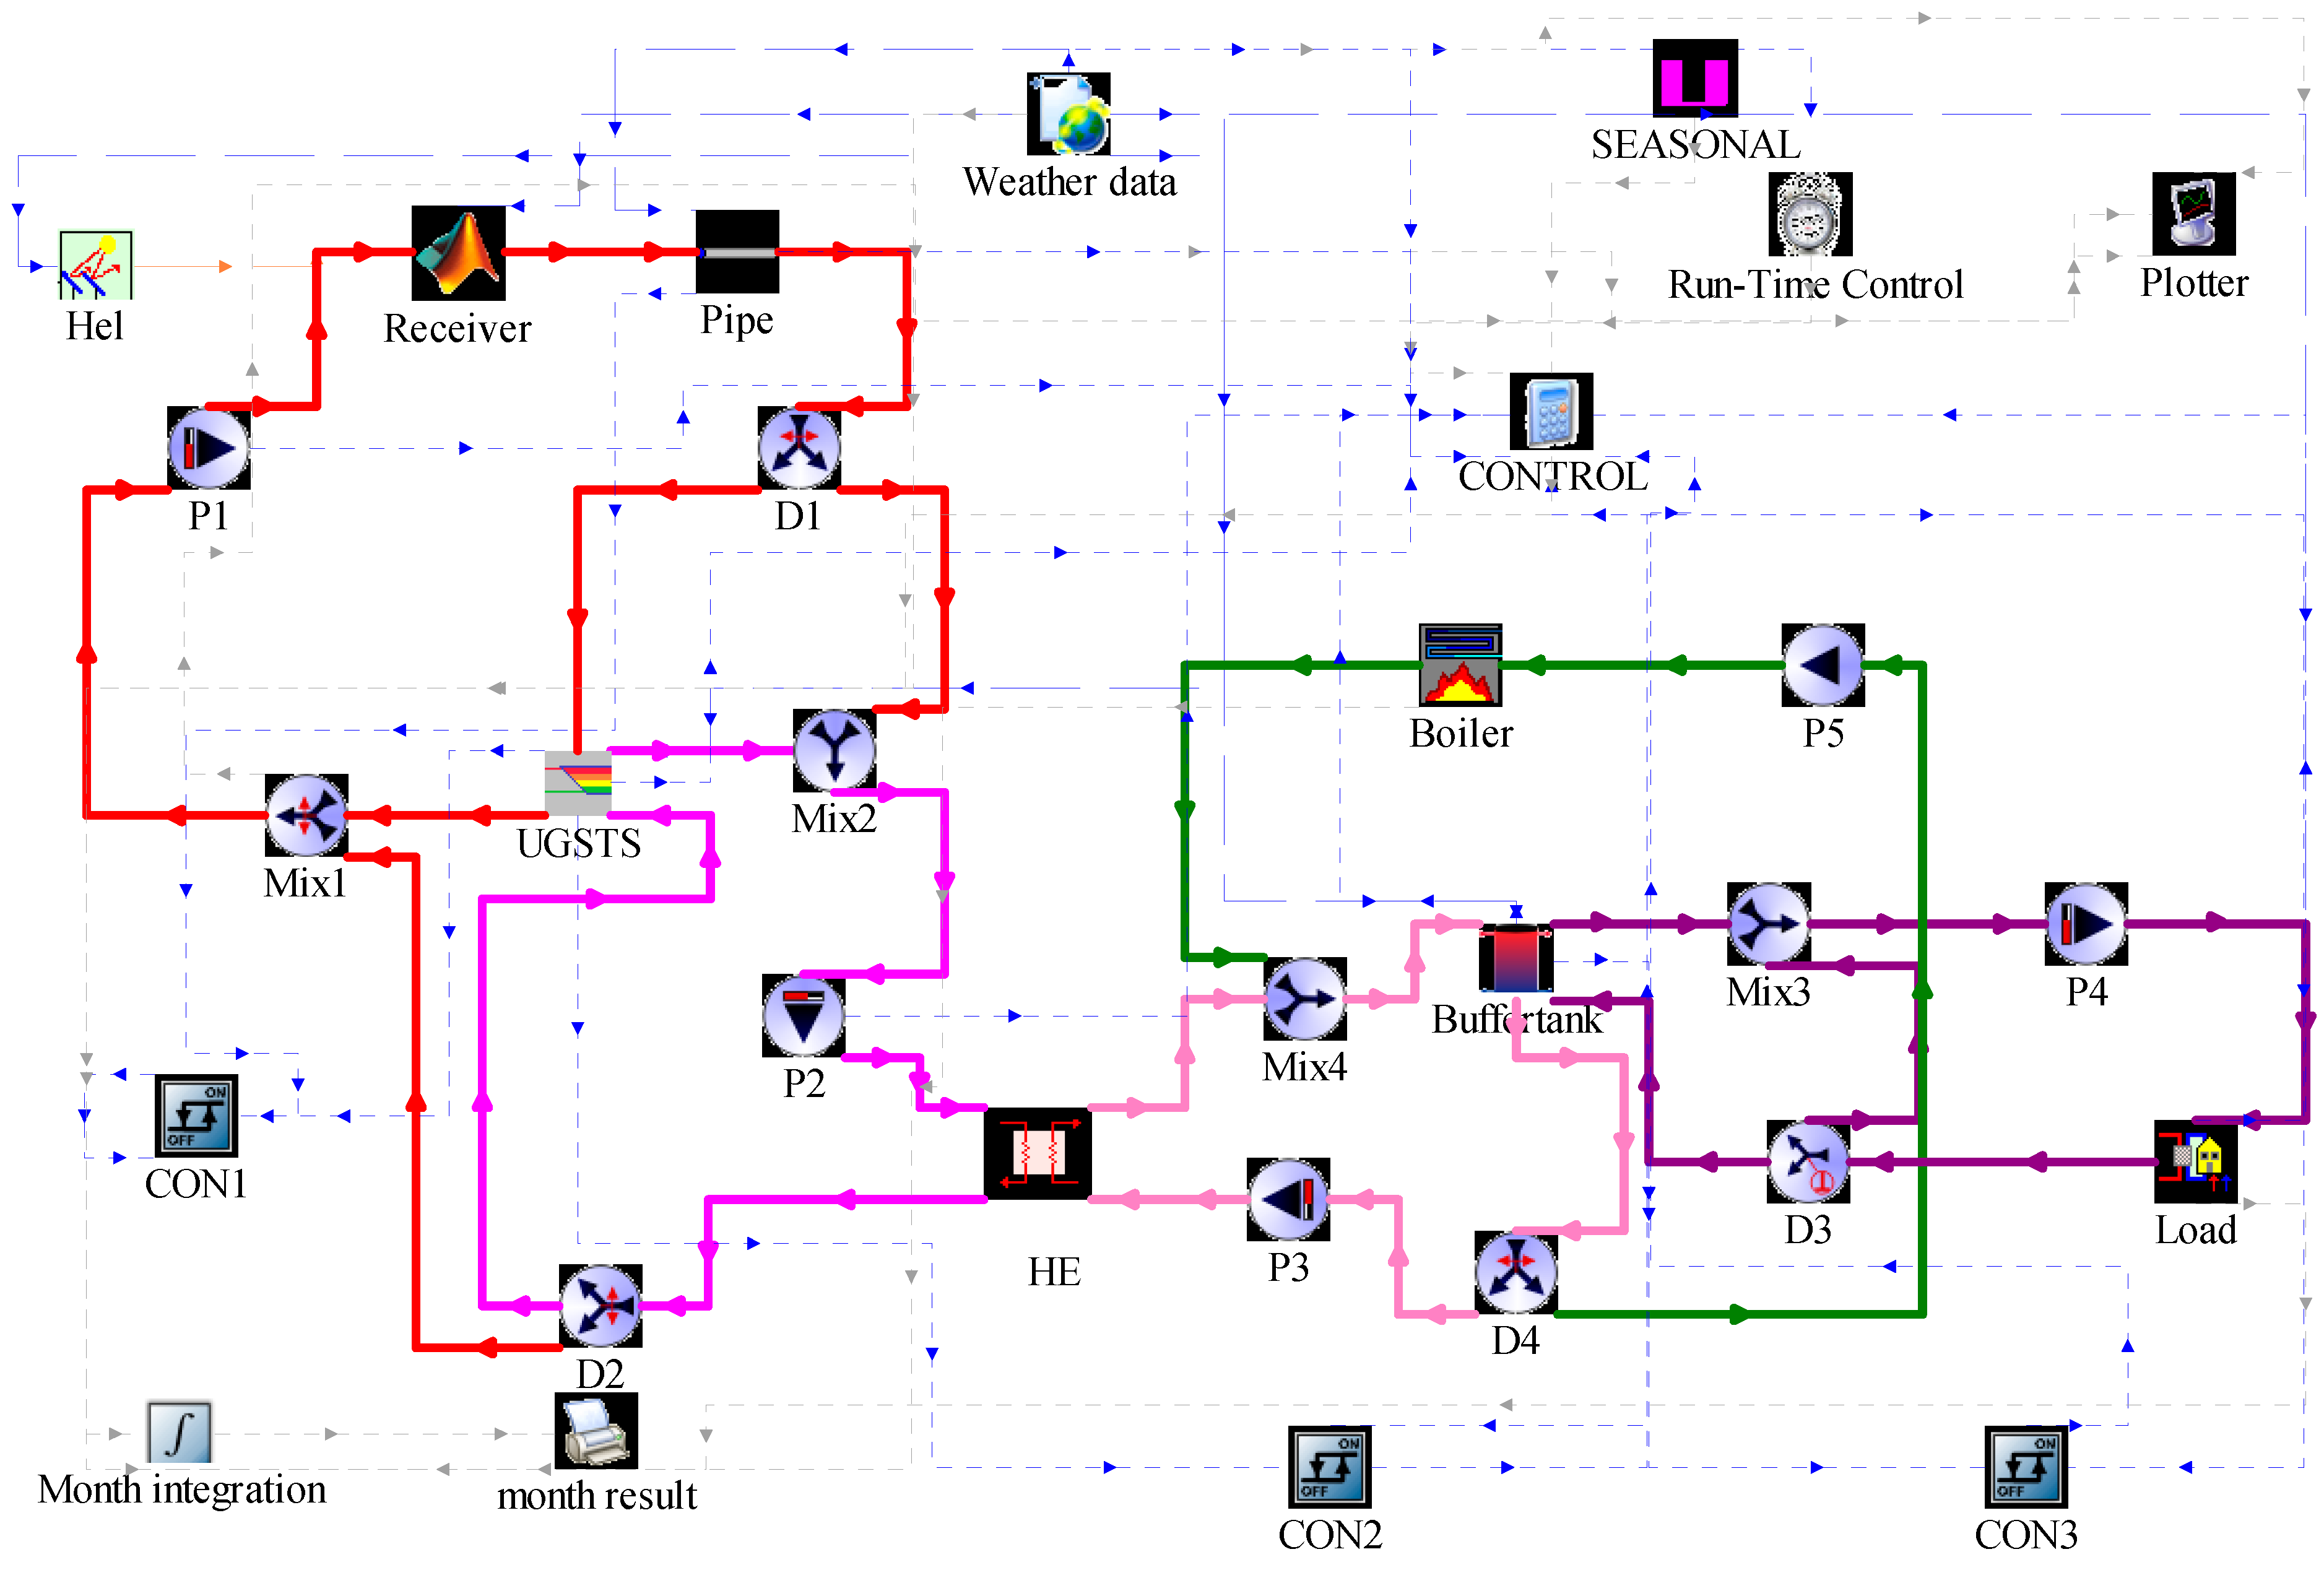
3.1.5. Mathematical model of the whole system
3.2. Operation strategies
3.2.1. Operation strategy in the non-heating season
3.2.2. Operation strategy in the heating season
3.3. System performance evaluation metrics
4. Discussion
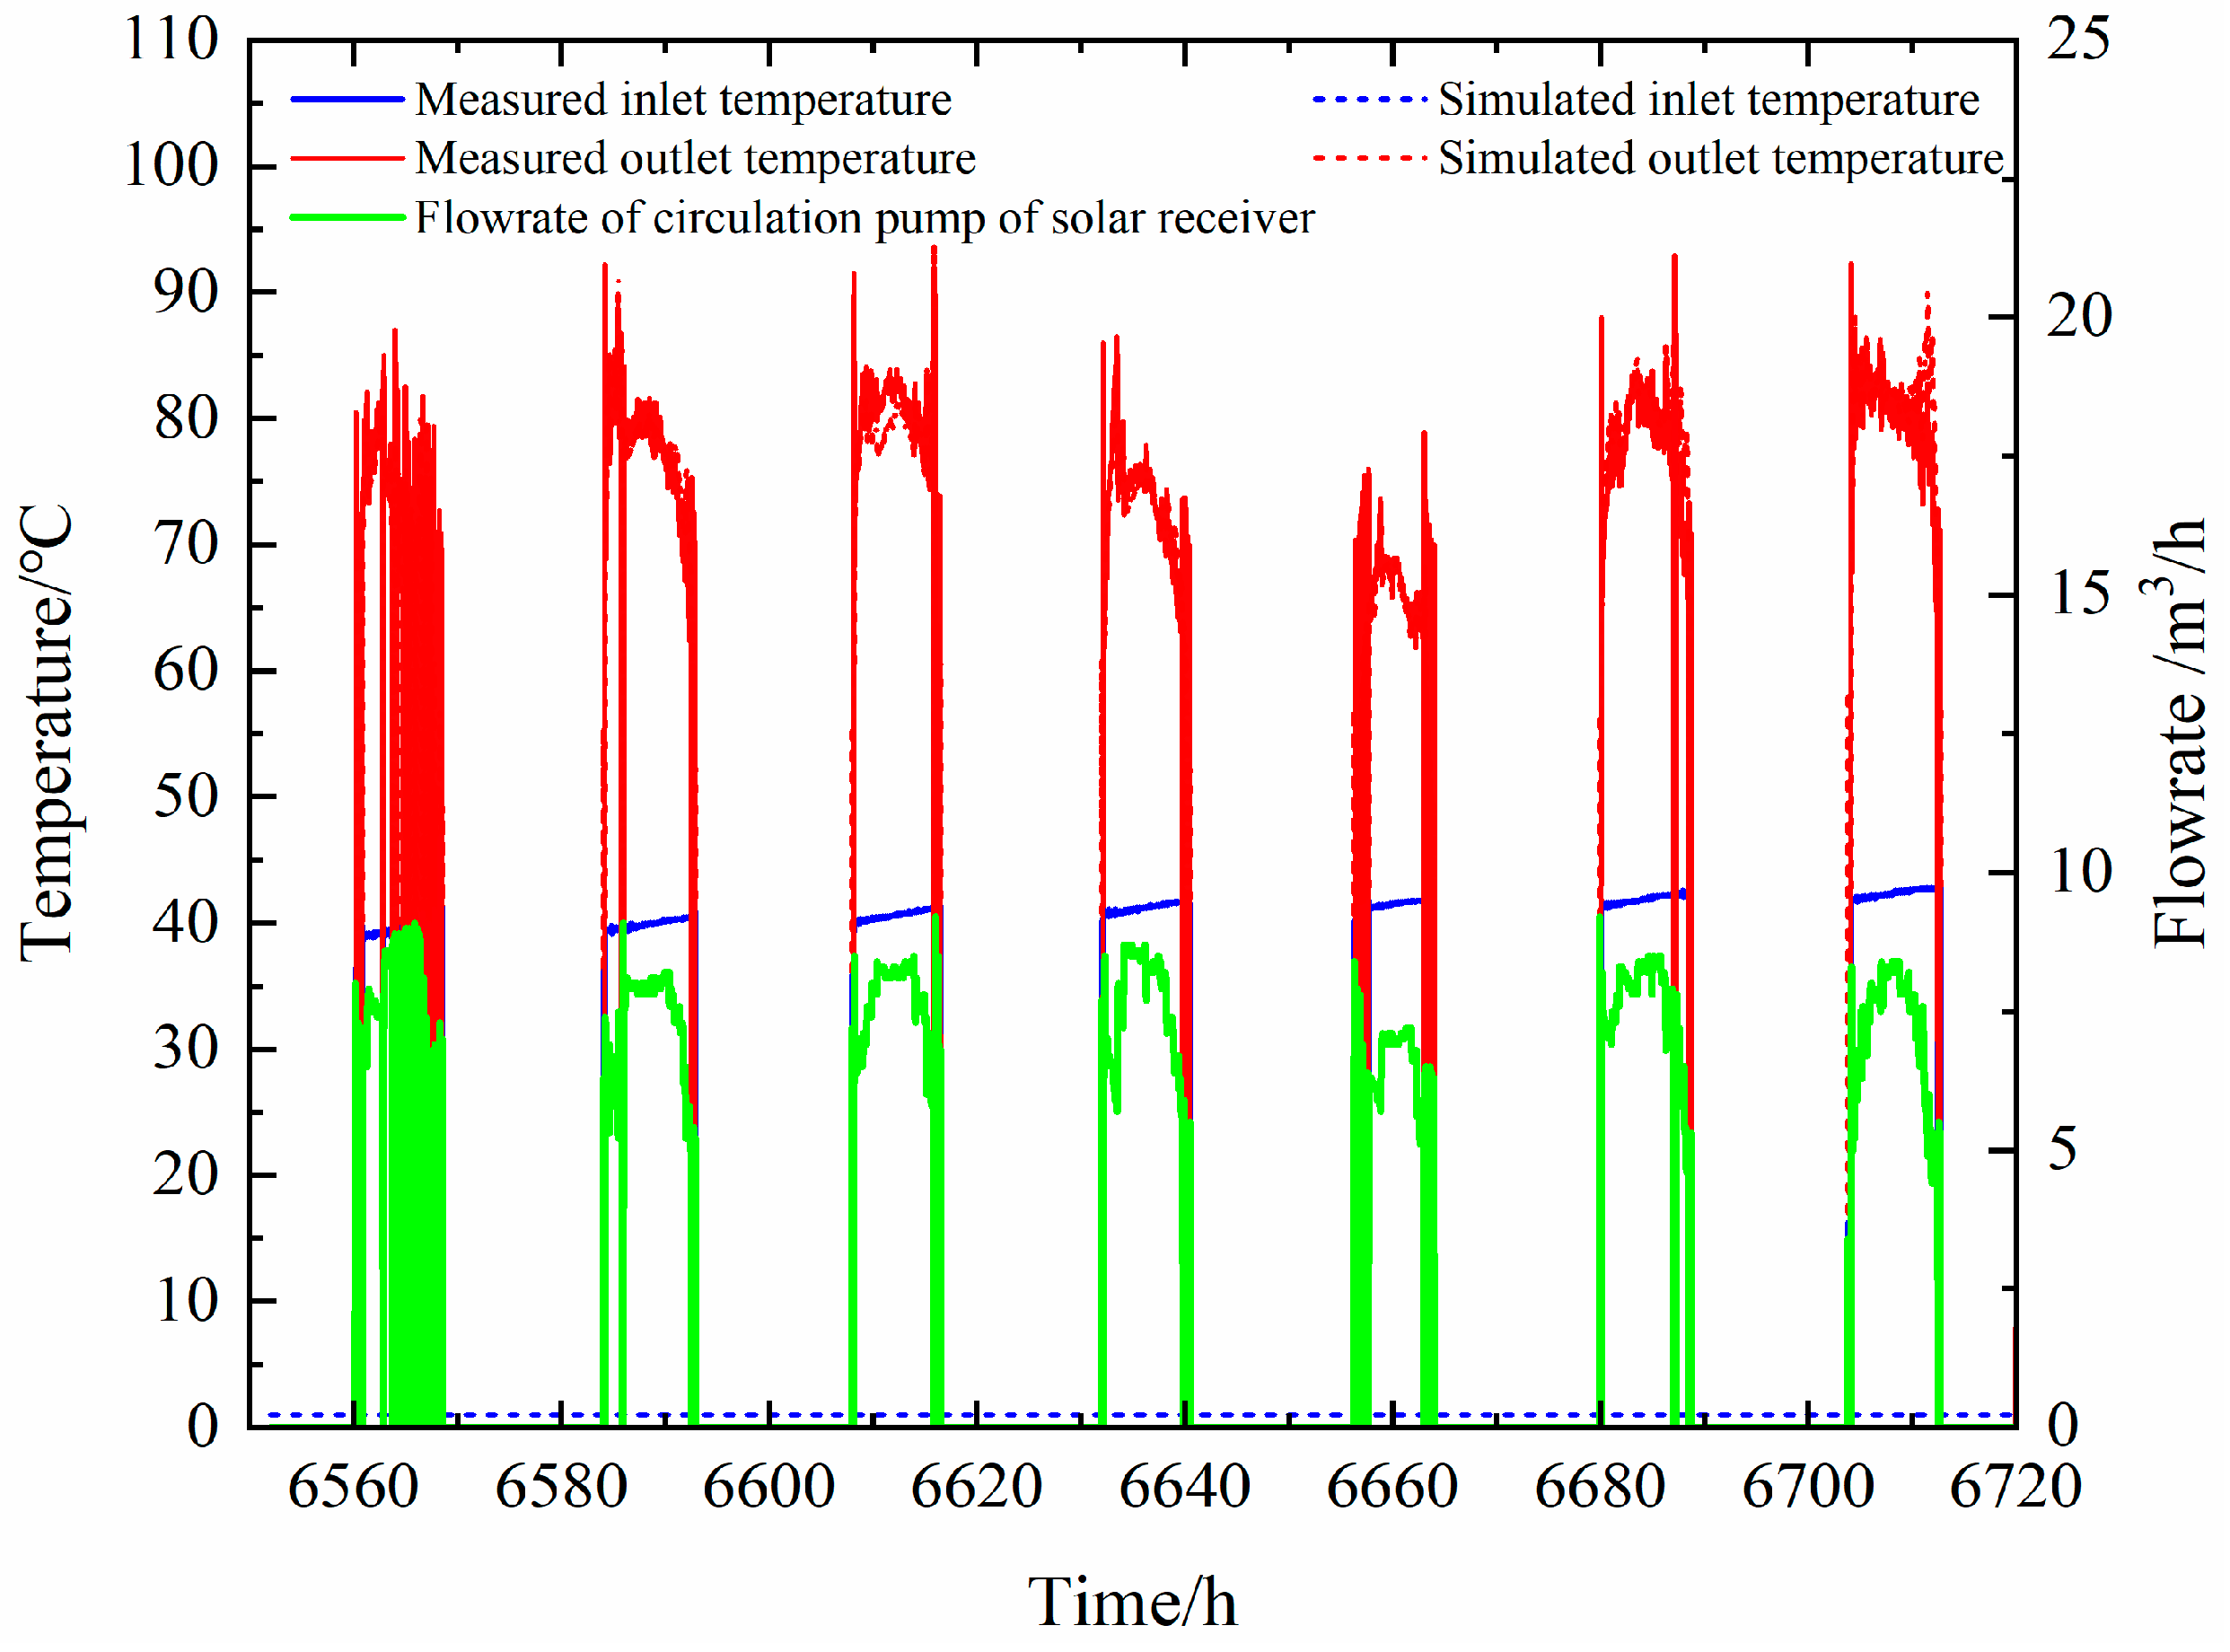
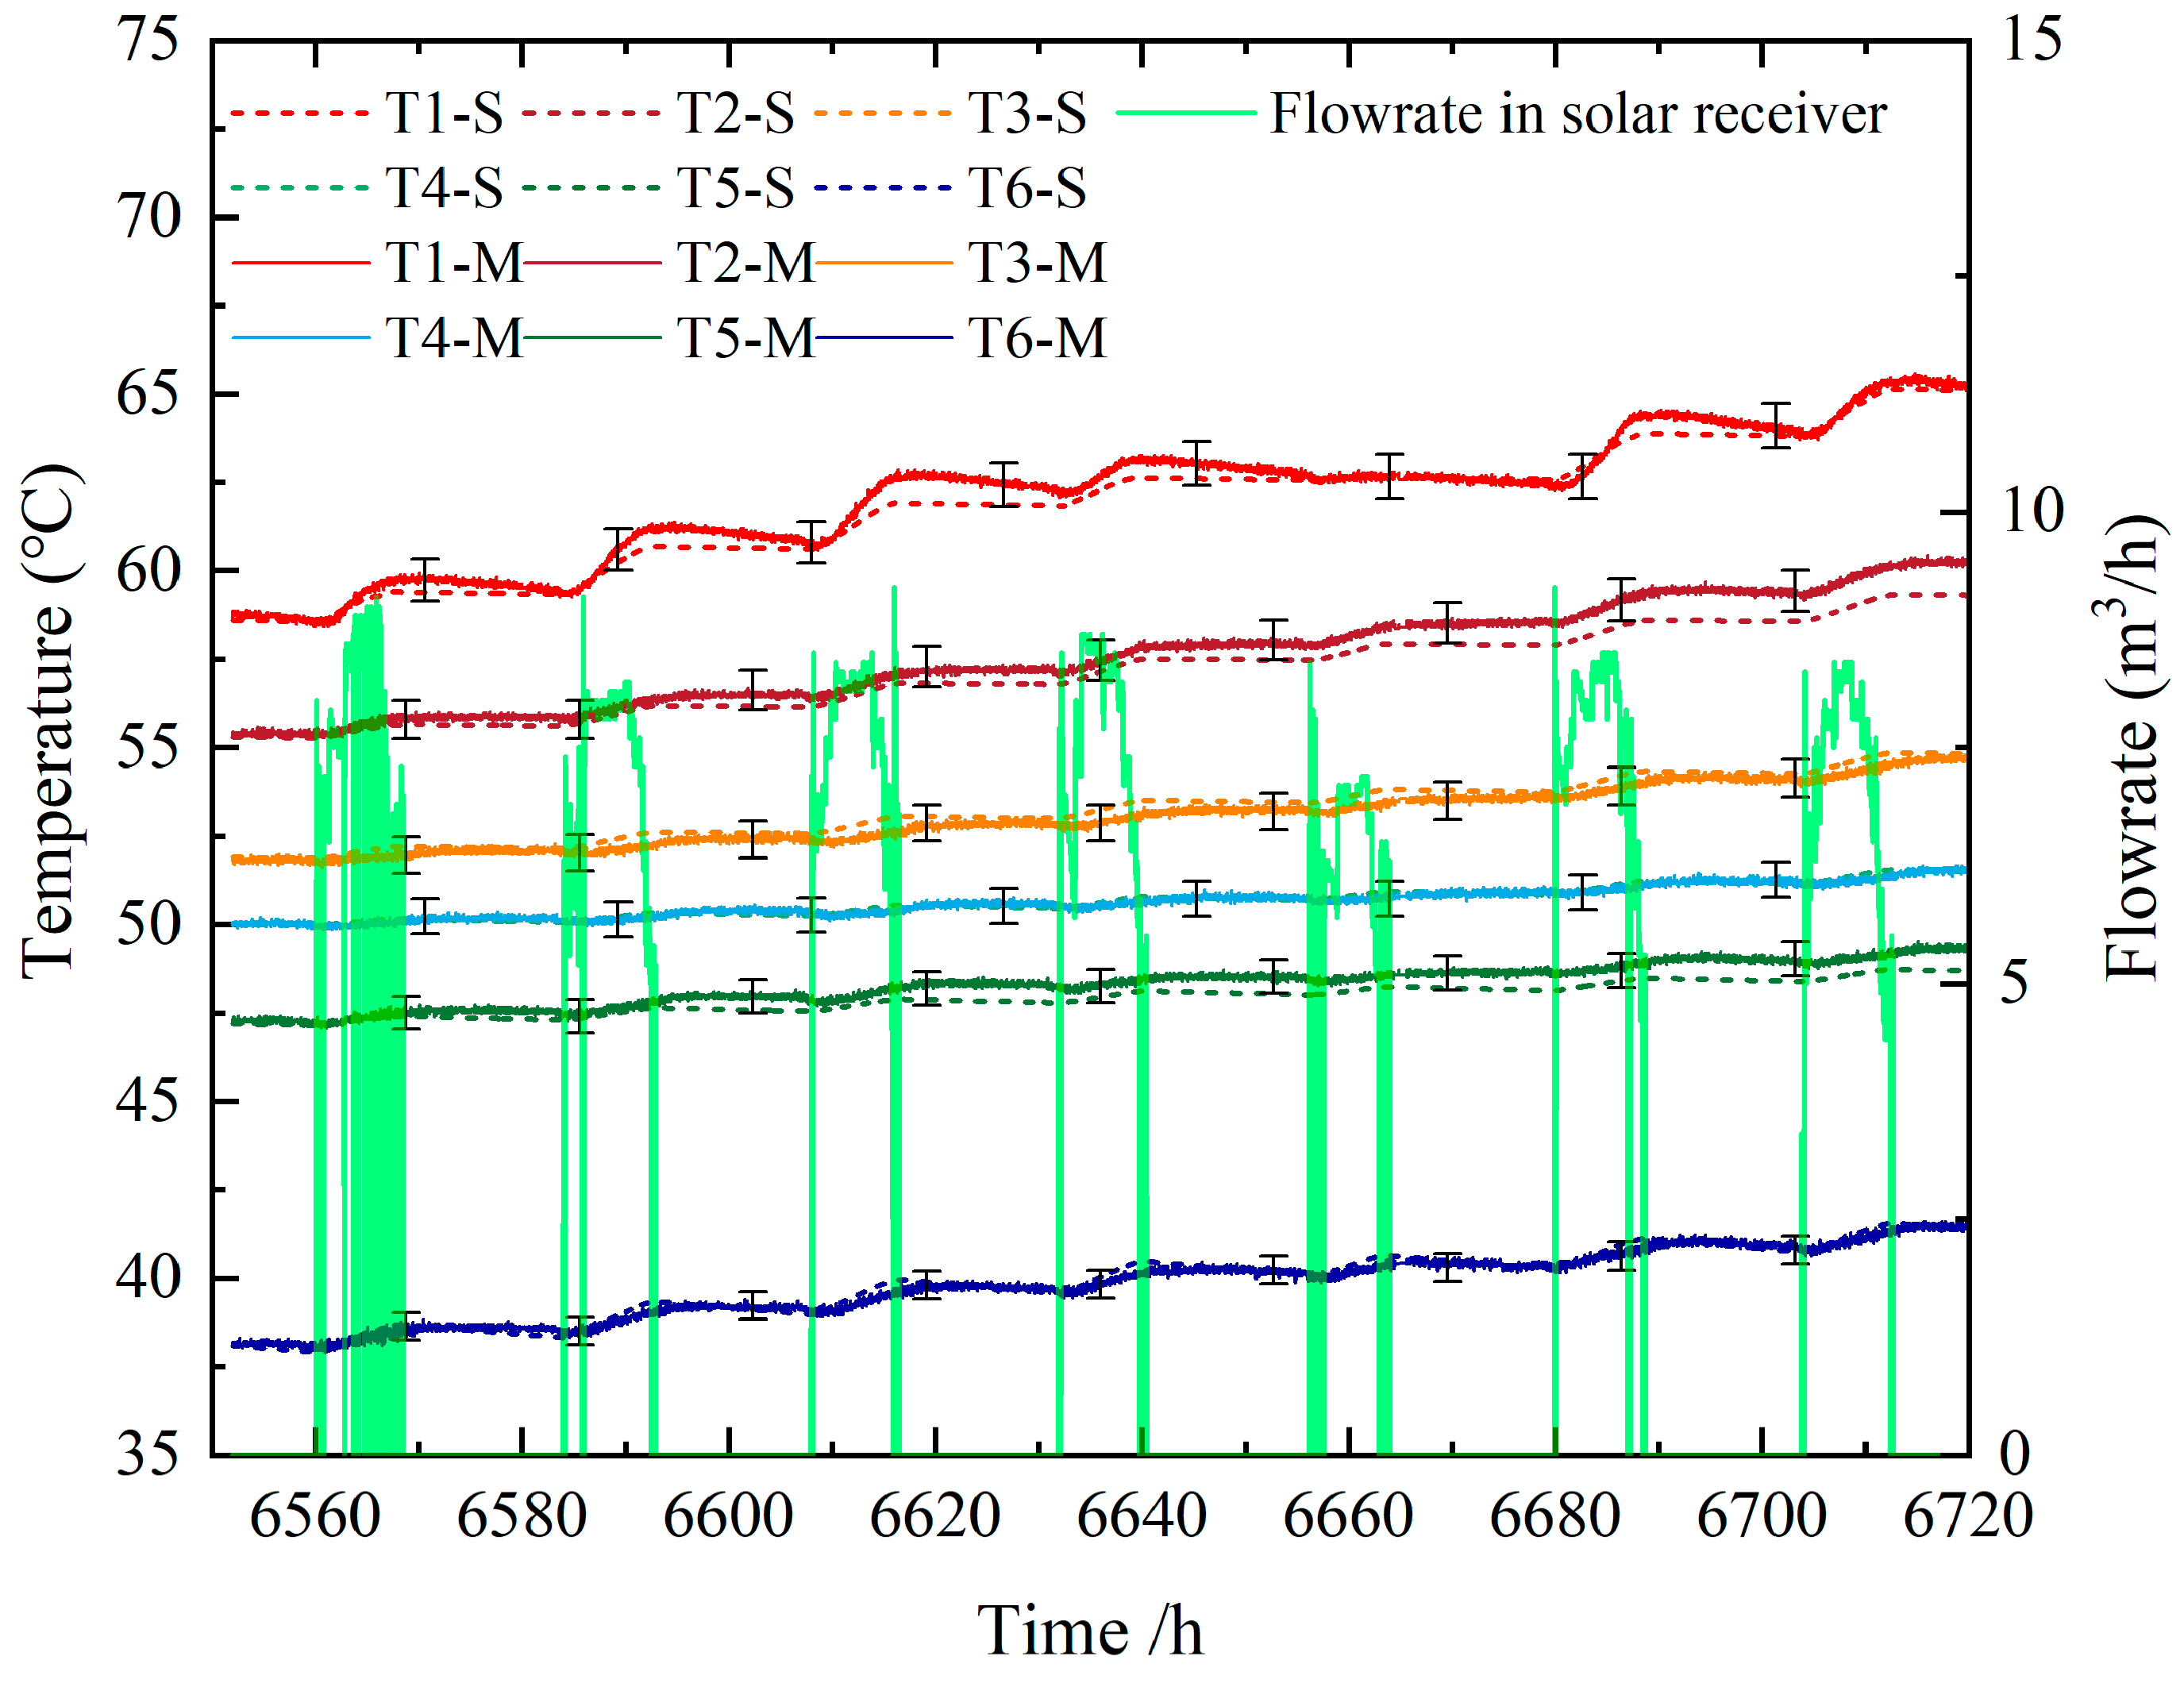
4.1. Model validation
4.2. Dynamical performance of the system
4.2.1. Dynamic characteristics analysis of typical working conditions in the non-heating season
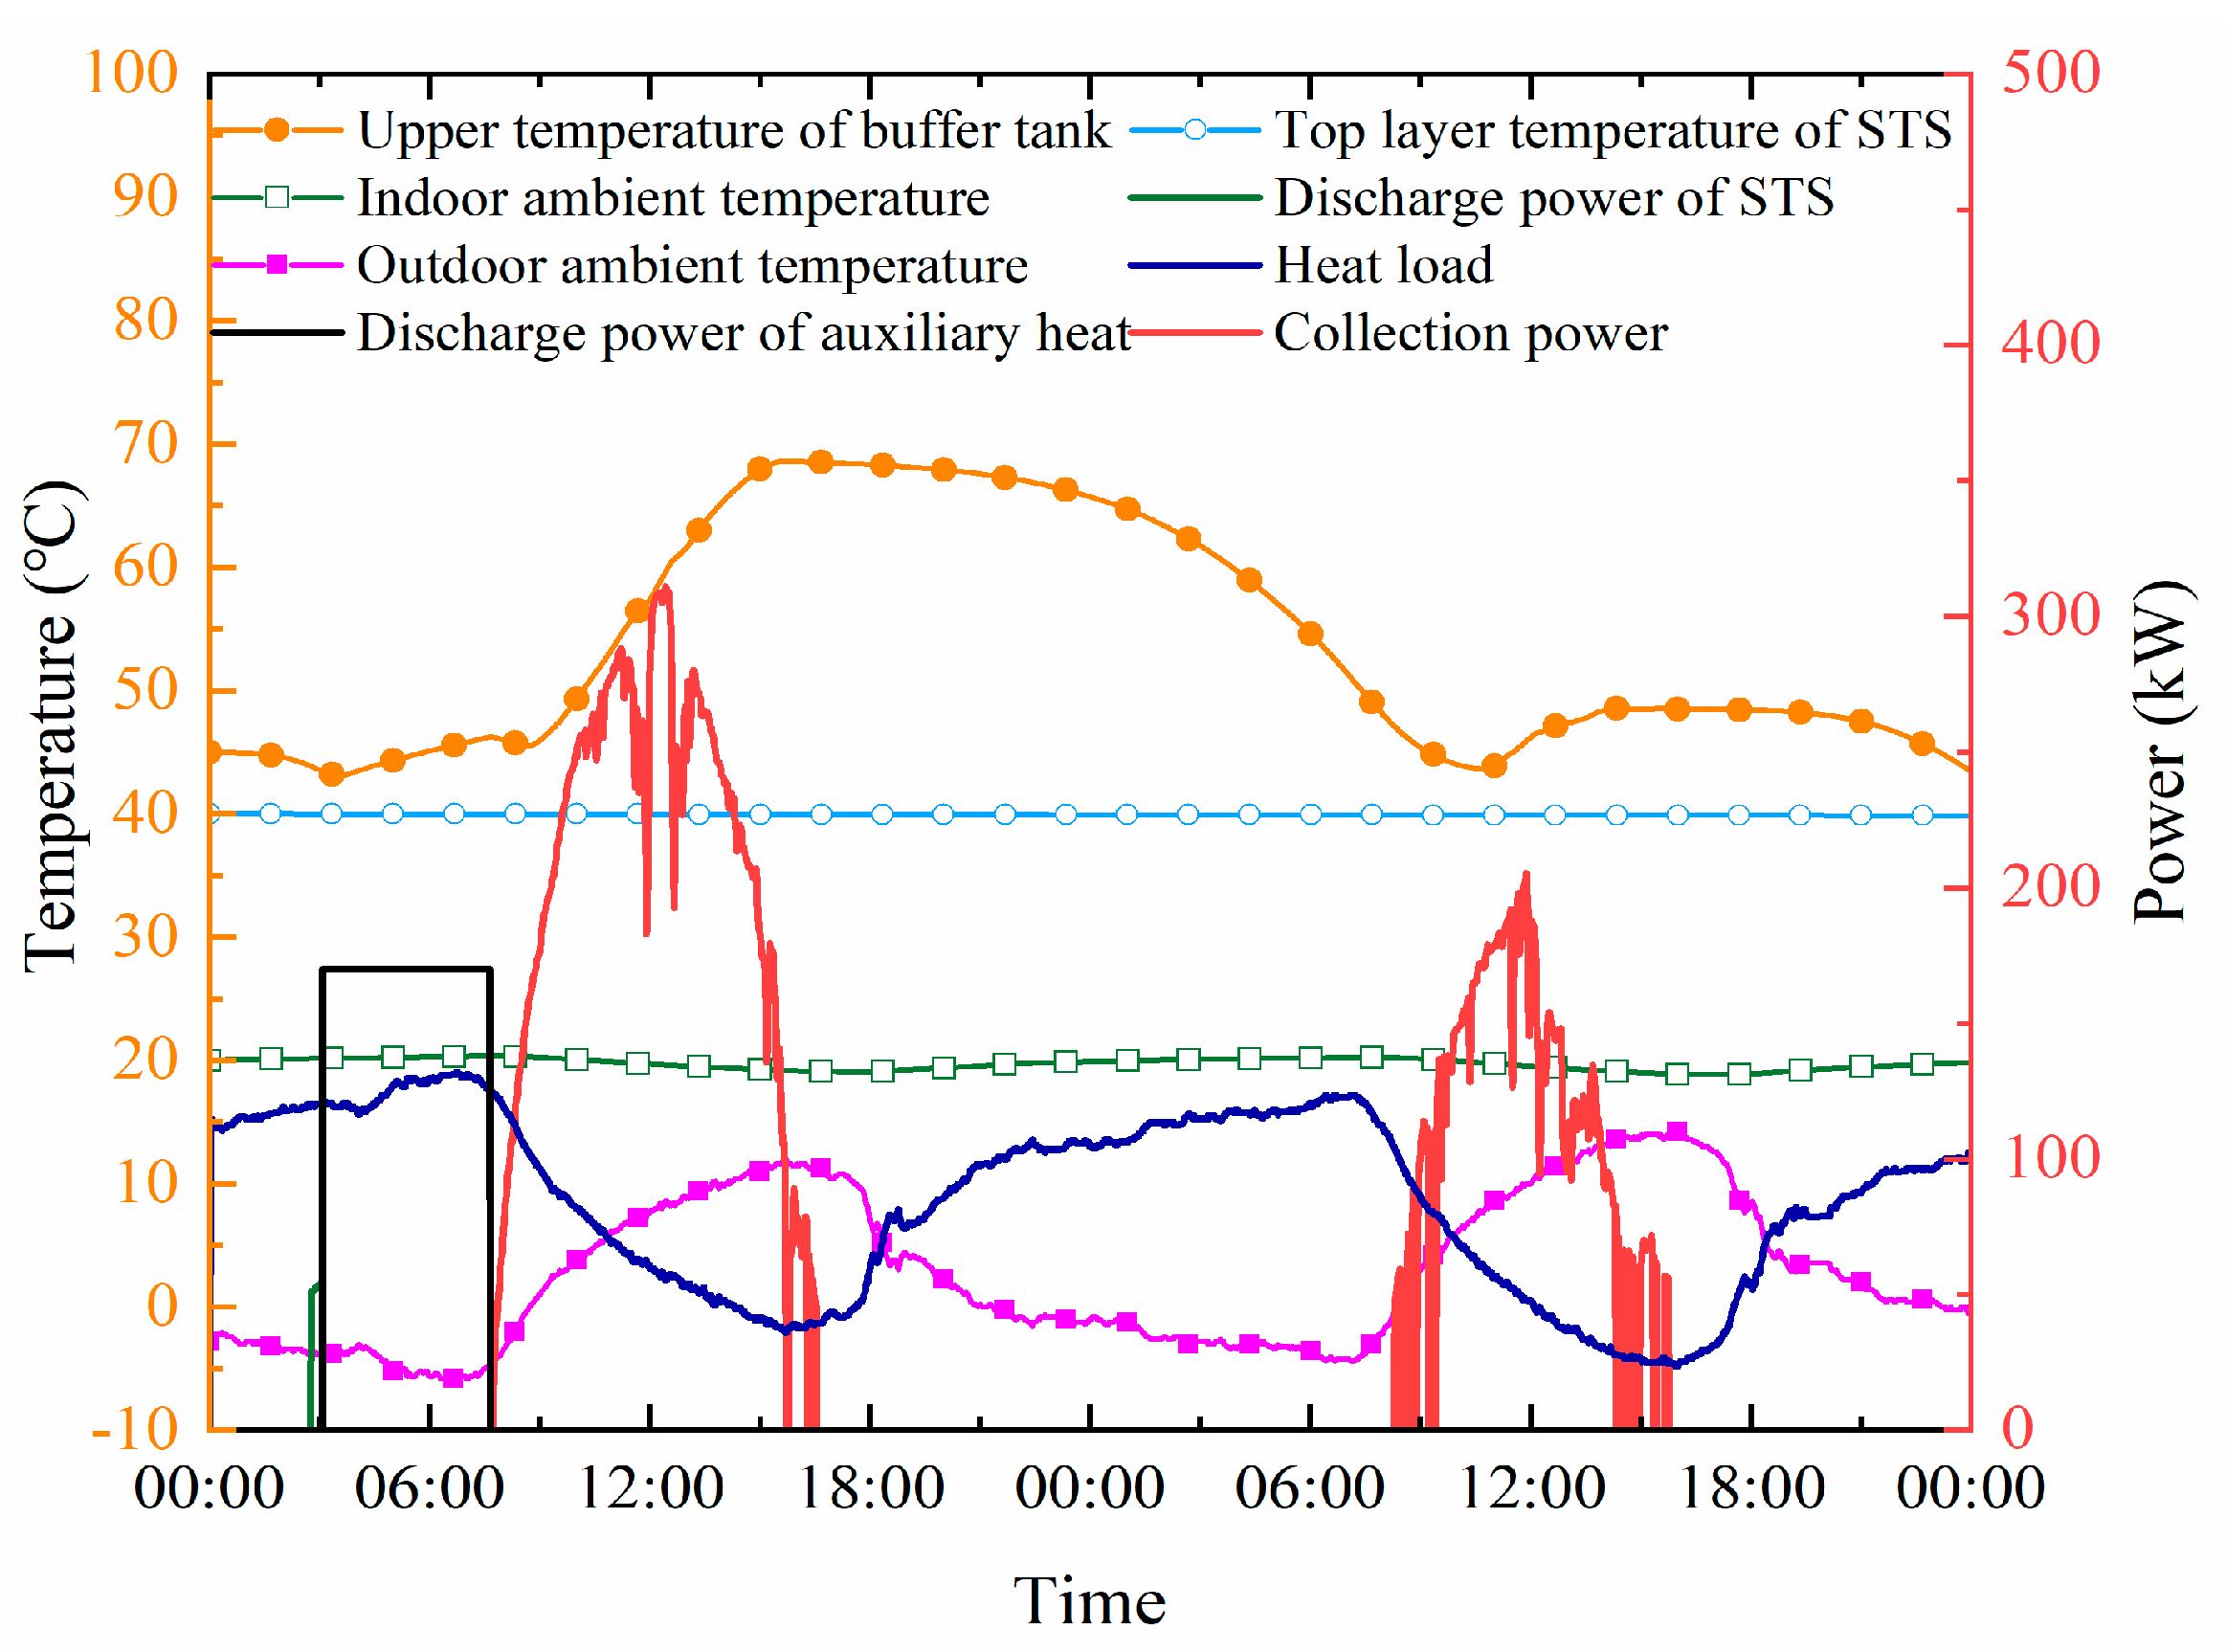
4.2.2. Dynamic characteristics analysis of typical working conditions in the heating season
- 1.
- In the initial stage of the heating season
- 2.
- In the middle stage of the heating season
- 3.
- In the end of heating season
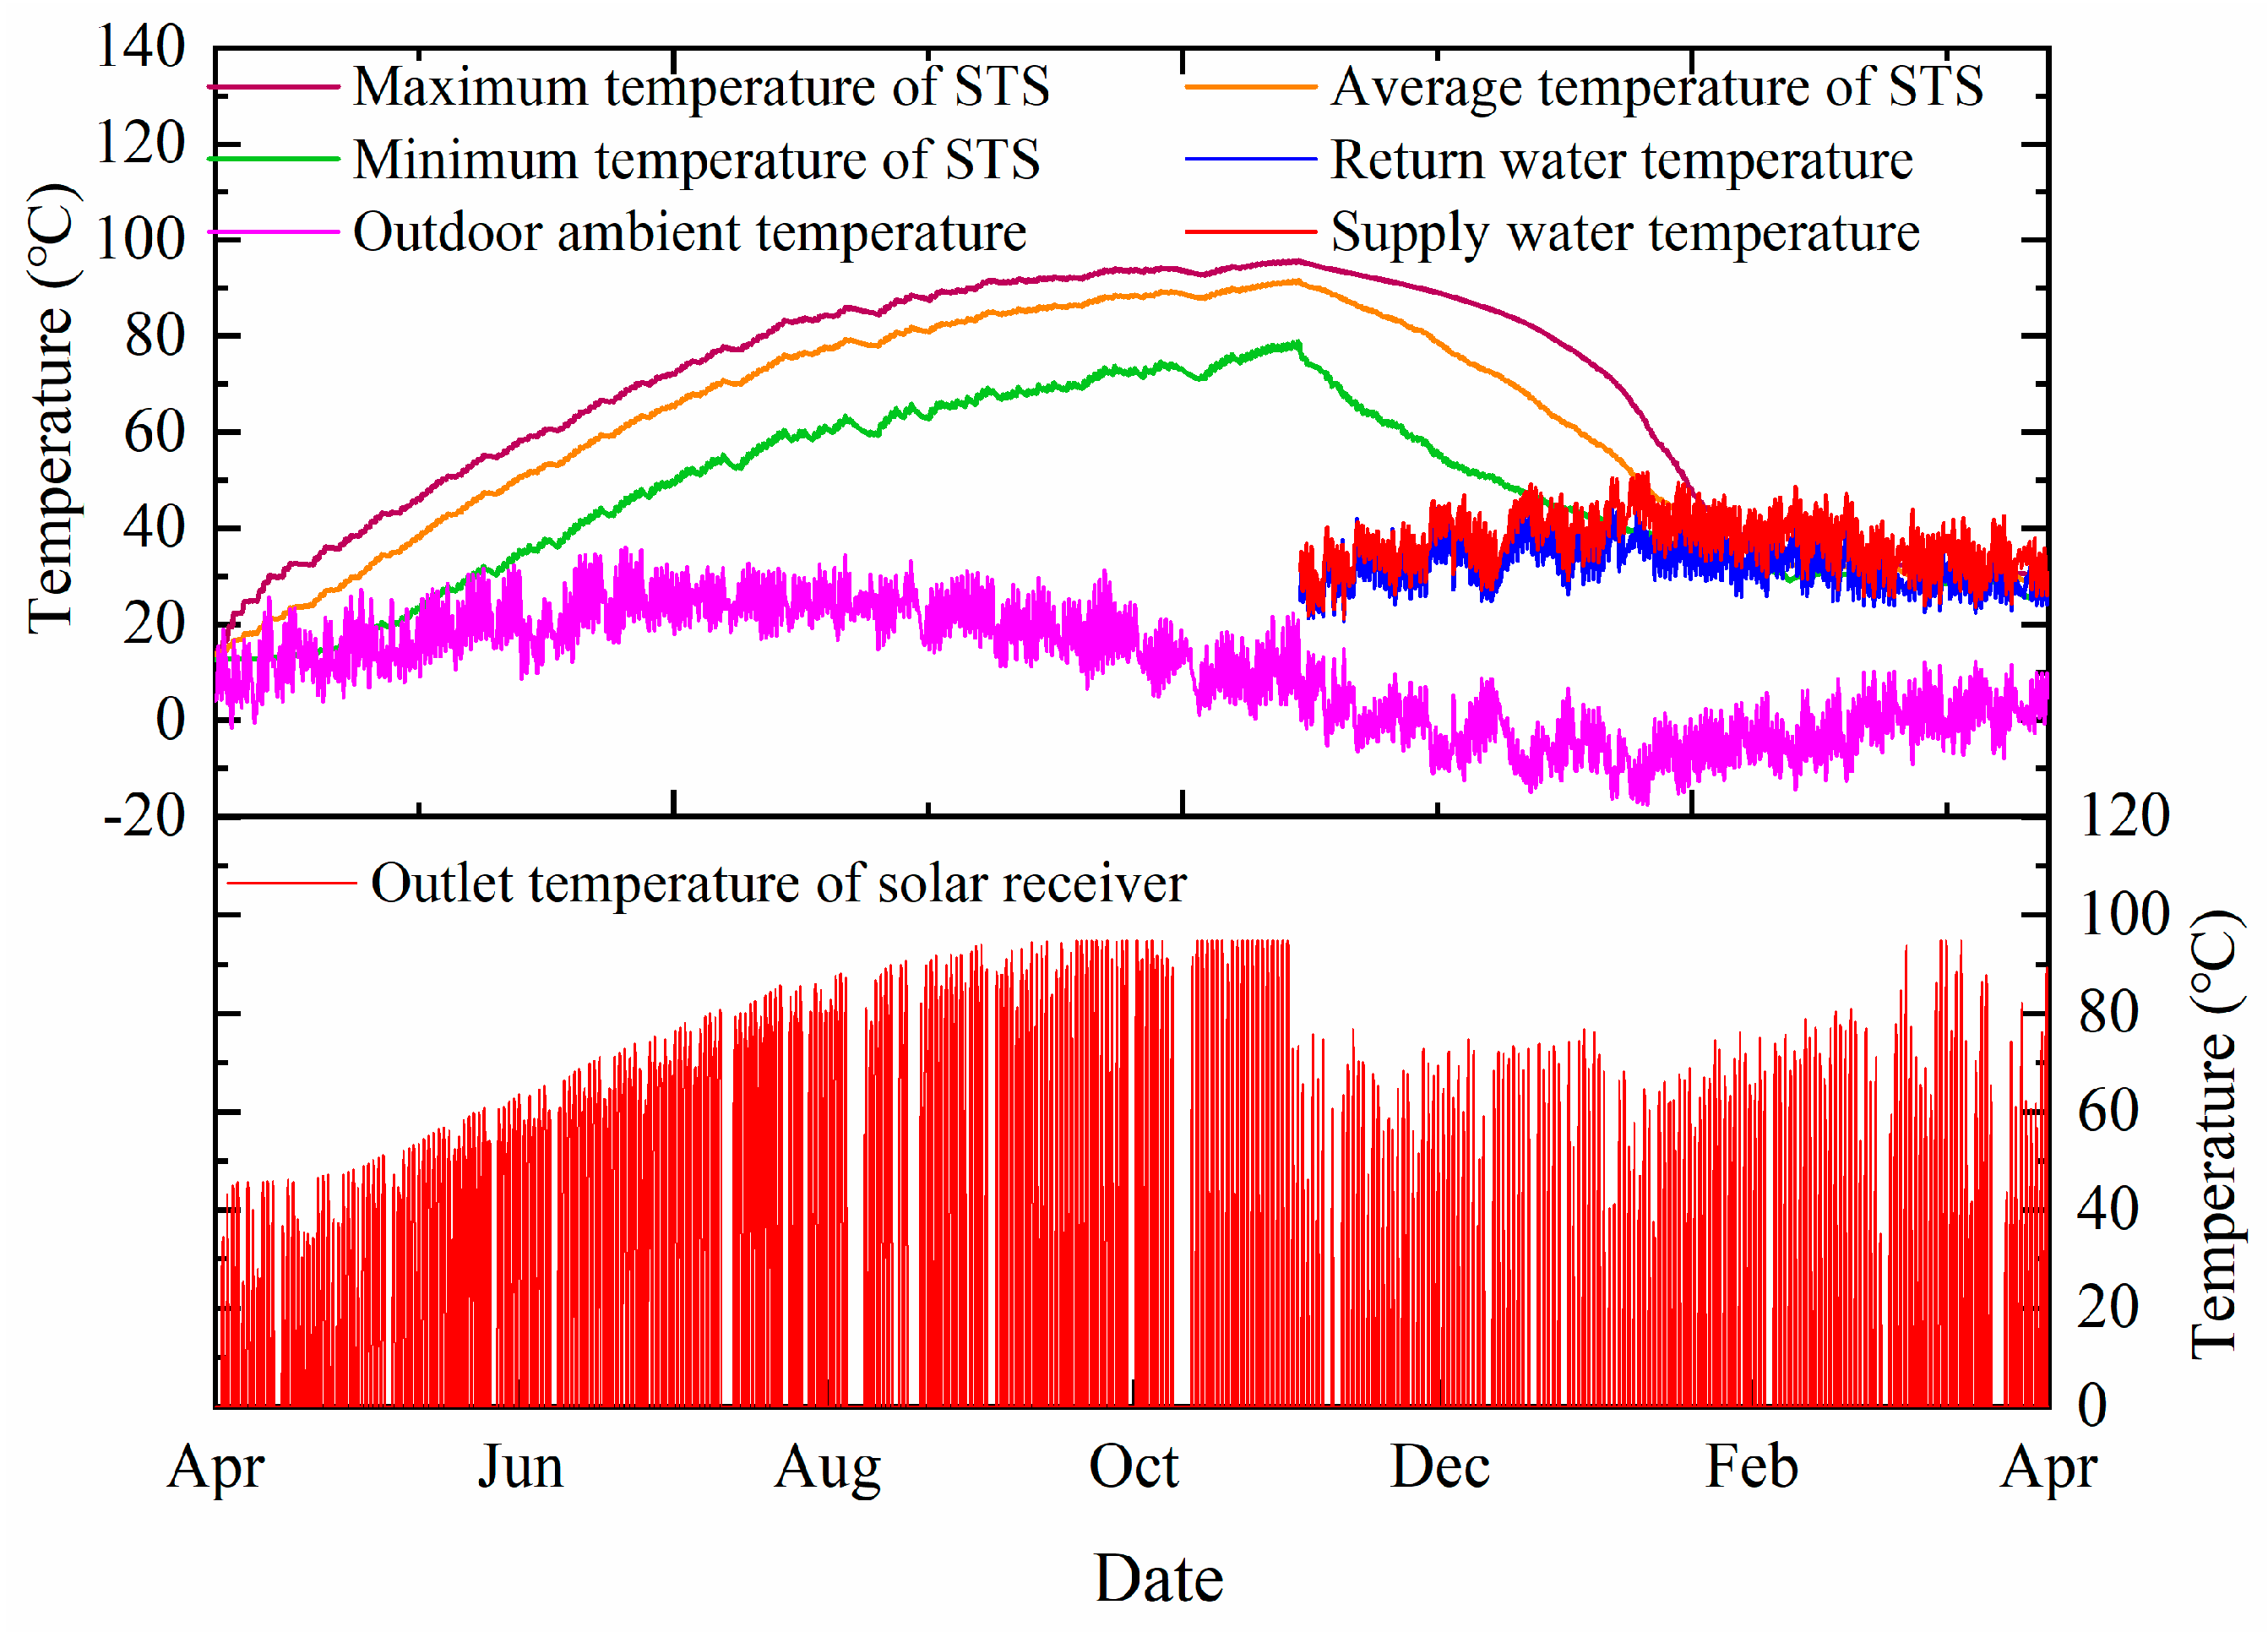
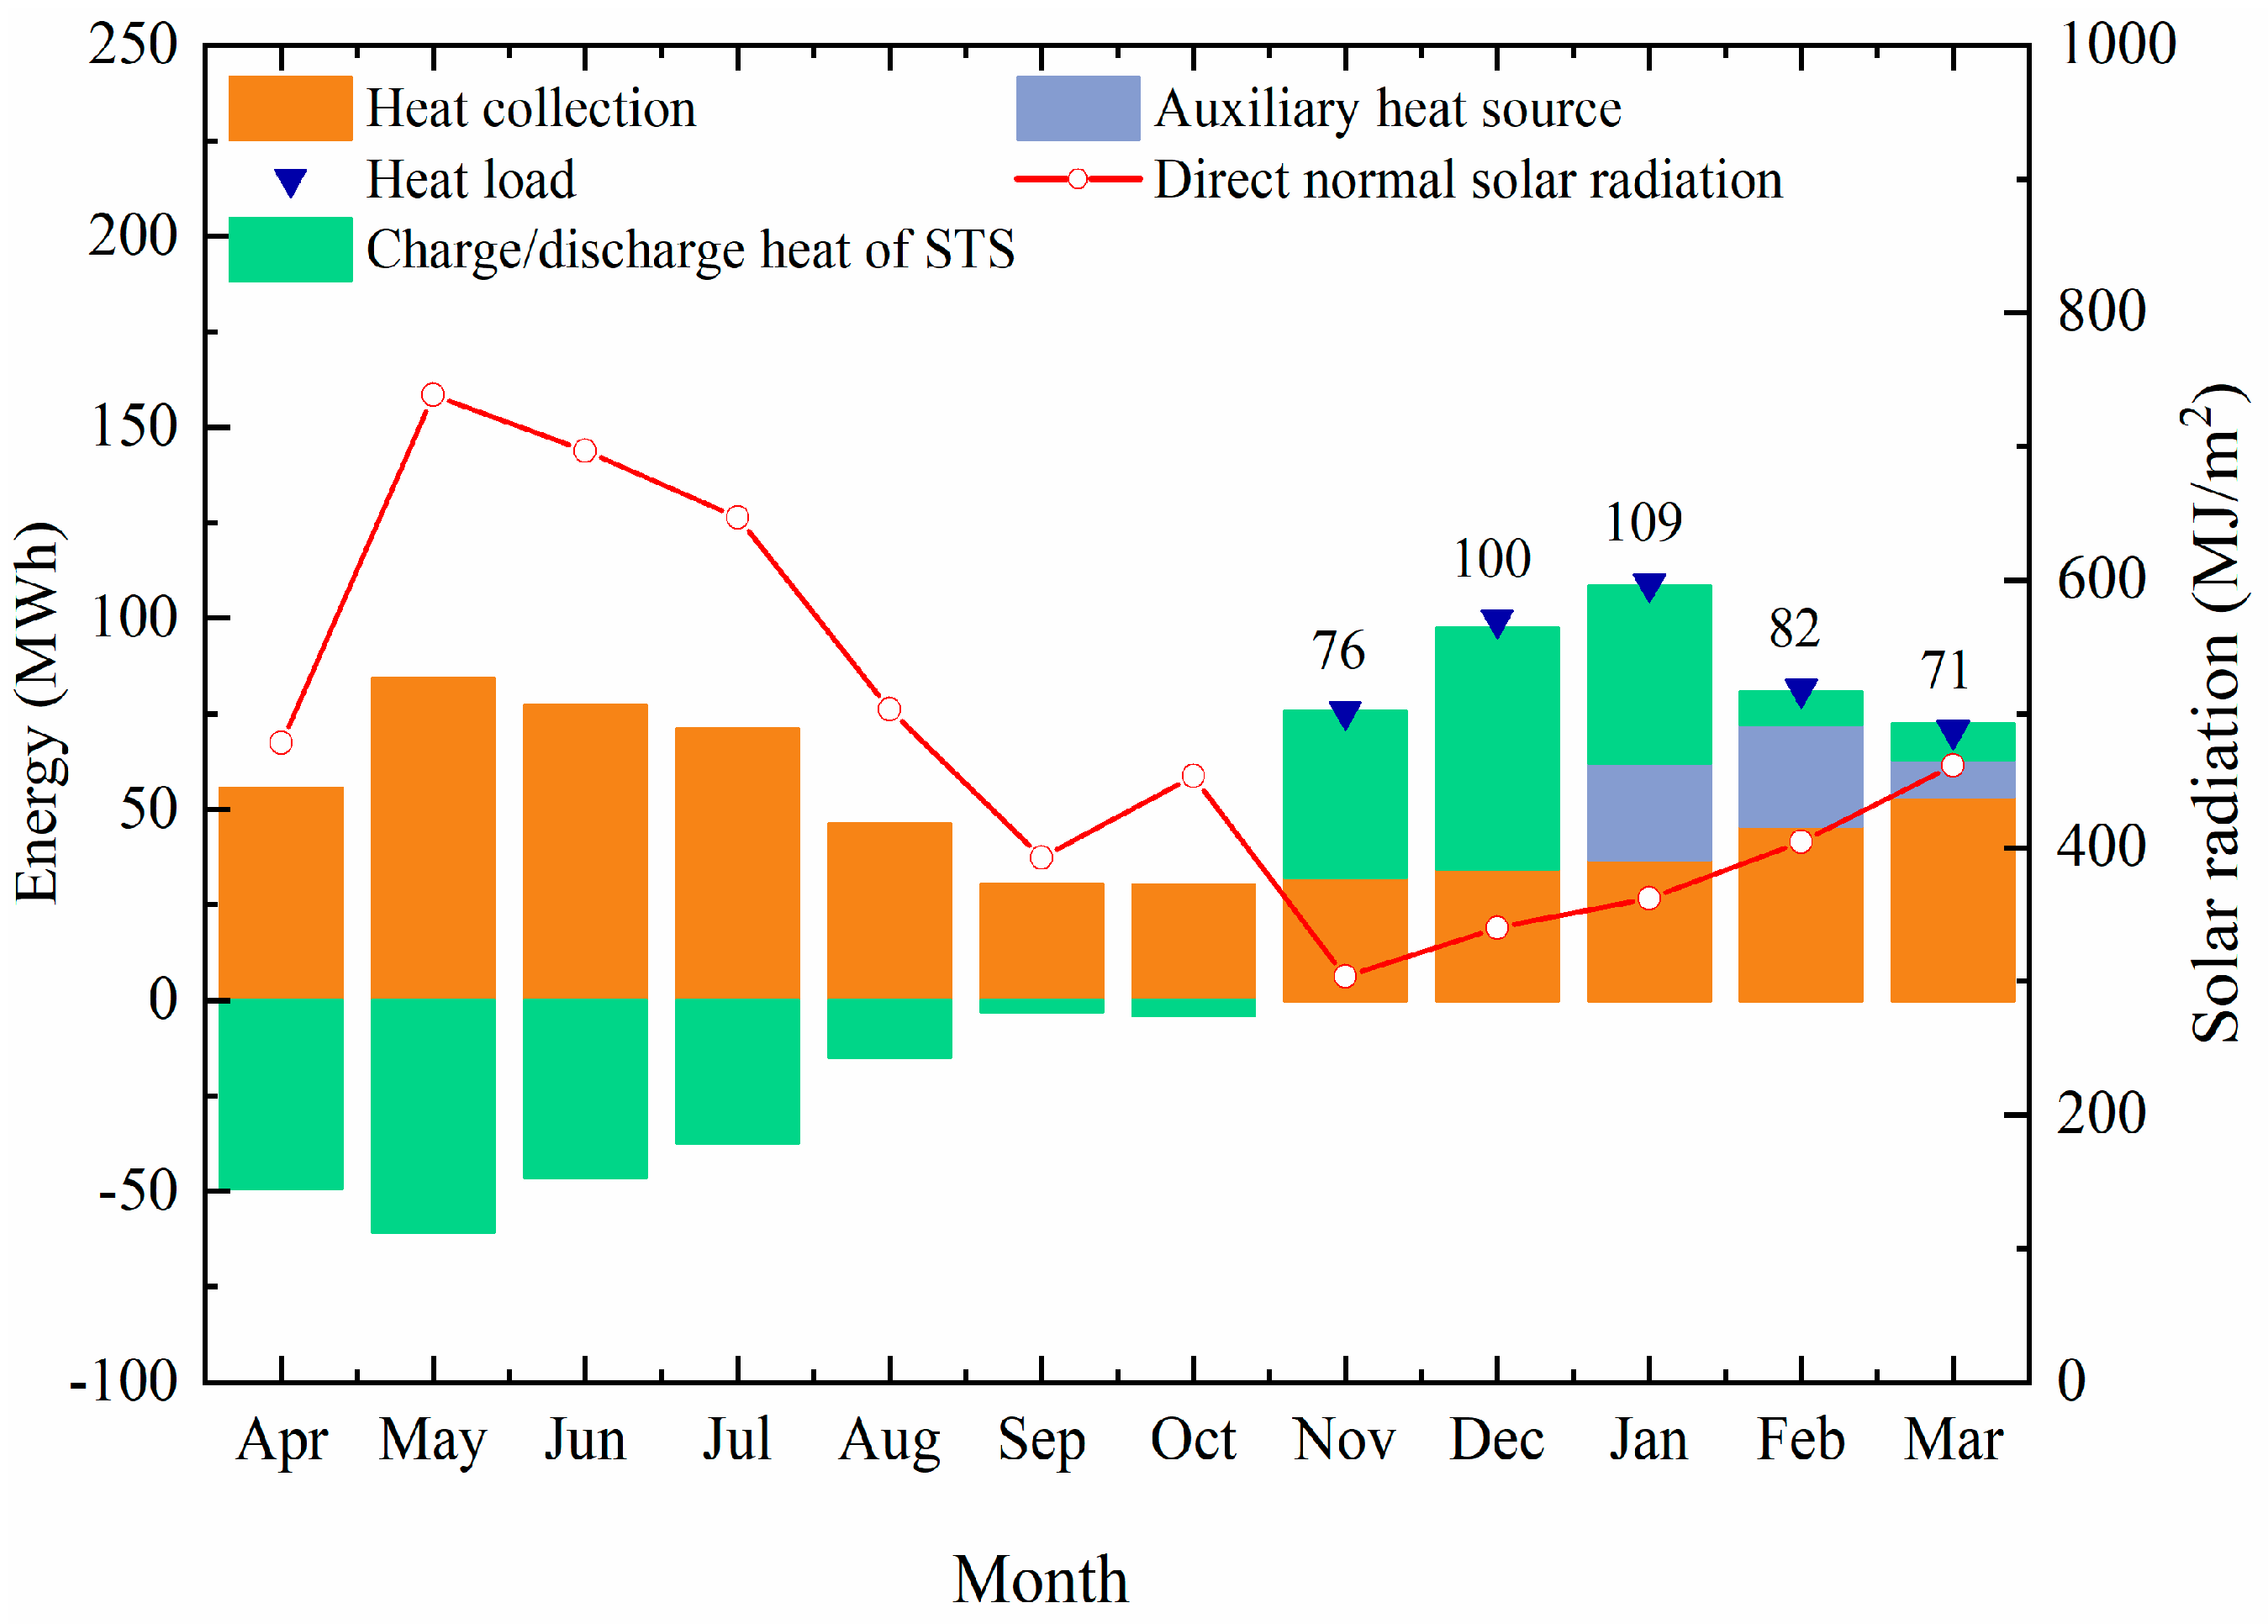
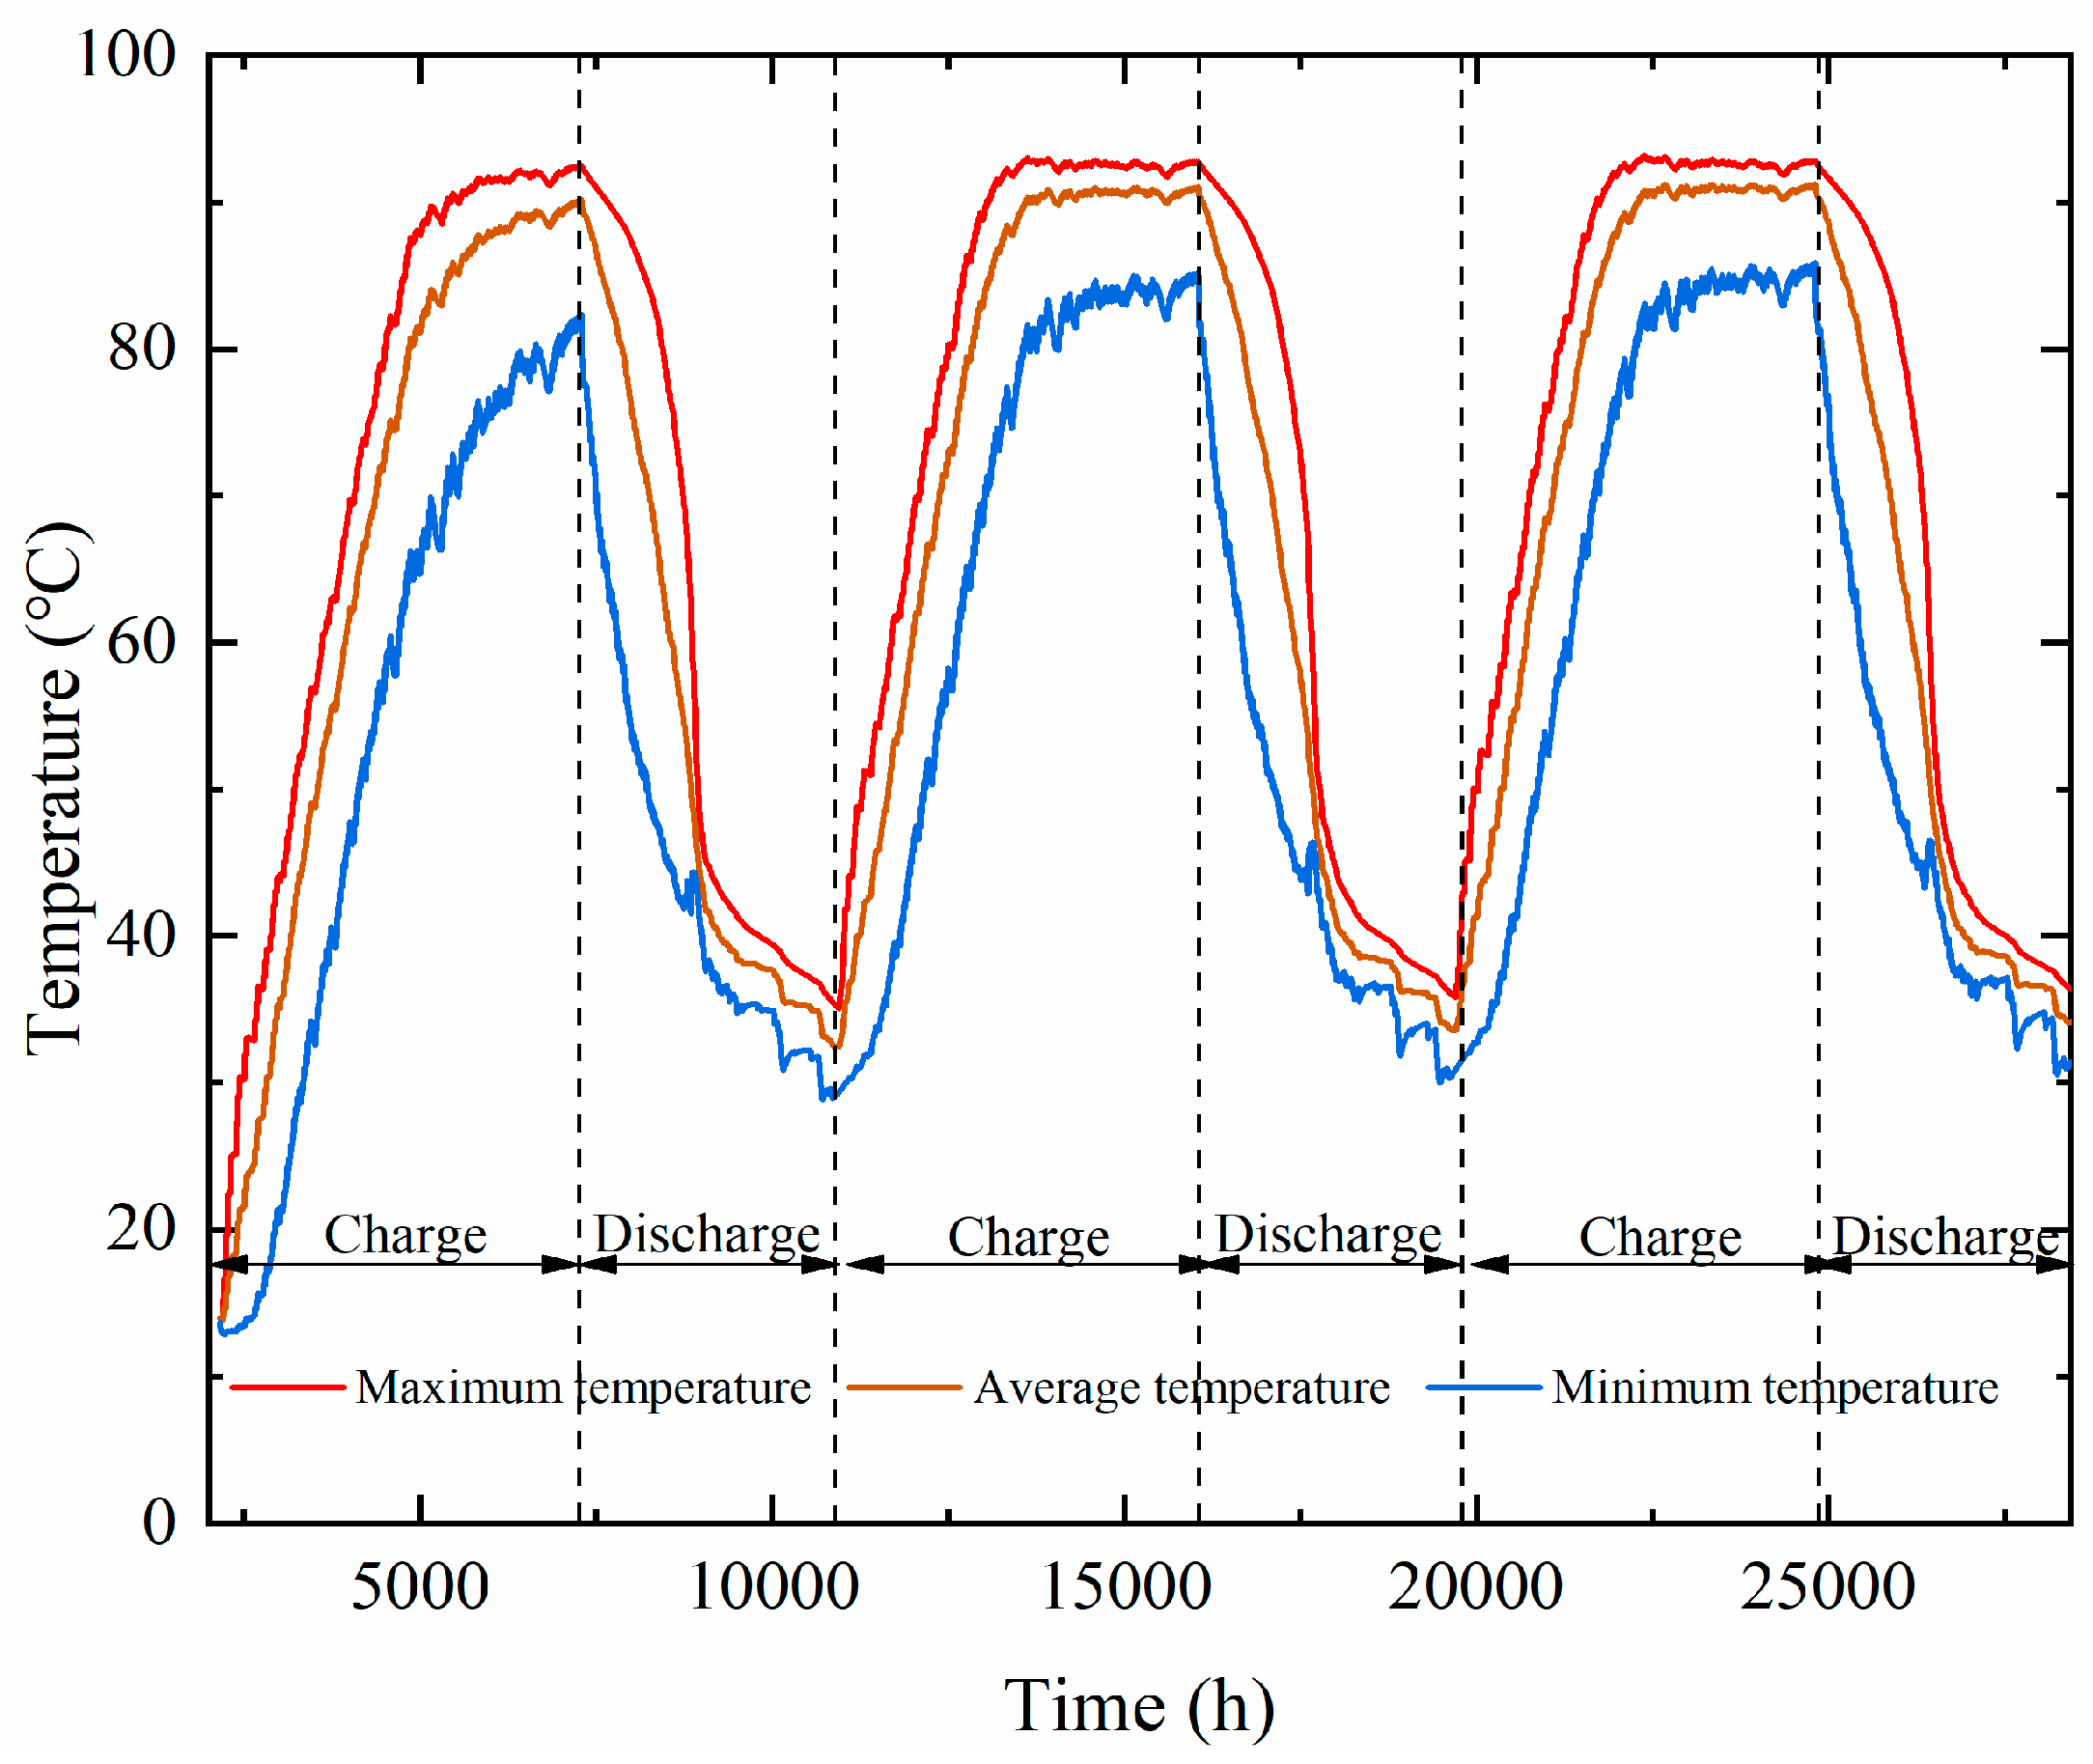
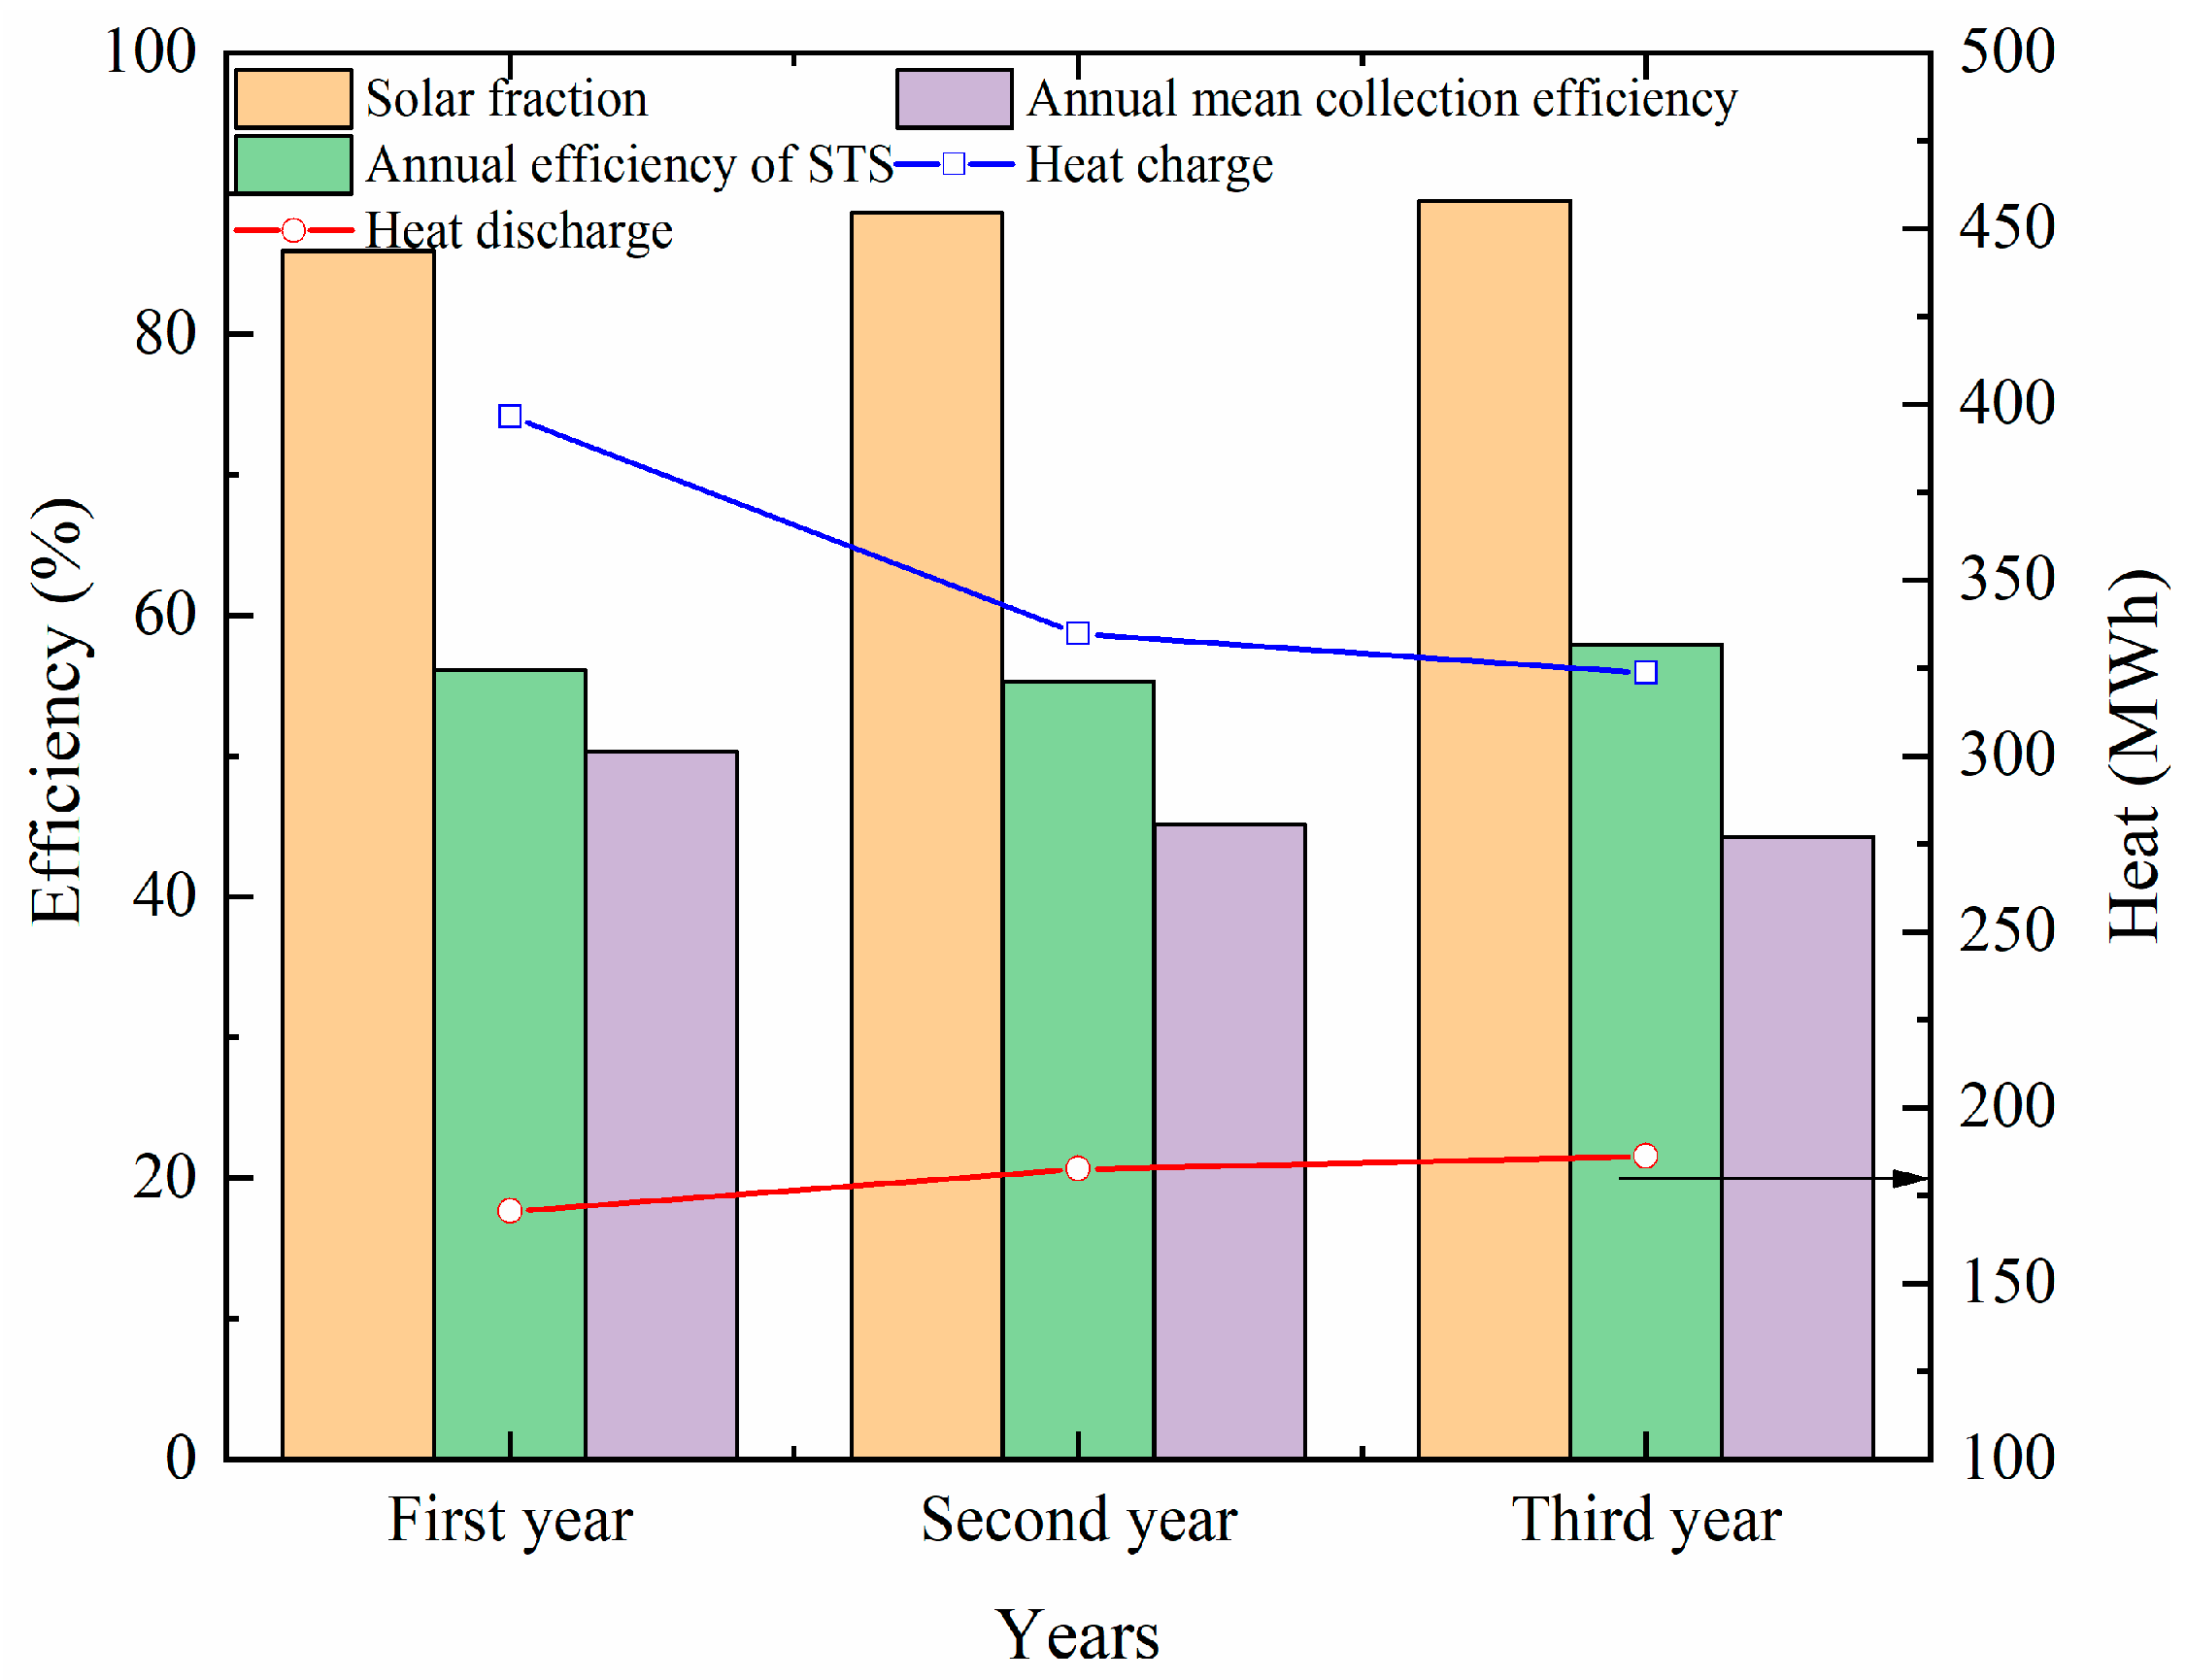
4.3. Long-term performance of the system
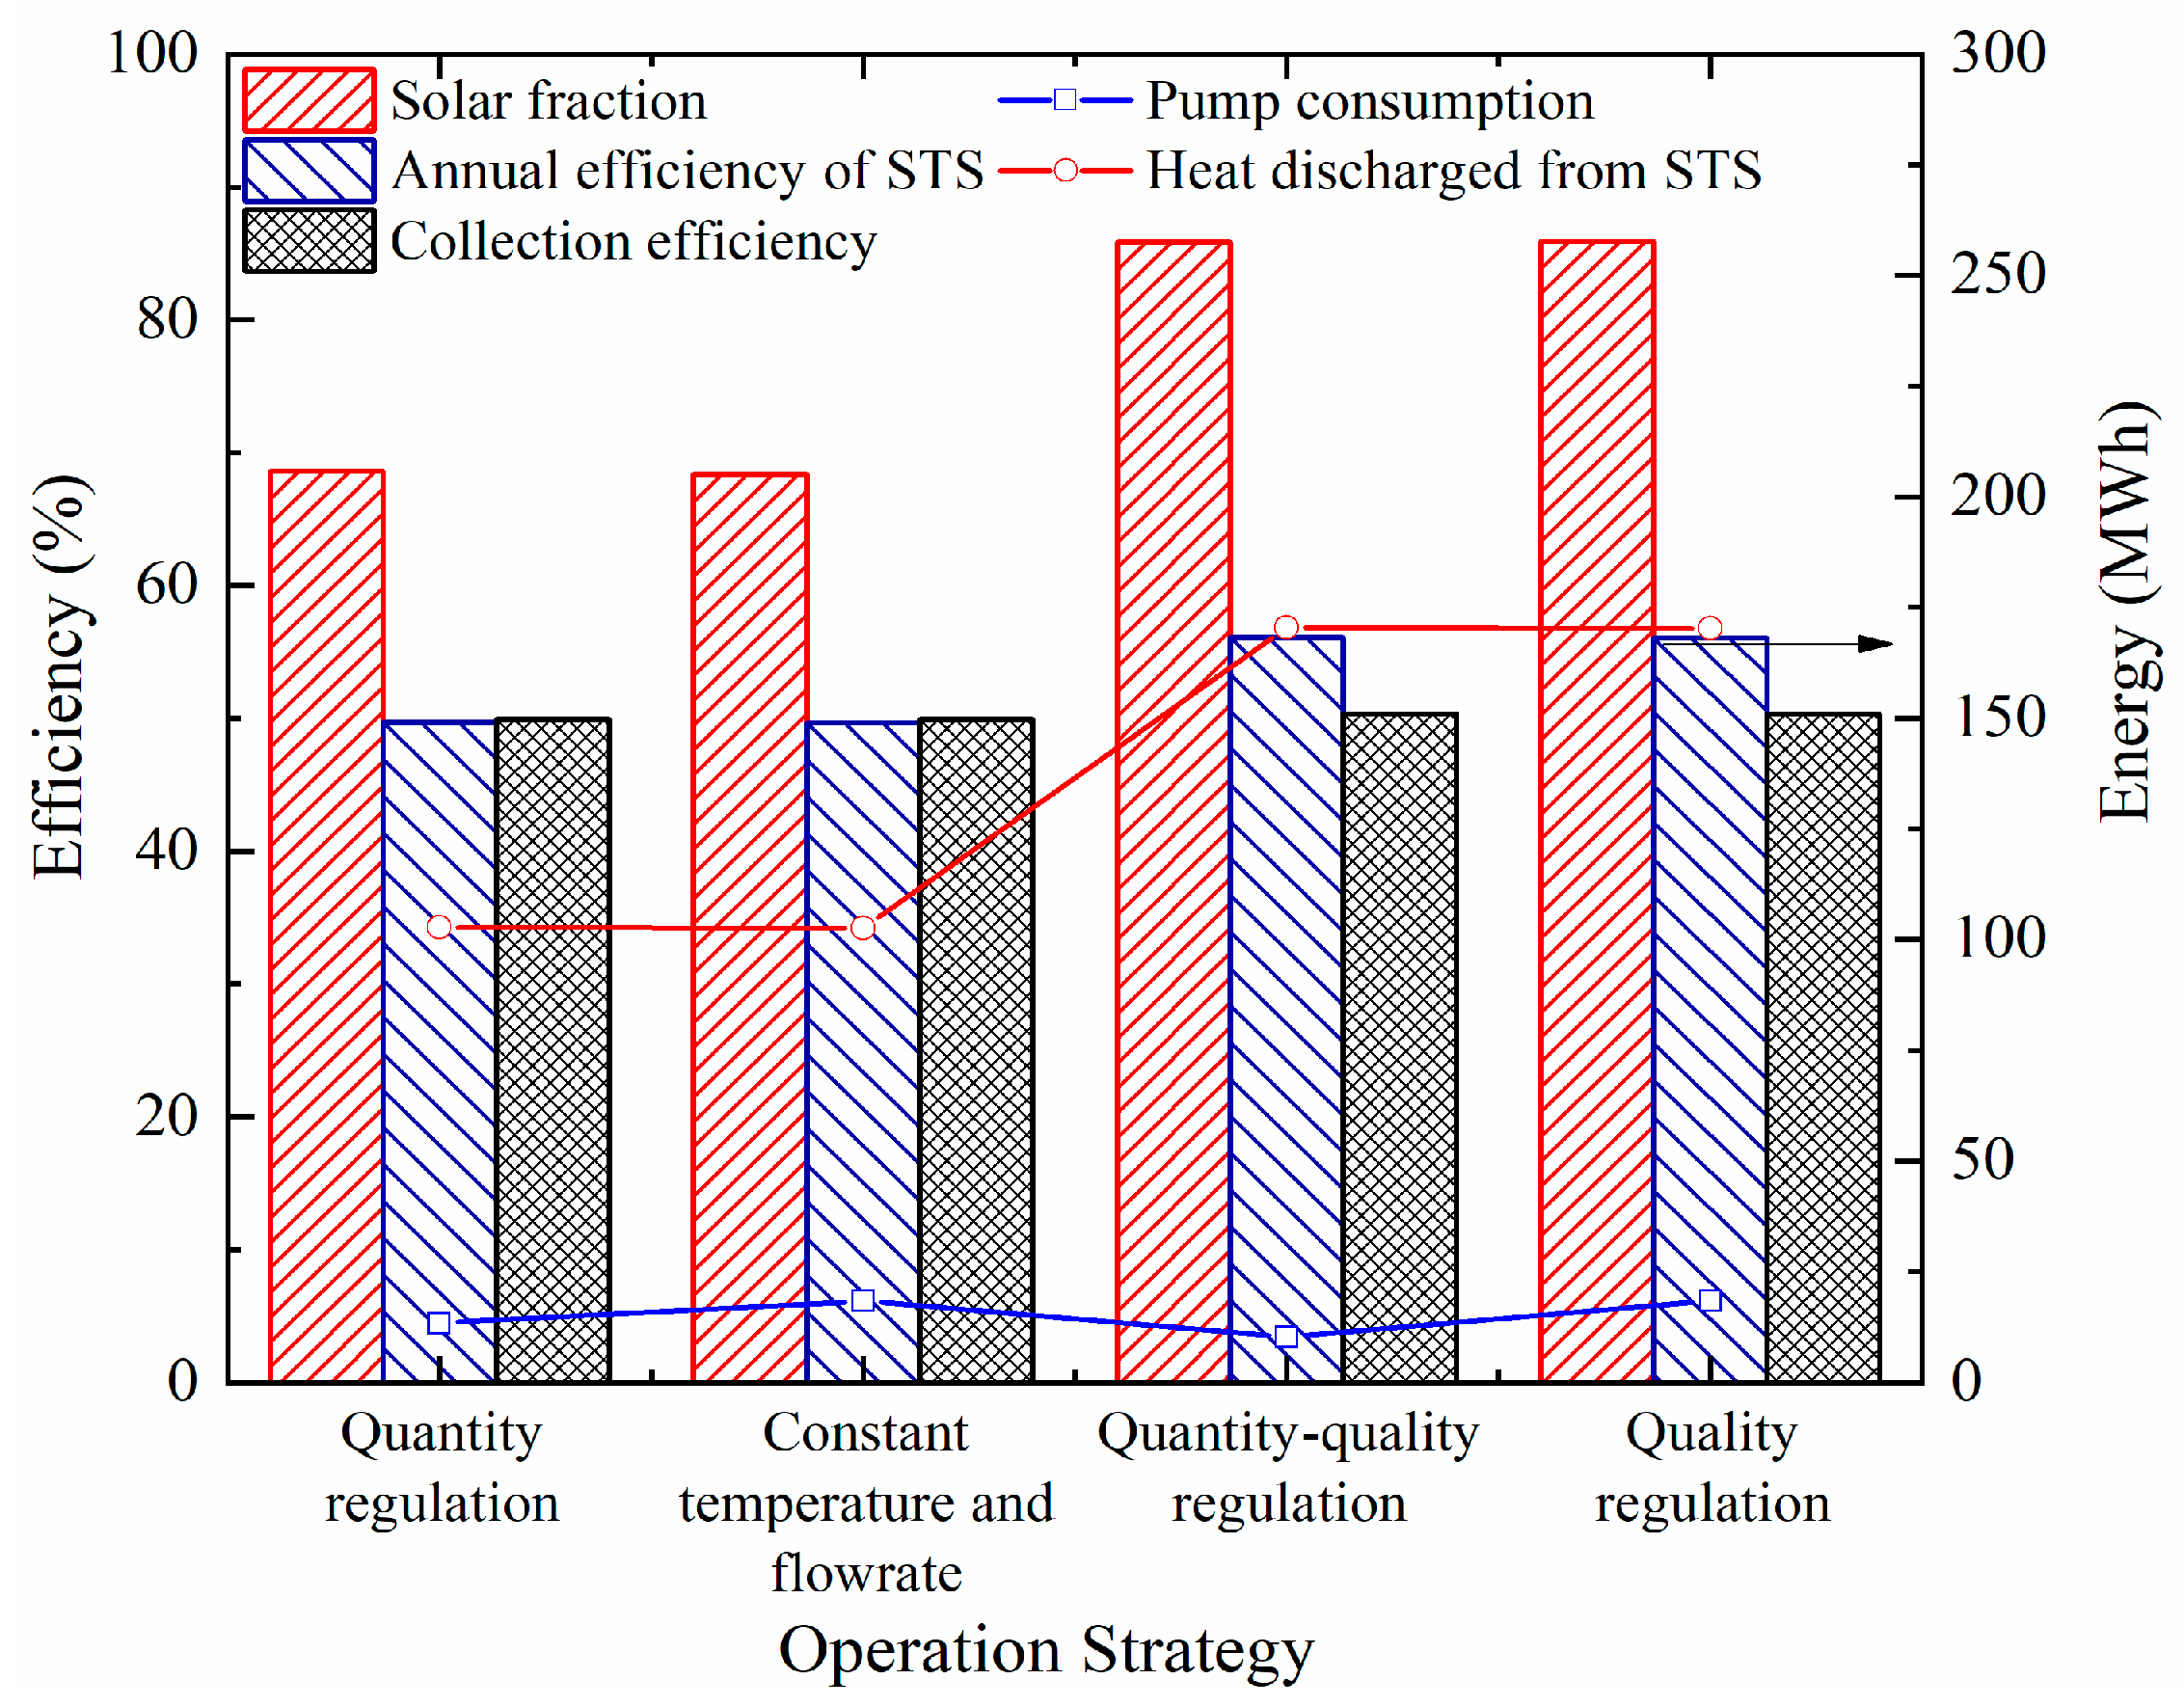
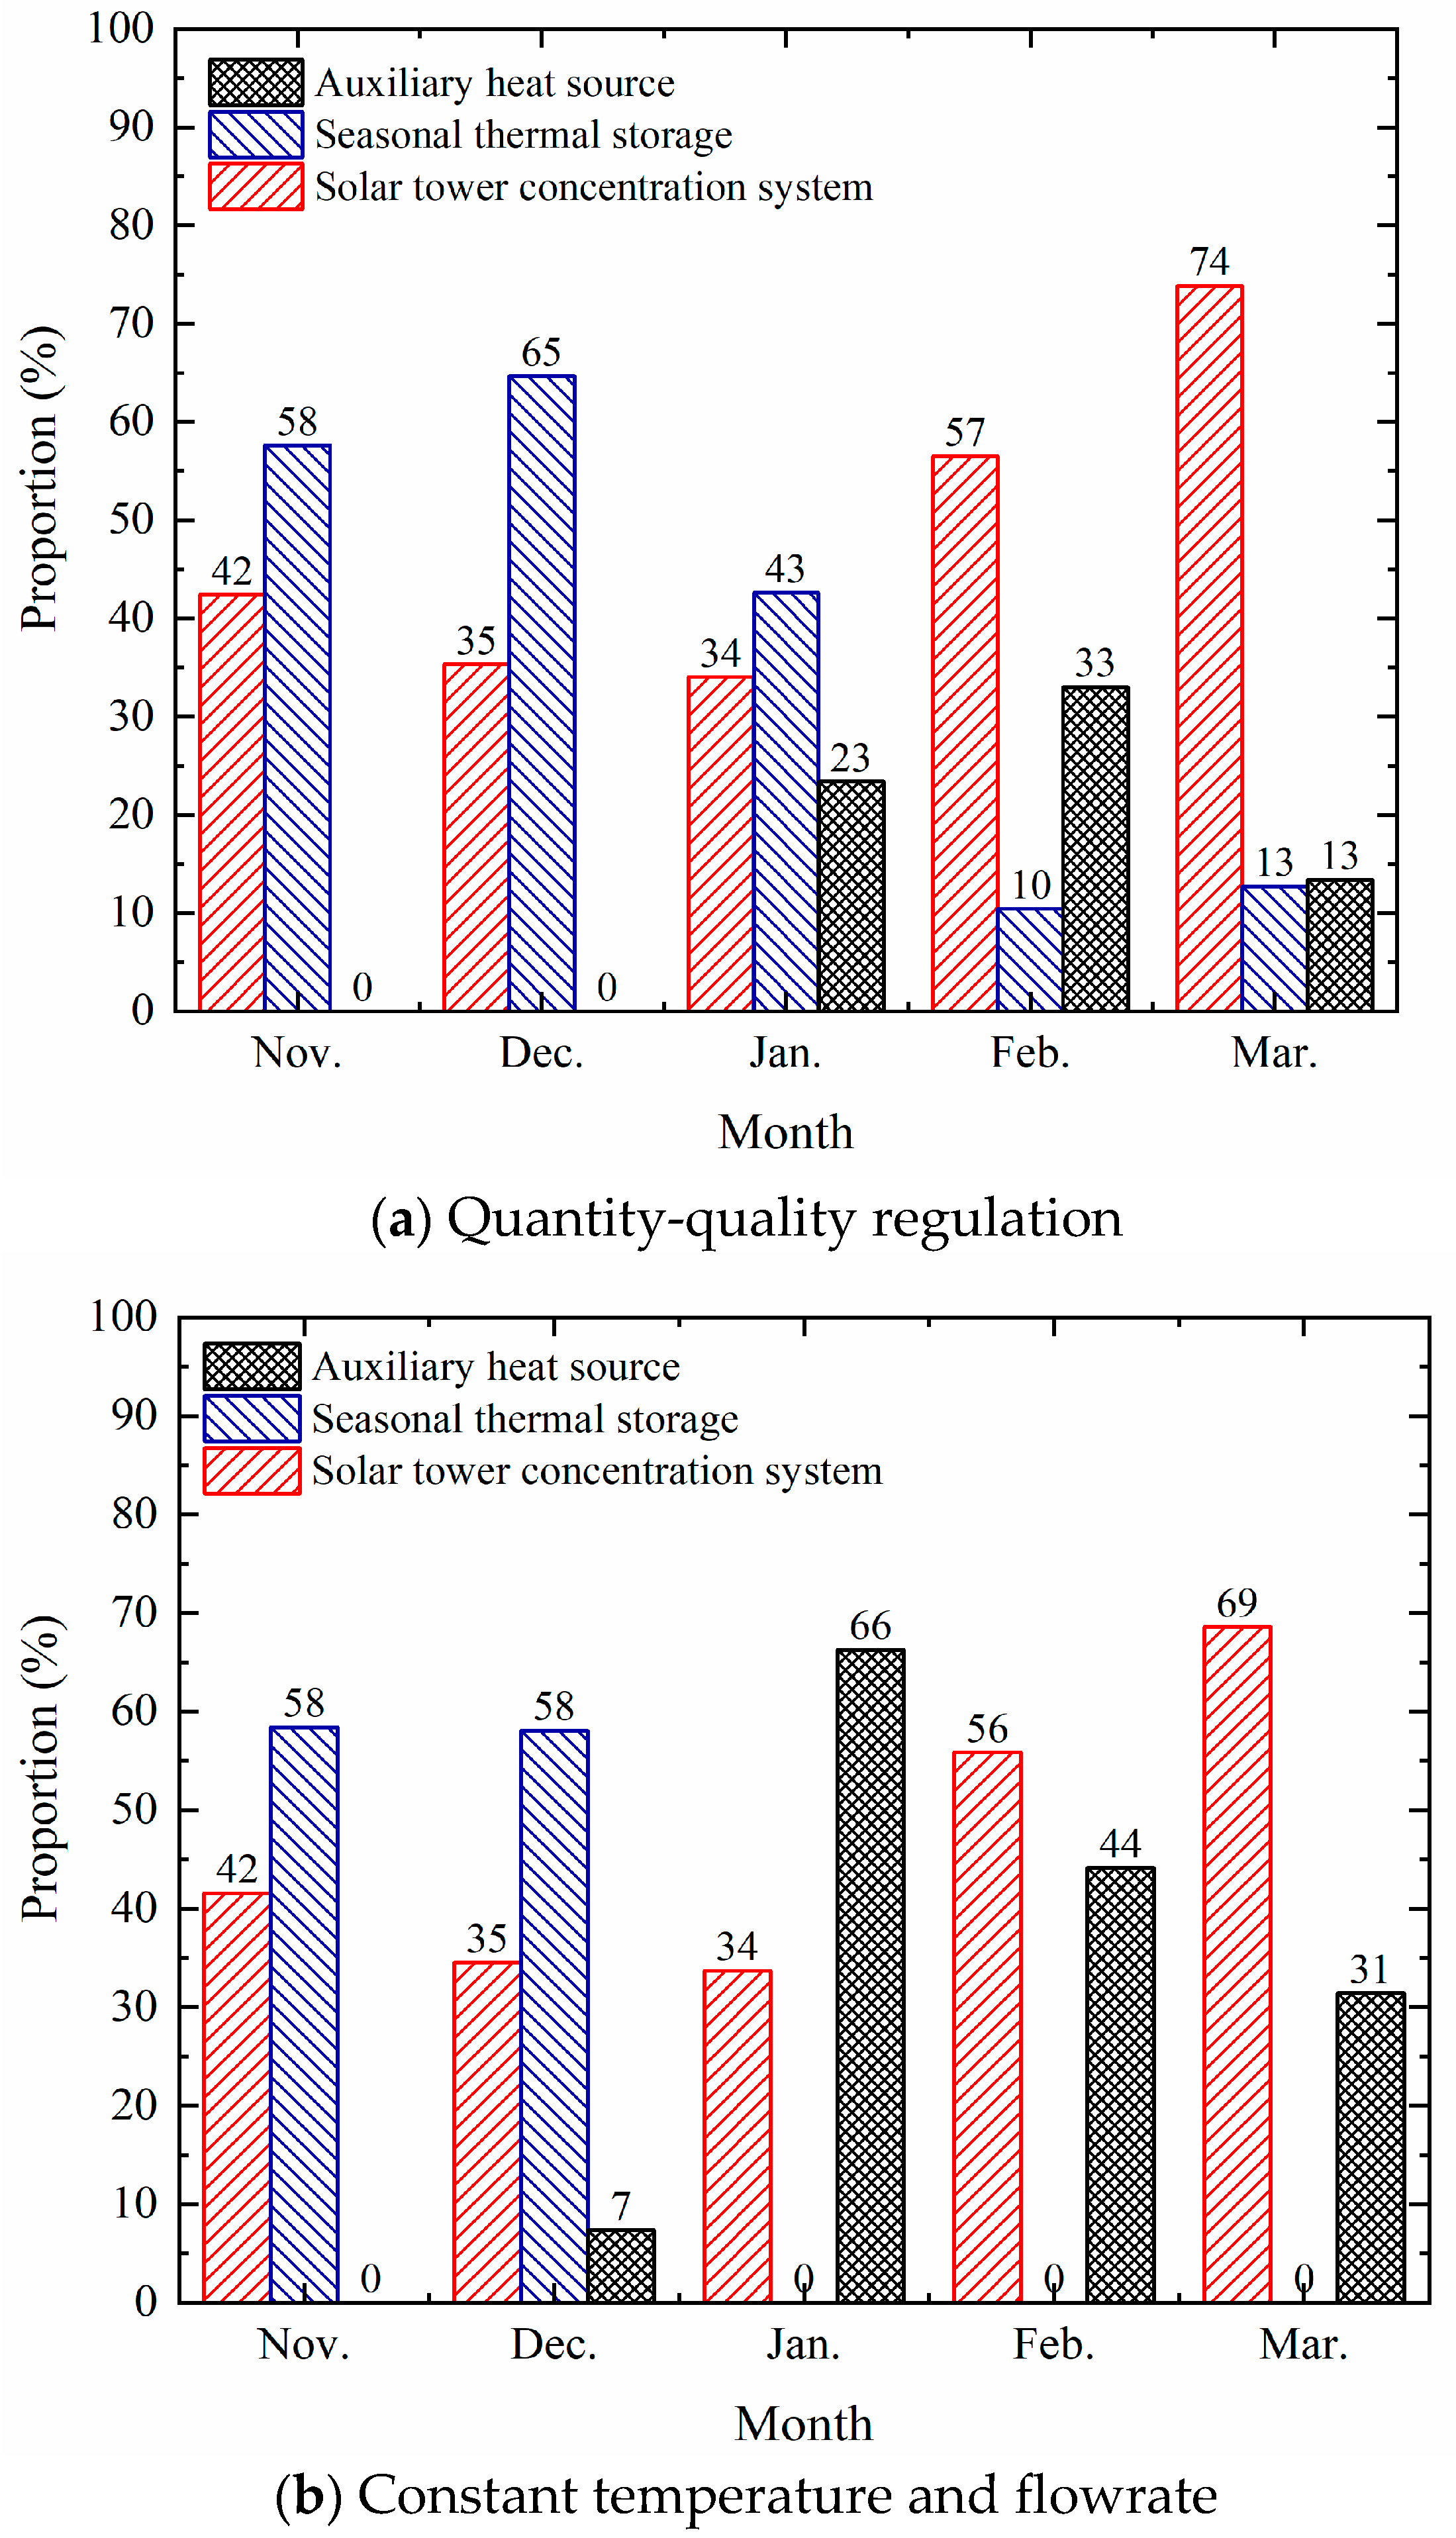
4.4. Effect of operation strategies
5. Conclusions
Acknowledgments
Nomenclature
| Latin characters | |
| A | Area, m2 |
| C | Heat capacity, kJ/(h·k) |
| CAP | Effective lumped heat capacity of building, kJ/K |
| Specific heat capacity, J/kgK | |
| Control function | |
| F | Flowrate, m3/h |
| H | Heigh, m |
| Normal direct irradiance, W/m2 | |
| m | Mass flowrate, kg/h |
| M | Mass, kg |
| N | Number |
| P | Power, kJ/h |
| Q | Heat, J |
| T | Temperature, °C |
| Heat loss coefficient, W/(m2 °C) | |
| UA | Heat loss coefficient of the building, kJ/(h·K) |
| V | Volume, m3 |
| Abbreviations | |
| STS | Seasonal thermal storage |
| SGHP | Solar and ground source heat pump system |
| DNI | Direct normal irradiance |
| SGSP | Salt gradient solar pond |
| UGSTS | Underground seasonal thermal storage |
| SF | Solar fraction |
| RMSD | Root-mean-square deviation |
| ARE | Average relative error |
| MRE | Maximum relative error |
| Subscripts | |
| a | Ambient |
| abs | Effective heat absorption |
| aux | Auxiliary heat source |
| b | Buffer tank |
| col | Heat collected by solar receiver |
| charge | Charge into the STS |
| discharge | Heat discharged from STS |
| exp | Experiment |
| h | Heat source/heliostat field |
| i | Natural numbers from 1 to n |
| in | Inflow |
| inc | Incident energy on the solar receiver |
| gain | Increment |
| l, load | Load side |
| max | Maximum |
| min | Minimum |
| out | Outflow |
| p | Pump |
| r | Room |
| rec | Receiver |
| Solar | Solar tower concentration system |
| S, s | Seasonal storage |
| sim | Simulation |
| w | Water |
| Greek character | |
| Heat exchange efficiency | |
| Density, kg/m³ | |
| Time, s | |
| Thermal conductivity, W/m/°C | |
References
- Center, B.E.C.R. Annual Development Research Report on Building Energy Efficiency in China 2022. 2022, 1–23.
- Rghif, Y.; Zeghmati, B.; Bahraoui, F. Numerical Analysis of the Influence of Buoyancy Ratio and Dufour Parameter on Thermosolutal Convection in a Square Salt Gradient Solar Pond. Fluid Dyn. Mater. Process. 2022, 18, 1319–1329. [Google Scholar] [CrossRef]
- Rghif, Y.; Zeghmati, B.; Bahraoui, F. Modeling the Influences of a Phase Change Material and the Dufour Effect on Thermal Performance of a Salt Gradient Solar Pond. Int. J. Therm. Sci. 2021, 166, 106979. [Google Scholar] [CrossRef]
- Rghif, Y.; Bahraoui, F.; Zeghmati, B. Experimental and Numerical Investigations of Heat and Mass Transfer in a Salt Gradient Solar Pond under a Solar Simulator. Sol. Energy 2022, 236, 841–859. [Google Scholar] [CrossRef]
- Rghif, Y.; Colarossi, D.; Principi, P. Effects of Double-Diffusive Convection on Calculation Time and Accuracy Results of a Salt Gradient Solar Pond: Numerical Investigation and Experimental Validation. Sustainability 2023, 15, 1479. [Google Scholar] [CrossRef]
- Tosatto, A.; Dahash, A.; Ochs, F. Simulation-Based Performance Evaluation of Large-Scale Thermal Energy Storage Coupled with Heat Pump in District Heating Systems. J. Energy Storage 2023, 61, 106721. [Google Scholar] [CrossRef]
- Narula, K.; Oliveira, F. De; Villasmil, W.; Patel, M.K. Simulation Method for Assessing Hourly Energy Fl Ows in District Heating System with Seasonal Thermal Energy Storage. Renew. Energy 2020, 151, 1250–1268. [Google Scholar] [CrossRef]
- Ushamah, H.M.; Ahmed, N.; Elfeky, K.E.; Mahmood, M.; Qaisrani, M.A.; Waqas, A.; Zhang, Q. Techno-Economic Analysis of a Hybrid District Heating with Borehole Thermal Storage for Various Solar Collectors and Climate Zones in Pakistan. Renew. Energy 2022, 199, 1639–1656. [Google Scholar] [CrossRef]
- Kim, M.H.; Kim, D.; Heo, J.; Lee, D.W. Techno-Economic Analysis of Hybrid Renewable Energy System with Solar District Heating for Net Zero Energy Community. Energy 2019, 187, 115916. [Google Scholar] [CrossRef]
- Chu, S.; Sethuvenkatraman, S.; Goldsworthy, M.; Yuan, G. Techno-Economic Assessment of Solar Assisted Precinct Level Heating Systems with Seasonal Heat Storage for Australian Cities. Renew. Energy 2022, 201, 841–853. [Google Scholar] [CrossRef]
- Renaldi, R.; Friedrich, D. Techno-Economic Analysis of a Solar District Heating System with Seasonal Thermal Storage in the UK. Appl. Energy 2019, 236, 388–400. [Google Scholar] [CrossRef]
- Zhang, C.; Nielsen, E.; Fan, J.; Furbo, S. Thermal Behavior of a Combi-Storage in a Solar-Ground Source Heat Pump System for a Single-Family House. Energy Build. 2022, 259. [Google Scholar] [CrossRef]
- Maragna, C.; Rey, C.; Perreaux, M. A Novel and Versatile Solar Borehole Thermal Energy Storage Assisted by a Heat Pump. Part 1: System Description. Renew. Energy 2023, 208, 709–725. [Google Scholar] [CrossRef]
- Li, X.; Wang, Z.; Li, J.; Yang, M.; Yuan, G.; Bai, Y. Comparison of Control Strategies for a Solar Heating System with Underground Pit Seasonal Storage in the Non-Heating Season. J. Energy Storage 2019, 26, 100963. [Google Scholar] [CrossRef]
- Villasmil, W.; Troxler, M.; Hendry, R.; Schuetz, P.; Worlitschek, J. Control Strategies of Solar Heating Systems Coupled with Seasonal Thermal Energy Storage in Self-Sufficient Buildings. J. Energy Storage 2021, 42. [Google Scholar] [CrossRef]
- Wang, Y.; Rao, Z.; Liu, J.; Liao, S. An Optimized Control Strategy for Integrated Solar and Air-Source Heat Pump Water Heating System with Cascade Storage Tanks. Energy Build. 2020, 210, 109766. [Google Scholar] [CrossRef]
- Zhao, J.; Lyu, L.; Li, X. Numerical Analysis of the Operation Regulation in a Solar Heating System with Seasonal Water Pool Thermal Storage. Renew. Energy 2020, 150, 1118–1126. [Google Scholar] [CrossRef]
- Tian, Z.; Perers, B.; Furbo, S.; Fan, J. Annual Measured and Simulated Thermal Performance Analysis of a Hybrid Solar District Heating Plant with Flat Plate Collectors and Parabolic Trough Collectors in Series. Appl. Energy 2017, 205, 417–427. [Google Scholar] [CrossRef]
- Bai, Y.; Wang, Z.; Fan, J.; Yang, M.; Li, X.; Chen, L.; Yuan, G.; Yang, J. Numerical and Experimental Study of an Underground Water Pit for Seasonal Heat Storage. Renew. Energy 2020, 150, 487–508. [Google Scholar] [CrossRef]
- Li, X.; Wang, Z.; Li, J.; Chen, L.; Bai, Y.; Yang, M.; Guo, M.; Sun, F.; Yuan, G. Numerical and Experimental Study of a Concentrated Solar Thermal Receiver for a Solar Heating System with Seasonal Storage. Int. J. Energy Res. 2021, 1–17. [Google Scholar] [CrossRef]
- GB/T18708-2002; Test Methods for Thermal Performance of Domestic Solar Water Heating System.
- Reference, M. TRNSYS 17 Manual. Math. Ref. 4.
- Pahud, D. Central Solar Heating Plants With Seasonal Duct Storage And Short-Term Water Storage: Design Guidelines Obtained By Dynamic System Simulations. 2000, 69, 495–509. [Google Scholar] [CrossRef]
- Xiaoxia, L.; Zhifeng, W.; Jinping, L.; Yang, M.; Bai, Y.; Chen, L. Space Heating Management for Solar Heating System with Underground Pit Storage; 2020; Volume III, ISBN 9789811395277. [Google Scholar]
- Ciampi, G.; Rosato, A.; Sibilio, S. Thermo-Economic Sensitivity Analysis by Dynamic Simulations of a Small Italian Solar District Heating System with a Seasonal Borehole Thermal Energy Storage. Energy 2018, 143, 757–771. [Google Scholar] [CrossRef]
- Moffat, R.J. Describing the Uncertainties in Experimental Results. Exp. Therm. Fluid Sci. 1988, 1, 3–17. [Google Scholar] [CrossRef]
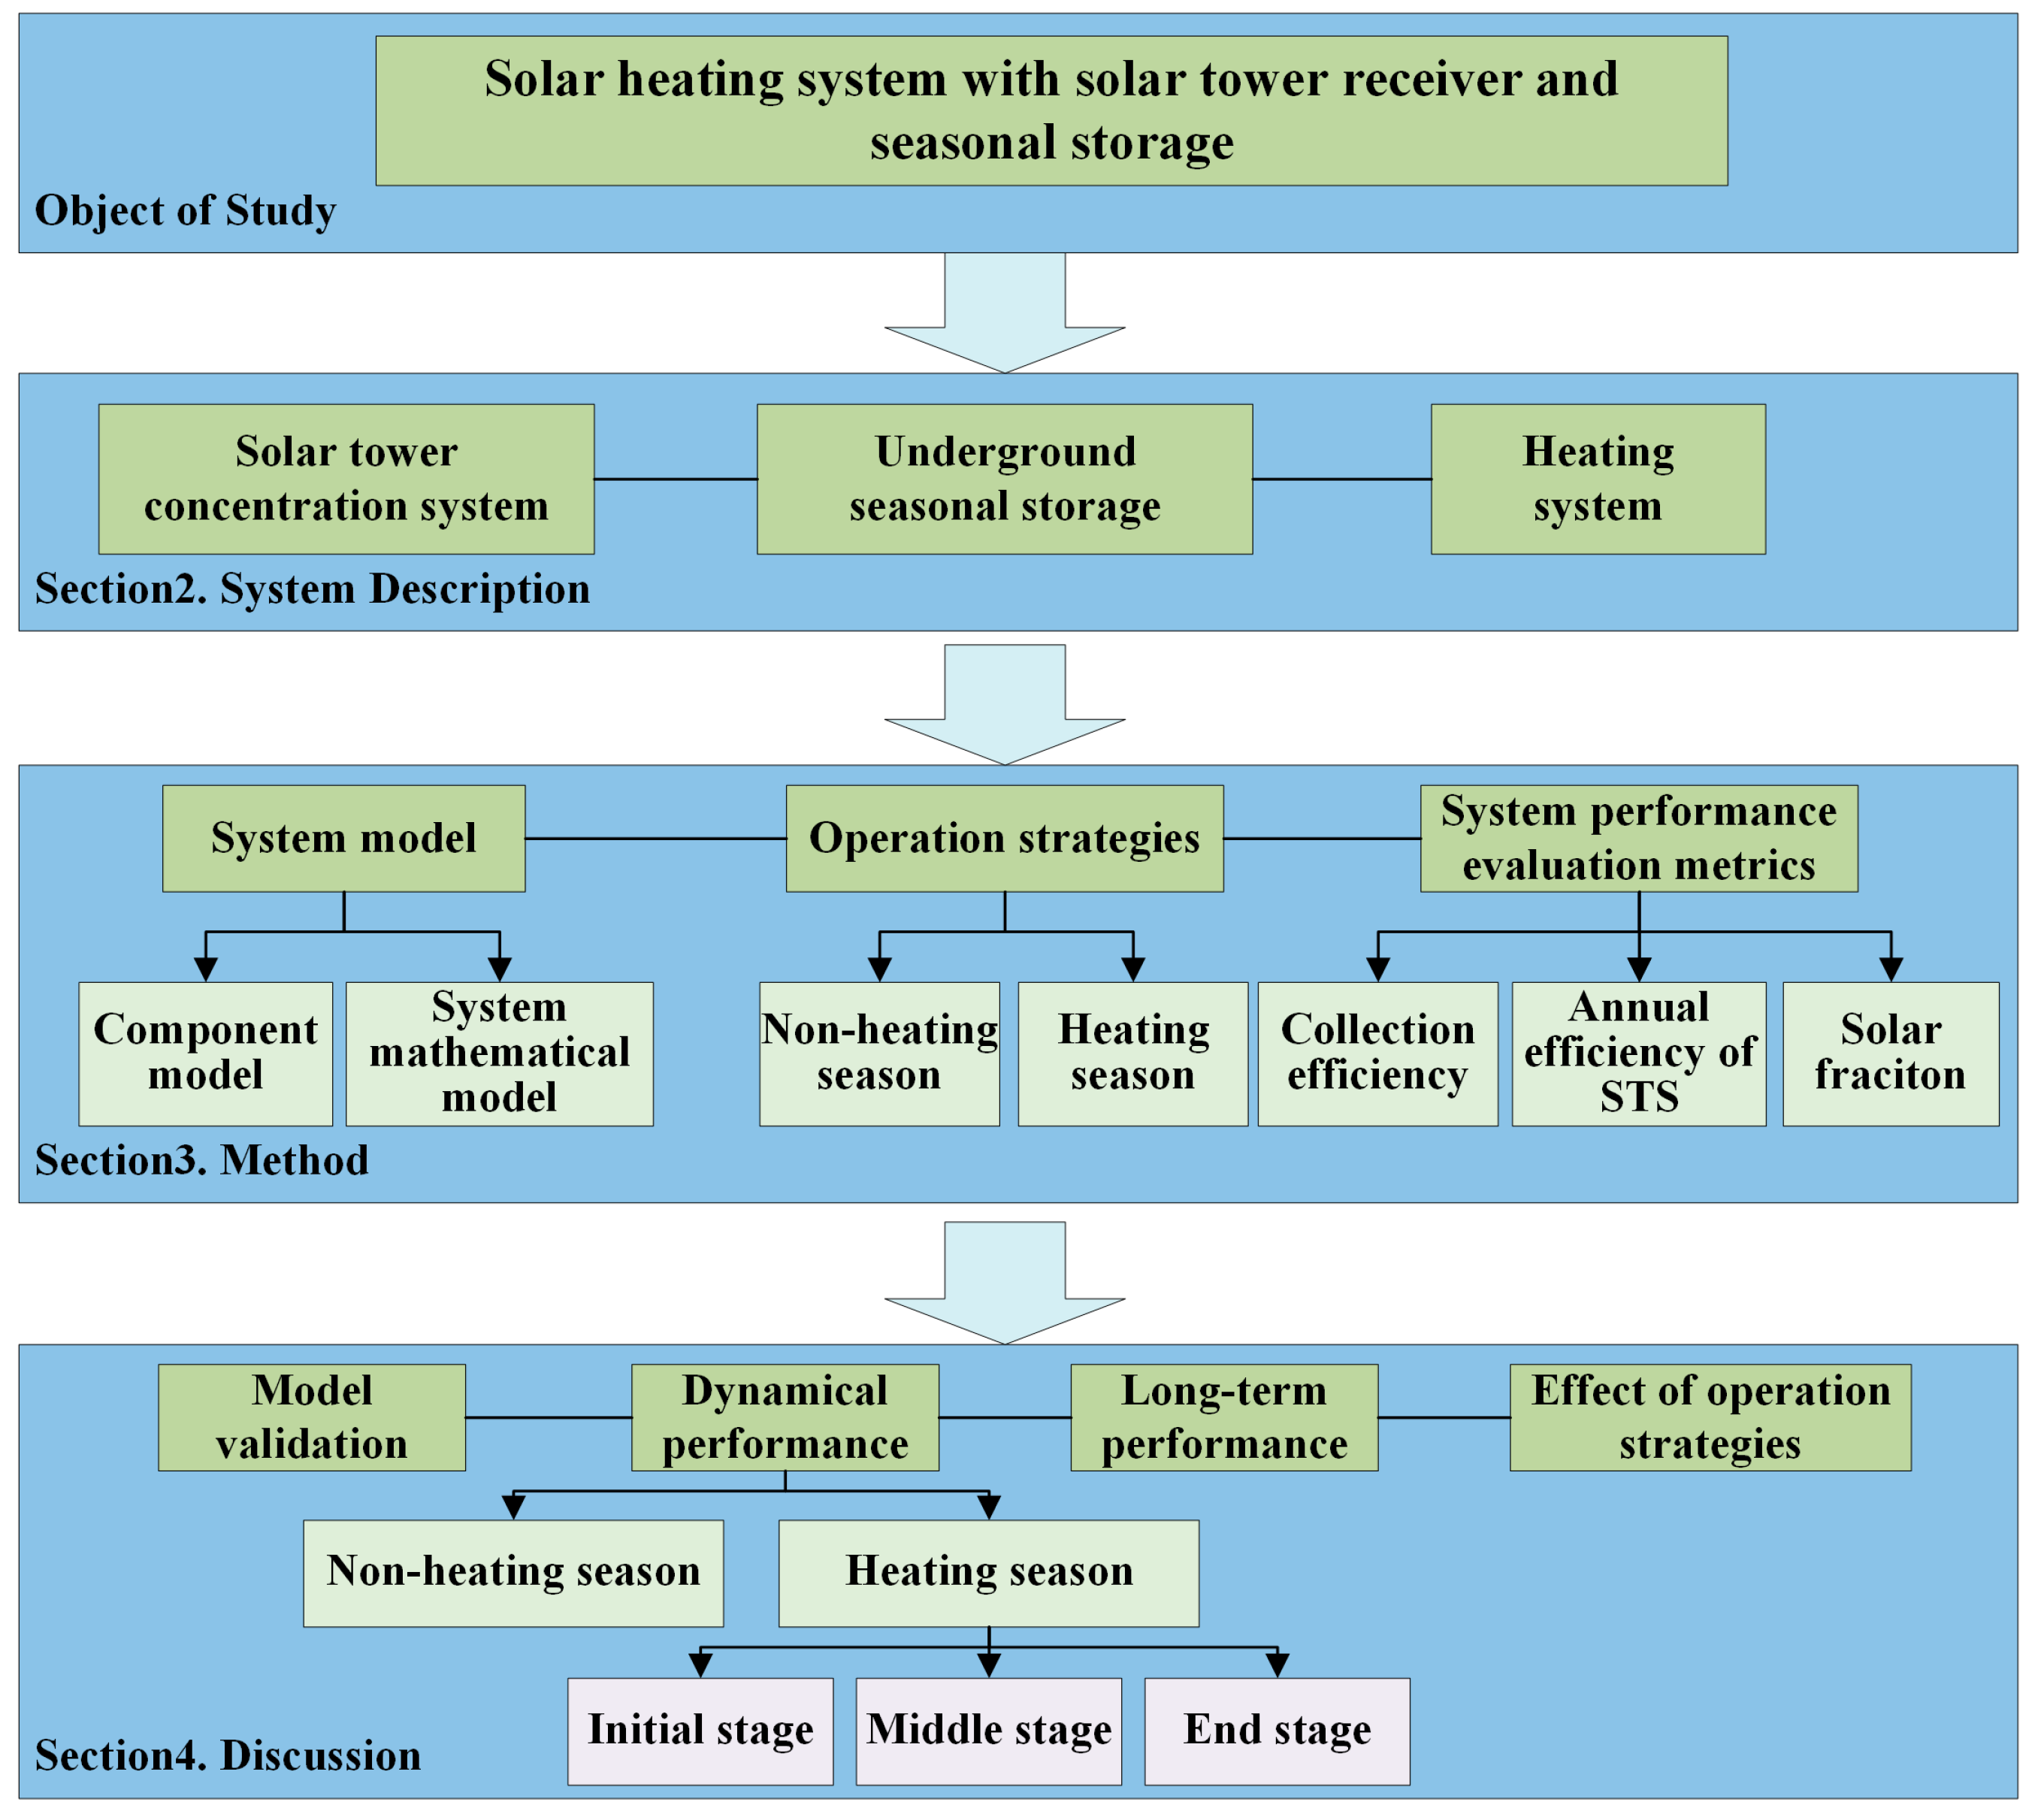
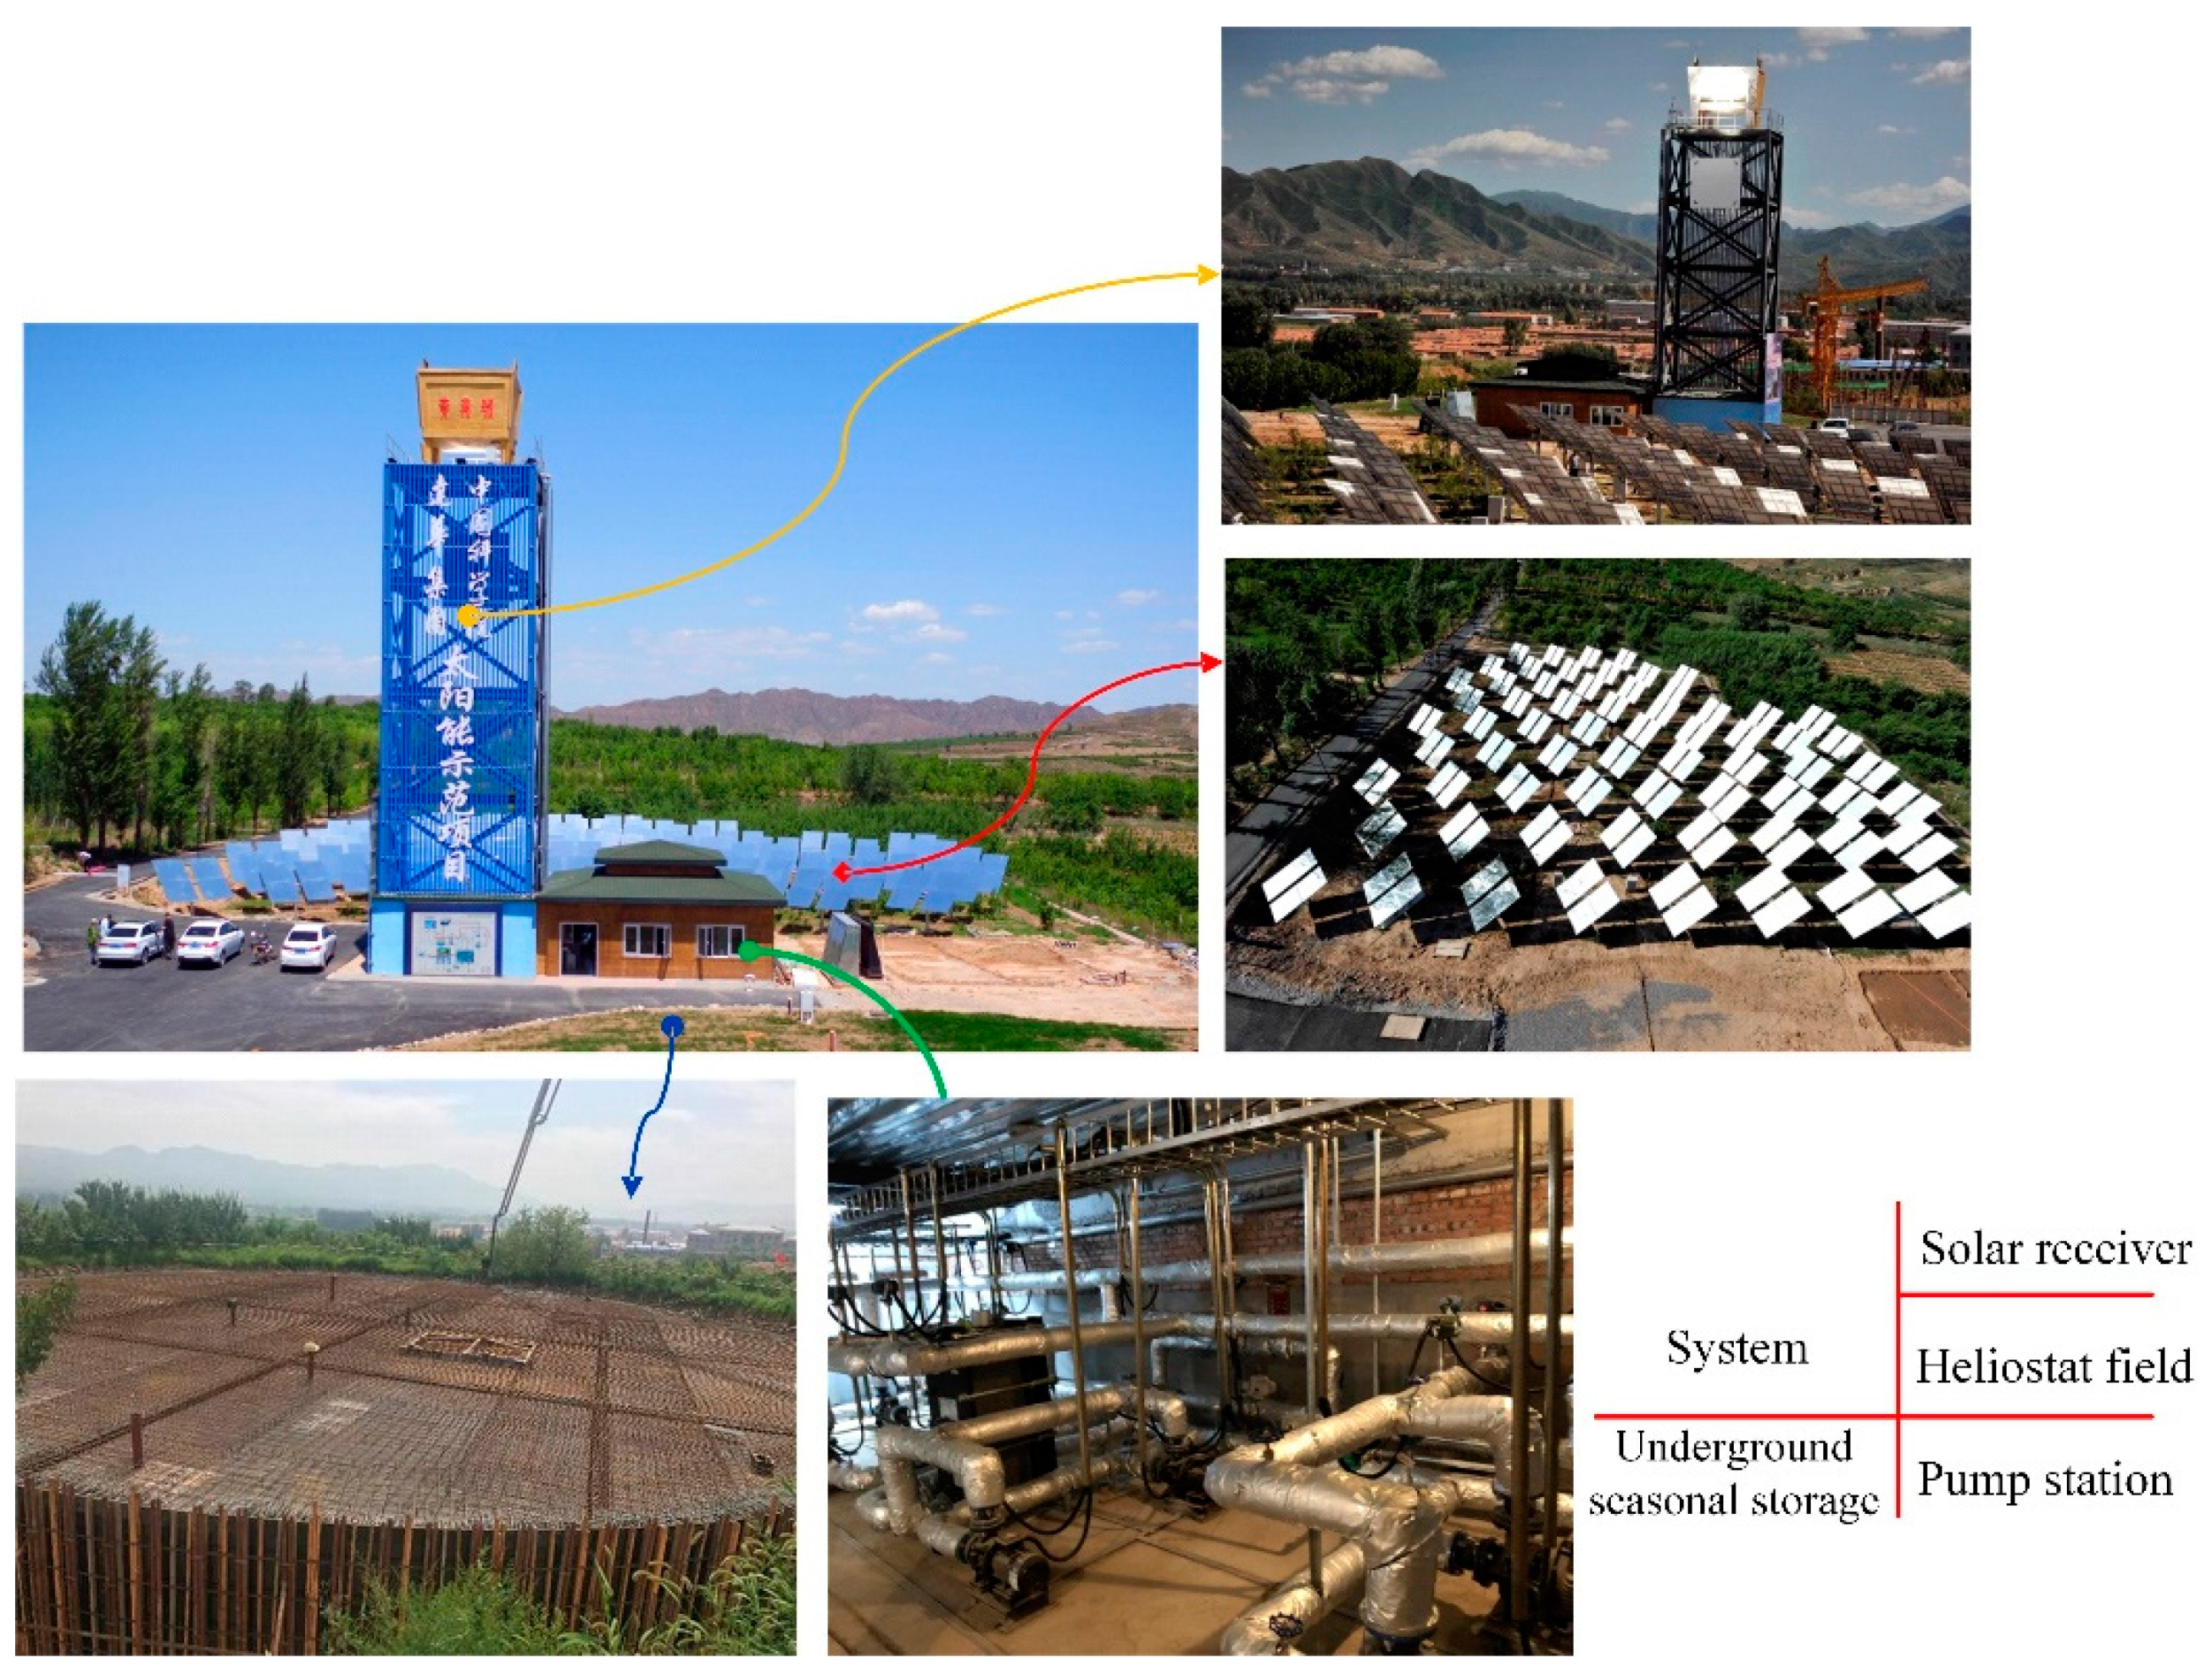
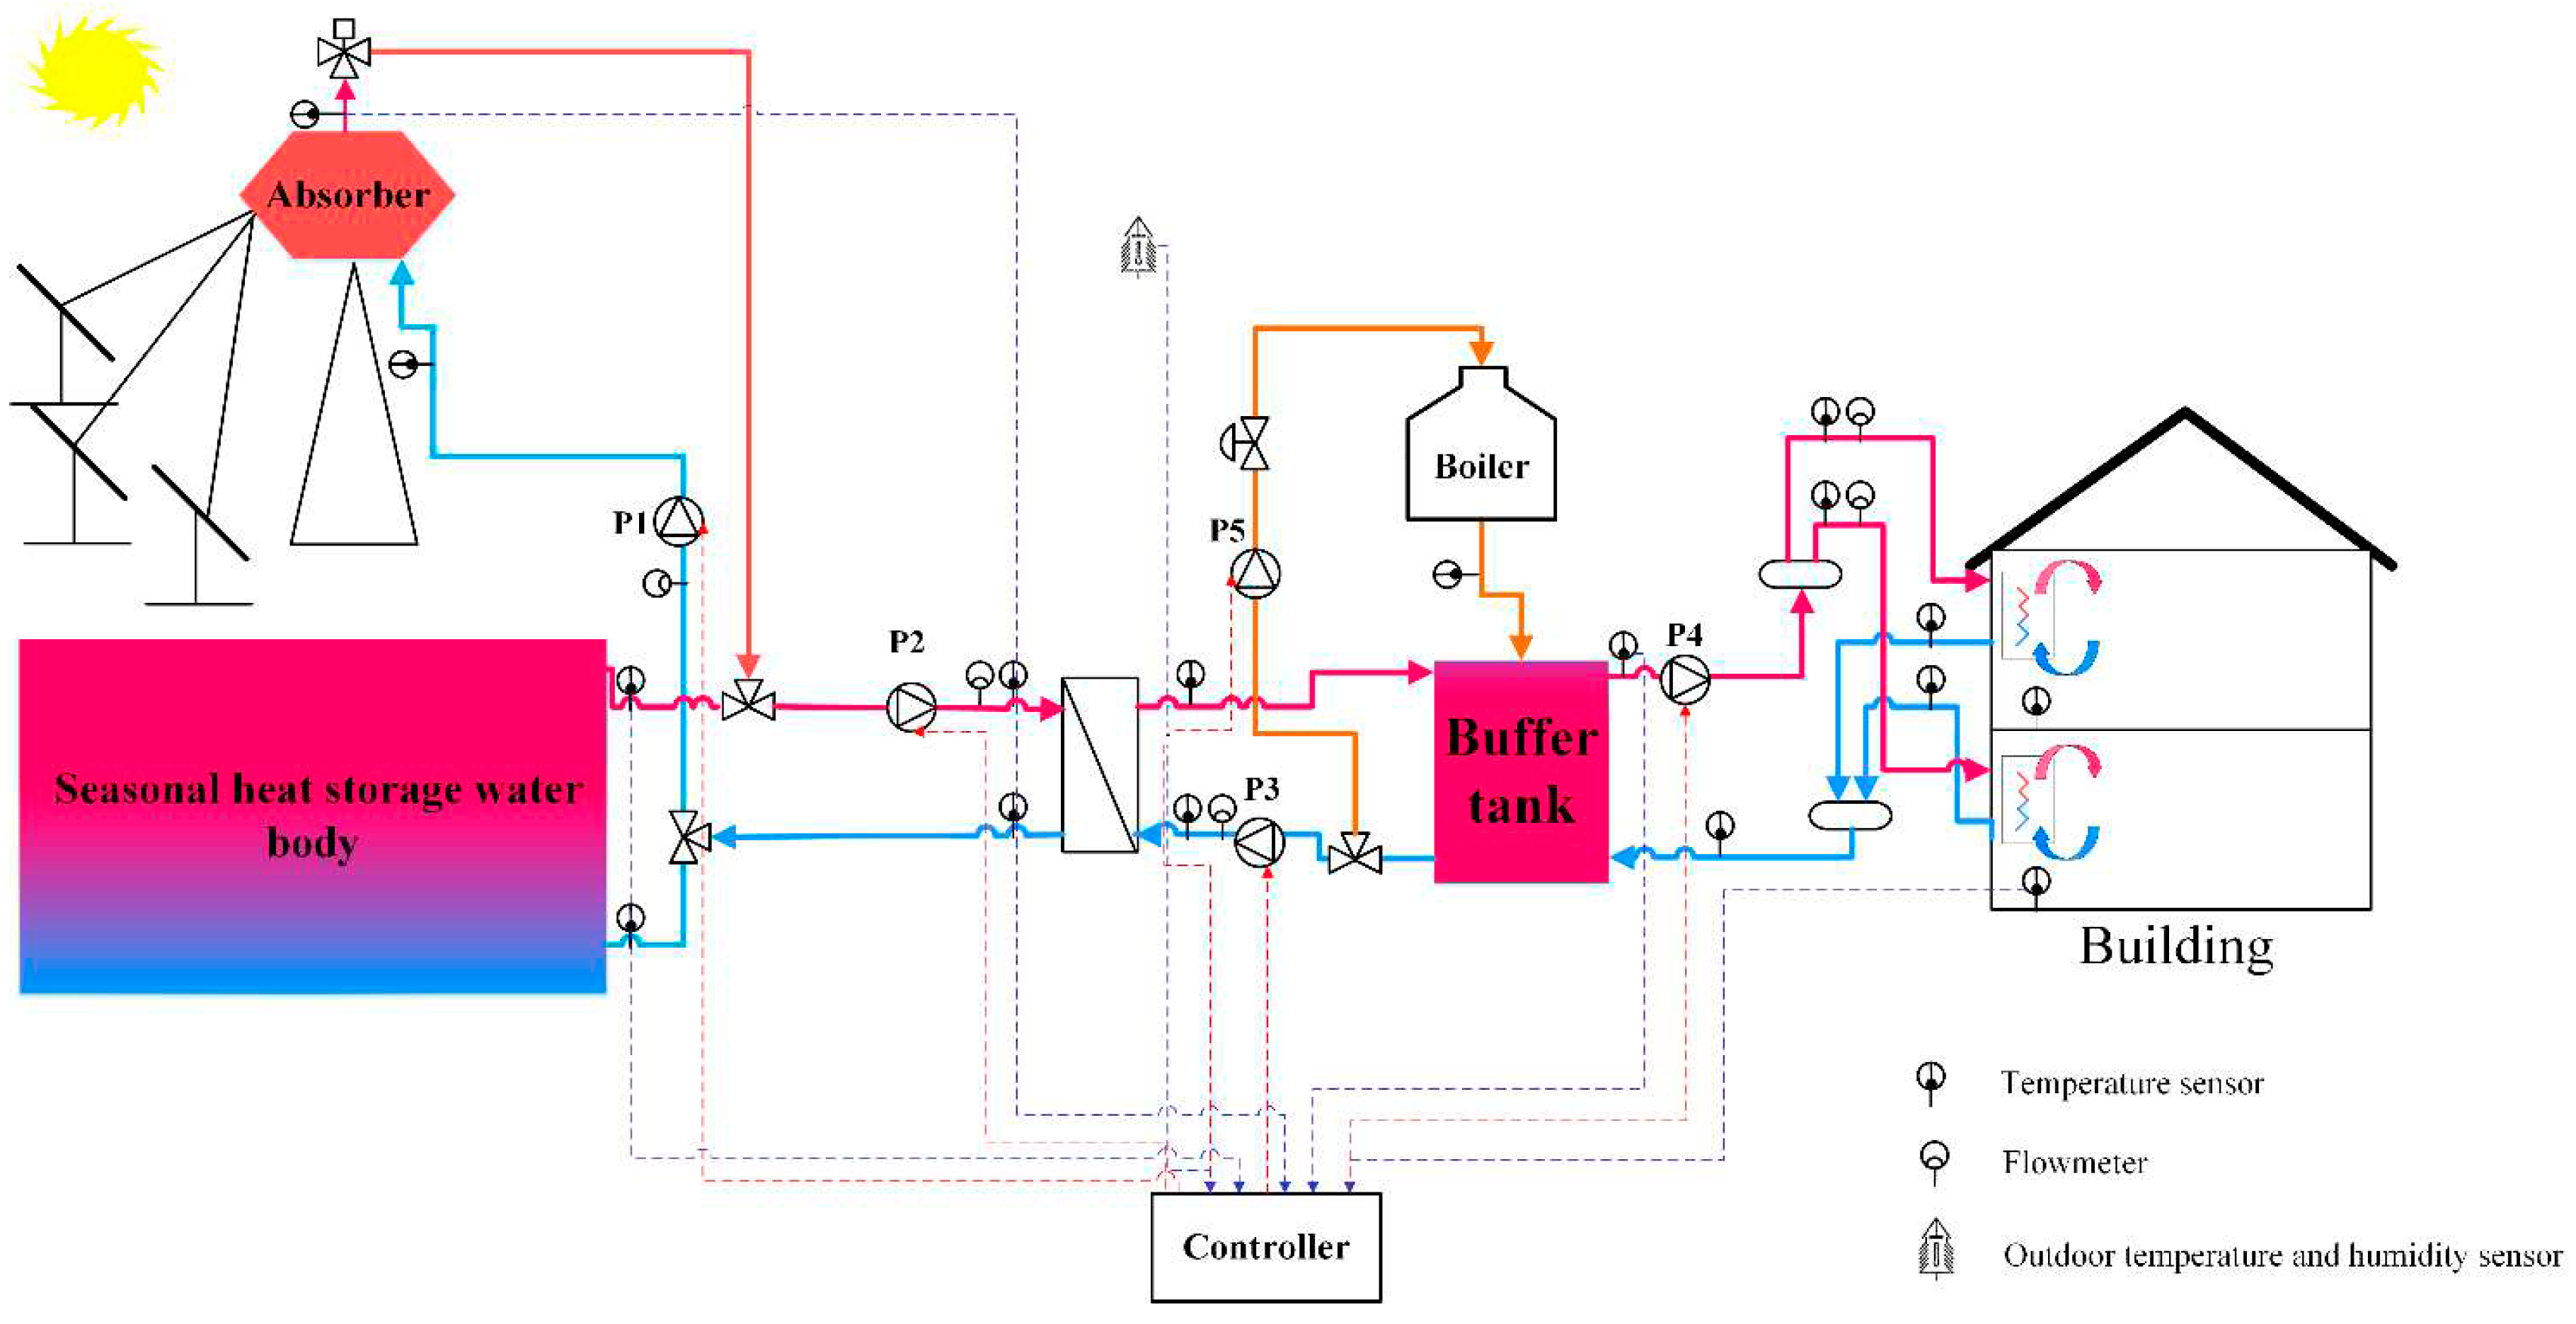
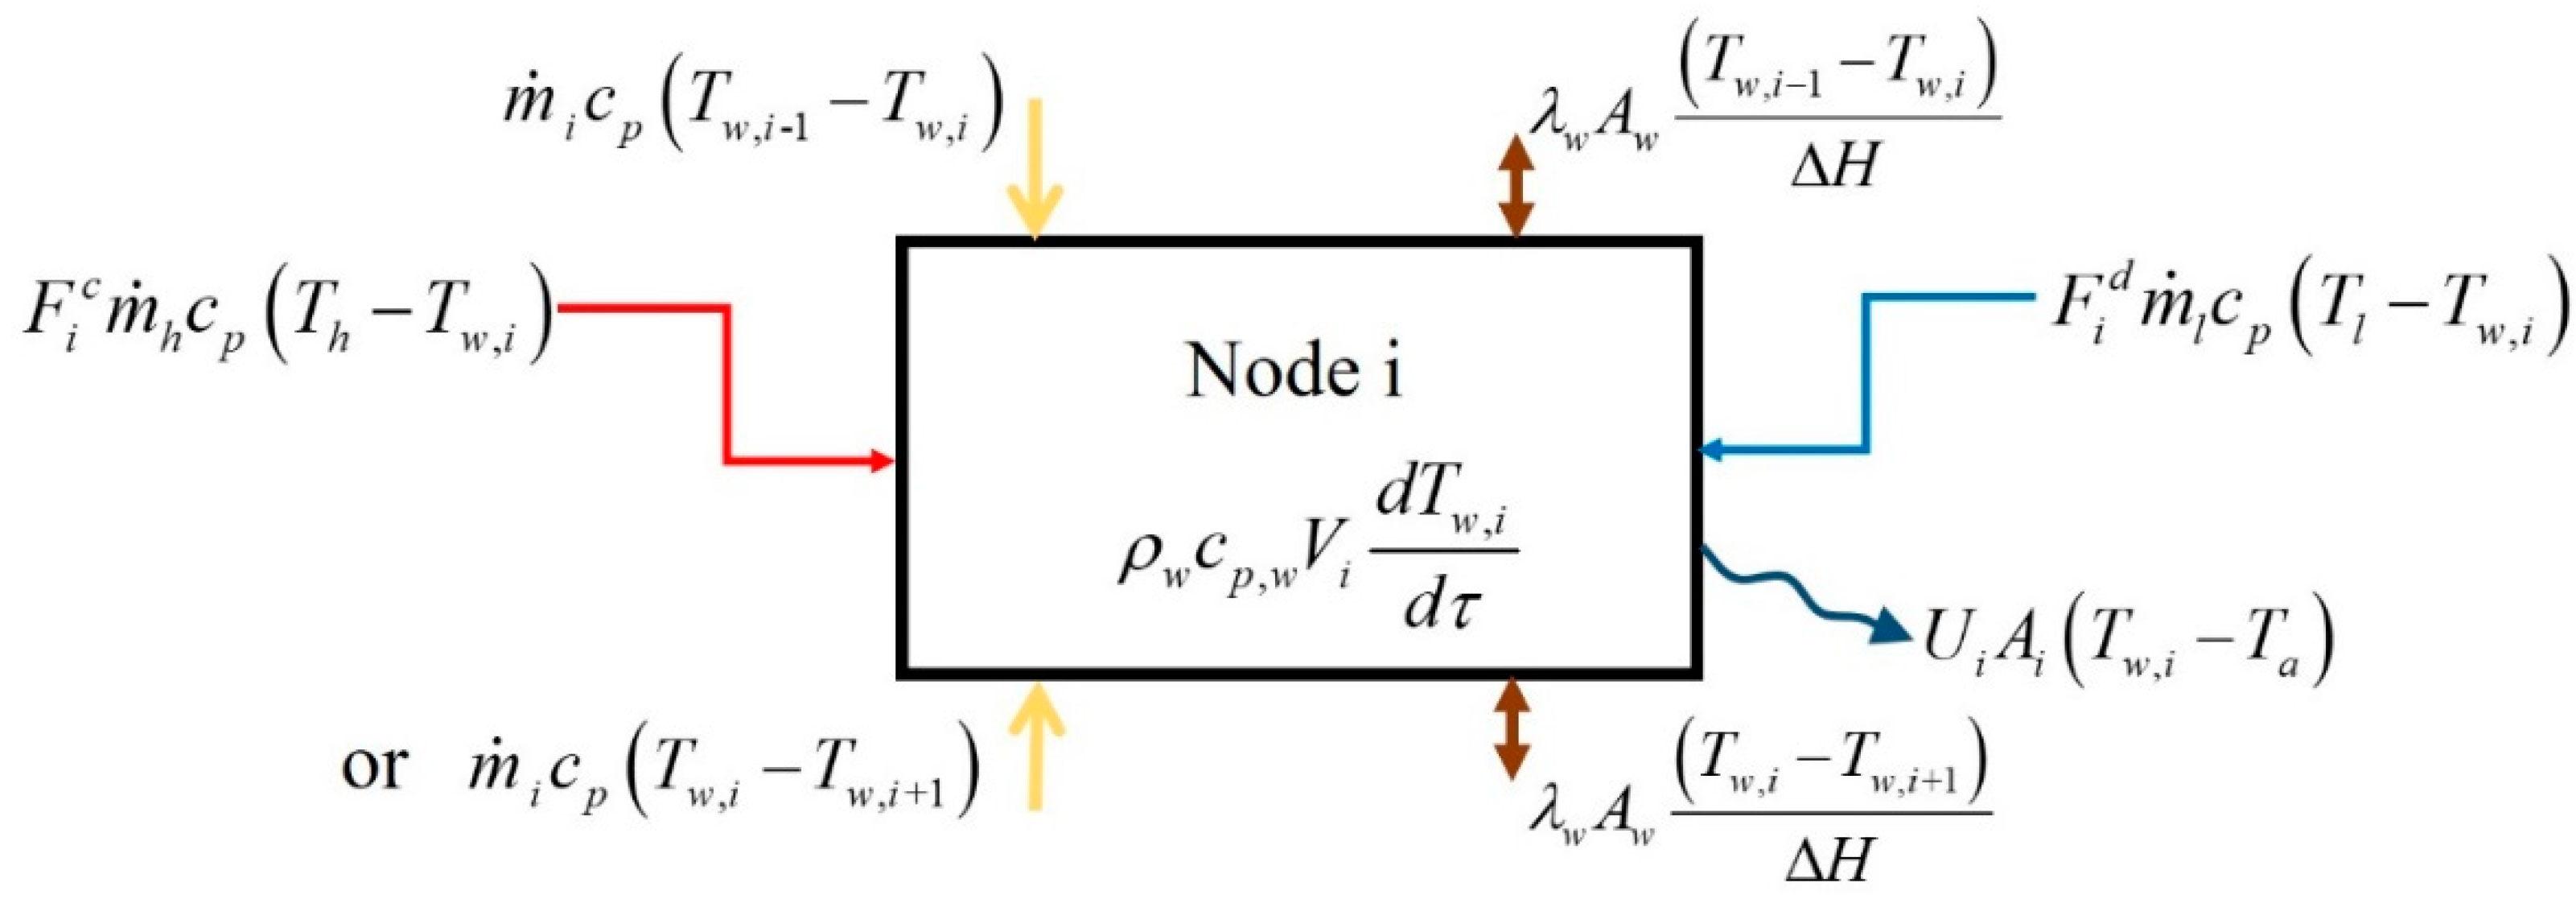

| Program | Property | Quantity | Unit |
|---|---|---|---|
| Location | Latitude | 40.23 N | ° |
| Longitude | 115.43 E | ° | |
| Heliostats field | Number of heliostats Area of heliostat Reflectivity |
66 11.2 0.9 |
m2 |
| Solar receiver | Daylighting area | 4.76 | m2 |
| Buffer tank | Volume | 48 | m3 |
| Seasonal thermal storage | Volume | 3000 | m3 |
| Heat exchanger | Area | 30 | m2 |
| Project | Name | Type | Notes |
|---|---|---|---|
| Meteorological parameters | Weather data | Type 15-3 | Calling in Typical annual meteorological data of Huailai obtained from the EnergyPlus website |
| Heliostat field | Hel | Type 394 | Calling in instantaneous efficiency of the heliostat field |
| Receiver | Receiver | Type 155 | Calling in structural parameters and mathematical models in MATLAB |
| Circulating pump | P(1~5) | Type 110 | Input the power curve of each circulation pump |
| Underground seasonal thermal storage | UGSTS | Type 207 | Self-developed model |
| Buffer tank | Buffer tank | Type 531 | Measured heat loss coefficient 0.34 W/(m2·°C) |
| Operation control unit | CON (1~3) | Type 2b | Temperature difference control |
| CONTROL | Calculator | Logical control | |
| Data display or output | Plotter | Type 65d | Display of results |
| Month result | Type 25c | Output of results | |
| Diversion valve | D (1~4) | Type 11f | Switch between different circulation routes |
| Mixing valve | M (1~4) | Type 11d | Switch between different circulation routes |
| Heat exchanger | HE | Type 5b | Counterflow, average heat transfer coefficient 100 W/K per m2 of collector area [23] |
| Building load | LOAD | Type 12c | Heat load per unit heating area 40 W/m2 |
| Heating season controller | SEASONAL | Type 14 | The heating season is from November 1st to April 1st of the following year |
| Auxiliary fuel boiler | Boiler | Type 700 | Rated power 170 kW, Boiler efficiency 0.9 |
| Temperature control diverter valve | D5 | Type 11b | The water supply temperature can reach the set temperature by mixing the supply and return water |
| Location | RMSD(°C) | ARE(%) | MRE(%) |
|---|---|---|---|
| T1 (4.25m from STS bottom) | 1.10 | 0.42 | 1.52 |
| T2 (3.45m from STS bottom) | 1.54 | 0.75 | 1.85 |
| T3 (2.65m from STS bottom) | 0.79 | 0.45 | 0.28 |
| T4 (1.85m from STS bottom) | 0.32 | 0.03 | 0.57 |
| T5 (1.05m from STS bottom) | 1.23 | 0.75 | 1.63 |
| T6 (0.25m from STS bottom) | 0.50 | 0.12 | 0.92 |
| Inlet temperature of receiver | 1.12 | 2.49 | 6.0 |
| Outlet temperature of receiver | 3.01 | 2.57 | 9.8 |
| Measurement devices | Type | Range | Accuracy |
|---|---|---|---|
| Temperature sensor | PT100 | 0~100 °C | ±0.5 °C |
| Vortex Flowmeter | HH-HYBLWGY-50 | 0~25 m³/h | ±1.0% |
| Parameters | Type of data | Unit | Relative error |
|---|---|---|---|
| Average inlet temperature of solar receiver | Measured | °C | 3.783% |
| Average outlet temperature of solar receiver | Measured | °C | 2.049% |
| Average flowrate | Measured | m3/h | 1.058% |
| Average temperature of STS | Measured | °C | 0.983% |
Disclaimer/Publisher’s Note: The statements, opinions and data contained in all publications are solely those of the individual author(s) and contributor(s) and not of MDPI and/or the editor(s). MDPI and/or the editor(s) disclaim responsibility for any injury to people or property resulting from any ideas, methods, instructions or products referred to in the content. |
© 2023 by the authors. Licensee MDPI, Basel, Switzerland. This article is an open access article distributed under the terms and conditions of the Creative Commons Attribution (CC BY) license (https://creativecommons.org/licenses/by/4.0/).


