1. Introduction
HIV (Human Immunodeficiency Virus) attacks the immune system, which can lead to AIDS (Acquired Immunodeficiency Syndrome) a condition that results in the weakening of the immune system and increased susceptibility to other infections. HIV/AIDS is a global public health issue, with an estimated 38 million people living with HIV/AIDS worldwide as of 2019. Since the virus was first identified in the early 1980s, HIV/AIDS has become one of the deadliest pandemics in human history, with over 36 million people dying from AIDS-related illnesses [
1,
2].
The majority of new HIV diagnoses in Europe are among MSM, who accounted for 42% of new diagnoses in 2019. Other key populations with higher rates of HIV/AIDS in Europe include PWID (People who Inject Drugs), migrants, and sex workers. According to the World Health Organization (WHO), there were approximately 2.2 million people living with HIV/AIDS in Europe in 2019, with an estimated 136,000 new diagnoses that year [
3].
Romania has a relatively low prevalence of HIV/AIDS compared to some other countries in Europe, but the epidemic has been growing in recent years. According to UNAIDS, there were approximately 16,000 people living with HIV/AIDS in Romania as of 2020, with an estimated 1,000 new infections that year [
4].
One of the most severe symptoms of extrapulmonary tuberculosis (TBEP) is tuberculous meningitis (TBM) which is linked to significant morbidity and high mortality. It is well recognized that HIV-positive people are more likely to develop TBEP, including TBM, especially if they have severe immunodeficiencies. Additionally, it has been demonstrated that TBM among HIV-positive patients died at higher rates than HIV-negative people in the time before receiving combination antiretroviral therapy [
5,
6].
TBM symptoms have reportedly ranged in length from one day to six months prior to presentation, and as a result, the condition may manifest as either acute or chronic meningitis. Fatigue, malaise, anorexia, vomiting, fever, and headache are among the symptoms of TBM's nonspecific prodrome; symptom variation throughout this time is frequent. Occasionally, TBM may manifest as gradual dementia, with social retreat and personality abnormalities. Active pulmonary tuberculosis coexists with TBM in 30% to 60 % of cases. Acute presentations may be difficult to distinguish from bacterial meningitis [
6,
7].
The diagnosis of TBM heavily relies on CSF analysis. A lymphocytic pleocytosis frequently coexists with low glucose and increased protein levels. Clinical and CSF findings-based diagnostic guidelines have been devised and evaluated in a variety of settings, however, it is unclear if these rules can be used outside of their source populations. The timing of the introduction of ART in relation to anti-tuberculous medication is complicated, even if the use of ART during the treatment of tuberculosis may improve clinical outcomes. In addition to the previously mentioned known drug-drug interactions, starting ART and anti-tuberculous therapy at the same time results in overlapping drug toxicities. The paradoxical reaction, which is a temporary exacerbation of the signs and symptoms of infection, has been linked to the start of anti-tuberculous medication in the absence of ART. The paradoxical reaction in TBM instances may manifest as the development of several tuberculomas following the start of effective treatment. The paradoxical response that occurs during the treatment of TBM may be made worse by ART's immunological reconstitution [
8].
In conclusion, significant immune suppression and an unacceptably high mortality rate are characteristics of HIV-positive patients with TBM. Patients who have advanced HIV infection have a particularly poor prognosis after TBM, which urgently calls for public health interventions to improve patient management in terms of earlier HIV infection diagnosis, timely and accurate TB diagnosis, optimal TB treatment, and access to cART [
9].
3. Results
Our Center has a total number of patients on record of 1692. Patients co-infected with HIV- TB, 195 of which 19 cases were HIV TBM coinfection, from January 1, 2010, to December 1, 2022.
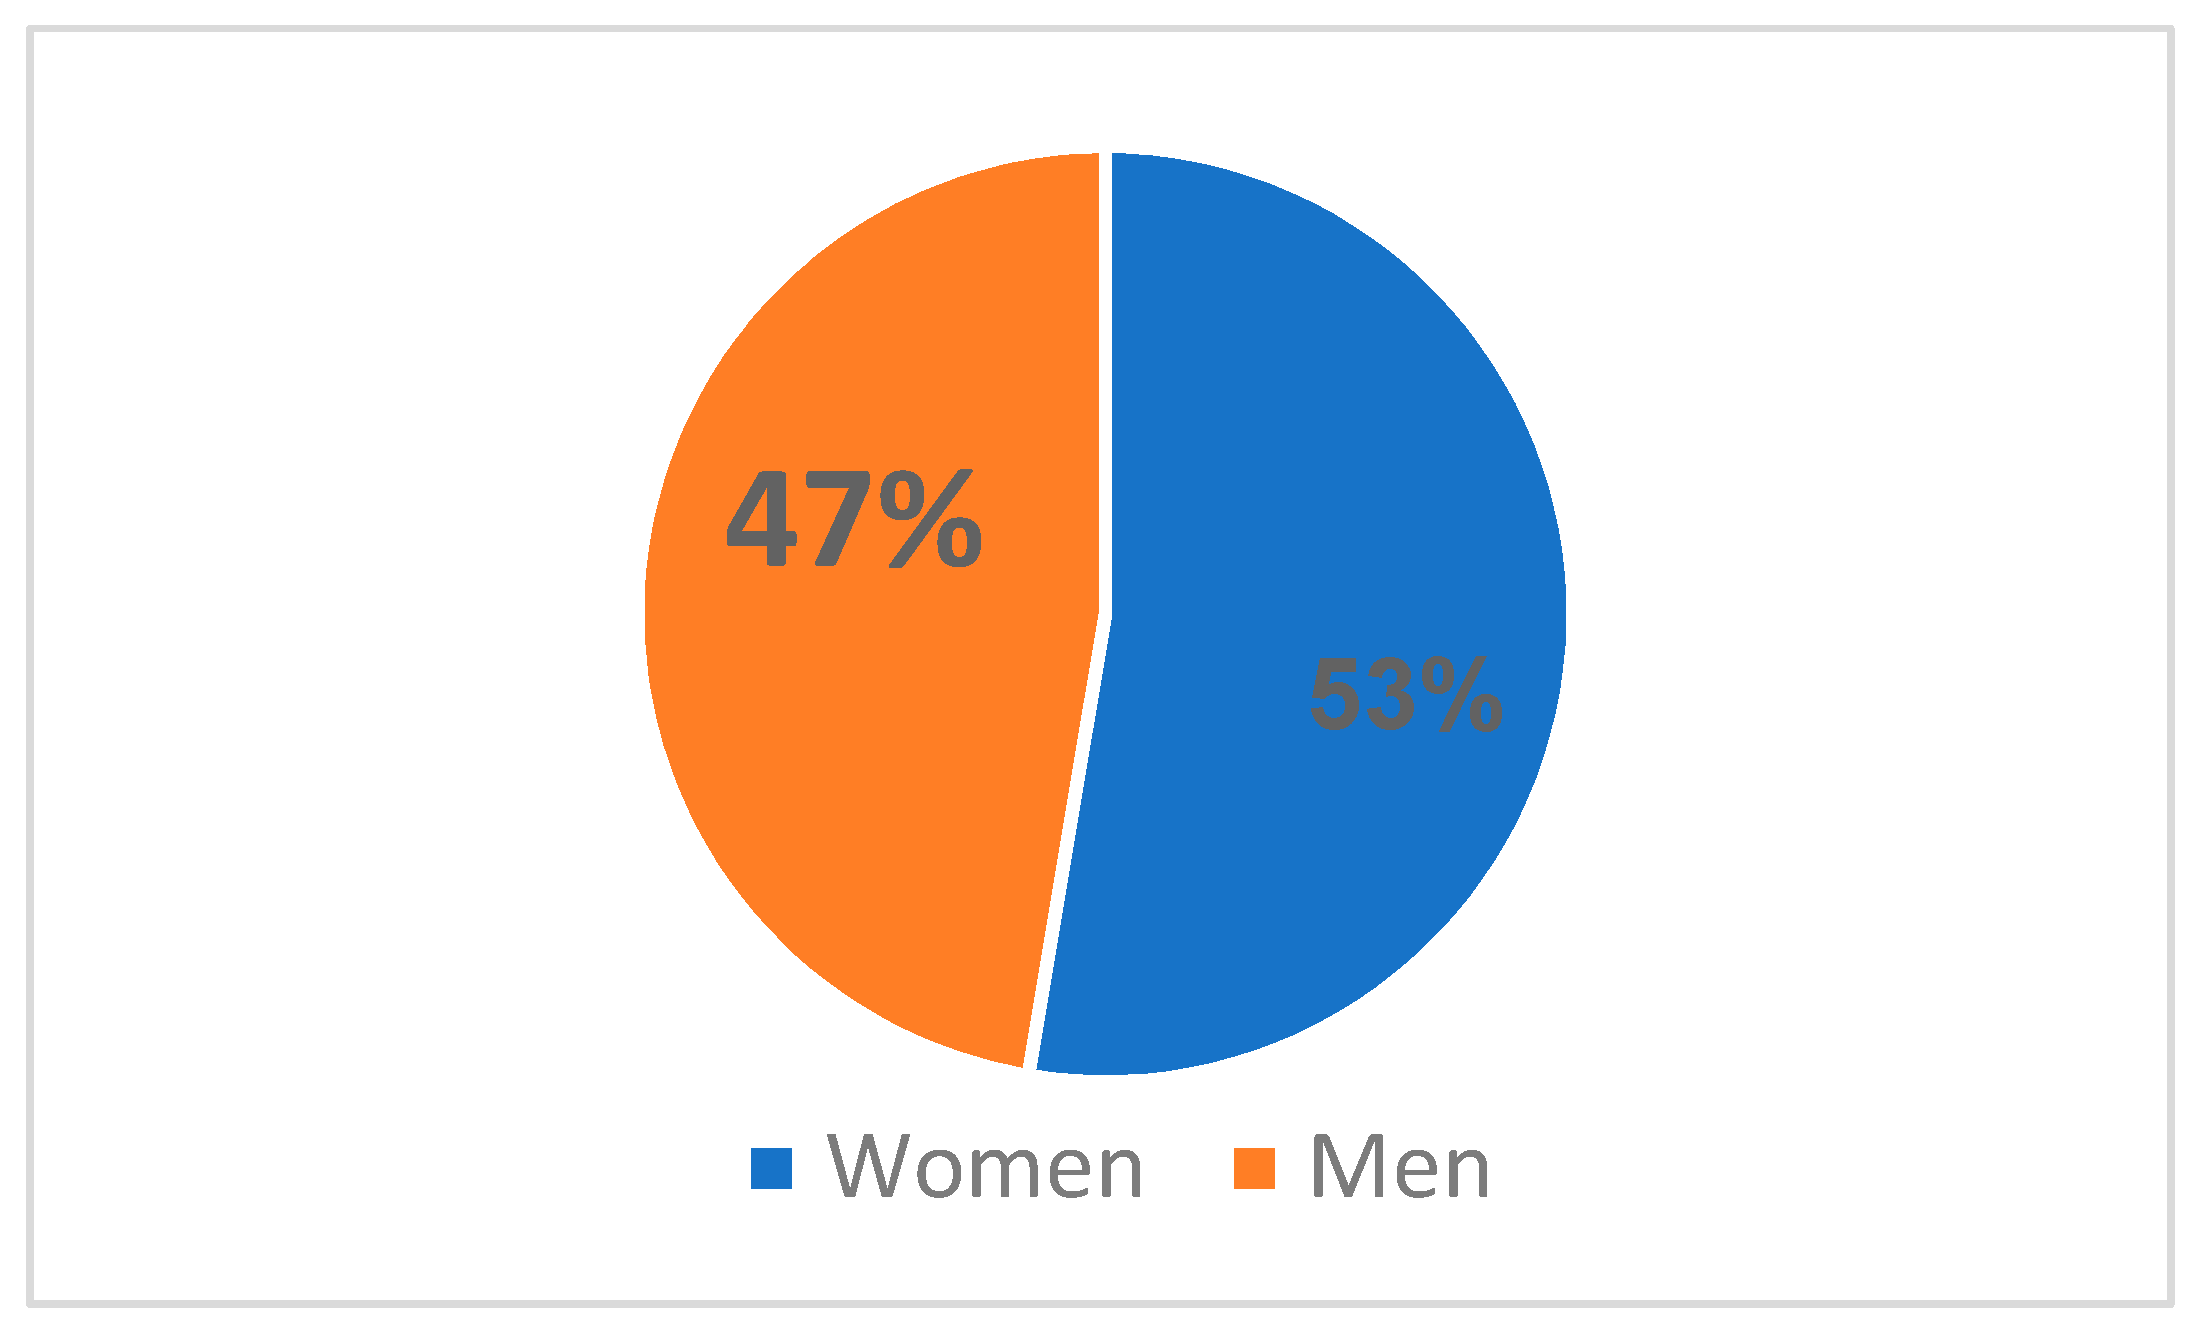
HIV infection was more common in women (10 cases, or 53%) than in men (9 cases, or 47%) in the Northeastern region of Romania from 2010 to 2022, where there was a total of 19 cases (
Figure 1). From this total, 6 cases were late presenters and 13 patients were already in the center's records with a deficient immunological viral status, non-compliant, and non-adherent to antiretroviral therapy.
The majority of cases were young adults, aged between 21-30 years old – 10 patients (26.31%), followed by the age group 31-40 – 5 patients (40.12%), 41-50 years – 2 patients (10.52%), 51-60 years old– 1 patient (5.26%), 0-20 years old – 1 patient (5.26%), (
Table 1). The average age in the study group was 27 years old.
The distribution of our study group based on county showed that almost a third of the patients were from Suceava (7 cases, 31%), followed by Iasi (4 cases, 21%), Botosani (4 cases, 21%), Bacau (2 cases, 11%), Neamt (1 case, 5%) and Vaslui (1 case, 5%), (
Table 2).
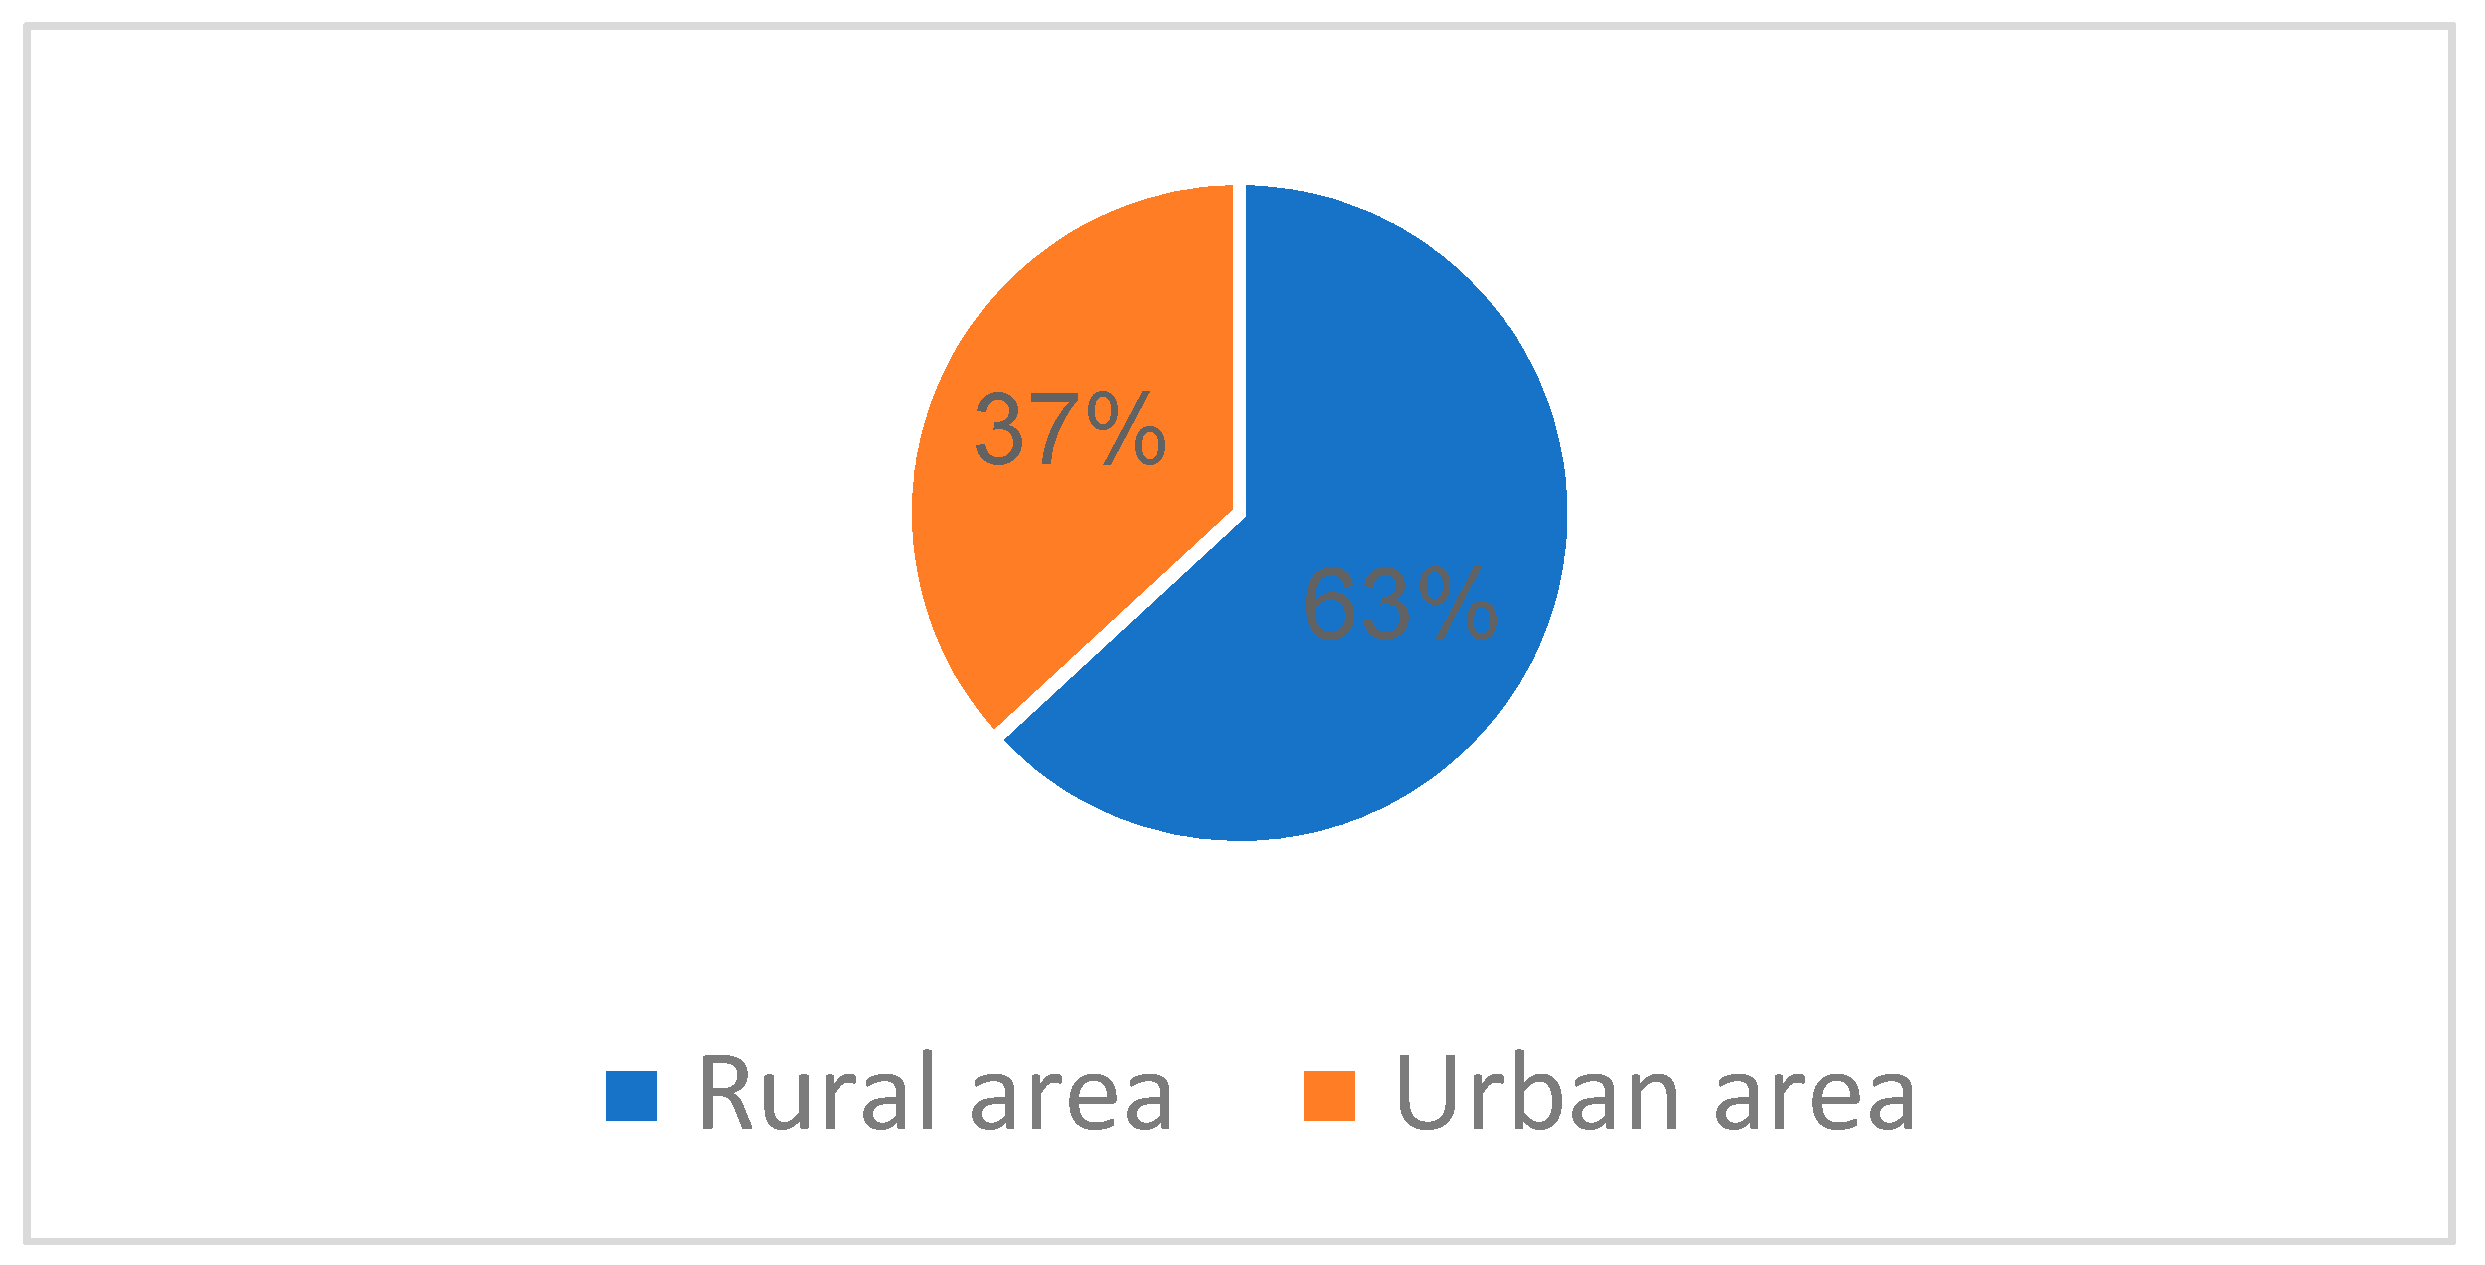
From urban areas in North East Romania, were 7 patients (37%), and the remaining 12 cases (63%) were from rural areas (
Figure 2).
Considering the route of transmission, only 18 cases (94.73%) have reported a possible cause. For the remaining 1 case (5.26%), the route of transmission remains unknown (
Table 3). For those with a known route of transmission, the most frequent was sexual transmission (MSM and heterosexual contact) (89.47%), with only one known case of intravenous drug usage (5.26%) and none perinatal cases recorded.
All of the admitted patients from the Iasi HIV/AIDS Regional Center between January 1st, 2010, and December 1st, 2022 were virologically and immunologically evaluated.
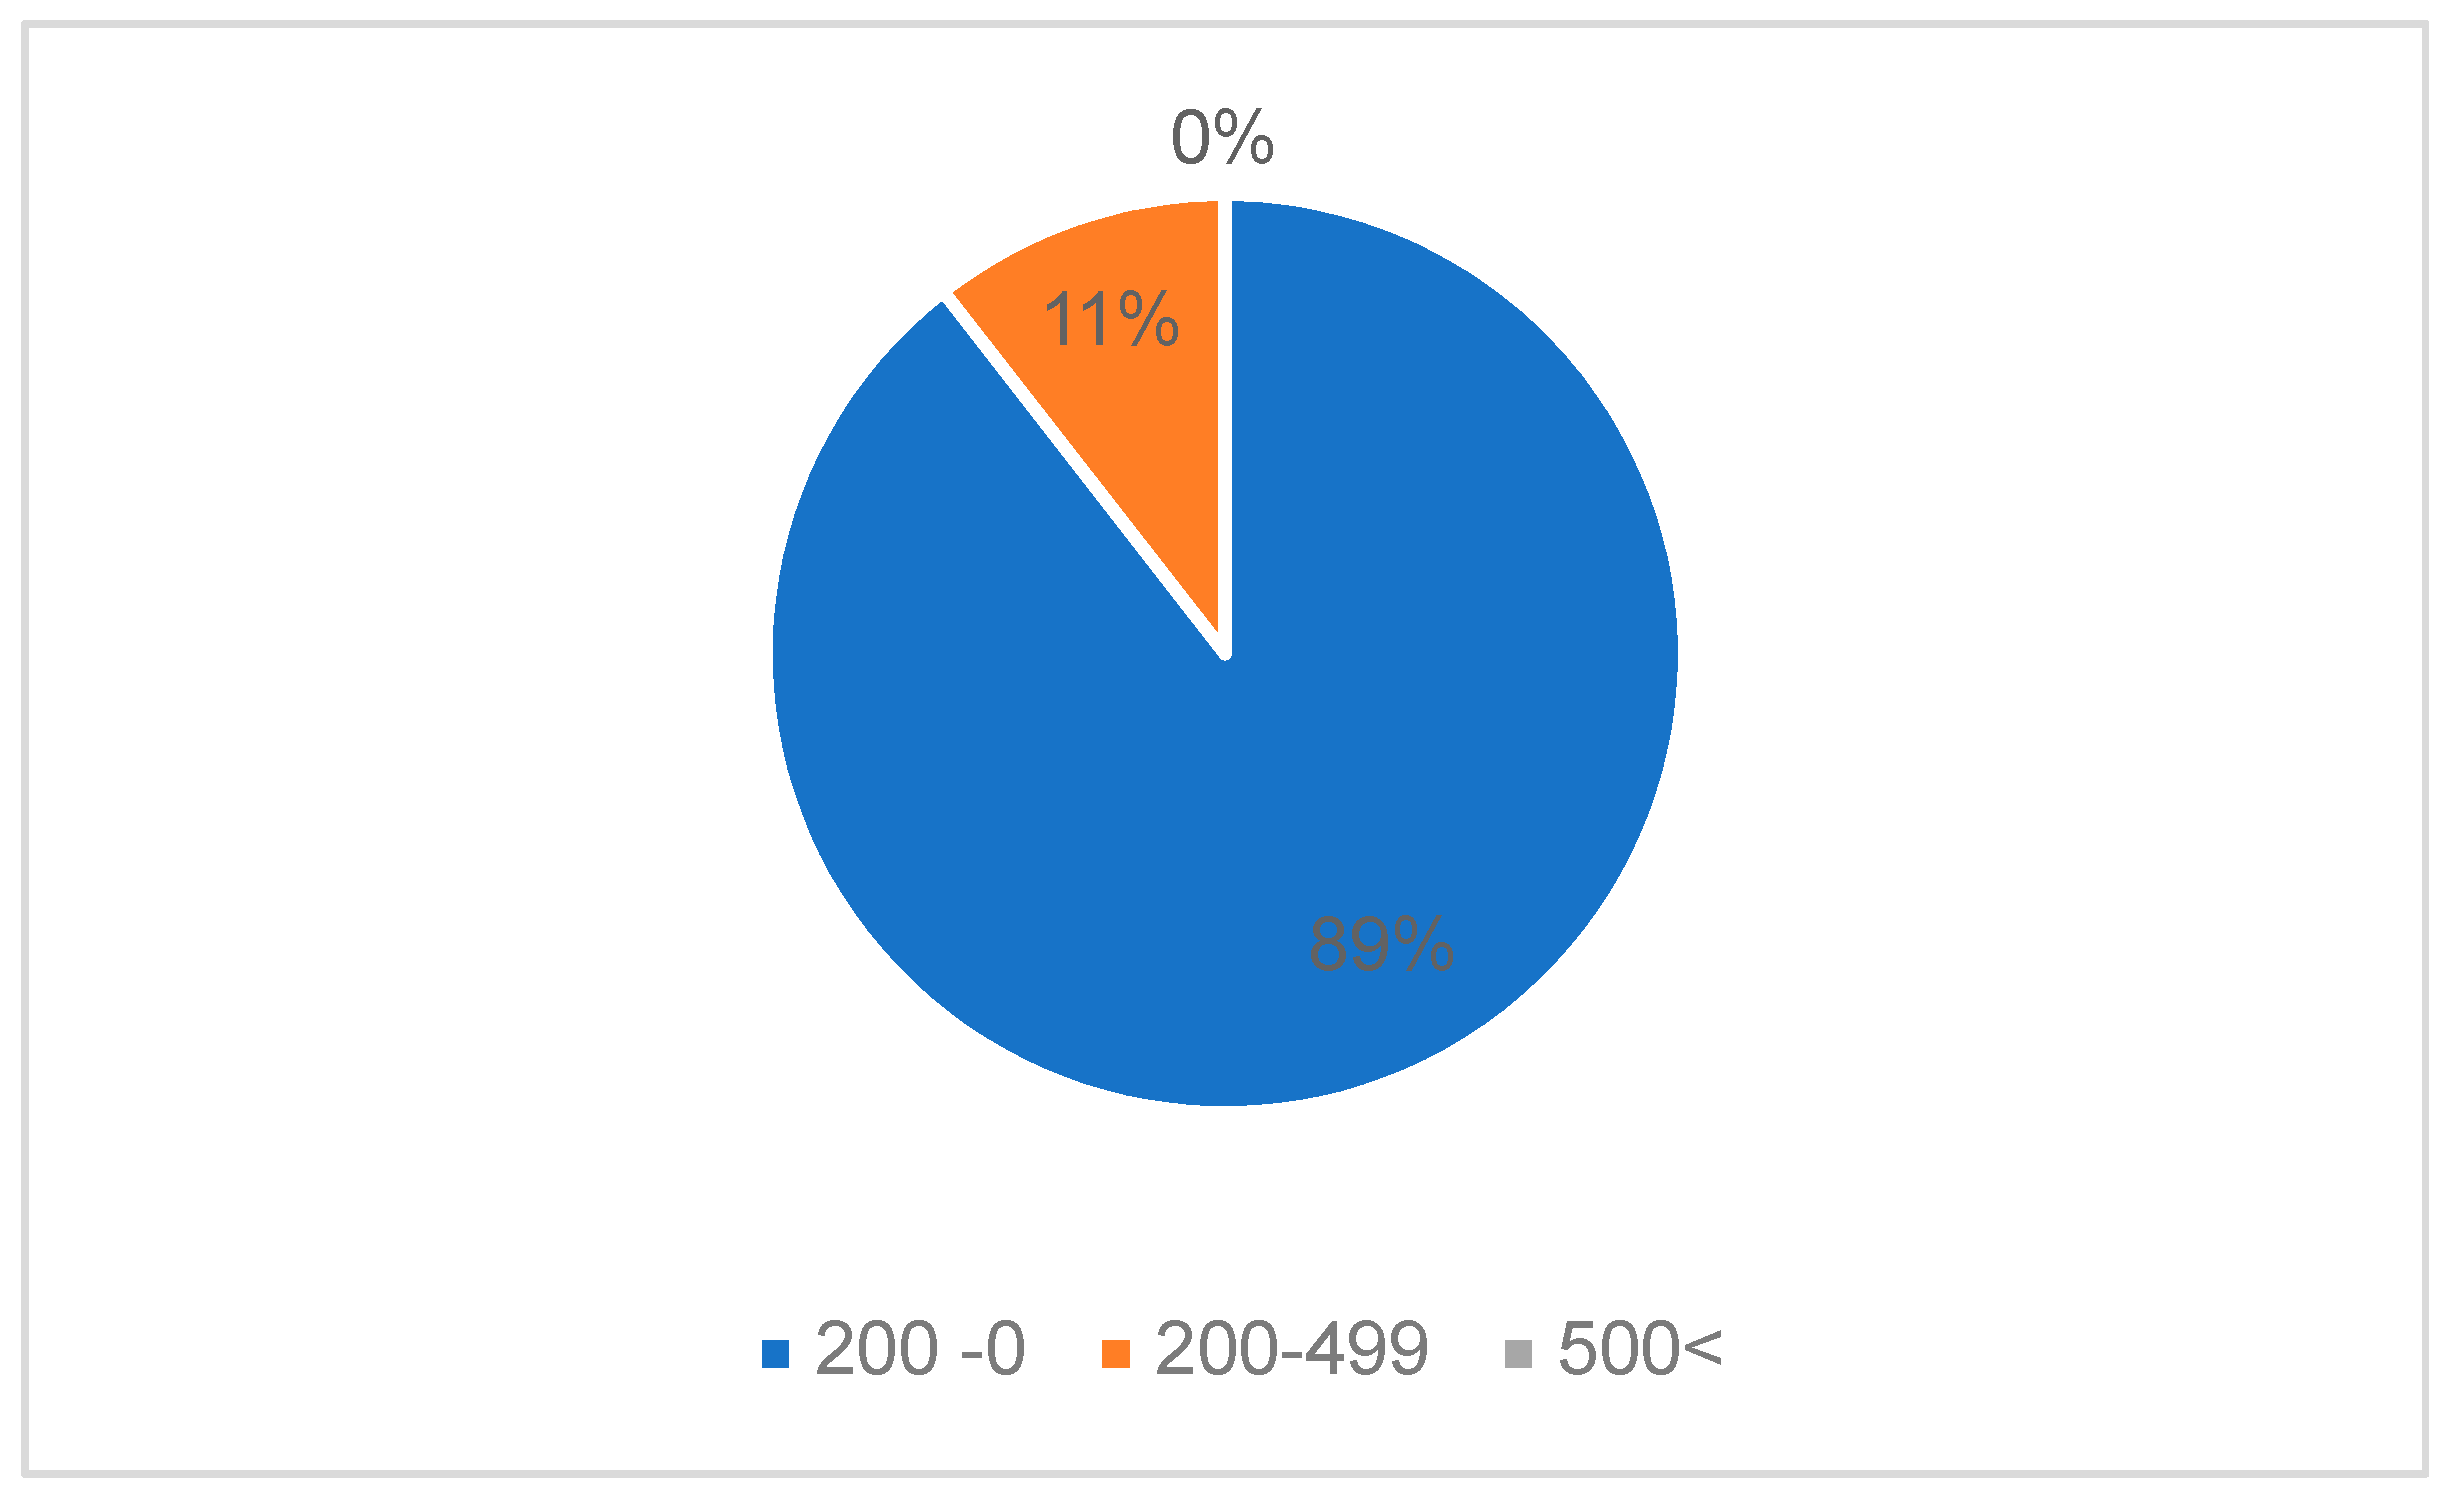
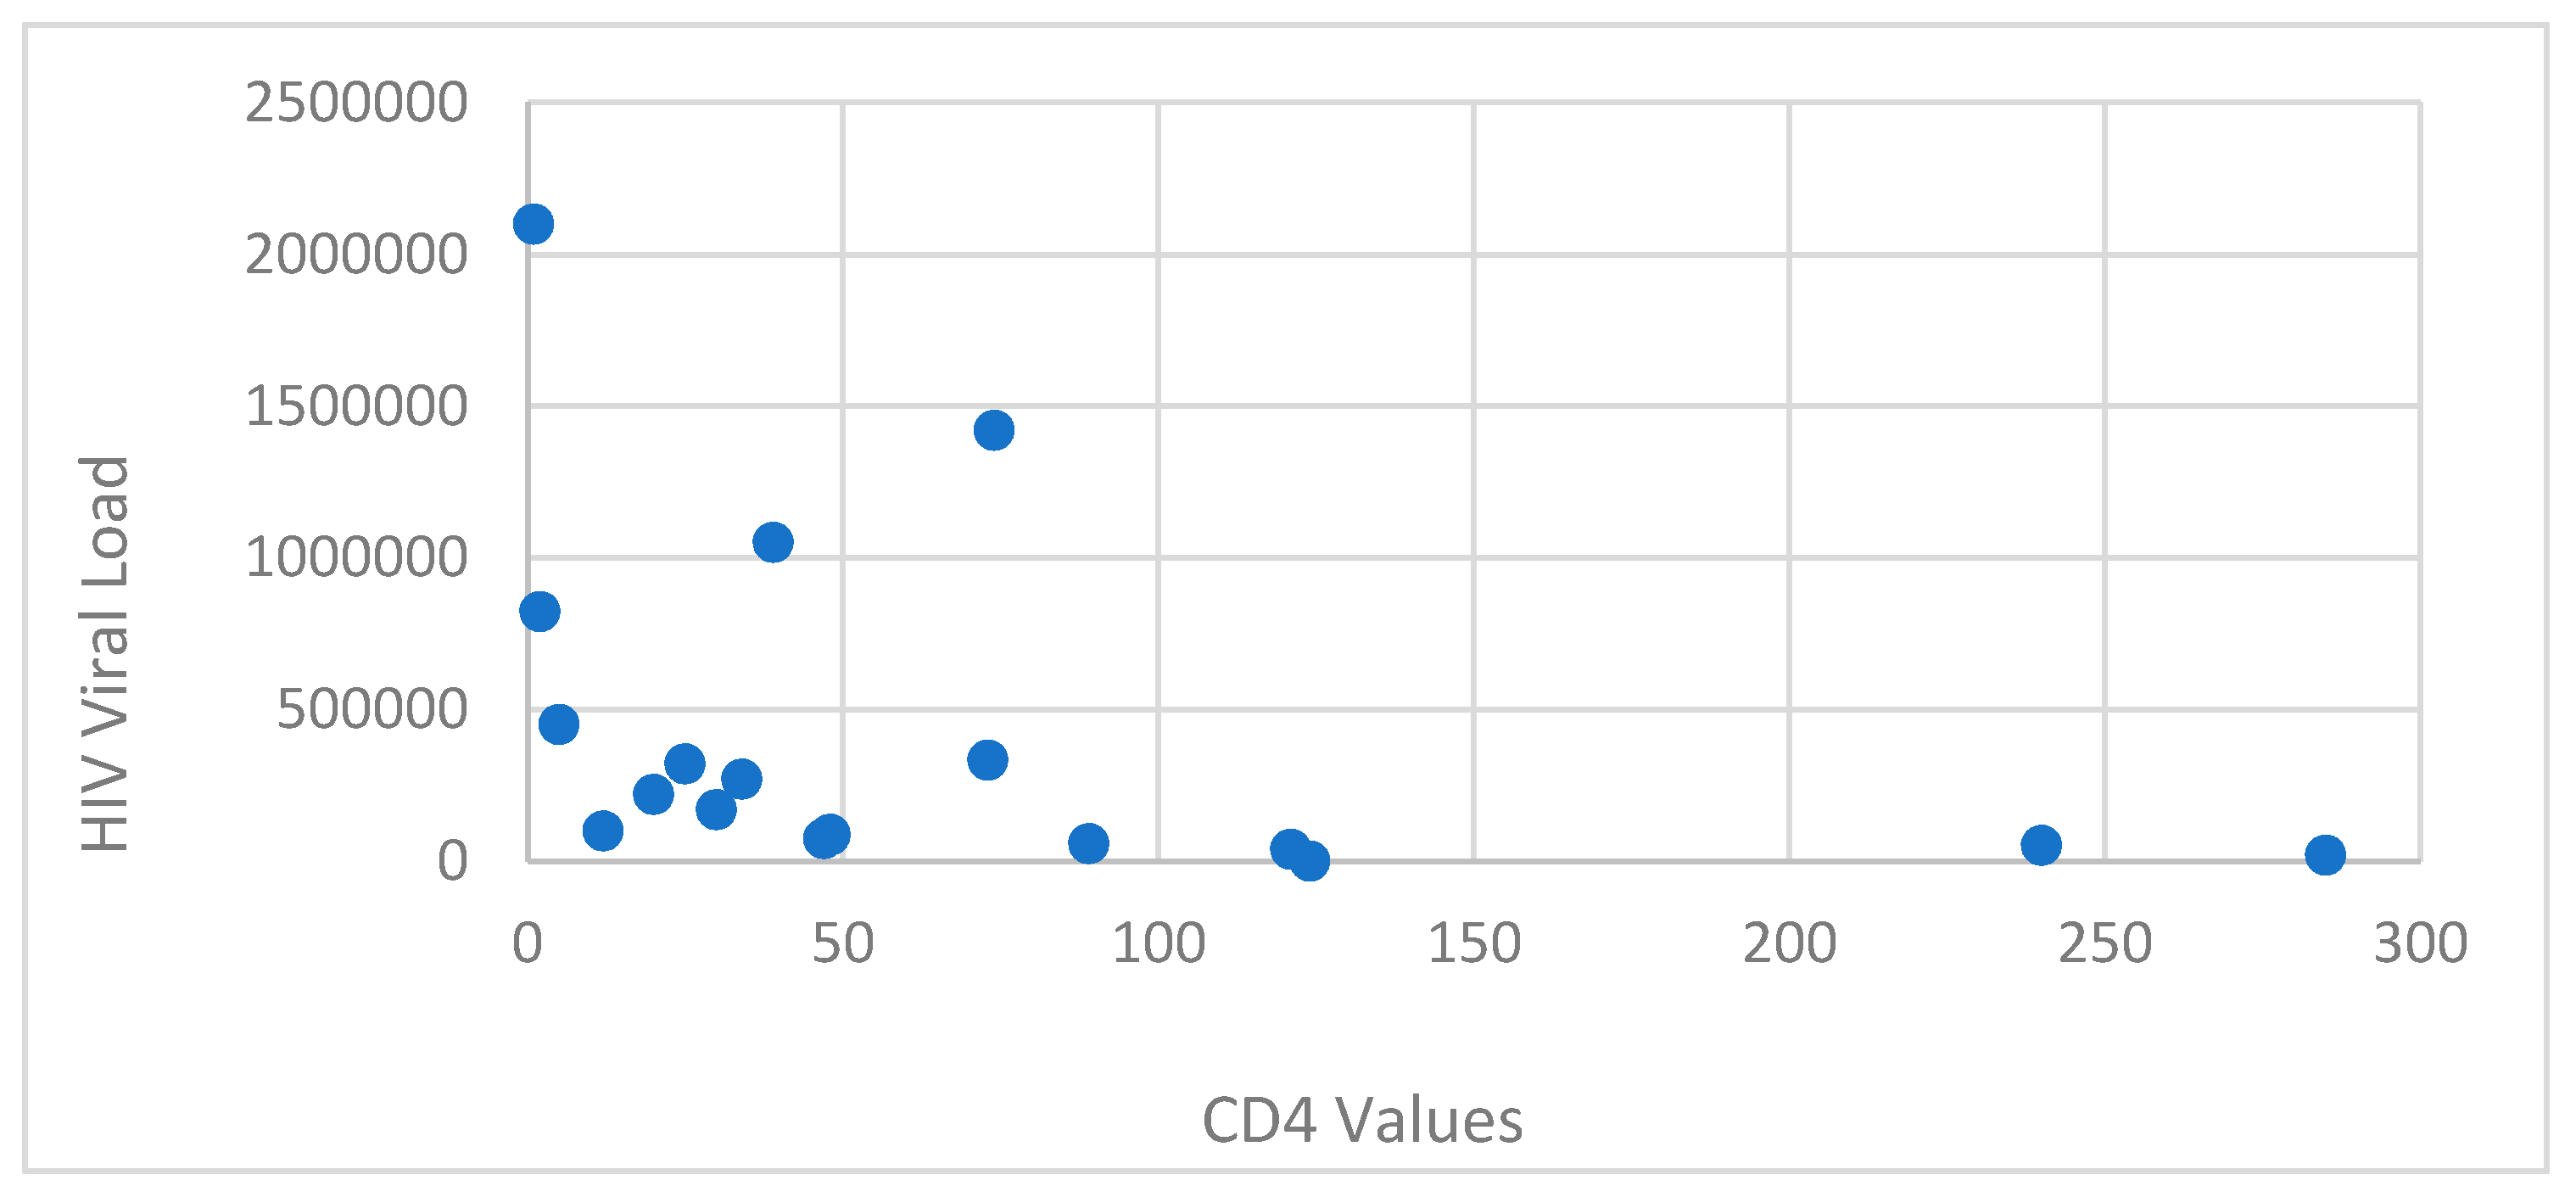
The patients presented a deficient viro-immunological status. It was observed that 89.47% (17 cases) had a CD4+ T-lymphocytes level between 1-199 cells/μl, 10.52% (2 cases) had CD4+ T-lymphocytes value between 200-499 cells/μl, with an average CD4+ T-lymphocytes level of 106.05 cells/μl. Cases with Ly T CD4+ >500 cells/μl were not recorded (
Table 4,
Figure 3,
Figure 4).
Based on sex correlated with CD4+ T-lymphocytes level, the most affected were females, with a lower CD4+ T-lymphocytes level overall. The average HIV viral load was 403 844.2 copies/ml.
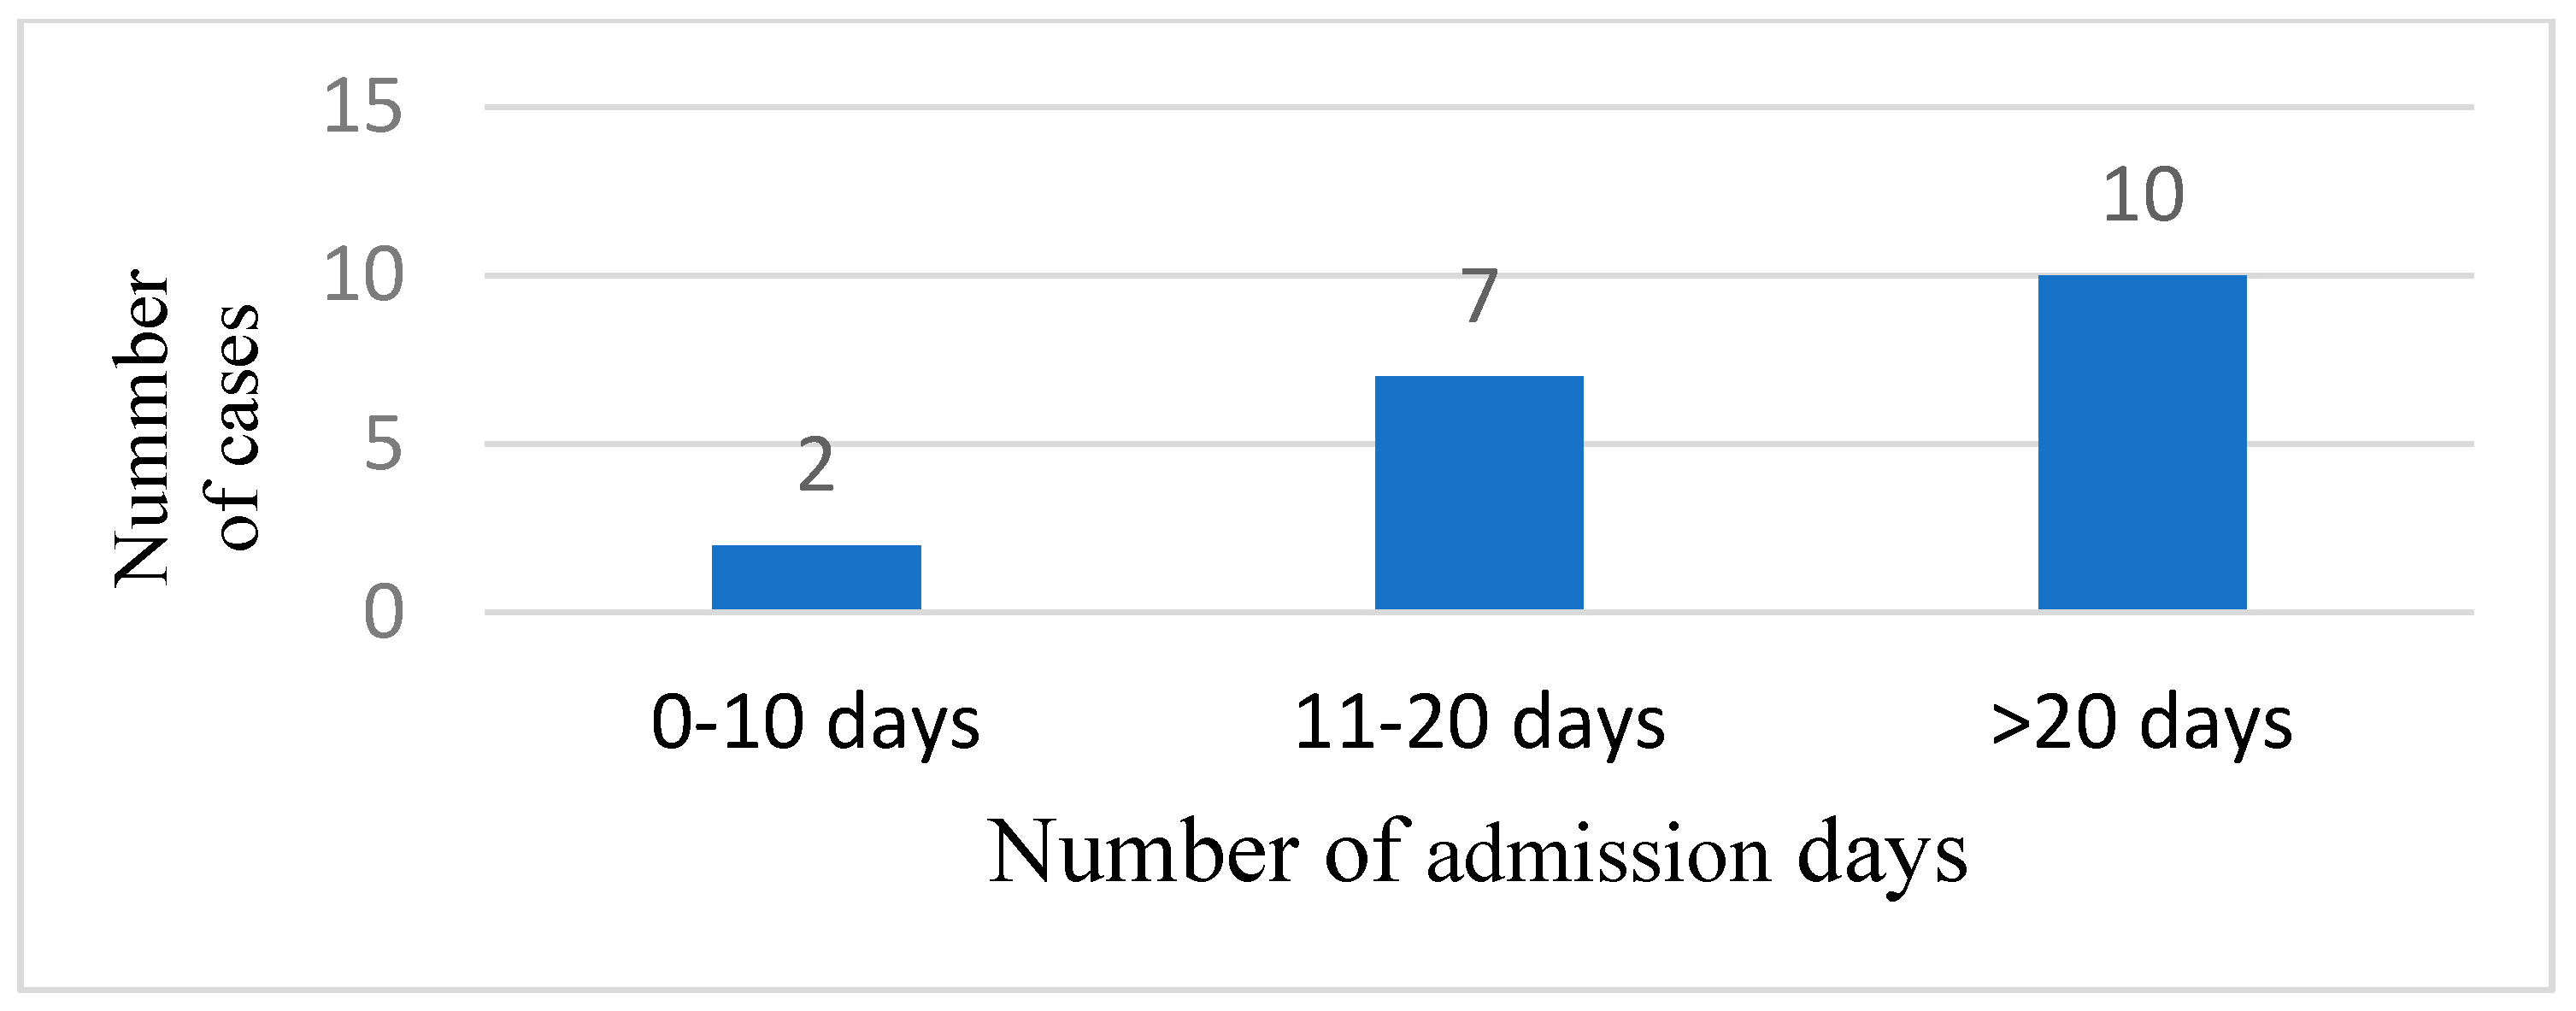
Most of the patients needed more than 20 days of admission in 10 cases (52.63), 7 cases (36.84%) were admitted between 11 and 20 days, and 2 cases (10.52%) were admitted between 0 and 10 days (
Figure 5). The mean admission day number was 17.73 days.
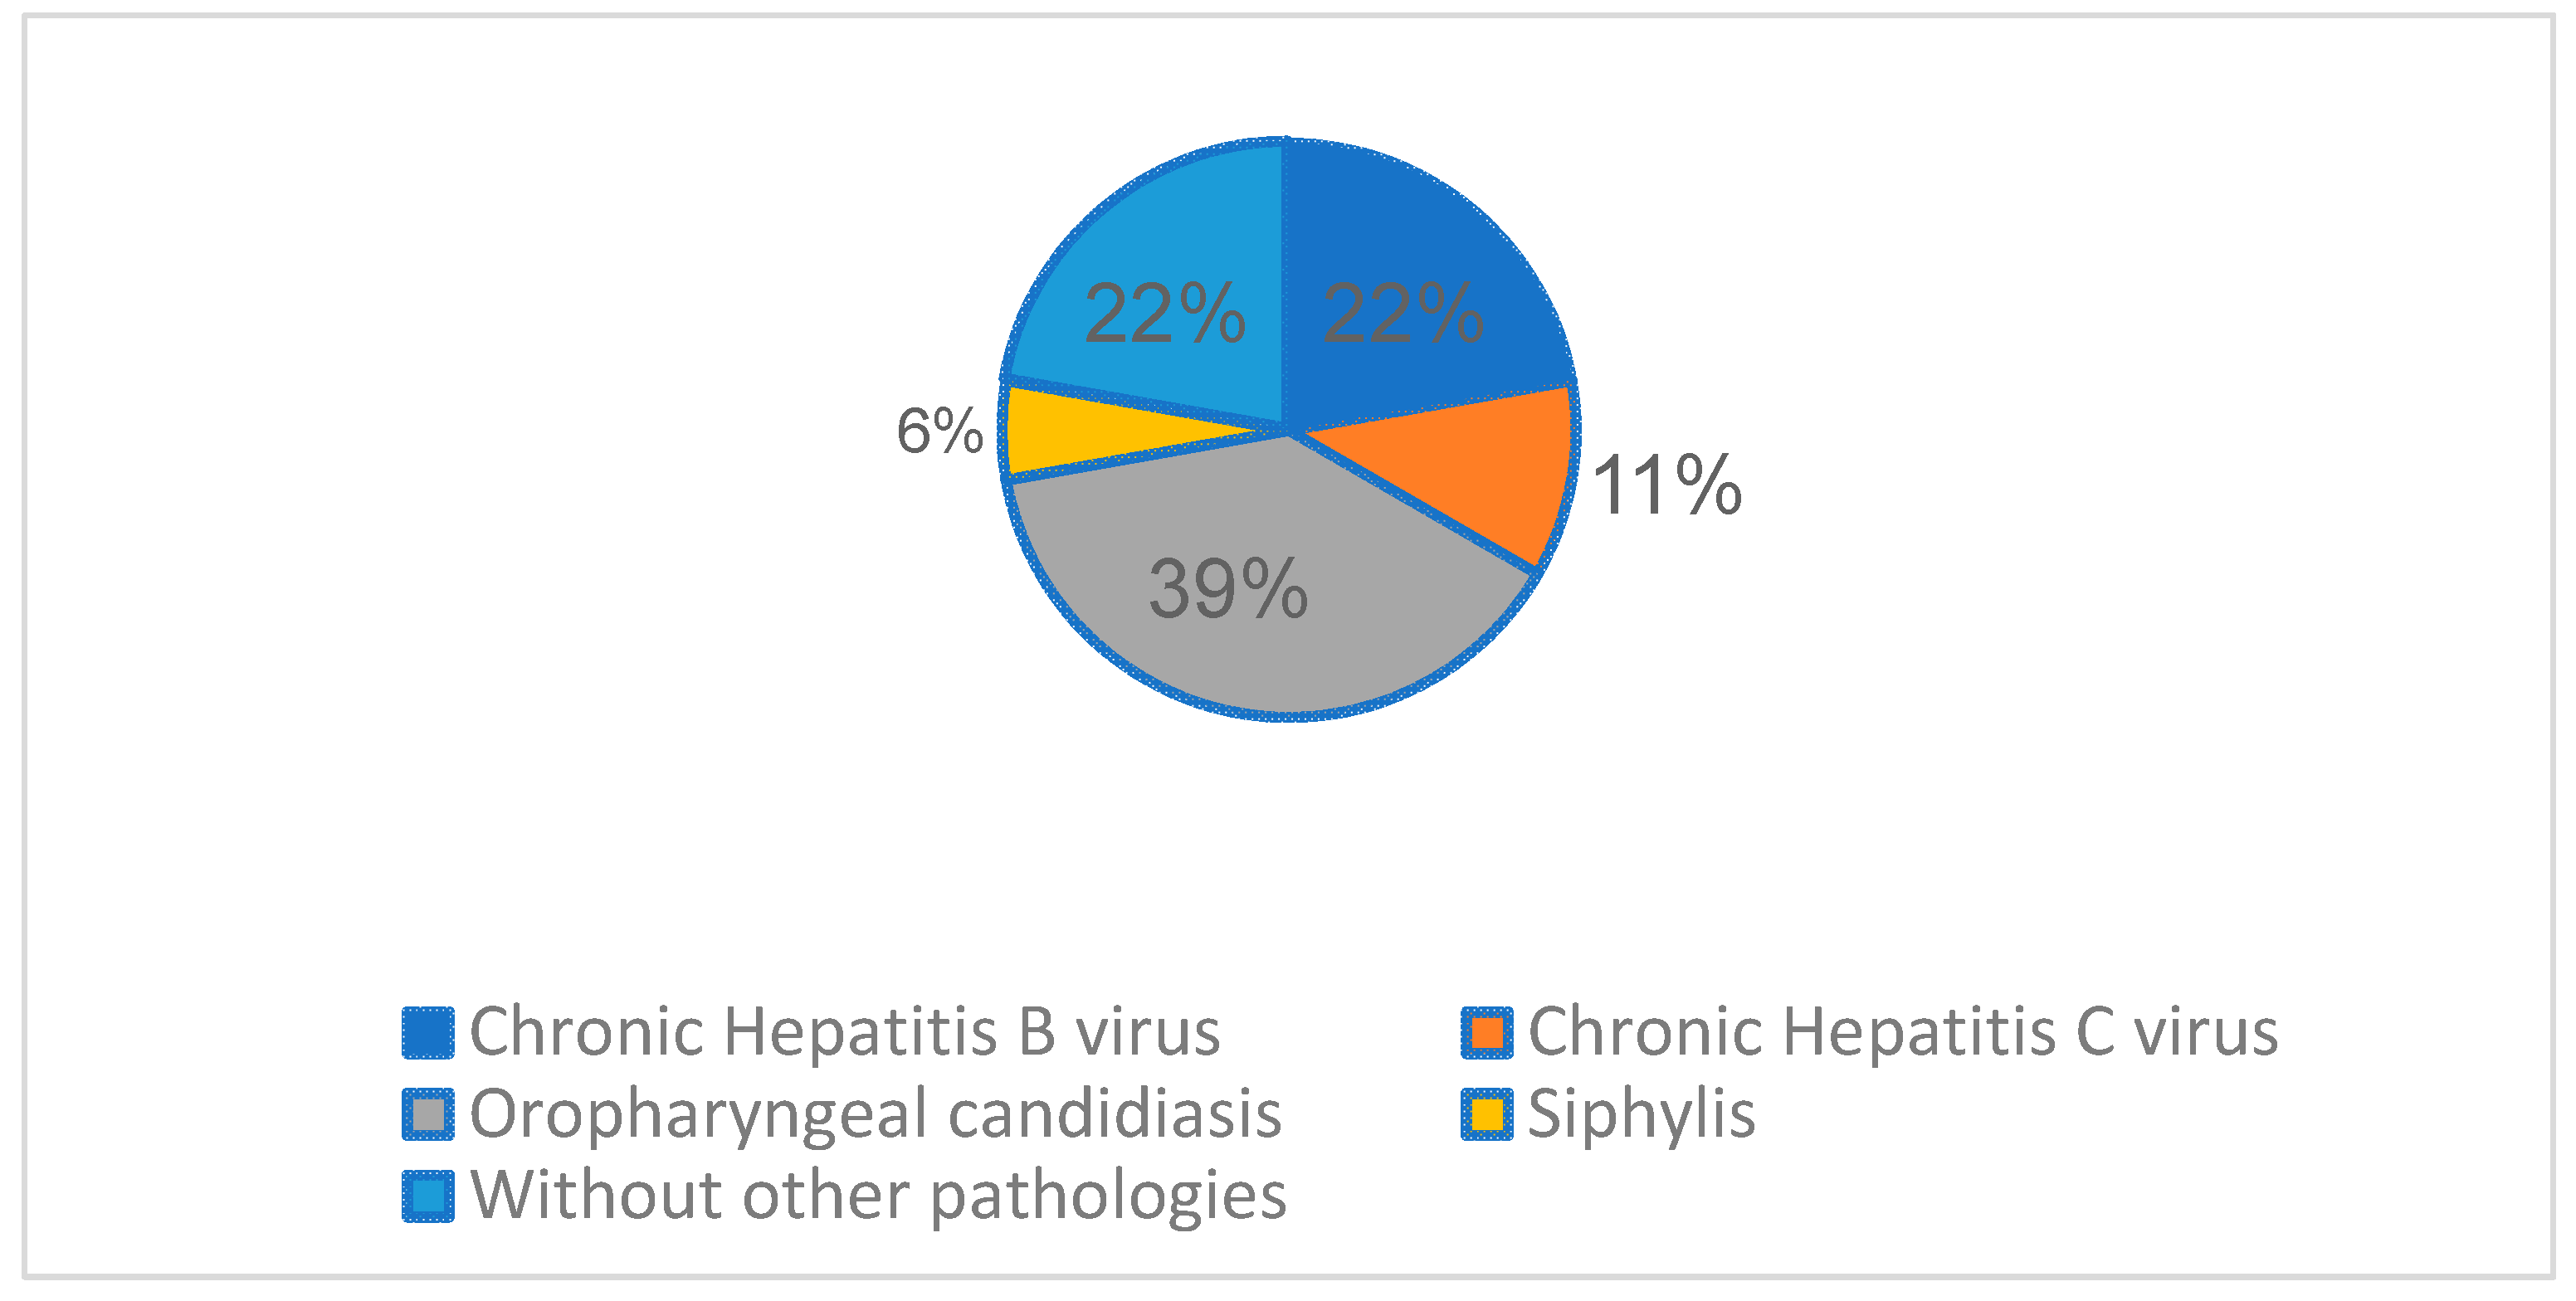
The most frequent associated infectious pathology registered, besides HIV and TB, was Oropharyngeal candidiasis (7 cases,36.84%), followed by chronic hepatitis B virus (4 cases, 21.05%), chronic hepatitis C virus (2 cases, 10.52%), and 1 syphilis co-infection case (5.26%).
Figure 6.
Other associated infectious pathology registered.
Figure 6.
Other associated infectious pathology registered.
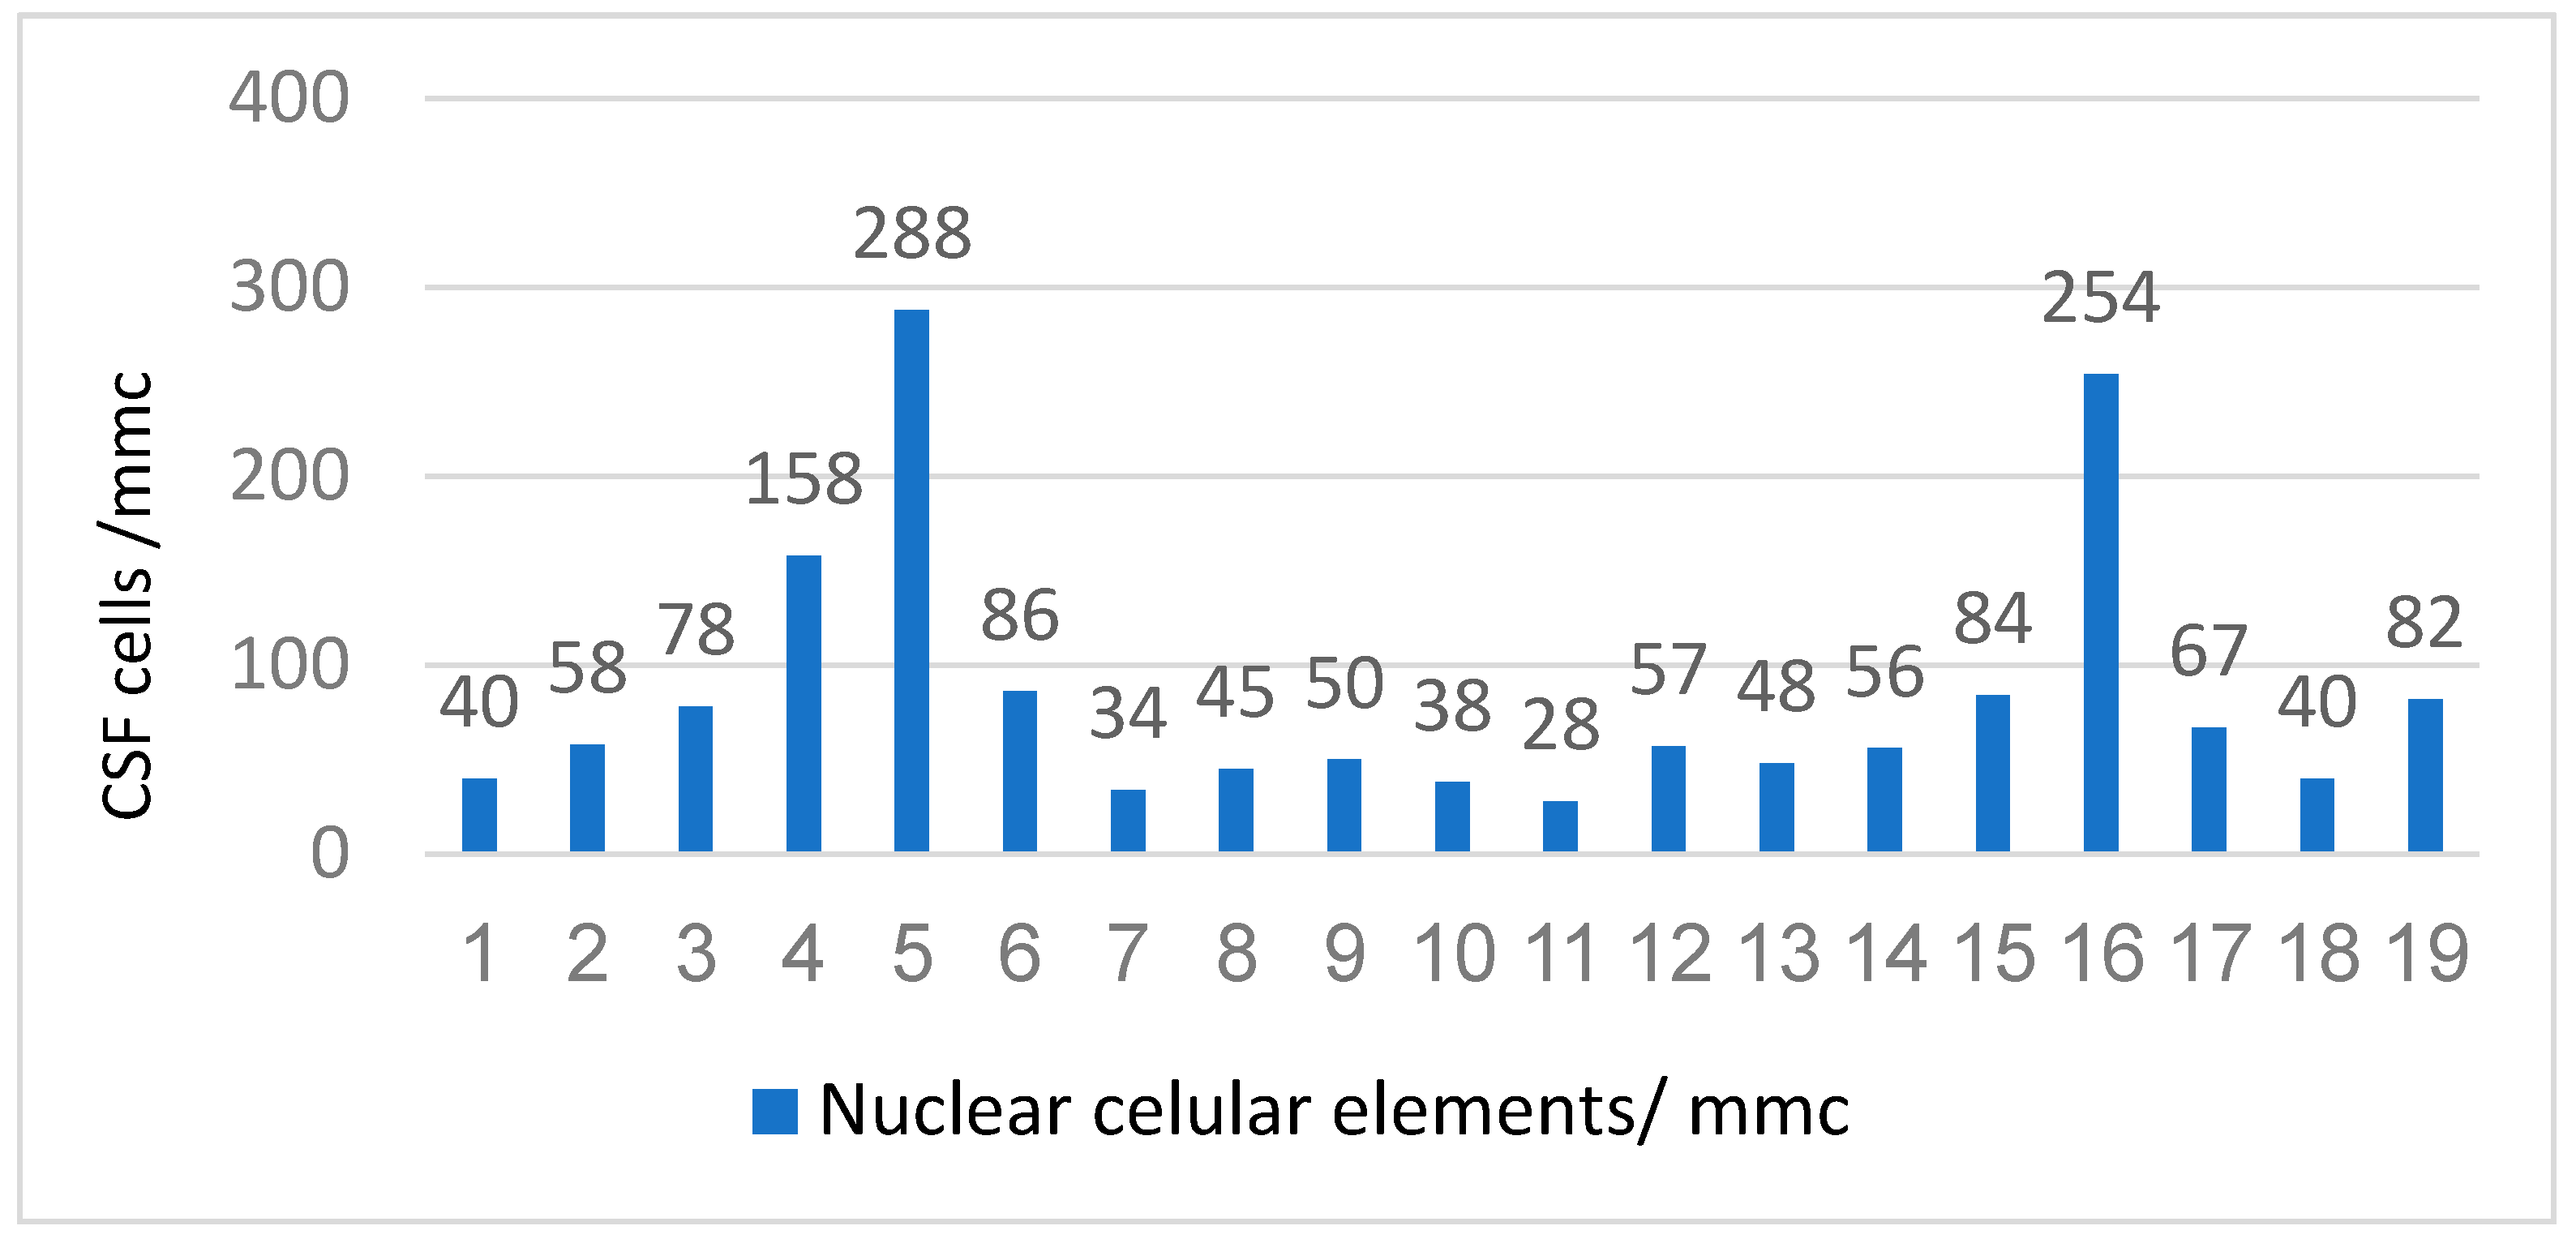
From the perspective of the laboratory features, in our study, we investigated CSF findings, Cytological examination (quantitatively and qualitatively), and biochemistry (glycorrhagia, albuminorrhagia, and chlororrhagia). The quantitatively cytological examination of the CSF showed that the majority of the patients had pleocytosis of the order of "tens" (16 cases, 84.21%) and 3 cases had pleocytosis of the order of "hundreds" (20.22) (
Figure 7). The mean value of the nuclear cellular elements was 83.73 cells/ mmc.
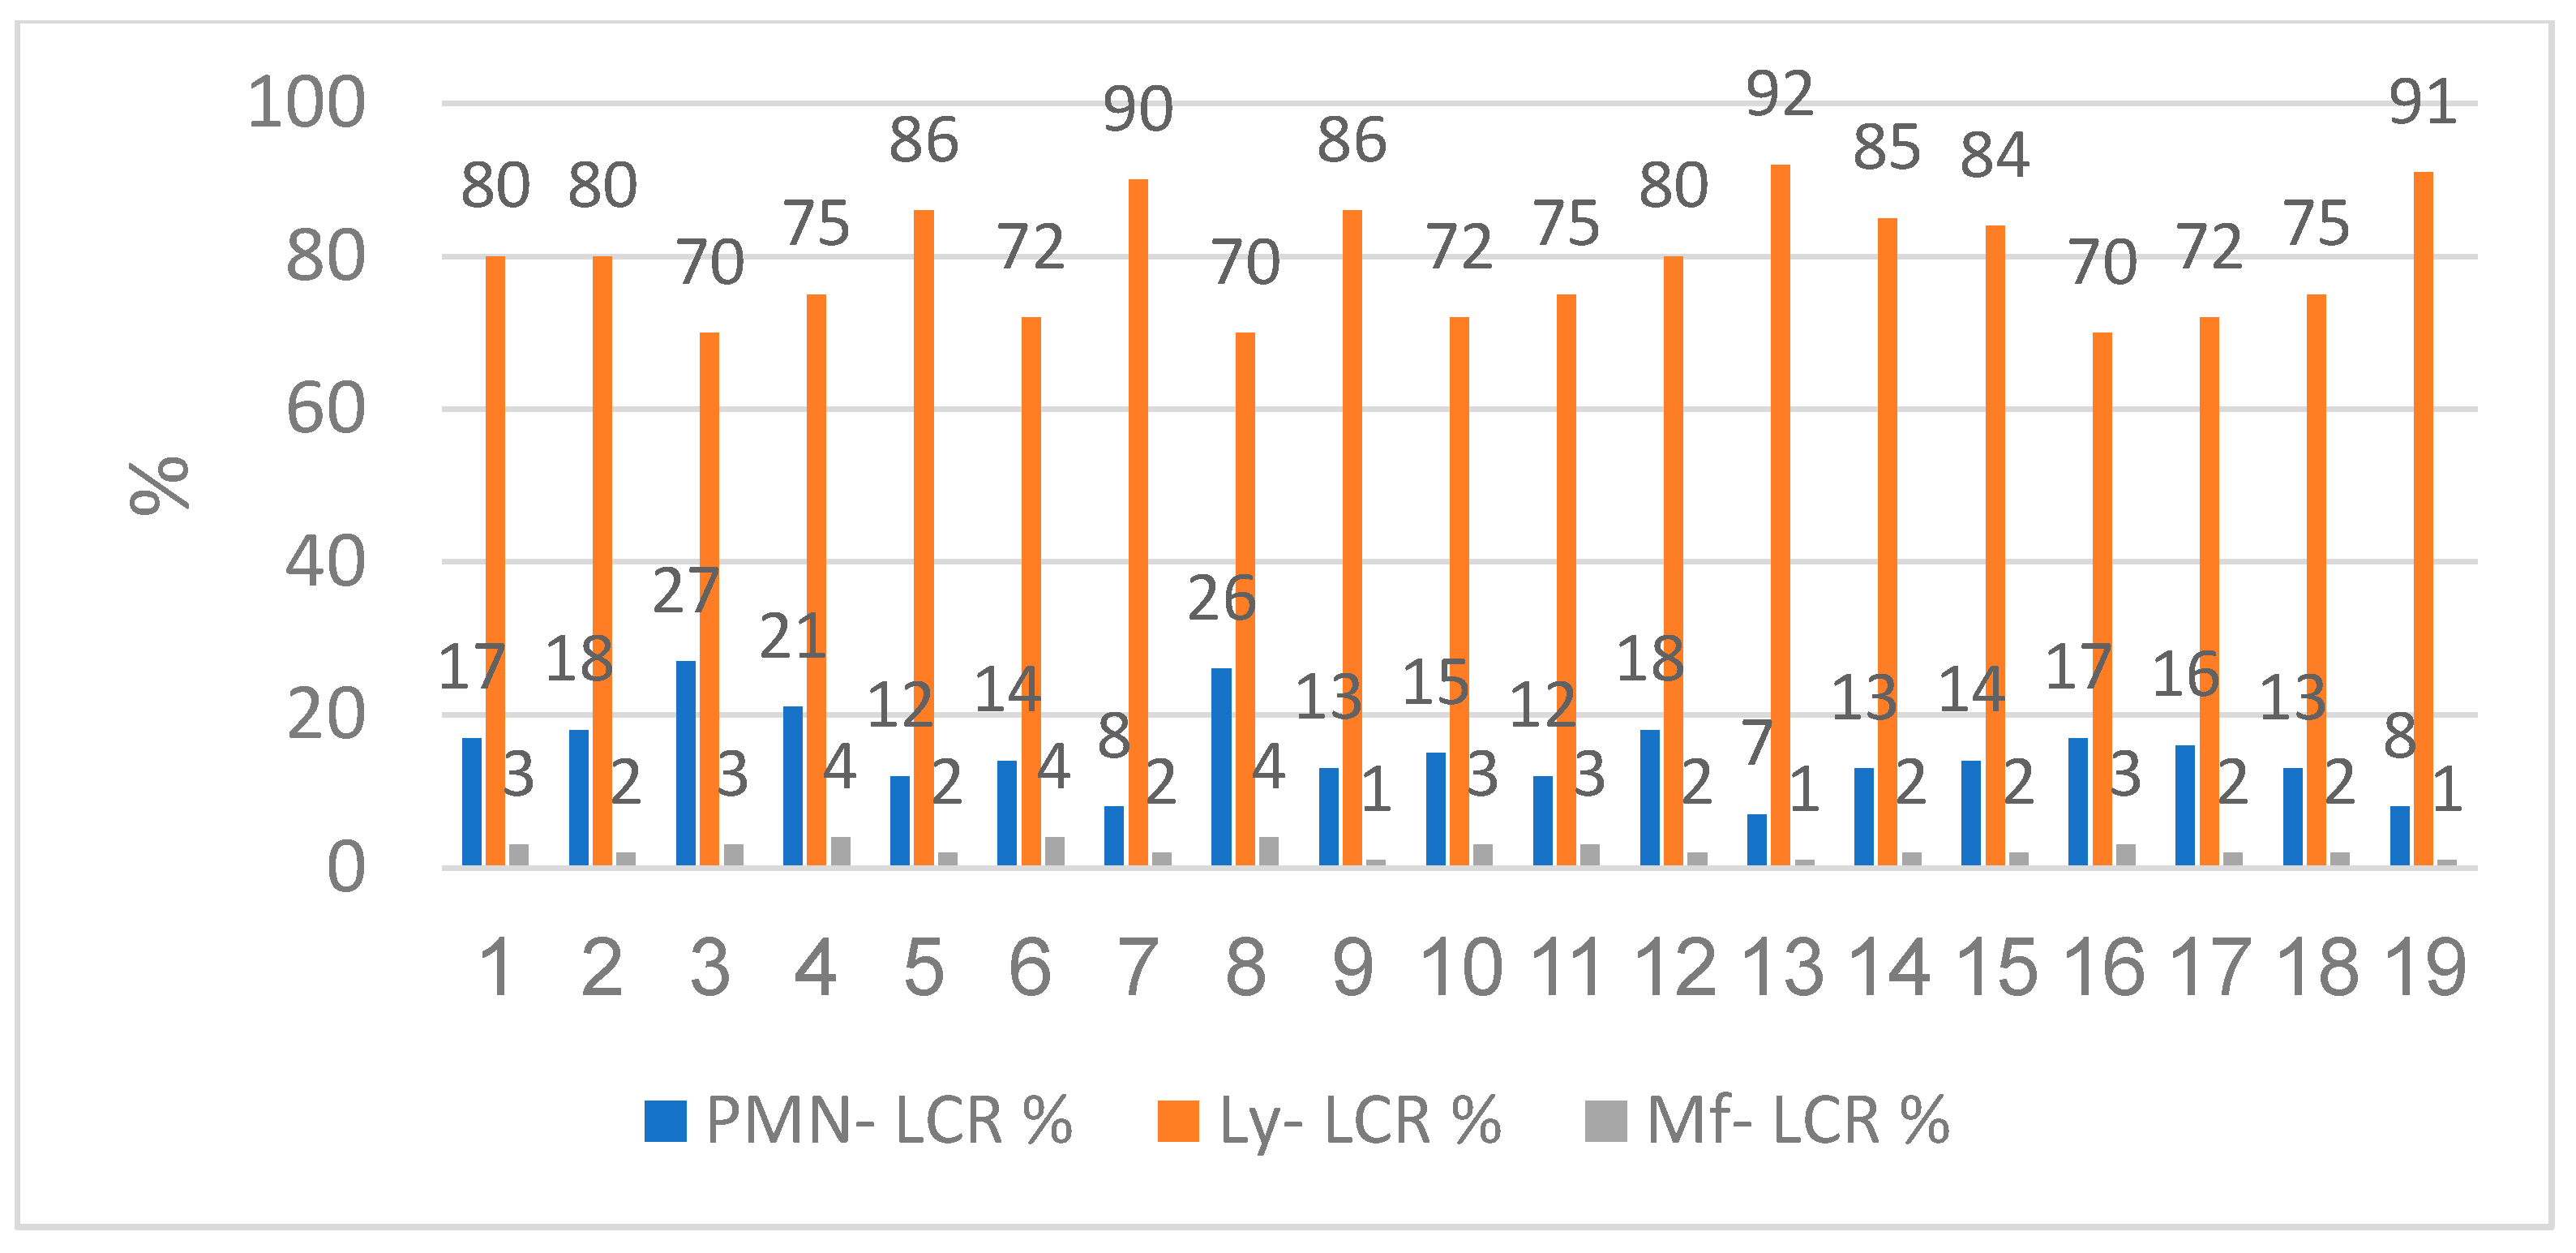
The qualitatively cytological examination showed us that the patients had lymphocytic predominance with low neutrophils and macrophages. The lymphocyte range was between 70% and 92% with a mean value of 79.21%. The neutrophil level was between 7% and 27%, the mean value was 15.21%. Macrophages were contained between 1% and 4%, the average value was 2.42% (
Figure 8).
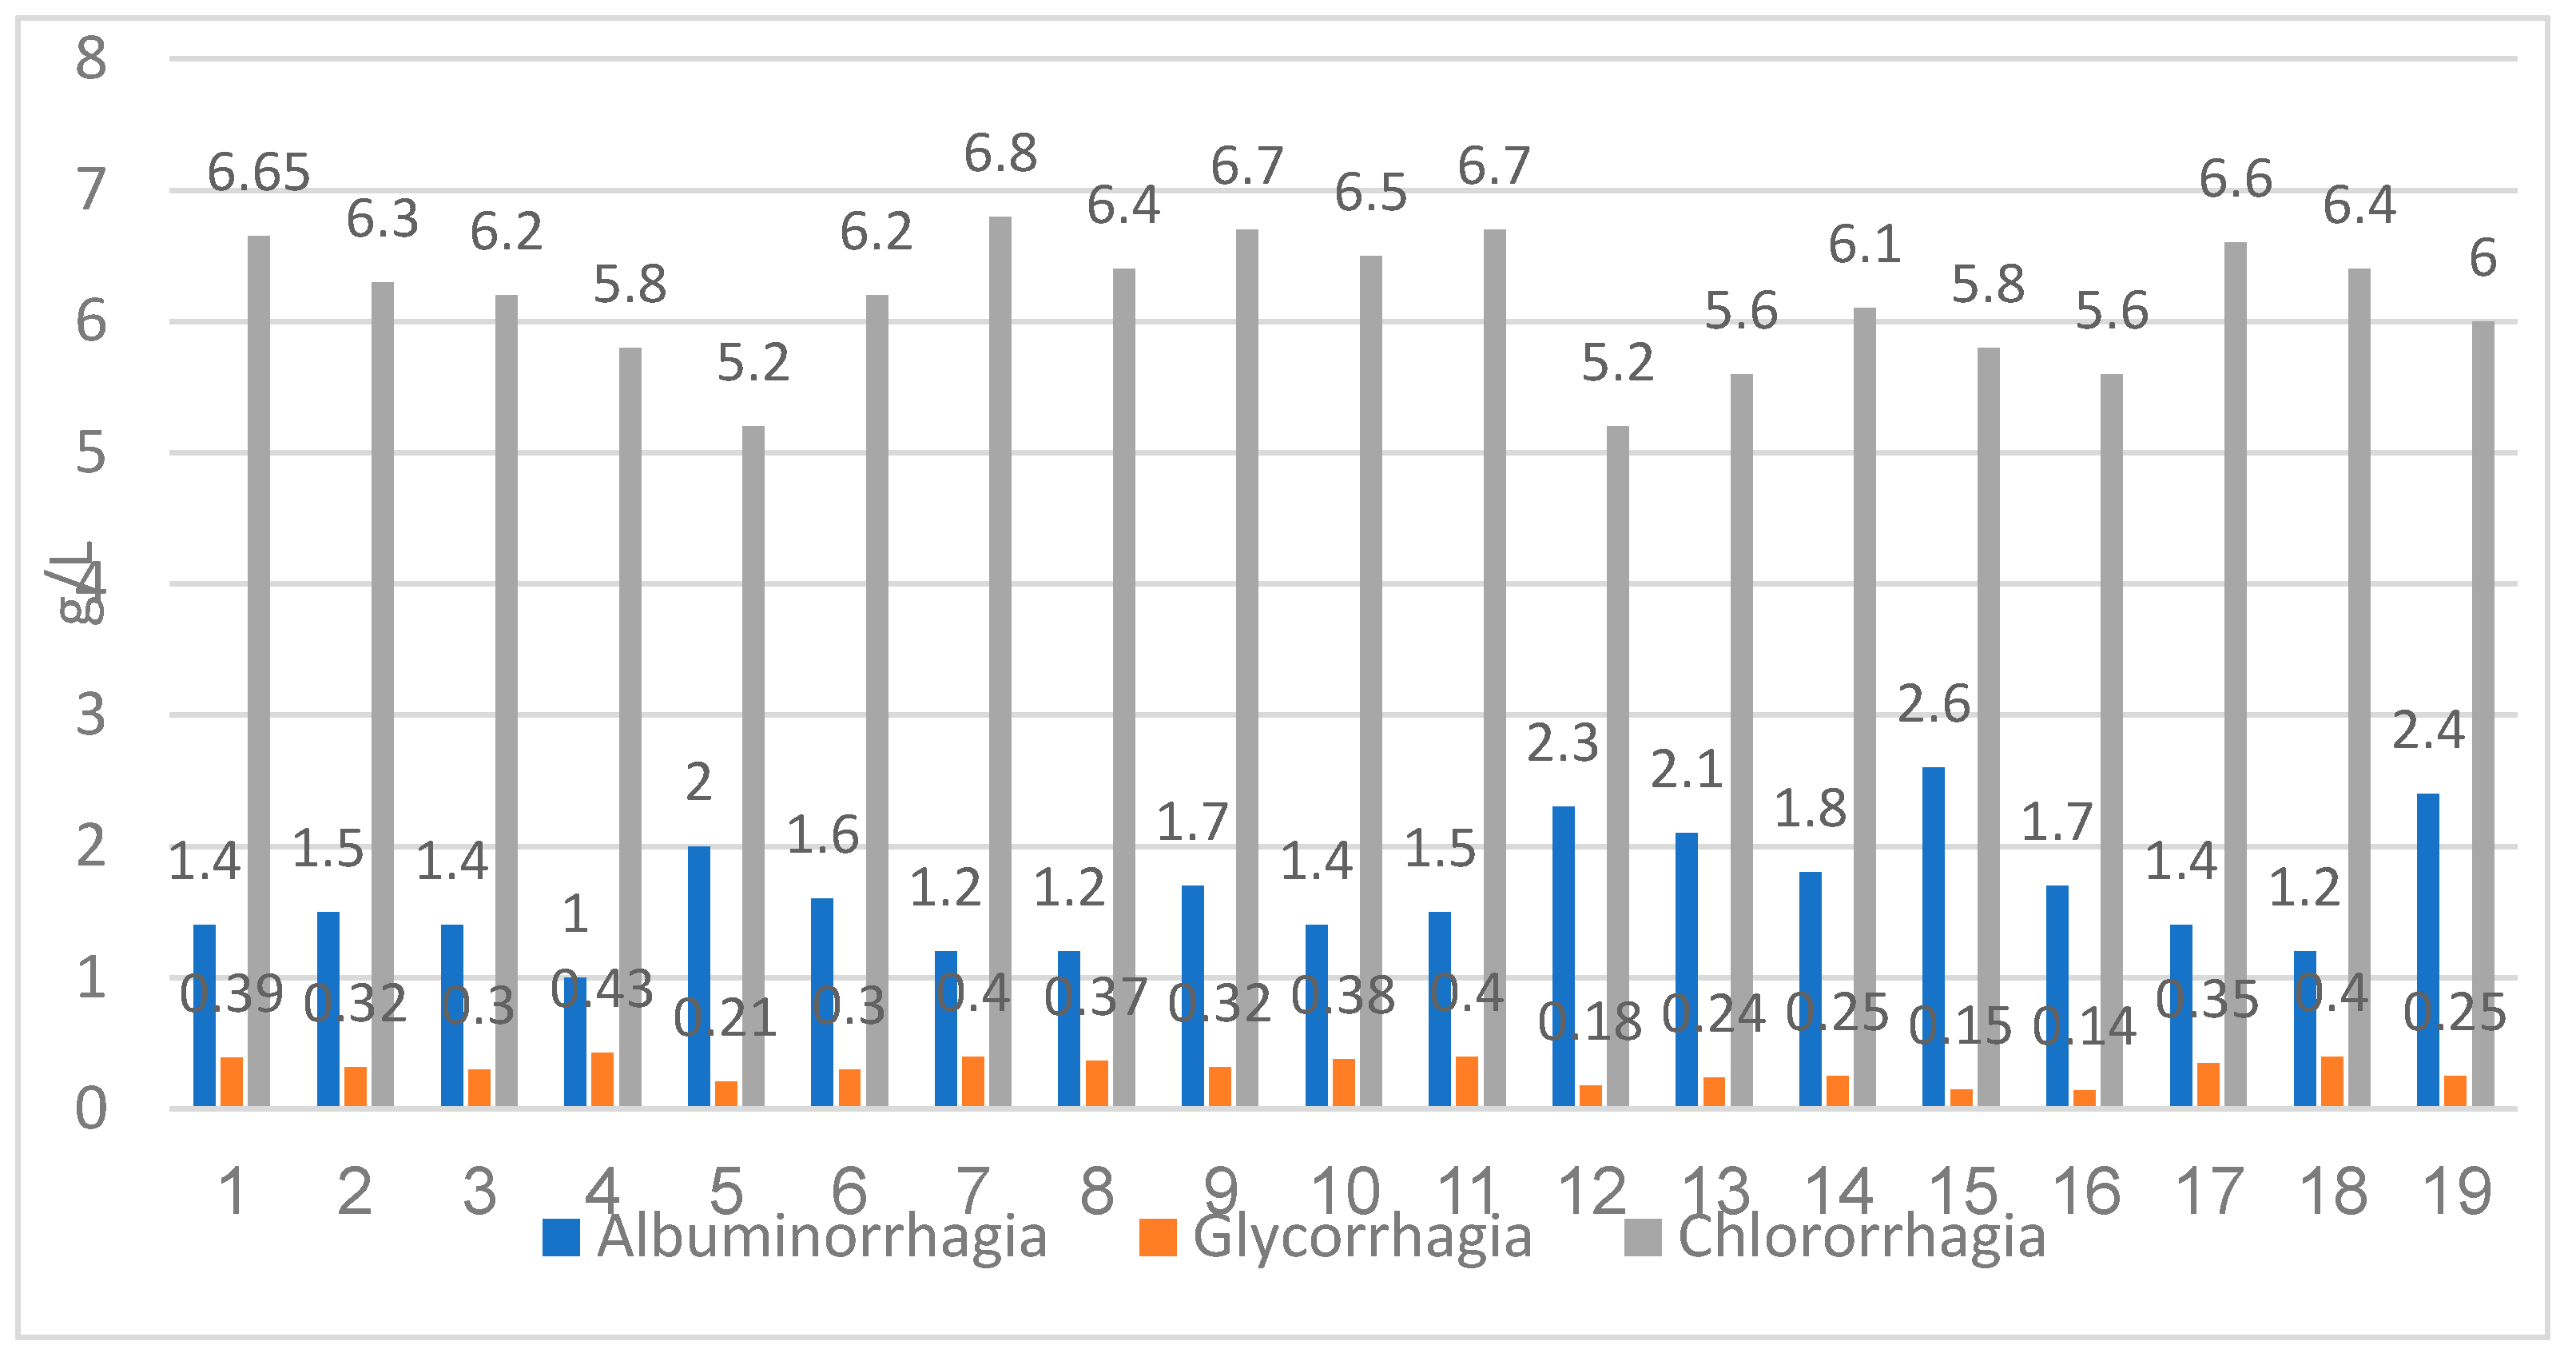
The evaluation of the CSF biochemistry showed an increased albuminorrhagia value between 1.0 g/L and 2.1 g/L, with a mean value of 1.65 g/L. Glycorrhagia was also increased, between 0.14 g/L to 0.43 g/L, the average value was 0.30 g/L. Chlororrhagia was decreased with values between 5.2 g/L and 6.8 g/L, the mean value was 6.14 g/L (
Figure 9).
In the study group, it was observed that a third of the males had an abnormal ALT (15.78%) and almost a half had abnormal AST (21.05%); as for the females, almost a third had an increased value of ALT or AST respectively (15.78% and 21.05%). Of the 15.78% of the males with an abnormal ALT/AST value, 5.26% (1 case) had hepatitis B, 5.26% (1 case) had hepatitis C, and only 5.26 (1 case) declared occasional alcohol consumption. Of 15,78% of female patients with abnormal AST/ ALT, 15.78% (3 cases) had hepatitis B, 5.26% (1 cases) had hepatitis C, and only 10.52% (2 cases) declared occasional alcohol consumption. The rest of the patients did not have an identified cause of elevated transaminase values (
Table 5).
The patients that were already in our evidence, before the admission, had different ARV regiments. Most of the patients had protease inhibitors (7 cases, 46.15%), others had integrase inhibitors regimens (5 cases, 38.46%) and 1 case (7.69%) had classic combined therapy (2 non-nucleoside reverse transcriptase inhibitors+ 1 nucleoside reverse transcriptase inhibitors) (
Table 6).
7/7 DOTS assessment and initiation were established in collaboration with the pneumology service. At 2-3 weeks, antiretroviral therapy was initiated for late-presenting cases, depending on the clinical evolution.
Interruption of ART was made for the patients already in the center's records during antituberculosis therapy to avoid immune reconstitution inflammatory syndrome, later with the resumption of the regimen adapted according to the clinical evolution in accordance with the guidelines' recommendations.
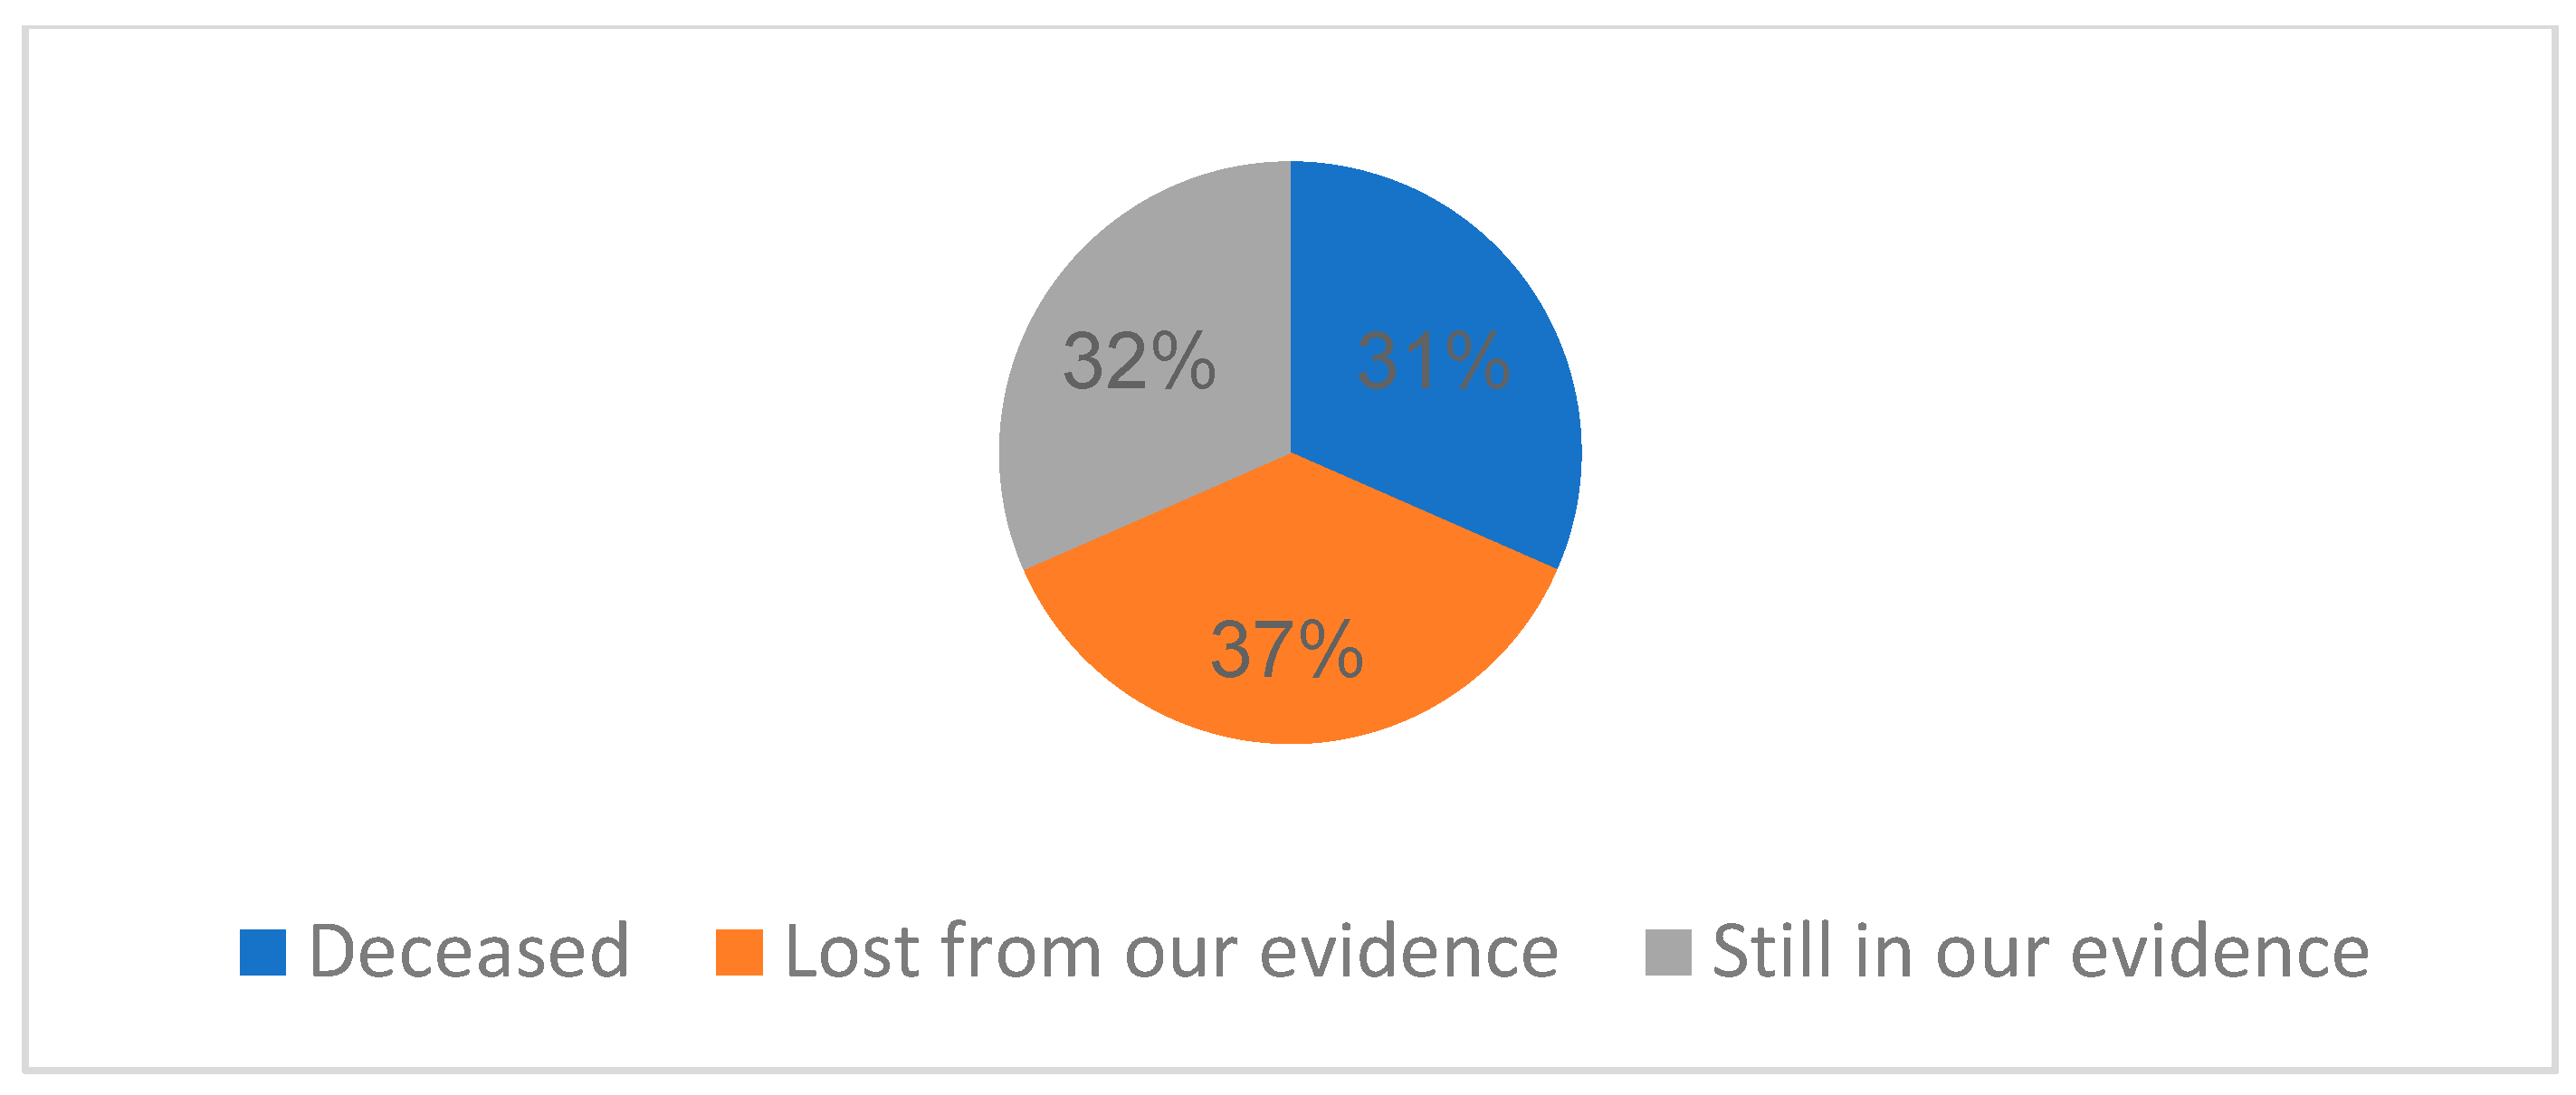
From the point of view of the evolution of the cases, 31.57% of cases had deceased (6 cases), 36.84% of patients (7 cases) were lost from our evidence, and 32% are still in our present evidence (
Figure 10).
The patients were evaluated after one year, and the viro-immunological status showed (
Table 7,
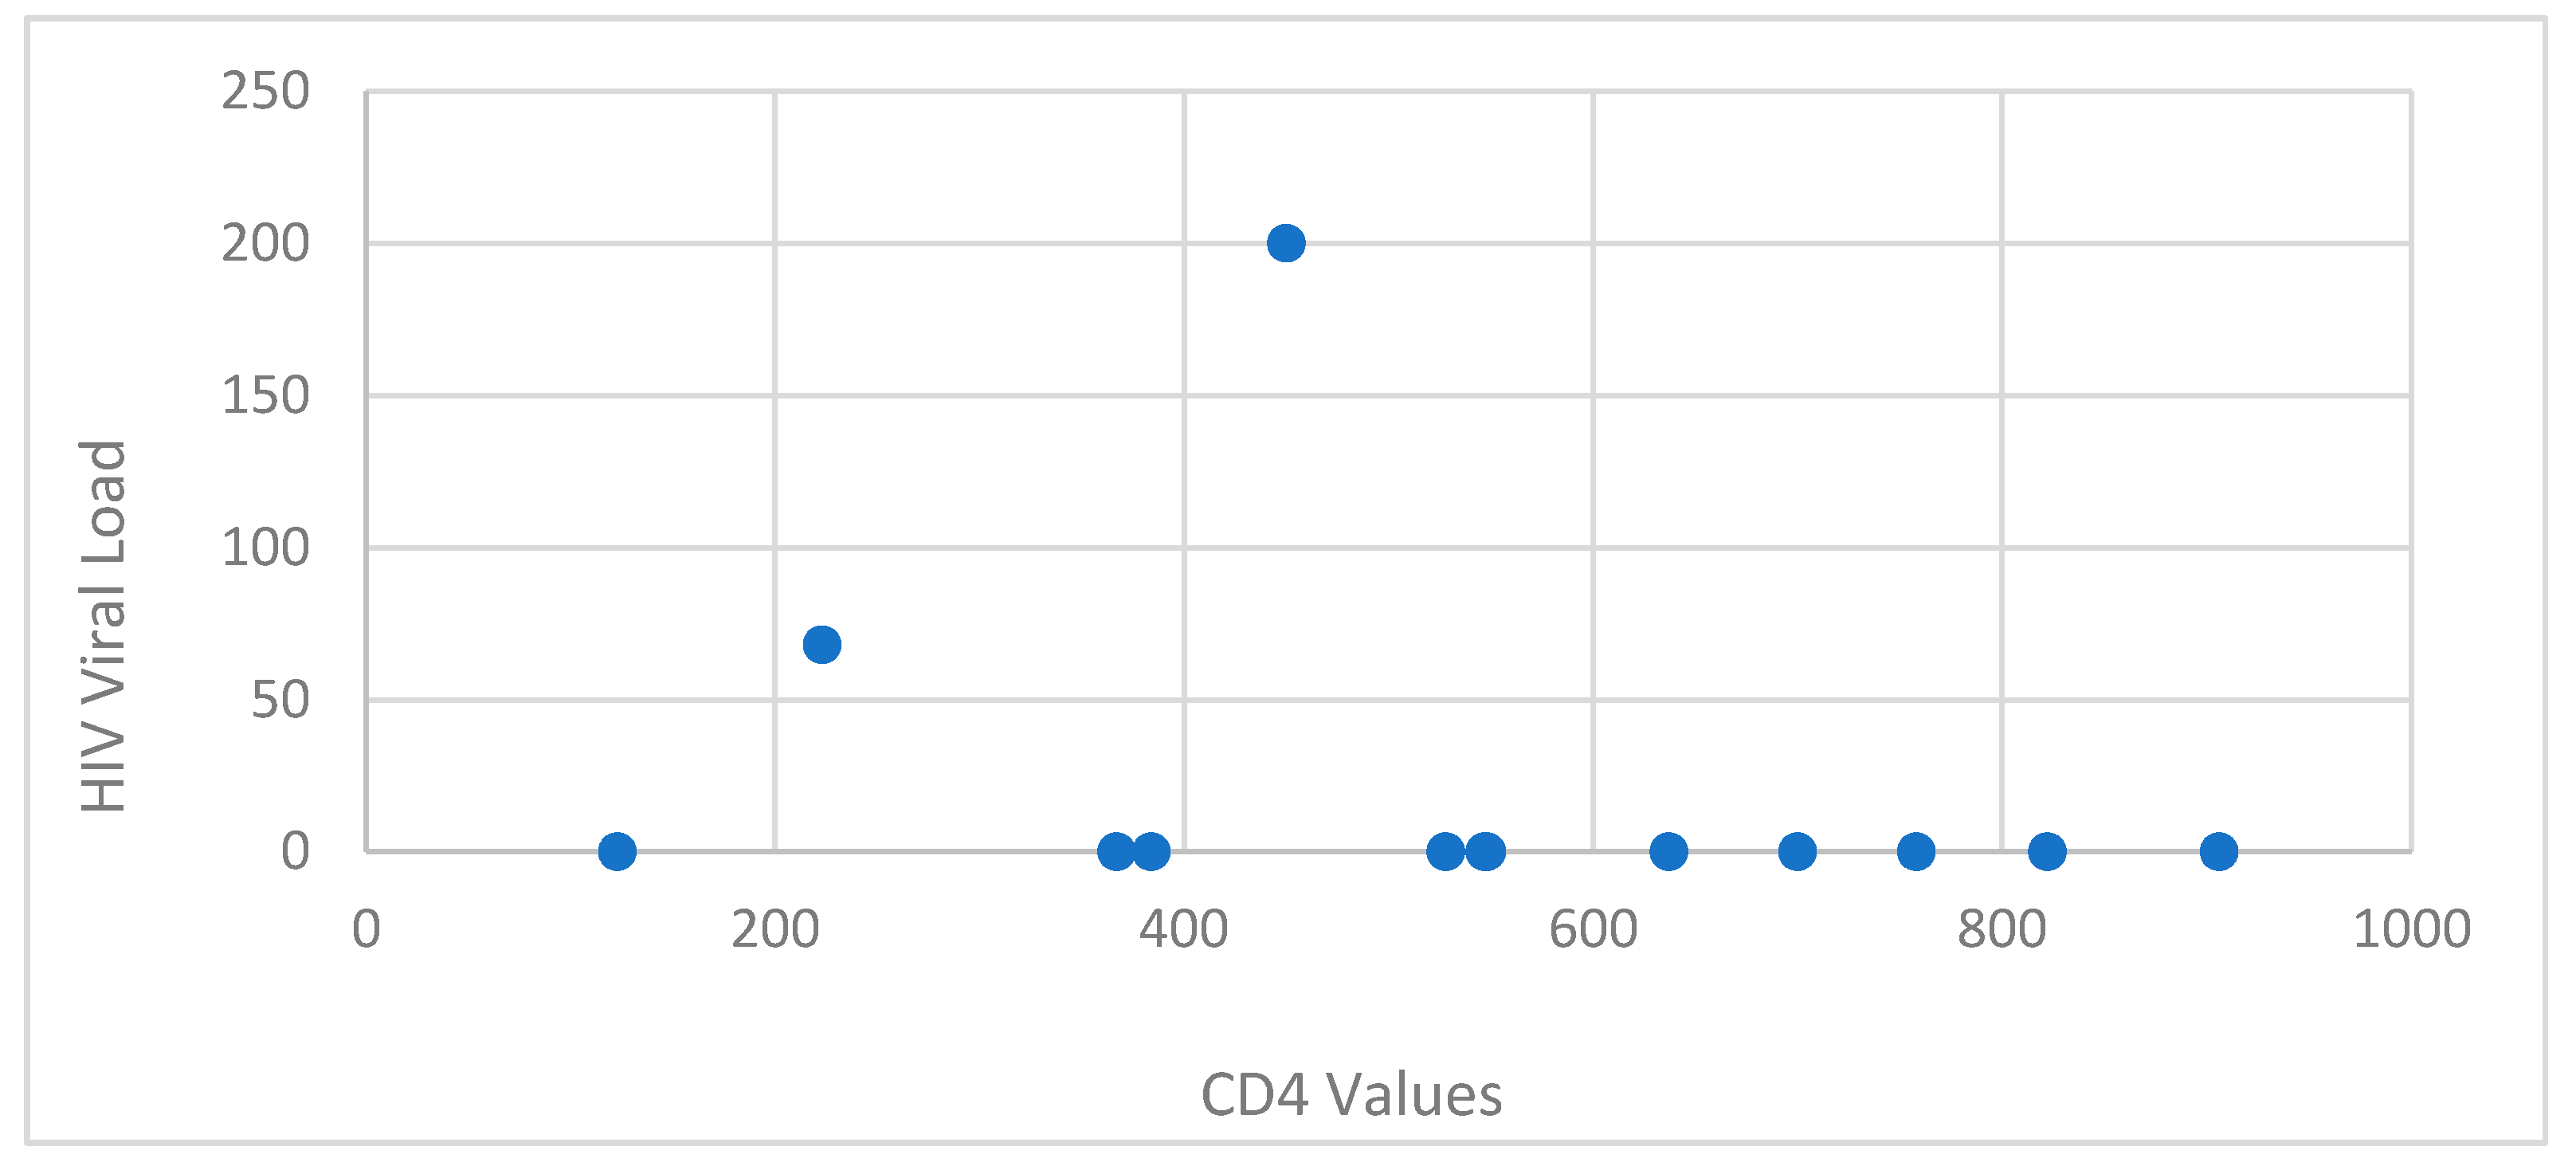
Table 8) an increased CD4+ T-lymphocytes level and a significant decrease in HIV viremia. As such, from the 13 patients that remained alive, 1 patient (7.69%) had a CD4 value between 1 and 199 cells/μl, 4 patients (30.76%) had a value between 200-499 cells/μl, and 8 patients (61.53%) had a value above 500 cells/μl. The median CD4 value was 537.92 cells/μl. The average HIV viral load was 20.61 copies/ml, 2 patients (15.38%) were with detectable viremia. In both sexes, most cases had a CD4+ T-lymphocyte level >500 cells/μl (
Table 7,
Table 8 and
Figure 11).
4. Discussion
TB remains one of the most significant socially neglected diseases because of its associations with prejudice, delayed diagnosis, limited access to therapies, and subpar follow-up. When linked to HIV infection, it significantly challenges the global and national health systems [
10].
Lawn et al. concluded that although early ART has been proven to be beneficial in various approach trials looking at the best timing of ART during opportunistic infections, the exceptions include those studies including patients with severe CNS infections in resource-constrained settings. Thus, it is evident that there are multiple correct responses to the question of the ideal timing. The timing of ART is simply one part of a complicated package of care that must also include the best possible care for the opportunistic infection in question, the best possible care for any concomitant conditions, and the best possible care for preventing the development of subsequent opportunistic infections. The unfortunate truth may be that in the instance of TB meningitis in Vietnam, the prognosis of the patients is so bad that changes in the scheduling of ART are mainly pointless. As a result, even though efforts must be made to improve the delivery of the present level of care and diagnose patients earlier, new solutions are urgently required [
11].
Cresswell et al. enrolled 61 adults, 92% were living with HIV in their study with the median CD4 count being 50 cells/L. Rifampicin minimal inhibitory concentration (MIC) was exceeded in 11% (2/18) of standard-of-care individuals, 93% (14/15) of IV-20 participants, and 95% (18/19) of PO-35 participants. At day 14, higher serum and CSF levels were still present. Adverse reactions were not dose-dependent. They showed reassuring proof that high-dose rifampicin increases CSF and serum exposures in a population mostly made up of HIV-positive individuals without causing any additional harm. Together with data from Indonesian research, these findings support the need for a phase III trial to look into safety in a larger population and assess the effects of high doses of rifampicin on death and disability. Whether high-dose rifampicin will ever be a part of the optimal TBM treatment regimen is not decided yet [
12].
Anggraini et al. studied the differences in clinical manifestations, cerebrospinal fluid (CSF) findings, and chest X-ray results between HIV-positive and HIV-negative TBM patients. Only the CSF results had statistical differences. HIV-positive subjects had higher CSF to blood glucose ratios (0.42 vs. 0.18) and fewer leukocyte cells (41 vs. 199), whilst clinical manifestations and chest x-ray results showed no differences [
13].
Thwaites et al. showed that despite the fact that extrapulmonary tuberculosis was more likely to develop in HIV-infected patients, the neurological manifestation of tuberculous meningitis was unaffected by HIV infection. The 9-month survival rate was significantly lower in HIV-infected patients (relative risk of death from any cause, 2.91 [95%]). Although HIV infection considerably lowers survival rates, it has little effect on the neurological characteristics of tuberculous meningitis [
14].
Croda et al contained 108 cases (72% men, 36 years was the median age). Fever, headache, and meningeal symptoms were only present in 15% of patients. The extra meningeal TB rate was 48%. The median number of CD4+ cells per microL was 65 cells. Nine percent of the 90 cases showed primary isoniazid resistance, and seven percent had multidrug-resistant strains. Overall mortality was 29% while in the hospital and 41% after 9 months. Mortality at 9 months was correlated with tachycardia and a history of HAART. The 9-month survival rate was 22%. They concluded that clinical and laboratory symptoms lacked specificity. Severe immunosuppression and widespread TB were prevalent. High mortality and a low 9-month survival rate were observed. [
15].
Boonyagars et al. did a retrospective cohort analysis on adult patients who received treatment at Thailand's Navamindradhiraj University's Vajira Hospital between January 2005 and December 2016 and whose final diagnosis was TBM. The final number of participants in the study was 174. 97 of them (55.75%) tested positive for HIV. There were larger percentages of patients under 40, those with low body mass indexes, those with a history of tuberculosis infection, and those who were also co-infected with the hepatitis C virus in HIV-infected TBM patients. Compared to HIV-uninfected TBM patients, the success rate of treatment was lower in HIV-infected TBM patients. Future research is required to identify the clinical markers for worse survival outcomes in HIV-positive TBM patients since HIV infection reduces the likelihood that TBM patients would respond favorably to treatment. They concluded that the findings of the present investigation show that HIV infection does not affect TBM radiological signs, CSF profiles (apart from increased CSF protein in HIV-infected patients), or neurological characteristics. Their results enable the elimination of clinical variables that were similar in HIV-infected and HIV-uninfected TBM patients. HIV infection lowers the likelihood of successful treatment and survival from an outcome standpoint. We advise early diagnosis and treatment to improve the outcome of TBM treatment. To enhance the caliber and success of TBM care, doctors may use this finding to establish early intervention plans and more potent therapeutic modalities for TBM patients, especially those who are HIV-positive [
16].
Maitre et al. did a phase III, multicenter, randomized controlled, factorial plan superiority experiment. The study was open-label for anti-TB treatment and double-blind placebo-controlled for aspirin treatment, and it contains four arms that combine the two experimental therapies (intensified TBM regimen and aspirin) with the two reference treatments (WHO standard TB treatment and placebo). This study is carried out in four African nations: Ivory Coast, Madagascar, Uganda, and South Africa, in adults or adolescents aged 15 years with TBM characterized as "definite," "probable," or "possible" using Tuberculosis Meningitis International Research Consortium criteria. All-cause mortality between inclusion and week 40 is the main result. Even while some other studies supported the intravenous method to boost rifampicin CSF exposure, we purposefully chose to limit the use of this route to malabsorption in order to evaluate the effectiveness of a widely repeatable and practical high-dose oral strategy on a global scale. We chose an aspirin dose that is readily available (200 mg daily) because it is closest to the one (150 mg daily) that lowers TBM mortality. Through a strong European and African partnership, the INTENSE-TBM trial offers a significant chance to improve the efficacy of TBM treatment with widely accessible old medications, particularly in high-incidence areas for both TB and HIV. The trial's design is practical, and the findings would allow for quick and efficient applications in the treatment of TBM patients, which would be simple to implement in nations with high rates of both TB and HIV [
17].
Pormohammad et al. included twenty studies in their review. In adult TBM patients, the combined HIV prevalence was 38.0% HIV infection was present in 6.0% of children (under the age of 15). In patients with bacterial meningitis other than TBM, the prevalence of HIV infection was 36.0%. They concluded that adults with HIV have a much higher case fatality rate than adults without the virus. One of the most significant elements that may have contributed to the high case fatality rate in HIV-infected patients with TBM is resistance to anti-TB medicines. More
M. tuberculosis isolates from HIV-positive patients had more than one first-line TB medication resistance. Additionally, there is an ongoing debate over whether antiretroviral medication (ART) should be started in individuals who are also infected with TB and HIV. Drug toxicity may be linked to early ART initiation with TB treatment, whereas delayed ART initiation may cause HIV disease progression and death [
18].
Vinnard et al. concluded that despite the beginning of effective anti-tuberculous therapy, the mortality rates of TBM remain high. The risk of TBM in an HIV-positive person increases, especially when immunosuppression is further established. Clinical traits include altered level of consciousness, cerebral infarctions, and a positive
M. tuberculosis CSF culture may be more prevalent in HIV-infected people with TBM [
19].
Garg et al. stated tuberculous meningitis is more common among HIV-positive people. Given that it is a significant predictor of death, infection by multidrug-resistant bacteria presents a significant challenge. Clinicians should be knowledgeable about the pathogenesis of infection and disease, rapid diagnosis, identification of resistant strains, ideal antituberculosis treatment regimens, adjunctive corticosteroid regimens, and the ideal time to start antiretroviral therapy in order to combat this deadly combination. The 3Is policy (intensified tuberculosis case finding, infection control, and isoniazid preventive therapy) continues to be the most effective strategy for eradicating this threat [
20].
From May 2000 to August 2003, Karande et al. did a prospective hospital-based investigation. The study included each subsequent child who was diagnosed with TBM and was admitted, ranging in age from 1 month to 12 years. It was evaluated how two outcomes—disabled survivor or death—relate to 35 features, including two demographic factors, nine clinical features, 13 neurological features, five laboratory parameters (including cerebrospinal fluid), six radiological parameters (including computed tomography scan brain), and 13 neurological features. Eight (6.5%) of the 123 TBM cases in total who were enrolled had HIV. The results were similar between the two groups. In conclusion, the only factor related to HIV infection was the presence of Hb 8 gm/dl. The presence of HIV did not influence the results [
21].
Martino et al. examined the information on 13,802 cases of TB identified in Harare, Zimbabwe, between 2013 and 2017. 9,725 (70.5%) of the 13,802 TB patients examined were HIV positive. The likelihood of being diagnosed with TB/HIV coinfection was shown to be considerably greater in females, patients aged 25 to 64, previously treated cases, and acid-fast bacillus sputum smear-negative cases. Miliary TB and TB meningitis both exhibited significantly higher odds of TB/HIV coinfection compared to nondisseminated pulmonary TB, but pleural TB and all other extrapulmonary TB had significantly lower risks. The sociodemographic and clinical variables of patients in Harare significantly affected the risk for TB/HIV coinfection. The information base about clinical markers for TB/HIV coinfection has been expanded as a result of our discovery that various kinds of EPTB have various connections with HIV coinfection. This finding can have a stronger public health influence on the elimination of TB/HIV infection [
22].
Mukuku O et al. did a cross-sectional analysis of children under 15 years who had TB treatment between January 1, 2013, and December 31, 2015. HIV-infected TB children who died and those who survived were compared statistically. There were 840 TB-positive kids in total. HIV infection was prevalent in 20.95% of people. HIV-positive children had a greater mortality rate (47.73%) than HIV-negative children (17.02%). Death during anti-TB medication was associated with age 5 years, poor nutritional condition, and a negative acid-fast bacilli test. They concluded that In Lubumbashi, pediatric settings frequently see co-infections with TB and HIV, and the significance of early management is highlighted by high mortality [
23].
Figure 1.
Distribution of TBM HIV cases by sex.
Figure 1.
Distribution of TBM HIV cases by sex.
Figure 2.
TBM HIV cases distribution by area.
Figure 2.
TBM HIV cases distribution by area.
Figure 3.
Distribution of cases by CD4+ T-lymphocytes level (cells/μl).
Figure 3.
Distribution of cases by CD4+ T-lymphocytes level (cells/μl).
Figure 4.
Distribution of HIV cases by CD4+ T-lymphocytes level and HIV viral load.
Figure 4.
Distribution of HIV cases by CD4+ T-lymphocytes level and HIV viral load.
Figure 5.
Distribution of TBM HIV cases by number of admission days.
Figure 5.
Distribution of TBM HIV cases by number of admission days.
Figure 7.
The quantitative examination of cerebrospinal fluid.
Figure 7.
The quantitative examination of cerebrospinal fluid.
Figure 8.
The qualitative examination of cerebrospinal fluid.
Figure 8.
The qualitative examination of cerebrospinal fluid.
Figure 9.
Biochemistry examination of cerebrospinal fluid- increased glycorrhagia, albuminorrhagia and decreased chlororrhagia.
Figure 9.
Biochemistry examination of cerebrospinal fluid- increased glycorrhagia, albuminorrhagia and decreased chlororrhagia.
Figure 10.
Evolution of our TBM HIV coinfected patients.
Figure 10.
Evolution of our TBM HIV coinfected patients.
Figure 11.
Distribution of HIV cases by CD4+ T-lymphocytes level and HIV viral load at one-year evaluation.
Figure 11.
Distribution of HIV cases by CD4+ T-lymphocytes level and HIV viral load at one-year evaluation.
Table 1.
Distribution of TBM HIV cases by age.
Table 1.
Distribution of TBM HIV cases by age.
| Age (years) |
n |
% |
| 0-20 |
1 |
5.26 |
| 21-30 |
10 |
26.31 |
| 31-40 |
5 |
40.12 |
| 41-50 |
2 |
10.52 |
| 51-60 |
1 |
5.26 |
Table 2.
Distribution of TBM HIV cases by county in North East Romania.
Table 2.
Distribution of TBM HIV cases by county in North East Romania.
| County |
n |
% |
| Iasi |
4 |
21 |
| Neamt |
1 |
5 |
| Vaslui |
1 |
5 |
| Bacau |
2 |
11 |
| Botosani |
4 |
21 |
| Suceava |
7 |
37 |
Table 3.
Route of transmission of the study group.
Table 3.
Route of transmission of the study group.
| |
n |
% |
| Known route of transmission |
18 |
94.73 |
| Sexual transmission |
17 |
89.47 |
| Drug-use transmission |
1 |
5.26 |
| Perinatal transmission |
0 |
0 |
| Unknown route of transmission |
1 |
5.26 |
Table 4.
Distribution of TBM HIV cases by CD4+ T-lymphocytes level and sex.
Table 4.
Distribution of TBM HIV cases by CD4+ T-lymphocytes level and sex.
CD4+ T-lymphocytes level
p=0.065 |
male |
female |
total |
| n |
% |
n |
% |
n |
% |
| 0-199 cells/μl |
8 |
42.10 |
9 |
47.37 |
17 |
89.47 |
| 200-499 cells/μl |
1 |
5.26 |
1 |
5.26 |
2 |
10.52 |
| >500 cells/μl |
0 |
0 |
0 |
0 |
0 |
0 |
Table 5.
Distribution of cases based on sex and metabolic syndrome and liver enzymes.
Table 5.
Distribution of cases based on sex and metabolic syndrome and liver enzymes.
Laboratory Marker
|
Value
|
Male |
Female |
Total |
| n |
% |
n |
% |
n |
% |
ALT
|
normal |
6 |
31.57 |
7 |
36.84 |
13 |
68.41 |
| abnormal |
3 |
15.78 |
3 |
15.78 |
6 |
31.56 |
AST
|
normal |
5 |
26.31 |
6 |
31.57 |
11 |
57.88 |
| abnormal |
4 |
21.05 |
4 |
21.05 |
8 |
42.10 |
GGT
|
normal |
3 |
15.78 |
6 |
31.57 |
9 |
47.35 |
| abnormal |
6 |
31.57 |
4 |
21.05 |
10 |
52.62 |
Cholesterol
|
normal |
7 |
36.84 |
5 |
26.31 |
12 |
63.15 |
| Abnormal |
2 |
10.52 |
5 |
26.05 |
6 |
36.57 |
HDL-COL
|
normal |
7 |
36.84 |
5 |
26.31 |
12 |
63.15 |
| abnormal |
2 |
10.52 |
5 |
26.05 |
6 |
36.57 |
LDL-COL
|
normal |
5 |
26.31 |
3 |
15.78 |
8 |
42.09 |
| abnormal |
4 |
21.05 |
7 |
36.84 |
11 |
57.89 |
Triglycerides
|
normal |
5 |
26.31 |
3 |
15.78 |
8 |
42.09 |
| abnormal |
4 |
21.05 |
7 |
36.84 |
11 |
57.89 |
Table 6.
ARV treatment before admission of the patients that were already in our evidence.
Table 6.
ARV treatment before admission of the patients that were already in our evidence.
| ARV therapy regimens |
Number of patients |
% |
| Protease inhibitors |
7 |
46.15 |
| Integrase inhibitors |
5 |
38.46 |
| 2 INNRT+ INRT |
1 |
7.69 |
Table 7.
Distribution by CD4+ T-lymphocytes level and sex, one month after ART.
Table 7.
Distribution by CD4+ T-lymphocytes level and sex, one month after ART.
CD4 levels
(p=0.053) |
male |
female |
Total |
| n |
% |
n |
% |
n |
% |
| 0-200 cells/μl |
1 |
7.69 |
0 |
0 |
1 |
7.69 |
| 200-499 cells/μl |
1 |
7.69 |
3 |
23.07 |
4 |
30.76 |
| >500 cells/μl |
3 |
23.07 |
5 |
38.46 |
8 |
61.53 |
Table 8.
Distribution by HIV viral load level, at first presentation and one month after ART.
Table 8.
Distribution by HIV viral load level, at first presentation and one month after ART.
HIV Viral Load
(p=0,5) |
First presentation |
One month after ART |
| n |
% |
n |
% |
| <40 copies/ml |
0 |
0 |
11 |
84.61 |
| >40 copies/ml |
19 |
100 |
2 |
15.38 |
