1. Introduction
Female breast cancer is one of the most frequently diagnosed cancers and is a leading cause of cancer death [
1]. Among the different types of breast cancers, triple negative breast cancer (TNBC) is the most aggressive subtype and has distinguished metastatic patterns with a poor prognosis [
2]. TNBC is characterized by the absence of expression of the estrogen receptor (ER), progesterone receptor (PR), and human epidermal growth factor receptor 2 (HER2) [
2]. TNBC is classified into basal-like 1 and 2, mesenchymal, and luminal androgen receptor subgroups [
3,
4]. Despite global research efforts, response to therapy following initial treatment of TNBC primary tumors with DNA-damaging agents and androgen receptors, varies considerably and is suboptimal [
5]. Thus, elucidating the proteins and signaling pathway mechanisms involved in the metastatic process of this cancer has the potential to reveal new therapeutic targets.
Nudt2 hydrolyzes diadenosine 5′, 5′′′-p1, p4-tetraphosphate (Ap4A) to yield AMP and ATP [
6,
7]. The regulation of intracellular Ap4A concentrations in immune cells, such as dendritic cells, was recently described by the authors of this study [
8]. Nudt2 has been found to be associated with RAG proteins which are involved in mTOR activation in breast cancer cells [
7]. A recent study showed that Nudt2 was significantly higher in ductal breast carcinoma tissue as compared to healthy tissue, highlighting this proteins potential as a potent prognostic factor in human breast carcinomas. The study also showed Nudt2 to be an estrogen-repressed gene that is induced by HER2 pathways in breast carcinoma cells therefore promoting proliferation and acting as a potent prognostic marker of breast carcinoma [
9]
. The main aim of the present study was to examine Nudt2 in human invasive ductal carcinoma. We focused on the implication of the role played by Nudt2 in functional pathways and its effect on TNBC cell lines. We observed a significant reduction in proliferation, tumorigenicity, migration and invasion after knockdown of Nudt2 in these TNBC cell lines.
2. Material and Methods
2.1. Patients and tissues
Two sets of frozen tissue specimens were used in this study. The first set were specimens consisting of normal human breast tissue and the second set were paired triple negative invasive ductal carcinoma breast tissue from the same corresponding patients (n=8). All specimens were collected from the pathology laboratory of our institution. These tissues were stored at -80oC in the Israeli National Tissue Bank for Research. Informed consent was obtained from all patients prior to surgery and examination of the specimens.
2.2. Cell culture
MDA-MB-231 and MDA-MB-436 human breast carcinoma cell lines, which are triple negative breast cancer (TNBC) cells, were purchased from American Type Culture Collection (ATCC) (Manassas, USA). Cells were cultured in DMEM (#01-052-1A, Biological Industries, Israel) containing: 10% fetal bovine serum, 100 units/ml penicillin, 100 μg/ml streptomycin (#03-031-5C, Biological Industries, Israel) and 1 mM sodium pyruvate (#03-042-1B, Biological Industries, Israel).
2.3. Stable Sh-RNA lentiviral particle transfected triple negative breast cancer cell lines
Human breast carcinoma cell lines, 1x10⁵ cells, were cultured in 6-well plates to reach 60% confluence on the first day of infection. They were infected with either Nudt2 shRNA lentiviral particles (#sc-60188-V; Santa Cruz Biotechnology, Almog, Israel) or control shRNA lentiviral particles (# sc-108080; Santa Cruz Biotechnology) using Polybrene transfection reagent (#TR-1003-G; Merck, Israel) reaching a final concentration of 8 μg/ml. Cells were then incubated at 37°C, in a 5% CO2 incubator for 24 h, after which the medium was replaced with complete medium. After a further 24 h, the medium was replaced with Puromycin (Cas-58-58-2, TOKU-E, Tiva-Biotech, Israel) selection medium for 48-96 hours, which was optimized for each cell line according to their killing curves.
2.4. Immunoblotting & Immunoprecipitation (IP)
Human breast carcinoma cell lines and frozen human breast carcinoma tissues (whole cell extracts) were extracted on ice by RIPA lysis buffer containing 50 mM Tris-HCl, 1% Nonidet P-40, 0.25% Na-deoxycholate, 150 mM NaCl, 1 mM EDTA, X1 protease inhibitor cocktail, 1 mM phenylmethylsulfonyl fluoride, 1 mM sodium orthovanadate, and 17 mM NaF. Proteins were resolved using 15% SDS-PAGE under reducing conditions and transferred to polyvinylidene difluoride membranes (Merck Millipore, Israel). Visualization of the proteins was performed by chemiluminescence with EZ-ECL (#20-500-1000, Biological Industries, Israel). For Immunoprecipitation (IP), cells were washed twice with ice-cold PBS and lysed with hypotonic lysis buffer (20 mM Tris-HCL pH=7.4, 10mMNacl, 3Mm Mgcl2), followed by 10 mins on rotation at 4 °C. For cytoplasmic extraction, centrifugation at 14,000 rpm for 15 min at 4 °C was performed. The resulting pellet was sonicated at 1 min intervals for 1 min on ice 3 times, followed by centrifugation at 14,000 rpm for 15 min at 4 °C. Nucleus lysis buffer (20mM Hepes pH 7.9, 0.4M NaCl, 1mM EDTA, 1mM EGTA, 1mM DTT, protease inhibitor cocktail, PMSF, SOV and NaF) was then added. For IP, 2 μg of antibody was added to the nucleus lysate and incubated at 4 °C overnight under gentle agitation with protein G magnetic (#1614023, Bio-Rad, Israel). The immunoprecipitate was washed 3 times with washing buffer (lysis buffer: 1X PBS, ratio (1:1)) and was subjected to SDS-PAGE and immunoblotting.
2.5. Cell proliferation
Cells were seeded at a density of 2500 cells per well in 96-well plates, with three wells per group. After 24 h, 48 h,72 h and 96 h viability was detected by adding 50ul of Cell Proliferation Kit (XTT based) solution (#20-300-1000, Biological Industrial) to each well. Absorbance was measured at an optical density of 450 nm using plate reader 280. The experiment was repeated a minimum of three times.
2.6. Immunofluorescence Staining
Cells were grown onto glass slides at density of 250x103, and fixed with 4% paraformaldehyde for 20 min at room temperature, followed by permeabilization with 0.5 % Triton X-100 in phosphate-buffered saline (PBS), cell blocking for an hour at room temperature in 0.5% BSA in PBS, and incubation in primary antibody in blocking buffer overnight at 4°C. The primary antibodies utilized were: Ki67 monoclonal antibody (ab 16667), Anti-beta II Tubulin [7B9] (ab28035) antibody, dilution was 1:100 for both antibodies. Appropriate secondary antibodies were applied for 1 h at room temperature. The secondary antibodies were: Cy2 –donkey anti-Mouse IgG [H+L] and Cy3-goat anti-Rabbit IgG [H+L], both were used at a dilution of 1:100. Samples were incubated with DAPI stain (Bio-Rad) at a dilution of 1:100 for 10–15 min. Coverslips were applied using Vectashield mounting medium for fluorescence (Vector-labs, Burlingame, CA USA) and slides were stored in the dark at 4°C until analysis was performed. Images were acquired using a ZEN 3.5 (ZEN lite) Axio Observer confocal Z1 laser scanning microscope, equipped with a 488 laser, 561 laser and 405 laser. The images were analyzed by Qupath software.
2.7. Antibodies
Antibodies against Nudt2 (#10484-1-AP, dilution 1:1000, Proteintech, Biotest, Israel), β-Actin (#A1978, dilution 1:10000, Sigma-Aldrich, Israel), Ki-67[SP6] (dilution 1:100, ab16667), Anti-alpha Tubulin antibody (dilution 1:100, ab7291) PUREBLU™ DAPI (#135-1303, dilution 1:100, Bio-Rad, USA), Cy™3 AffiniPure Goat Anti-Rabbit IgG (H+L) (# 111-165-144,dilution 1:100 , Jackson, USA), Cy™2 AffiniPure Donkey Anti-Mouse IgG (H+L) (#715-225-151, dilution 1:100 , Jackson, USA), Phospho-Rb (Ser807/811) Antibody ( #9308,CST,USA), Phospho-Rb (Ser795) Antibody (#9301,CST,USA), Rb (4H1) Mouse mAb (#9309,CST,USA)and E2F-1 Antibody (#3742,CST,USA).
2.8. Cell cycle
MDA-MB-231 cells were seeded at 5x10⁶. After 96 h, the cells were collected and centrifuged at 2150 g for 5 min. The cells were then fixed with 1 ml 70% ethanol and incubated at 4°C for 15 min. At the end of incubation, the cells were washed with PBS twice and centrifuged at 200 g for 5 min. The cells were then incubated with 500 μl Propidium iodide (PI) solution (20 μg/ml PI, 0.0002g/ml RNase A, 0.01% Triton X-100) at 37°C for 30 min in the dark. After centrifugation at 200 g for 5 min, the cells were washed with 1 ml PBS and then resuspended in 500 μl PBS. The content of DNA in the cell cycle was measured by CytoFLEX LX Flow Cytometer (Beckman Coulter) at an excitation wavelength of 488nm. The data were analyzed using FCS expressed 7 flow cytometry software.
2.9. Migration and invasion assay
The cell migration assay was performed by seeding 60x105 and 90x105 cells in a 96-well Image Lock plate in a CO2 incubator for 24h to reach full confluence the next day. The scratch assay was performed using the 96-pin IncuCyte® Wound Maker which creates precise and reproducible wounds in all wells of a 96-well Image Lock plate by gently removing the cells from the confluent monolayer. The plate was washed several times, fresh medium was added to the wells, and the plate was placed in the IncuCyte® Live-Cell Analysis System. Relative wound density (RWD %) was measured using IncuCyte software metrics every 2 h for a total of 48 h. For the invasion assay, the 96-well Image lock plate was coated with ECM matrigel 1ug/ml (E1270-1ml, Sigma, Israel) overnight, after which the cells were seeded following the removal of the matrigel and kept in a CO2 incubator until complete adherance. A 96-pin IncuCyte® Wound Maker was used to create wounds in all wells, the plate was then washed several times and another layer of matrigel 0.5mg/ml was added. The plate was kept in the CO2 incubator for 30mins for complete solidification, fresh medium was added and the plate was put in the IncuCyte® Live-Cell Analysis System. Relative wound density (RWD %) was measured using IncuCyte software metrics every 2 h for a total of 48 h.
2.10. Soft Agar Colony Formation Assay
Soft agar colony formation assays were performed in 24-well plates. The lower layer was prepared from 0.8% noble agar, the top layer contained 1 x 10⁴ cells that were suspended in 0.3% noble agar in complete medium. After the agar solidified, 500 μl of complete medium were added. Cells were incubated at 37C° in a CO2 incubator for 21 days, after which the colonies were stained with p-iodonitrotetrazolium violet (Sigma). Images were captured using a Nikon SMZ25 stereomicroscope, and the number of cells were counted using Image J software.
2.11. Statistical Analysis
The Two Tailed Wilcoxon Signed-Rank Test was used for the Ki67 detection, migration and invasion, soft agar and the Western-blot. The Mann-Whitney Test was used for viability testing and cell cycle analysis. The t-test was used for Nudt2 expression analysis in tissues.
4. Discussion
High expression of Nudt2 has been observed in the human breast carcinoma tissues that serves as a viable prognostic factor in human breast carcinomas [
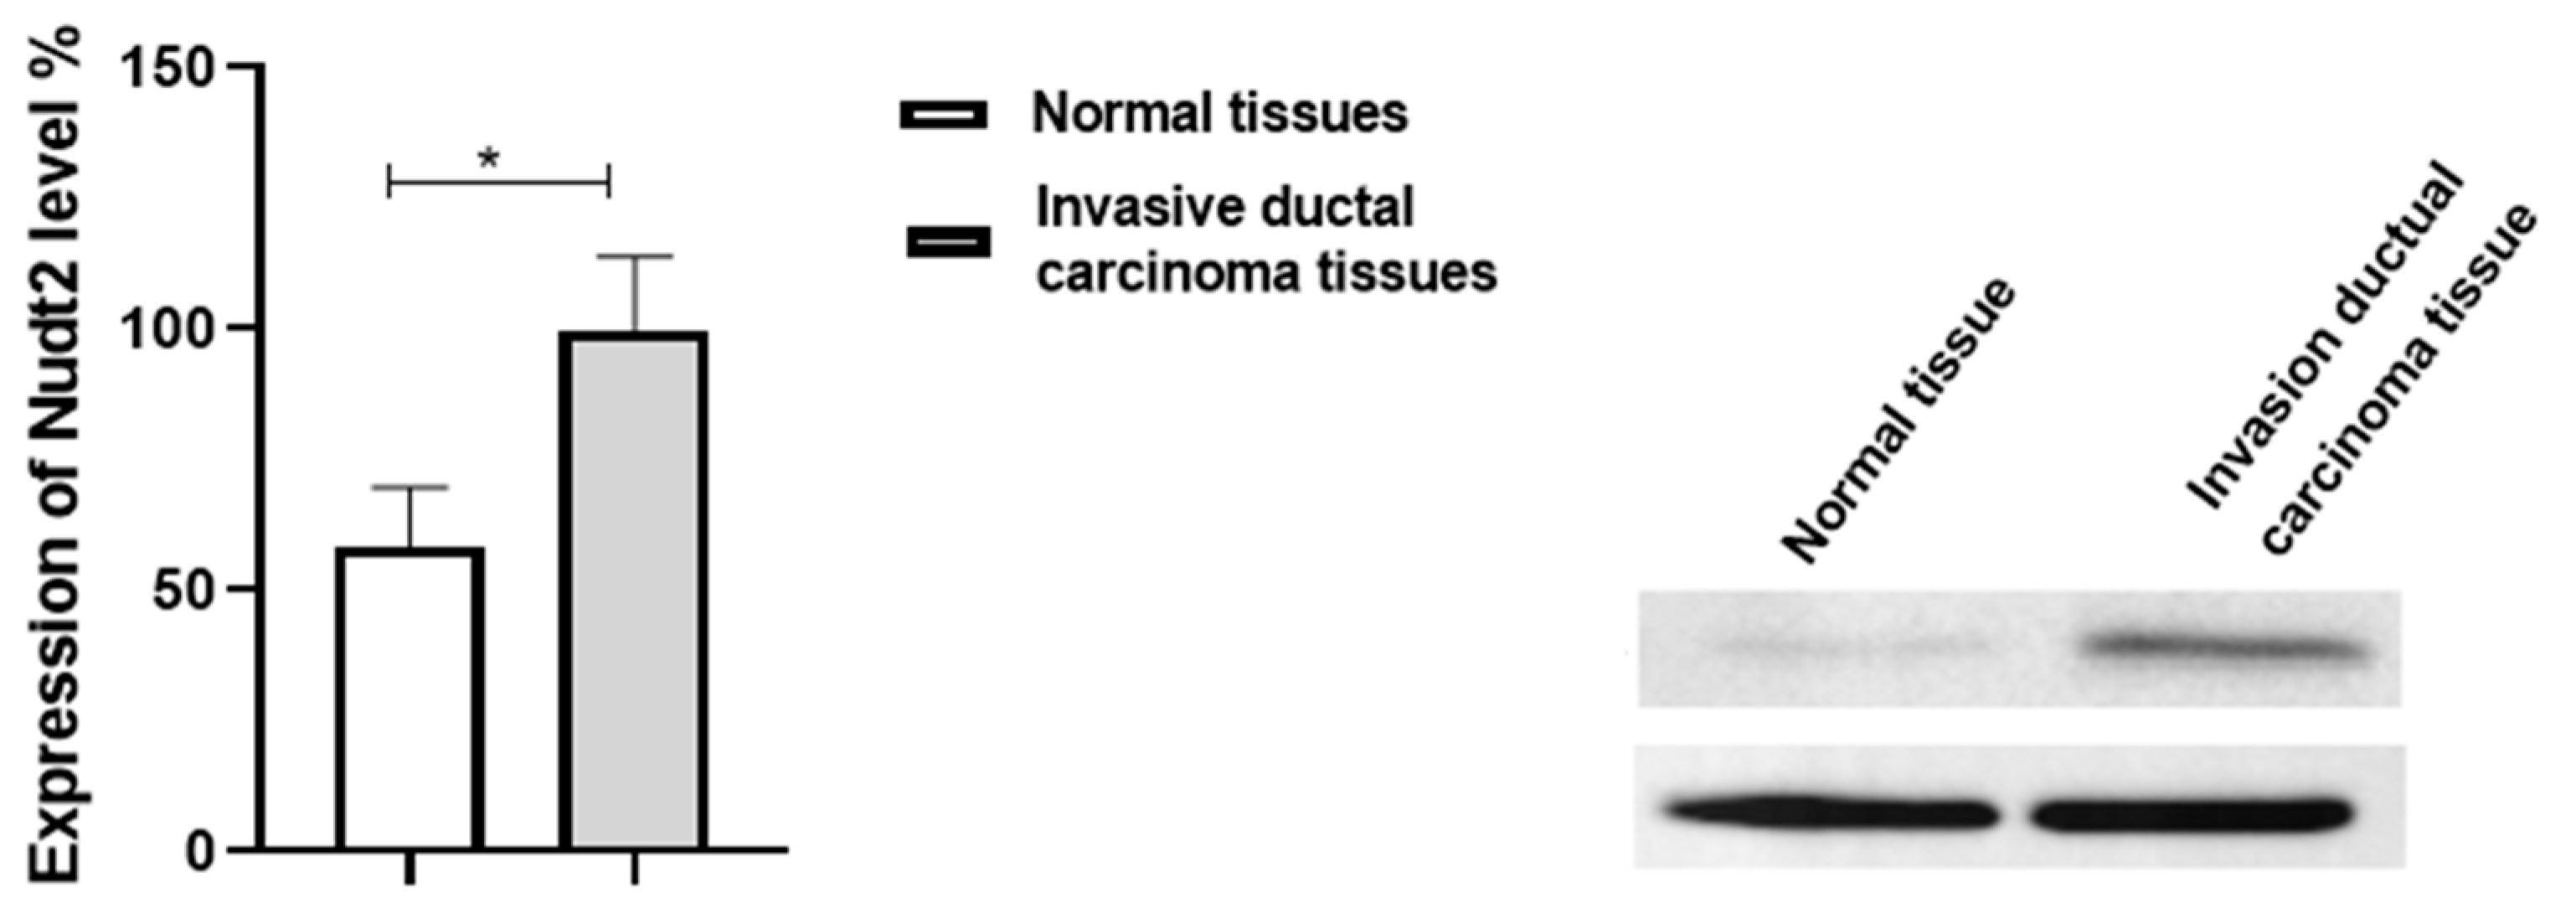
9]. In our study we detected higher expression levels of Nudt2 in human triple negative ductal breast carcinoma tissue compared to normal breast tissue from the same patients (
Figure 1). It was recently discovered that Nudt2 has a significant role in promoting breast cancer proliferation by different mechanisms involving estrogen [
7,
9]. Previously it was reported that Nudt2 is involved in breast cancer proliferation by regulating mTORC1 localization [
7]. Nudt2 could thus be considered as a tumor-promoting gene, and its high expression in breast cancer cells could make it a prognostic marker. Nudt2 could also promote the proliferation of breast carcinoma cells through a decrement of the intracellular Ap4A level. Previous studies demonstrated that Ap4A is involved in the cell cycle by slowing the process of replication, which subsequently allows for cells to repair possible DNA damage in ovarian cell lines [
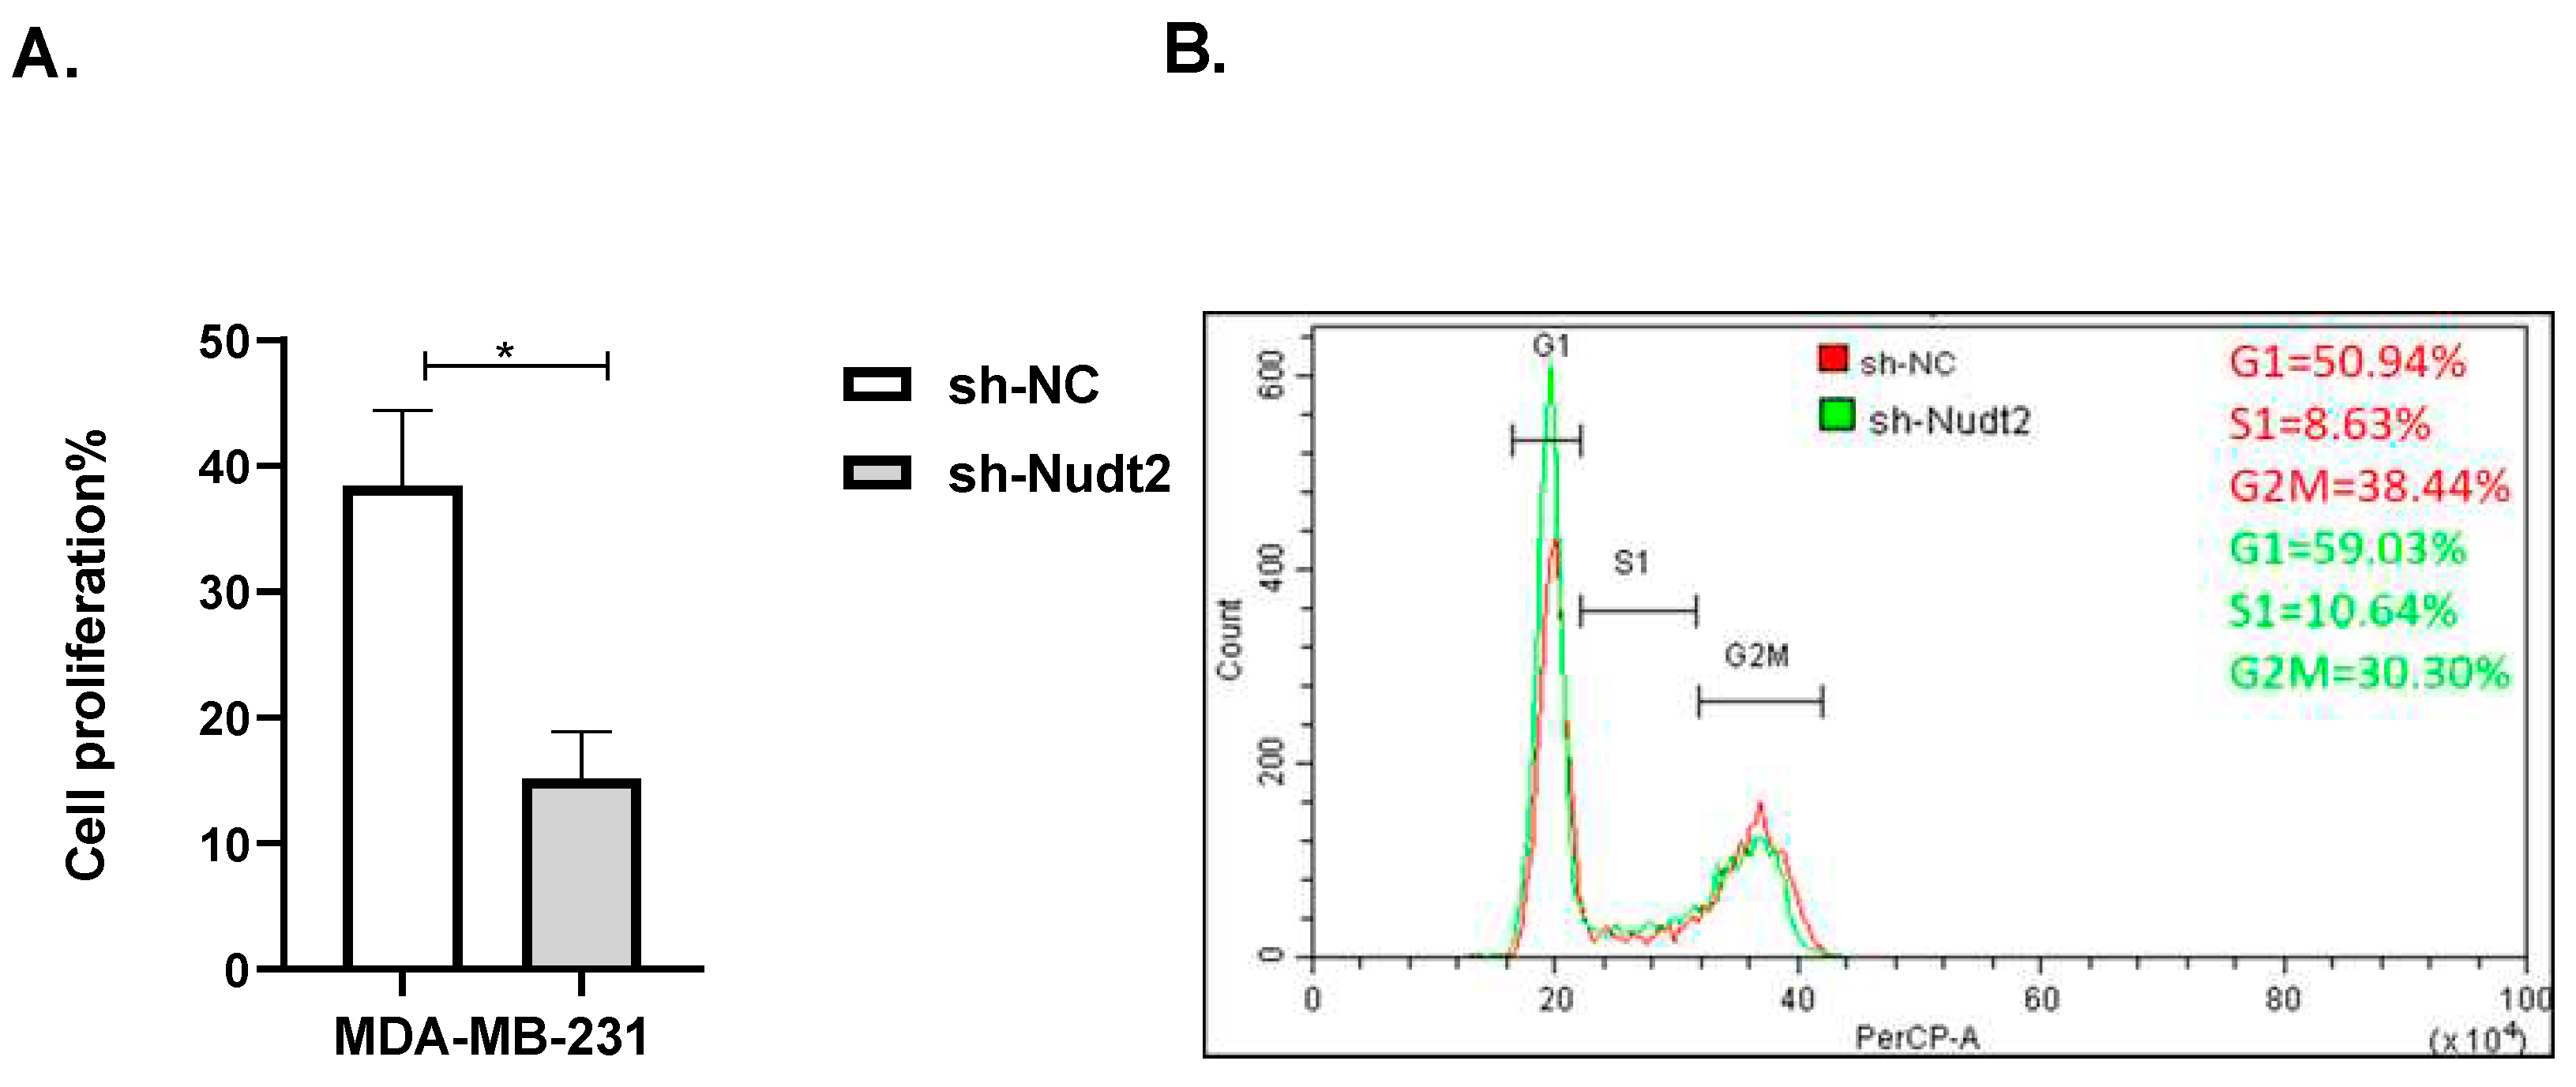
12]. Our study found a significant reduction in cell proliferation associated with a significant increase in the G0/G1 phase in the Nudt2 knockdown MDA-MB-231 cell line (
Figure 2). The Ki-67 protein, which plays a role in mitotic cells, has been widely used as a proliferation marker for human tumor cells [
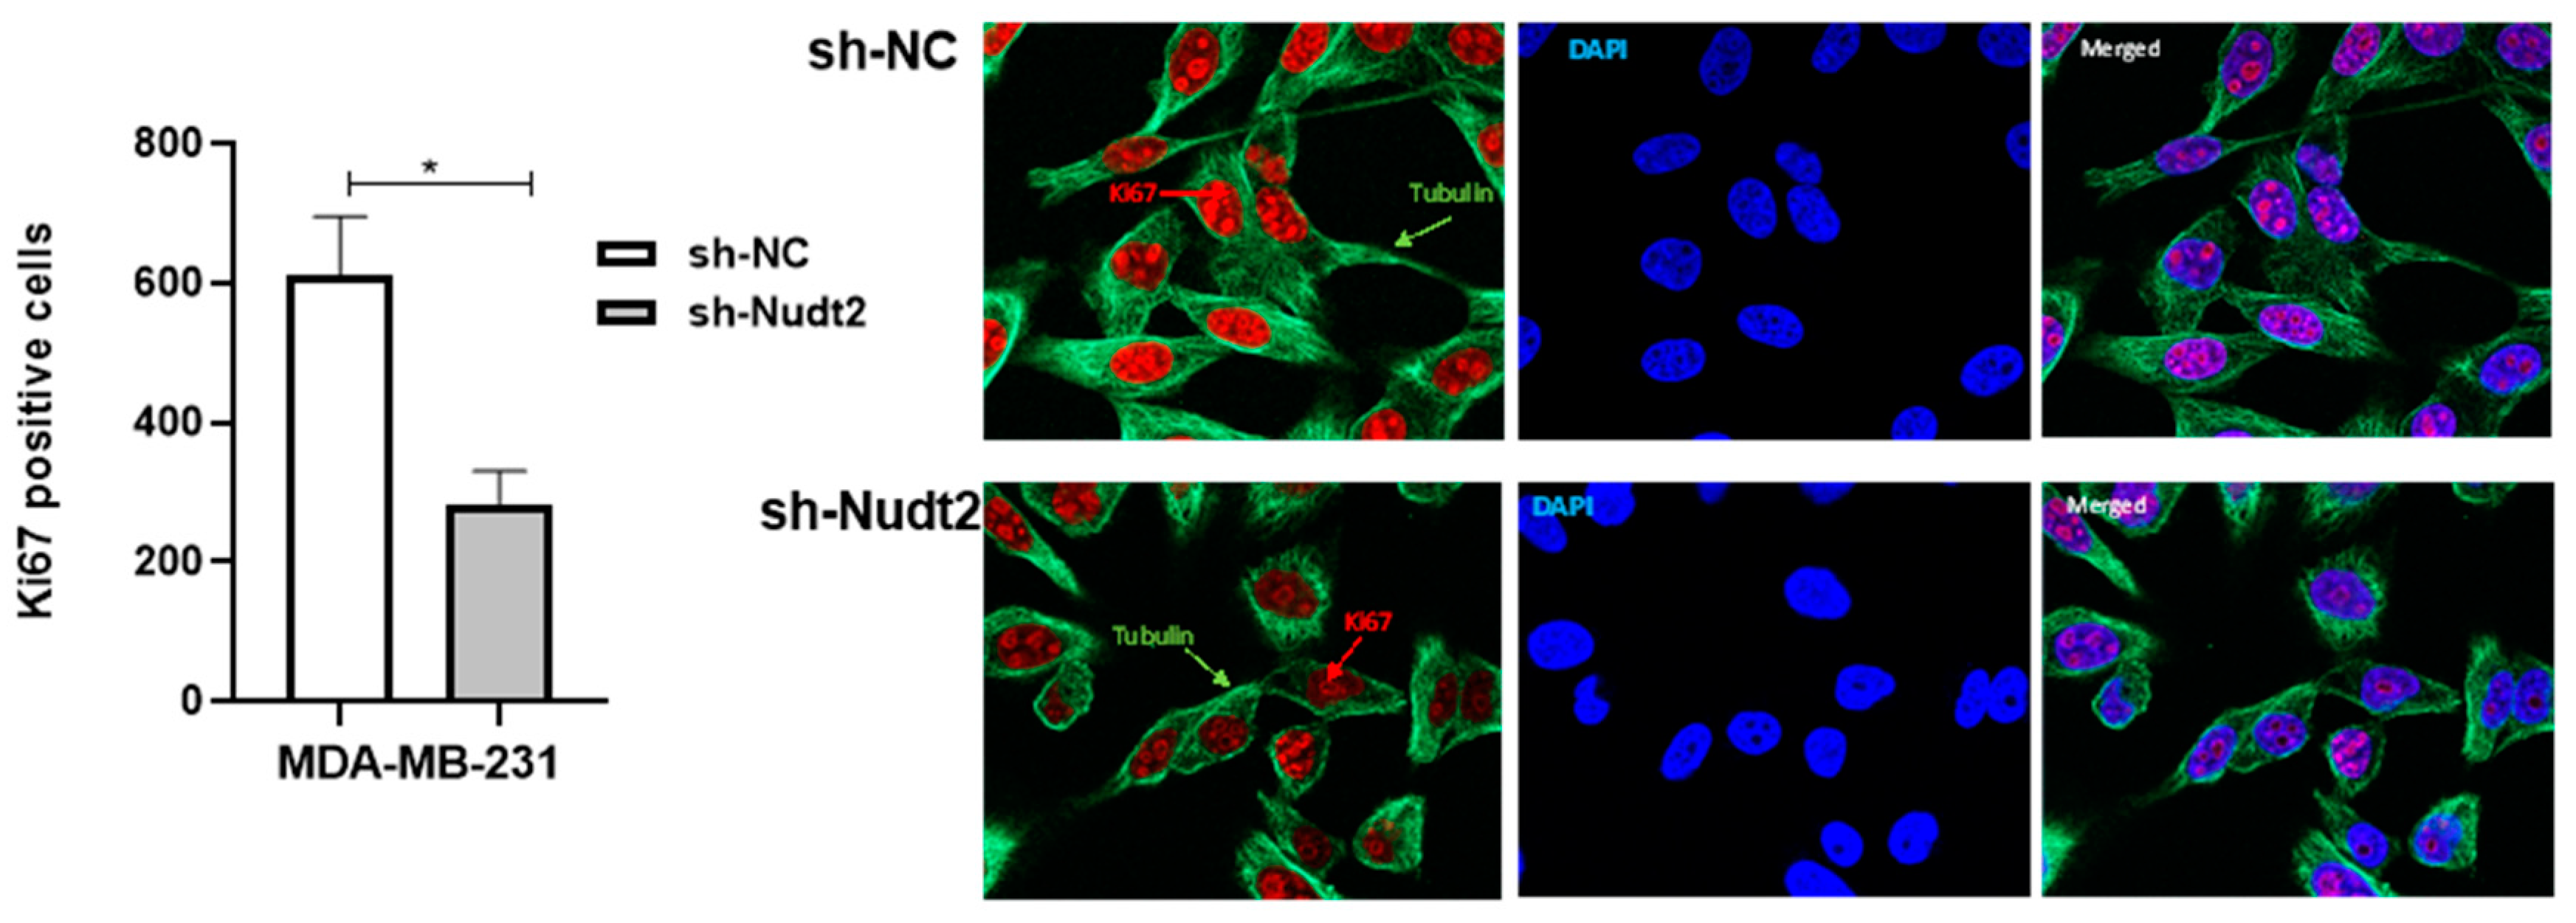
10]. Herein we found a depletion in the number of Ki67 markers (
Figure 3) which confirm our results of cell cycle arrest in the G0-G1 phase in human TNBC MDA-MB-231 cells. Retinoblastoma (Rb) is an important cell cycle regulatory marker [14]. Rb proteins repress gene transcription, which is required for transition from the G1 to S phase, by directly binding to the transactivation domain of E2F1 [
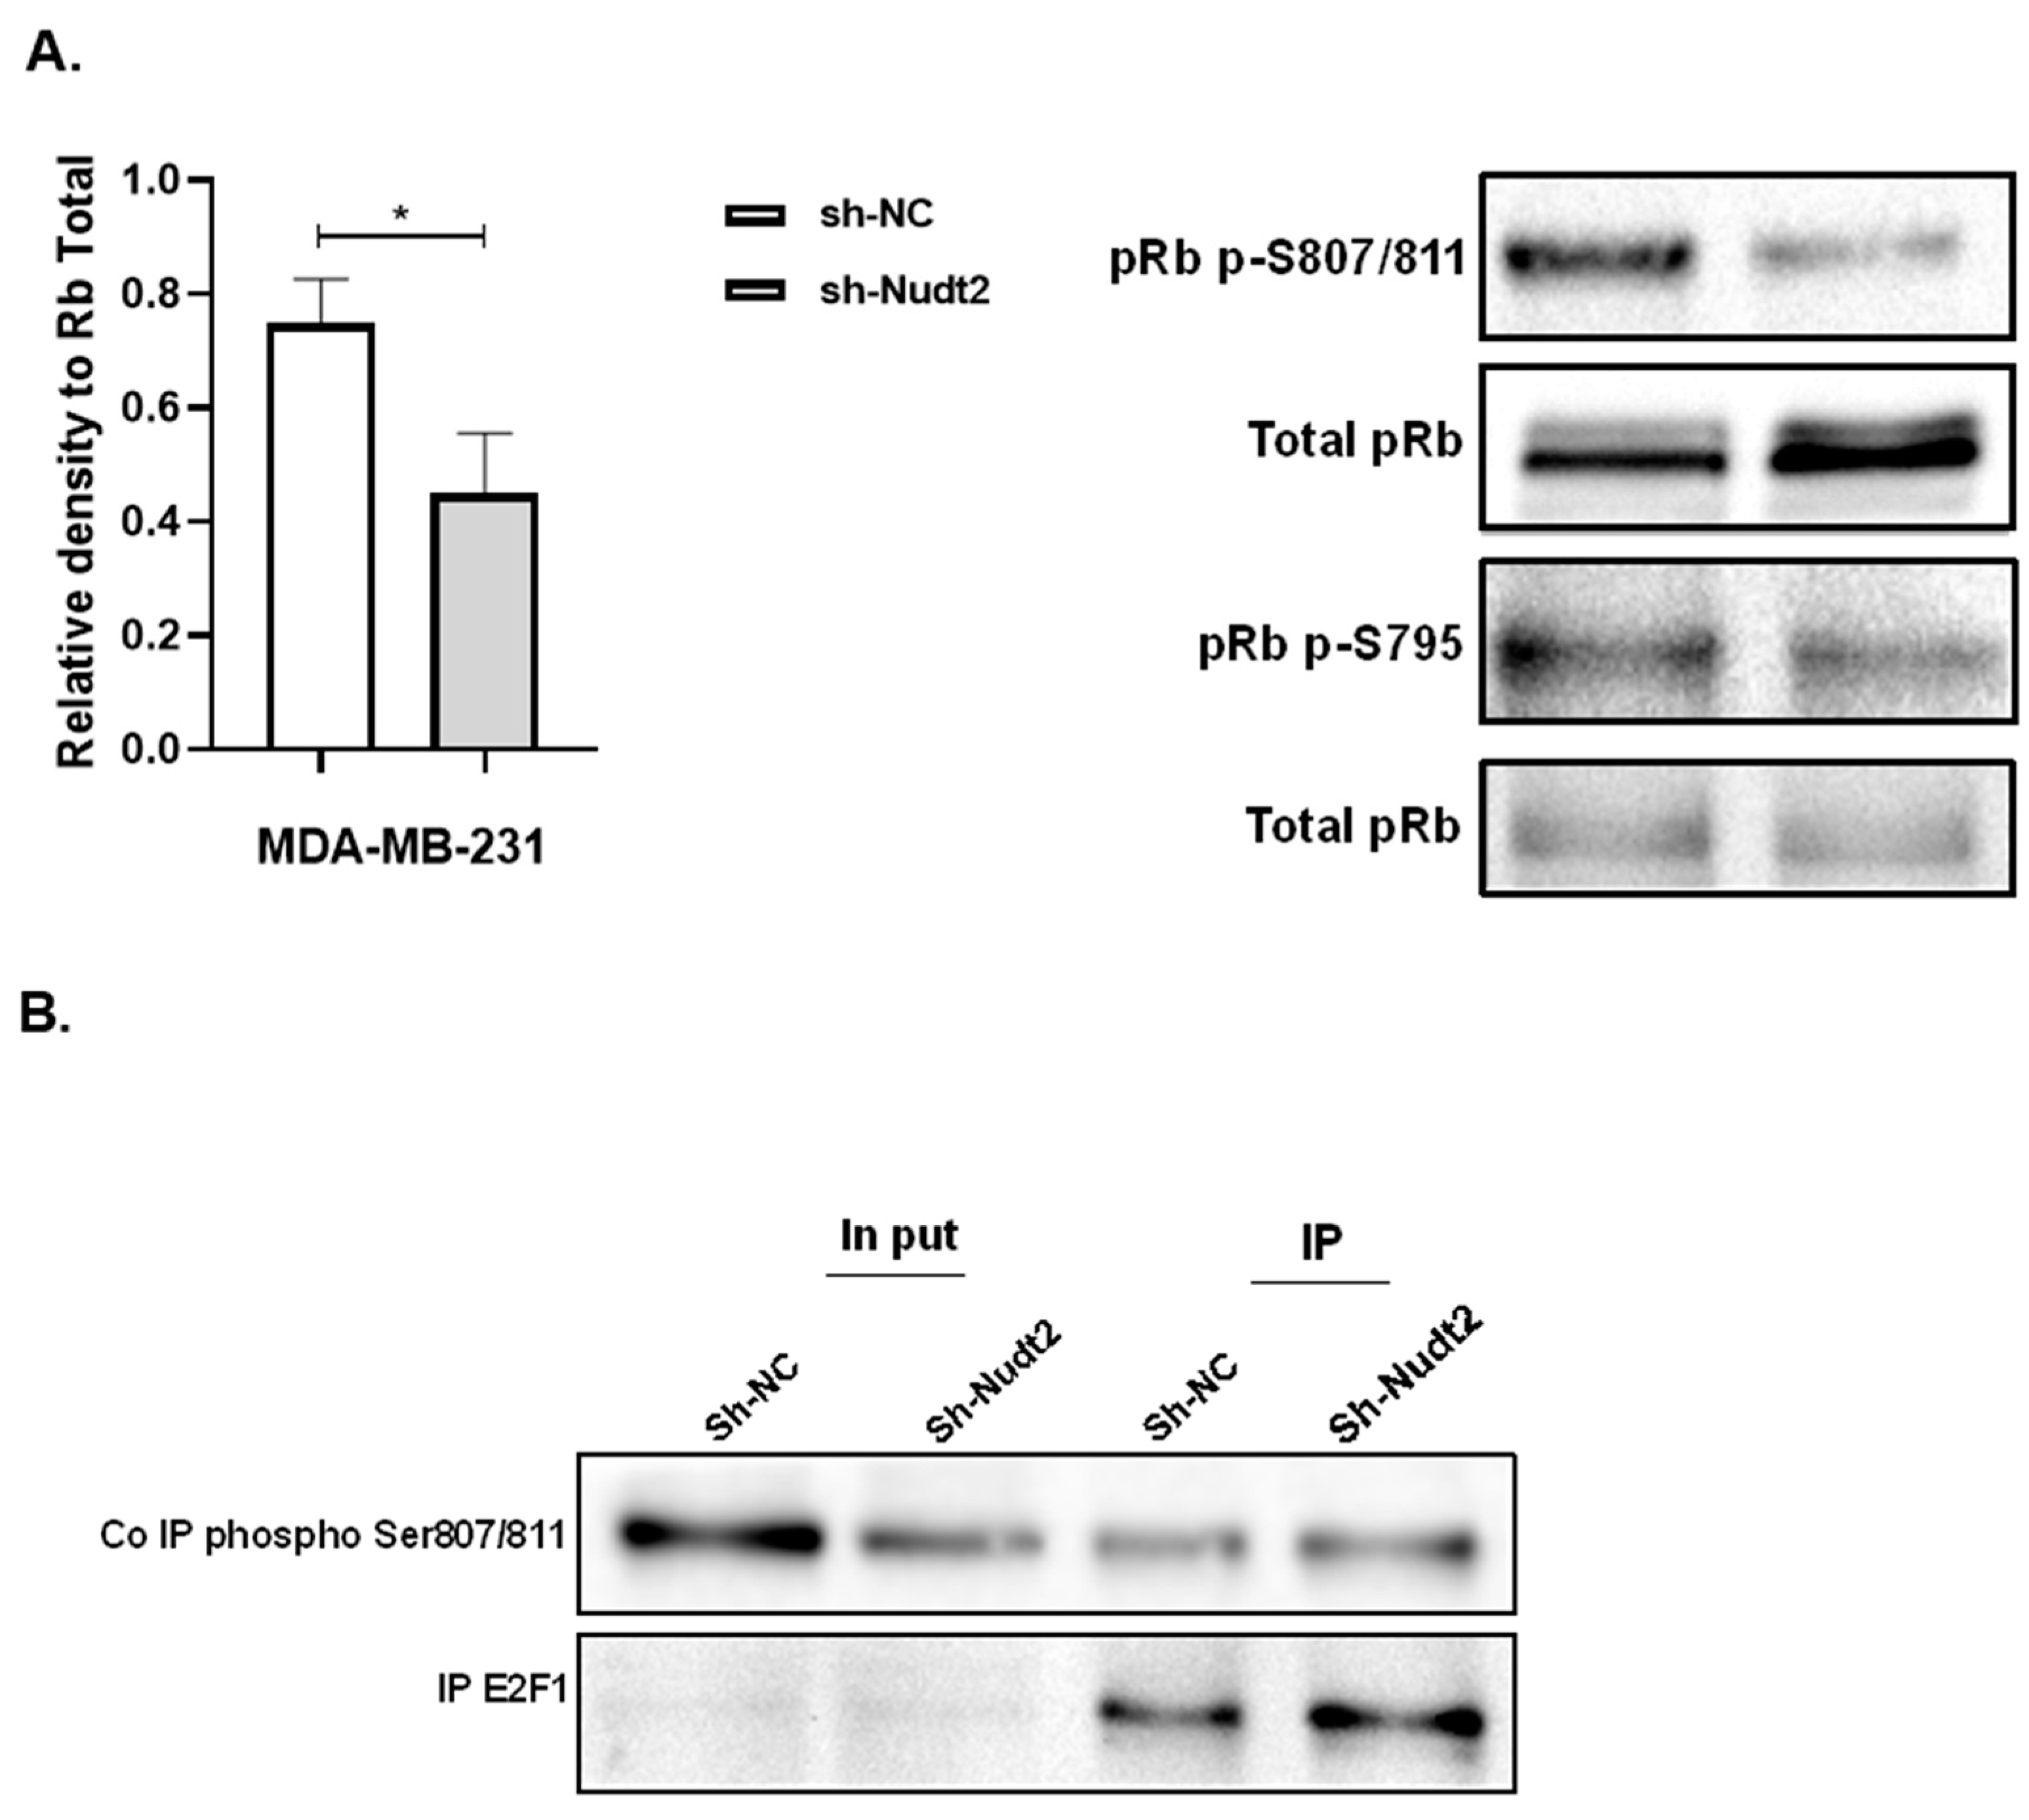
15]. In G0 and early G1, hypo-phosphorylated Rb physically associates with E2F1 factors and blocks their transactivation domain. In late G1, hyper-phosphorylated Rb releases E2F1 factor, allowing for the expression of genes that encode products necessary for S-phase progression. In this present study we found that hypo-phosphorylated Rb in the Nudt2 knockdown MDA-MB231 cell line had higher Rb-E2F1 association (
Figure 4).
This delay in the release and transition of the E2F1 transcriptional factor from late G1 to S phase leads to G0/G1 arrest. No reduction in the proliferation of human MDA-MB-436 cells was seen, and this could be because these cells are Rb null cells, which do not express the Rb protein [
16].
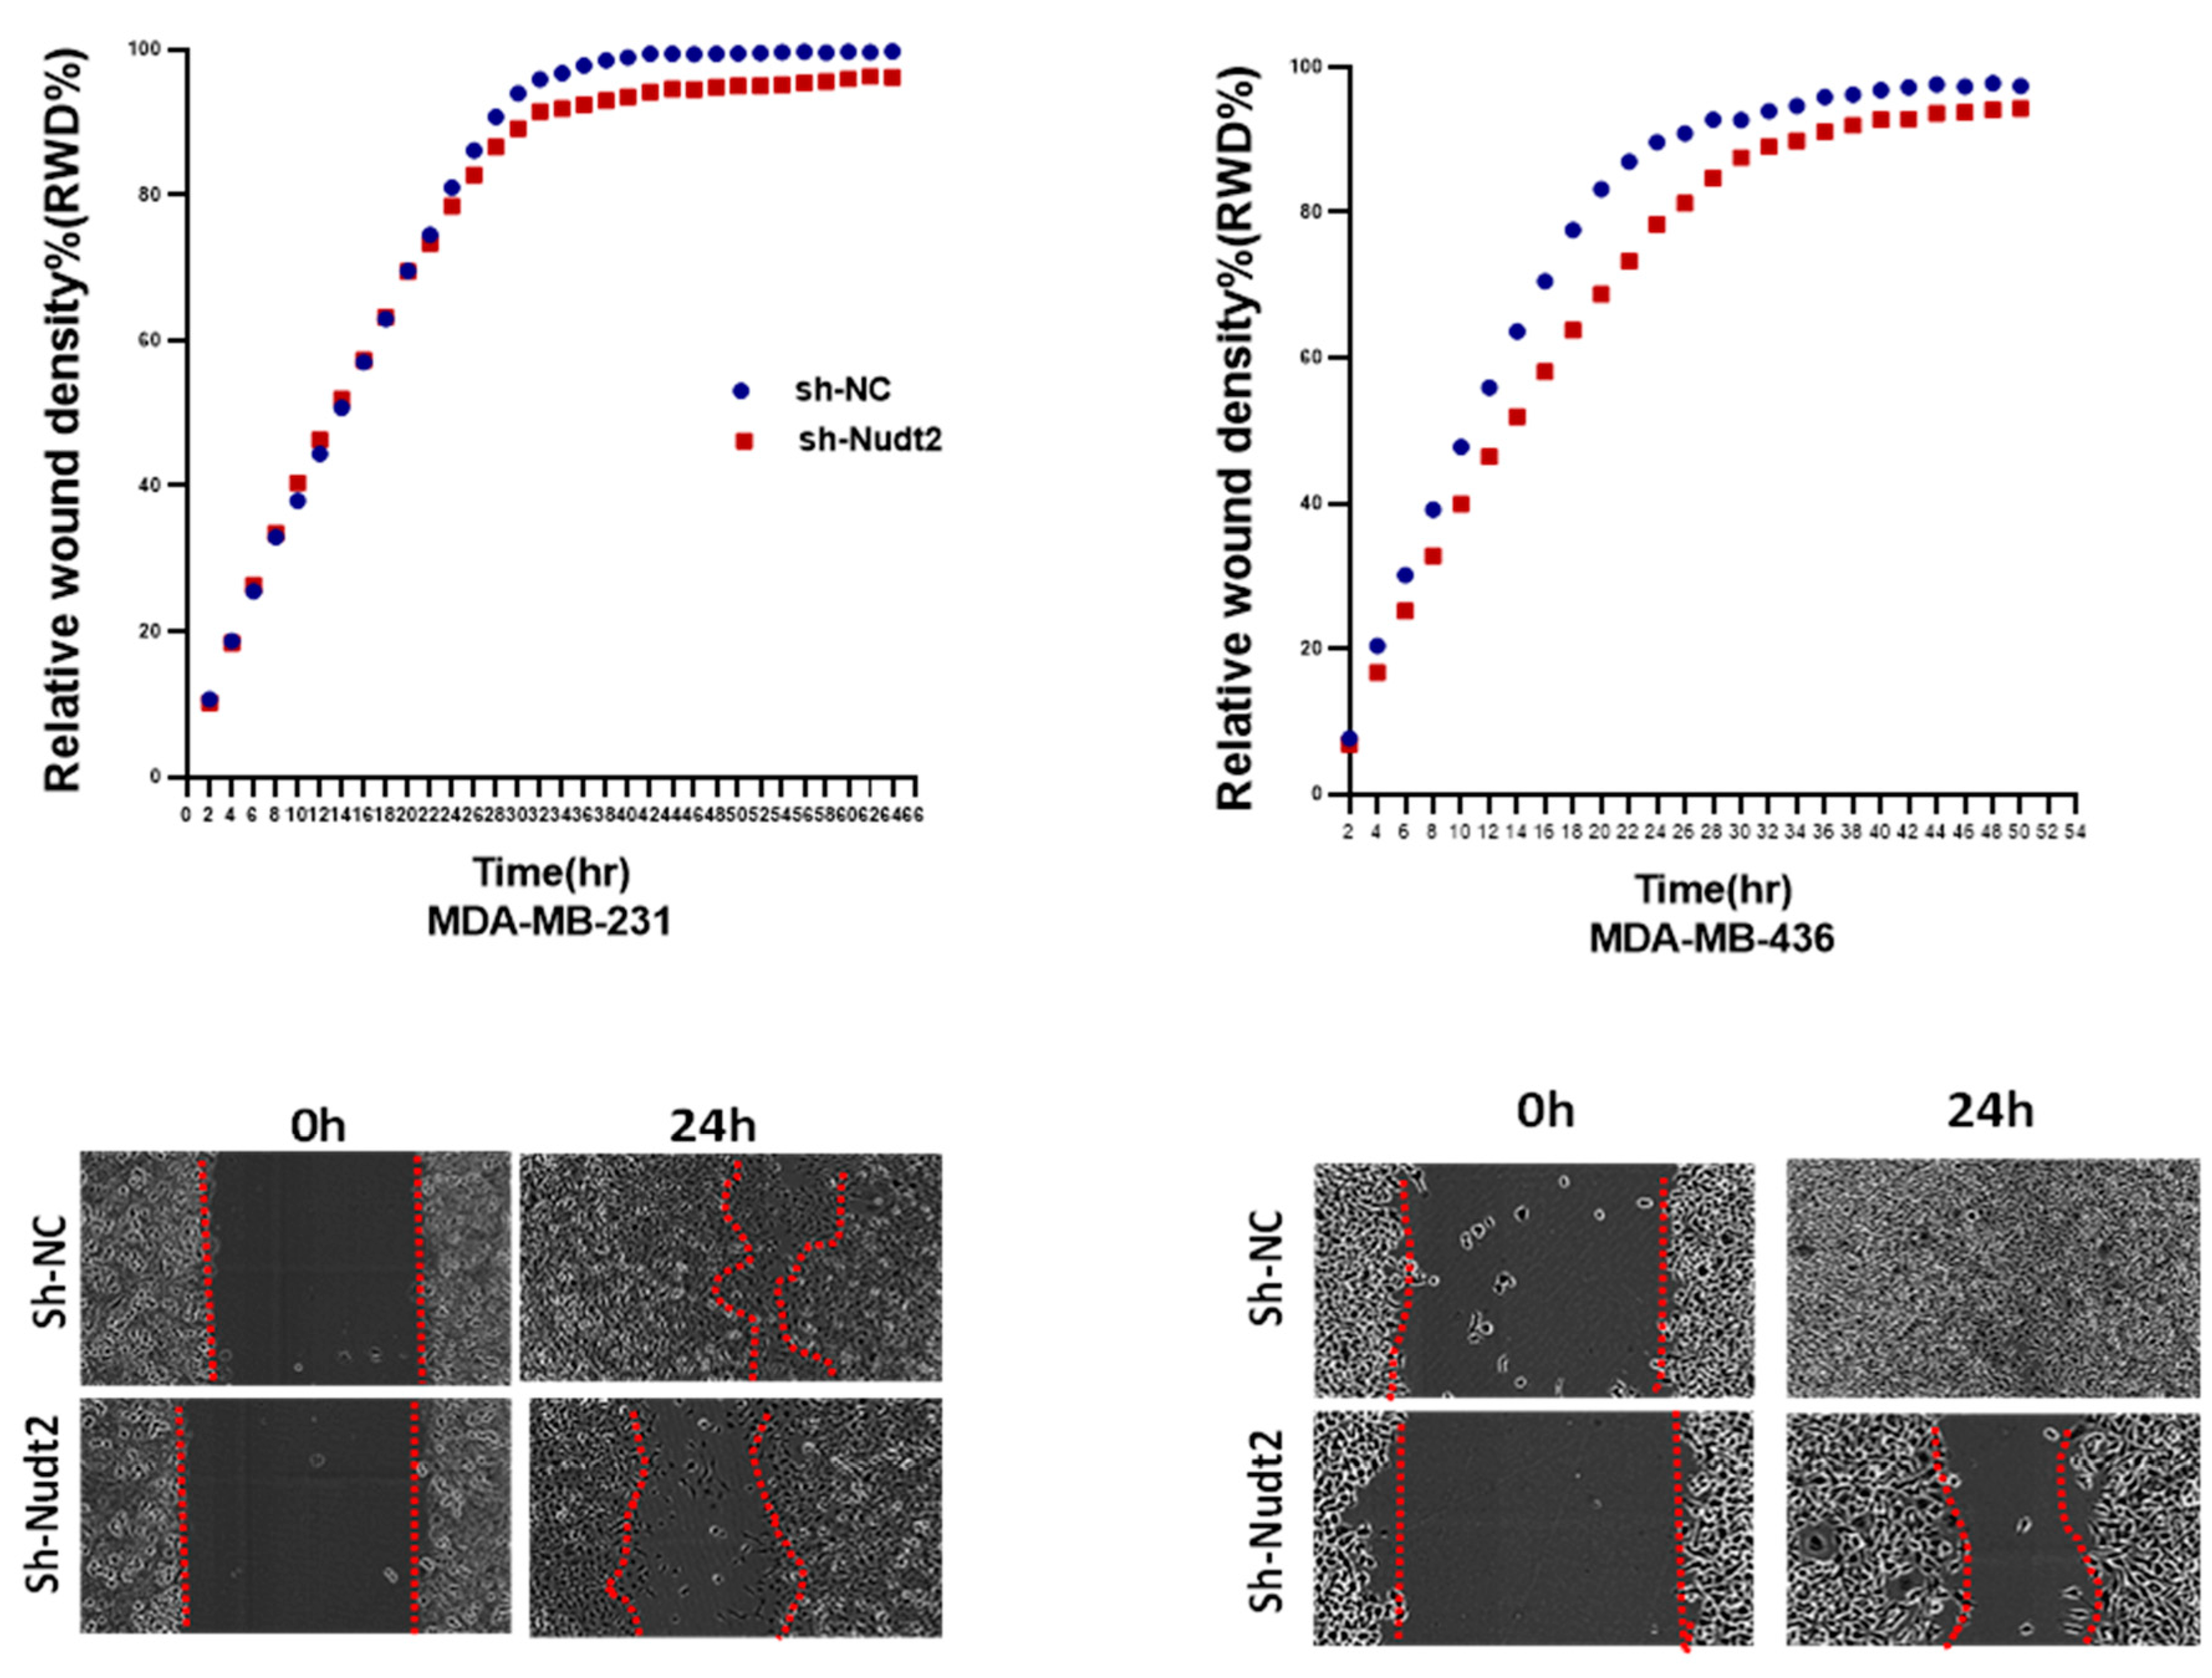
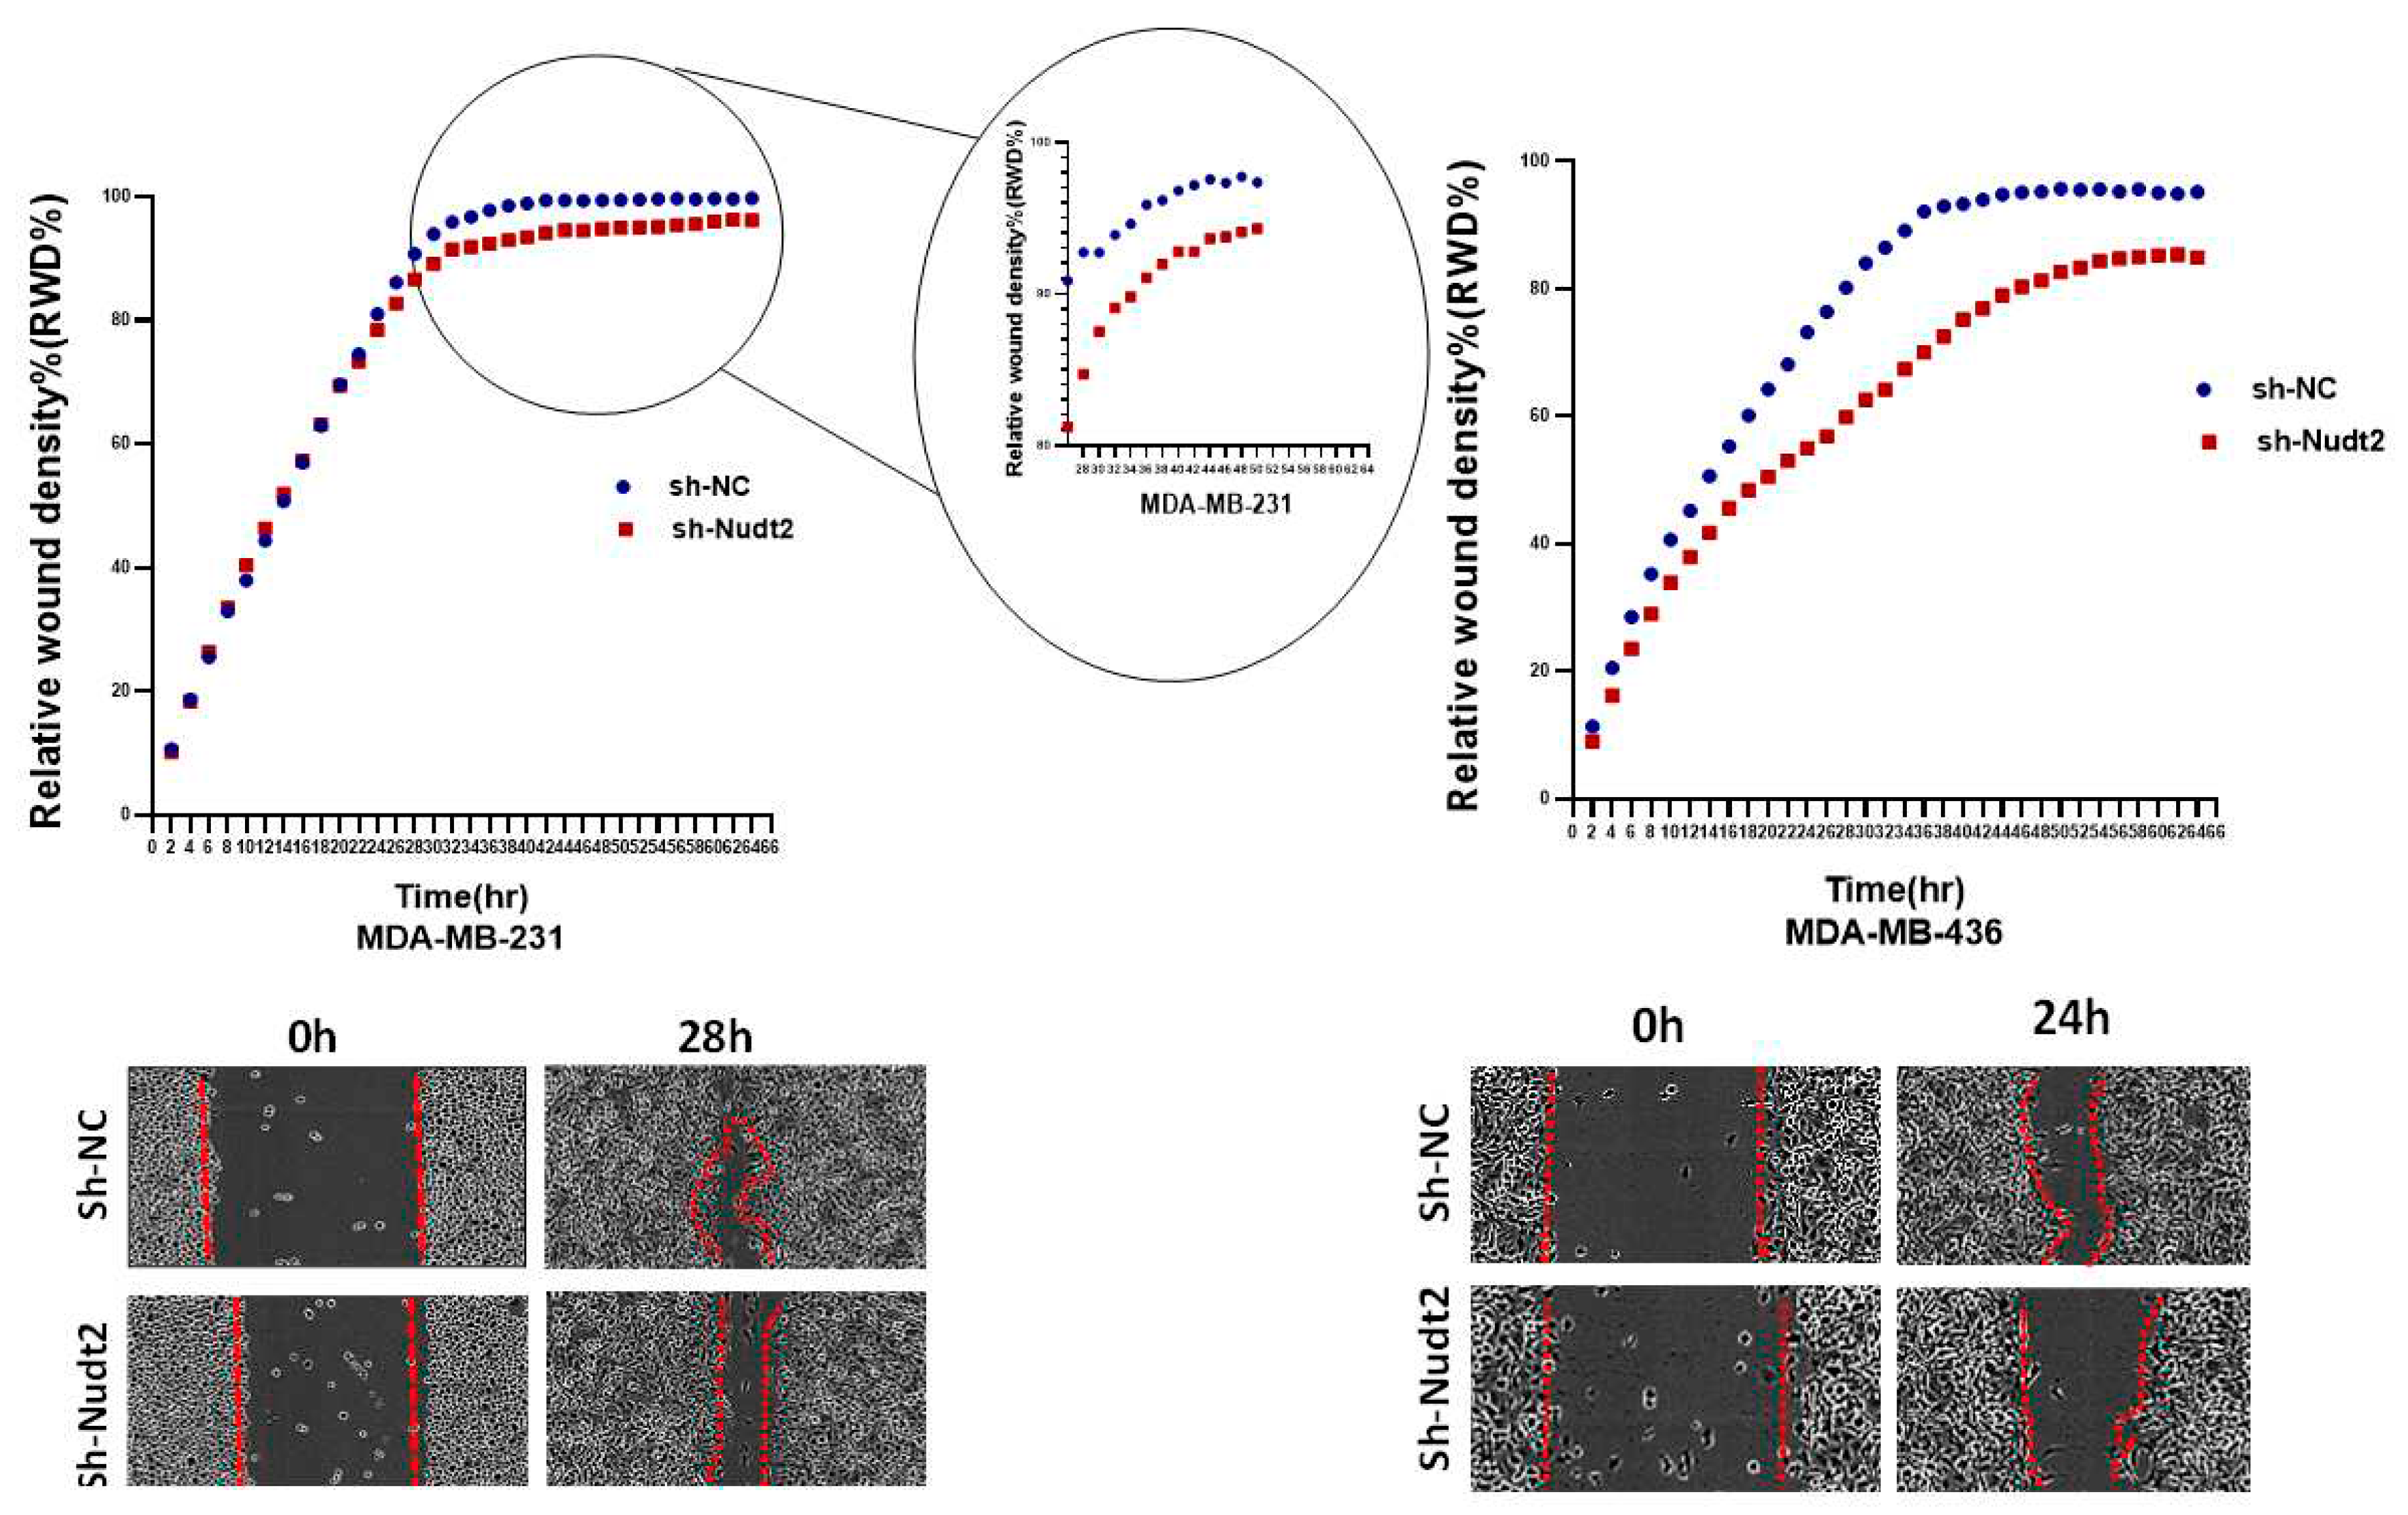
We also investigated the effect of the Nudt2 knockdown on migration and invasion. Our results clearly showed a significant reduction in both migration and invasion in both human Nudt2 knockdown MDA-MB-231 and MDA-MB-436 cell lines, which suggests that Nudt2 may play a role in metastasis (
Figure 5 and
Figure 6).
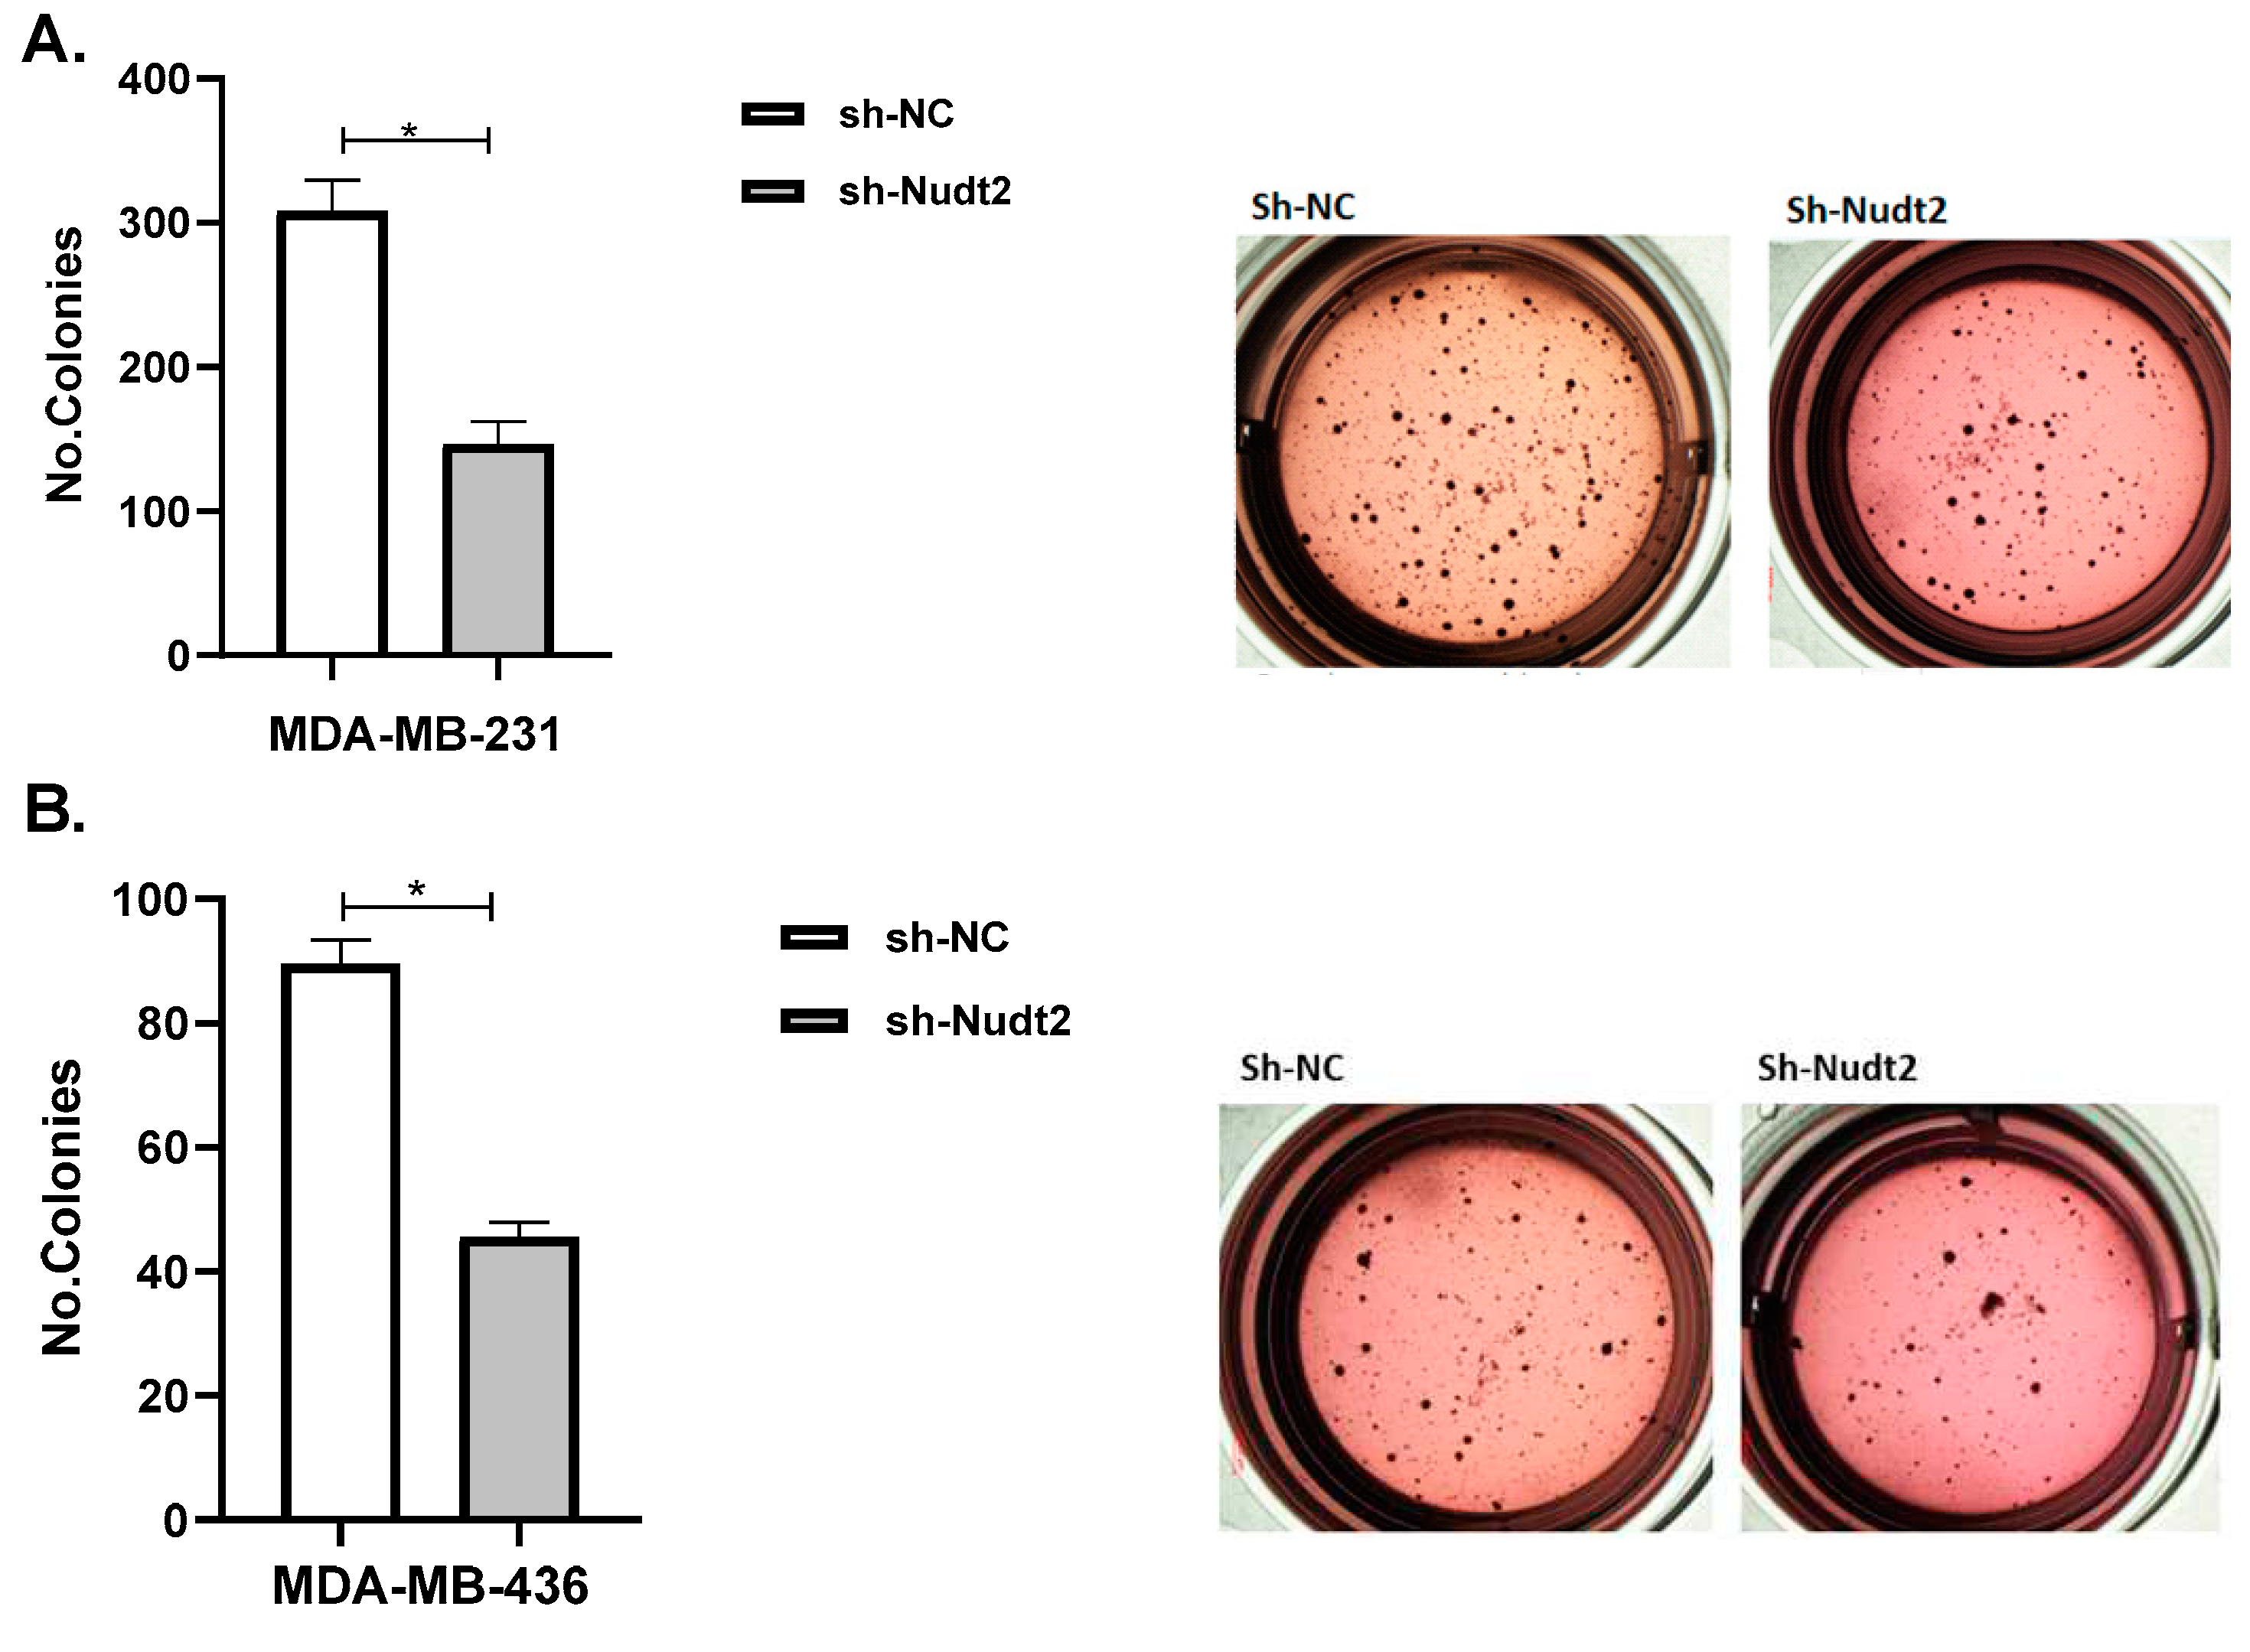
This study demonstrated that Nudt2 knockdown inhibited anchorage-independent growth in both human TNBC cell lines: MDA-MB-231 and MDA-MB-436 transfected with sh-Nudt2 (
Figure 7). Anchorage-independent growth is a hallmark of cancer and is necessary for metastasis [
17]. Anchorage-independent growth is also connected to epithelial-to-mesenchymal transition (EMT) in many cancers [
18]. Thus it could be that the second messenger, Ap
4A, is involved in this process which could explain the mechanism behind it.
In our present study, higher expression levels of Nudt2 were detected in human invasive ductal breast carcinoma tissues, linking it to the promotion of proliferation of breast carcinoma cells. Additionally, our results showed that Nudt2 is important in the maintenance of anchorage independent growth and the reduction of cell migration and invasion. The revelation of the exact underlying mechanisms that Nudt2 plays a role in with respect to migration and invasion is critical in future studies.
Figure 1.
Expression of Nudt2 protein levels in human invasive breast carcinoma tissues (TNBC). Relatively higher Nudt2 levels were detected in the cases of invasive ductal carcinoma tissues compared to lower Nudt2 levels in the normal tissues. The data are presented as the mean±SEM (Normal breast tissues=8, invasive ductal breast carcinoma=8). The t-test was used for statistical analysis (p=0.039), (*p<0.01).
Figure 2.
The role played by Nudt2 in the proliferation of the TNBC MDA-MB-231 cell line. A. Following 96h of incubation, a significant reduction in proliferation of sh-Nudt2 (Nudt2 knockdown) cells was detected. Data are presented as individual experiments (MDA-MB-231, n=7), P>0.05 as calculated by the Mann-Whitney Test. B. MDA-MB-231 cells were stained with propidium iodide and DNA content fluorescent profiles were measured using a PerCP-A channel by flow cytometry. Percentages of cells in the G1, S and G2M phases were determined using FCS express cell cycle analysis. The above figure is representative of one experiment of seven replicates. Data are presented as individual experiments (MDA-MB-231, n=7), P>0.05 as calculated by the Mann-Whitney Test.
Figure 3.
Cell proliferation as detected through Ki-67 expression in the human MDA-MB-231 cell line at 96h. Red- Ki-67, blue- nuclear DNA (DAPI), and Green- tubulin. Ki-67-positive cells were significantly reduced in sh-Nudt2 (Nudt2 knockdown) cells. Images were acquired using a ZEN 3.5 (ZEN lite) Axio Observer confocal Z1 laser scanning microscope equipped with a 488 laser, 561 laser and 405 laser. The images were analyzed by Qupath software. Data are presented as individual experiments (MDA-MB-231, n=3), P>0.05 as calculated by the Wilcoxon test.
Figure 4.
Expression of phosphorylated Rb in the TNBC MDA-MB-231 cell line. A. Western blotting detection of phosphorylated Rb sites 795 and 807/811; and the ratio of signal intensity of pRb phospho-S807/811 and S 795 to total Rb levels. A significant reduction in phosphor-S807/811 was detected. The results represent one of five independent experiments with similar results. The Wilcoxon-test was used for statistical analysis (p=0.03), P>0.05. B. Immunoprecipitation (IP) showed higher pRb phospho807/811-E2F1 association in the Nudt2 knockdown MDA-MB-231 cell line.
Figure 5.
The role played by Nudt2 knockdown in the migration of TNBC MDA-MB-231 and MDA-MB-436 cell lines. A significant reduction in migration was detected in both cell lines using the scratch wound assay with the IncuCyte live imaging system. Relative wound density (RWD %) was measured using IncuCyte software metrics every 2 h for 48 h. Area under the curve (AUC) was computed by numerical integration. Data are presented as individual experiments (MDA-MB-231 n=5; MDA-MB-436 n=5), P>0.005.
Figure 6.
Role played by Nudt2 Knock down in the invasion in TNBC MDA-MB-231 and MDA-MB-436 cell lines. Significant reduction in invasion in both cell lines using IncuCyte live imaging system ,in MDA-MB-231 the reduction started from time=28h. Relative wound Density (RWD%) was measured by using IncuCyte software metrics every 2 h for 48 h. Area under the curve (AUC) was computed by numerical integration. Data are presented as individual experiments (MDA-MB-231, n=5 MDA-MB-436 n=5), P>0.005.
Figure 7.
Effect of Nudt2 knockdown on anchorage-independent growth in MDA-MB-231 and MDA-MB-436 cell lines. Soft agar colony formation experiments were performed by seeding 10000 cells/well in 24-well plates for 21 days. Colonies were stained with 1 mg/ml of p-iodonitrotetrazoliumviolet stain and were counted using Image J software. A. Soft agar showed a significant reduction in colony numbers of MDA-MB-231 sh-Nudt2 cells. B. Soft agar showed a significant reduction in colony numbers of MDA-MB-436 sh-Nudt2 cells. Data are presented as individual experiments (MDA-MB-231n=5, MDA-MB-436 n=5), P>0.05 calculated by Wilcoxon Test.
