1. Introduction
Wildland fire not only costs the lives of humans and property but also influences ecosystems (Storey, 2010). The summer between 2018–19 recorded the hottest in both maximum and minimum temperature on record in Australia (Hague, 2021). In Tasmania, it was the third and the fourth highest in maximum and minimum temperature respectively which contributed to the large wildfires in remote areas during that season (Hague, 2021). For example, there were 70 fires, including Riveaux Road Fire, ignited by more than 2000 lightning strikes on 15th January 2019 in southern Tasmania (Wardlaw, 2021). Previous research has addressed the association of topography, conducive wind structure, and fire propagation by studying the Riveaux Road Fire as an example of rugged terrain fire (Ozaki et al., 2022).
The Riveaux Road Fire is employed again in this paper as a case-study fire to identify types of dynamic winds affecting fire propagation. There are several types of dynamic winds which interact with topography in mountains and can cause unexpected fire behaviour. We focus on two types of atypical winds: terrain-forced channelling and downslope wind. Terrain-forced channelling occurs when synoptic scale wind is modified by terrain (Whiteman, 2000). Thus, the presence and orientation of ridgelines often affects wind speed and direction. In particular, wind speed can increase through an opening in a mountain barrier when a ridgeline is concave to windward and flow along the valley between ridgelines (Whiteman, 2000). The second type of dynamic wind, downslope wind, is often associated with the foehn effect, in which the air can be dried and heated adiabatically and become downslope wind on the leeside after it surmounts a mountain barrier (Sharples, 2009). Although, downslope winds often occur in areas of high topographic amplitude, in which the elevation of barriers are greater than one km (Kusaka & Fudeyasu, 2017), such a high elevation is not always necessary. For example, the Waroona Fire (2016) in Western Australia was ignited by lightning, and propagated downhill rapidly, driven by downslope winds (Peace et al., 2017). The ignition point was at about 500 m elevation above the plain, and the total burnt area was approximately 700 .
The Riveaux Road case study area contains various vegetation types of differing flammability, such as buttongrass moorland, dry and wet eucalyptus forests, rainforests and shrublands in rugged terrain. Two fire isochrones of the west region of the study case are employed for this study because native buttongrass moorland predominates in these areas, and this vegetation lacks a canopy, making modelling and diagnosis of wind effects in this area simpler. These isochrones were also identified as being in terrain likely to induce channel winds. Buttongrass moorland or Gymnoschoenus sphaerocephalus occupies approximately one seventh of the land of Tasmania and is abundant in southwest, west and northwest of Tasmania (Marsden-Smedley & Catchpole, 1995a). Moorland is a similar vegetation description to bogs and heathland. Buttongrass tends to dominate on low nutrient waterlogged and peat soil (Marsden-Smedley & Catchpole, 1995a), and fire risk in this vegetation type is elevated because the grass is highly flammable and smouldering fires can persist in the organic peat soil (Storey, 2010). This implies that the fire can suddenly emerge on the ground and jeopardise those who perform fire prescription or fire extinguishment activity. In addition, the organic peat soils are particularly susceptible to damage by fire, leading to erosion or weathering (Storey, 2010). Further, fire expansion in buttongrass moorland is often more rapid than suppression of the fire and frequently enables fire spread to more fire-sensitive vegetation (Marsden-Smedley et al., 2001; Marsden-Smedley & Catchpole, 1995b).
We employ two strategies to investigate dynamic winds in this study: numerical weather model vertical sounding (NWMVS) and fire simulation. NWMVS plots show temporal changes of wind magnitude and direction at various pressure levels, temperature (oC) and cloud coverage (%). Fire spread in this study is simulated using Prototype 2 (Ozaki et al., 2022), a fire simulator, which is configured to employ two types of wind fields: the Bureau of Meteorology Atmospheric high-resolution Regional Reanalysis for Australia for the Tasmanian region (BARRA-TA) and downscaled wind. Results of the simulation relative to known fire boundaries are verified with fraction skills scores (FSS) and confusion matrices (CF). In addition, the fire intensity throughout the study period is monitored with the infrared channels from two satellites: Suomi National Polar-orbiting Partnership Program (S-NPP) satellite and Himawari-8, which is a high temporal resolution geostationary satellite. SNPP and Himawari-8 were launched in 2011 and 2016 respectively (Listi et al., 2018; Yumimoto et al., 2016).
In this study, we hypothesise that terrain channelling wind which enhanced fire propagation occurred, but little downslope wind since there are only a few small-scale downslopes of limited elevation difference evaluated from the topography dataset. Although two types of wind field, BARRA-TA and WindNinja downscaled winds, are used, the quality of them for fire simulation is expected to be mostly similar because the selected study isochrones are located in less rugged terrain than the previous study of this fire, and also the dynamic winds we investigate are different from previous study, which focused on conducive wind structures, which are the combination of wind and temperature layers likely to result in enhanced surface wind (Ozaki et al., 2022).
2. Dataset and methodology
Fire propagation and atmospheric conditions are diagnosed in two observed fire isochrones, both of which comprise sections of the larger Riveaux Road fire complex with fire propagation occurring in January 2019, in the west valley. The fire started at 17:20 on 25th and its recording finished at 15:30 on 28th in isochrone #1 while it ran from 15:10 till 19:30 on 28th in isochrone #2. Upper air conditions were analysed in the time series with two types of wind fields: the Bureau of Meteorology Atmospheric high-resolution Regional Reanalysis for Australia for the Tasmanian region (BARRA-TA) and the downscaled grid by WindNinja. Then, the fires were simulated by Prototype 2 parameterized by these wind fields.
2.1. Spatial Domain and date time
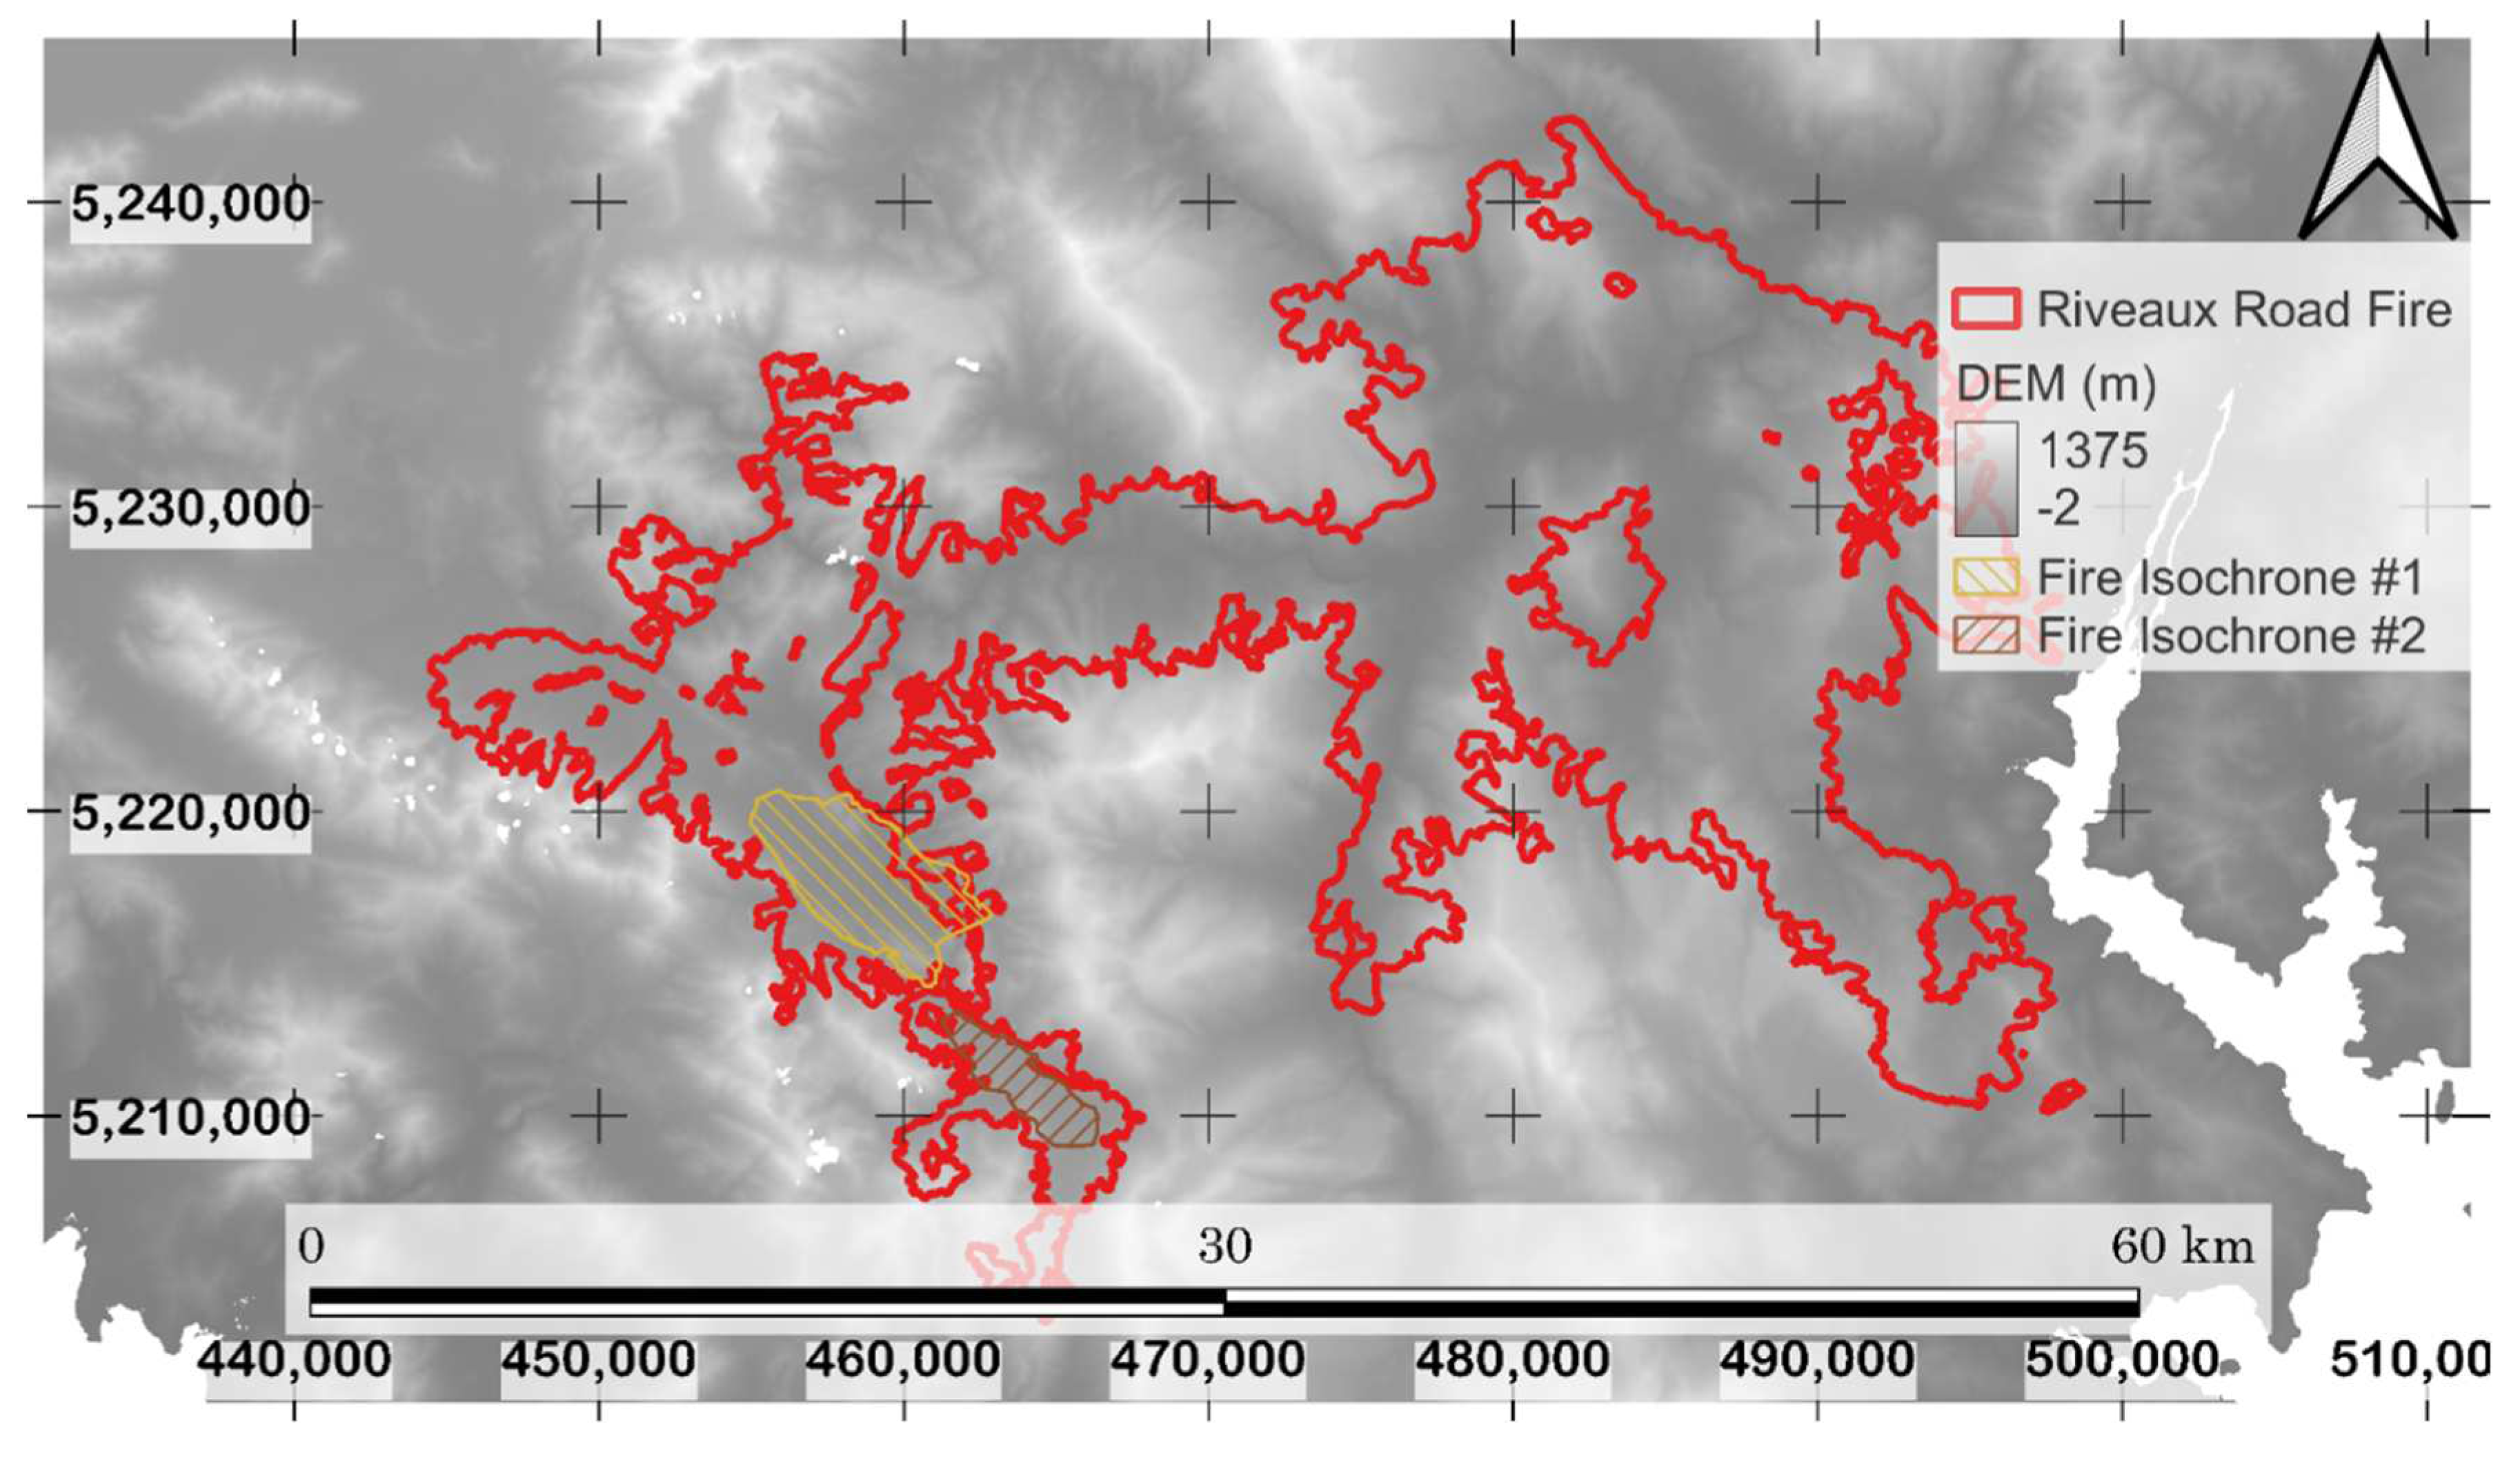
The coordinate system and time zone to represent in this study area was GDA94 zone 55 and local time (Australia/Hobart) respectively unless mentioned explicitly. The modelling domain in that coordinate system was defined to extend beyond the mapped boundary of the Riveaux Road Fire (
Figure 1).
There are ridgelines where elevations are above 800m. The wind at ridgetop level is broadly representative of geostrophic flow, and the alignment of ridgetops upwind of the Riveaux Road fire is conducive to funnelling of the north-westerly winds. This concave formation can serve to increase the of speed of northwest wind, and therefore fire propagation in leeside fire isochrones. On the other hand, downhill at the northwest of isochrone #1 can deaccelerate the wind speed. Note that isochrone #1 extended beyond the final measured area. This is because the intermediate isochrones were recorded by operational teams and can lack some accuracy relative to the final mapped fire boundary.
2.1.1. BARRRA-TA weather datasets and downscaled wind field
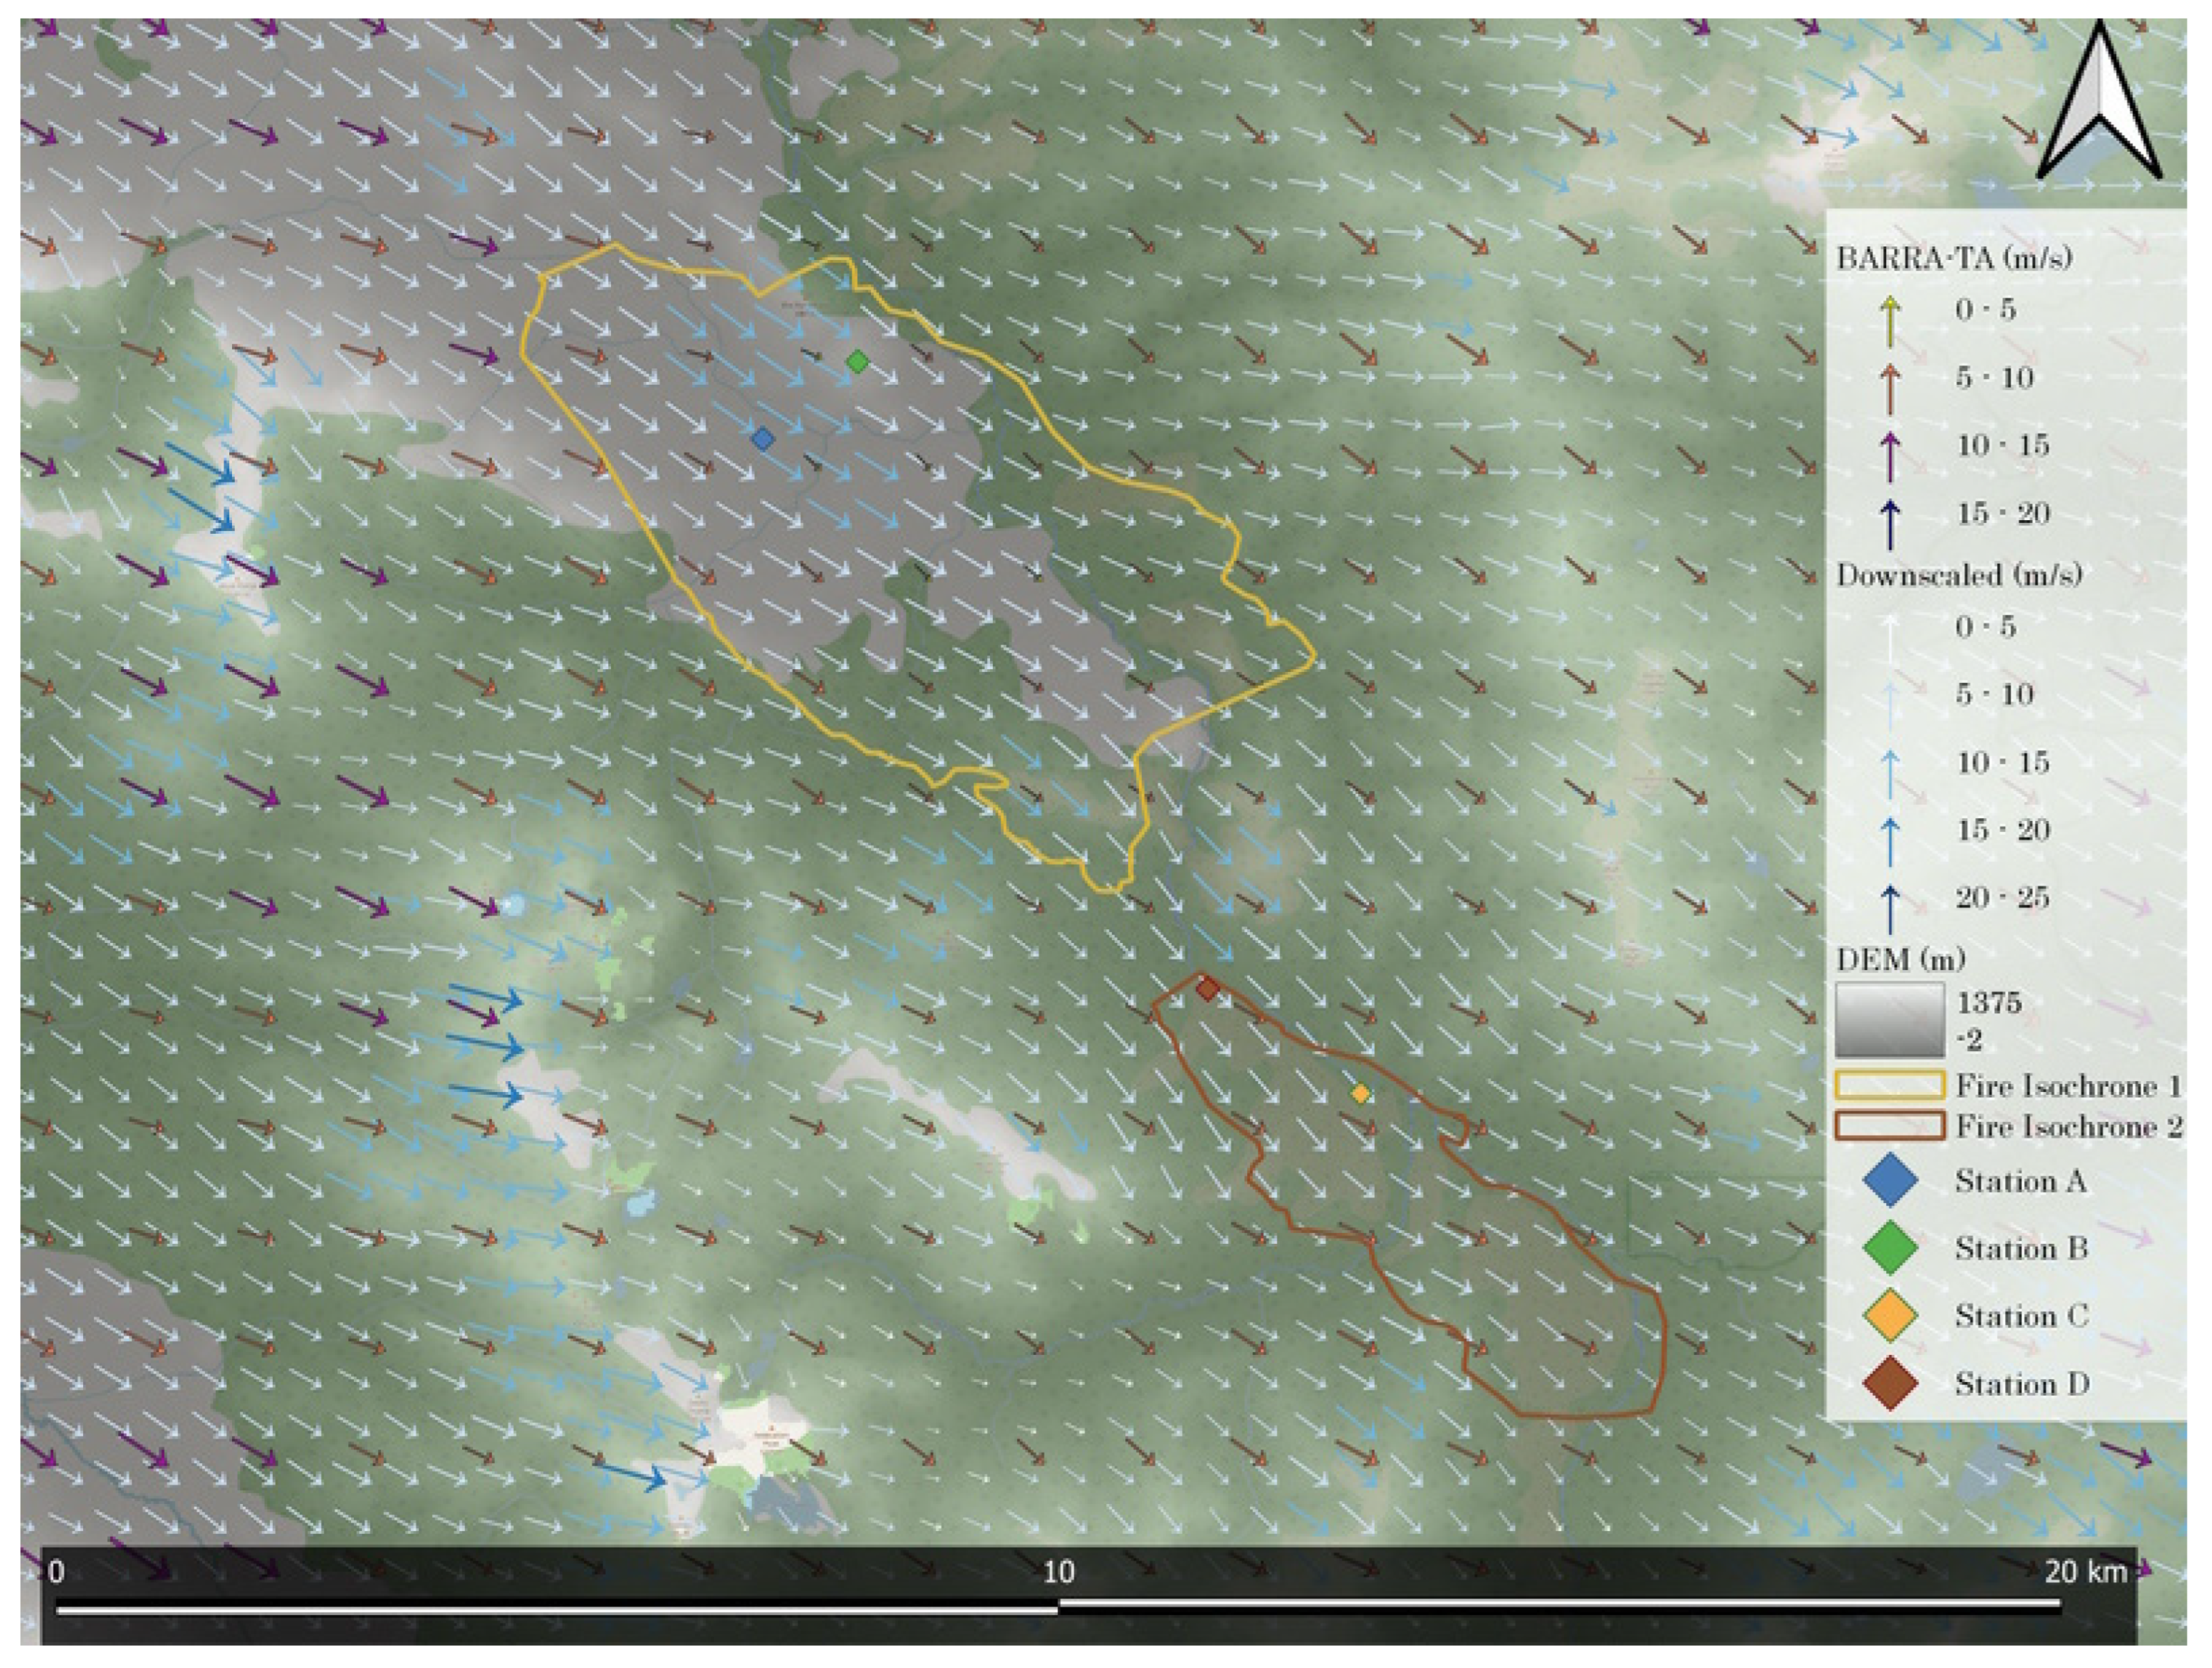
As in the previous study of wind in the Riveaux Road Fire (Ozaki et al., 2022), this study employs the Bureau of Meteorology Atmospheric high-resolution Regional Reanalysis for Australia for the Tasmanian region (BARRA-TA) which includes various weather parameters, such as cloud coverage, precipitation, atmospheric pressure at mean sea level, temperature, dew point temperature, geopotential height, soil moisture, relative humidity, and wind (Eizenberg et al., 2021). It consists of 21 atmospheric pressure levels as well as the ground surface level (Eizenberg et al., 2021). For finer-scaled surface winds, we downscaled the BARRA-TA wind field using the numerical WindNinja tool, with gridded initialisation configuration (Firelab, 2020). The resolution of the BARRA-TA and the downscaled field are approximately 1.5 km and 447 m respectively (
Figure 2).
The downscaled wind takes into account terrain-induced features such as terrain channel flow, deacceleration on leeside and speed-up over ridges by using a conservation of mass (CoM) solver (Wagenbrenner et al., 2019). Details of the downscaling methodology are described in the previous study (Ozaki et al., 2022). Both BARRA-TA and the downscaled winds are used to simulate the fire by expecting to capture synoptical wind interaction and topographical sensitivity respectively.
2.1.2. Fire isochrones and ignitions estimated from satellite’s hotspots
Two fire isochrones within the set describing the spread of the Riveaux Road Fire were acquired from Tasmania Fire Service and used as study fire sections. However, the isochrones do not contain any ignition point information indicating the location of the fire line at the start of the period (Tasmanian Fire Service, 2020). Therefore, the ignition zones are estimated from hotspots detected by satellite, employing data from the Visible Infrared Imaging Radiometer Suite (VIIRS) sensor on the Suomi National Polar-orbiting Partnership Program (S-NPP), and the AHI sensor on the Himawari-8 geostationary satellite (JAXA, 2022; Lee, 2014; Listi et al., 2018; ORNL DAAC, 2018; Schroeder, 2017). Area and ruggedness of isochrone #1 are greater than in isochrone #2 (
Table 1).
Note that the ruggedness is represented by the standard deviation of the digital elevation model (DEM) to be more sensitive for topography while it was only expressed by the gap between the maximum and minimum elevation in previous study. The comparison of isochrones from previous study is addressed further in Appendix A. Spatial and temporal resolution varies between the two satellite hotspot products. The temporal resolution in VIIRS data is poor with observations only six times a day at most (Lee, 2014; Schroeder, 2017; Wang, 2021), while spatial resolution is high, with a pixel size of 375 m. On the other hand, spatial resolution in the Himawari-8 hotspot detections is low, with 2 km pixels, but temporal resolution is extremely good, due to the geostationary nature of the satellite, with detection frequency of up to 10 minutes (Listi et al., 2018; Yumimoto et al., 2016).
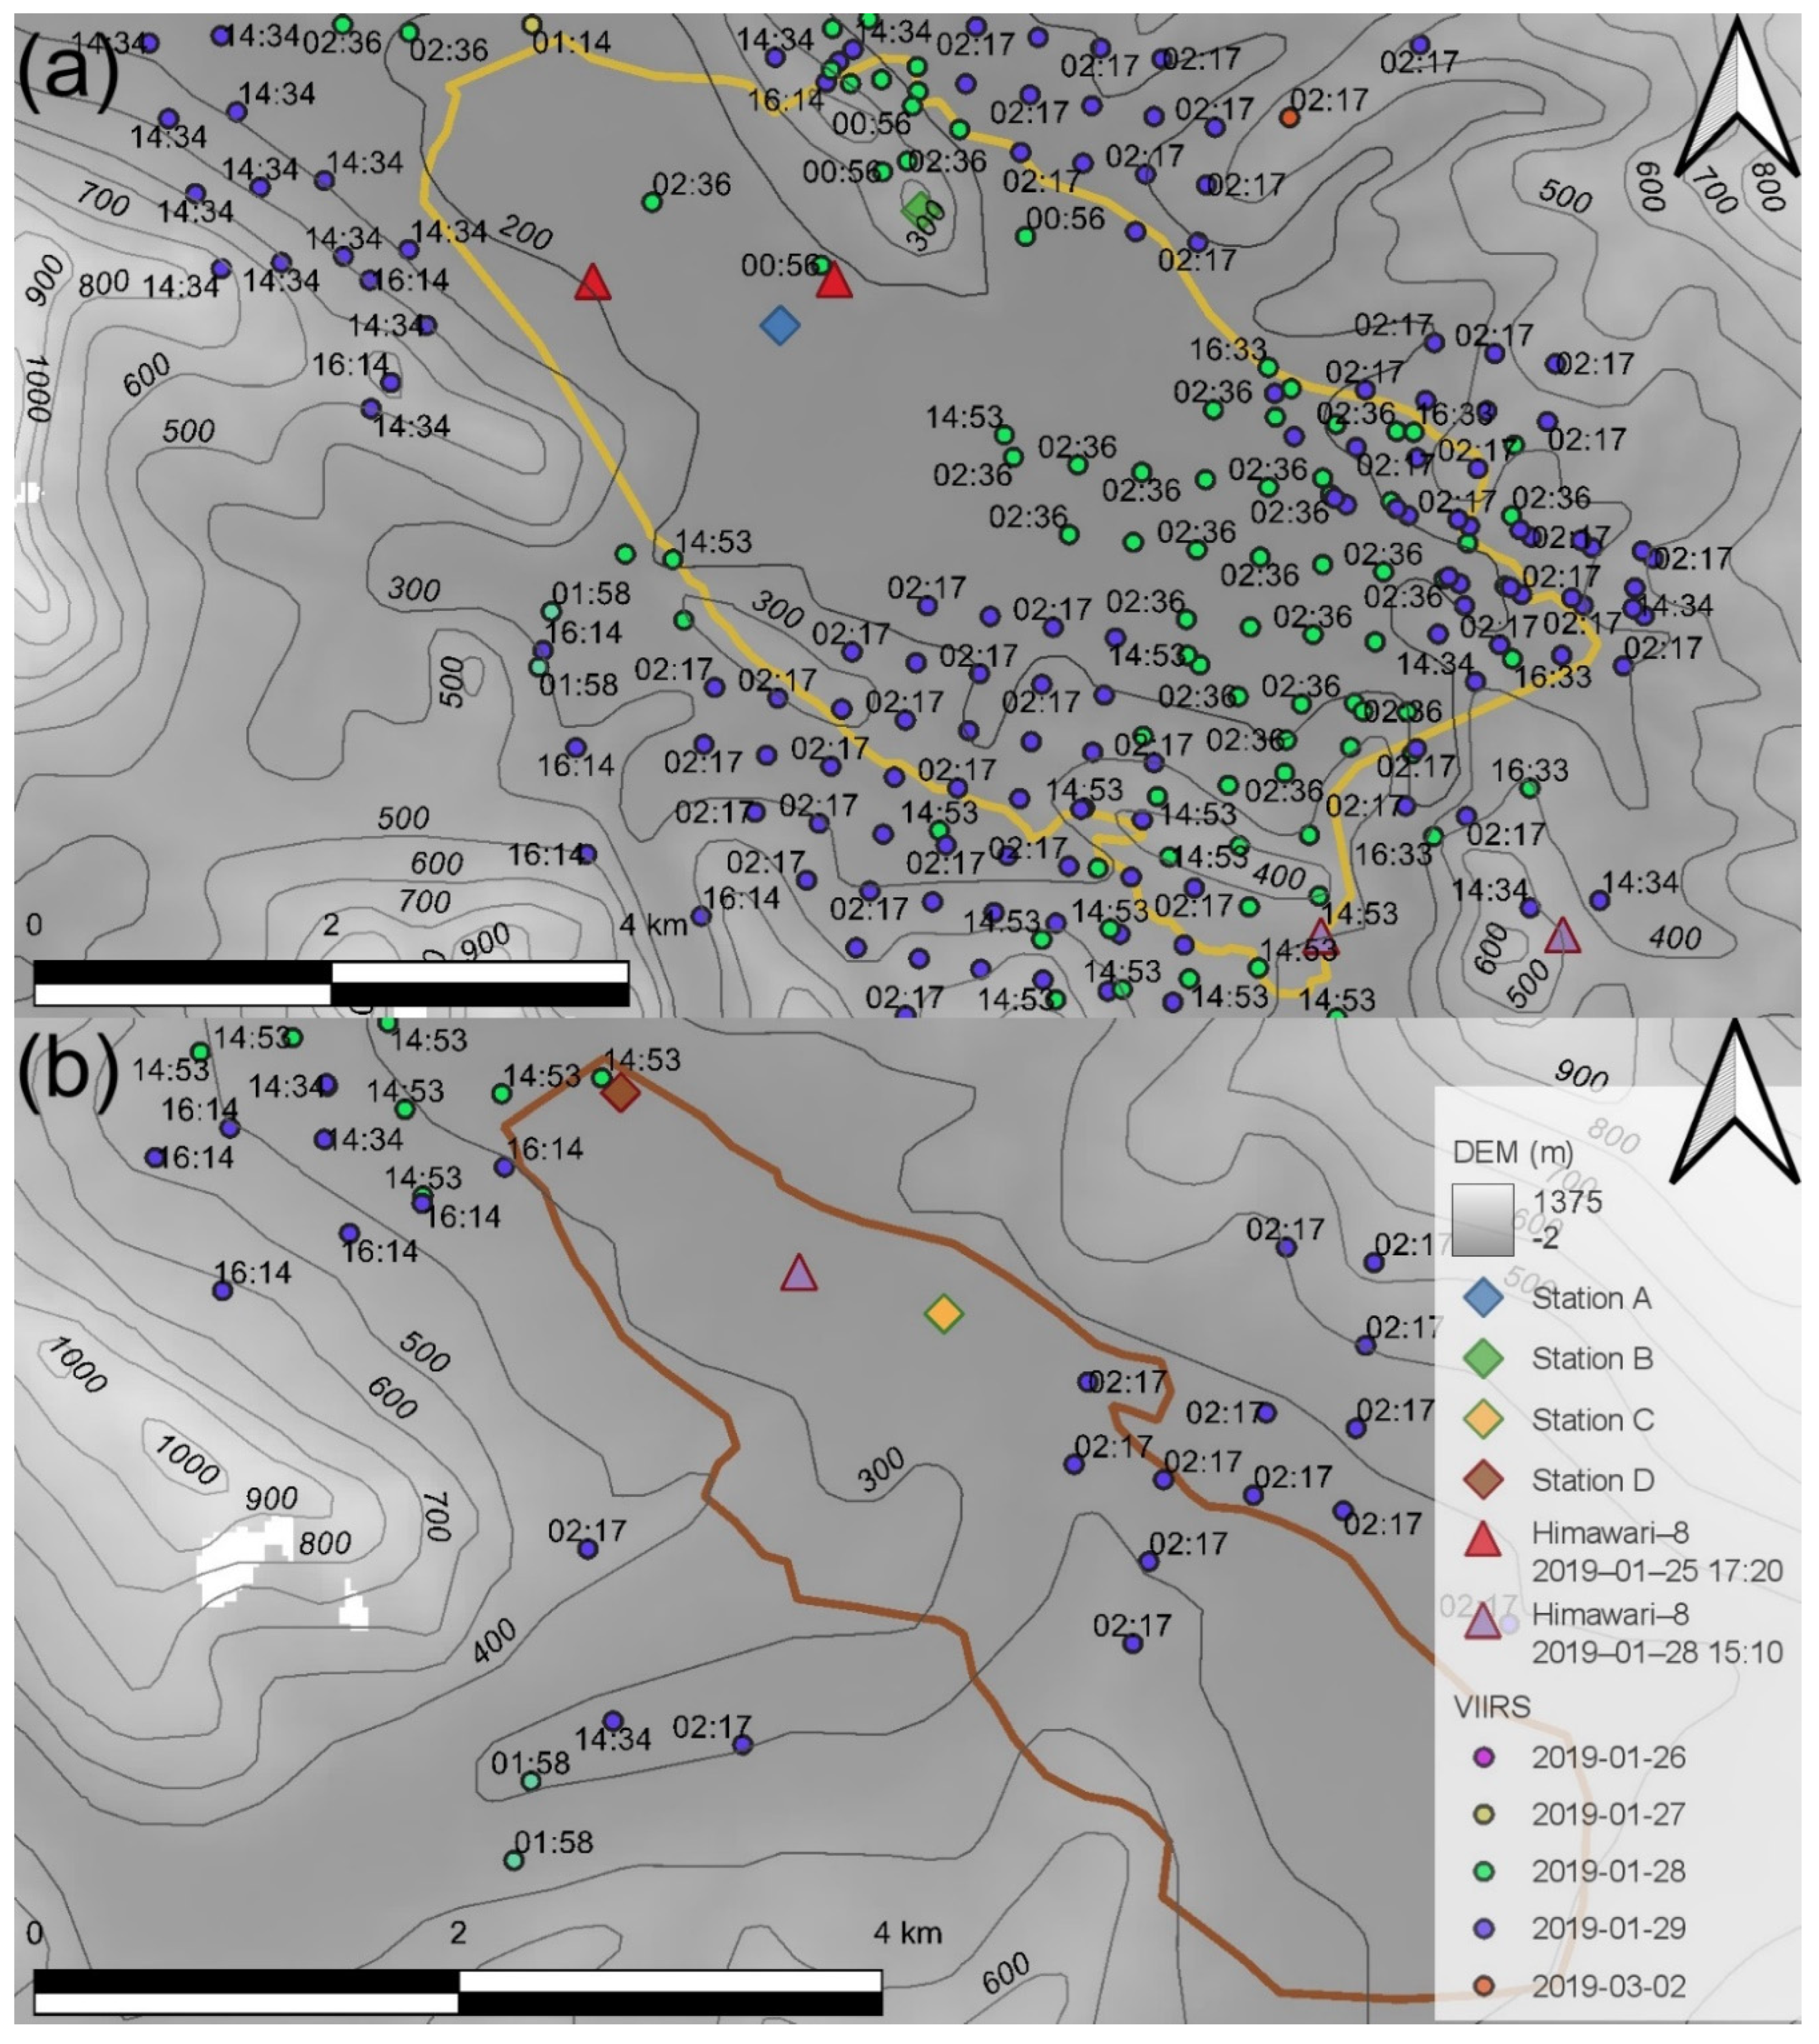
Two ignition candidates were identified and prepared for simulation in both isochrones, and pseudo weather stations placed at ignition locations, indicated by a blue diamond (A) and green diamond (B) in
Figure 3-(a), a yellow diamond (C) and brown diamond (D) in
Figure 3-(b).
Circular icons show local time on the maps and date on legend for S-NPP while Himawari-8 fire spots are shown as red or purple triangles on the map with local datetime on the legend in
Figure 3. Because no prior isochrones were available, it is necessary to include the possibility that the fire started from multiple independent ignitions within the first available isochrone. The location of the ignition point within isochrone #1 was estimated from Himawari-8 hotspots on 25
th January 2019 because the earliest hotspots in VIIR within this isochrone was only detected a day later, 26
th. Location of fire spread prior to this isochrone, and the location of the early hotspots indicated fire spread from the northern section of the fire. Station A appeared a more reasonable start point than Station B based on the hotspots’ distribution. Although both stations were close to fire hot spots identified Himawari-8 at 17:20 on 25
th Station A is more windward than the other. In addition, locations closer to S-NPP hotspots on the edge or outside the isochrone in the north are less appropriate by thinking of the valley structure, wind direction, and later ignitions than Himawari-8 hotspots. Due to these factors fire is primarily simulated with Station A. However, fire also is simulated with Station B to identify downslope wind separately by considering the tendency of wind direction, northwest to southeast. Station B was situated on a small ridge, whose elevation is 409 m, and is expected to show downslope fire spread. Indeed, east of the ignition is on lee slope and the elevation is below 150 m in isochrone #1.
Figure 3-(b) shows an ignition at pseudo weather station C and D in orange and brown diamond icons respectively in isochrone #2. The ignition time at station D was primarily determined because timestamps in both satellite images were close to each other. However, VIIRS hotspots with timestamp 14:53, presented in light green circles, are distributed outside isochrone #2 more than inside. This indicates some disparity in geographical distribution between two types of satellite, therefore, the station C was also selected in the middle among the observed hotspots.
There are several vegetation groups within the isochrones. The largest vegetation is buttongrass moorland, 58.77% and 54.60%, in isochrones #1 and #2 respectively (
Table 2).
2.2. Methods
Weather for fire periods was profiled prior to fire simulations. In addition, fire intensity during the period of each isochrone is quantified using geostationary satellite hotspot detections.
2.2.1. Numerical weather model vertical sounding (NWMVS), fire intensity and wind vector map
We employed numerical weather model vertical sounding (NWMVS) and wind vector map. Further, three types of time series graph are used for NWMVS. The first type of graph shows wind direction and magnitude and is expected to show dynamic wind’s features. This graph type contains several pressure levels and near ground surface, which is 10 m above the ground. There are two types of surface wind fields employed, BARRA-TA and the wind downscaled by WindNinja. Geostrophic wind (I.e. assumed unmodified by topography) is taken at 850 hPa (Whiteman & Doran, 1993). The second type of graph shows temperature (oC) and dew point temperature (oC) in near surface level as well as cloud coverage (%). These weather parameters also contribute to the simulation of fire behaviour (Ozaki et al., 2022). The last is a comparison of fire intensity (%) calculated from hotspots in Himawari-8 images, surface wind magnitude (%) in BARRA-TA and cloud coverage (%) in BARRA-TA to show the validity of fire intensity under the clouds. Note that the percentage of the fire intensity and surface wind magnitude are calculated for each timestamp as:
where value
rel is a relative figure (%) for fire intensity or wind magnitude. In the same manner, value
abs represents an absolute figure. Value
min and value
max denote minimum and maximum figures measured during the period for each station. However, cloud coverage (%) is an exception, which was retrieved from BARRA-TA directly. Compared with these vertical diagnoses, wind vector maps allow provision of a larger picture of near ground surface flow of the BARRA-TA wind field and these maps capture the time of ignition of each isochrone. The BARRA-TA wind field is chosen for these maps because the scale of the maps is too large for the downscaled wind to depict the flow of the entire fire area.
2.2.2. Prototype 2
Prototype 2 is an integrated fire simulator in which several fire behaviour models are automatically selected depending on the type of vegetation by following the specification of Australian Fire Danger Rating System (Ozaki et al., 2022; The Australasian Fire and Emergency Service Authorities Council (AFAC), 2020). Each fire model in Prototype 2 ingests topography, vegetation and weather data, such as temperature, relative humidity, wind direction and magnitude (Ozaki et al., 2022). Wind type, derived from either BARRA-TA or downscaled WindNinja fields, can be selected in the configuration. The prediction results are recorded in prediction grids whose geometry can be selected from Delaunay, diamond, hexagon, square or Voronoi, and contains two columns: burnt time and status indicators such as “Not Yet”, “Work In Progress” and “Completed”. In this study, 10 runs are simulated for each pseudo station, comprising all five cell geometries with two types of wind fields. The recorded burnt time can be used to compute fire speed. Distance and slope angle are computed by combination of prediction polygon and digital elevation model (DEM). In this study, the distance on leeward slope is measured from ignition point whose elevation is 409 m to the bottom whose elevation equal to or below 150 m within the burnt prediction polygon in isochrone #1. In the same manner, slope angle and fire speed are calculated from these two locations. In the previous study, simulation was initialised with ignition timestamps and locations provided by Tasmania Fire Service (TFS). However, there were no recorded ignition points in the isochrones, with spread from surrounding burnt areas likely but not confirmed. Hence, ignition points in these isochrones are estimated using hotspots from satellite images, rather than assuming direct spread from previous areas and allowing for the possibility of spot fire ignition. Rate of fire spread (ROS) for these simulations was bias adjusted using data from other isochrones with accurately known ignition points and times.
2.2.3. Verification
Two metrics were employed to compare simulated fire spread extent with the observed fire isochrone: a fraction skills score (FSS) and confusion matrix (CM) (Ozaki et al., 2022). FSS is a probabilistic statistical metric considering a cell and neighbouring grids. An advantage of FSS is presence of “useful”, a threshold that confirms model accuracy relative to observation (Ebert, 2008, 2009; Faggian et al., 2015). Precision is one of indicators in CM and shows the degree of a simulated area overlapping on total simulated fire area in this study (Markham, 2014; Ozaki et al., 2022).
3. Results
Terrain-forced channelling resulted in fire spread along the valley. In addition, the fire intensity changed in accordance with the wind magnitude in buttongrass moorland which can smoulder beneath the ground even though the intensity is low.
3.1. Numerical weather model vertical sounding (NWMVS), fire intensity, and wind vector map
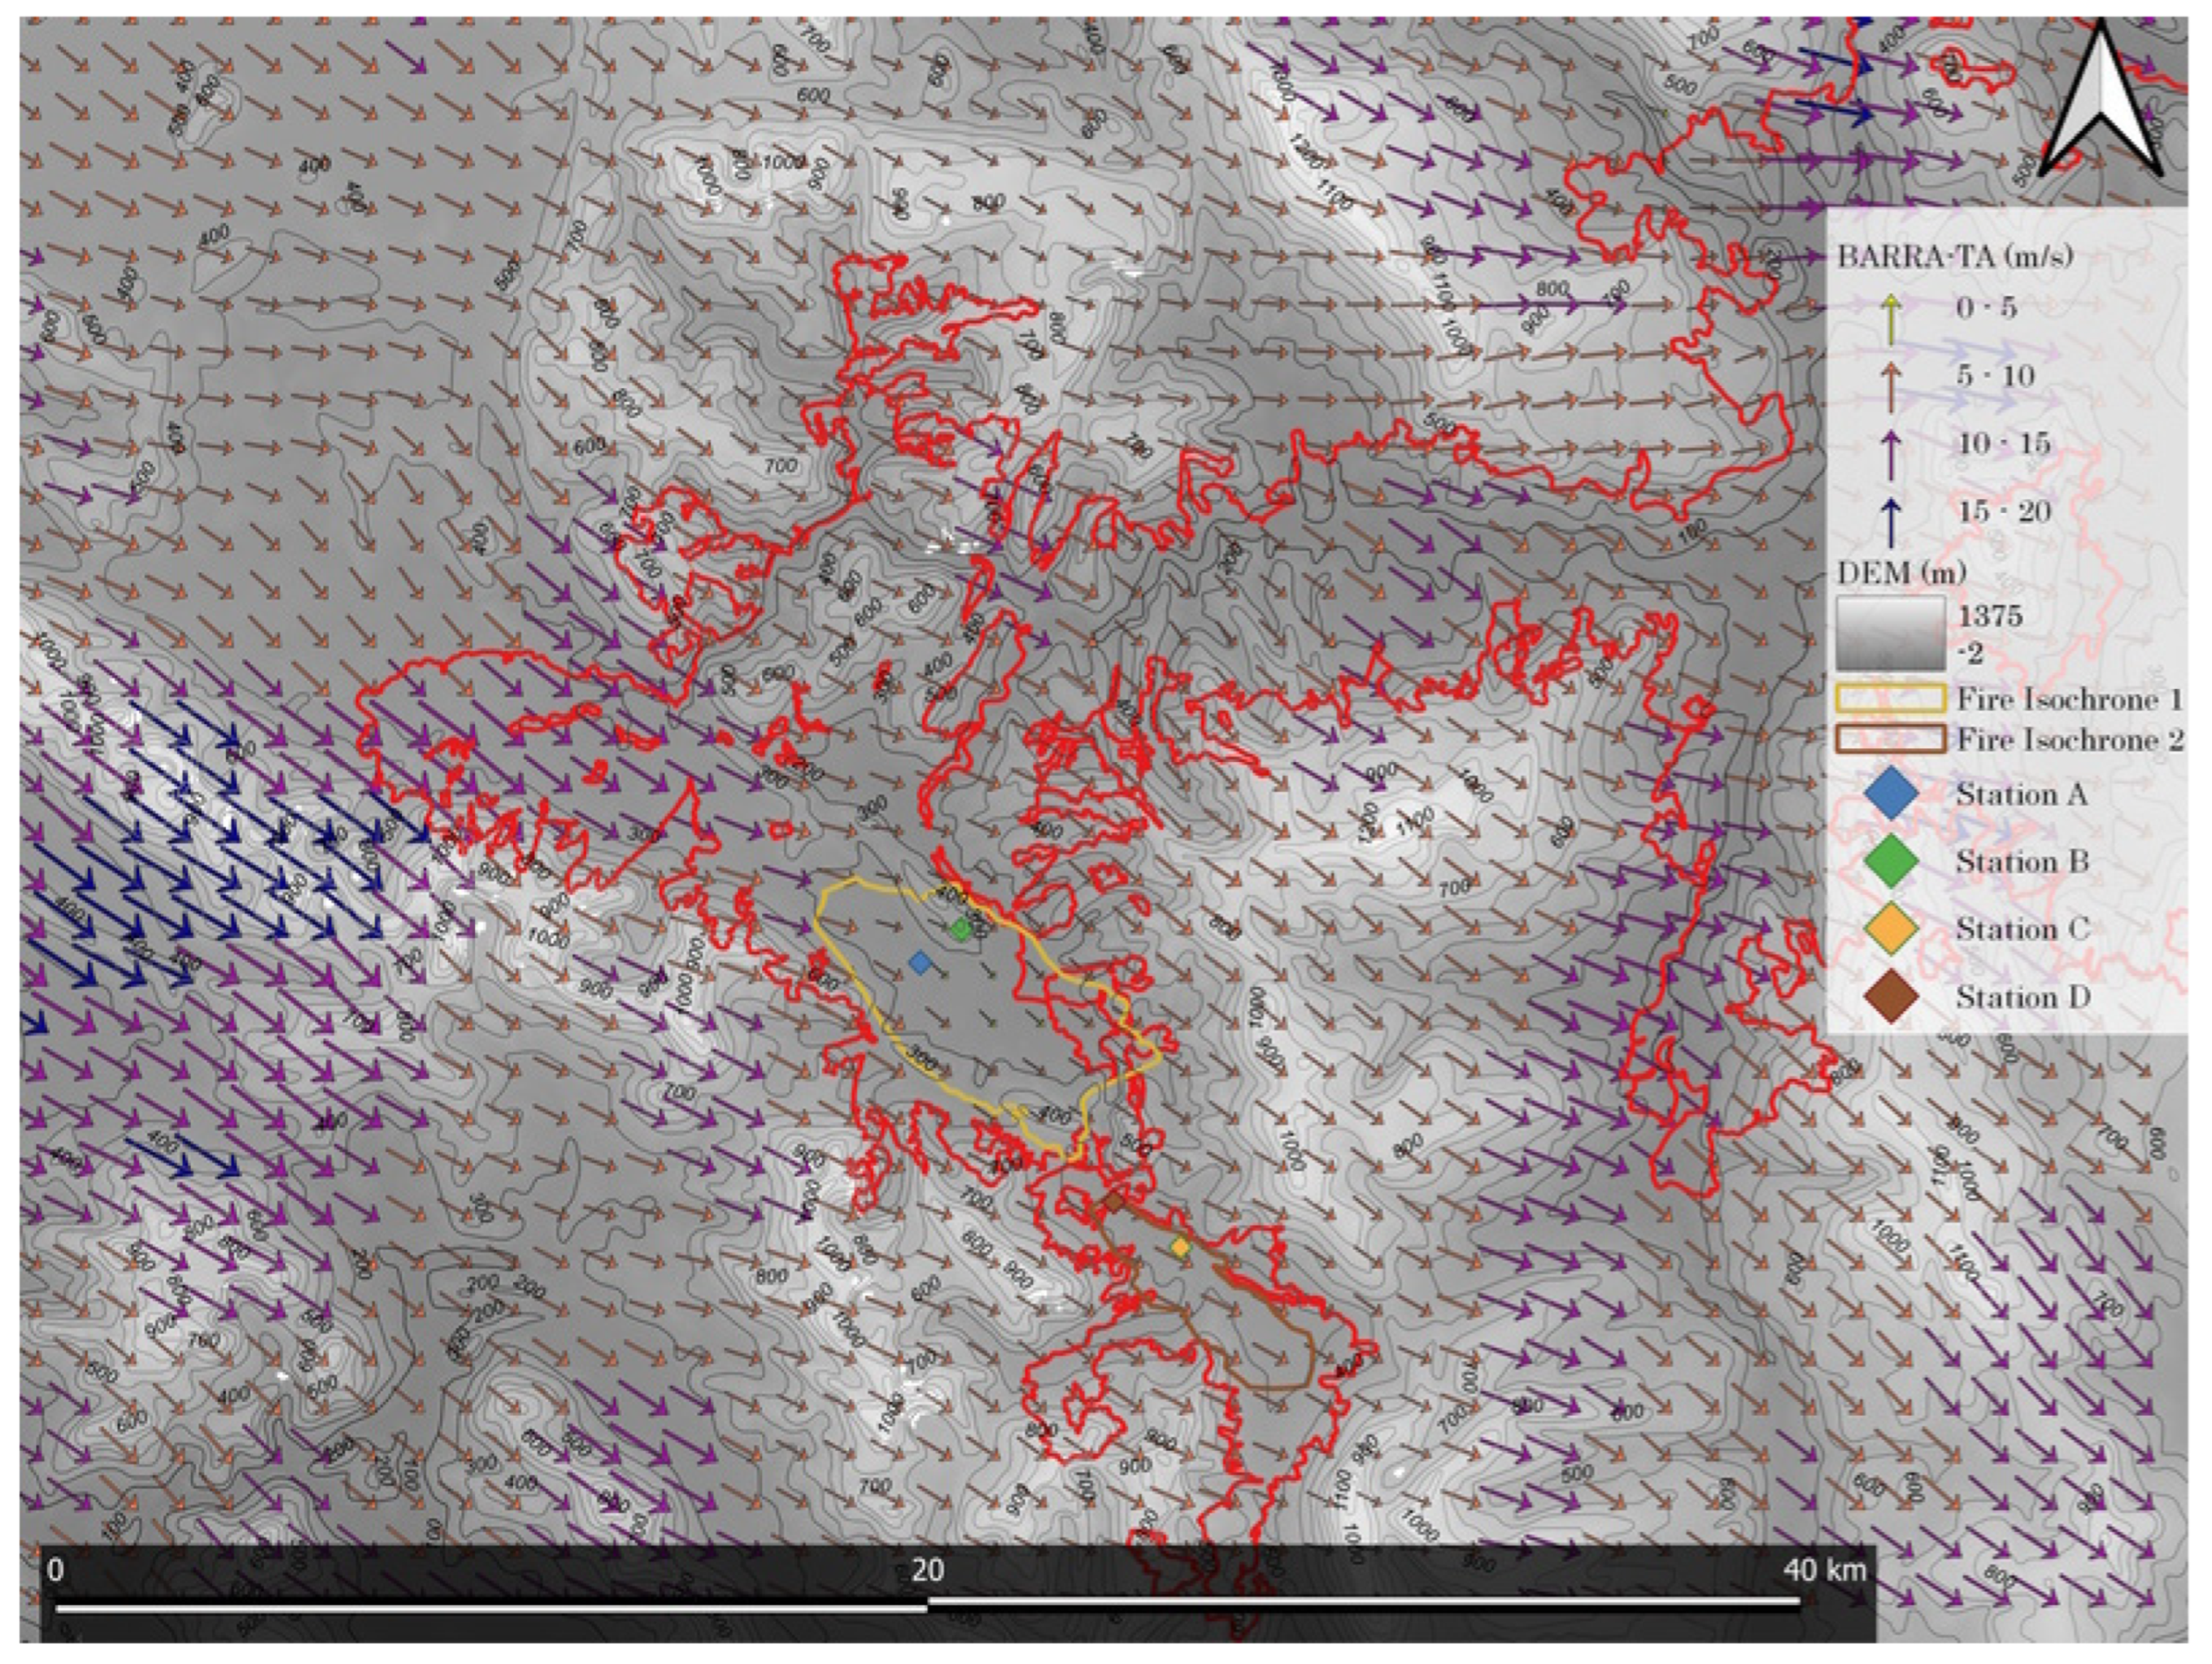
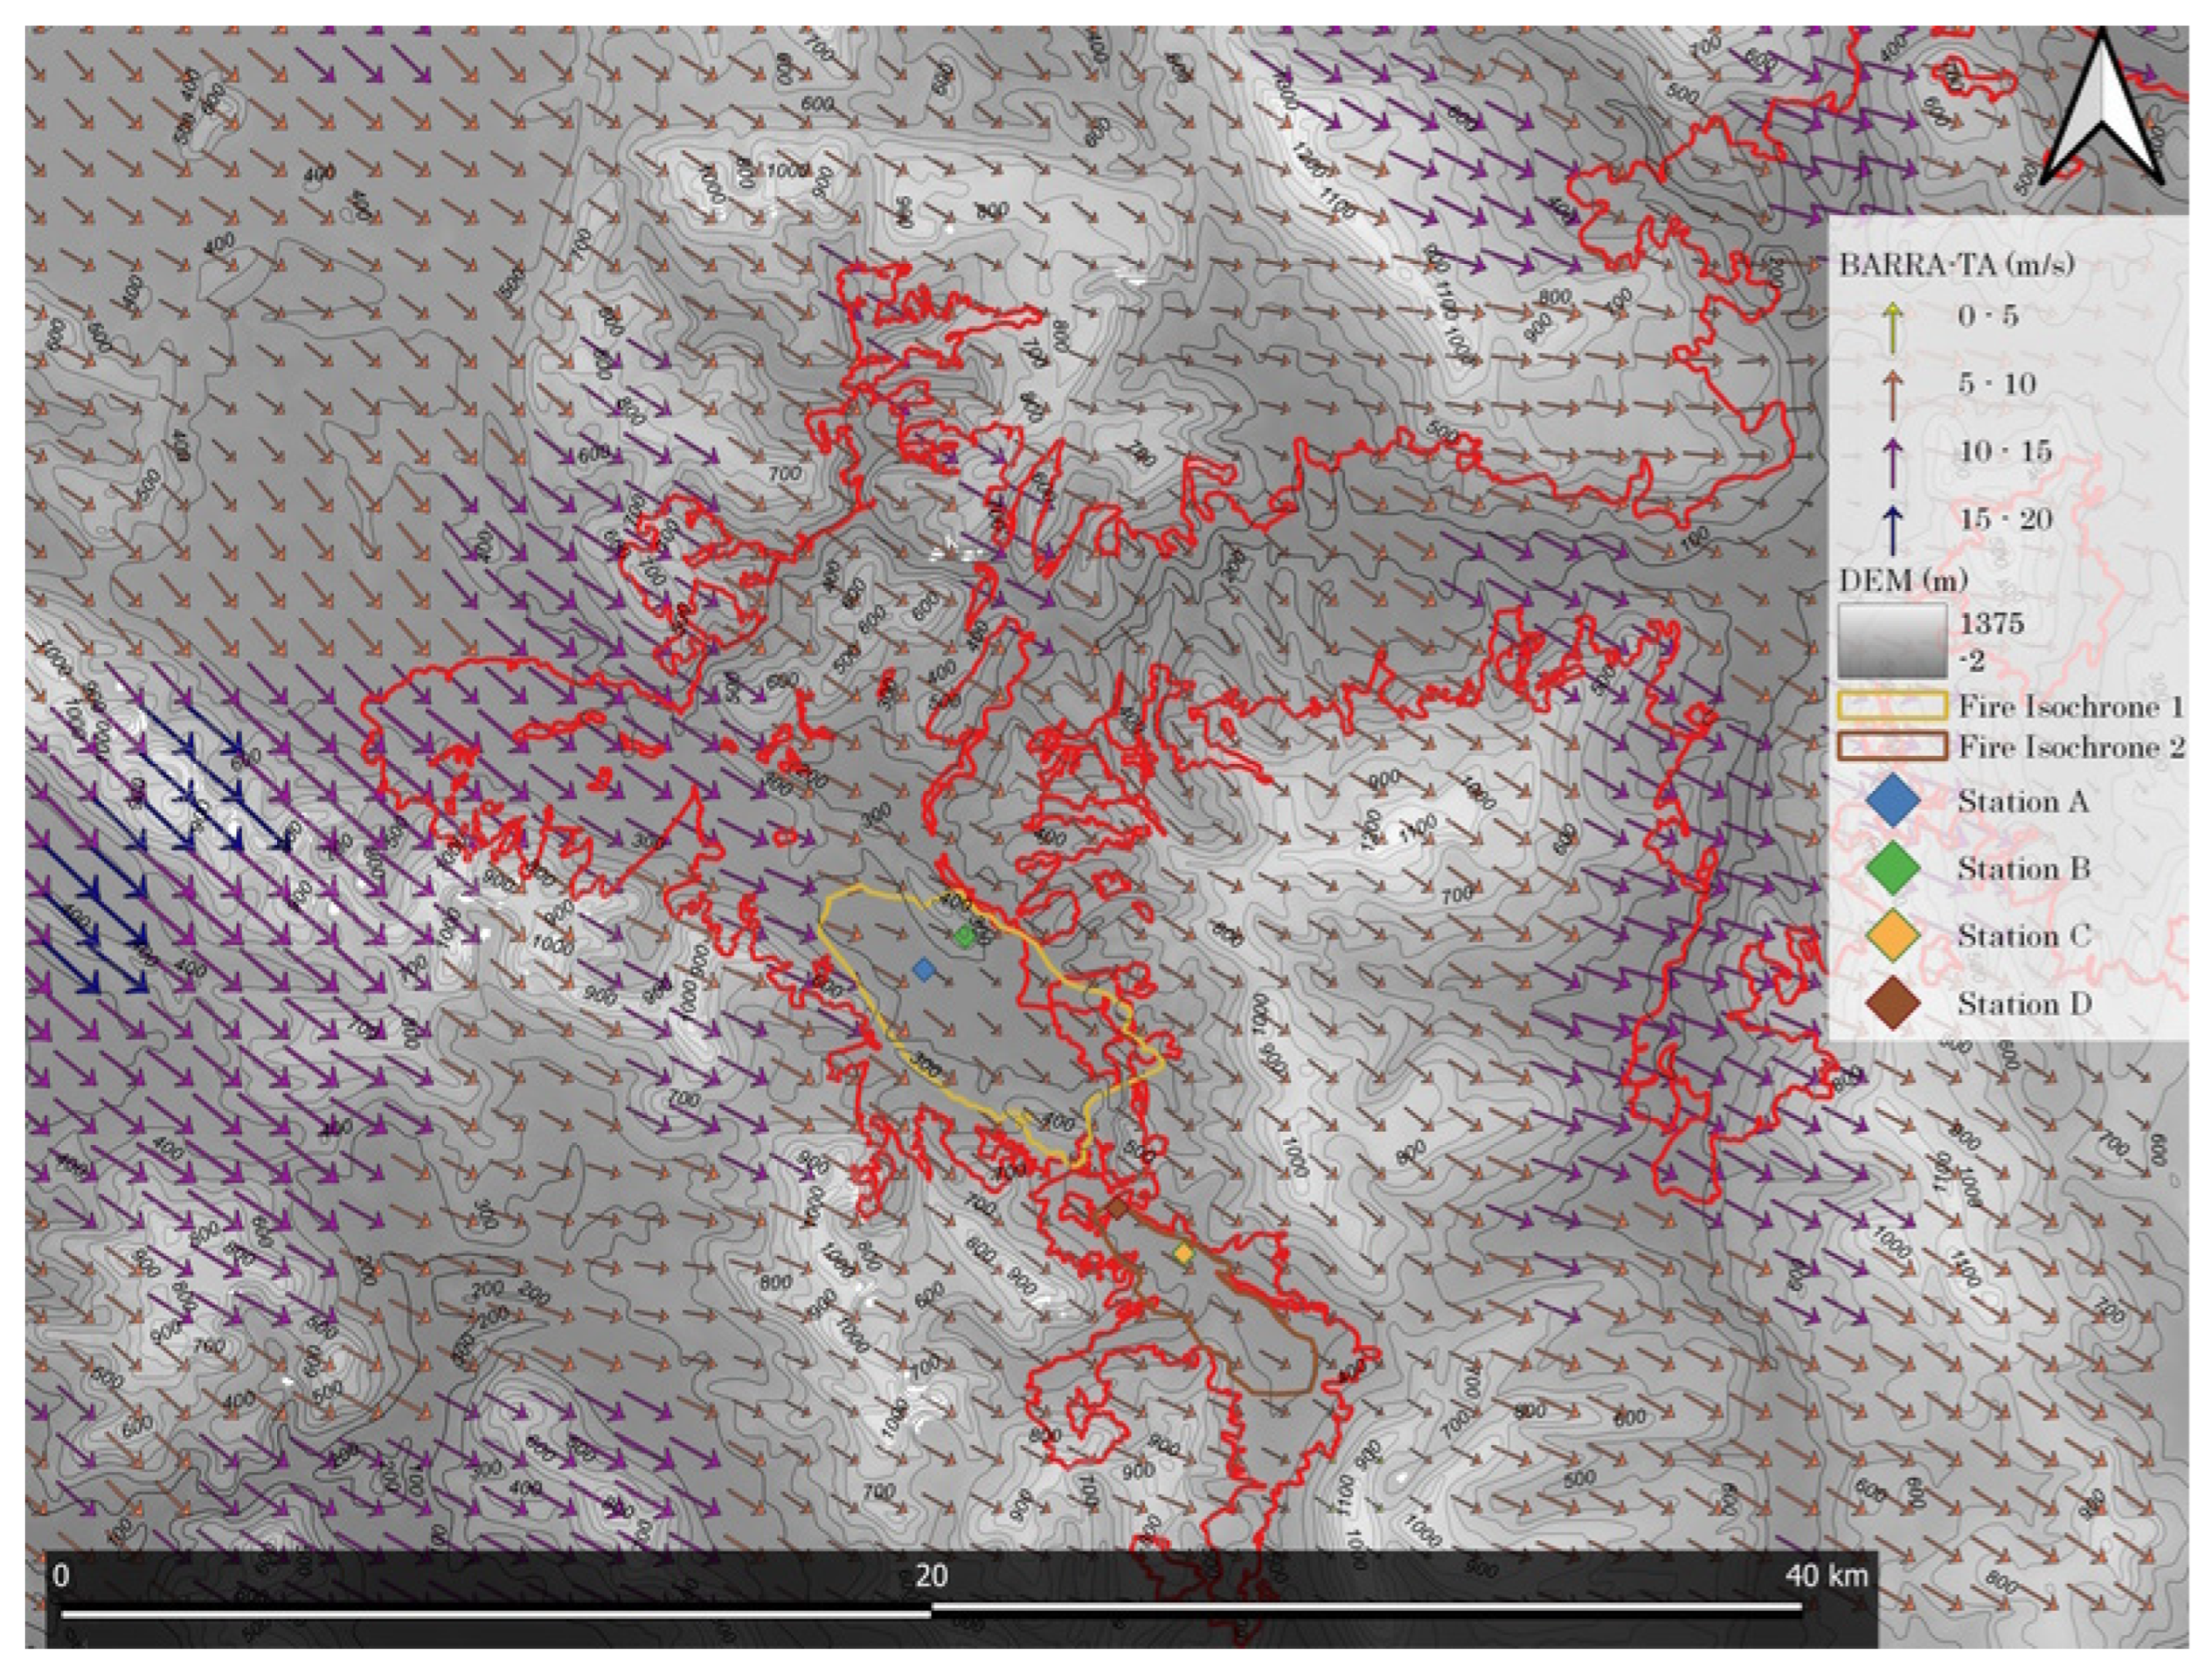
Wind vector maps revealed convergence of ground surface wind, and analysis of the numerical weather model vertical sounding (NWMVS) indicated some presence of dynamic winds and association with fire intensity during the fire spread in two isochrones. Firstly, the convergence of surface wind field appears at windward, which was northwest of the entire fire area at ignition time of both isochrone #1 and #2 (
Figure 4 and
Figure 5).
These converged winds increased speed at entrance of the fire area (
Figure 4). Although the speed was mitigated before reaching isochrone #1 in which elevation turned out to be slightly lower, the direction mostly remained consistent. The wind magnitude was slightly regained at ignition #2 where there is slight concavity before reaching the isochrone (
Figure 5).
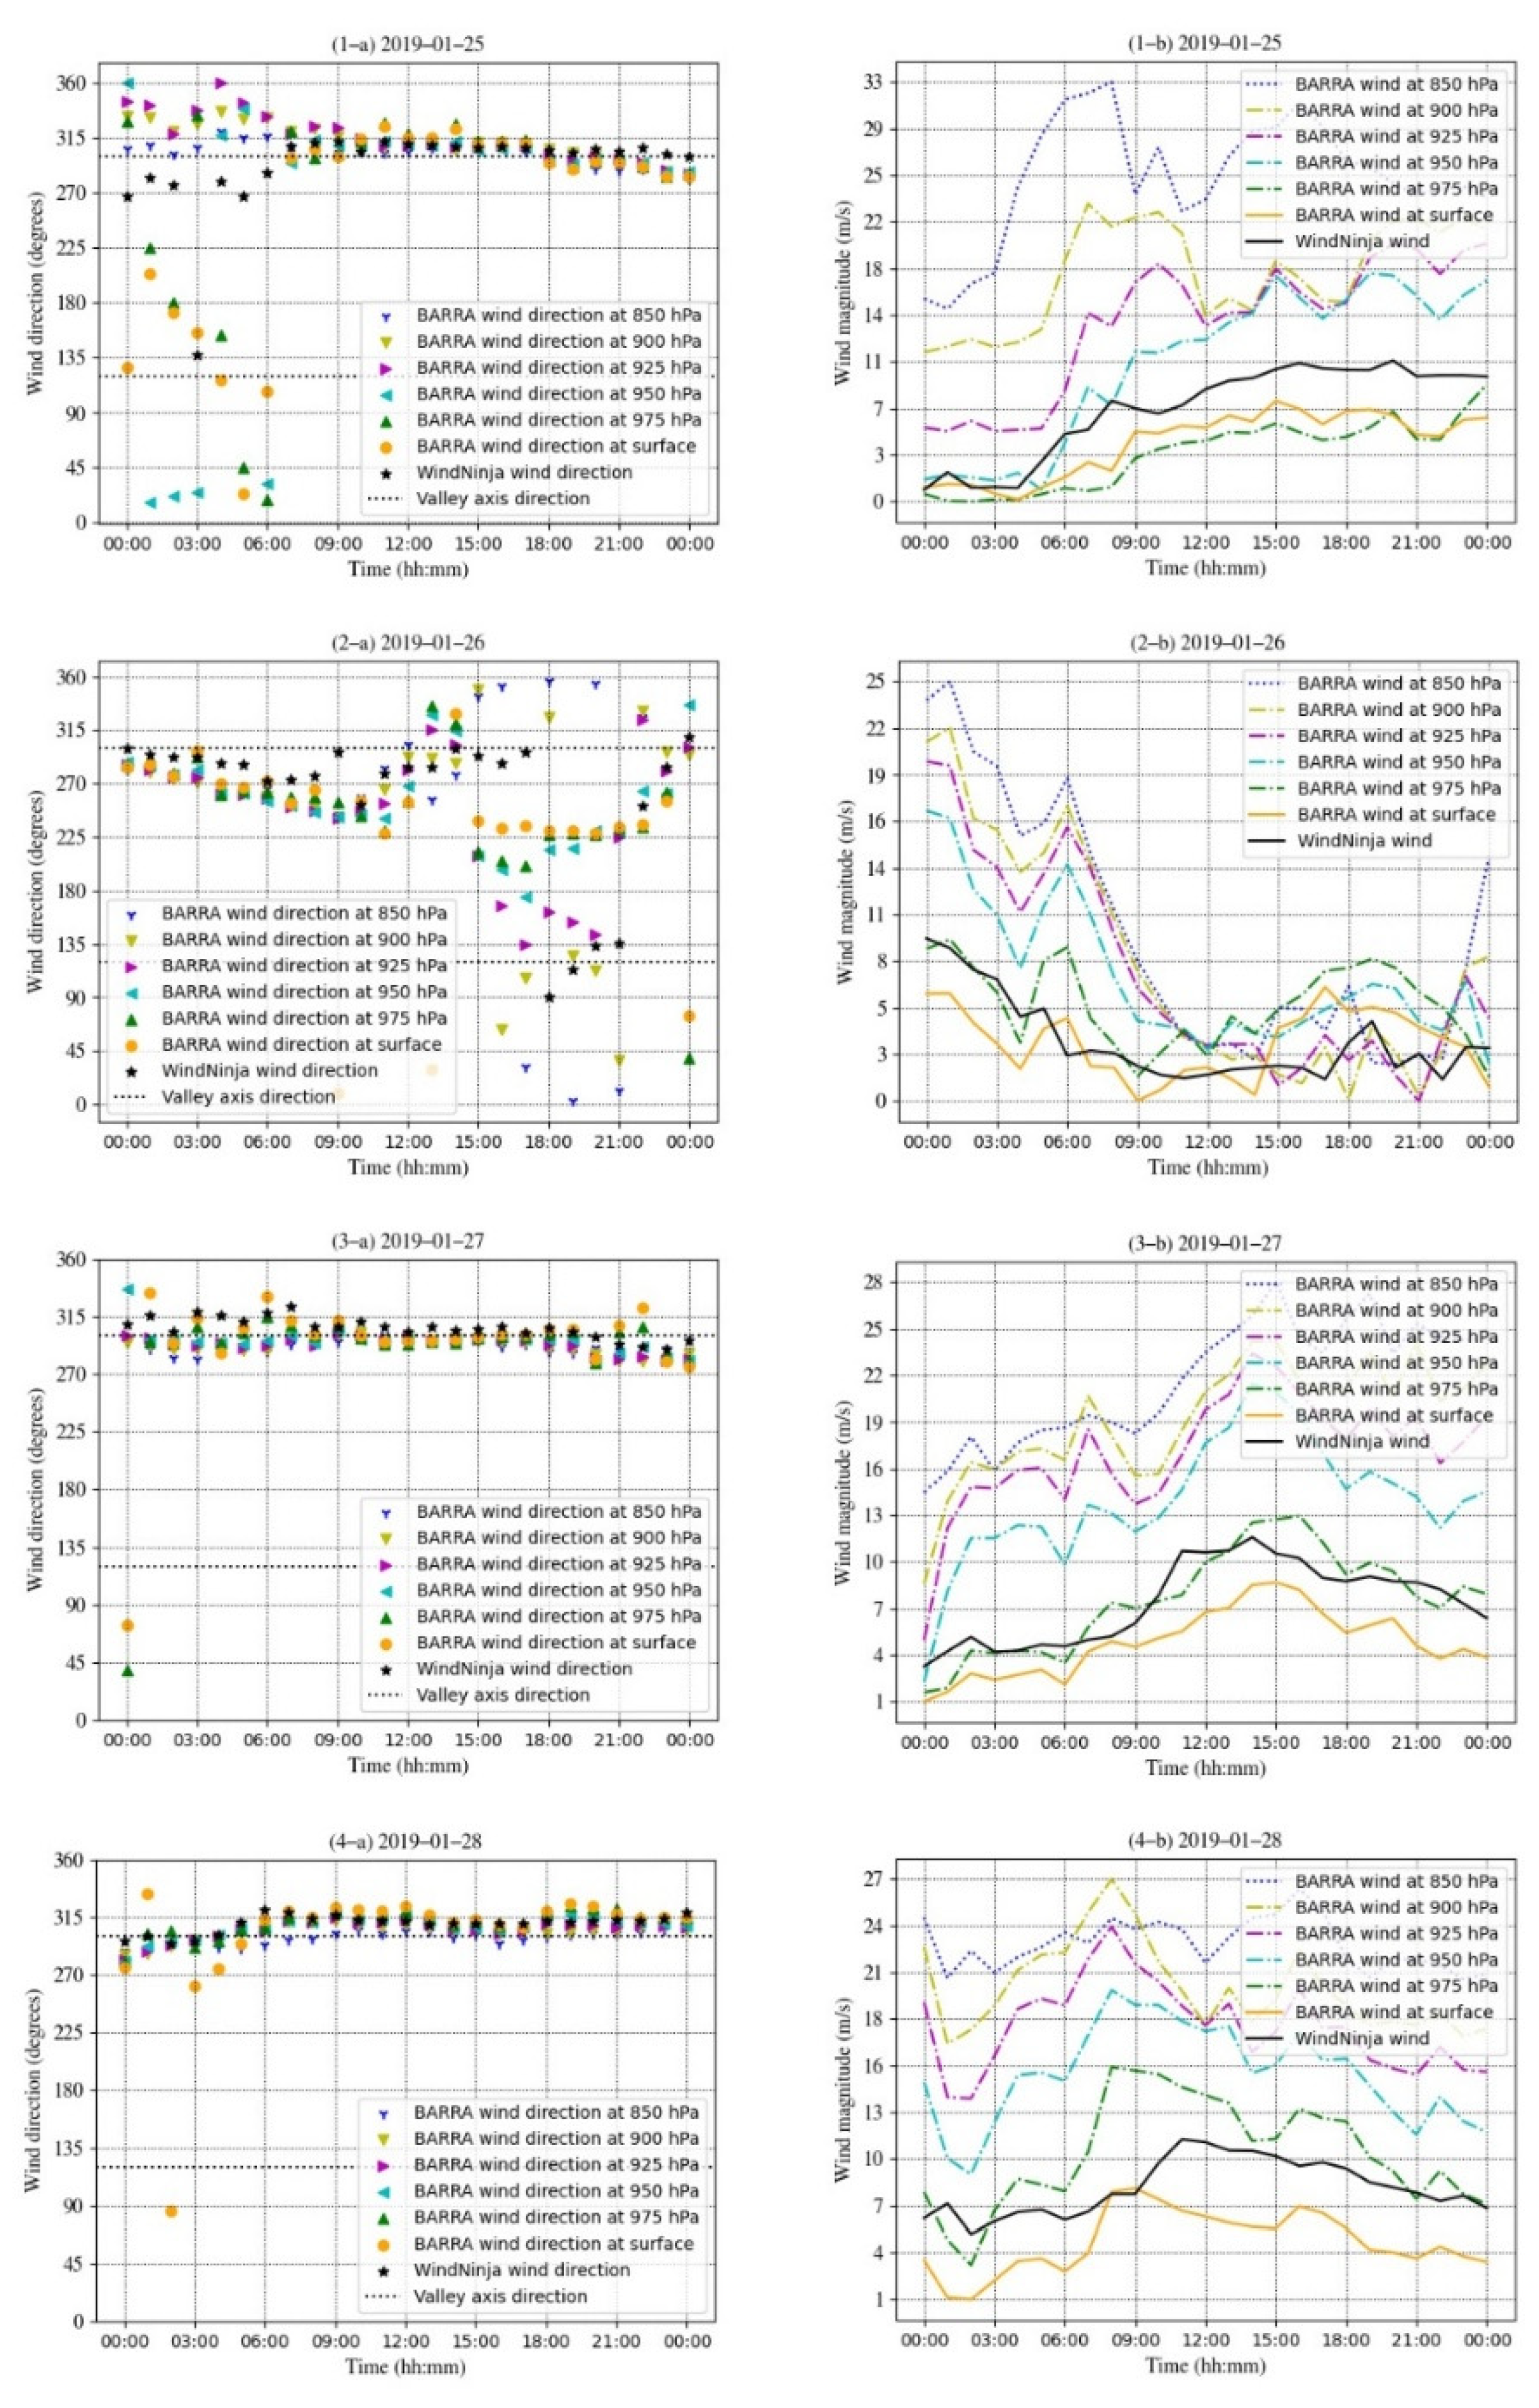
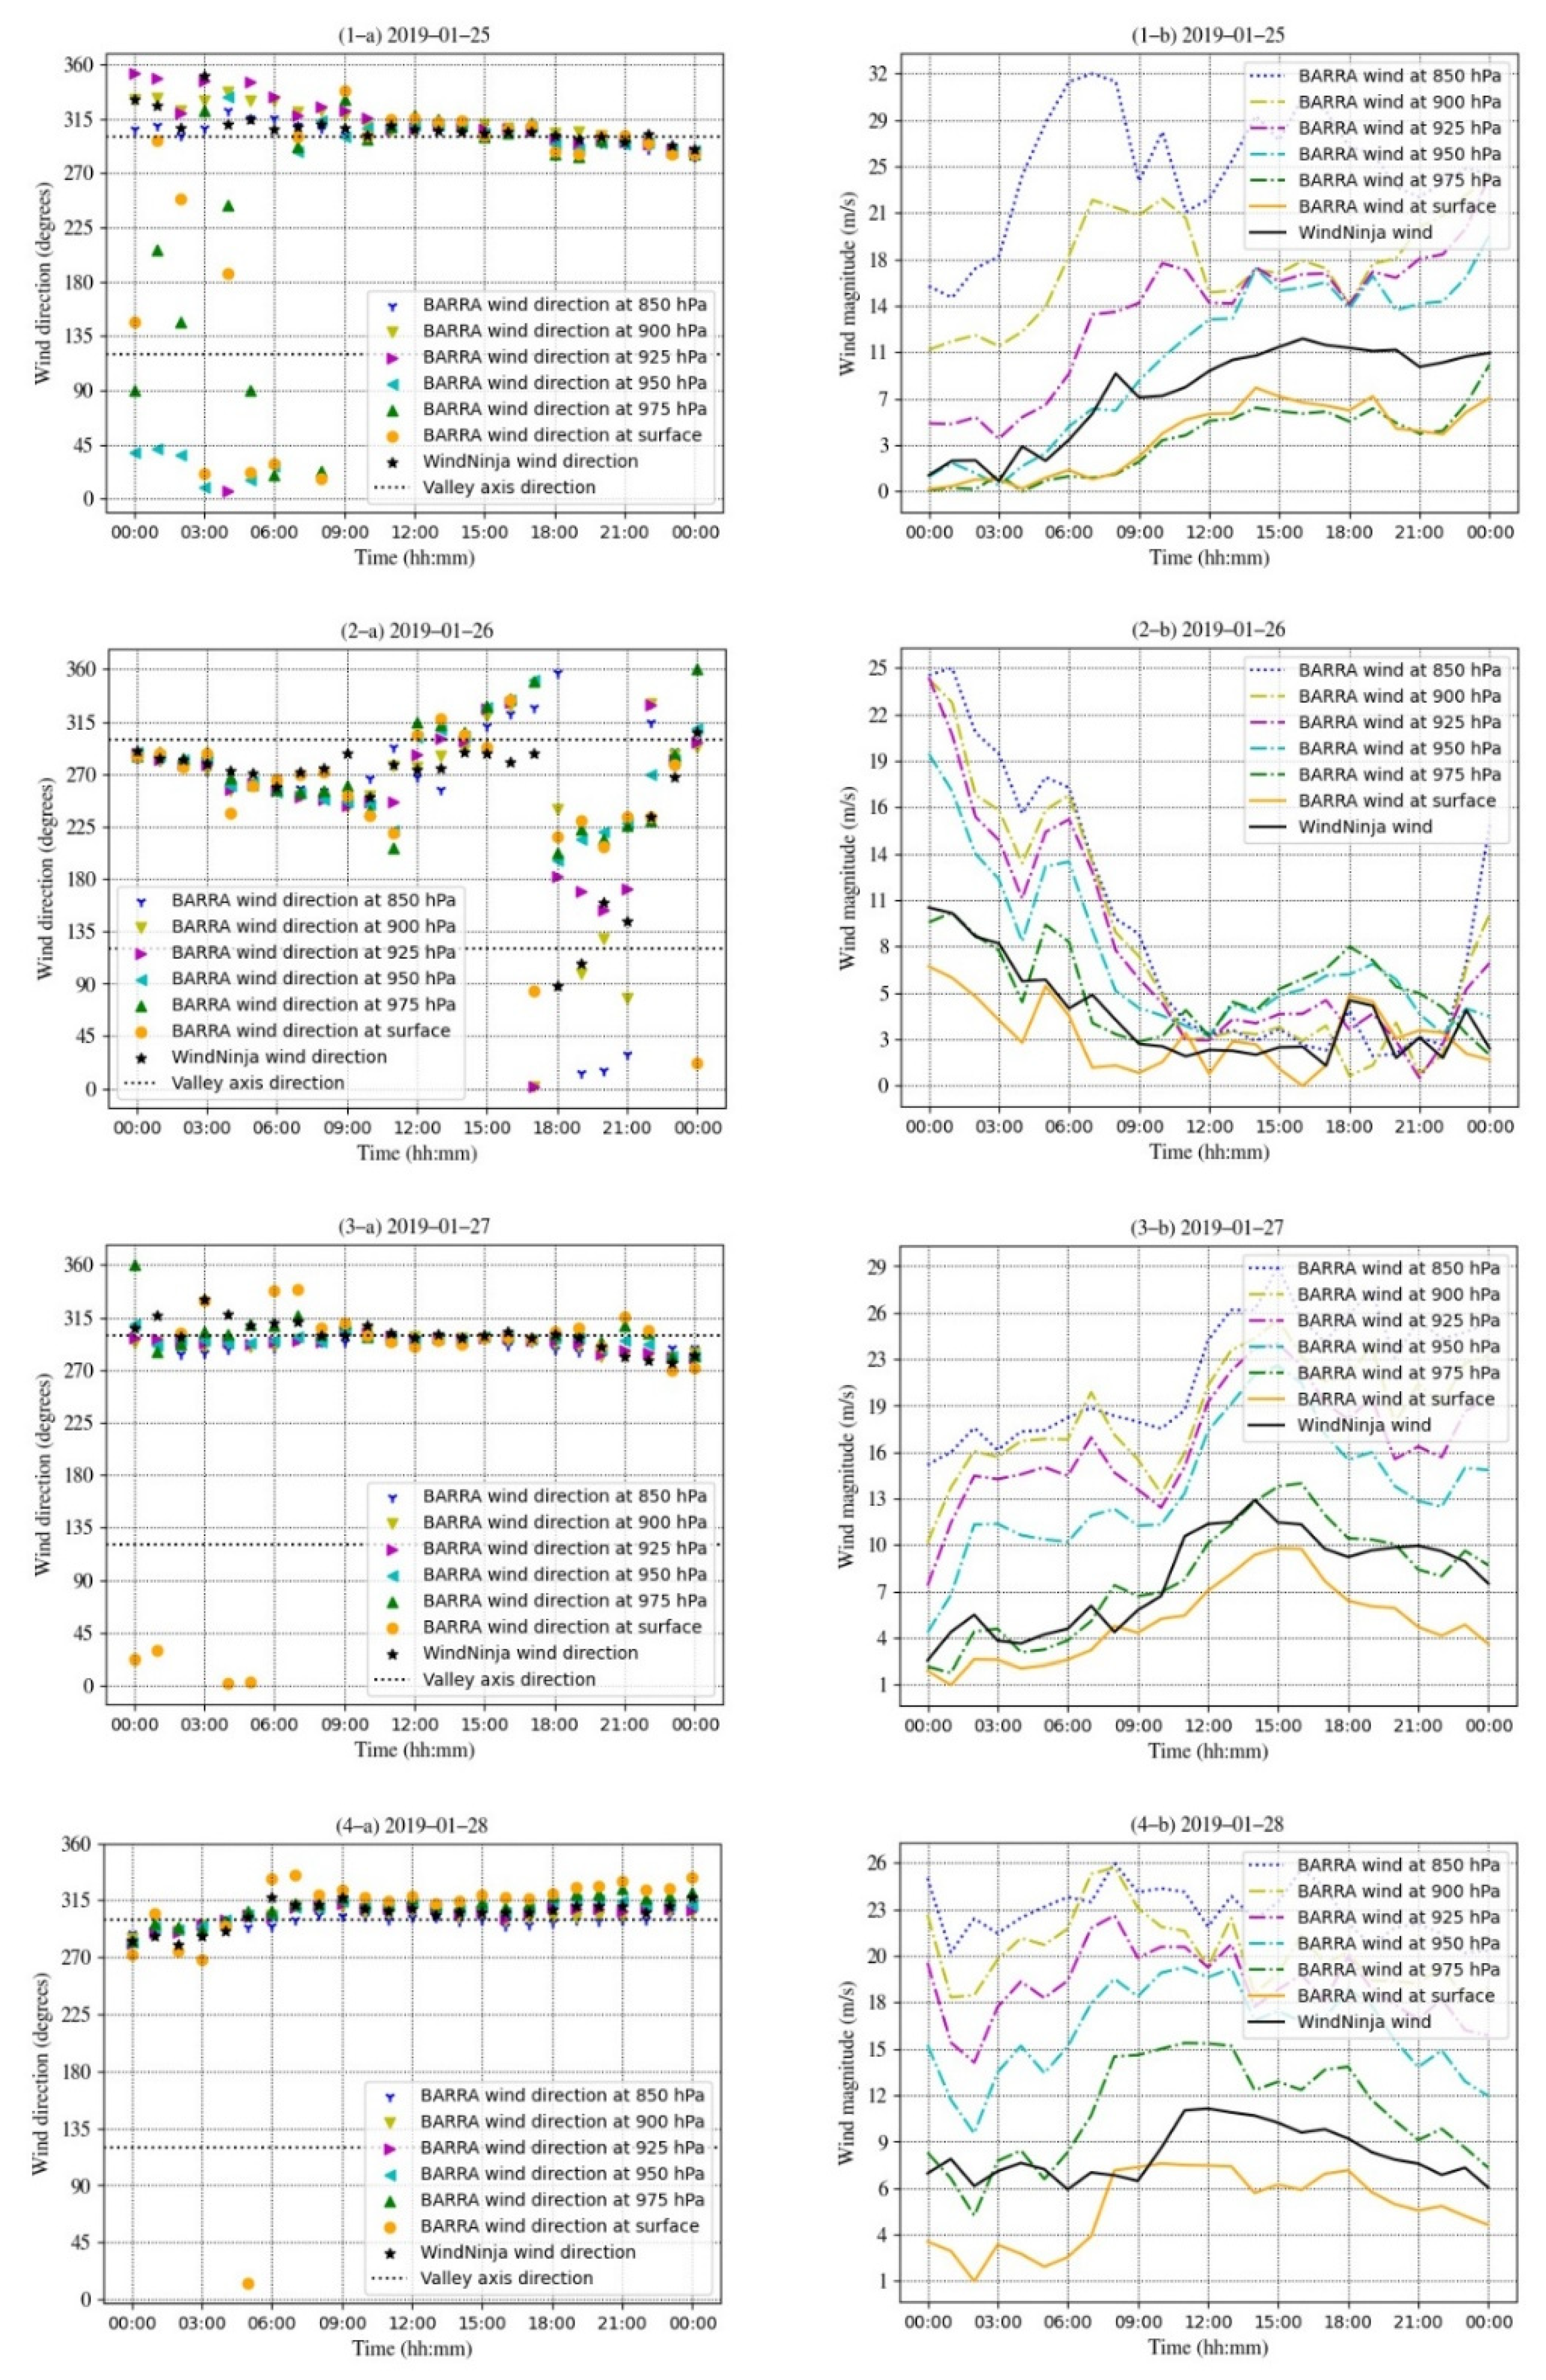
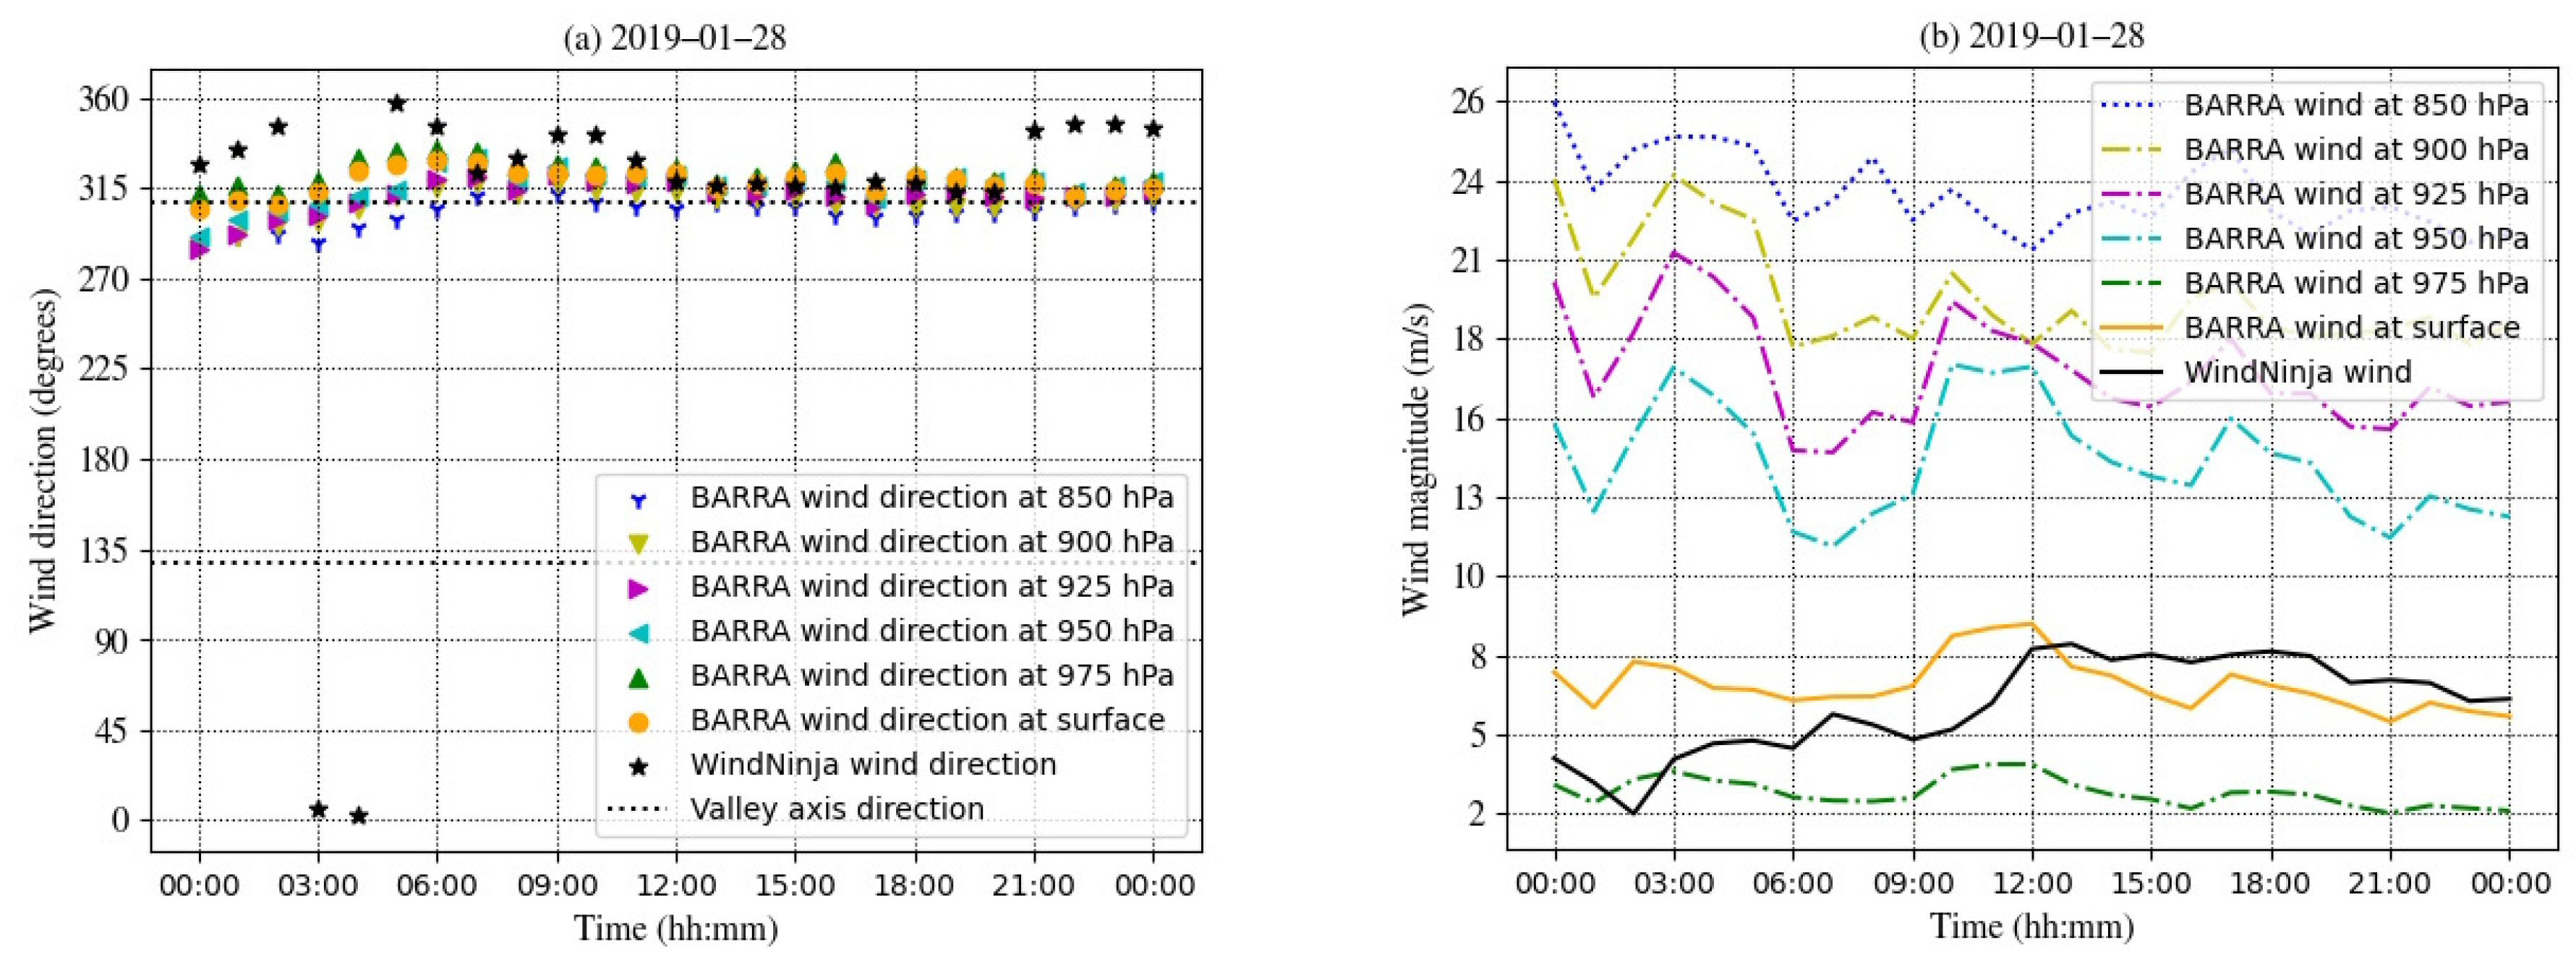
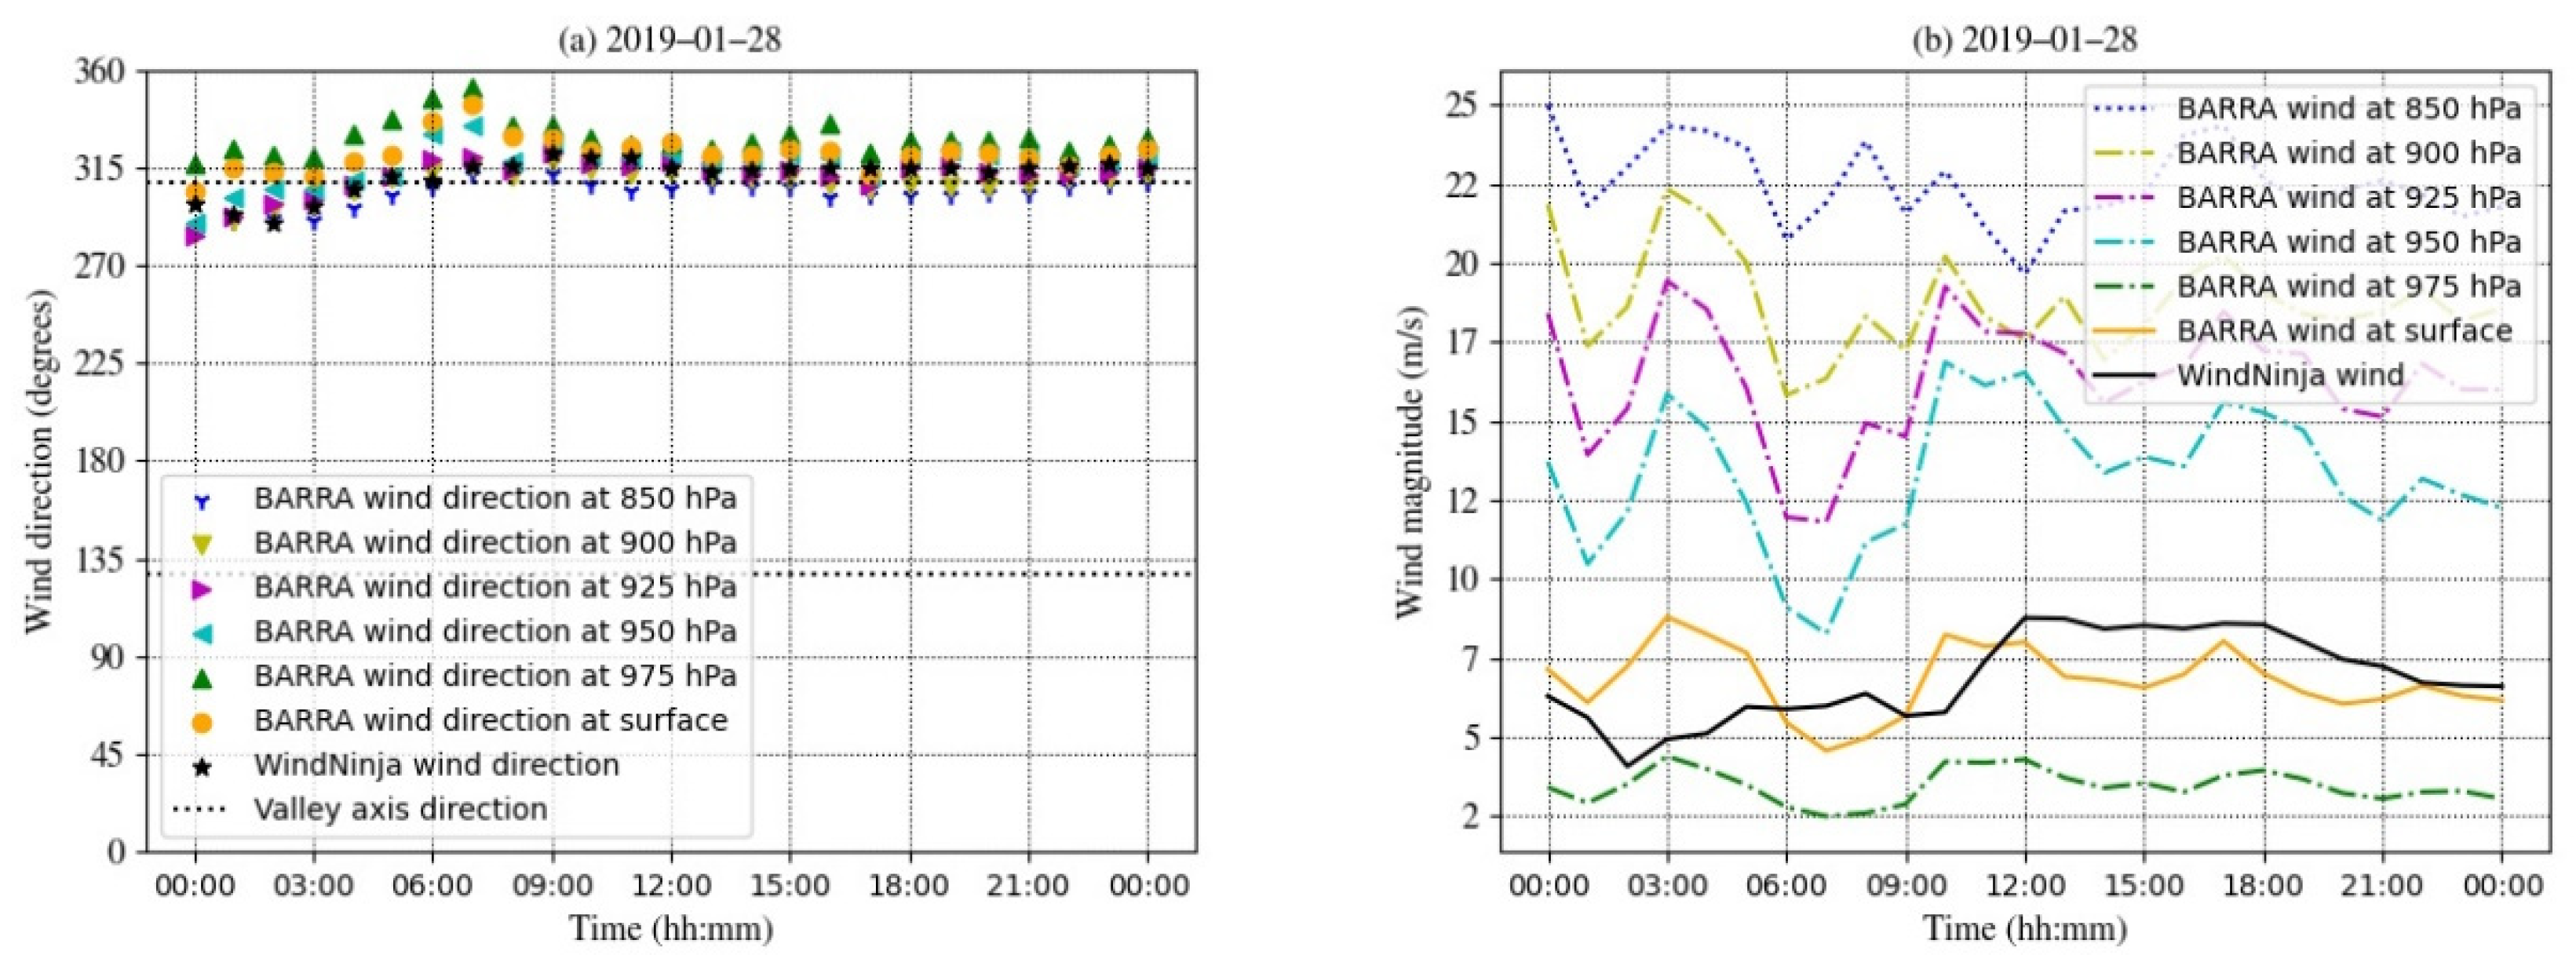
Secondly, terrain forced channel wind exhibited the association of geostrophic wind (850 hPa) magnitude with little direction gap between geostrophic and surface winds. Figures juxtapose wind direction on the left and wind magnitude on the right in,
Figure 6,
Figure 7,
Figure 8, and
Figure 9 for pseudo weather stations A, B, C and D respectively during the fire periods.
These figures show surface wind angle in orange circle, geostrophic wind angle in blue tripod on left panes and the geostrophic wind speed in dotted line on right panes. Terrain channelling winds showed little angle gap between surface and geostrophic winds when the geostrophic wind speed was higher than
during the fire period while it was larger when the wind magnitude was mostly below
(
Figure 6). Therefore, synoptic wind appeared to have more impact on surface wind as terrain-forced channelling when its speed is high than when the speed is lower. Station B shows very similar tendency to pseudo station A because both are sited in isochrone #1 (
Figure 7). Further both station C and D in isochrone #2 shows the alignment of all wind directions because geostrophic wind was almost above
throughout the fire period (
Figure 8 and
Figure 9) regardless of cloud coverage (See Appendix A), which often reduces diurnal wind if the coverage is high (Whiteman, 2000). These alignments of winds appear subject to the structure of the terrain which was slightly concave against the winds (
Figure 1) and therefore funnelled the wind into the valley (Whiteman, 2000). Another reason of the small angle gap between two levels of wind is that geostrophic wind blew from the northwest and tended to align with the valley axis indicated by dotted lines during the fire period (
Figure 6,
Figure 7,
Figure 8 and
Figure 9).
Thirdly, downslope wind was not evident in areas of low topographic amplitude. The winds were well aligned at lower atmospheric pressure levels including surface wind at ignition on the ridge in isochrone #1 as shown in
Figure 7 (1-a). Since station B was placed on the ridge, the surface wind resulted in downslope wind and assisted fire spread on leeside in the east. As a general tendency in this study, the downscaled surface wind was faster than BARRA-TA surface wind when upper wind speed was high (
Figure 6,
Figure 7 and
Figure 8). This tendency also held true at station B because the ridge area is too small to be adequately captured within the coarser BARRA-TA wind field, which has a horizontal resolution of 1.5 km (
Figure 2 and
Figure 3).
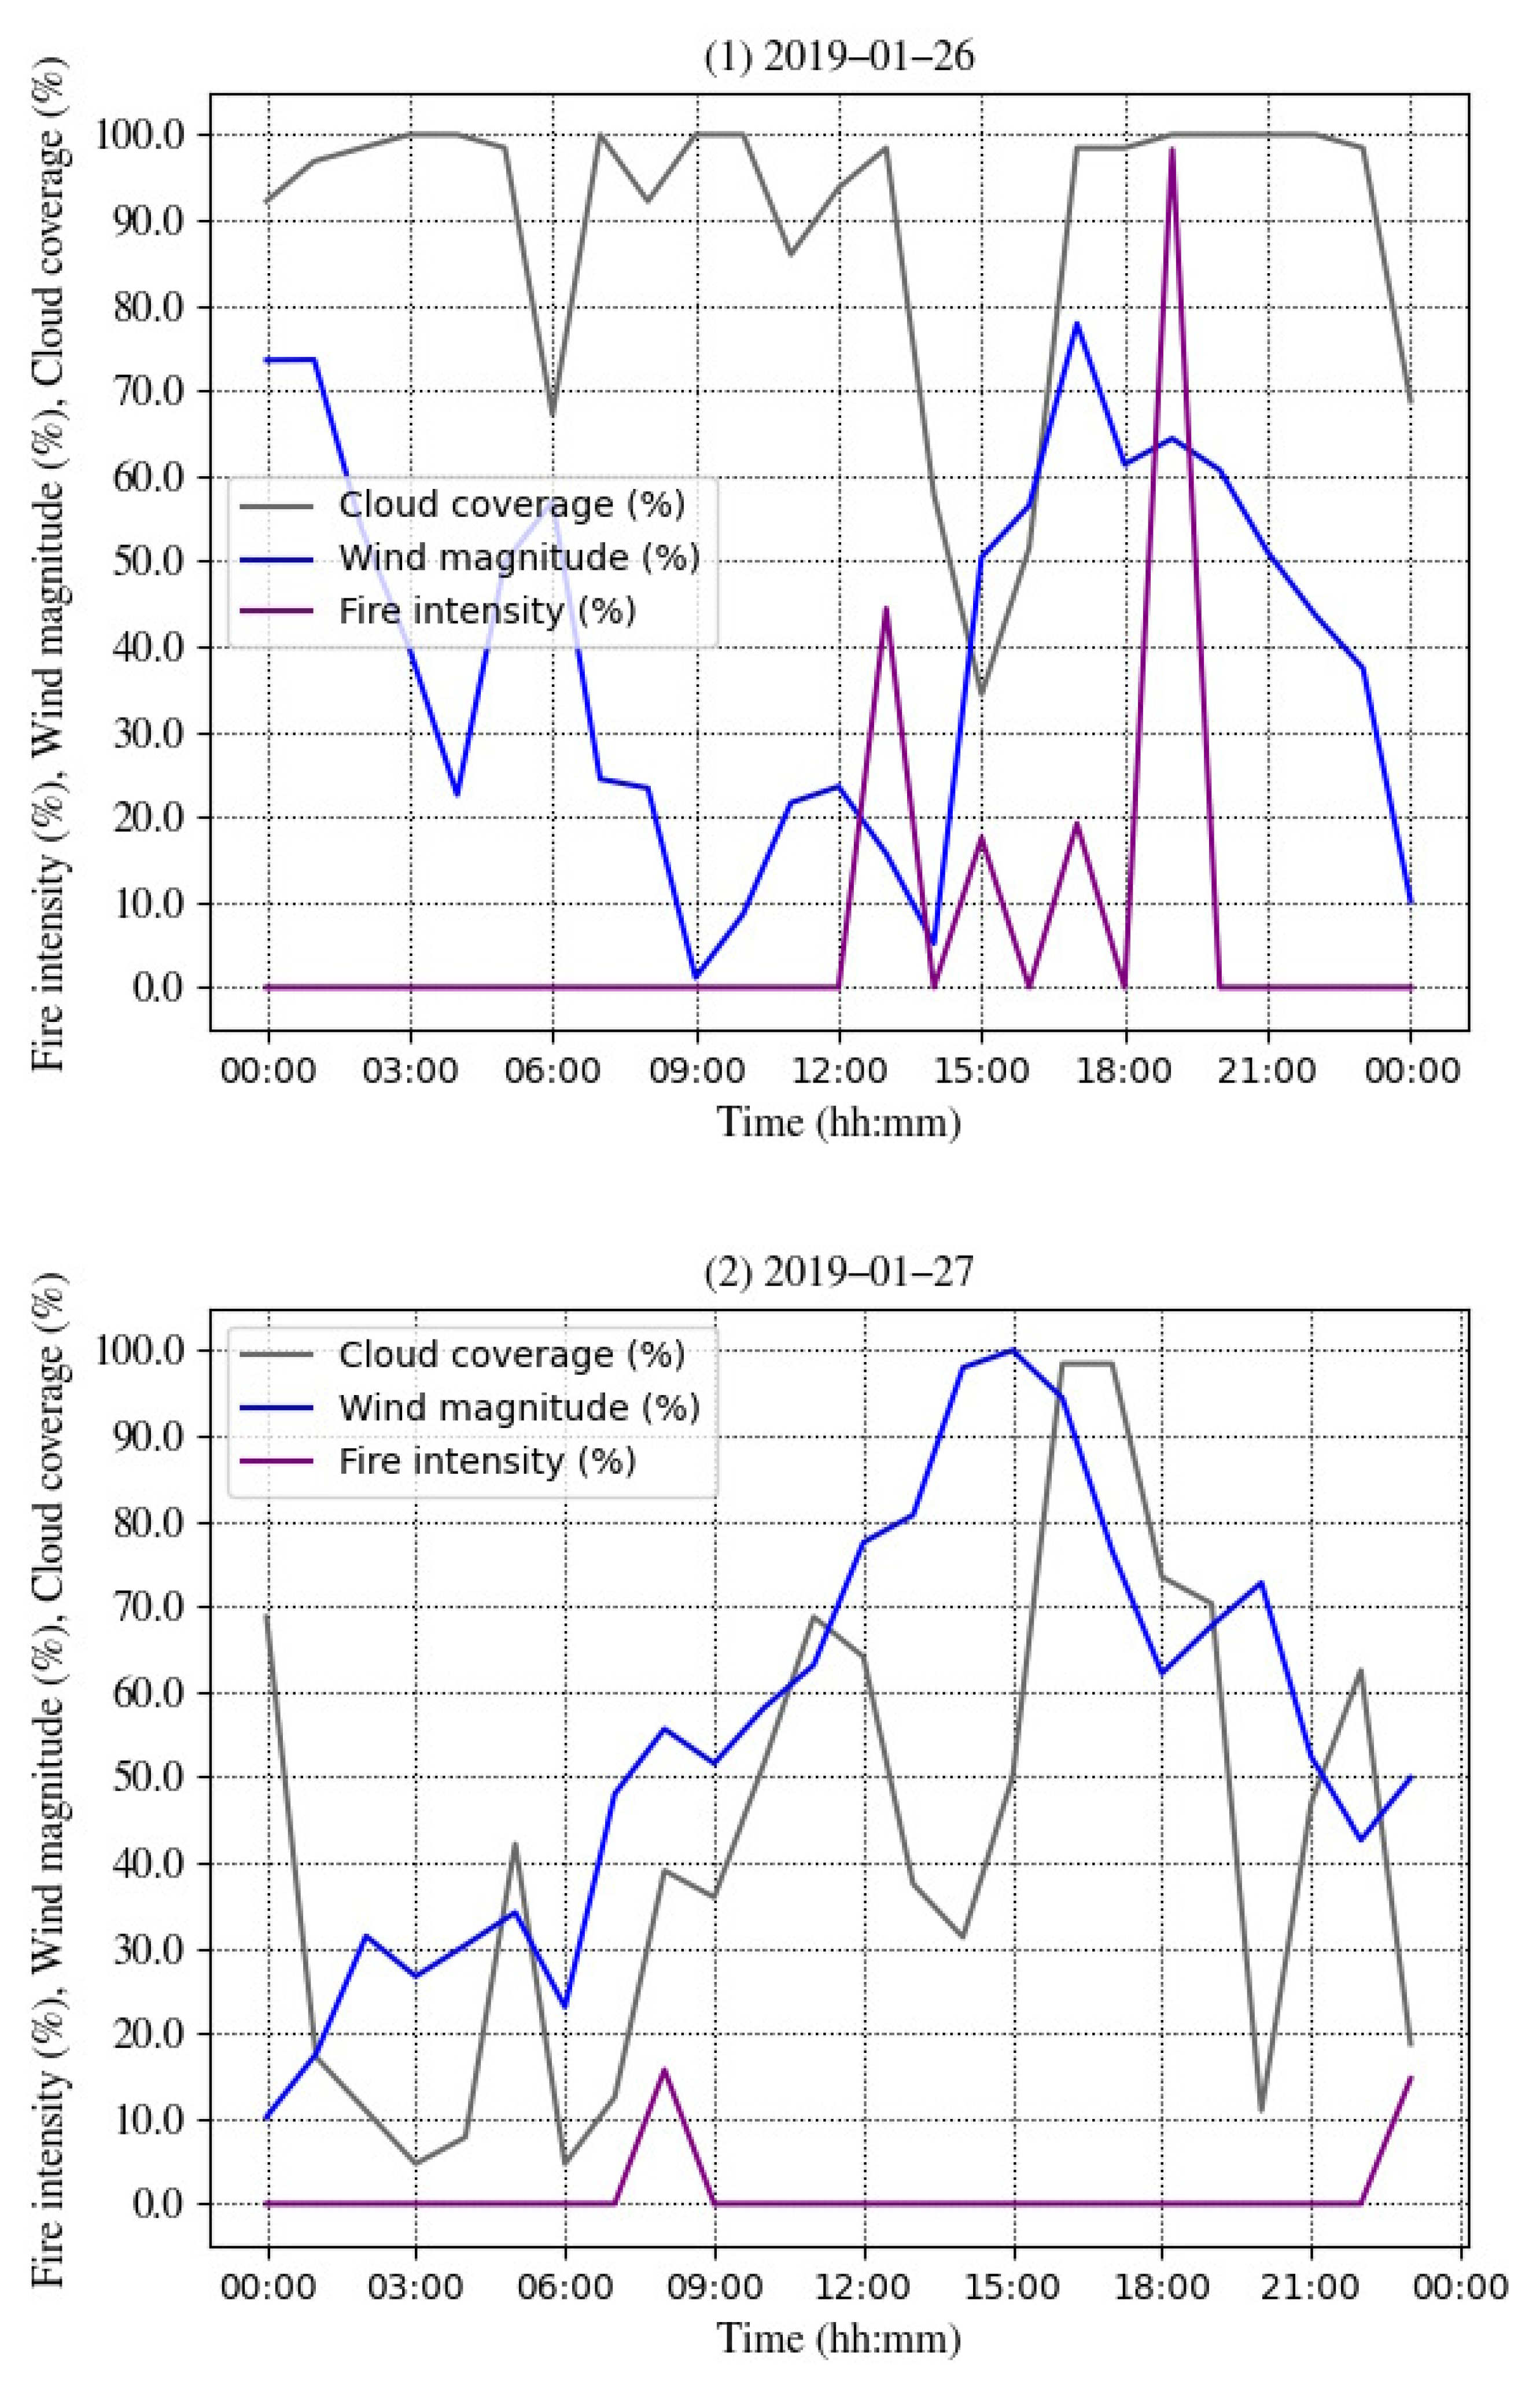
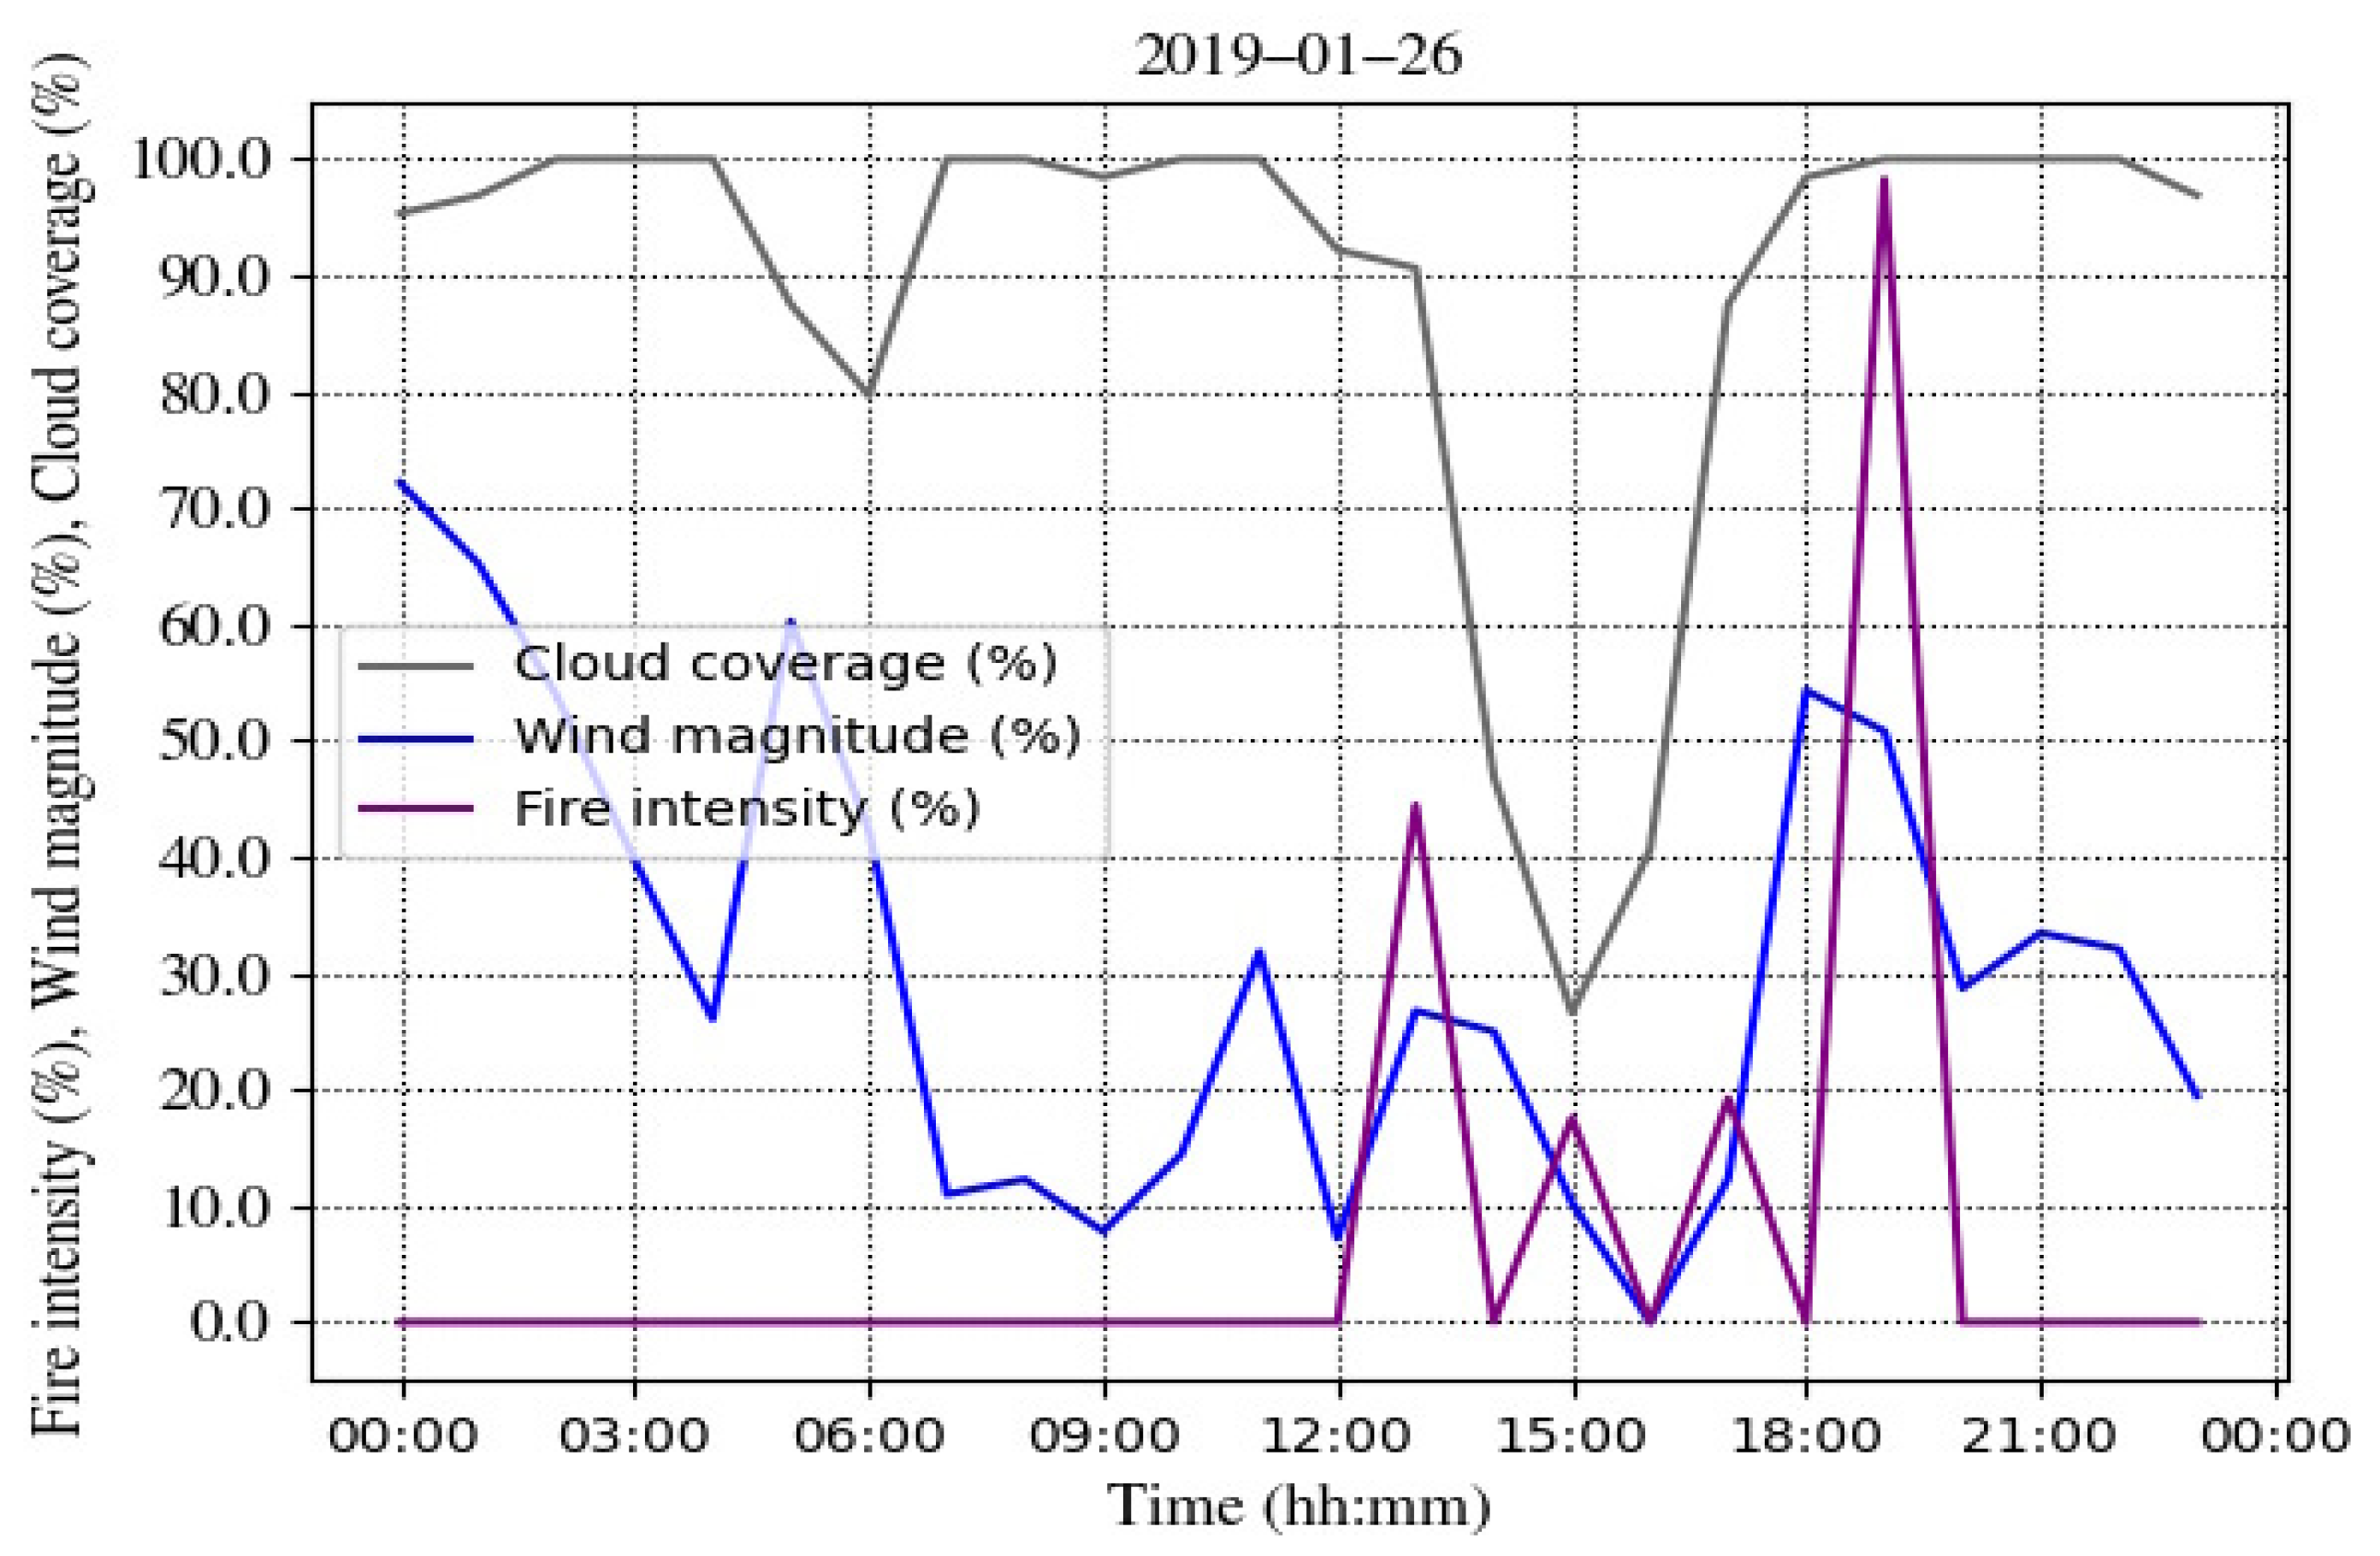
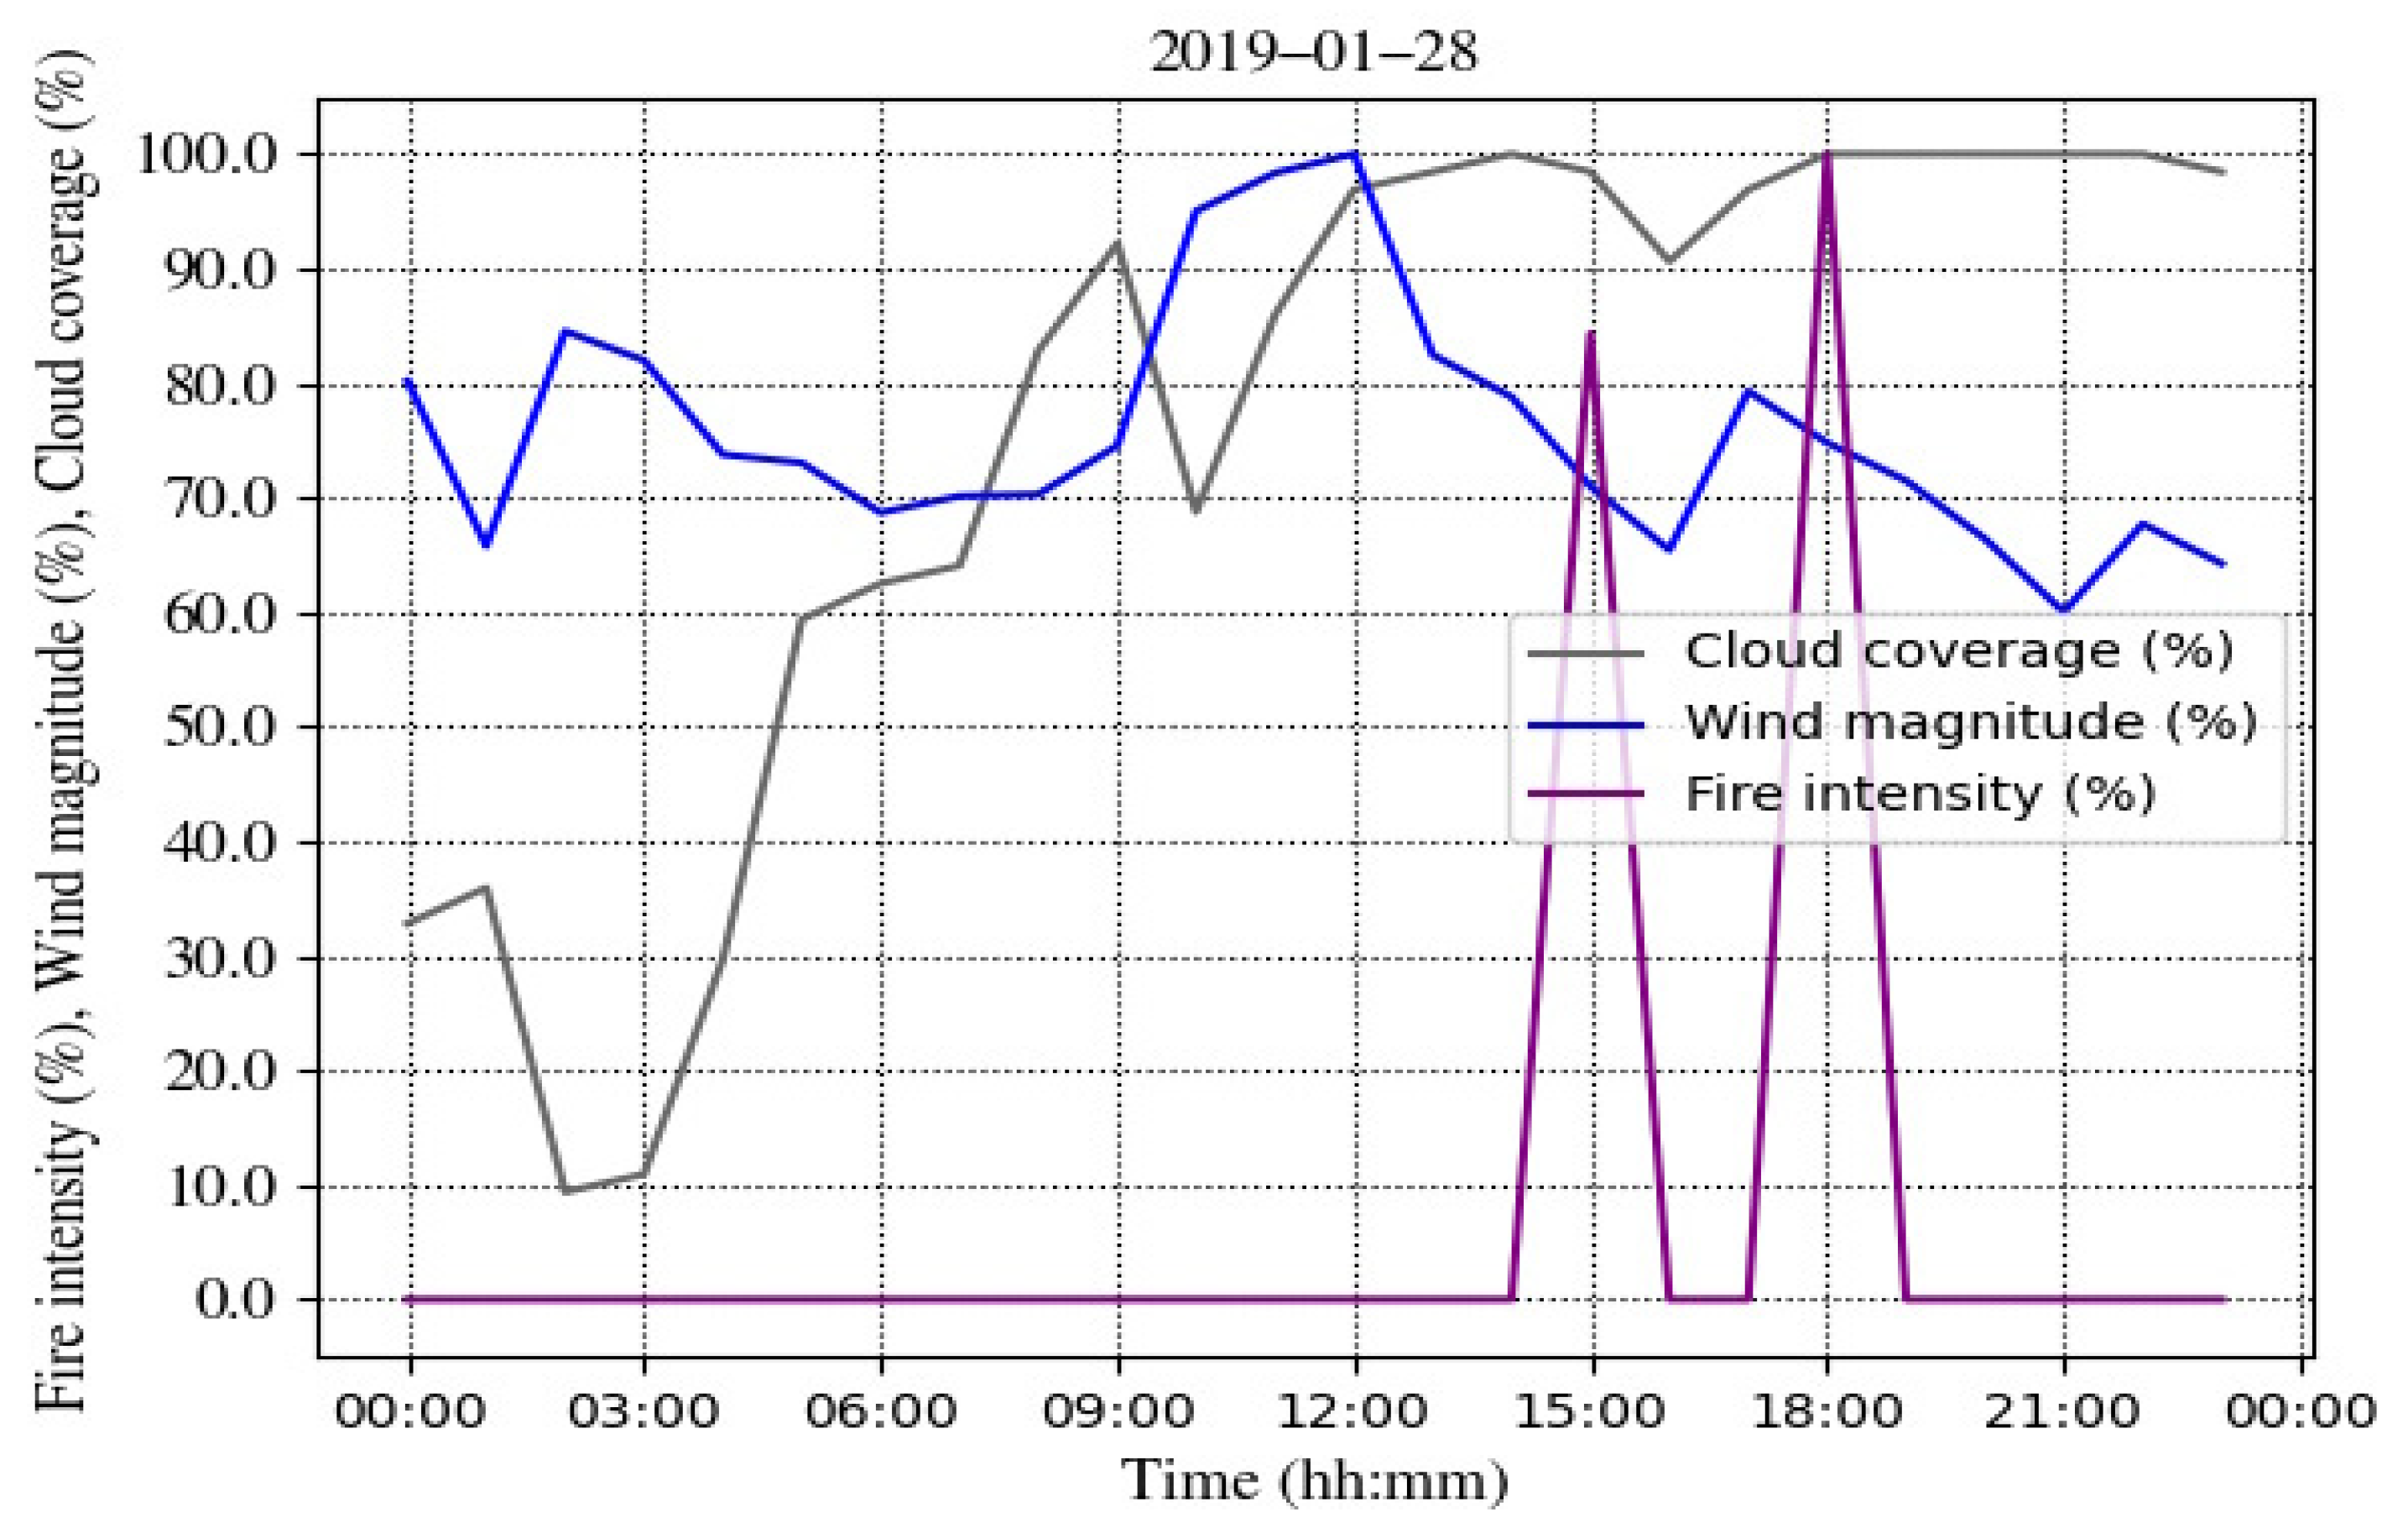
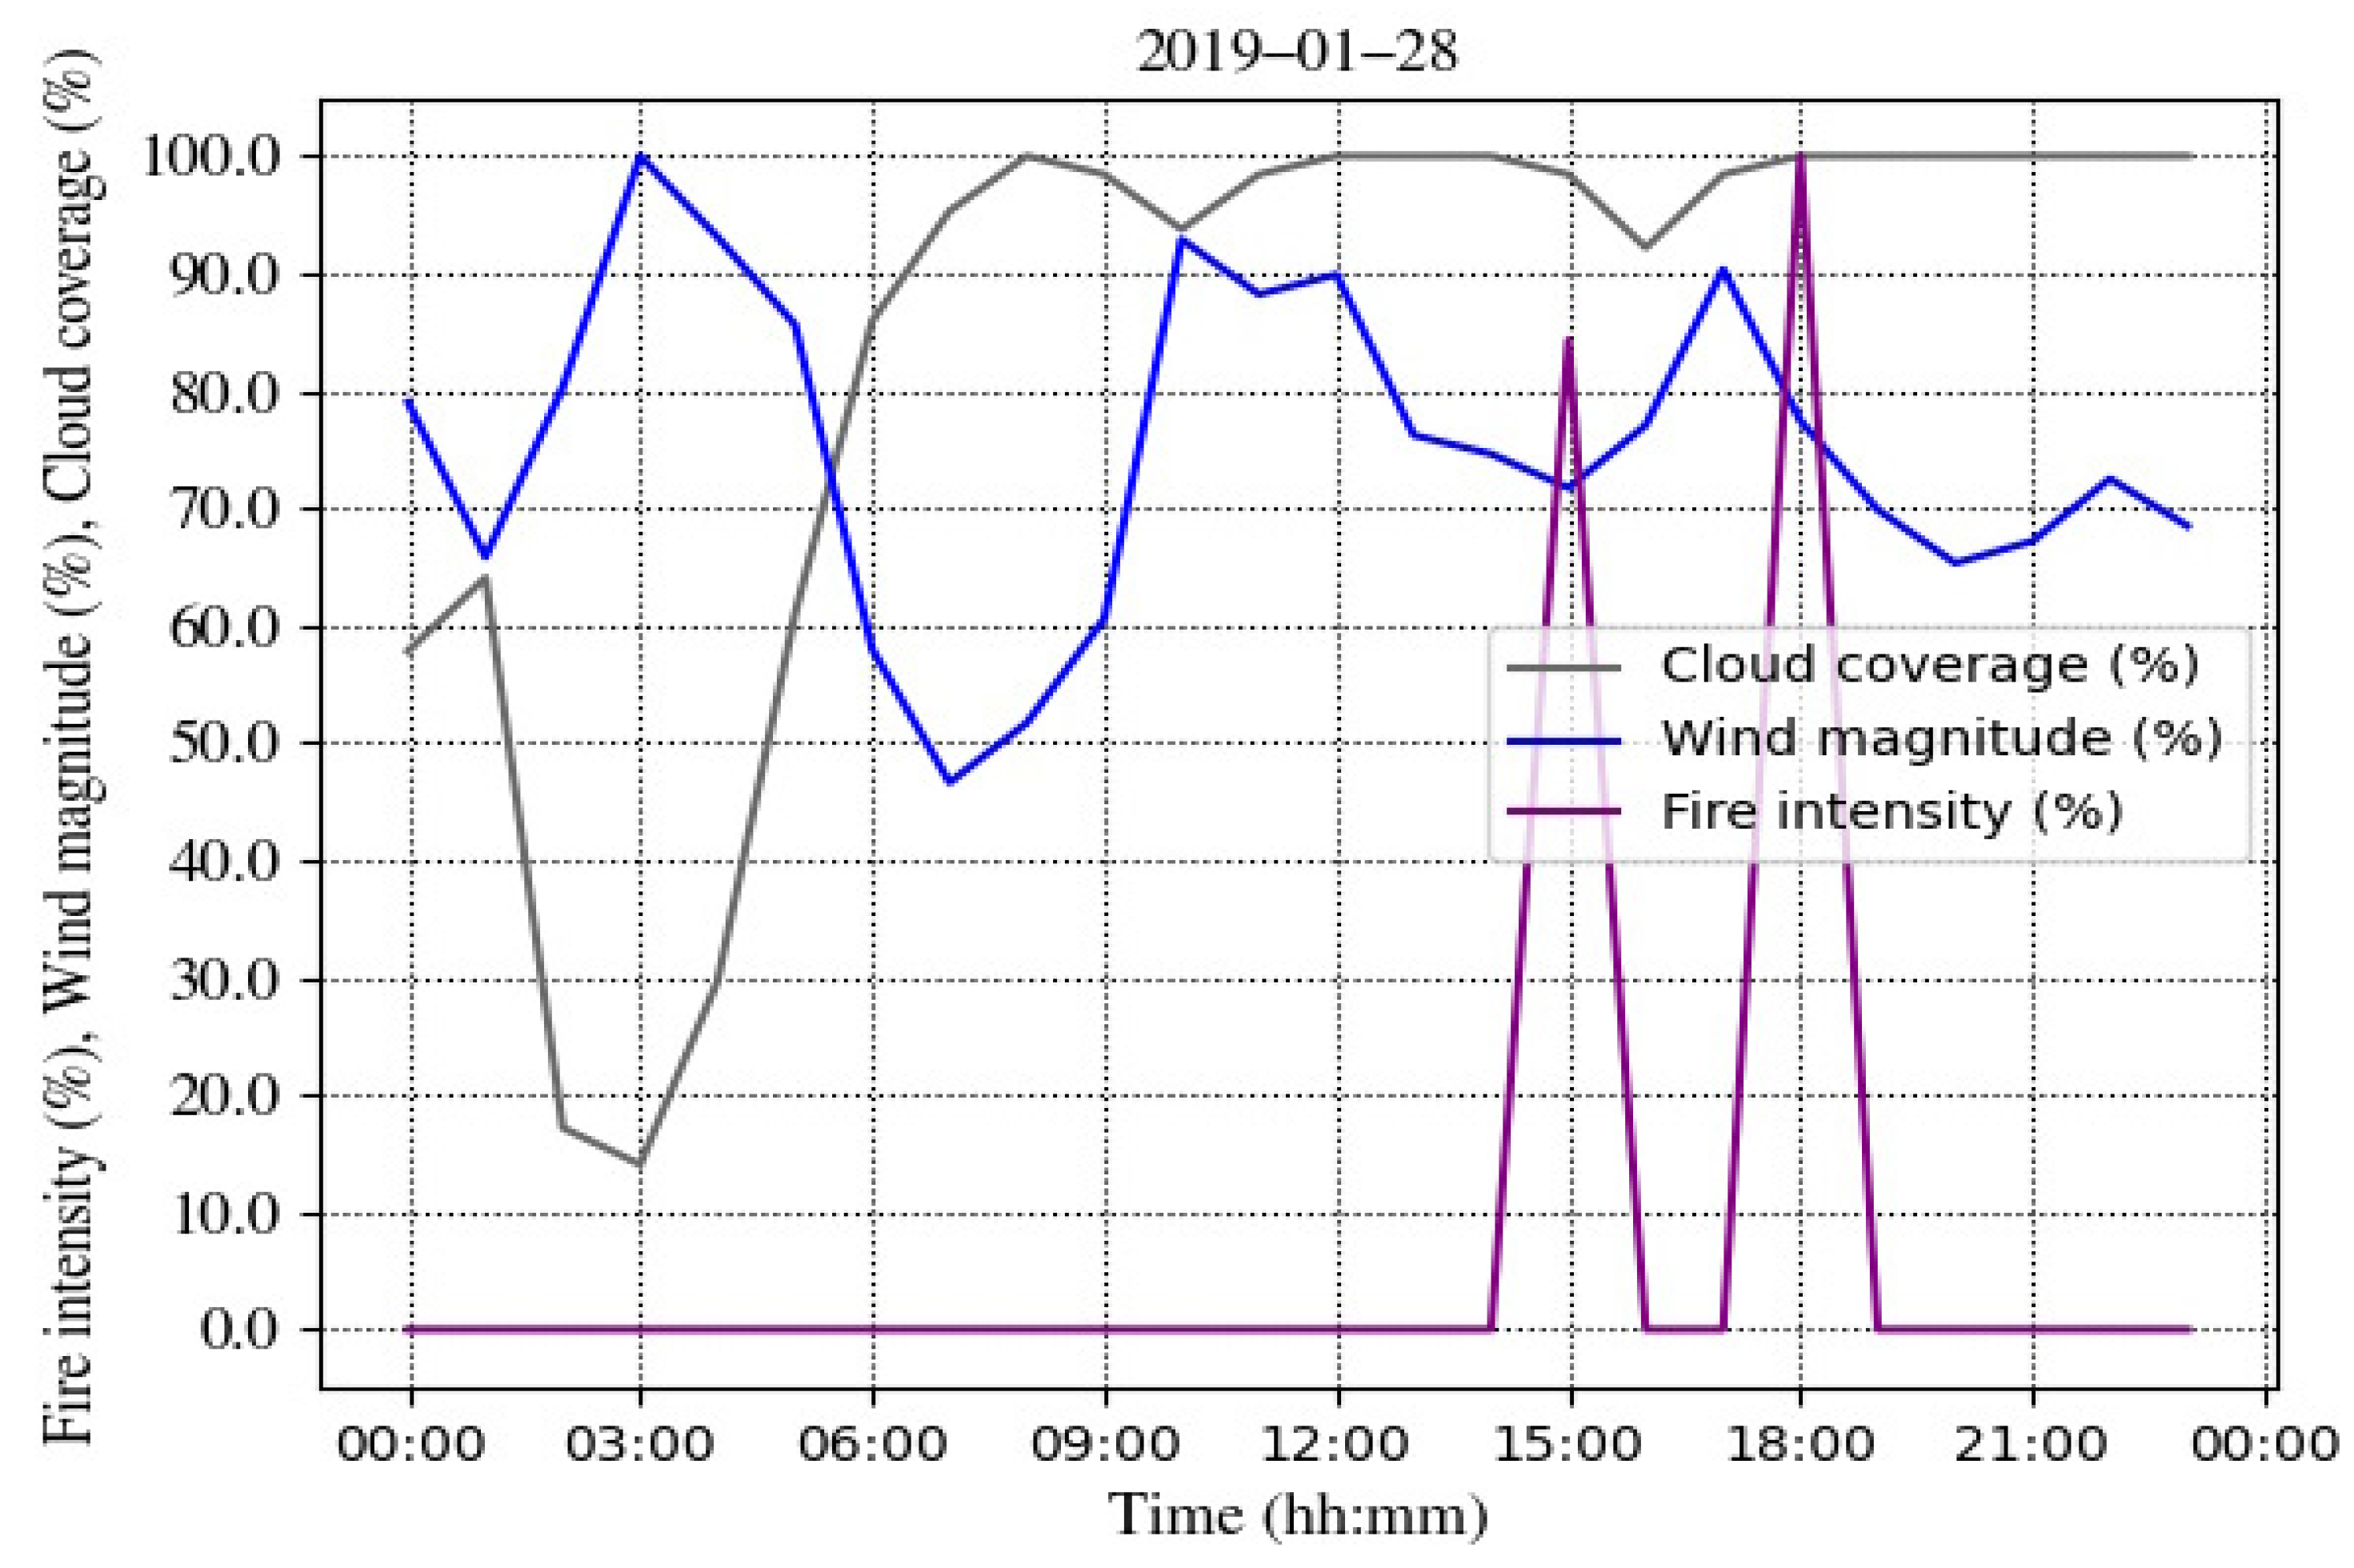
Lastly, drastic changes of fire intensity were observed in Himawari-8 satellite hotspot detections through the course of fire spread which were associated with the wind magnitude. They also imply the possibility of alternating periods of low intensity smouldering and more rapid intense fire spread in buttongrass. In general, the infrared channels of the satellite images identify the fire intensity easily when cloud coverage is low. However, the hot spots were often identified even under the high cloud coverage, indicating high intensity. In particular, the intensity is proportional to surface wind magnitude. For example, fire intensity in red is nearly 100% when both cloud coverage in grey and surface wind magnitude in blue are more than 50% at 19:00 on 26
th in
Figure 10-(1) and
Figure 11 and at 18:00 on 28
th in
Figure 12 and
Figure 13.
On the other hand, the image did not capture the hot spots even when the cloud coverage was below 50% if the wind magnitude is low. For instance, the intensity was zero% from 1:00 to 7:00 on 27
th when both wind magnitude and cloud coverage are lower than 50% in
Figure 10-(2). This indicates that the fire intensity frequently changed in accordance with surface wind magnitude.
In conclusion, analysis of atmospheric profiles confirmed the presence of downslope wind and terrain-forced channelling in isochrone #1, while only terrain-forced channelling was present during fire spread in isochrone #2. Fire intensity frequently changed in accordance with wind magnitude in both isochrones.
3.2. Fire simulations
Simulation scores and fire durations varied between two types of wind field in isochrone #1 in accordance with the various dynamic winds determined to be present based on atmospheric profiling: downslope wind and terrain-forced channelling. On the other hand, there was not significant difference between two types of wind in isochrone #2, in which there was only terrain-forced channelling detected (
Table 3).
Firstly, the number of valid fraction skills score (FSS), which is identified as “useful” as it surpassed the threshold (Faggian et al., 2015), at station A is 100% with both types of wind. However, median FSS with BARRA-TA is 0.57, much lower than the simulation parameterised with downscaled wind, with a score of 0.67. Median precision with BARRA-TA is also lower, 0.82 than 0.96 with the downscaled wind. This tendency also presented in the simulation ignited at station B. Fire appeared to propagate to the east further beyond the isochrone with BARRA-TA than with the downscaled wind. This indicates the downscaled wind controlled the downslope range better than the coarse scale wind.
Secondly, the number of valid FSS, median FSS and median precision are all greater at station A than ones at station B. These are reasonable results because station A is closer to fire spots captured by Himawari-8 than B (
Figure 3).
Thirdly, all FSS scores at station D are below threshold, “useful”, hence, validity is zero% (
Table 3). This result is reflected in VIIRS fire spots, which became ignition points, only one of which is inside the isochrone #2 detected at 14:53 on 28
th while others with the same timestamp are outside the isochrone (
Figure 3). On the other hand, station C is more confident as a potential ignition point because it is located between hotspots identified by both Himawari-8 and S-NPP in the isochrone (
Figure 3). Therefore, the poor scores in both FSS and precision with station D are attributed to this disparity between the cluster of fire spots at 14:53 and isochrone #2.
The fourth is discrepancy of fire duration between stations within the same isochrone, which is retrieved from the burnt time field of prediction grid when the simulated area becomes equal to or greater than observed isochrone. The mean fire durations with the BARRA-TA wind field were 1.90 days and 2.03 days at station A and B respectively. These durations were longer than ones with the downscaled wind, 0.73 days and 1.68 days at station A and B respectively. This is sensible because the speed of the downscaled wind is generally faster than the other as mentioned in previous section. By comparison with observed data, estimated 2.92 days, which is speculated by isochrone and Himawari-8 fire spots (
Table 1), all four simulated durations are less than the observed duration. In isochrone 2, the simulated durations with BARRA-TA wind field are 0.72 days and 0.76 days for station C and station D respectively while those with the downscaled wind field are 0.70 days and 0.69 days for these stations. Although these four durations are close each other, they are far greater than the observed duration, 0.18 days (
Table 3). Due to the low validity of FSS at station D, only station C is further analysed in isochrone #2 for now. Neither fire duration nor simulation scores showed discrepancies between two types of wind at station C in isochrone #2. For example, differences for the fire duration and median precision are just 0.02 and 0.01 respectively between two winds. In addition, the number of valid FSS and its median are also the same in both (
Table 3). Fire propagation between two types of wind also look alike (section 3.3.3 in Appendix A).
Lastly, fire speed on a downslope slope was also affected by the difference between two types of wind. Median fire speeds on the downslope areas were and with BARRA-TA and the downscaled wind respectively in isochrone #1. On the other hand, slope angle was –18.65 degrees in median with both types of wind in this isochrone. Details are addressed further in Appendix A.
4. Discussions and conclusions
Downslope wind was resolved by the downscaled wind better than by BARRA-TA in the fire simulations, while the terrain-forced channelling showed the similar verification scores between two types of wind field. Firstly, the quality of simulation and fire duration varied between BARRA-TA wind and the downscaled wind by WindNinja in isochrone #1 while in isochrone #2 simulations under the two wind fields were similar. Interestingly, the median FSS scores, 0.67 and 0.63, with the downscaled wind at station A and B in isochrone #1 were better than the median FSS, 0.58, in #2 even though the area is about as three times large as the other and isochrone #1 is as approximately 1.5 times rugged as #2 (
Table 1 and
Table 3). On the other hand, these scores with BARRA-TA, 0.57 and 0.53, were slightly lower than the one, 0.58, at station C in #2 (
Table 3). The scores at station D in #2 are inadequate since location of the ignition was selected among fire spots which share the same timestamp but where the location varies inside and outside the isochrone. Topographical variation, especially the presence of the microscale ridge in isochrone #1 led to the discrepancy of wind magnitude. This discrepancy resulted in the difference in fraction skills score (FSS) and simulation durations between the wind types. Indeed, the gap of wind magnitude between these wind fields appeared greater in isochrone #1 than #2 (
Figure 6 ,
Figure 7,
Figure 8, and
Figure 9). The area of the ridge, in which station B is situated, is approximately 1 km
2, which is smaller than the resolution of BARRA-TA at 1.5 km, and larger than the downscaled wind at 447 m. Therefore, the primary reason for the differences in simulations can be concluded as the ability for wind dynamics around this ridge to be accurately resolved in the two wind models, with BARRA-TA unable to resolve its effect. Secondly, terrain-forced channelling is well traced by both types of wind in both the numerical weather model vertical sounding plots and fire simulations. The angle gap between surface wind and geostrophic wind was not large, especially when the wind magnitude was high, as wind direction was closely aligned with the valley axis in both isochrones. Although terrain-forced channelling occurred in both isochrones, #2 is more suitable to measure this wind because other dynamic winds are not observed in #2 (
Figure 6 ,
Figure 7,
Figure 8 and
Figure 9). As a result, the scores with both wind fields for this dynamic wind are equally high in isochrone #2. Regarding with simulation scores, durations resulting from simulations are approximately a day less than the ones in observed fire in isochrone #1. This may allude to a possibility of multiple ignitions, or the inability of the Prototype 2 model used to initialize simulation from a 2-dimensional fire line. Thirdly, there was fluctuation in fire intensity, which was often able to be identified in accordance with surface wind magnitude even under the cloud through infrared channel in satellite image (
Figure 10,
Figure 11,
Figure 12 and
Figure 13). This implies that fire might continue submerging and emerging repeatedly in the moorland bogs during the fire extinguishment activity. Lastly, there are some limitations; ignitions were speculated from fire spotting from satellite data; simulated downslope wind fire is highly conditional due to such uncertainty of ignition location; rate of spreading fire (ROS) adjustments have been accumulated from other isochrones which contain single ignition; other limitations are the same as the previous study (Ozaki et al., 2022).
All in all, terrain-forced channelling was recognised well by both BARRA-TA and the downscaled wind. On the other hand, downslope wind with small scale ridge was not identified as good thereby BARRA-TA as thereby the downscaled wind. Habitat of buttongrass moorland could cause uncertainty of fire behaviour to jeopardize the fire fighters.
Funding
This research did not receive any specific funding.
Data Availability Statement
Conflicts of Interest
The authors declare no conflict of interest.
References
- Ebert, E. E. (2008). Fuzzy verification of high-resolution gridded forecasts: A review and proposed framework. Meteorological Applications. [CrossRef]
- Ebert, E. E. (2009). Neighborhood verification: A strategy for rewarding close forecasts. Weather and Forecasting, 1498. [Google Scholar] [CrossRef]
- Eizenberg, N. , Jakob, D., Fox-Hughes, P., Steinle, P., White, C., & Franklin, C. (2021). BARRA v1.0: Kilometre-scale downscaling of an Australian regional atmospheric reanalysis over four midlatitude domains. Geoscientific Model Development, 4378. [Google Scholar] [CrossRef]
- Faggian, N. , Roux, B., Steinle, P., & Ebert, B. (2015). Fast calculation of the fractions skill score. ( 66(3), 457–466.
- 5. Firelab. (2020, May 13). WindNinja Tutorials version 3.6.0, /: 3.6.0. https, 13 May.
- Hague, B. S. (2021). Seasonal climate summary for Australia and the southern hemisphere (summer 2018–19): Extreme heat and flooding prominent. Journal of Southern Hemisphere Earth Systems Science.
- 7. JAXA. (2022, September 13). Earth-graphy, 13 September.
- Kusaka, H. , & Fudeyasu, H. (2017). Review of downslope windstorms in Japan. ( 24(6), 637–656.
- Lee, S.-C. , KwofuAU-Xiong, XiaoxiongAU-Sun, ChengboAU-Anderson, SamuelTI-The S.-NPP VIIRS Day-Night Band On-Orbit Calibration/Characterization and Current State of SDR Products. (2014). The S-NPP VIIRS Day-Night Band On-Orbit Calibration/Characterization and Current State of SDR Products. Remote Sensing, 1242. [Google Scholar] [CrossRef]
- Listi, H. , Sulma, S., Suwarsono, N., Zubaidah, A., & Prasasti, I. (2018). SPECTRAL ANALYSIS OF THE HIMAWARI-8 DATA FOR HOTSPOT DETECTION FROM LAND/FOREST FIRES IN SUMATRA. International Journal of Remote Sensing and Earth Sciences (IJReSES). [CrossRef]
- Markham, K. (2014). Simple guide to confusion matrix terminology.
- Marsden-Smedley, J. B. , & Catchpole, W. R. (1995a). Fire behaviour modelling in tasmanian buttongrass moorlands i. Fuel characteristics. R. ( 5(4), 203–214.
- Marsden-Smedley, J. B. , & Catchpole, W. R. (1995b). Fire Behaviour Modelling in Tasmanian Buttongrass Moorlands.II. Fire Behaviour. R. ( 5(4), 215–228.
- Marsden-Smedley, J. B. , Catchpole, W. R., & Pyrke, A. (2001). Fire modelling in Tasmanian buttongrass moorlands. IV. Sustaining versus non-sustaining fires. International Journal of Wildland Fire.
- 15. ORNL DAAC. (2018). MODIS and VIIRS Land Products Global Subsetting and Visualization Tool.
- Ozaki, M. , Harris, R. M. B., Love, P. T., Aryal, J., Fox-Hughes, P., & Williamson, G. J. (2022). Impact of Vertical Atmospheric Structure on an Atypical Fire in a Mountain Valley. Fire. [CrossRef]
- Peace, M. , Mccaw, L., Santos, B., Kepert, J. D., Burrows, N., & Fawcett, R. J. (2017). Meteorological drivers of extreme fire behaviour during the Waroona bushfire, Western Australia, January 2016. J. ( 67(2), 79–106.
- Schroeder, W. (2017, December 1). Visible Infrared Imaging Radiometer Suite (VIIRS) 375 m & 750 m Active Fire Detection Data Sets Based on NASA VIIRS Land Science Investigator Processing System (SIPS) Reprocessed Data—Version 1, /: Visible Infrared Imaging Radiometer Suite (VIIRS) 375 m & 750 m Active Fire Detection Data Sets Based on NASA VIIRS Land Science Investigator Processing System (SIPS) Reprocessed Data - Version 1. https, 1 December.
- Sharples, J. J. (2009). An overview of mountain meteorological effects relevant to fire behaviour and bushfire risk. International Journal of Wildland Fire. [CrossRef]
- Storey, K. (2010). A review of the potential interactions between fire, soil, hydrology and geomorphology of buttongrass moorland.
- 21. Tasmanian Fire Service. (2020, May 17). Tasmania Fire Service, 17 May.
- 22. The Australasian Fire and Emergency Service Authorities Council (AFAC). (2020, May 19). Australian Fire Danger Rating System—Research Prototype, /: Rating System. https, 19 May.
- Wagenbrenner, N. S. , Forthofer, J. M., Page, W. G., & Butler, B. W. (2019). Development and Evaluation of a Reynolds-Averaged Navier-Stokes Solver in WindNinja for Operational Wildland Fire Applications. Atmosphere. [CrossRef]
- Wang, W.-C. , ChangyongTI-NOAA-20 and S.-NPP VIIRS Thermal Emissive Bands On-Orbit Calibration Algorithm Update and Long-Term Performance Inter-Comparison. (2021). NOAA-20 and S-NPP VIIRS Thermal Emissive Bands On-Orbit Calibration Algorithm Update and Long-Term Performance Inter-Comparison. Remote Sensing. [CrossRef]
- Wardlaw, T. (2021). Measuring a Fire. The Story of the January 2019 Fire Told from Measurements at the Warra Supersite, Tasmania. Fire, 20 January. [CrossRef]
- Whiteman, C. D. (2000). Mountain meteorology: Fundamentals and applications, N: University Press.
- Whiteman, C. D. , & Doran, J. C. (1993). The relationship between overlying synoptic-scale flows and winds within a valley. Journal of Applied Meteorology, 1682. [Google Scholar] [CrossRef]
- Yumimoto, K. , Nagao, T. M., Kikuchi, M., Sekiyama, T. T., Murakami, H., Tanaka, T. Y., Ogi, A., Irie, H., Khatri, P., Okumura, H., Arai, K., Morino, I., Uchino, O., & Maki, T. (2016). Aerosol data assimilation using data from Himawari-8, a next-generation geostationary meteorological satellite. Geophysical Research Letters, 5894. [Google Scholar] [CrossRef]
Figure 1.
Extent of geospatial parameters for Riveaux Road Fire in red with fire isochrones, #1 in yellow and #2 in brown. Some ridges are more than 1 km elevation.
Figure 1.
Extent of geospatial parameters for Riveaux Road Fire in red with fire isochrones, #1 in yellow and #2 in brown. Some ridges are more than 1 km elevation.
Figure 2.
Resolutions of two types of wind as indicated by spacing of wind vector arrows. Map also shows local topography, the location of the two study isochrones and location of model ignition points.
Figure 2.
Resolutions of two types of wind as indicated by spacing of wind vector arrows. Map also shows local topography, the location of the two study isochrones and location of model ignition points.
Figure 3.
Pseudo weather stations and fire spots with digital elevation model (DEM) in isochrone #1 and #2.
Figure 3.
Pseudo weather stations and fire spots with digital elevation model (DEM) in isochrone #1 and #2.
Figure 4.
Wind vector map about ignition at 18:00 on 25th January 2019 for isochrone #1 shows windward flow are converged by the terrain in purple and then mitigated the speed before it reached to the isochrone.
Figure 4.
Wind vector map about ignition at 18:00 on 25th January 2019 for isochrone #1 shows windward flow are converged by the terrain in purple and then mitigated the speed before it reached to the isochrone.
Figure 5.
Wind vector map around ignition at 16:00 on 28th January 2019 for isochrone #2 shows windward flow are converged by the terrain in purple and then mitigated the speed before it reached to the isochrone.
Figure 5.
Wind vector map around ignition at 16:00 on 28th January 2019 for isochrone #2 shows windward flow are converged by the terrain in purple and then mitigated the speed before it reached to the isochrone.
Figure 6.
Wind in isochrone #1 with pseudo weather station A with wind direction (1-a) and wind magnitude (1-b) on 25th. In the same manner, wind direction and magnitude are presented in (2-a), (2-b), (3-a), (3-b), (4-a) and (4-b) for 26th, 27th and 28th respectively in January 2019. Directions of valley axis represent in dotted line with wind direction. The fire period was from 17:20 on 25th till 15:30 on 28th. Directions in both surface and geostrophic winds were well aligned from 15:00 on 25th till 6:00 on 26th and from 0:00 on 27th to the end at pseudo station A in isochrone #1 (1-a, 2-a, 3-a and 4-a) when geostrophic wind magnitude was above (1-b ,2-b, 3-b and 4-b). On the other hand, the wind angle gap shows larger disparity from 15:00 till midnight on 26th (2-a) when the wind magnitude was mostly below (2-b) even though cloud coverage, which often reduces diurnal wind if the coverage is high (Whiteman, 2000), was low at 15:00 at that day (See Appendix A).
Figure 7.
Wind in isochrone #1 with pseudo weather station B with wind direction (1-a) and wind magnitude (1-b) on 25th. In the same manner, wind direction and magnitude are present in (2-a), (2-b), (3-a), (3-b), (4-a) and (4-b) for 26th, 27th and 28th respectively in January 2019. The fire period was from 17:20 on 25th till 15:30 on 28th.
Figure 8.
Wind in isochrone #2 with pseudo weather station C with wind direction (a) and wind magnitude (b) on 28th in January 2019. The fire period was from 15:10 till 19:30 on 28th. .
Figure 8.
Wind in isochrone #2 with pseudo weather station C with wind direction (a) and wind magnitude (b) on 28th in January 2019. The fire period was from 15:10 till 19:30 on 28th. .
Figure 9.
Wind in isochrone #2 with pseudo weather station D with wind direction (a) and wind magnitude (b) on 28th in January 2019. The fire period was from 15:10 till 19:30 on 28th.
Figure 9.
Wind in isochrone #2 with pseudo weather station D with wind direction (a) and wind magnitude (b) on 28th in January 2019. The fire period was from 15:10 till 19:30 on 28th.
Figure 10.
Fire intensity shows positive relationship with surface wind magnitude and negative proportion to cloud coverage in isochrone #1 at pseudo station A. (1) 26th and (2) 27th in January 2019.
Figure 10.
Fire intensity shows positive relationship with surface wind magnitude and negative proportion to cloud coverage in isochrone #1 at pseudo station A. (1) 26th and (2) 27th in January 2019.
Figure 11.
Fire intensity shows positive relationship with surface wind magnitude and negative proportion to cloud coverage in isochrone #1 at pseudo station B on 26th in January 2019. .
Figure 11.
Fire intensity shows positive relationship with surface wind magnitude and negative proportion to cloud coverage in isochrone #1 at pseudo station B on 26th in January 2019. .
Figure 12.
Fire intensity shows positive relationship with surface wind magnitude and negative proportion to cloud coverage in isochrone #2 at pseudo station C on 28th in January 2019. .
Figure 12.
Fire intensity shows positive relationship with surface wind magnitude and negative proportion to cloud coverage in isochrone #2 at pseudo station C on 28th in January 2019. .
Figure 13.
Fire intensity shows positive relationship with surface wind magnitude and negative proportion to cloud coverage in isochrone #2 at pseudo station D on 28th in January 2019. .
Figure 13.
Fire intensity shows positive relationship with surface wind magnitude and negative proportion to cloud coverage in isochrone #2 at pseudo station D on 28th in January 2019. .
Table 1.
Fire isochrones with area and ruggedness. The ignition and end of fire are expressed as local time (Australia/Hobart). Ruggedness is expressed by standard deviation of digital elevation model (DEM) in each isochrone.
Table 1.
Fire isochrones with area and ruggedness. The ignition and end of fire are expressed as local time (Australia/Hobart). Ruggedness is expressed by standard deviation of digital elevation model (DEM) in each isochrone.
| Isochrone |
Estimated ignition time |
End |
Duration (days) |
) |
Standard deviation of DEM (m) |
| 1 |
2019/1/25 17:20 |
2019/1/28 15:30 |
2.92 |
24.86 |
64.42 |
| 2 |
2019/1/28 15:10 |
2019/1/28 19:30 |
0.18 |
8.52 |
40.24 |
Table 2.
Vegetation distribution (%).
Table 2.
Vegetation distribution (%).
| Isochrone # |
Moorland |
Scrubland |
Wet eucalypt forest |
Rainforest |
Non eucalypt forest |
Dry eucalypt
forest |
Other natural environments |
| 1 |
58.77 |
13.31 |
13.09 |
11.44 |
0.89 |
1.81 |
0.69 |
| 2 |
54.60 |
16.13 |
21.37 |
0.63 |
6.24 |
0.07 |
0.96 |
Table 3.
Ground summary of fire simulation. Fires were simulated using five geometries with each type of wind Verification scores including median values were calculated from these geometries. Details are further addressed in Appendix A.
Table 3.
Ground summary of fire simulation. Fires were simulated using five geometries with each type of wind Verification scores including median values were calculated from these geometries. Details are further addressed in Appendix A.
| Isochrone # |
Pseudo station |
Wind data type |
Duration days in median |
Valid FSS % (Median FSS) |
Median Precision |
| 1 |
A |
BARRA-TA |
1.90 |
100% (0.57) |
0.82 |
| Downscaled |
0.73 |
100% (0.67) |
0.96 |
| B |
BARRA-TA |
2.03 |
80% (0.53) |
0.73 |
| Downscaled |
1.68 |
100% (0.63) |
0.90 |
| 2 |
C |
BARRA-TA |
0.72 |
100% (0.58) |
0.96 |
| Downscaled |
0.70 |
100% (0.58) |
0.95 |
| D |
BARRA-TA |
0.76 |
0% (0.46) |
0.78 |
| Downscaled |
0.69 |
0% (0.41) |
0.69 |
|
Disclaimer/Publisher’s Note: The statements, opinions and data contained in all publications are solely those of the individual author(s) and contributor(s) and not of MDPI and/or the editor(s). MDPI and/or the editor(s) disclaim responsibility for any injury to people or property resulting from any ideas, methods, instructions or products referred to in the content. |
© 2023 by the authors. Licensee MDPI, Basel, Switzerland. This article is an open access article distributed under the terms and conditions of the Creative Commons Attribution (CC BY) license (https://creativecommons.org/licenses/by/4.0/).
