1. Introduction
One of the biggest challenges facing Egyptians recently has been bridging the fast-widening gap between the limited quantity of water that is currently available and the huge quantity required to meet the needs of growing populations for agricultural and food production. That is why Egyptian policymakers as well as scientific researchers in Egypt have focused on finding radical solutions for such a problem and providing the largest possible amount of water through more than one tool at the same time. In addition to proceeding with extreme degrees of rationalization of water use in all sectors, the National Great Project for Lining and Rehabilitation of All Open Canals of the Irrigation Network all over the Egyptian Countryside was recently implemented, mainly to get rid of the main reason for irrigation water losses through seepage in permeable soil. That project not only preserves the seeped quantities of water but also minimizes the lost quantities that were lost through evaporation and evapotranspiration due to controlling the designed cross-sections of all irrigation water streams. Also, the project stops the increase in water sections, distortions, or swimming processes, as well as the growth of weeds and plants in irrigation water canals, which decreases the lost quantities of water. The Egyptian irrigation authorities expect to save about five thousand million cubic meters of water a year. The current field study aims to evaluate the water losses from the Al Maanna canal network in Assiut governorate as a representative case study for the Middle Egypt region. Also, the study contains an economic study of the saved costs after the lining process in the selected study area.
2. Literature Review
Water losses from earthen irrigation canals have several forms; the most important of these, which have a significant impact on water quantities, are seepage, evaporation, and evapotranspiration losses, which will be described in more detail in the following sections:
2.1. Seepage Losses
Seepage losses from earthen irrigation canals, which account for a significant portion of canal water losses, are determined by several factors, such as soil permeability, canal water depth, length of wetted perimeter, channel geometry, location of the groundwater table, velocity of flowing water, and so on. Worldwide, several researchers studied seepage losses from the earthen canals, as given in the following
Table 1.
Previous studies employed two basic strategies to quantify seepage losses from earthen canals: experimental formulas and field methods. A summary of these approaches is given below.
2.1.1. Experimental Formulas for Measuring Seepage Losses
The following
Table 2 introduces a variety of experimental formulas that were used to quantify seepage losses from earthen canals.
2.1.2. The Field Ponding Method for Measuring of SEEPAGE losses
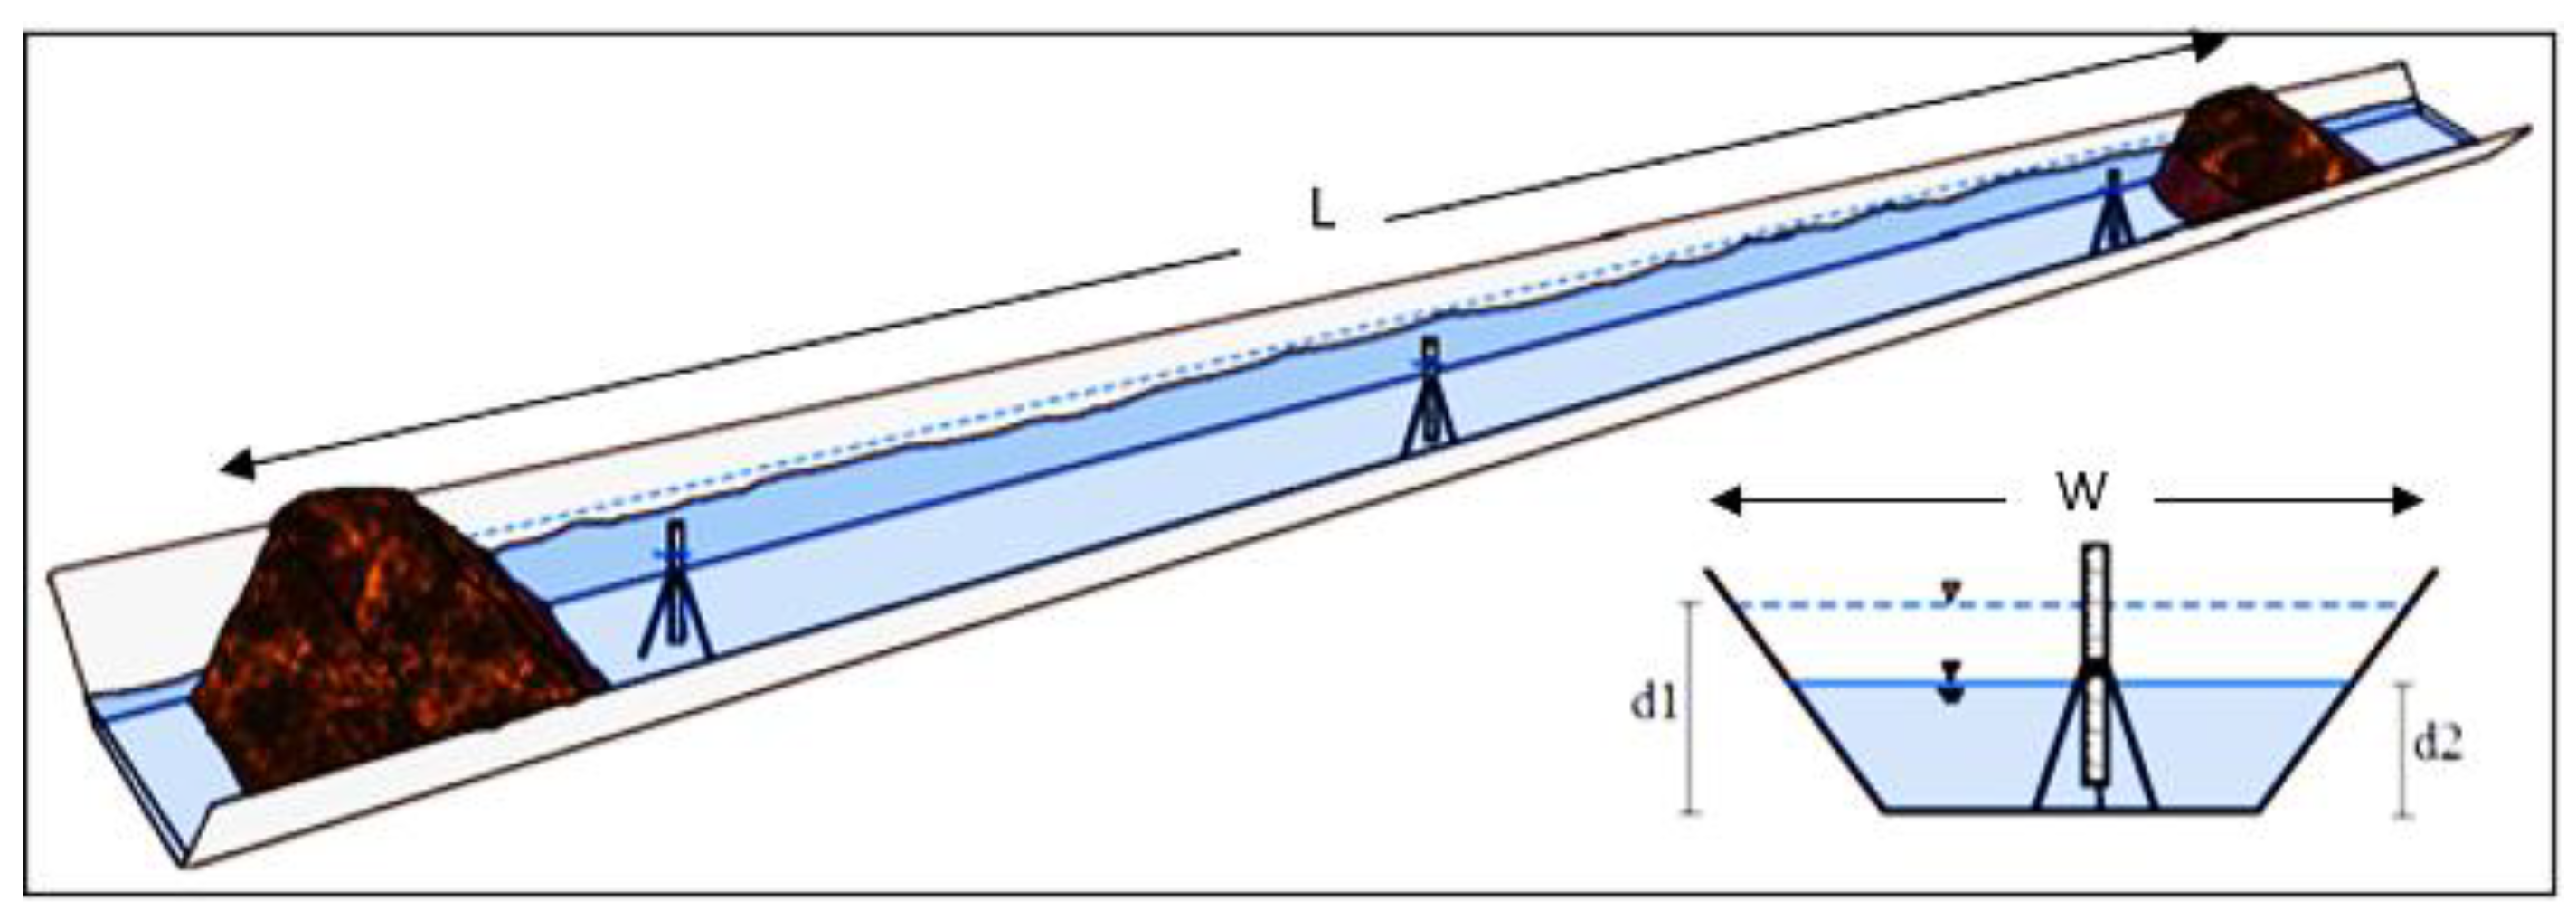
The field ponding method, which represents a direct method for measuring seepage losses from a considerable length of a canal, is based on restricting water in a certain reach of the canal and then measuring the water level twice: once after the restriction process and again after 24 hours. The reduction in the water level is considered a seepage loss (Leigh, 2014), as shown in
Figure 1.
Leigh (2014) proposed the following equation to calculate the seepage rates of ponding tests:
| where; |
S |
Average seepage losses from the ponded reach (ft3 /ft2 /day) |
| |
W |
Average width of water surface in the ponded reach (ft) |
| |
d1
|
Water depth at the beginning of measurement in the ponded reach (ft) |
| |
d2
|
Water depth in the ponded reach after 24 hours (ft) |
| |
P |
Average wetted perimeter in the ponded reach (ft) |
| |
L |
Length of canal ponded reach (ft) |
2.2. Evaporation Losses
Evaporation losses from the open canals, which depend mainly on the surface wind speed, are negligible in comparison to seepage losses. Suhua et al. (2016) used two methods to investigate evaporation losses from the middle reaches of the Heihe River in northern China: i) the aerodynamic method based on the Double-Deck Surface Air Layer (DSAL) model, and ii) the heat balance method. Results showed that cumulative evaporation losses estimated by the DSAL model were equal in order of magnitude to those estimated by the heat balance method. The evaporation losses were determined to be less than 1% of the total designed discharge. They also provided the following equation to predict a canal's evaporation losses:
| where; |
Ep
|
Pan Evaporation(mm/day) |
| |
W |
Width of water surface in the canal (m) |
| |
L |
Length of canal(m) |
| |
Kp
|
Pan coefficient |
2.3. Evapotranspiration Losses
Transpiration from the crops and evaporation from the soil make up the evapotranspiration in a cropped area. The evapotranspiration rate (crop water use) is determined by the crop type, growth stage, soil moisture content, and available energy to evaporate water (El-Enany et al. 2004). The reference crop evapotranspiration (ET
o) and an average crop coefficient (K
a) are used to calculate crop water use (ET
c) (Hanks, 1974), as follows:
The average crop coefficient (K
a) is estimated, as follows (Paul, et al., 1993):
| where; |
Ka |
Average crop coefficient |
| |
KCb
|
Basal crop coefficient |
| |
Kw
|
Wet soil evaporation |
| |
Ks
|
Water stress factor |
On the other hand, Jensen et al. (1990) examined 20 methods to estimate ETo for arid and humid areas. For both areas, they found that the Penman-Monteith technique was the most accurate. The approach introduced by El-Enany et al. (2004) is used to calculate the water consumption (evapotranspiration losses) from a cultivated area as follows:
| where; |
WC
|
Water consumptive needed during a month (m3/sec.) |
| |
ETo
|
Monthly reference crop evapotranspiration (mm/day) |
| |
Ka
|
Monthly average crop coefficient |
| |
A |
Area cultivated (feddan) |
3. Research Methodology
Assessment of water losses from the distorted irrigation networks in Assiut Governorate, as well as the positive impacts of the rehabilitation process, will be conducted through the following steps: i) Selection and description of a study area; ii) Surveying of soil types in the study area; iii) Collection of meteorological data that affects evaporation and evapotranspiration losses; iv) Collection of field data that affects seepage, evaporation, and evapotranspiration losses; v) Analyses and discussions of seepage, evaporation, and evapotranspiration losses (before and after rehabilitation); and vi) An economic study of the saved costs after the lining process in the selected study area.
3.1. Selection and Description of the Study Area
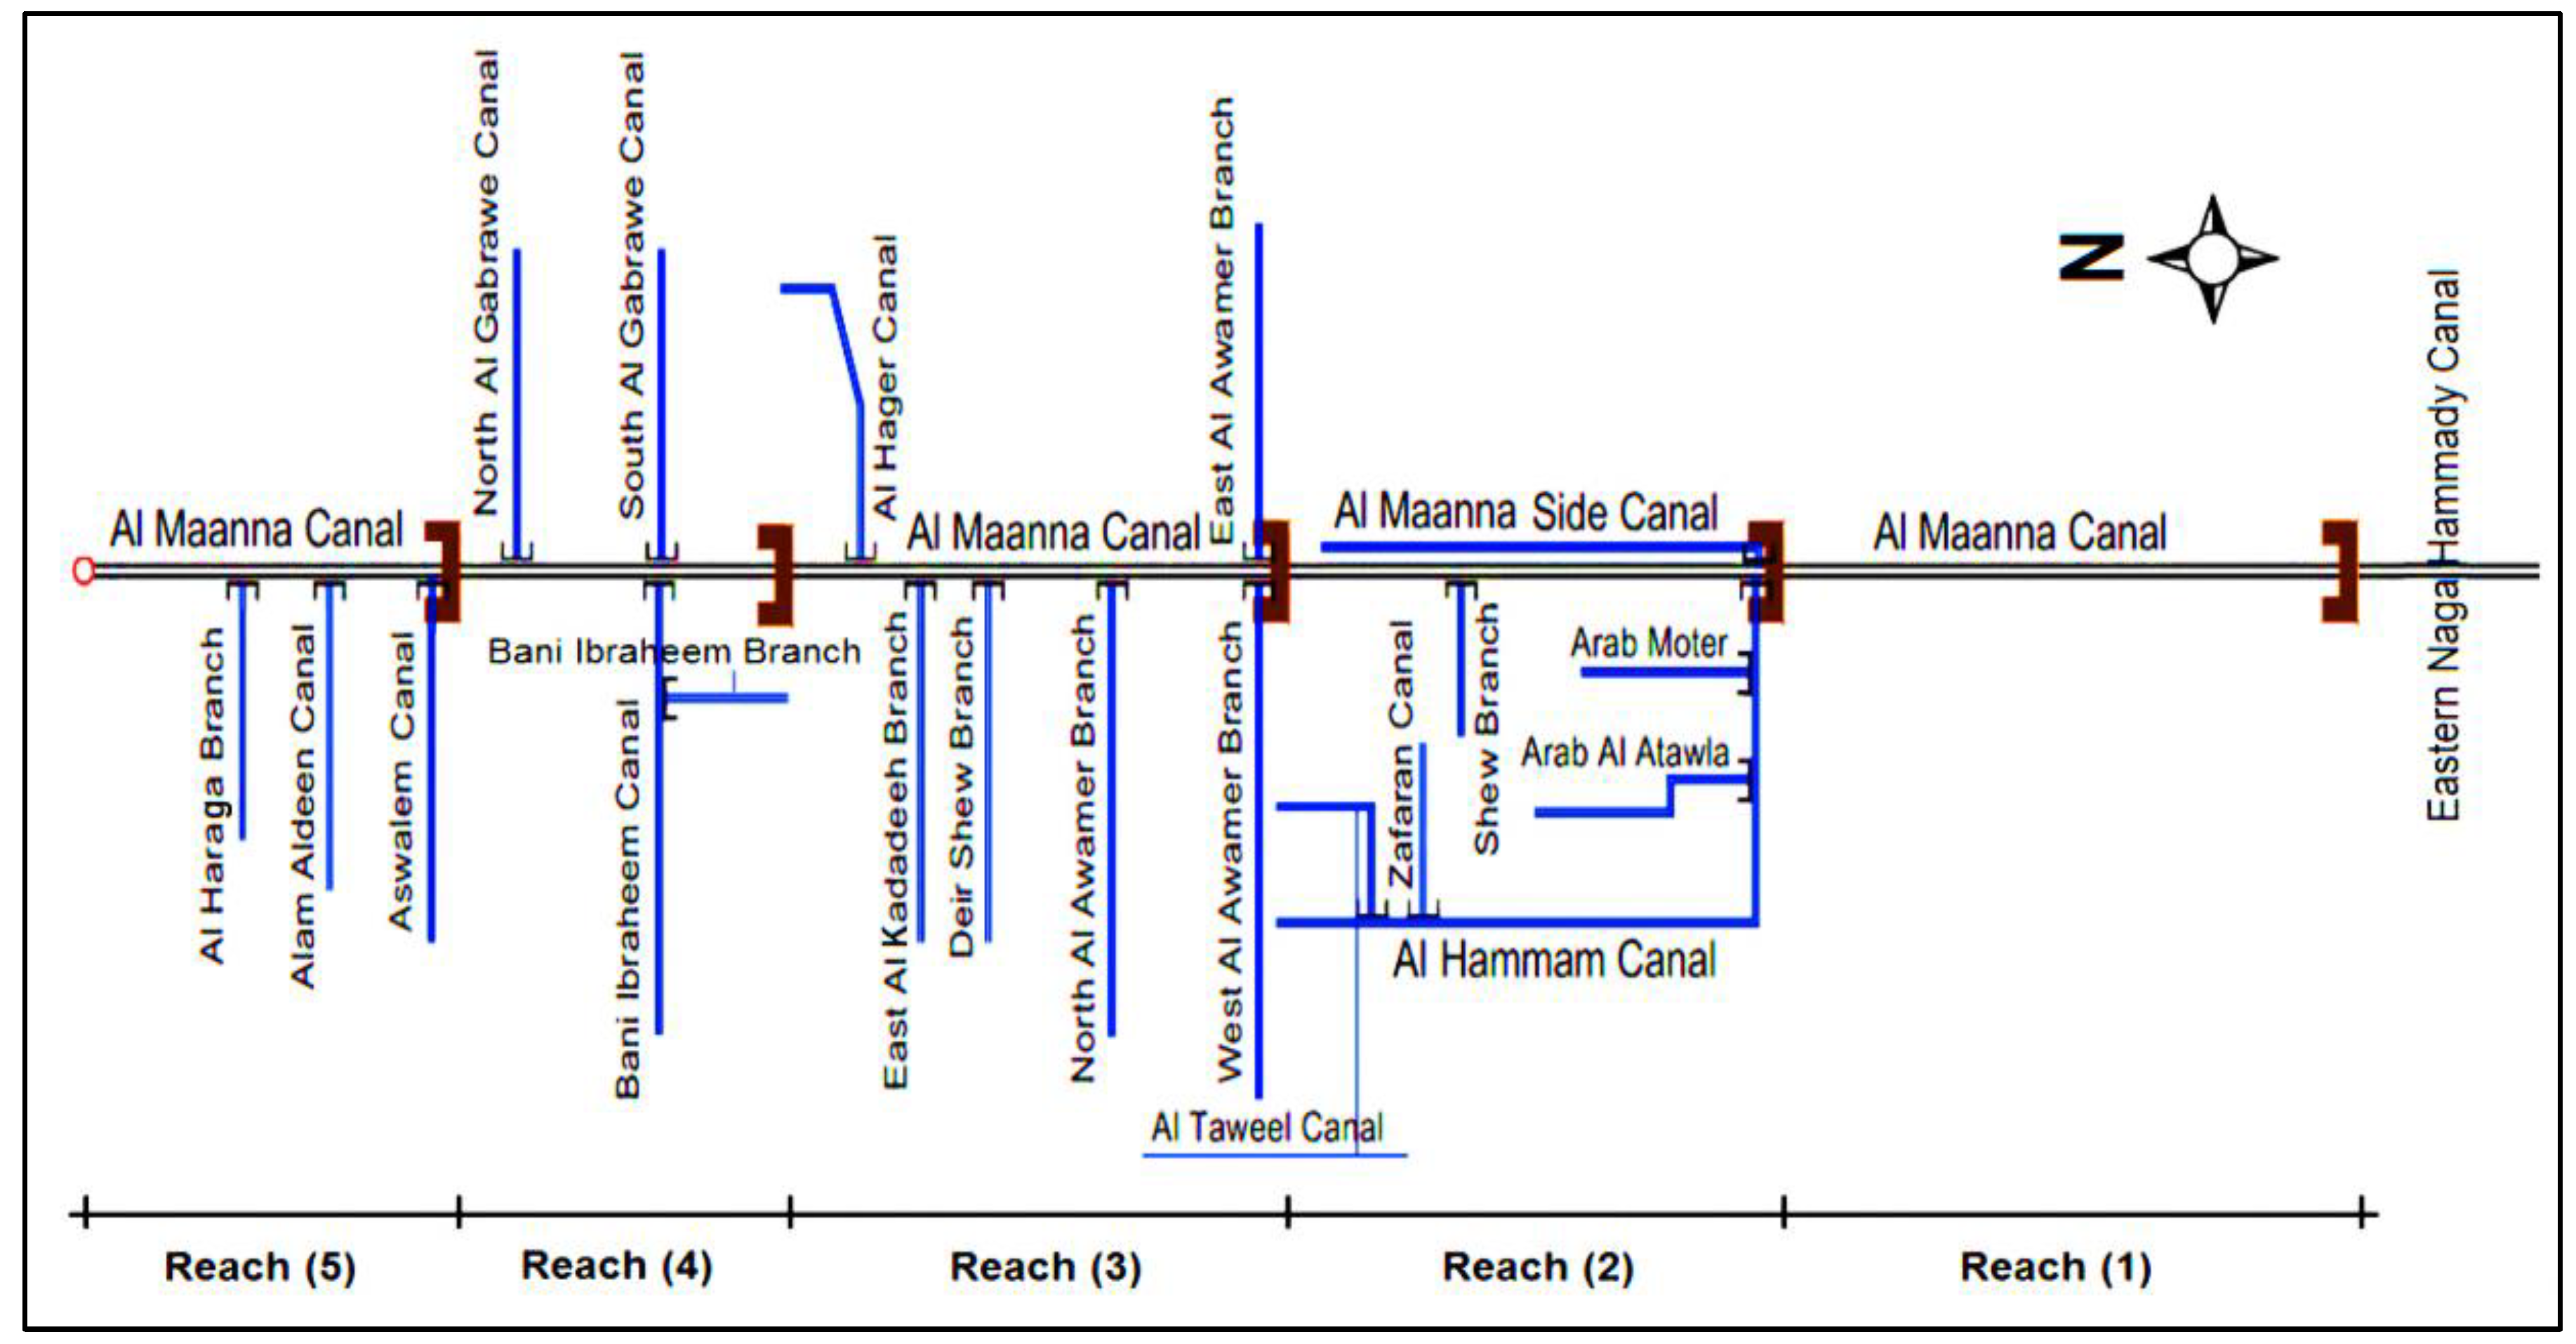
Al Maanna Canal is one of the main canals in Assiut Governorate. It takes its water from the Eastern Naga Hammady Canal and irrigates a cropped area of about 13500 feddan. The length of the Al Maanna Canal is roughly 32.8 km. This length is divided into five reaches, where the less ordered canals are branched on both sides, as shown in
Figure 2. The branches have a total length of around 47 km (Abu-Zaid and Sabery, 2021).
Table 3 summarizes the characteristics of the Al Maanna Canal and its branches.
3.2. Surveying of Soil Types in the Study Area
It was required to take some samples along the canals' paths to determine the soil type, degree of permeability, and other physical properties. Every five kilometers along the main canal and one sample for every off-taking canal, soil samples were gathered at various depths beneath the canal bed and from the side slopes. All of these samples were subjected to sieve analysis, a liquid limit, a plastic limit, a plasticity index, and a group index test to estimate all of these parameters and coefficients.
3.3. Meteorological Data
Table 4 shows the available monthly meteorological data for the understudied region from the Arab Al-Awamer Weather Station (AAWS, 2020). These data include Air Temperature (T), Relative Humidity (RH), Pan Evaporation (Ep), Wind Speed, and Number of Sunny Hours per Day (SH/Day). These meteorological data were used to calculate evaporation and evapotranspiration losses from the Al Maanna canal and its branches, as analyzed and discussed further below.
3.4. Field Data
The gathered data from the study area of the Al Maanna canal and its branches were based on the required parameters to measure seepage, evaporation, and evapotranspiration losses from the network, as indicated below.
3.4.1. Field Parameters of Seepage Losses
In order to measure seepage losses, water was restricted in significant lengths of the Al Maanna canal and its branches using the field ponding method, as shown in photo (1); then the water level was measured twice, once after the restriction process and again after 24 hours, using the measuring device shown in photo (2). The ponding test seepage rates were calculated using the above-mentioned equation (1) proposed by Leigh (2014).

3.4.2. Field Parameters of Evaporation Losses
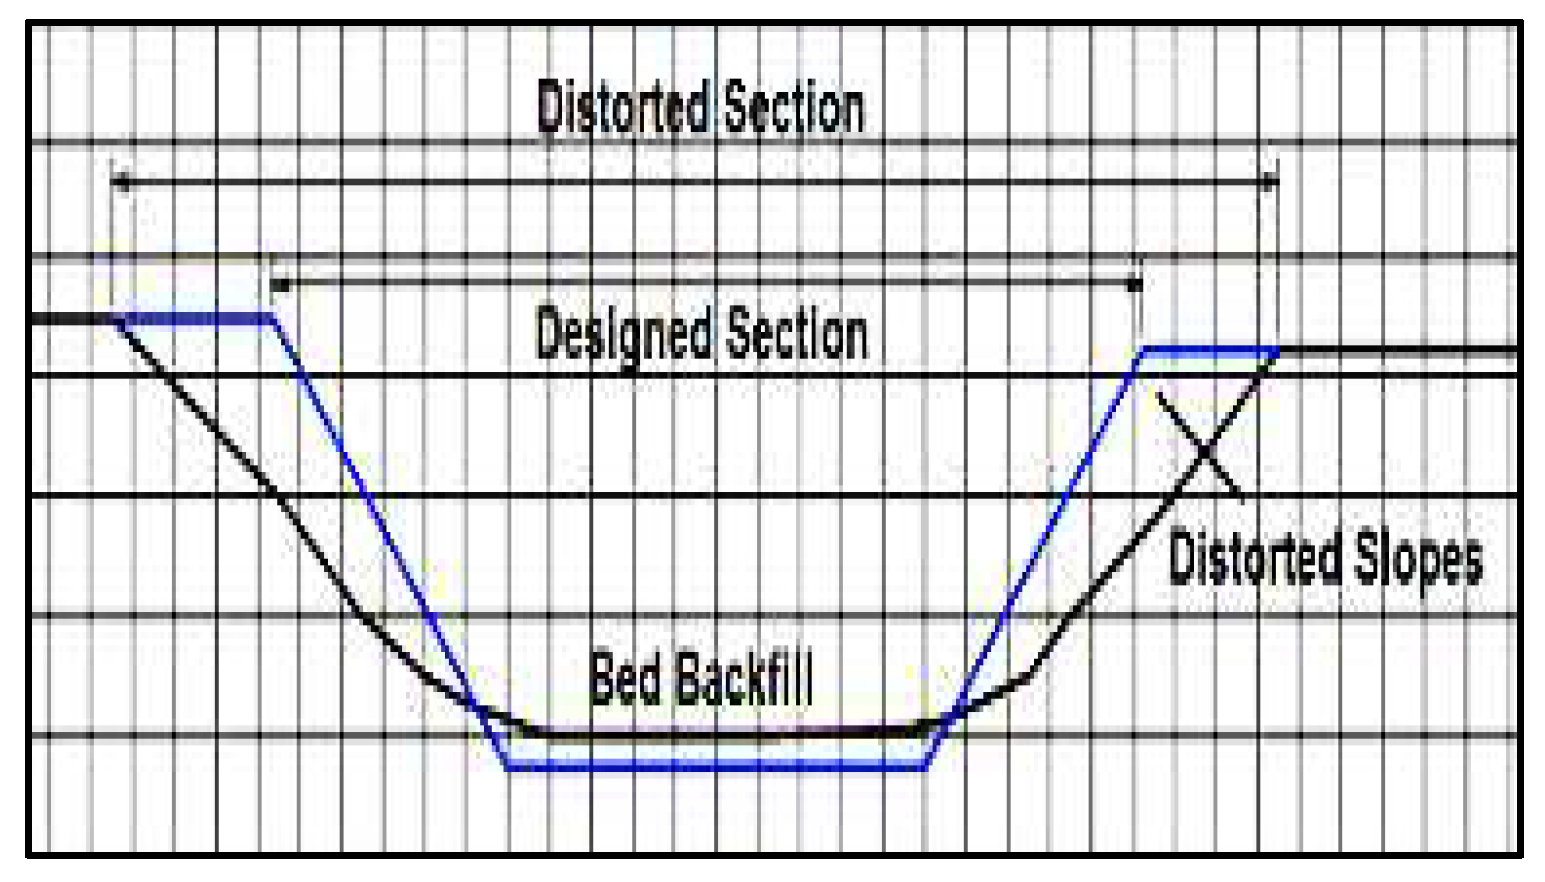
Evaporation losses occur from both the designed (rehabilitated) and distorted cross sections of canals, depending on the top width of the exposed water surface. As shown in
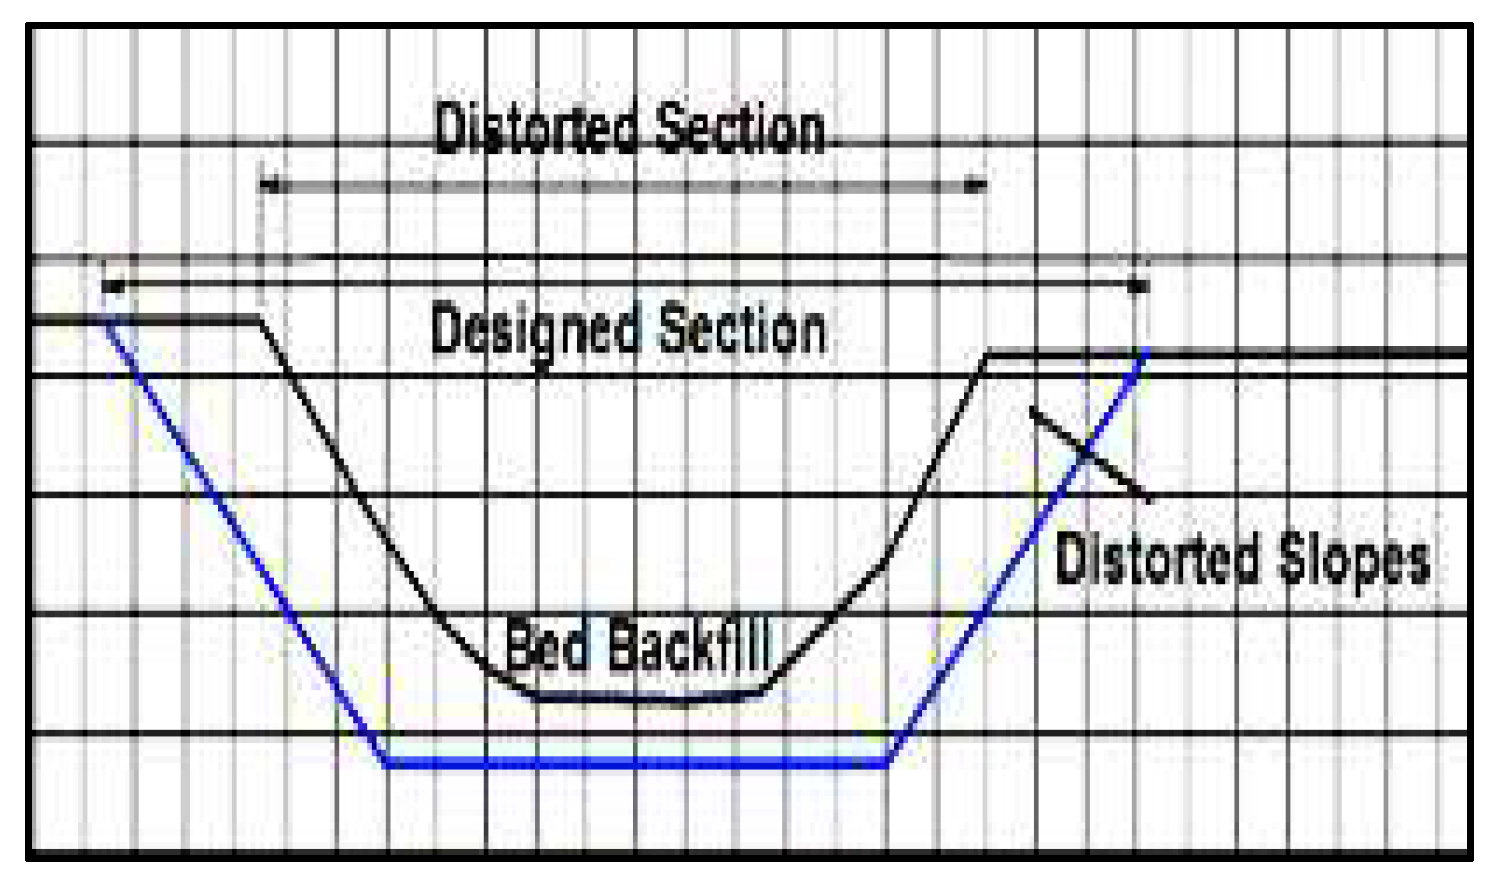
Figure 3, if the top water surface in the distorted cross section is bigger than the top water surface in the designed cross section, the evaporation rate from the distorted cross section of the canal will be positive (more than the evaporation rate from the designed cross section). However, if the top water surface in the distorted cross section is less than the top water surface in the designed (rehabilitated) cross section, as shown in
Figure 4, the evaporation rate from the distorted cross section of the canal will be negative (less than the evaporation rate from the designed cross section). The distorted cross sections of Al Maanna canal and its branches were measured every 200 m along the canal's length and compared with the designed cross sections. The evaporation rates from the designed and distorted cross sections were estimated using the foregoing equation (2) provided by Suhua et al. (2016), associated with the meteorological data listed in the above
Table 4.
3.4.3. Field Parameters of Evapotranspiration Losses
Most irrigation canals have extensive weed growth along their sides as well as siltation above the canals' beds. These conditions have an impact on the hydraulic characteristics of canals, such as the shape of the cross-section and its performance, the reduction of water velocity, and the limiting capacity of irrigation canals. As shown in Photo 3, growing weeds along the banks of the Al Maanna canal and its branches is a source of evapotranspiration losses from the network. The weeds' dimensions were estimated using a field measuring wheel, as shown in Photo 4. The areas of weeds along Al Maanna Canal and its branches were computed using these dimensions, as given in
Table 5.

The above-mentioned equation (5), developed by El-Enany et al. (2004), was used to estimate evapotranspiration losses from the weeds along Al Maanna canal and its branches, based on the available meteorological data introduced in the above
Table 4, in addition to the CROPWATER software model that was utilized to estimate the reference evapotranspiration (ET
o) from the weeds. It's worth noting that the CROPWATER software is based on the Penman-Monteith method (Allen et al. 1998).
3.5. Analyses and Discussions
The determination of seepage, evaporation, and evapotranspiration losses from the distorted and designed (rehabilitated) cross sections of the Al Maanna canal and its branches in Assiut governorate was achieved by using the literature review associated with the collected data for the study area. The following items have been separately analyzed to determine each water loss from the network:
3.5.1. Seepage Losses
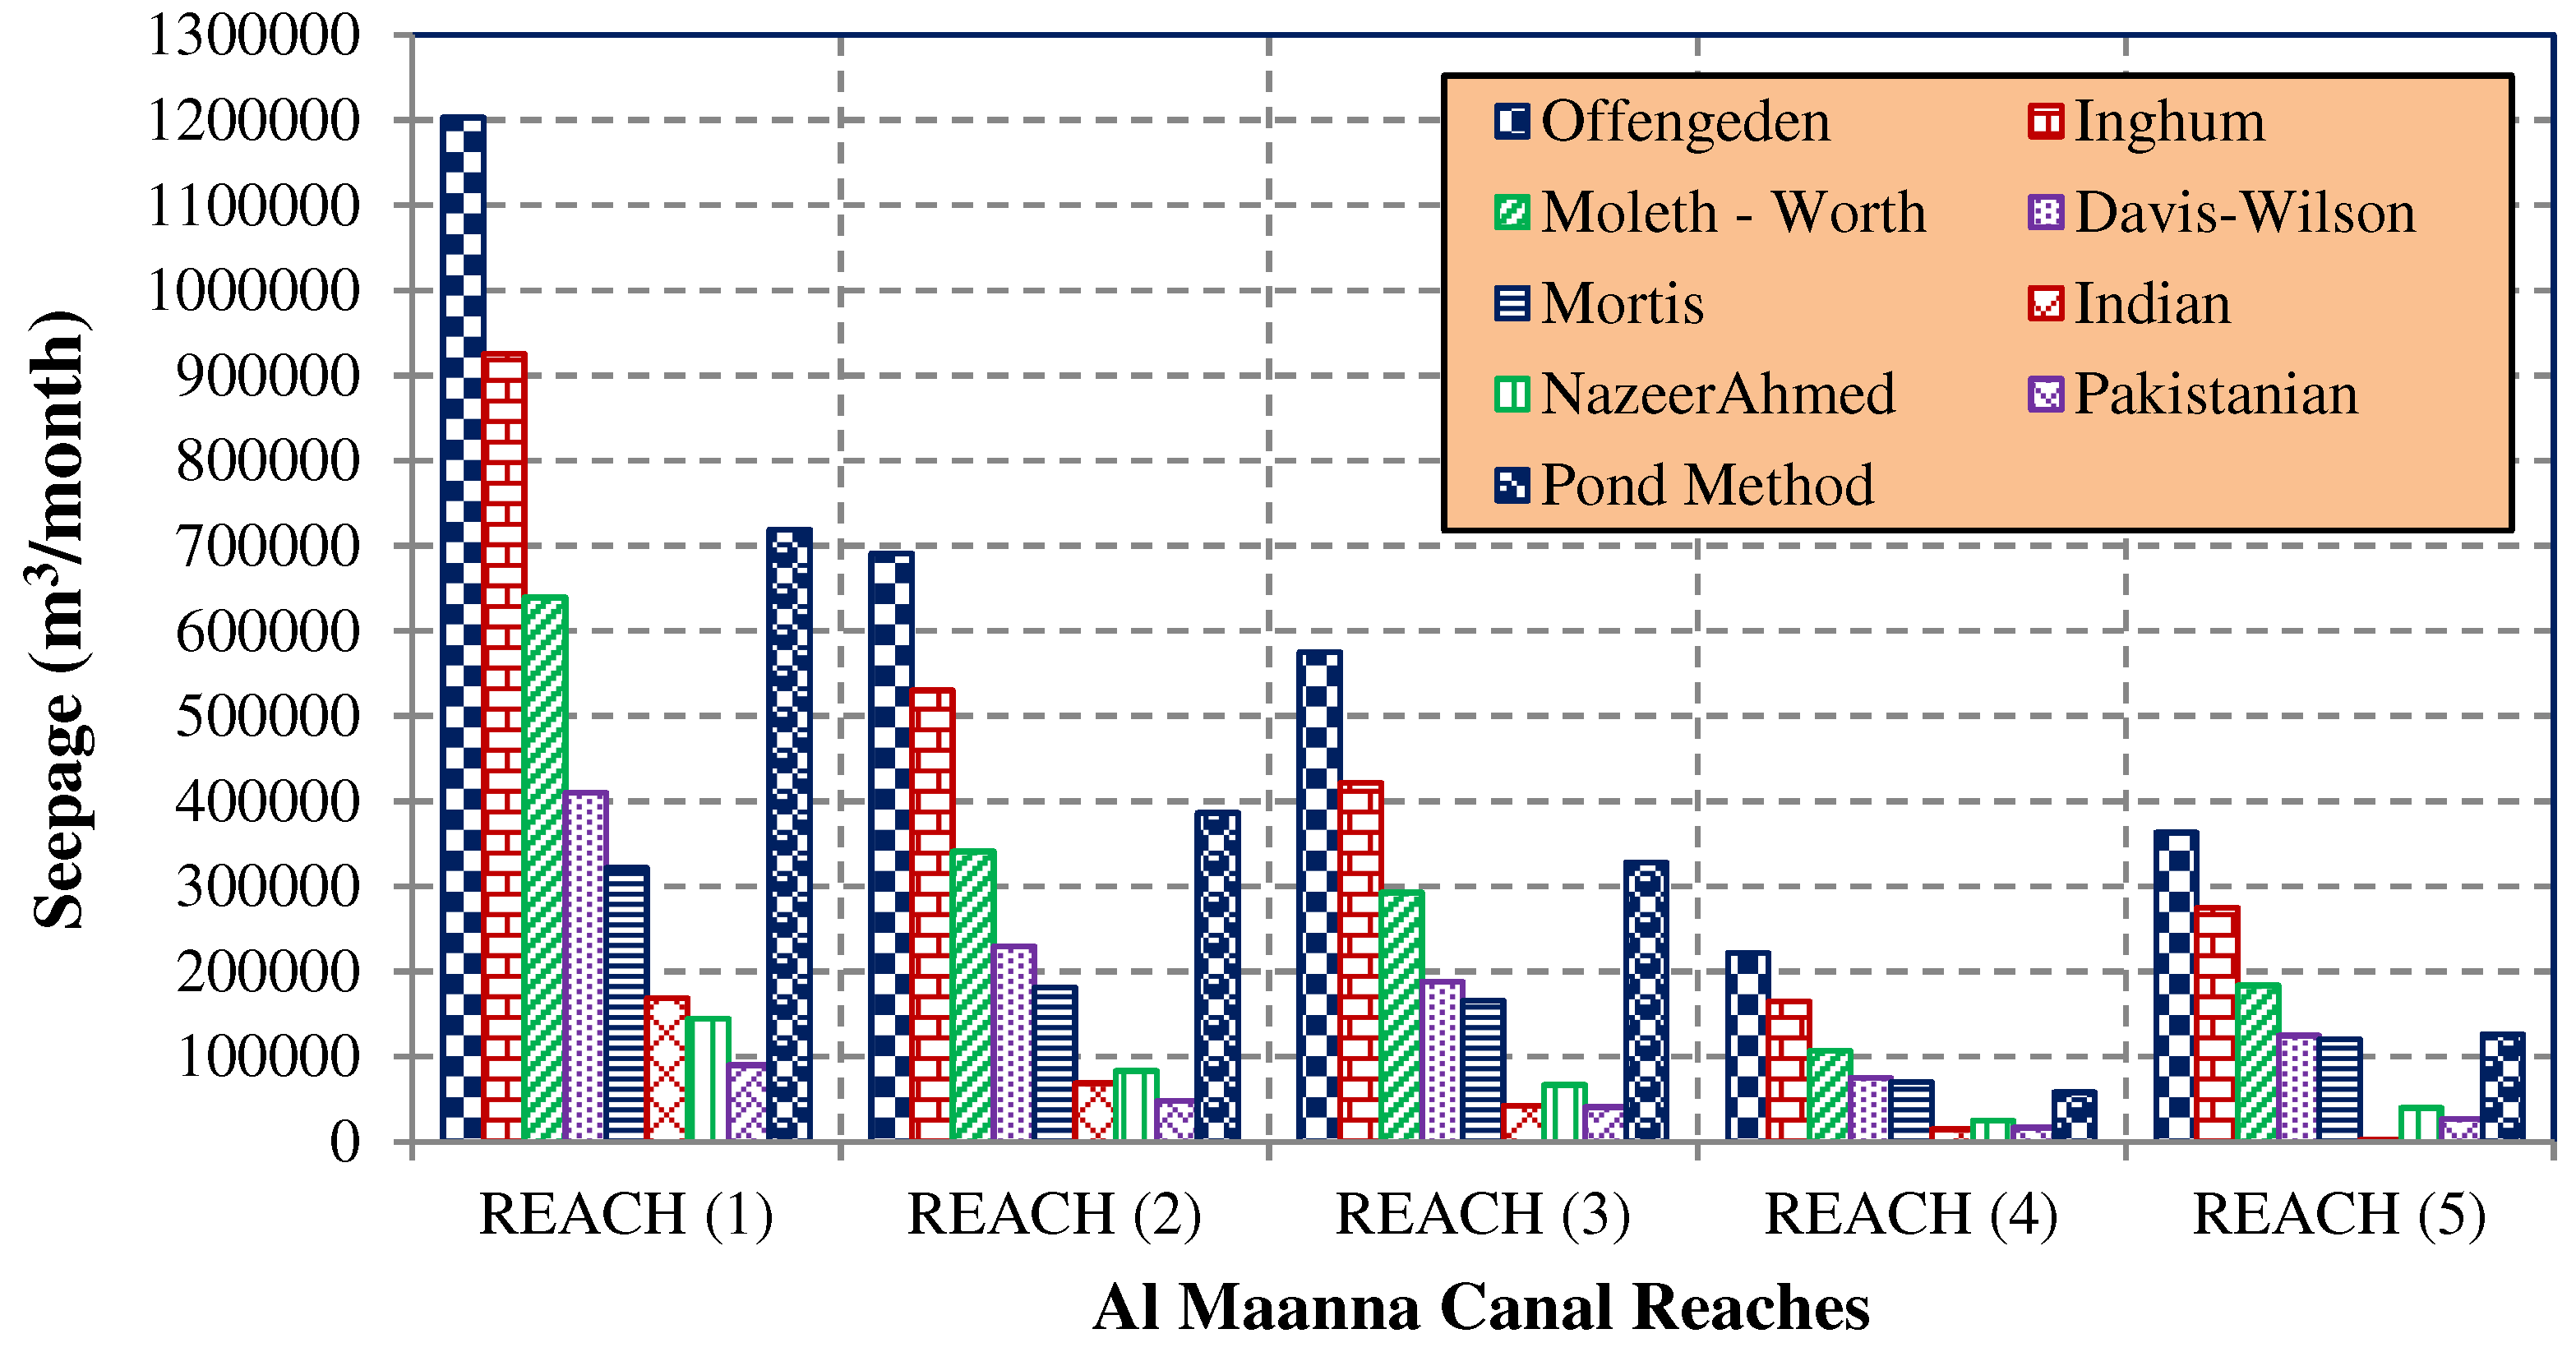
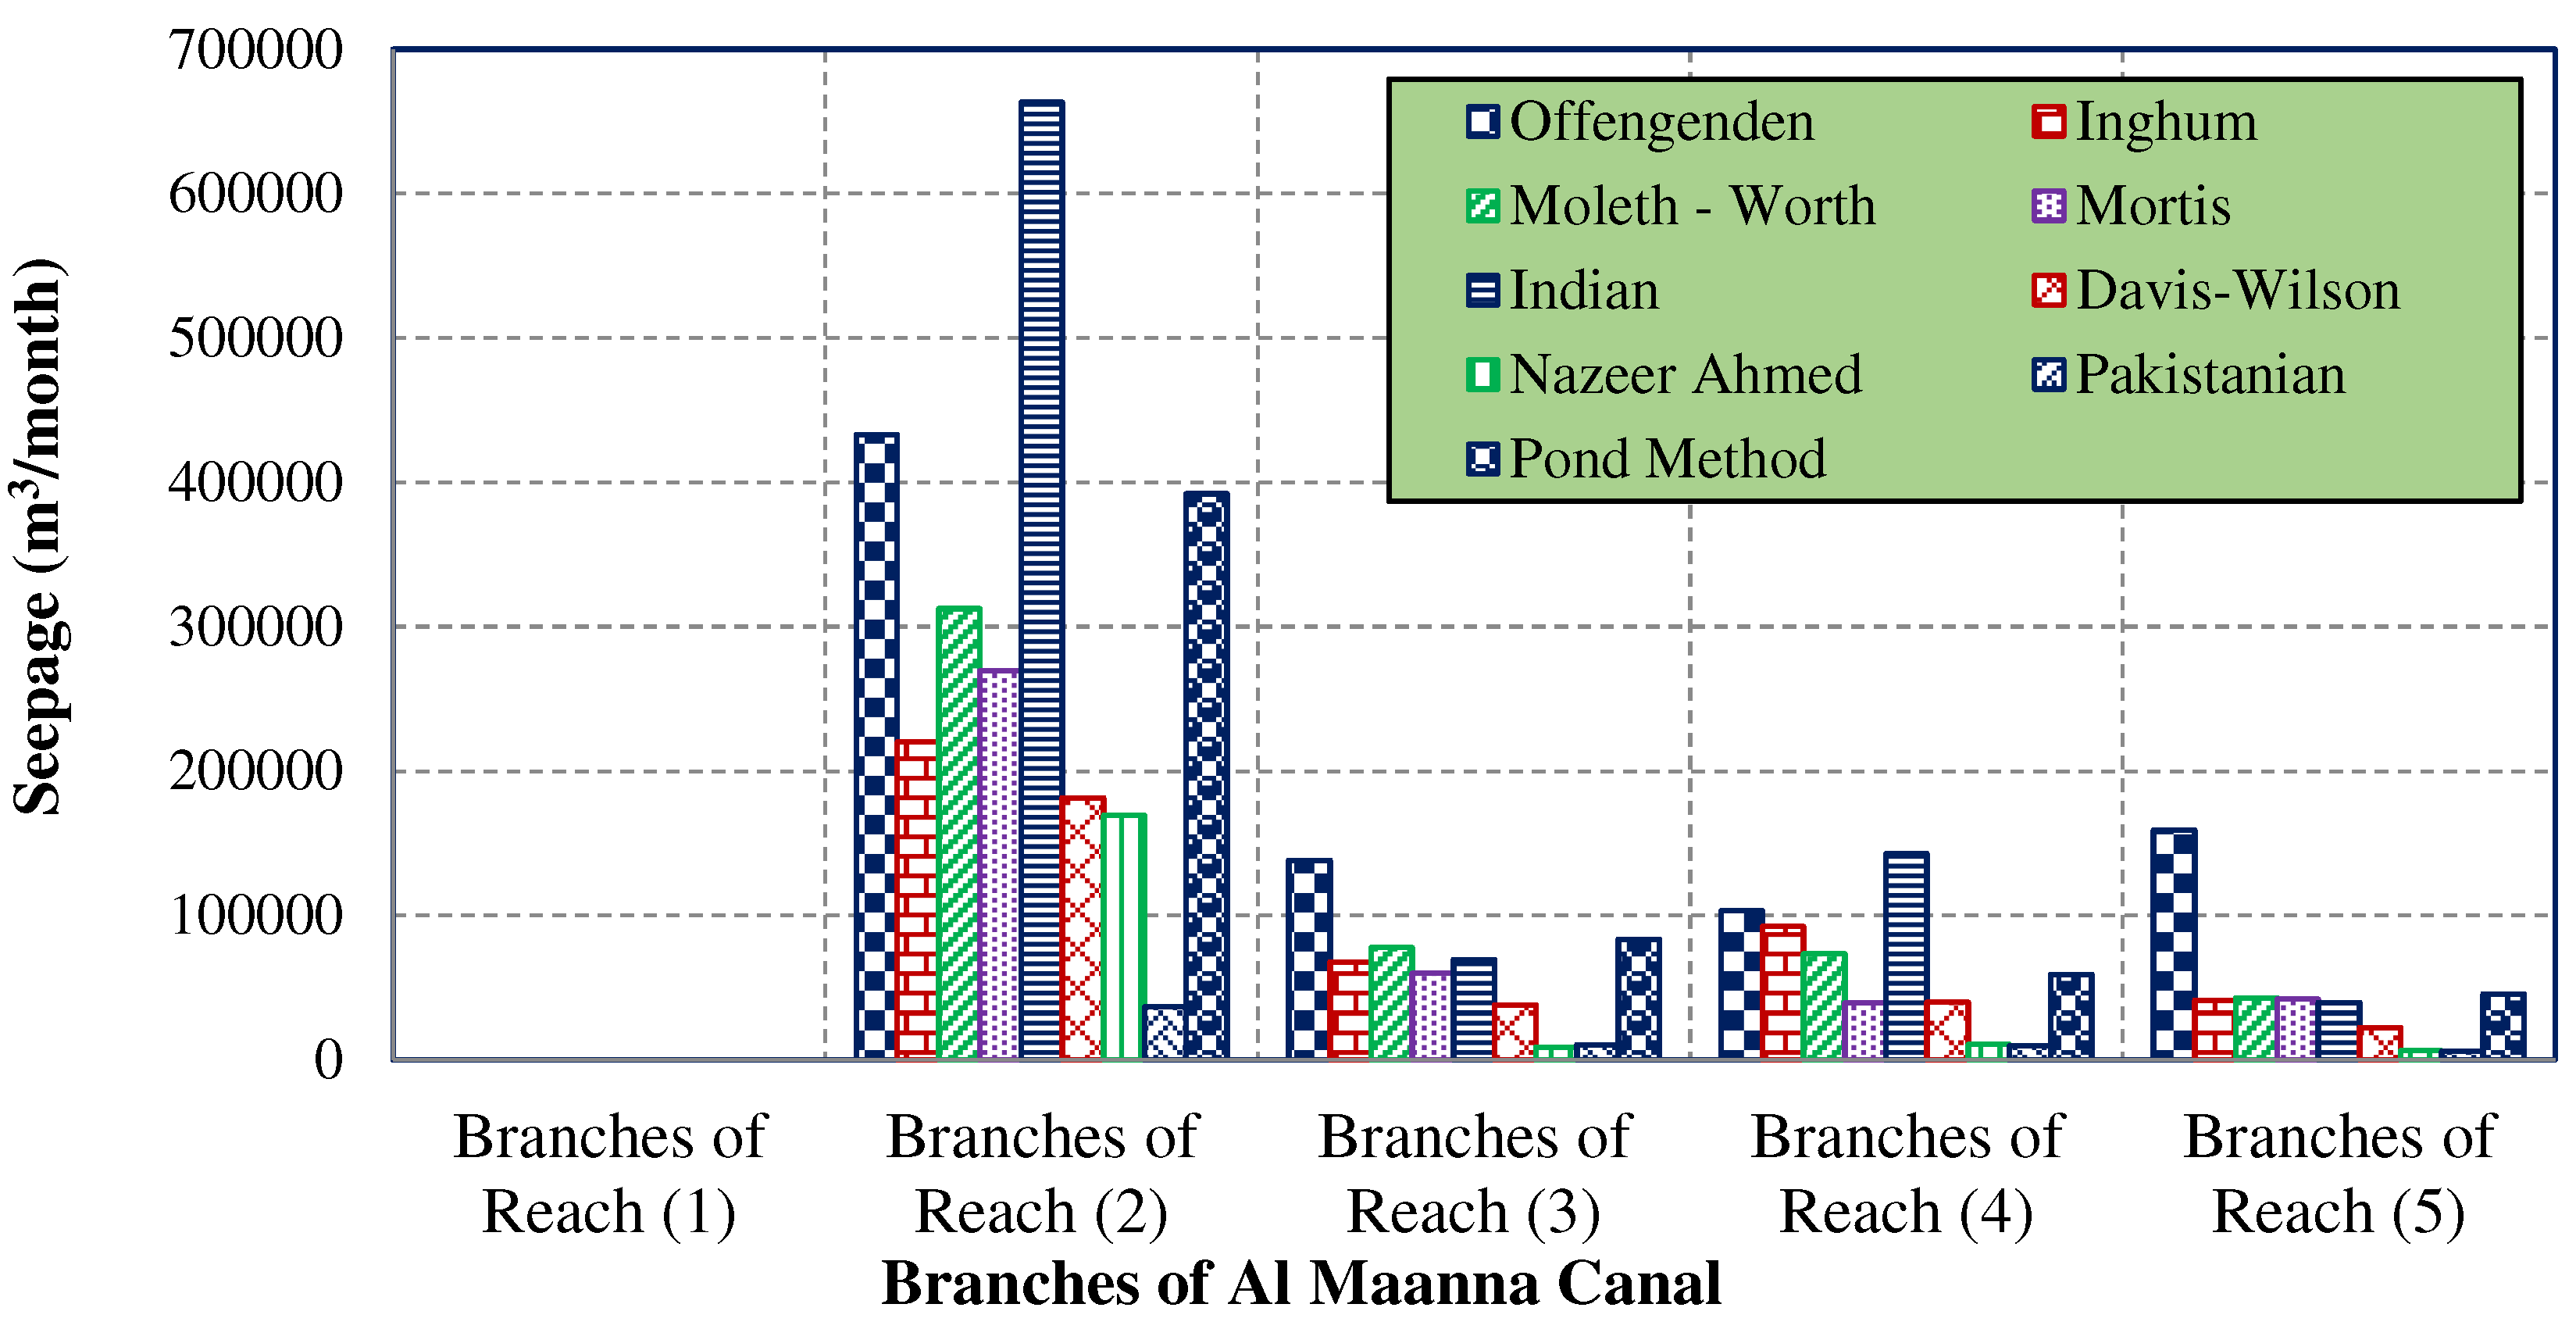
As shown in the
Figure 6 and
Figure 7, seepage losses from the distorted cross sections of Al Maanna canal and its branches were calculated using the field ponding method in addition to the experimental formulas presented in the foregoing
Table 2.
From
Figure 6, it can be observed that the maximum seepage losses from the Al Maanna canal occurred from the first reach, using the Offengenden experimental formula. Using the Indian experimental formula, the fourth reach had the lowest seepage losses.
From
Figure 7, it can be noticed that the maximum seepage losses from the branches of the Al Maanna canal occurred from branches of the second reach using the Indian experimental formula. While, branches of the last reach caused the minimum seepage losses according to the Pakistani experimental formula. It should be noted that the first reach of the Al Maanna Canal has no branches.
The predictions of the experimental Moleth-Worth and Yennidunia formulas for measuring seepage losses are compatible with the field ponding method, as shown in
Figure 6 and
Figure 7. Seepage losses from the distorted cross sections of the Al Maanna canal were estimated to be about 1,562,917 and 1,617,354 m
3/month by using the experimental Moleth-Worth formula and field ponding method, respectively. Seepage losses from the branches of the Al Maanna canal were estimated to be nearly 506,777 and 580,233 m
3/month by using the Moleth-Worth formula and ponding method, respectively.
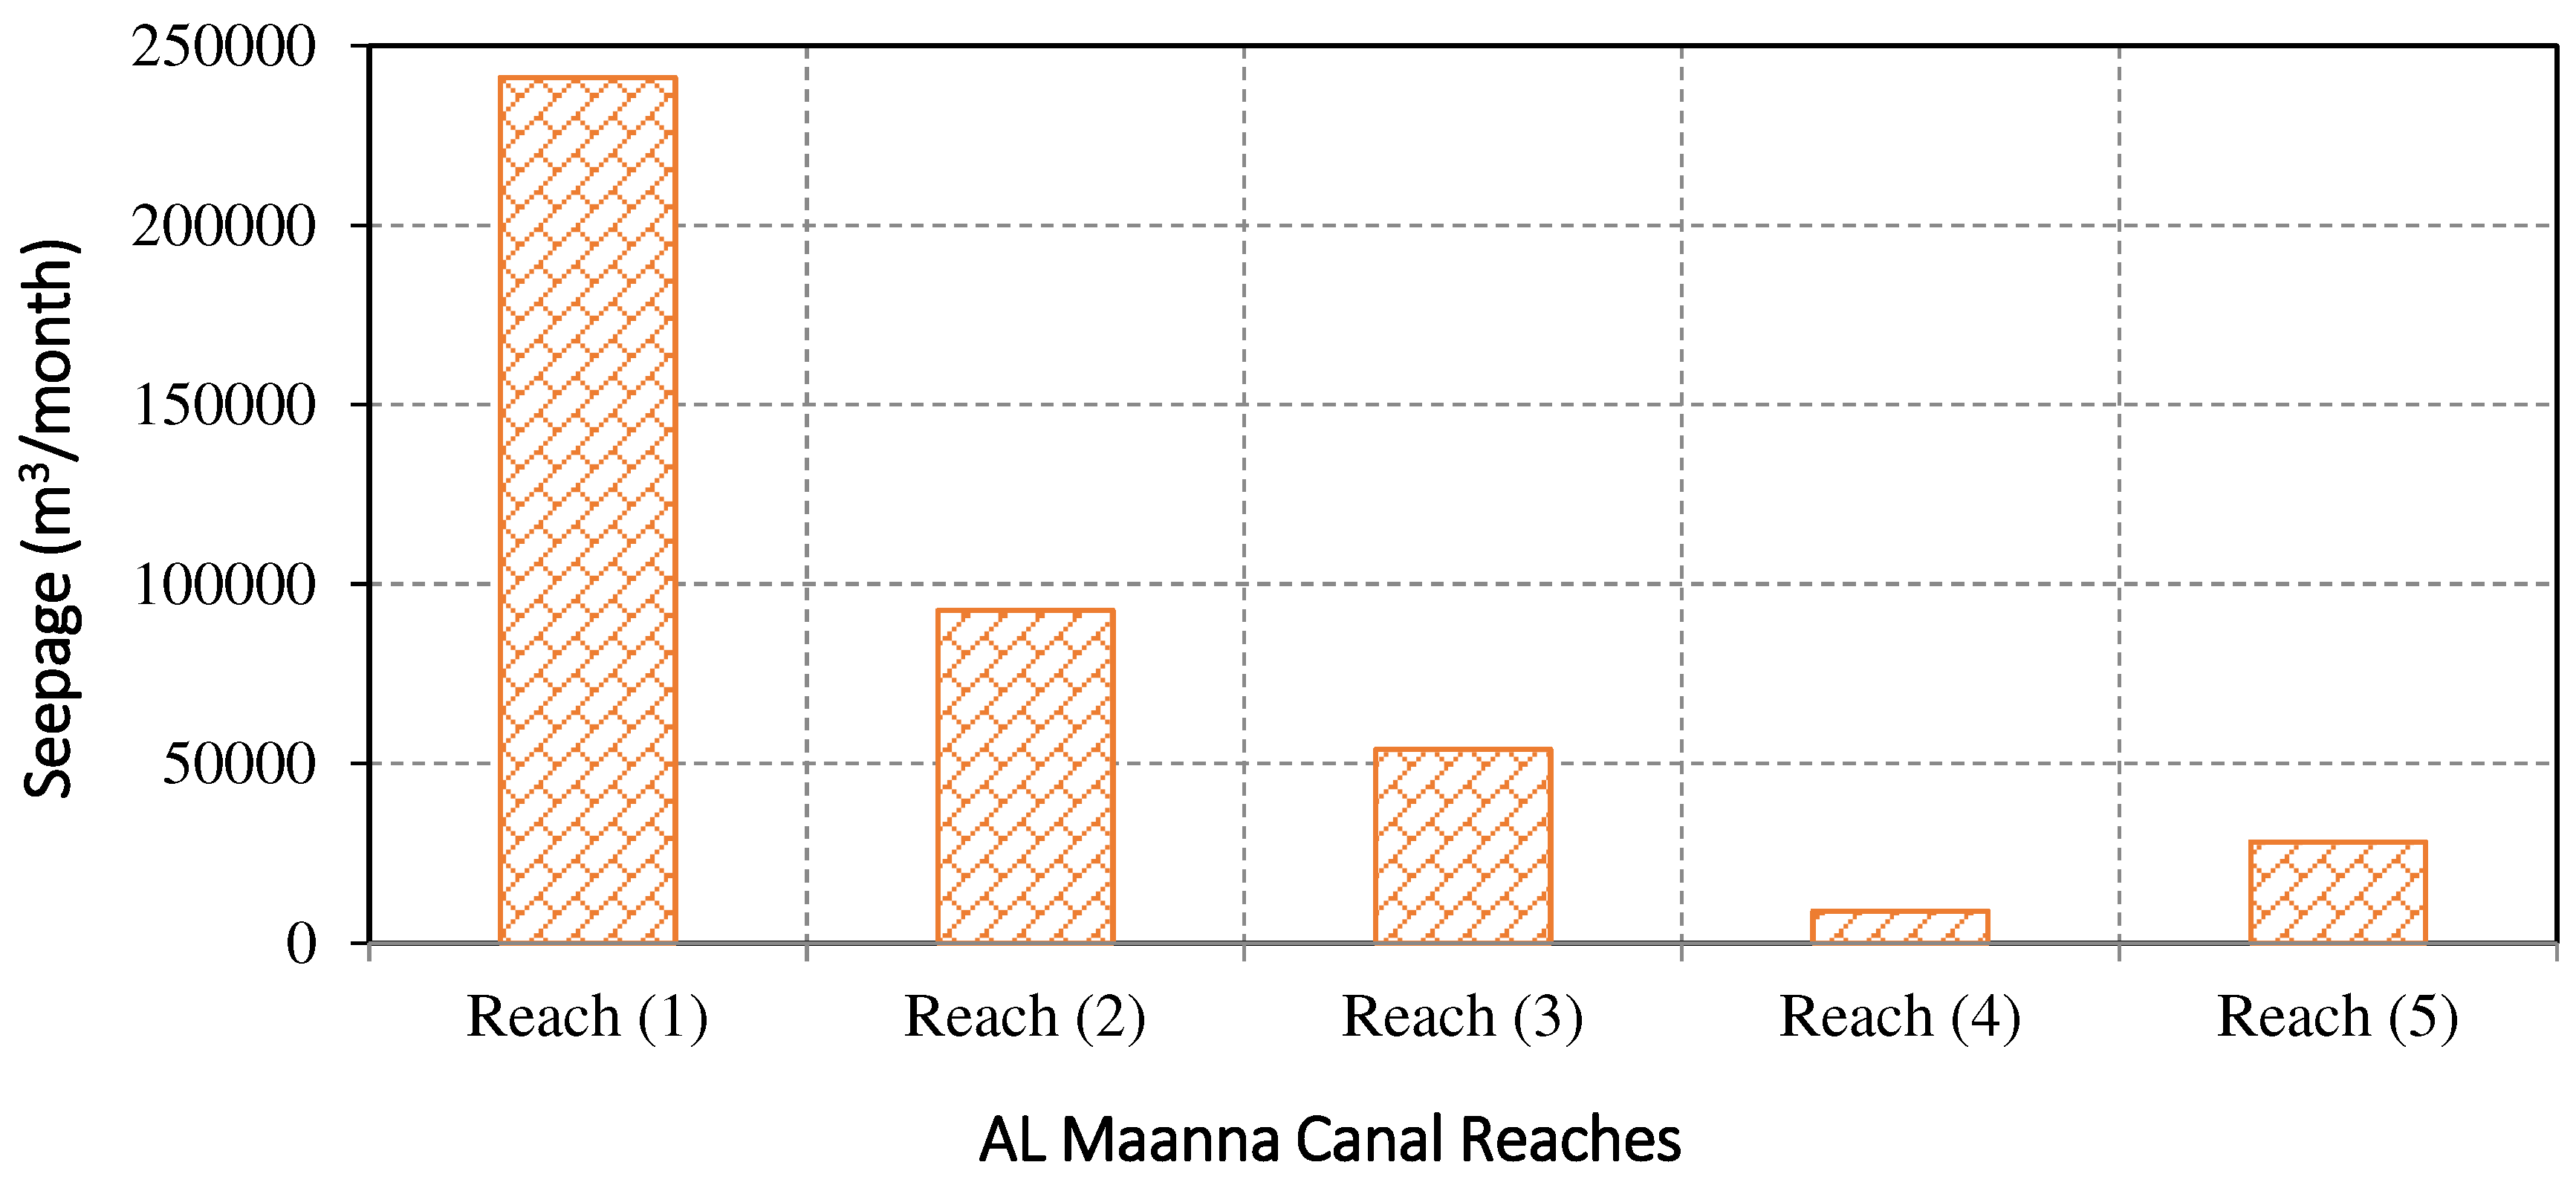
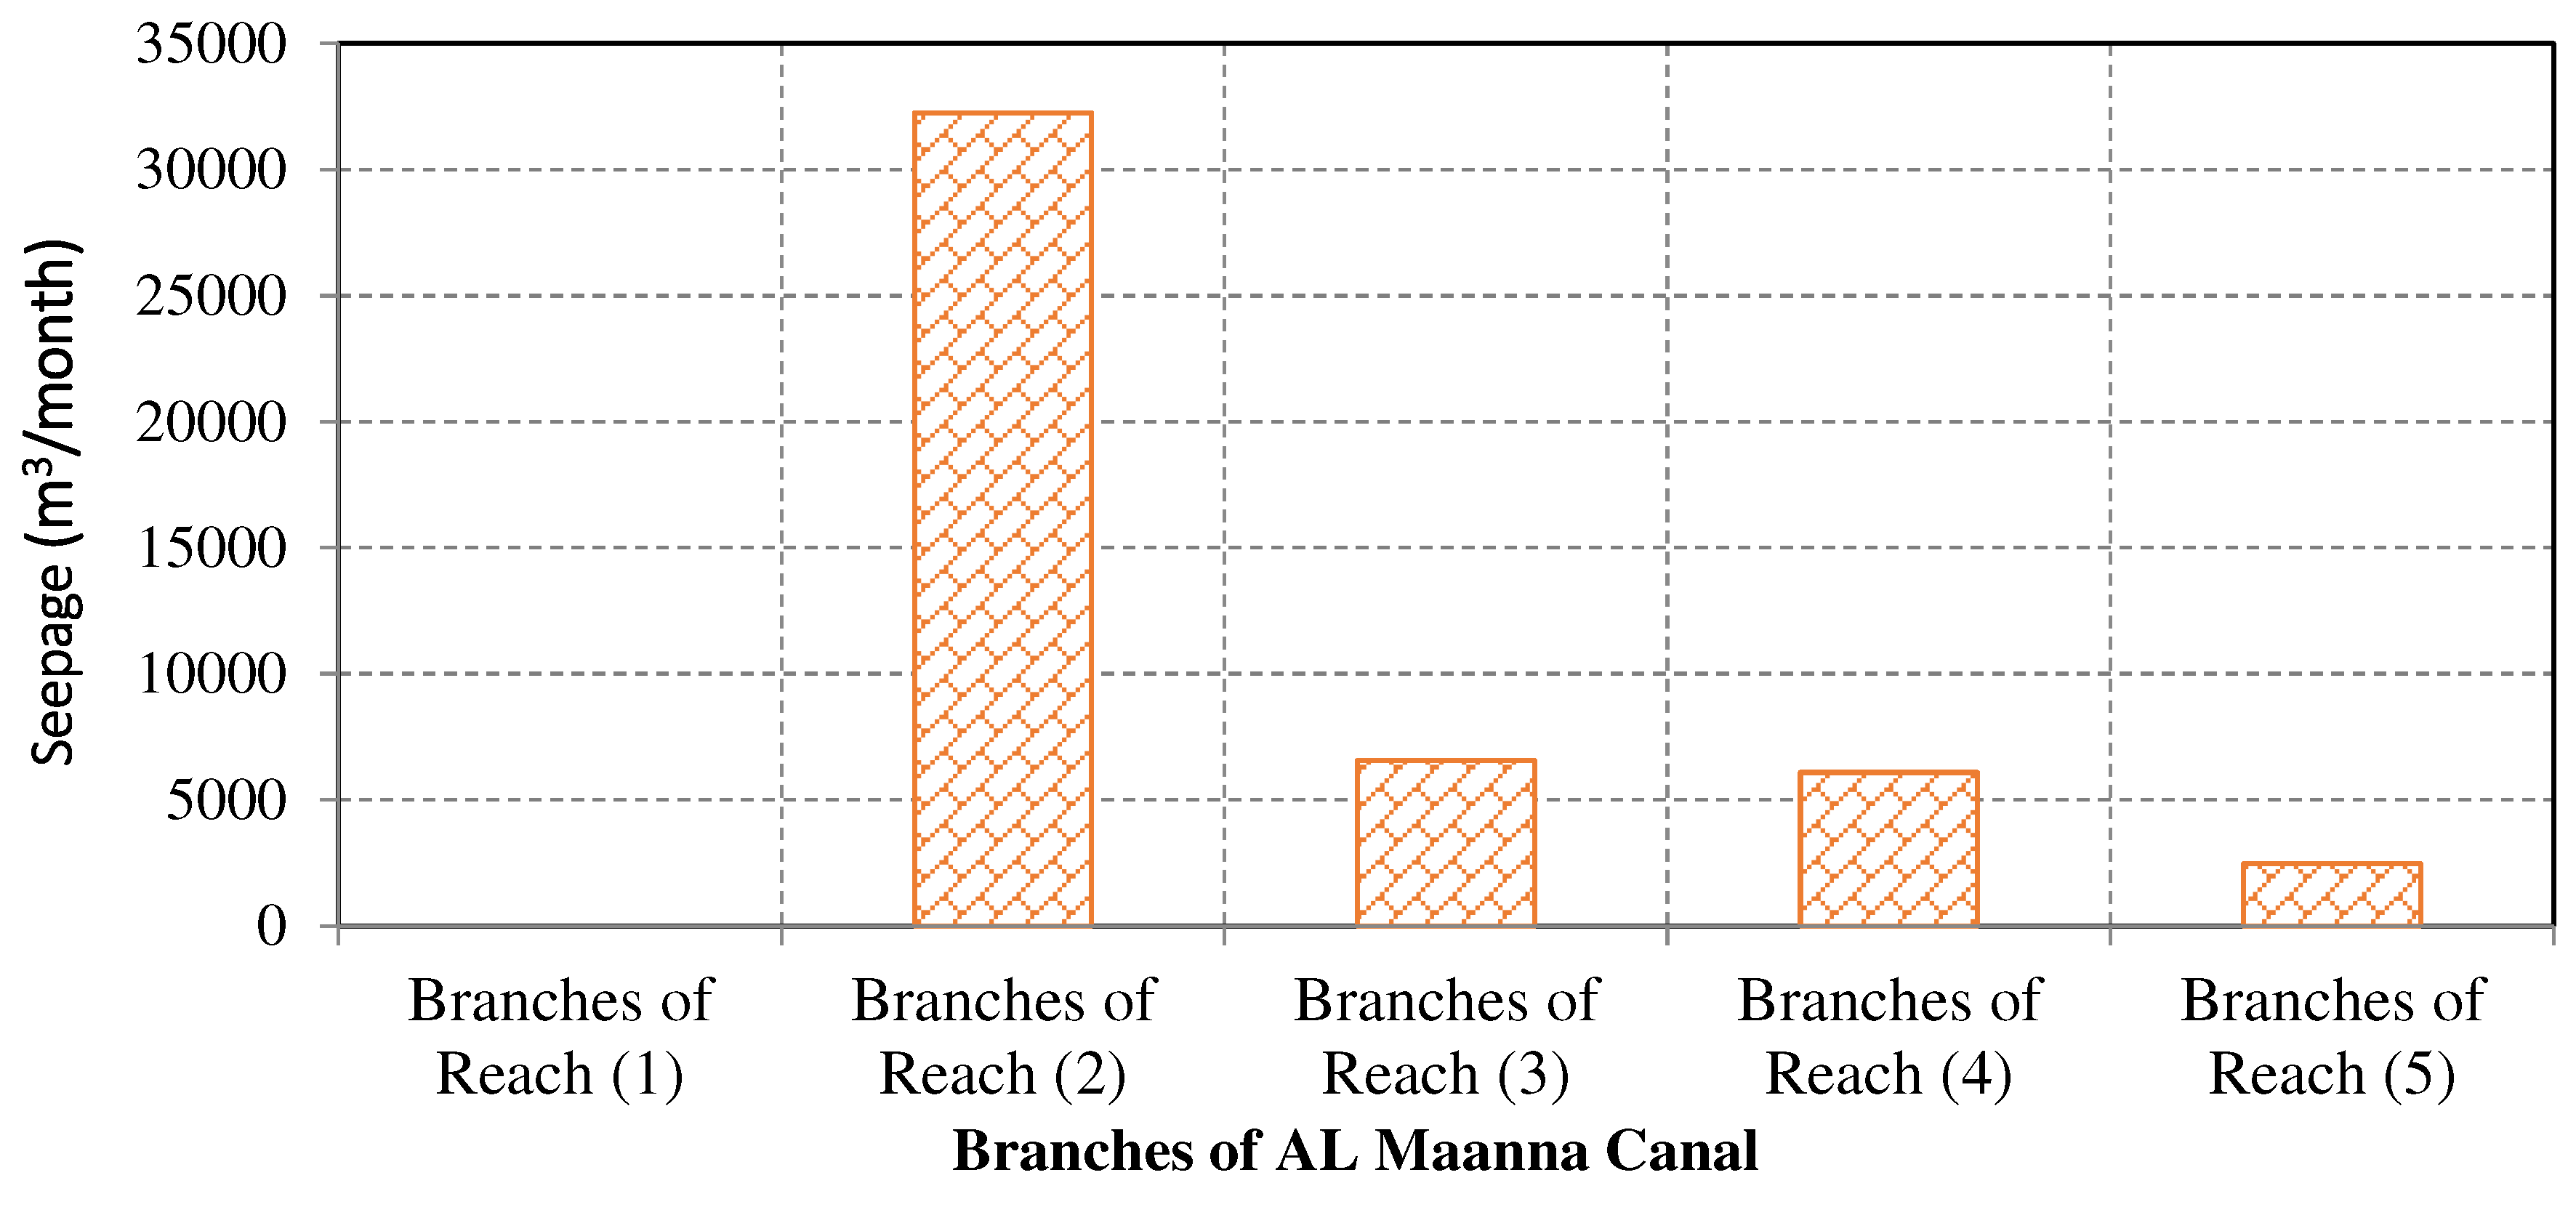
After the lining and rehabilitation process of the Al Maanna canal and its branches, the field ponding method was conducted to estimate seepage losses from the lined cross sections, as illustrated in the following
Figure 8 and
Figure 9.
The highest seepage losses from the rehabilitated sections of Al Maanna Canal occurred in the first reach, as shown in
Figure 8. The fourth-lined reach had the fewest seepage losses. Also,
Figure 9 shows that lined branches in the second reach of the Al Maanna canal caused the most seepage losses. While the last reach's lined branches caused the least amount of seepage losses.
The calculated seepage losses from the distorted cross sections and the rehabilitated sections have a clear difference. After the lining and rehabilitation process of the Al Maanna canal network, the massive amounts of seepage losses were significantly reduced to about 472,255 m3/month, which represents nearly 21.48% of seepage losses before rehabilitation.
3.5.2. Evaporation Losses
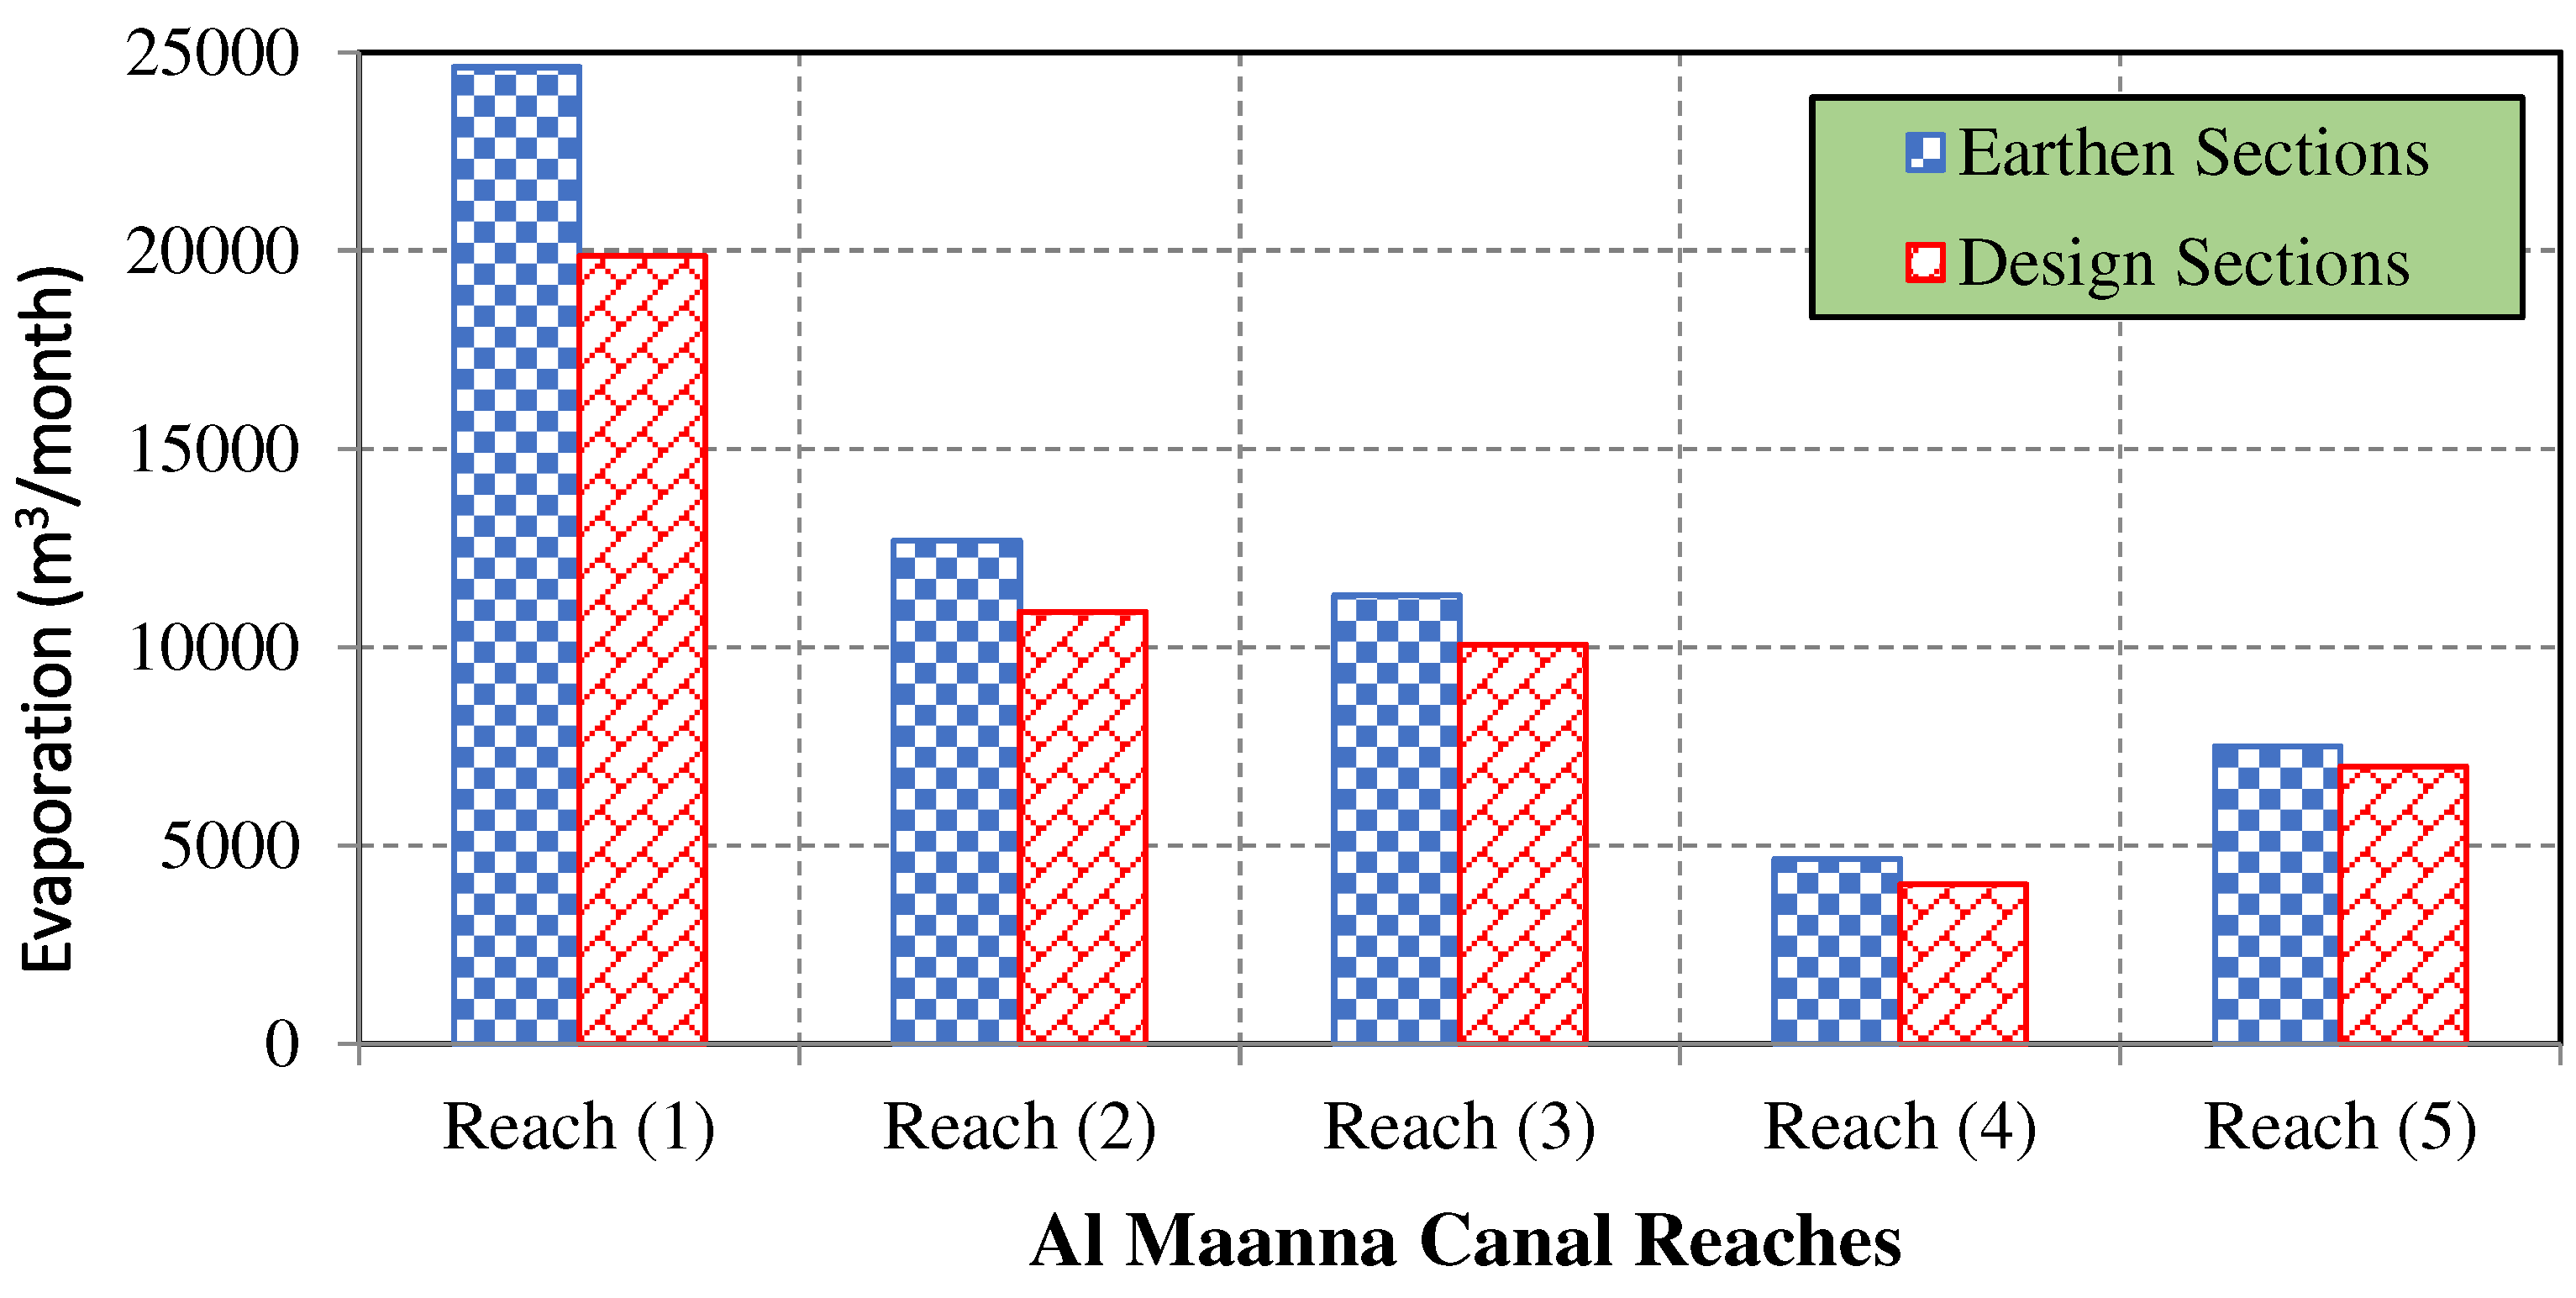
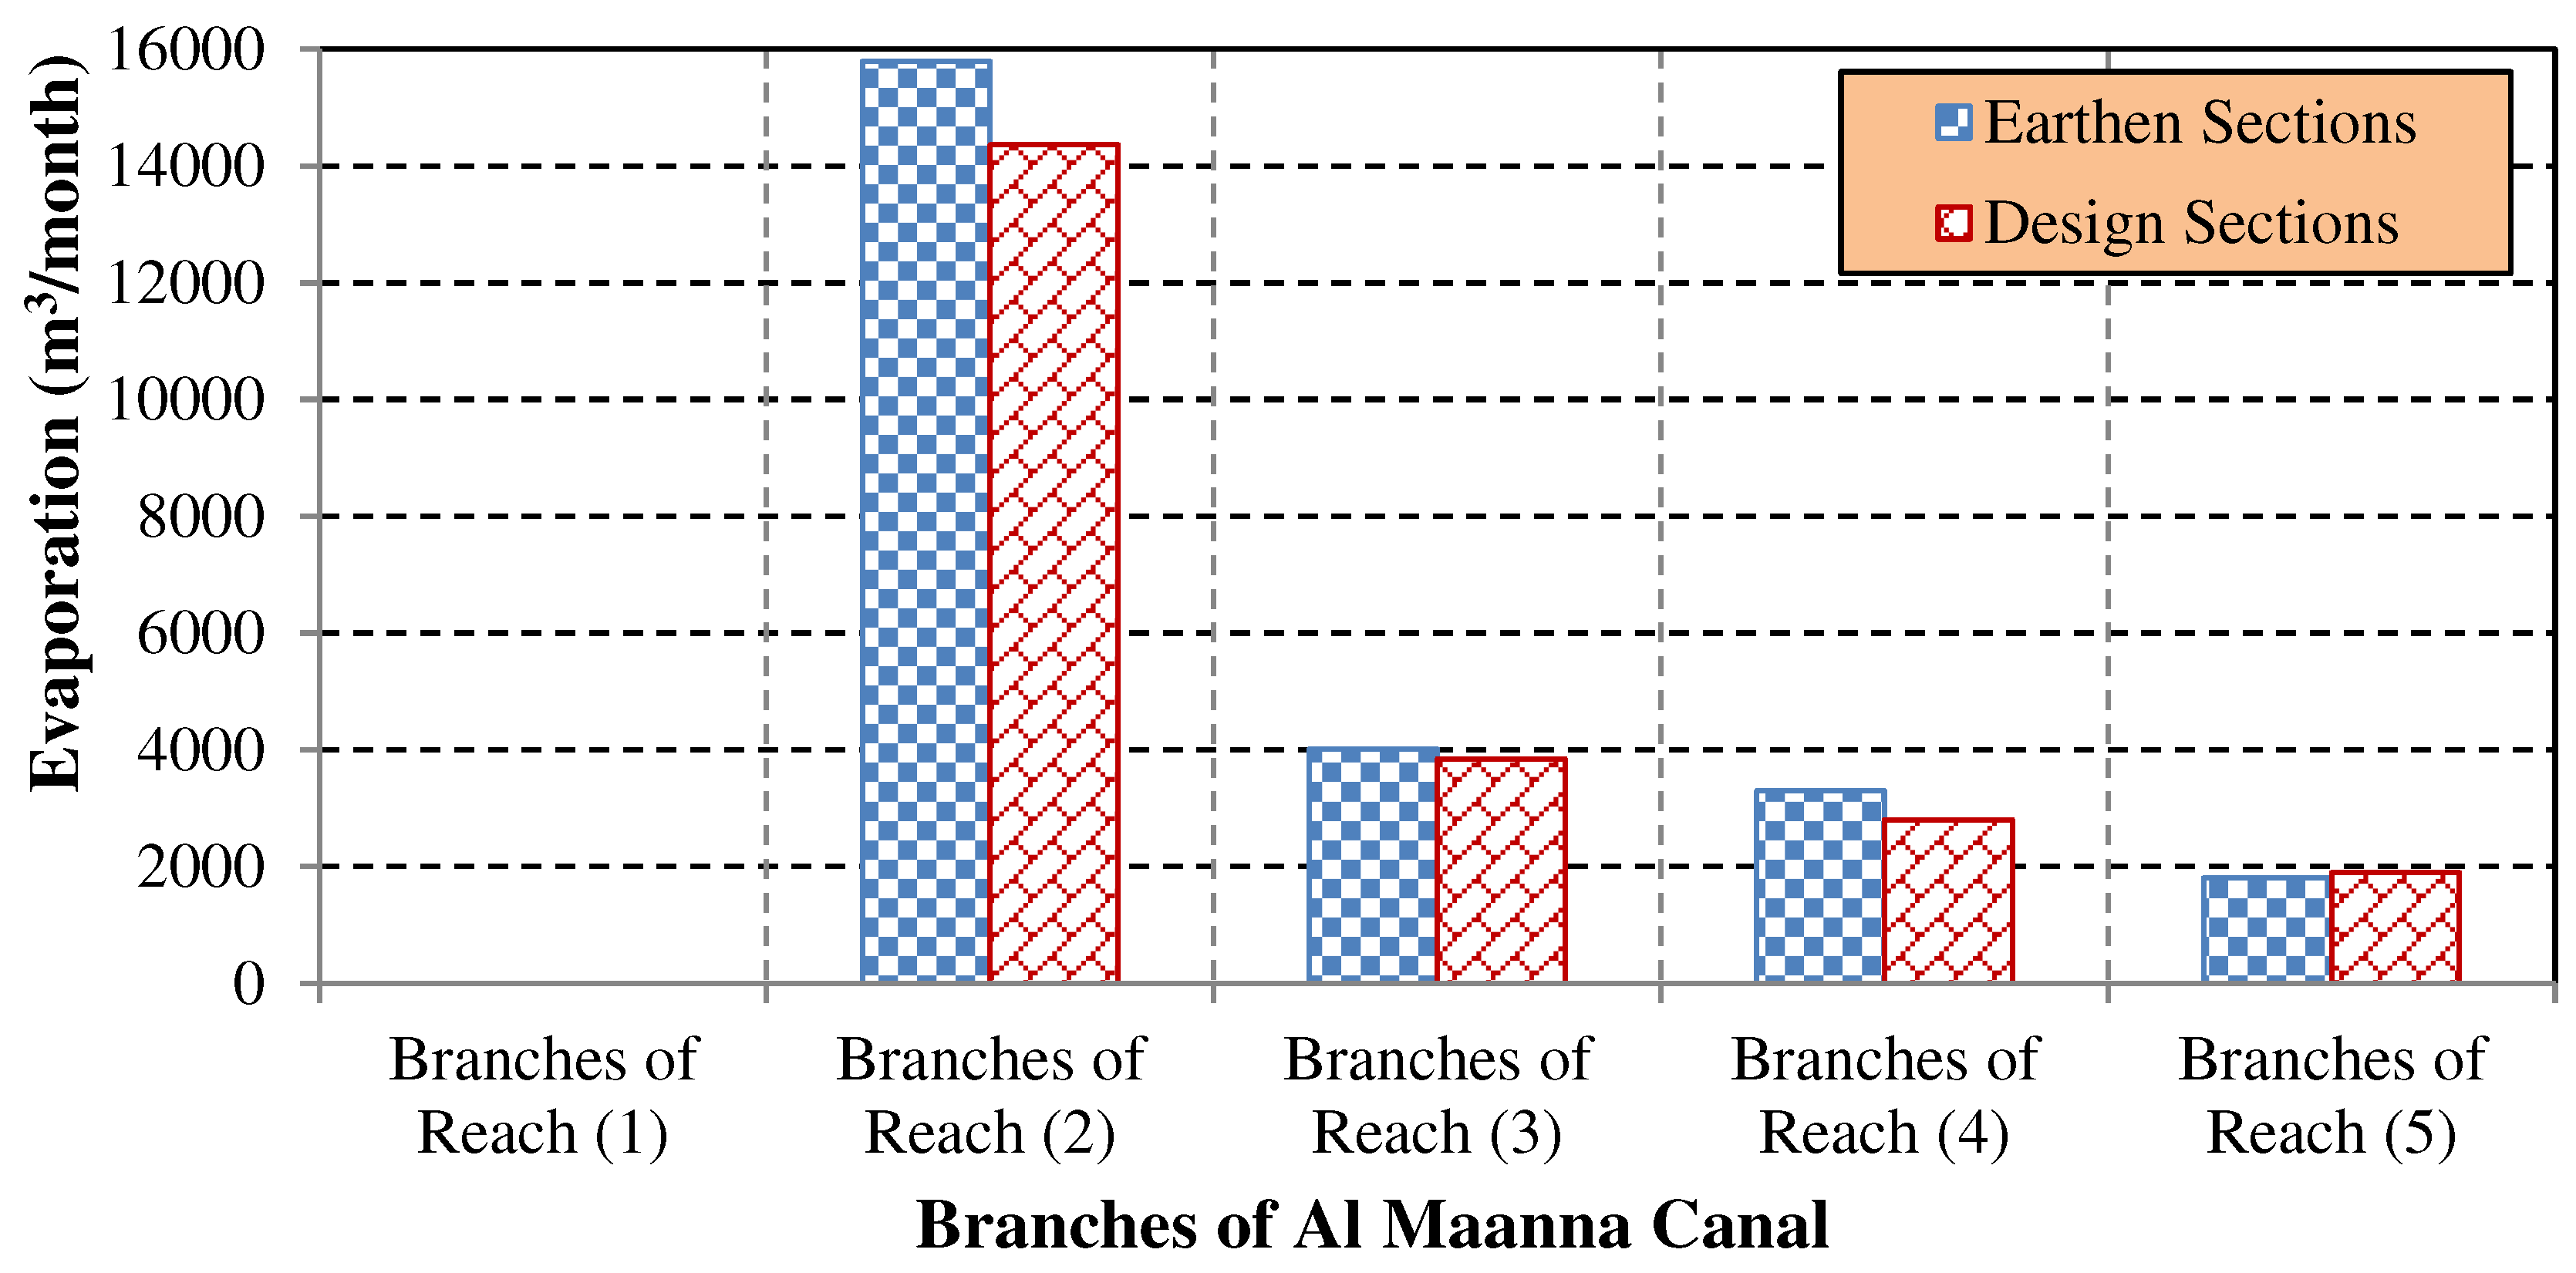
Evaporation losses from Al Maanna canal and its branches obtained from the distorted and rehabilitated sections show a clear difference, as shown in
Figure 10 and
Figure 11. Evaporation losses from the lined (designed) sections are lower than those from the distorted (earthen) sections due to the decreased top width of the exposed water surface in the rehabilitated sections.
Also, it should be noted that branches of the last reach have negative evaporation losses, as shown in
Figure 11, which is considered an indication of decreasing the distorted cross sections compared to the lined sections in these branches. Evaporation losses from the distorted sections of the Al Maanna canal and its branches were estimated to be around 60,789 and 24,899 m
3/month, respectively. While, evaporation losses from the lined sections of Al Maanna canal and its branches were estimated to be about 51,856 and 22,905 m
3/month, respectively. As a result, evaporation losses can be reduced by roughly 10,926 m
3/month due to the rehabilitation of the Al Maanna canal network.
3.5.3. Evapotranspiration Losses
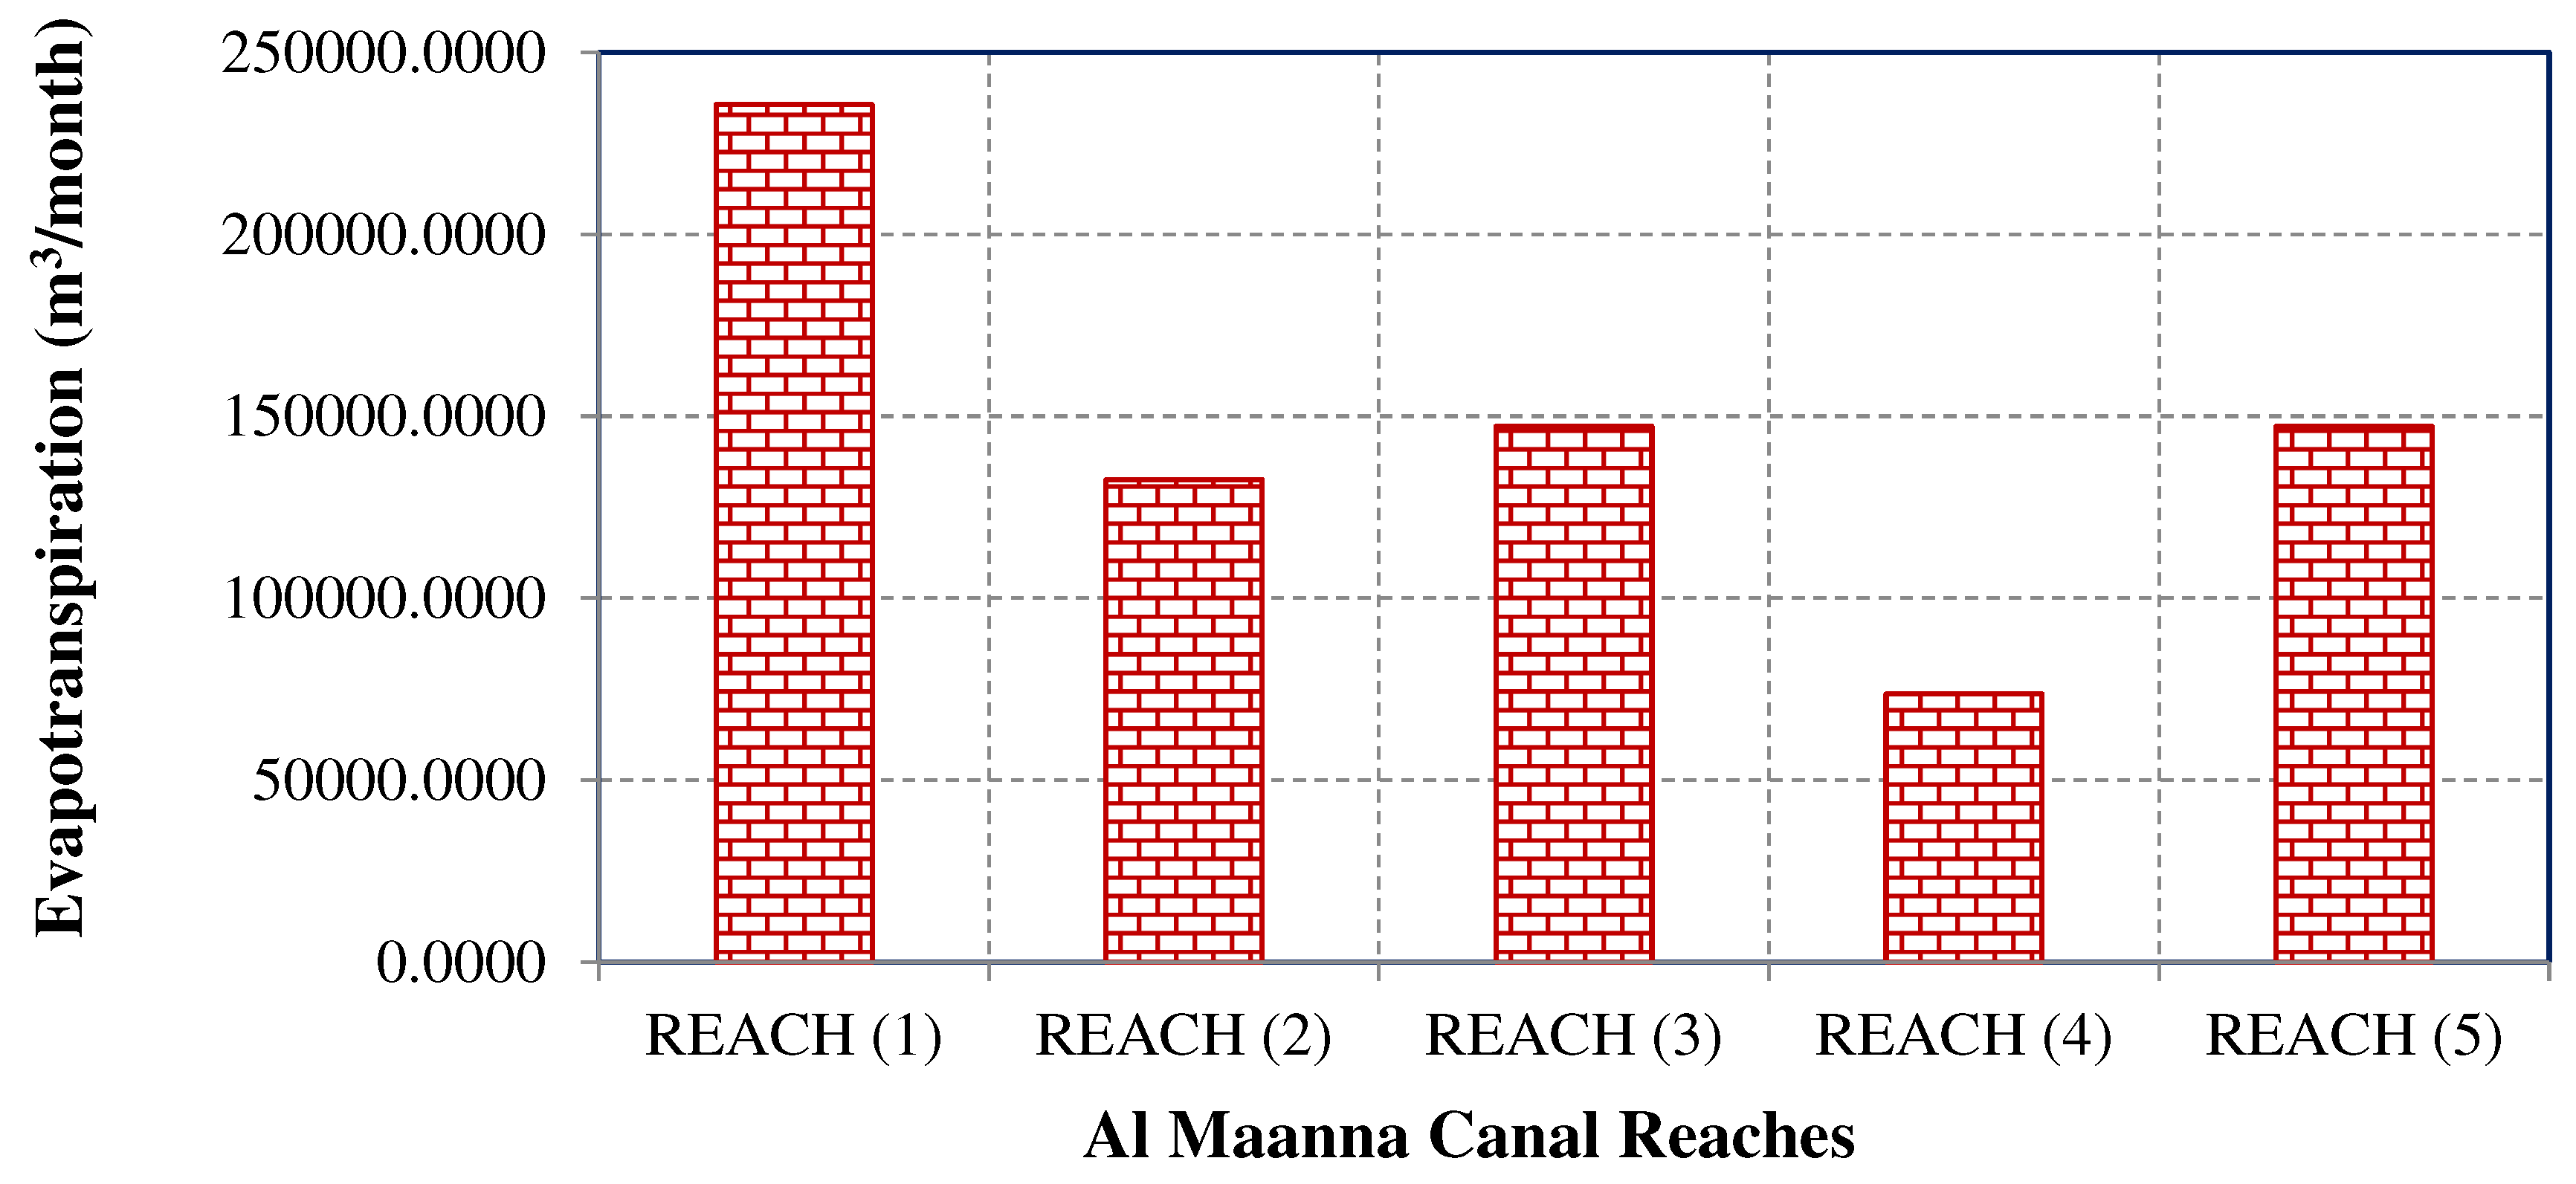
The first reach of the Al Maanna canal had the highest evapotranspiration rate from weeds, about 235,630 m
3/month. While the minimum evapotranspiration rate from weeds occurred in the fourth reach, at about 73,634 m
3/month, as presented in
Figure 12.
These massive evapotranspiration losses caused by weeds along the banks of the Al Maanna canal and its branches will be ignored following the lining and rehabilitation process.
3.6. An Economic Study of the Lining Process in the Study Area
The traditional irrigation networks suffer from two main issues: (i) the growth of weeds along the banks of canals; and (ii) bed backfill. Weed removal occurred every three months, and canal dredging from bed backfill occurred once a year. For canals with a designed bed width of 10 m, weed removal costs approximately 5000 Egyptian pounds per km (LE/km), while bed dredging costs approximately 8 LE/m
3 (MWRI, 2019). The total costs of bed dredging and weed removal from the distorted cross sections of Al Maanna canal and its branches are calculated and presented in the following constructed
Table 6 and
Table 7.
Weed removal occurs every three months, so the total annual cost of weed removal from Al Maanna Canal and its branches is approximately 1,498,773 LE per year.
According to the results of the above tables, the costs of bed dredging from the Al Maanna canal and its branches are approximately 5,304,030 and 533,363 Egyptian pounds, respectively. The costs of weed removal from Al Maanna Canal and its branches are approximately 573,393 and 925,380 Egyptian pounds per year. These costs can be saved after the lining and rehabilitation processes.
4. Conclusions
After studying the seepage, evaporation, and evapotranspiration losses from the distorted and lined sections of the Al Maanna canal and its branches, the following main conclusions can be drawn:
Using the most popular available equations for calculating the expected values of seeped water from the Al Maanna Canal, the obtained results were significantly different. This is due to the different conditions and properties of the soil in which the experiments were conducted, which produced each equation.
The results obtained using the Moleth-Worth formula were the most compatible with the measured seeped quantities of water by the field ponding method. The measured seeped quantities from Al-Manna canal were about 1.563 million m3/month, while the calculated quantities using the Moleth-Worth equation were 1.617 million m3/month. Also, the seepage losses from the Al Manna canal branches were approximately 0.506 and 0.580 million m3/month, respectively, indicating an acceptable approximate difference.
-
The maximum calculated evaporation and evapotranspiration losses calculated from Al Maanna Canal were approximately 0.061 and 0.736 million m3/month, respectively. While the maximum evaporation and evapotranspiration losses from the branches of the Al Maanna canal were calculated to be about 0.0249 and 0.397 million m3/month, respectively.
The expected total seepage, evaporation, and evapotranspiration losses from the Al Maanna canal network might be about 3.42 million m3/month, which accounts for approximately 13.63% of the total discharge of the Al Manna Canal, which is so big.
After the lining process, the field ponding method was employed to estimate seepage losses from the Al Maanna canal and its branches, which were about 0.472 million m3/month. Also, evaporation losses after the rehabilitation process can be reduced to around 0.075 m3 per month, while evapotranspiration losses will be neglected.
The lining of distorted sections of the Al Maanna canal and its branches can reduce water losses by approximately 84%, which is good and sufficient to recommend and encourage the lining processes, where the gained quantities of water are more valuable and important than the cost of implementation.
Saving not less than 5.84 Million L.E./year and 1.50 million L.E./year on the expenses of the regular periodic maintenance and weed removal costs for distorted Al Maanna canal sections and branches.
Author Contributions
Mahmoud S. Abdel Nasser designed, collected the observed data, wrote the first draft, and edited the document. Tarek S. Abu-Zaid collected, processed, guided writing, and reviewed. Mohamed A. Ashour guided the writing and review. All authors have read and agreed to the published version of the manuscript.
Funding
This research received no external funding.
Data Availability Statement
The underlying research use data in this work were obtained officially from the Egyptian Ministry of Irrigation and Water Resources, while other used data was extracted from the results of previous studies in the field's scientific research literature.
Acknowledgments
The authors would like to mention that the second author involved in this paper has passed away before finishing it; the rest of the authors completed the paper and published it as a gift to his soul, praying for mercy and forgiveness for him.
Conflicts of Interest
The authors declare no conflict of interest.
References
- Abu-Zaid, T. S., and Sabery, M., (2021), A New Approach for Water Allocation Scheduling in Irrigation Open Channels (Case Study: Al Maanna Main Canal, and Its Branches), Journal of Engineering Sciences, Assiut University, Faculty of Engineering, Vol. 49, No. 3, May, pp. 354-377. DOI: 10.21608/jesaun.2021.66660.1038.
- Adnan, T. A., Khan, K. S., and Laghari, M., (2015), Relationship between Seepage and Discharge for Kabul River in District Nowshera, Pakistan Journal of Agriculture, Agricultural Engineering and Veterinary Sciences, Vol. 31, No. 2, pp. 249-259. https://pjaaevs.sau.edu.pk/index.php/ojs/article/view/103.
- Allen, G. R., Pereira, L. S., Raes, D., and Smith, M., (1998), Crop Evapotranspiration: Guidelines for Computing Crop Water Requirements, FAO Irrigation and Drainage, Paper No. 56, Rome, Italy. https://www.fao.org/3/x0490e/x0490e00.htm.
- Arab Al Awamer Weather Station (AAWS), (2020), Meteorological Data of Abnoub Cropped Area During the Period from 2014 to 2019 as Documented in the Arab Al Awamer Weather Station, Assiut, Egypt.
- Bakry, M. F., and Awad, A. A., (1997), Practical Estimation of Seepage Losses Along Earthen Canals in Egypt, Water Resources Management, Vol. 11, pp.197-206. https://doi.org/10.1023/A:1007921403857.
- Dolatkhah, S., Kazemiazar, F., Deljou, P., and Nourmand, B., (2015), Simulation of Seepage from Earthen Canals of Moghan Irrigation and Drainage Network Using Seep/w Model, Bulletin of Environment, Pharmacology and Life Sciences, Vol. 4, No. 1, pp. 430-435.
- El-Enany, M. A., El-Alfy, K. S., Sobeih, M. F., Armanious, S. D., and Gergis, E. S., (2004), Modification of the Improved Irrigation System in the Old Lands in Egypt, Mansoura Engineering Journal (M.E.J.), Vol. 29, No. 1, pp. 21-45.
- Eshetu, B. D., and Alamirew, T., (2018), Estimation of Seepage Loss in Irrigation Canals of Tendaho Sugar Estate, Ethiopia, Eshetu and Alamirew, Irrigation Drainage Sys Eng., Vol. 7, No. 3, pp. 2-5.
- Hanks, R. J., (1974), Model for Predicting Plant Yield as Influenced by Water Use, Agronomy Journal, Vol. 66, pp. 660-665.
- Jensen, M. E., Burman, R. D., and Allen, R. G., (1990), Evapotranspiration and Irrigation Water Requirements, Amer. Soc. Civil Eng., Man. and Rep. on Eng. Prac., No. 70, New York.
- Leigh, W. E., (2014), Evaluation of Methods for Predicting Seepage Loss Rates for the Hard Lined Irrigation Canal of the Lower Rio Grande Valley of Texas, M.SC. Thesis, University of Texas, A&M University, USA.
- Mahesh, M. K., Panke, R. A., and Hangargekar, P. A., (2013), Seepage Losses Through Canals & Minors, International Journal of Engineering Research & Technology (IJERT), Vol. 2, No. 11, pp. 1125-1134.
- Ministry of Water Resources and Irrigation (MWRI), (2019), Backfill and Weeds Removal Contract, Report, Egypt.
- Mowafy, H. M., (2001), Seepage Losses in Ismailia Canal, Sixth International Water Technology Conference (IWTC), Alexandria, Egypt, pp. 195-211.
- Paul, K. K., Gylan, L. D., and Nelton, O. S., (1993), Chapter 2: Irrigation Water Requirements, National Engineering Handbook, United States Department of Agriculture, Soil Conservation Service.
- Sabery, M., (2019), Hydraulic Performance Assessment for Improved Irrigation System, M.Sc. Thesis, Assiut University, Egypt.
- Suhua, L., Weizhen, W., Makito, I., and Tetsuo, K., (2016), Estimating the Evaporation from Irrigation Canals in Northwestern China Using the Double-Deck Surface Air Layer Model, Advances Meteorology, Vol. 16, pp. 1-9.
- Vivekanand, I., Chandan, R., and Shashank, S. S., (2021), Determination of Canal Seepage Loss in Arrah Main Canal: A Case Study, Irrig. and drain, Vol. 3, No. 1, pp. 1-9.
Figure 1.
Ponding method for measuring of seepage losses.
Figure 1.
Ponding method for measuring of seepage losses.
Figure 2.
Schematic diagram of Al Maanna canal and its branches.
Figure 2.
Schematic diagram of Al Maanna canal and its branches.
Figure 3.
An example of positive.evaporation rate.
Figure 3.
An example of positive.evaporation rate.
Figure 4.
An example of negative evaporation rate.
Figure 4.
An example of negative evaporation rate.
Figure 6.
Seepage losses from the distorted sections of Al Maanna canal.
Figure 6.
Seepage losses from the distorted sections of Al Maanna canal.
Figure 7.
Seepage losses from the distorted sections of branches of Al Maanna canal.
Figure 7.
Seepage losses from the distorted sections of branches of Al Maanna canal.
Figure 8.
Seepage losses from the rehabilitated sections of Al Maanna canal.
Figure 8.
Seepage losses from the rehabilitated sections of Al Maanna canal.
Figure 9.
Seepage losses from the rehabilitated sections of branches of Al Maanna canal.
Figure 9.
Seepage losses from the rehabilitated sections of branches of Al Maanna canal.
Figure 10.
Evaporation losses from distorted and lined sections of Al Maanna Canal.
Figure 10.
Evaporation losses from distorted and lined sections of Al Maanna Canal.
Figure 11.
Evaporation losses from distorted and lined branches of Al Maanna canal.
Figure 11.
Evaporation losses from distorted and lined branches of Al Maanna canal.
Figure 12.
Evapotranspiration losses from weeds along Al Maanna canal.
Figure 12.
Evapotranspiration losses from weeds along Al Maanna canal.
Table 1.
Examples of previous studies on measuring of seepage losses from earthen canals.
Table 1.
Examples of previous studies on measuring of seepage losses from earthen canals.
| Reference |
The Study |
Country |
Major Findings |
| Mowafy (2001) |
Seepage losses from Al Ismailia canal using empirical and analytical formulas. |
Egypt |
Minimum seepage losses occurred from reach 1 and maximum seepage losses occurred from reach 4 |
| The maximum seepage losses from reach 2 are 0.5753 (m3/sec./km), and maximum seepage losses from reach 3 are 0.645 (m3/sec./km) |
| Bakry, and Awad (1997) |
Seepage losses from two main conveyance canals (Port-Said and Suez canals) |
Egypt |
Developed four equations based on the inflow-outflow method. The relations are applicable for canals having discharges ranging between 2 and 20 (m3/sec.)
Where, S = Seepage losses (m3/sec./km);
Q = Discharge (m3/sec.).
d = Water depth (m); and
P = wetted Perimeter (m) |
| Mahesh et al. (2013) |
Seepage losses from canals and minors in Paithan Left Bank Canal and Lassina Left Bank Canal |
Pakistan |
Average seepage losses from lined and unlined canal were 0.836 and 7.063 (cumec/Mm2), respectively |
| Average seepage losses from lined and unlined minor canals were 3.01 and 4.93 (cumec/Mm2), respectively |
| Adnan et al. (2015) |
Seepage losses from Kabul River in Nowshera District |
Afghanistan |
Developed mathematical relationships between seepage and discharge
Linear solution:
S = 0.00024Q+ 0.298
Logarithmic solution:
S = 0.294 ln (Q) - 1.453
Power solution:
S= 0.018Q0.494
Where, S = Seepage losses (m3/sec./km); and
Q = Discharge (m3/sec.) |
| Eshetu and Alamirew (2018) |
Seepage losses from irrigation canals in Tendaho Sugar Estate |
Ethiopia |
Average seepage losses were 0.55% per 100 m and 0.84% per 100 m from lined and unlined primary canals, respectively |
Table 2.
Experimental formulas for estimating seepage losses.
Table 2.
Experimental formulas for estimating seepage losses.
| Formula Name |
Seepage (S) |
Factors |
Units |
| Mortis 1 |
S = |
Clay: C = 0.34.
Sand: C = 2.2 |
American |
| Moleth - Worth and Yennidunia 1 |
S = |
Clay: C = 0.0015.
Sand: C = 0.003 |
SI |
| Indian 1 |
S = |
C = (1.1: 1.8).
a = Area of wetted perimeter (million ft2) |
American |
| Pakistanian 1 |
|
----- |
American |
| Davis-Wilson 2 |
|
C = (1: 70) depends on bed material |
SI |
| Inghum 3 |
S = |
C = (1.5: 5.5) |
SI |
| Offengenden 4 |
α
|
(α-β) = (0.7-0.3), (1.9-0.4) and (3.4-0.5) for low, medium, and high permeable soil, respectively |
SI |
| Nazeer Ahmed 5 |
|
----- |
SI |
Table 3.
Characteristics of Al Maanna Canal and its branches (Abu-Zaid and Sabery, 2021).
Table 3.
Characteristics of Al Maanna Canal and its branches (Abu-Zaid and Sabery, 2021).
| Reaches of Al Maanna Canal |
Branches of Al Maanna Canal |
| No. |
Beginning |
End |
Length |
Area Served |
Designed Discharge * |
Location of Off-taking Branches |
Branches |
Length |
Area Served |
MeasuredDischarge * |
| Direct irrigation from Al Maanna Canal |
Branches of Al Maanna Canal |
|
Secondary Branches |
| Km |
Km |
Km |
Feddan |
Feddan |
m3/sec. |
Km |
|
Km |
Feddan |
m3/sec. |
| 1 |
0.0000 |
10.450 |
10.450 |
zero |
zero |
19.34 |
|
|
|
|
|
| 2 |
10.450 |
16.450 |
6.0000 |
1140 |
4850 |
21.79 |
10.500 |
Al Maanna Side |
5.827 |
1000 |
2.05 |
| 10.500 |
Al Hammam |
9.000 |
3400 |
4.39 |
| 1.0000 |
|
Arab Moter |
2.000 |
600 |
1.45 |
| 3.0000 |
|
Arab Al Atawla |
2.400 |
500 |
1.65 |
| 6.3000 |
|
Zafaran |
2.300 |
400 |
1.34 |
| 6.9400 |
|
Al Taweel |
2.400 |
500 |
2.92 |
| 12.500 |
Shew |
2.300 |
450 |
1.26 |
| 3 |
16.450 |
23.060 |
6.6100 |
868 |
2680 |
14.65 |
16.500 |
East Al Awamer |
0.670 |
400 |
0.04 |
| 16.500 |
West Al Awamer |
0.800 |
200 |
1.38 |
| 17.800 |
North Al Awamer |
1.400 |
780 |
1.93 |
| 19.800 |
Deir Shew |
1.000 |
400 |
0.50 |
| 21.800 |
East Al Kadadeeh |
1.000 |
400 |
0.74 |
| 22.800 |
Al Hager |
4.200 |
500 |
0.95 |
| 4 |
23.060 |
26.400 |
3.3400 |
zero |
1700 |
8.23 |
23.800 |
South Al Gabrawe |
2.200 |
500 |
2.01 |
| 23.800 |
Bani Ibraheem |
1.400 |
800 |
1.74 |
| 0.250 |
|
Bani Ibraheem |
1.350 |
400 |
1.45 |
| 25.650 |
North Al Gabrawe |
1.350 |
400 |
0.81 |
| 5 |
26.400 |
32.800 |
6.4000 |
562 |
1700 |
7.55 |
26.450 |
Aswalem |
1.800 |
700 |
1.93 |
| 27.600 |
Alam Aldeen |
1.600 |
500 |
0.90 |
| 28.350 |
Al Haraga |
2.100 |
500 |
1.15 |
| Total |
32.800 |
2570 |
10930 |
|
|
|
47.097 |
10930 |
|
| 13500 |
Table 4.
Meteorological data of the study area (AAWS, 2020).
Table 4.
Meteorological data of the study area (AAWS, 2020).
| Month |
Temperature (T) |
RH |
Ep |
Wind Speed |
SH/Day |
| Max. |
Min. |
Avg. |
| °C |
% |
mm/day |
km/hour |
No. |
| January |
18 |
6.50 |
22.40 |
60.30 |
2.80 |
16.00 |
08.90 |
| February |
22.5 |
11.20 |
26.10 |
52.60 |
3.20 |
17.30 |
9.70 |
| March |
25 |
14.20 |
30.50 |
42.90 |
4.40 |
19.80 |
9.90 |
| April |
29 |
17.10 |
35.10 |
36.50 |
6.40 |
21.30 |
10.30 |
| May |
32 |
22.00 |
38.10 |
35.10 |
6.60 |
20.30 |
11.40 |
| June |
36 |
24.90 |
40.70 |
37.40 |
6.90 |
21.00 |
12.30 |
| July |
37 |
25.30 |
39.10 |
41.50 |
7.40 |
19.50 |
12.20 |
| August |
34.5 |
24.80 |
40.30 |
40.70 |
8.00 |
19.80 |
11.90 |
| September |
29 |
23.80 |
38.50 |
46.20 |
7.00 |
21.70 |
10.80 |
| October |
29 |
20.90 |
33.00 |
51.30 |
5.70 |
19.20 |
10.00 |
| November |
27 |
13.20 |
27.00 |
54.70 |
5.00 |
15.20 |
09.40 |
| December |
22.5 |
9.00 |
23.20 |
63.20 |
3.10 |
16.80 |
09.00 |
Table 5.
Measured areas of weeds along Al Maanna canal and its branches.
Table 5.
Measured areas of weeds along Al Maanna canal and its branches.
| Reaches of Al Maanna Canal |
Branches of Al Maanna Canal |
| Reach No. |
Area of Weeds
(Feddan) |
Branches |
Area of Weeds
(Feddan) |
| |
Secondary Branches |
| |
|---|
| Reach 1 |
37.17 |
|
|
| Reach 2 |
20.91 |
Al Maanna Side |
6.91 |
| Al Hammam |
10.21 |
| |
Arab Moter |
3.80 |
| |
Arab Al Atawla |
4.90 |
| |
Zafaran |
6.66 |
| |
Al Taweel |
2.48 |
| Shew |
3.22 |
| Reach 3 |
24.39 |
East Al Awamer |
0.66 |
| West Al Awamer |
0.92 |
| North Al Awamer |
1.09 |
| Deir Shew |
1.26 |
| East Al Kadadeeh |
1.31 |
| Al Hager |
4.70 |
| Reach 4 |
11.62 |
South Al Gabrawe |
1.77 |
| Bani Ibraheem |
0.65 |
| |
Bani Ibraheem |
2.12 |
| North Al Gabrawe |
2.03 |
| Reach 5 |
22.07 |
Aswalem |
1.82 |
| Alam Aldeen |
2.09 |
| Al Haraga |
4.01 |
| Total |
116.16 |
|
62.61 |
| 178.77 Feddan |
Table 6.
Costs of bed dredging and weeds' removal from Al Maanna canal cross sections.
Table 6.
Costs of bed dredging and weeds' removal from Al Maanna canal cross sections.
| Reach |
Costs of Bed Dredging |
Costs of Weeds' Removal |
| Reach No. |
Reach Length |
Fill Area |
Costs / m3
|
Total Costs |
Designed Bed Width |
Covered Length of Weeds |
Costs / Km |
Total Costs |
| m |
m2
|
L.E. * |
L.E. |
m |
Km |
L.E. * |
L.E. |
| {1} |
{2} |
{3} |
{4} = {1}*{2}*{3} |
{5} |
{6} |
{7} |
{8} = {6}*{7} |
| Reach 1 |
10450 |
39.030 |
8.00 |
3262908 |
10.00 |
7.80595 |
5000 |
39029.75 |
| Reach 2 |
6000 |
15.380 |
738240 |
7.50 |
4.87872 |
24393.60 |
| Reach 3 |
6610 |
15.590 |
824399.2 |
6.00 |
5.73967 |
28698.35 |
| Reach 4 |
3340 |
7.560 |
202003.2 |
4.00 |
4.06560 |
20328.00 |
| Reach 5 |
6400 |
5.400 |
276480 |
3.00 |
6.17971 |
30898.55 |
| Total |
|
82.960 |
|
5,304,030 |
|
28.66965 |
|
143,348.30 |
Table 7.
Costs of bed dredging and weeds' removal from branches of Al Maanna canal.
Table 7.
Costs of bed dredging and weeds' removal from branches of Al Maanna canal.
| Al Maanna Canal Branches |
Length of Branch |
Costs of Bed Dredging |
Costs of Weeds' Removal |
| Fill Area |
Costs / m3
|
Total Costs |
Covered Length of Weeds |
Costs / Km |
Total Costs |
| Branches |
m |
m2
|
L.E. * |
L.E. |
Km |
L.E. * |
L.E. |
| |
Secondary Branches |
{1} |
{2} |
{3} |
{4} = {1}*{2}*{3} |
{5} |
{6} |
{7} = {5}*{6} |
| Al Maanna Side |
5827 |
0.852775 |
8.00 |
39752.96 |
5.277 |
5000 |
26385 |
| Al Hammam |
9000 |
1.834167 |
132060 |
9 |
45000 |
| |
Arab Moter |
2000 |
1.783 |
28528 |
1.9 |
9500 |
| |
Arab Al Atawla |
2400 |
0.8625 |
16560 |
2.400 |
12000 |
| |
Zafaran |
2300 |
1.493478 |
27480 |
2.295 |
11475 |
| |
Al Taweel |
2400 |
1.455 |
27936 |
2.400 |
12000 |
| Shew |
2300 |
1.453043 |
26735.99 |
2.299 |
11495 |
| East Al Awamer |
670 |
1.022687 |
5481.602 |
0.660 |
3300 |
| West Al Awamer |
800 |
1.5275 |
9776 |
0.800 |
4000 |
| North Al Awamer |
1400 |
2.315714 |
25936 |
1.400 |
7000 |
| Deir Shew |
1000 |
1.1244 |
8995.2 |
0.998 |
4990 |
| East Al Kadadeeh |
1000 |
1.392 |
11136 |
1.000 |
5000 |
| Al Hager |
4200 |
1.192143 |
40056 |
4.187 |
20935 |
| South Al Gabrawe |
2200 |
1.319318 |
23220 |
2.197 |
10985 |
| Bani Ibraheem |
1400 |
1 |
11200 |
1.400 |
7000 |
| |
Bani Ibraheem |
1350 |
1.044074 |
11276 |
1.350 |
6750 |
| North Al Gabrawe |
1350 |
1.549259 |
16732 |
1.343 |
6715 |
| Aswalem |
1800 |
1.995556 |
28736.01 |
1.800 |
9000 |
| Alam Aldeen |
1600 |
1.860375 |
23812.8 |
1.463 |
7315 |
| Al Haraga |
2100 |
1.068571 |
17951.99 |
2.100 |
10500 |
| Total |
|
28.14556 |
|
533,362.6 |
46.269 |
|
231,345 |
|
Disclaimer/Publisher’s Note: The statements, opinions and data contained in all publications are solely those of the individual author(s) and contributor(s) and not of MDPI and/or the editor(s). MDPI and/or the editor(s) disclaim responsibility for any injury to people or property resulting from any ideas, methods, instructions or products referred to in the content. |
© 2023 by the authors. Licensee MDPI, Basel, Switzerland. This article is an open access article distributed under the terms and conditions of the Creative Commons Attribution (CC BY) license (https://creativecommons.org/licenses/by/4.0/).


