1. Introduction
Forests have the potential to positively impact climate change by reducing atmospheric carbon dioxide (CO
2) and sequestering C over the short- or mid-term [
1]. They act as carbon sinks in terrestrial biomes, comprising about 80% of the global above-ground biomass (AGB) [
2,
3]. However, due to increasing demands for forest resources, the forest ecosystem is changing rapidly [
4,
5,
6]. Therefore, the tree AGB plays a crucial role in estimating and monitoring forest carbon stocks [
7]. Additionally, tree AGB estimations allow us to understand the interaction between forest growth and biomass productivity [
8]. Research has shown that tree AGB yield is affected by factors such as stand age, tree species, and site fertility (e.g., the abundance of nitrogen in the soil) [
9], with stand age being considered the most important factor [
10,
11,
12,
13].
Stand age affects the ability of the stand to sequester carbon by affecting the net primary productivity (NPP). Therefore, the chronosequence method, which represents a type of ‘natural experiment’, is often used to estimate the temporal dynamics of various stand development aspects and to understand the effect of stand age on successional changes [
14]. However, while chronosequence studies of birch stands have been limited in Finland [
15,
16], such studies on birch AGB and belowground biomass (including fine root biomass) have been widely investigated in Southern Estonia [
17].
In terms of quantity, foliage (leaves) biomass is not the most important biomass pool in a forest ecosystem. Nevertheless, due to its short lifespan, it has great potential to contribute to carbon dynamics in addition to photosynthesis and respiratory functions. On the other hand, the woody parts of the tree, such as stems, branches, and bark, store carbon for a longer period, as they remain active throughout the tree’s life, thus contributing to forests’ long-term carbon storage [
18]. The relationship between stand age and leaf biomass is complicated and the stand structure, such as stand age, stand density, canopy depth, and tree size influence light level and light intensity, and therefore leaf biomass. Starr et al. (2005) [
19] reported a weak negative correlation between stand age (35 to over 200 years) and leaf biomass production in Scot’s pine (
Pinus sylvestris L.) stands in Finland. However, several studies have shown that foliage biomass increases with the increment of stand age [
20,
21,
22,
23].
Forests allocate a significant portion of their net primary productivity (20–65%) belowground for root and mycorrhizal growth and maintenance [
24], emphasizing the need for a comprehensive understanding of biomass allocation, particularly belowground, to comprehend and forecast the forests’ response to elevated CO
2 [
25]. Fine and coarse root fractions are distinguished based on their diameter and exhibit different morphological and functional characteristics, decomposition dynamics, and resource availability responses [
26,
27]. While fine roots (<2 mm) play a crucial role in resource acquisition and contribute to soil carbon and nitrogen input through rapid turnover, coarse roots (>2 mm) are perennial, support fine root networks, transport water and nutrients, store carbohydrates, and provide physical support for aboveground biomass [
24], accounting for up to 80% of belowground biomass [
28] and 10–20% of NPP [
29,
30]. Coarse roots contribute to long-lived wood biomass formation [
31], which persists for decades following senescence [
32,
33,
34,
35] and is vital for ecosystem carbon storage over the long term [
25].
IPCC (2006) [
36] classified the compartments of tree AGB as stem, stump, branch, bark, seed, and foliage. Tree-level AGB is generally estimated by either destructive sampling or by allometric models that use tree dimensions as explanatory variables (regression equations) [
37]. Destructive sampling is time-consuming, arduous, costly, and highly disruptive to the ecosystem [
38]. On the other hand, allometric models are non-destructive and have been considered the most reliable method to estimate tree biomass [
39,
40,
41]. In general, an allometric model estimates traits that are difficult to measure (e.g., AGB) using other traits that are easy to measure (e.g., diameter at breast height (DBH at 1.3 m), tree height) [
42,
43,
44,
45]. However, as there have been limited chronosequence studies of birch stands in Finland, especially concerning foliage biomass, we measured leaf biomass in our study area. To measure leaf biomass, which is an important indicator of tree growth, we used a destructive sampling method. This involved collecting samples of the trees and analyzing them in a laboratory to determine the amount of leaf biomass present. By using this method, we were able to obtain more accurate information about the growth patterns of birch stands in our study area.
Birches are an abundant deciduous tree genus in Northern Europe, the Baltic Sea region, and Northwestern Russia [
46]. Downy birch (
Betula pubescens Ehrh.) and silver birch (
Betula pendula Roth.) make up a significant proportion of the total volume of growing stocks in the region, with 16% in Finland, 11–16% in other Nordic countries, and 17–28% in the Baltic countries [
47,
48]. Downy birch is a primary succession tree on drained peatland sites in Finland and plays a significant role in the pulp and paper industry, as well as contributing to forest biodiversity. Despite being an important tree species in boreal forest ecosystems, the succession and biomass allocation of downy birch is not well understood [
49,
50].
Our study aimed to investigate the effects of stand age on above- and belowground biomass allocation in downy birch in three drained peatland sites in Central Finland. We used allometric equations [
51] and empirical foliage and coarse root measurements to estimate the biomass allocation to stem wood including coarse roots, bark, leaves, and living branches in young, middle-aged, and mature stands. The specific aims of this study were to
- i)
estimate biomass allocation in the above-ground parts, where we tested the hypotheses that 1) downy birch AGB allocation depends on the stand age, and 2) foliage biomass production would peak at the middle-age stands compared to the young and mature stand, due to the well-established canopy cover, increased nutrient uptake and allocation, and reduced competition.
- ii)
estimate biomass allocation in the belowground parts, where we tested the hypotheses that 3) coarse root biomass (CRB) would show a consistent pattern with soil depth across all sites, indicating a general trend of root biomass decreasing with increasing soil depth, and 4) coarse root production would be higher in the middle-age stands than the young and mature stand.
4. Discussion
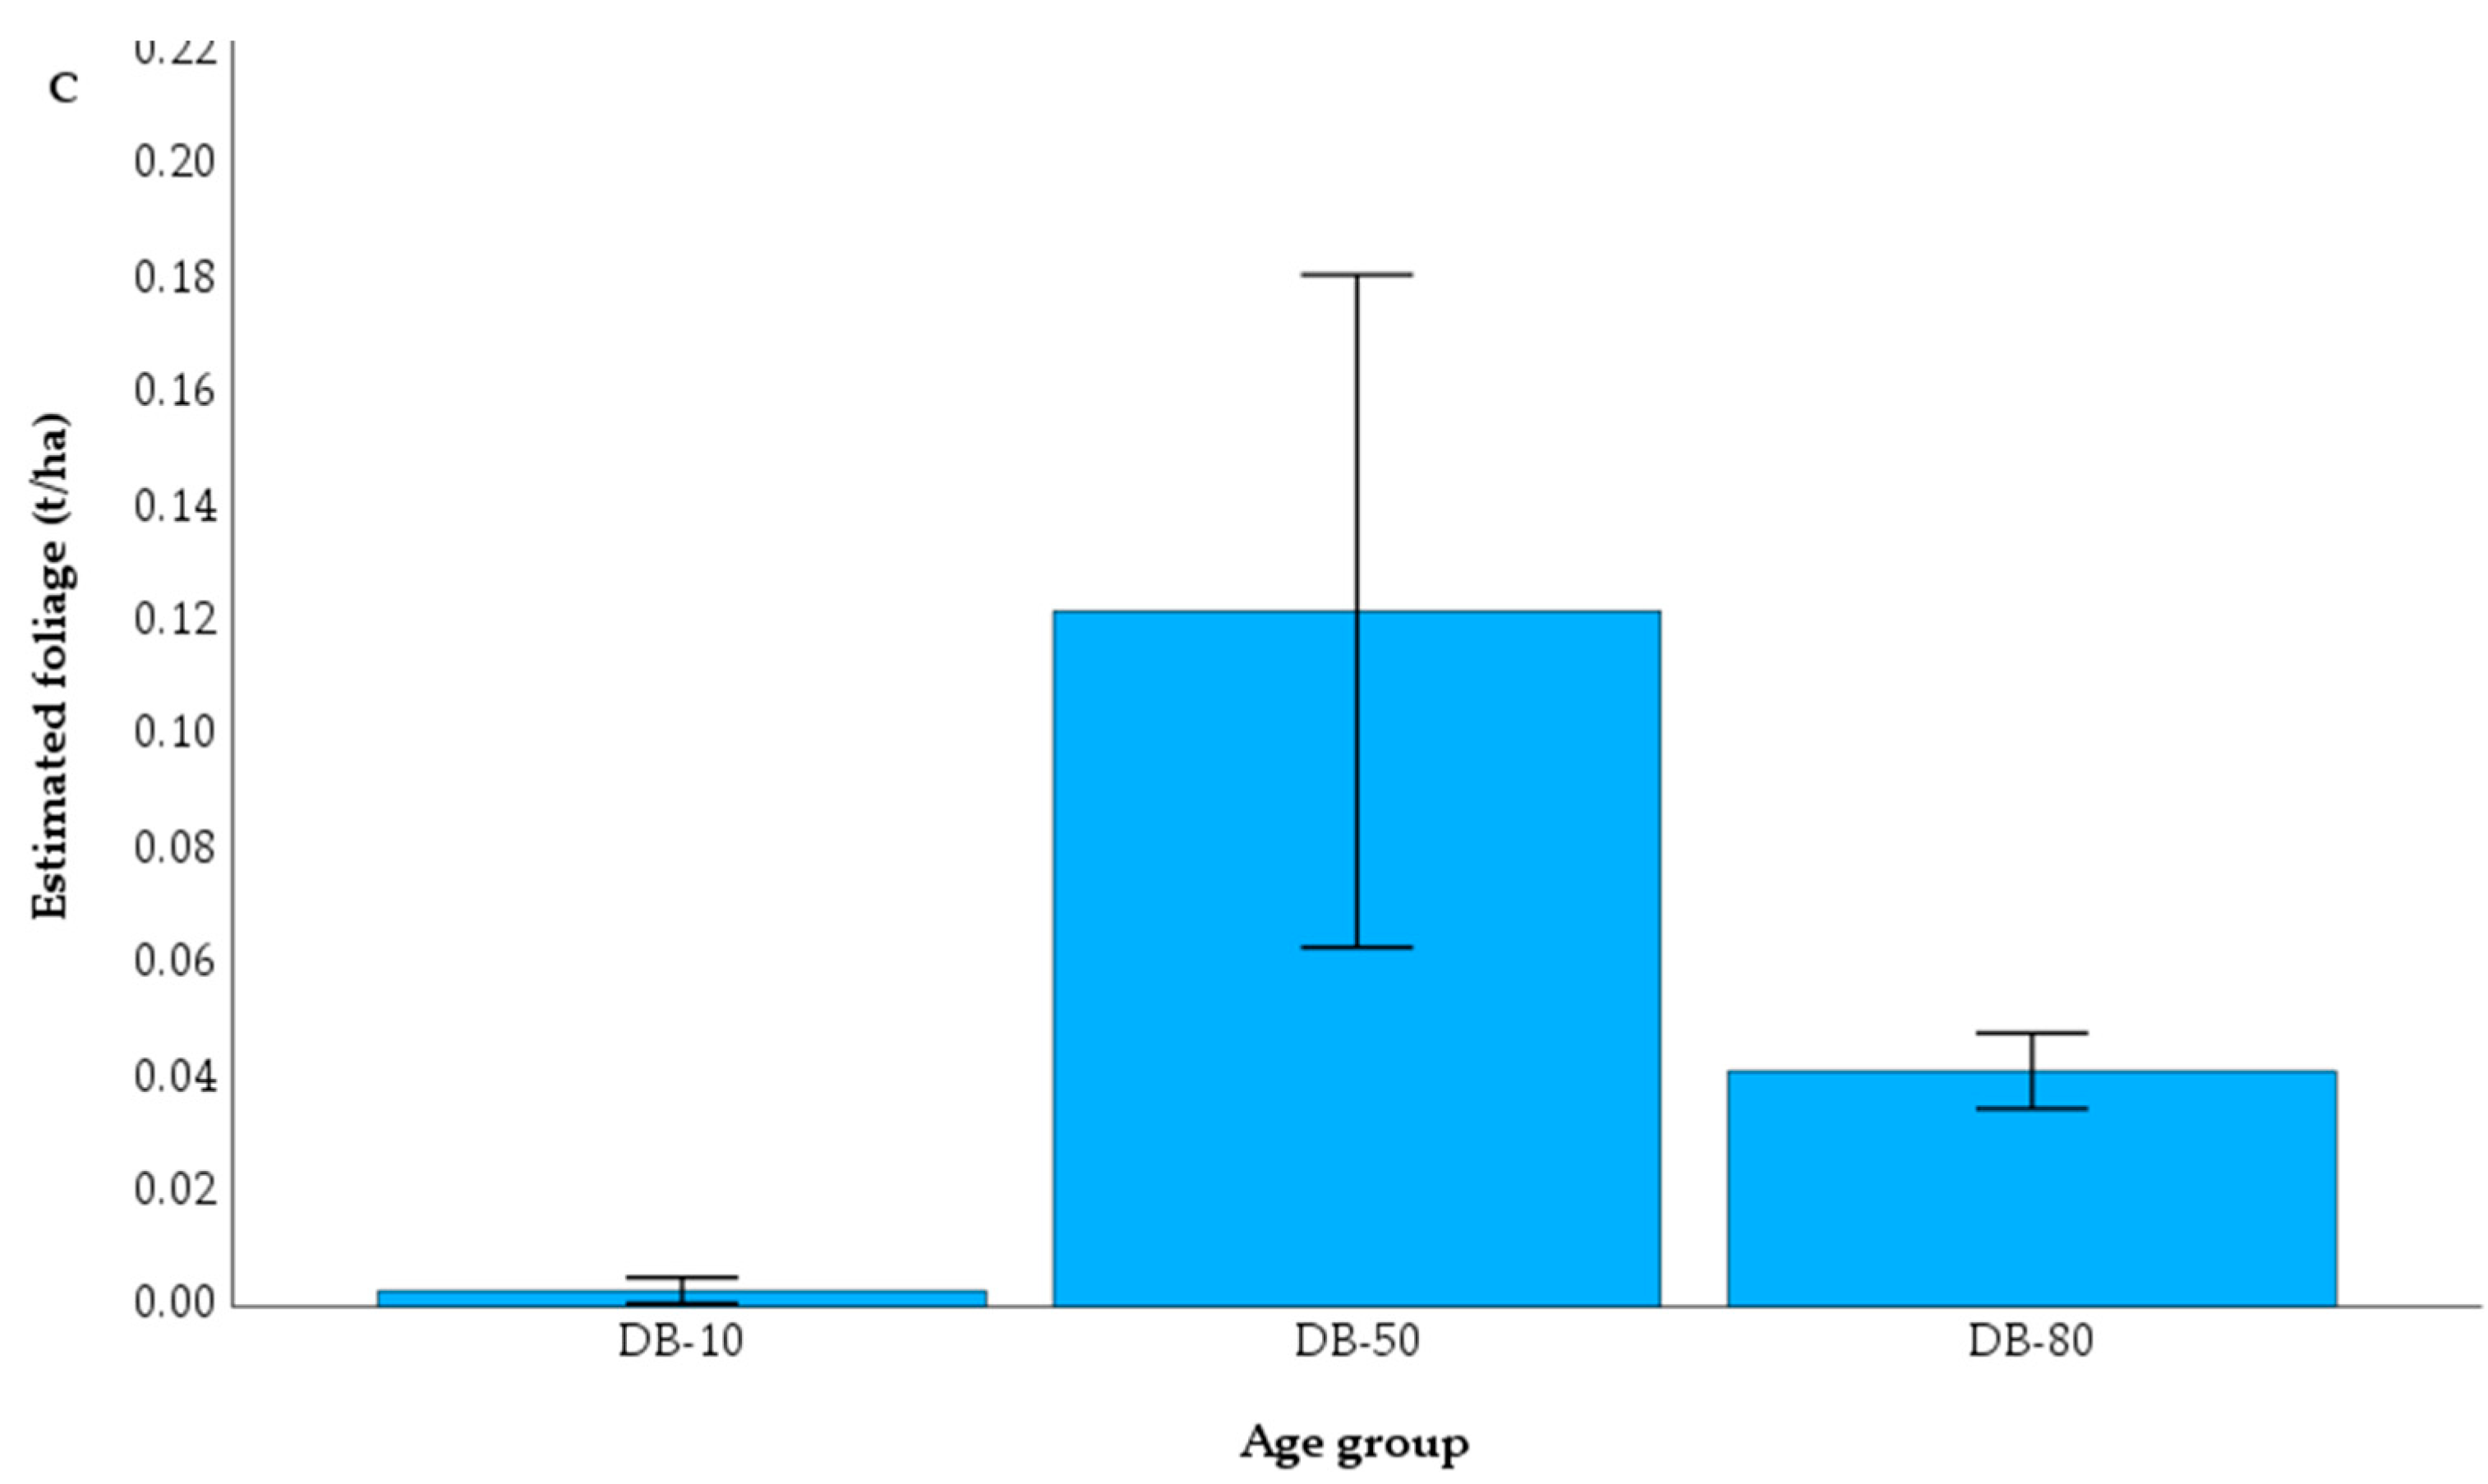
The novelty of the current study is revealing the successional development of downy birch biomass allocation, especially foliage biomass, in peatland forests. We observed that the foliage biomass in the middle-aged stand was significantly higher than in the young and mature stands. This contrasts with Repola (2008) [
51], whose model underestimated and overestimated the magnitude of foliage biomass (leaves) for each age class in the present study.
Our young seedling stand AGB allocation estimates are of the same magnitude as in Hytönen et al. (2018) [
66], where downy birch coppice stand AGB was measured in peat cutaway areas in northern Finland (Age class: A: 10–12 years, B: 15–16 years, C: 22–24 years). The comparability of results can be explained by the similarity of the study sites, which both were peatlands. Similarly, our AGB estimates for the middle-age stand (DB-50) were consistent (175.4 ± SE 0.3 t ha
-1) with the study of Uri et al. (2012) [
17] for downy birch in Estonia (AGB: 118.6 t ha
-1). In their study, the middle-aged stand was 30 years (stands age range: 12–78 years old) compared to the mean age of 50 years in this study. The climate in their study area belongs to the hemiboreal vegetation zone [
17] compared to our central boreal forest zone. However, the soil type in the Uri et al. (2012 [
17] study was the same as in our study (peatland). Thus, it may imply that the soil type, tree species, and stand age fundamentally control AGB yield despite the dissimilar climate [
9].
Our study revealed that the biomass equation by Repola (2008) [
51] provided inaccurate estimates of foliage biomasses. This deviation may be due to inter-tree competition within stands, such as stand structure, stand density, self-thinning process, and tree relative growth rate, which can affect the downy birch branch number and biomasses. For example, Mäkelä and Vanninen, (1998) [
67] reported that the AGB of Scots pine in Southern Finland varied due to different competition status of the trees (competition for light reduces the density of foliage in the crown). On the other hand, the litter fall in a forest ecosystem provides important insights into the dynamics of nutrient cycling and serves as a primary link between producers and decomposers [
68]. However, estimating the amount of branch and foliage biomass at the level of individual trees within a stand can be difficult because trees exhibit a high degree of variability in their size, shape, and foliage density [
69]. This variability can make it challenging to accurately estimate the amount of biomass present in branches and leaves, as different trees within the same stand may have vastly different amounts of these materials. Therefore, accurately measuring stand-level branch and foliage biomass requires careful consideration of this variability, as well as the use of appropriate sampling and measurement techniques to ensure accurate and representative estimates [
70,
71]. Additionally, estimating foliage biomass in matured stands can be difficult because the applicability of biomass equations is often limited to smaller trees, as the variance and potential error increase with stand age [
58]. This result could have important implications for forestry management and conservation efforts, as it suggests that the age of a forest stand can play a significant role in determining its productivity and ecological function. Further research may be needed to explore the specific mechanisms underlying this relationship and to identify strategies for optimizing dry foliage biomass production in different stand ages.
The larger tree DBHs and heights in the mature stand compared to the other age classes are reflected in stand-level AGB estimates. Thus, the higher total AGB of the mature stand is perhaps connected with the larger tree DBHs and height compared to the other stands' tree sizes (diameters and heights) [
21]. On the other hand, dry foliage was of the same magnitude in young and mature stands, but not in the middle-aged stand. This can be explained by the higher stand density of the middle-aged stand, as stand density affects the production of AGB (
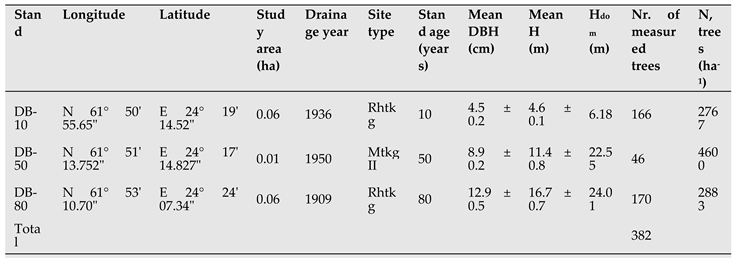
Table 1) [
17]. The stem numbers of all the stands show that the stand density is high in our non-managed middle-aged and mature stands because of the self-thinning and closed canopy of the trees, thus in pristine downy birch stands, the foliage biomass seems to develop early during succession (
Table 1). On the other hand, the chronosequence approach, which examines the development dynamics of tree stands over time, is frequently used in modeling forest succession. However, this approach also highlights the high between-site variability in biotic and abiotic conditions, as well as the influence of stand management and silvicultural practices on stand density, biomass, and yield.
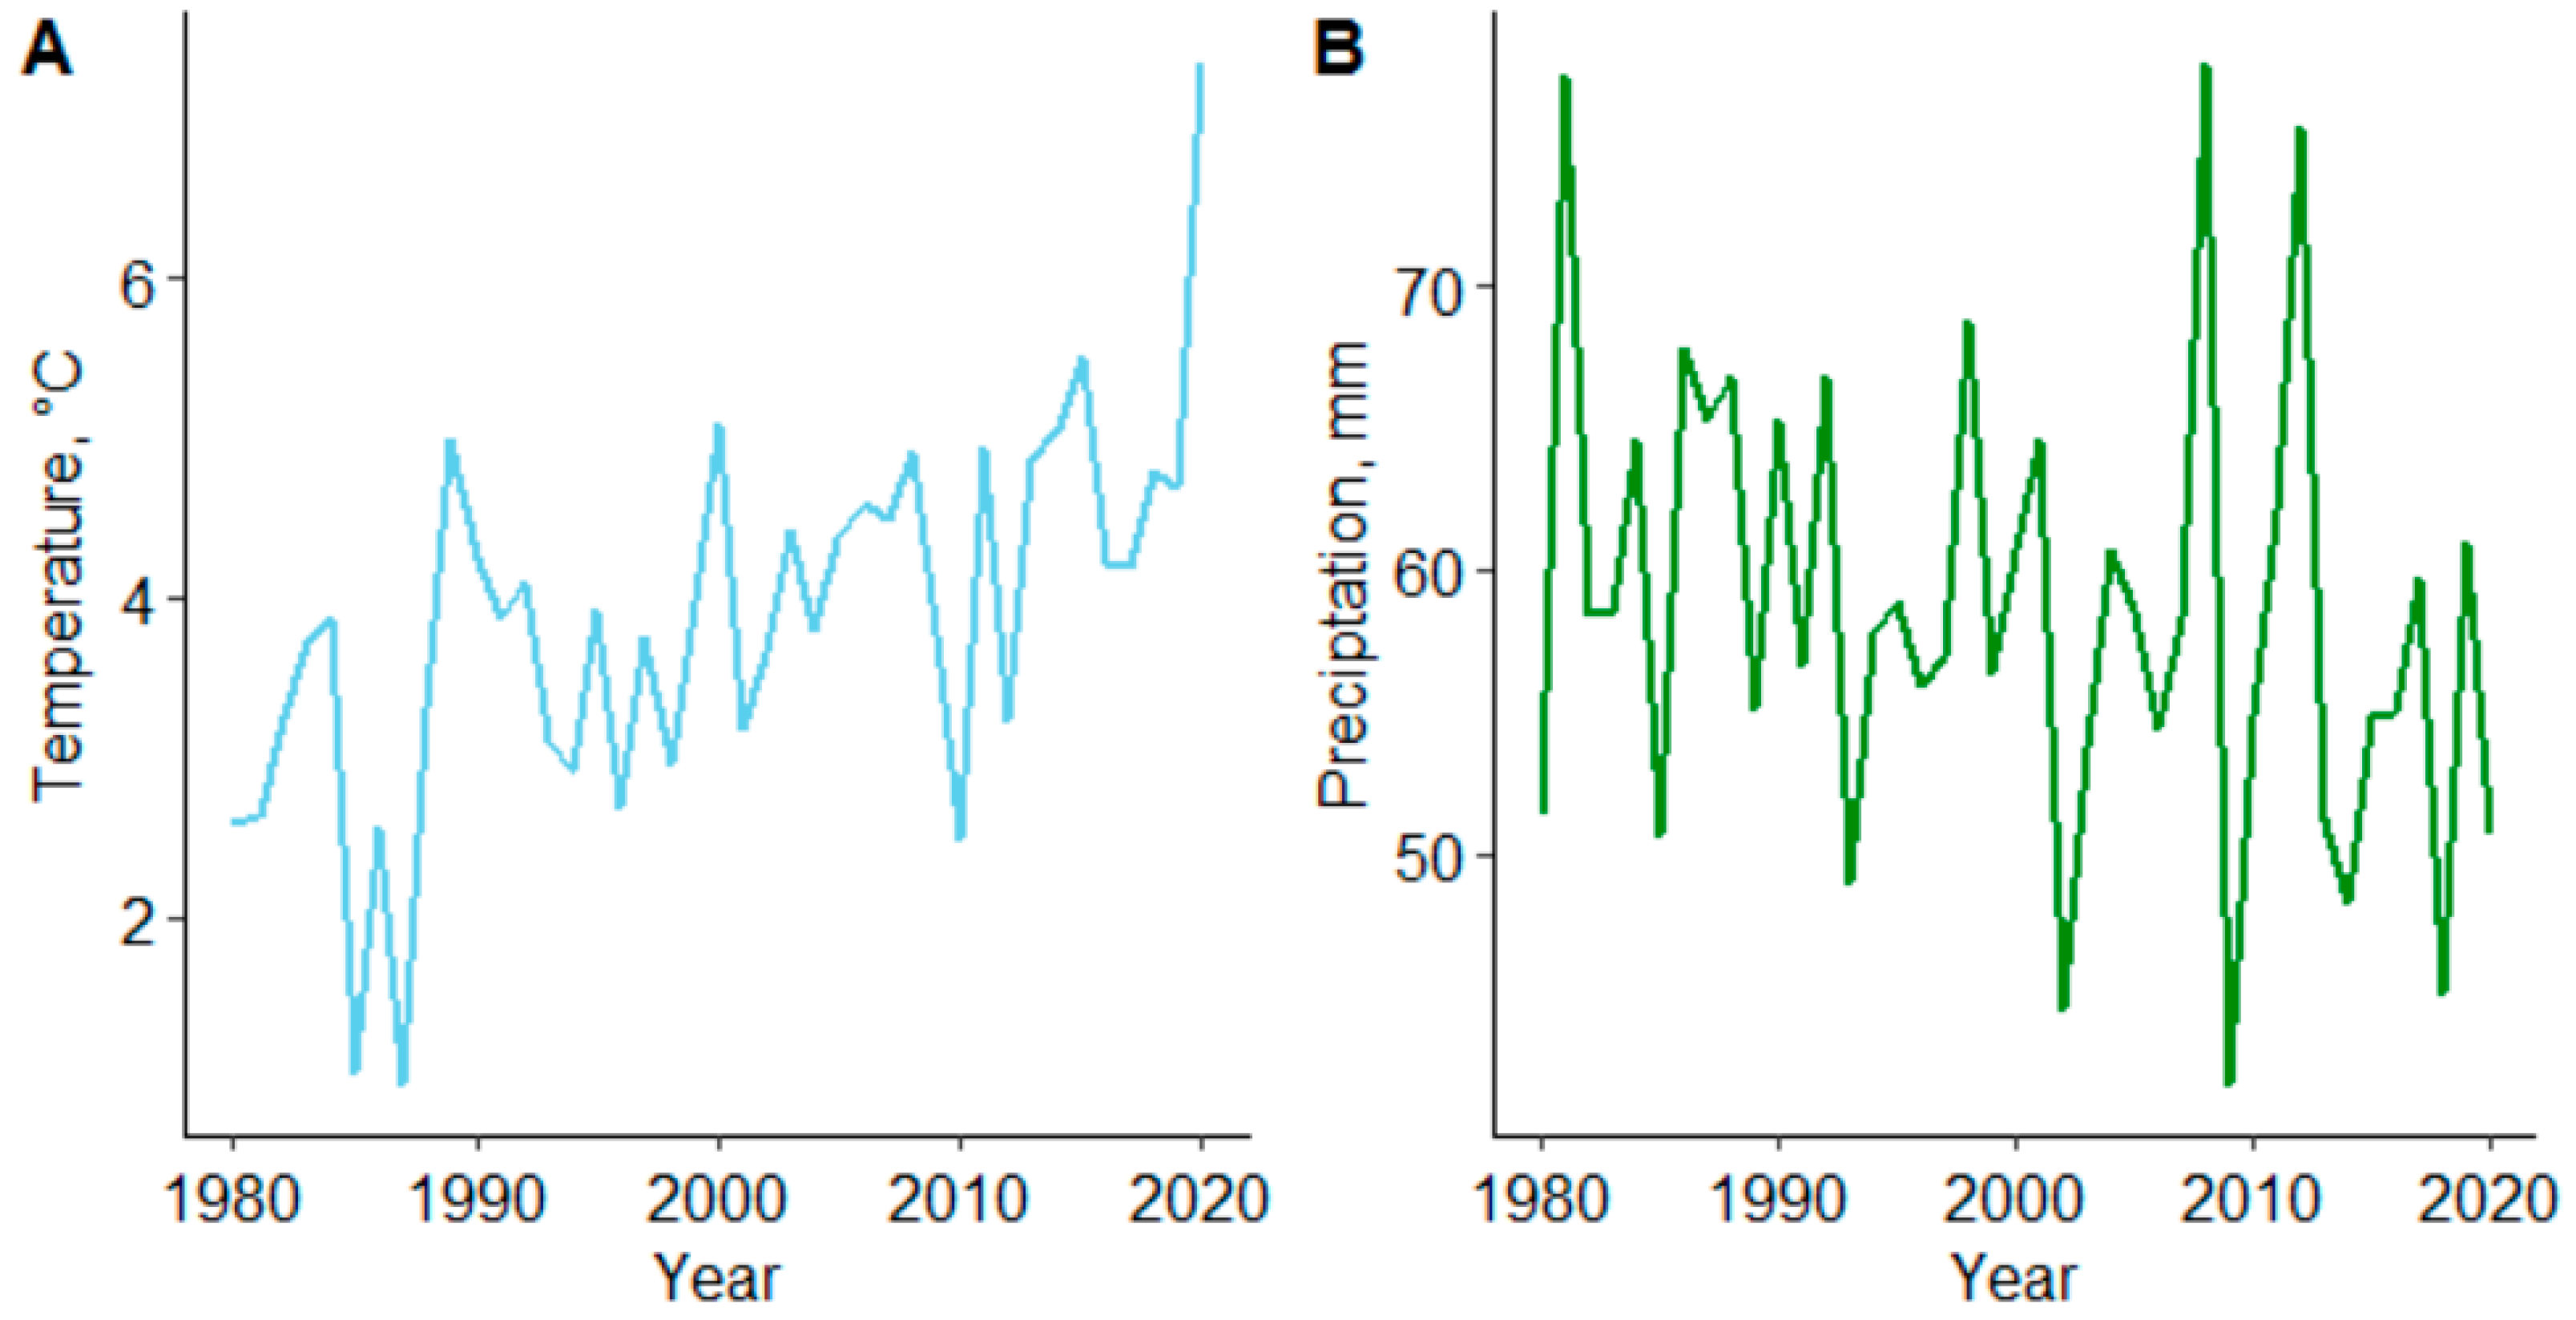
According to Ukonmaanaho et al. (2008) [
68], the proportion of senescent leaves’ biomass is closely related to the amount of aboveground litter fall, which can vary between species and years. For example, a smaller litter fall biomass can indicate a longer retention of foliage in the tree canopy. The consistency of our foliage biomass results over successive years suggests that the yields are not coincidental, but accurately reflect the actual leaf mass of the forest. Additionally, the higher annual mean temperature in 2020 (6.2 ℃) compared to 2019 (4.7 ℃) and 2021 (4.1℃) at our study sites may have contributed to the large differences in annual foliage yield [
52].
In forest ecosystems, roots are important contributors to net primary production and play a crucial role in carbon cycling [
72]. Despite their importance, there is limited empirical data on the belowground coarse root biomass of downy birch, with only a few studies available in the literature [
73,
74]. However, it is important to consider that various factors can influence coarse root biomass [
75], and trees growing in peatlands may allocate more biomass to belowground parts than those growing on mineral soil sites [
76]. This was also demonstrated in our study, where the proportion of roots (64%) in a young downy birch stand was higher than the corresponding proportion (ranging from 24% to 59%) in a silver birch stand of similar age growing on mineral soil [
61].
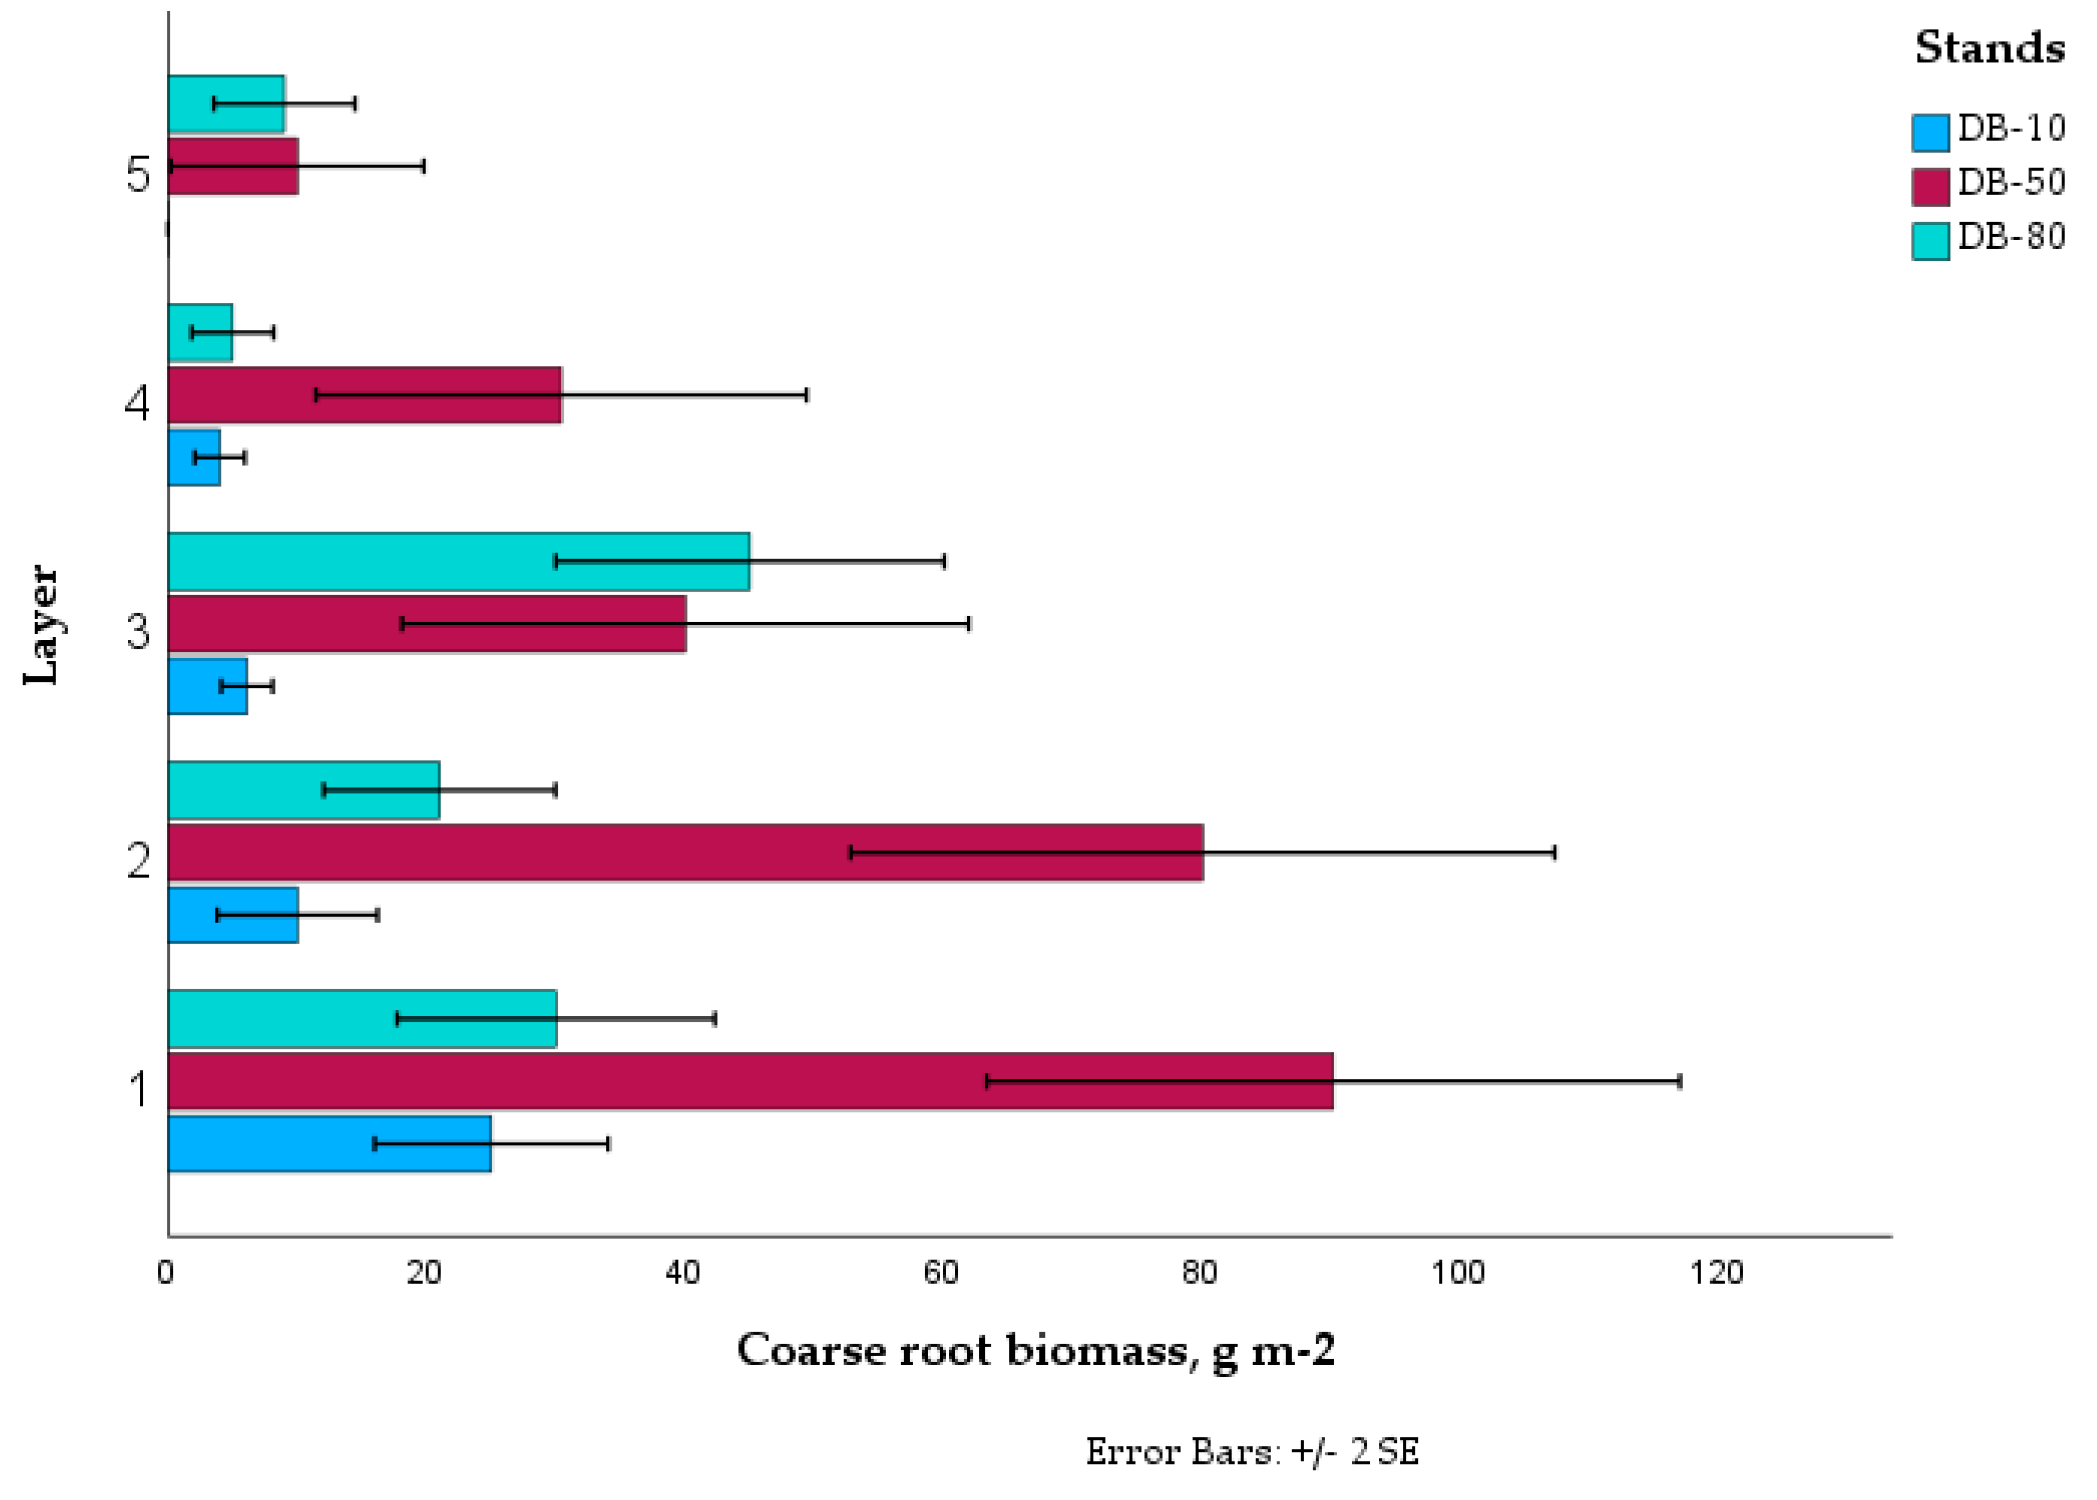
The observed distribution of coarse roots, with the majority (77%) located in the upper 20 cm soil layer (
Figure 5), is in line with the expected soil nutrient concentration pattern [
77]. The tendency for higher concentrations of roots in horizons or patches of higher fertility is well documented in the soil profile [
78], and lower soil horizons generally contain fewer roots due to increasingly unfavorable soil factors [
75]. Nevertheless, the root system has been shown to adapt to varying environmental conditions, such that trees growing in nutrient-rich forests are expected to develop a higher amount of root biomass [
79]. Our findings indicate that coarse root biomass is higher in a more nutrient-rich forest (middle-aged stand) than in nutrient-poor forests (young and mature stands). However, it is important to note that the final conclusions should not be drawn from the 1-year data only.
Author Contributions
Conceptualization, M.R.K (Md Rezaul Karim); Formal analysis, M.R.K (Md Rezaul Karim); investigation, M.R.K (Md Rezaul Karim) and S.S (Sakari Sarkkola); data curation, M.R.K (Md Rezaul Karim); funding acquisition, M.R.K (Md Rezaul Karim); methodology, M.R.K (Md Rezaul Karim) and S.S (Sakari Sarkkola); supervision, S.S (Sakari Sarkkola) and K.R.G (Katja Rinne-Garmston); visualization, M.R.K (Md Rezaul Karim), K.R.G (Katja Rinne-Garmston), and S.S (Sakari Sarkkola); writing—original draft preparation, M.R.K (Md Rezaul Karim); writing—review and editing, M.R.K (Md Rezaul Karim), K.R.G (Katja Rinne-Garmston), and S.S (Sakari Sarkkola); project administration, S.S (Sakari Sarkkola). All authors have read and agreed to the published version of the manuscript.
Figure 1.
Mean air temperature (A) and precipitation (B) of the study area in Juupajoki, Finland (Finnish Meteorology Institute (FMI)) [
52].
Figure 1.
Mean air temperature (A) and precipitation (B) of the study area in Juupajoki, Finland (Finnish Meteorology Institute (FMI)) [
52].
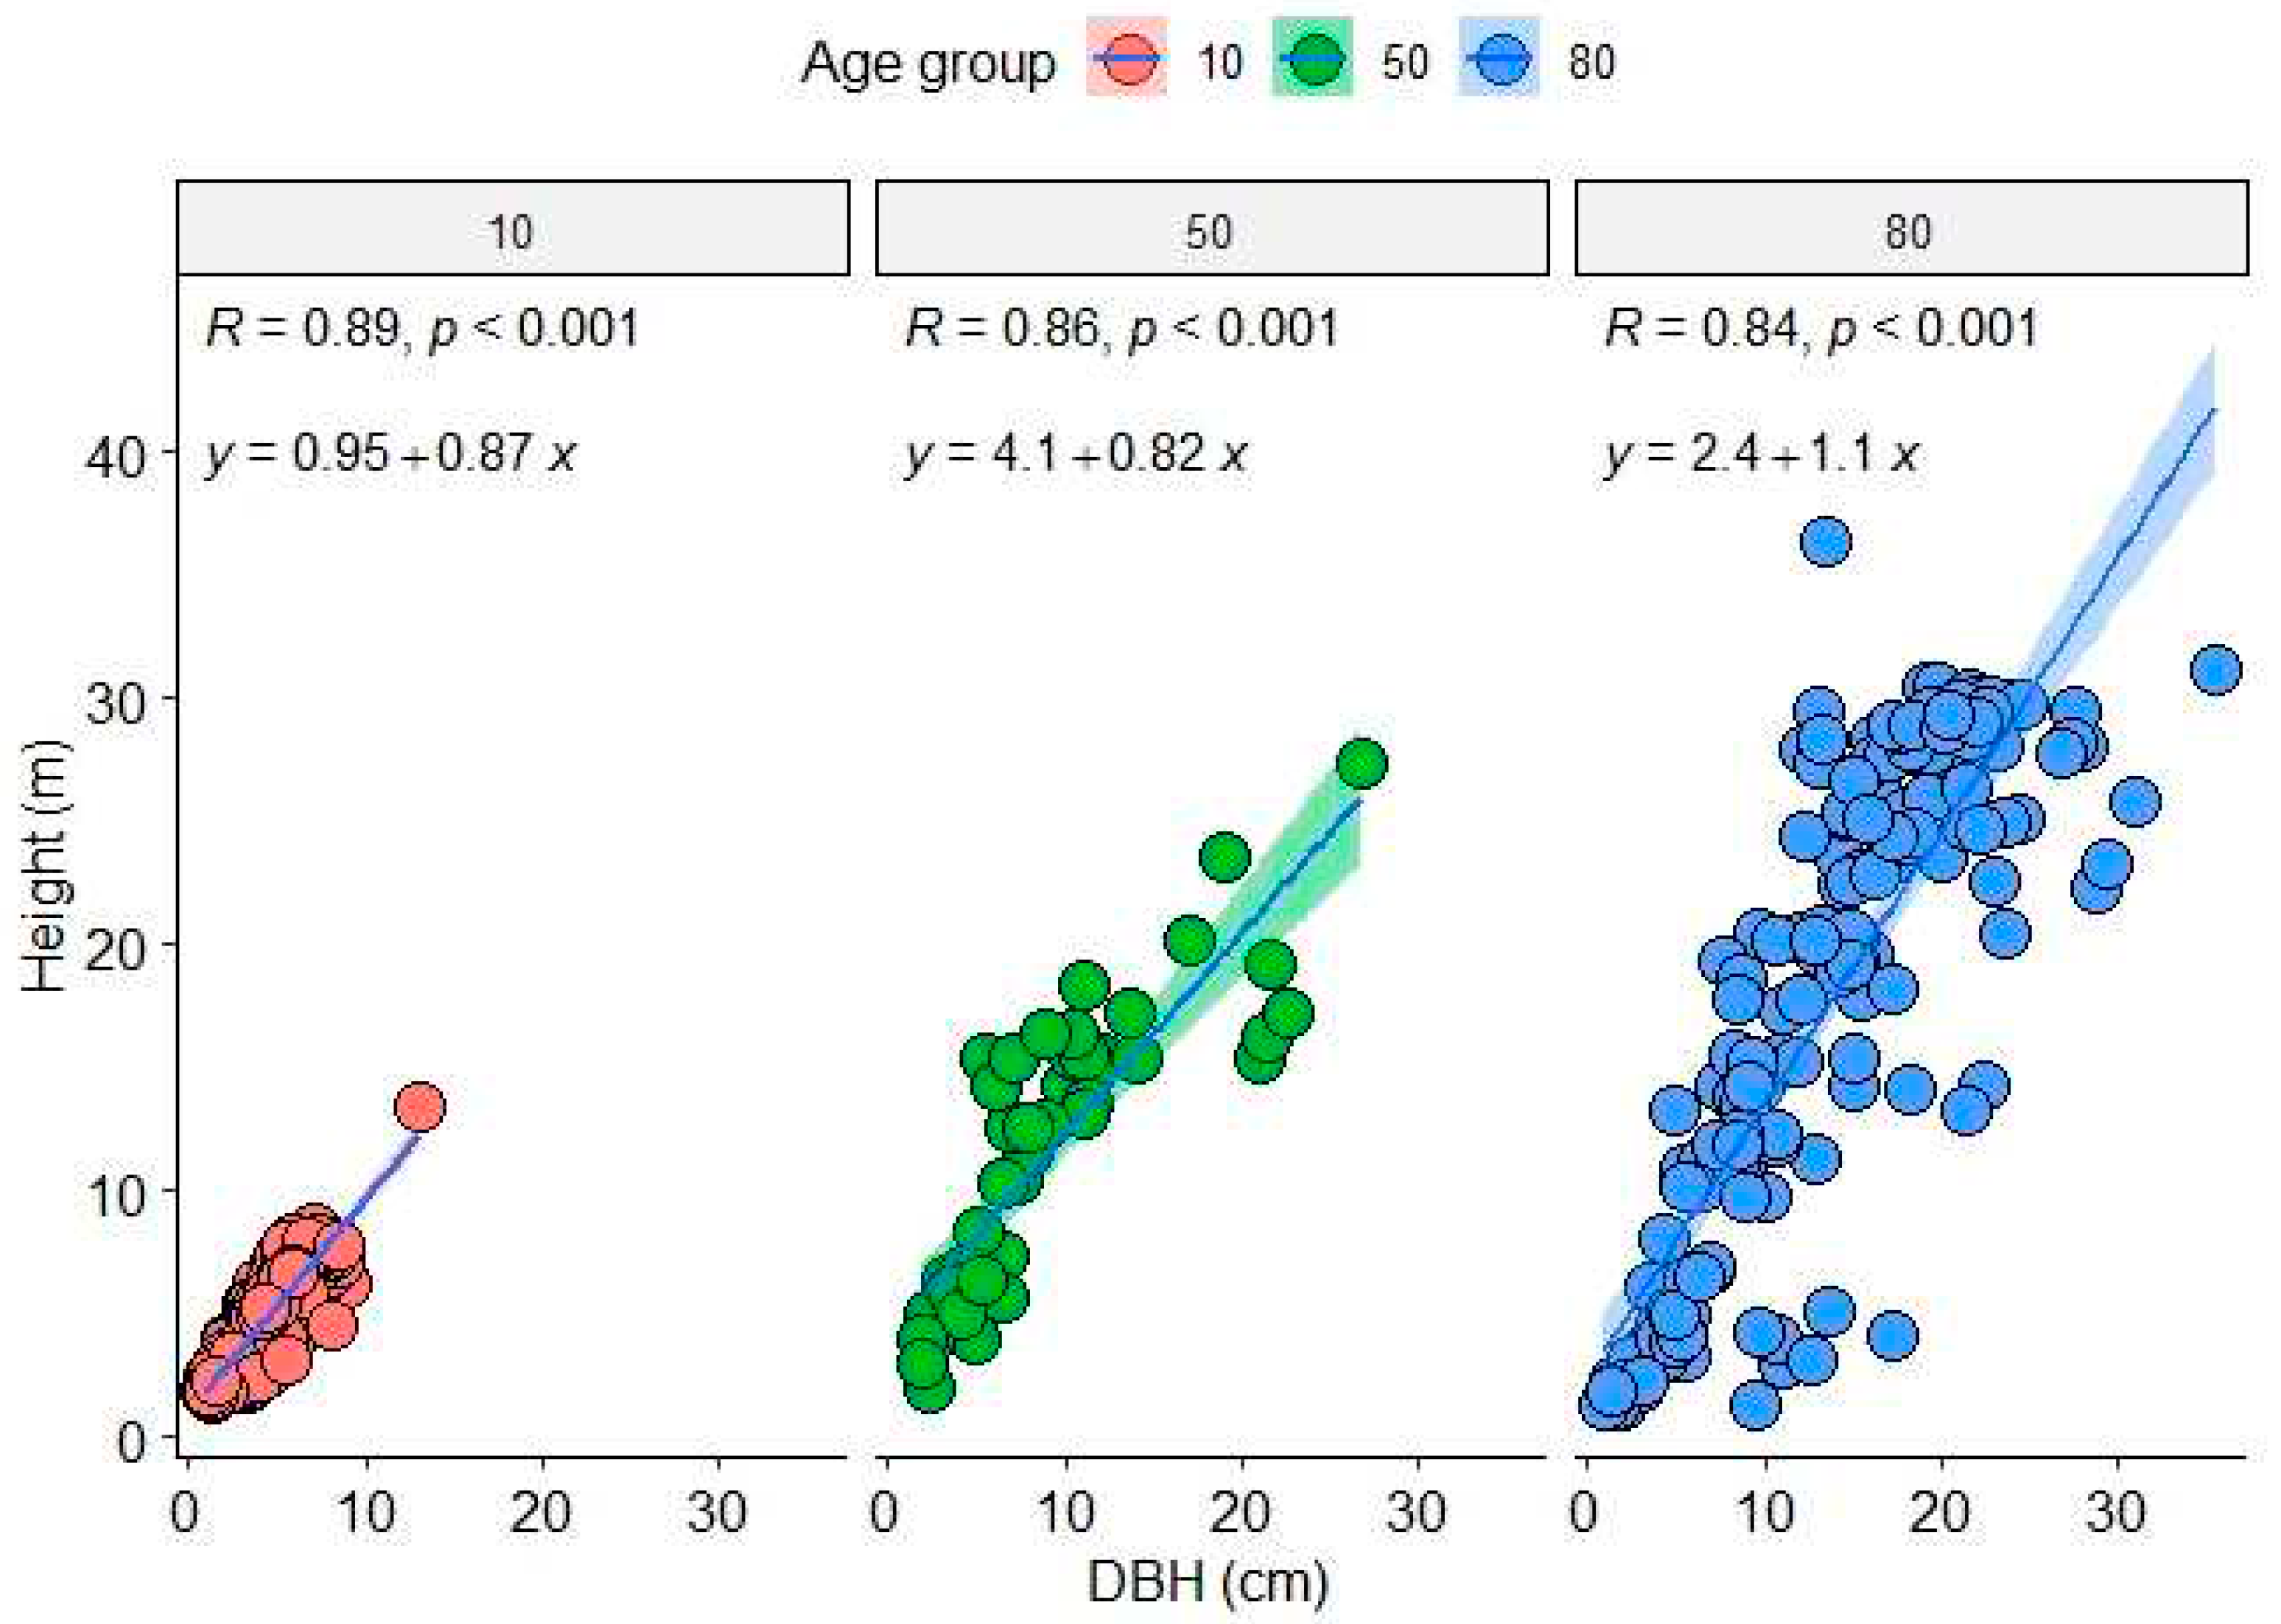
Figure 2.
Relationship between the downy birch tree height and diameter at breast height (DBH) in the studied experimental stands of three mean age classes (10, 50 and 80 years) in Juupajoki, Central Finland in 2019. The shaded areas around each regression line represent 95% confidence intervals.
Figure 2.
Relationship between the downy birch tree height and diameter at breast height (DBH) in the studied experimental stands of three mean age classes (10, 50 and 80 years) in Juupajoki, Central Finland in 2019. The shaded areas around each regression line represent 95% confidence intervals.
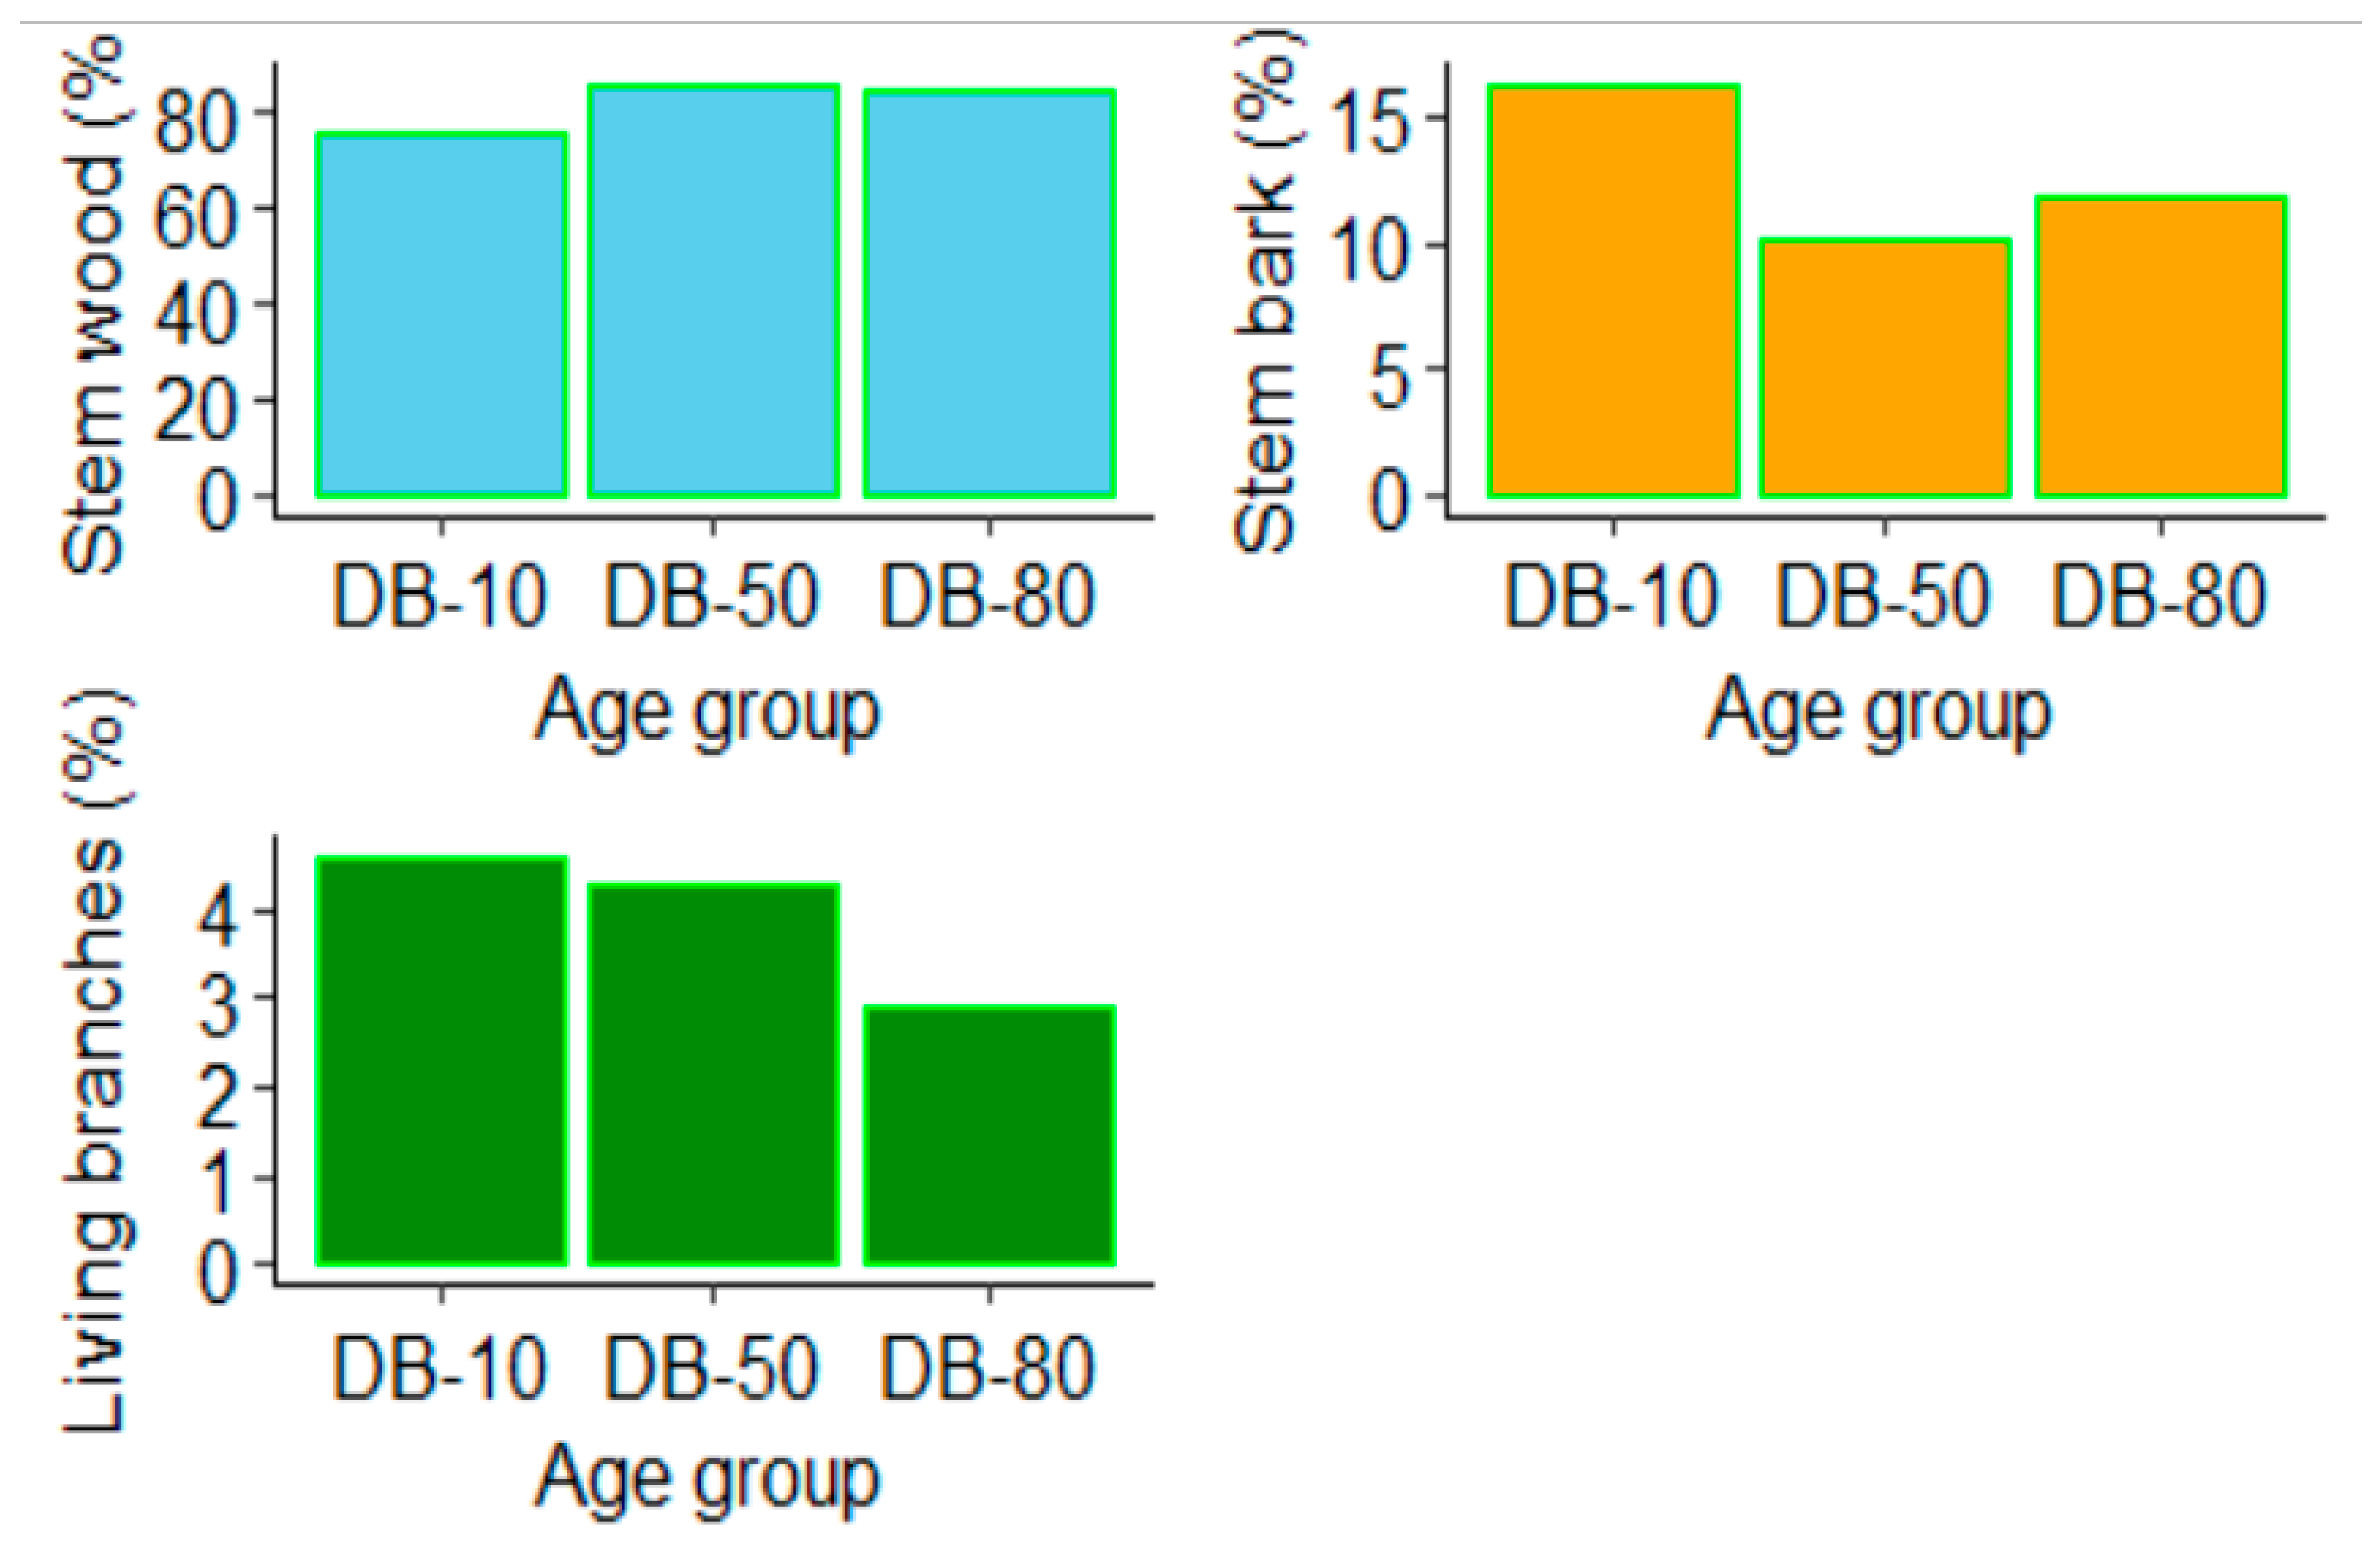
Figure 3.
Relative proportions of tree biomass compartments to total aboveground biomasses in each age class – Mature: 80 years, middle-aged: 50 years, and young: 10 years.
Figure 3.
Relative proportions of tree biomass compartments to total aboveground biomasses in each age class – Mature: 80 years, middle-aged: 50 years, and young: 10 years.
Figure 4.
Mean living foliage biomass (leaves) measured from the captured litter fall in the three different age classes of downy birch in the study area of drained peatlands (A, B); C. Mean foliage biomass estimated by the biomass equation of Repola, (2008) [
51] for downy birch. DB-10: Young stand; DB-50: Middle-age stand; DB-80: Mature stand. Bars represent the standard error of means (SE).
Figure 5.
Mean coarse root production in the drained peatland forests. Error bars are standard error of means. Layer 1: 0-10 cm depth from moss surface; layer 2: 10-20 cm; layer 3: 20-30 cm; layer 4: 30-40 cm; layer 5: 40-50 cm.
Figure 5.
Mean coarse root production in the drained peatland forests. Error bars are standard error of means. Layer 1: 0-10 cm depth from moss surface; layer 2: 10-20 cm; layer 3: 20-30 cm; layer 4: 30-40 cm; layer 5: 40-50 cm.
Table 1.
Location, stand characteristics, tree diameter (DBH; diameter at 1.3 m) and tree height of experimental downy birch-dominated (DB) stands on peatlands in Central Finland.
Table 1.
Location, stand characteristics, tree diameter (DBH; diameter at 1.3 m) and tree height of experimental downy birch-dominated (DB) stands on peatlands in Central Finland.
Table 2.
Stand-level aboveground biomass by compartment, summed up from tree-level estimates, at the three downy birch-dominated stands representing different age classes.
Table 2.
Stand-level aboveground biomass by compartment, summed up from tree-level estimates, at the three downy birch-dominated stands representing different age classes.
Table 3.
Correlation matrix of stand age and the different compartments of tree aboveground biomass (t ha-1). SA: stand age, SB: stem biomass, SW: stem wood, LB: living branches, DB: dead branches; AGB: total aboveground biomass.
Table 3.
Correlation matrix of stand age and the different compartments of tree aboveground biomass (t ha-1). SA: stand age, SB: stem biomass, SW: stem wood, LB: living branches, DB: dead branches; AGB: total aboveground biomass.
Table 4.
Dry foliage biomass (t ha -1) with standard deviation (SD), minima and maxima across the three downy birch-dominated stands and years. N = 6 for all sites.
Table 4.
Dry foliage biomass (t ha -1) with standard deviation (SD), minima and maxima across the three downy birch-dominated stands and years. N = 6 for all sites.
Table 5.
Coarse root production (g m-2) with standard deviation (SD), standard error (SE), minima and maxima by depth in the drained forests. N = 10 for each site.
Table 5.
Coarse root production (g m-2) with standard deviation (SD), standard error (SE), minima and maxima by depth in the drained forests. N = 10 for each site.
Table 6.
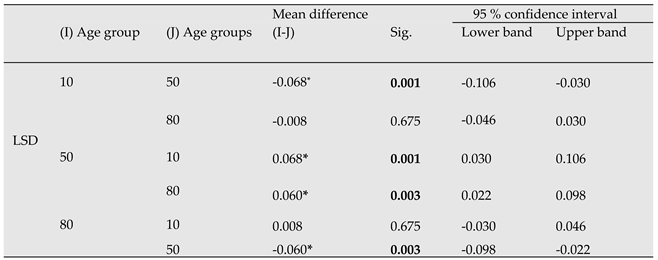
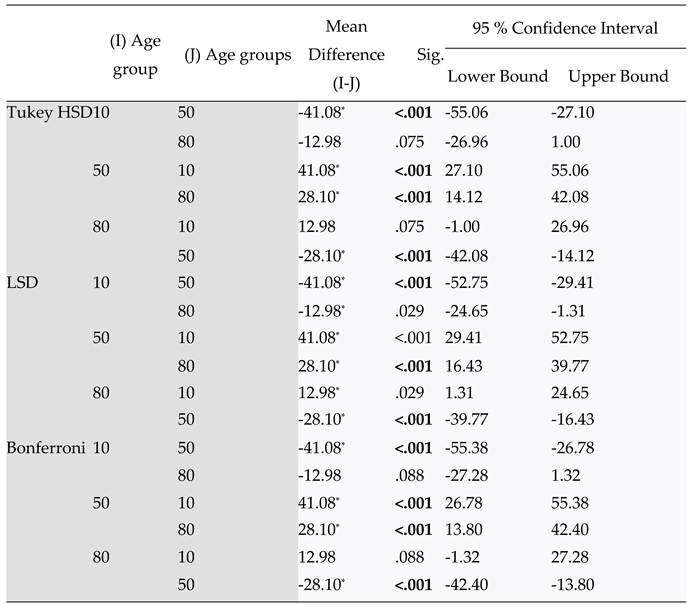
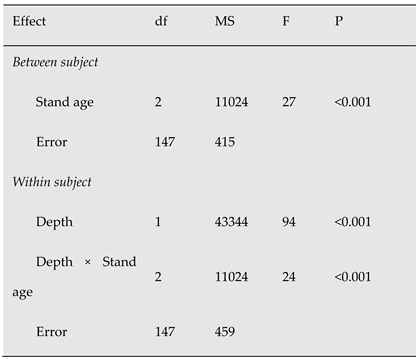
Repeated measures analysis of Variance on the effects of stand age (young, middle-aged and mature) on coarse root biomass (g m-2). Data are from cores and were divided into five 10-cm layers per core (within-factor Depth).
Table 6.
Repeated measures analysis of Variance on the effects of stand age (young, middle-aged and mature) on coarse root biomass (g m-2). Data are from cores and were divided into five 10-cm layers per core (within-factor Depth).
