Preprint
Article

Analysis on the Characteristics of Typical Forest Fire Weather Index in the Beijing-Tianjin-Hebei-Shanxi Region

Altmetrics

Downloads

95

Views

17

Comments

0

This version is not peer-reviewed

Submitted:

19 July 2023

Posted:

20 July 2023

You are already at the latest version

Alerts
Abstract
In the overall context of national eco-conservation civilization development and considering the hills in the Beijing-Tianjin-Hebei-Shanxi region, the local forest coverage rate is gradually on the rise, and so is the risk of forest fire. Every year, satellites can monitor and detect hundreds of fire spots on average. In recent years, serious fire took place for several times, leading to loss of life and personal injury. Then the fire-fighting work consumed huge amount of labor and material resources, exerting negative social impacts in many ways. Thus, the analysis of fire climate background in this region and the forecast based on fire weather indexes constitute an important part in the forest fire risk management. Located in the tropical monsoon climate zone, four provinces and municipalities of Beijing, Tianjin, Hebei and Shanxi are similar in terms of climate characteristics. This study tries to analyze the characteristics about fire spots under satellite monitoring, fire climate and fire weather index. The probability distribution analysis of weather index about fire spots in history and key meteorological observation stations as well as the weather index analysis in the early stage of typical fire indicate that the Fine Fuel Moisture Content (FFMC) and the Initial Spread Index (ISI) in the Fire Weather Index (FWI) system is applicable to the fire risk analysis in the Beijing-Tianjin-Hebei-Shanxi region, which can also effectively indicate the fuel moisture and spread conditions. As regards to the average level in Beijing-Tianjin-Hebei-Shanxi, when the FFMC is smaller than 93.5 and the ISI is also smaller than 5.0, there is a low risk of fire; when the FFMC is above 94 and the ISI is larger than 10.0, there is a high risk of fire; and the fire risk will be extremely high if the FFMC is over 96 and the ISI is above 13.0. In the practical fire-fighting management, the fire danger class can be released in reference to the ISI classes and threshold values of key meteorological observation stations under analysis provided by this study.
Keywords: 
Subject: Environmental and Earth Sciences  -   Atmospheric Science and Meteorology

1. Background and Significance of the Research

The forest is a vital component of the terrestrial ecosystem and a significant natural resource, which plays an important role in regulating the climate and maintaining soil and water. At the same time, it is also an ideal habitat for many wild animals, and the resources it provides, such as timber, also have an essential function in people’s daily life [1,2].
The healthy growth of forests is threatened every year by disasters such as pests and rats, as well as fires. Among the forest disasters such as fires, pests, and diseases, fires are the major contributor to disasters and losses to China’s forest resources, with more than 3000 forest fires occurring nationwide annually [1]. Against the backdrop of global warming and increased extreme drought incidents, the incidence of fire is increasing. Consequently, it is even more important to effectively protect forest resources and achieve their sustainable development [3].
Furthermore, studies have indicated that the occurrence of forest fires not only leads to the loss of forest resources, but also changes them from a sink of CO2 to a source of CO2, which further exacerbates global warming [4]. Forest fires are not only harmful to the woods economy, but also damaging to the ecological environment. Fires in the junction area of urban forestry and rural forestry are often a threat to people’s lives and property, and large-scale fires can even affect global climate change [5]. Thus, forest fire prevention and extinguishing work is related to social harmony and stability and the overall issue of addressing climate change, which is of great significance to national economic and social development as well as an integral part of the ecological progress [6,7].
The Beijing-Tianjin-Hebei-Shanxi region is an important political, economic and cultural center of China, which has an important strategic position in the field of ecological and environmental protection [8]. The region has numerous mountain ranges, including the Yanshan Mountains, the Yinshan Mountains, the Taihang Mountains, the Wutai Mountains as well as the Lyuliang Mountains, and woodlands are also mainly distributed in these mountainous areas [9]. Under the background of national ecological progress, as well as the “Three-North Shelter Forest Programme” (also known as the Green Wall of China) and “Beijing-Tianjin Sandstorm Source Control” projects, the forest coverage in the region has gradually increased, bringing with it a growing risk of forest fires. According to the forest fires by regions from 2011 to 2014 as published by the National Bureau of Statistics (http://www.stats.gov.cn/sj/), 466 forest fires occurred accumulatively in the Beijing-Tianjin-Hebei-Shanxi region during the above years, including 111 large and major fires, with a cumulative burned area of 15743 hectares (Table A1). Hence, it is of great importance to carry out research on forest fire climate characteristics and risk assessment and forecasting indicators for the Beijing-Tianjin-Hebei-Shanxi region, particularly for the Taihang Mountains and Yanshan Mountains. While previous studies on forest fire climate characteristics, risk assessment and fire risk forecasting models in northeast and southwest China have been conducted thoroughly and comprehensively, few studies have been carried out on forest fire climate characteristics and forest fire risk forecasting models in the Beijing-Tianjin-Hebei-Shanxi region [10].
The forest fire risk assessment, forecasting and early warning are of great significance in the routine prevention and control of forest fires. The high-accuracy fire risk forecasting is the fundamental support for fire prevention and fire-fighting work, which is vital for the protection of forests and people’s lives and property [11]. There are many forest rating systems for forest fire prediction ,such as U.S. Forest Service National Fire Danger Rating System (NFDRS), Canadian Forest Fire Danger Rating System (CFFDRS) [12,13], and McArthur Forest Fire Danger Index (FFDI) [14,15]. Canadian Forest Fire Weather Index (FWI) System is a subsystem of CFFDRS which is widely used in forest fire warnings and assign resources in the field[16,17]. Therefore, FWI system was used in this study for forest fire risk assessment in the Beijing-Tianjin-Hebei-Shanxi region, a method to identify dynamically high fire risk periods was established for this region and the characteristics of FWI index is analyzed to provide technical support for fire monitoring in the future.

2. Research Data

2.1. Study Area

The Beijing-Tianjin-Hebei-Shanxi region is located in the northern North China Plain with a total area of 21.72×10⁴ km2(Figure 1). Its geographic coordinates are 113°27’ - 119°50’ E and 36°05’ - 42°40’ N. It is belong to a temperate monsoon climate zone with hot, rainy summers and cold, dry winters. The average monthly temperature is below 3℃, and the average temperature in July is 18~27℃. The average annual precipitation is 484.5mm which is more in southeast than in northwest. The main vegetation type is grassland and woodland which decreases from north to south [18].

2.2. Data

The main data used in this research are fire point data and meteorological data. In particular, the fire point data were derived from the satellite monitoring fire point data from 2007 to 2017 from the Forest Fire Monitoring Center of the State Forestry Administration, including information such as number, latitude and longitude, continuity, land type, monitoring time, monitoring satellite, feedback information, pixel count, and so on, while the satellite data sources included FY-1D, FY-3A, FY-3B, MODIS, NOAA-15, NOAA-16, NOAA-18 and NOAA-19 (http://www.nsmc.org.cn/nsmc/cn/home/index.html).
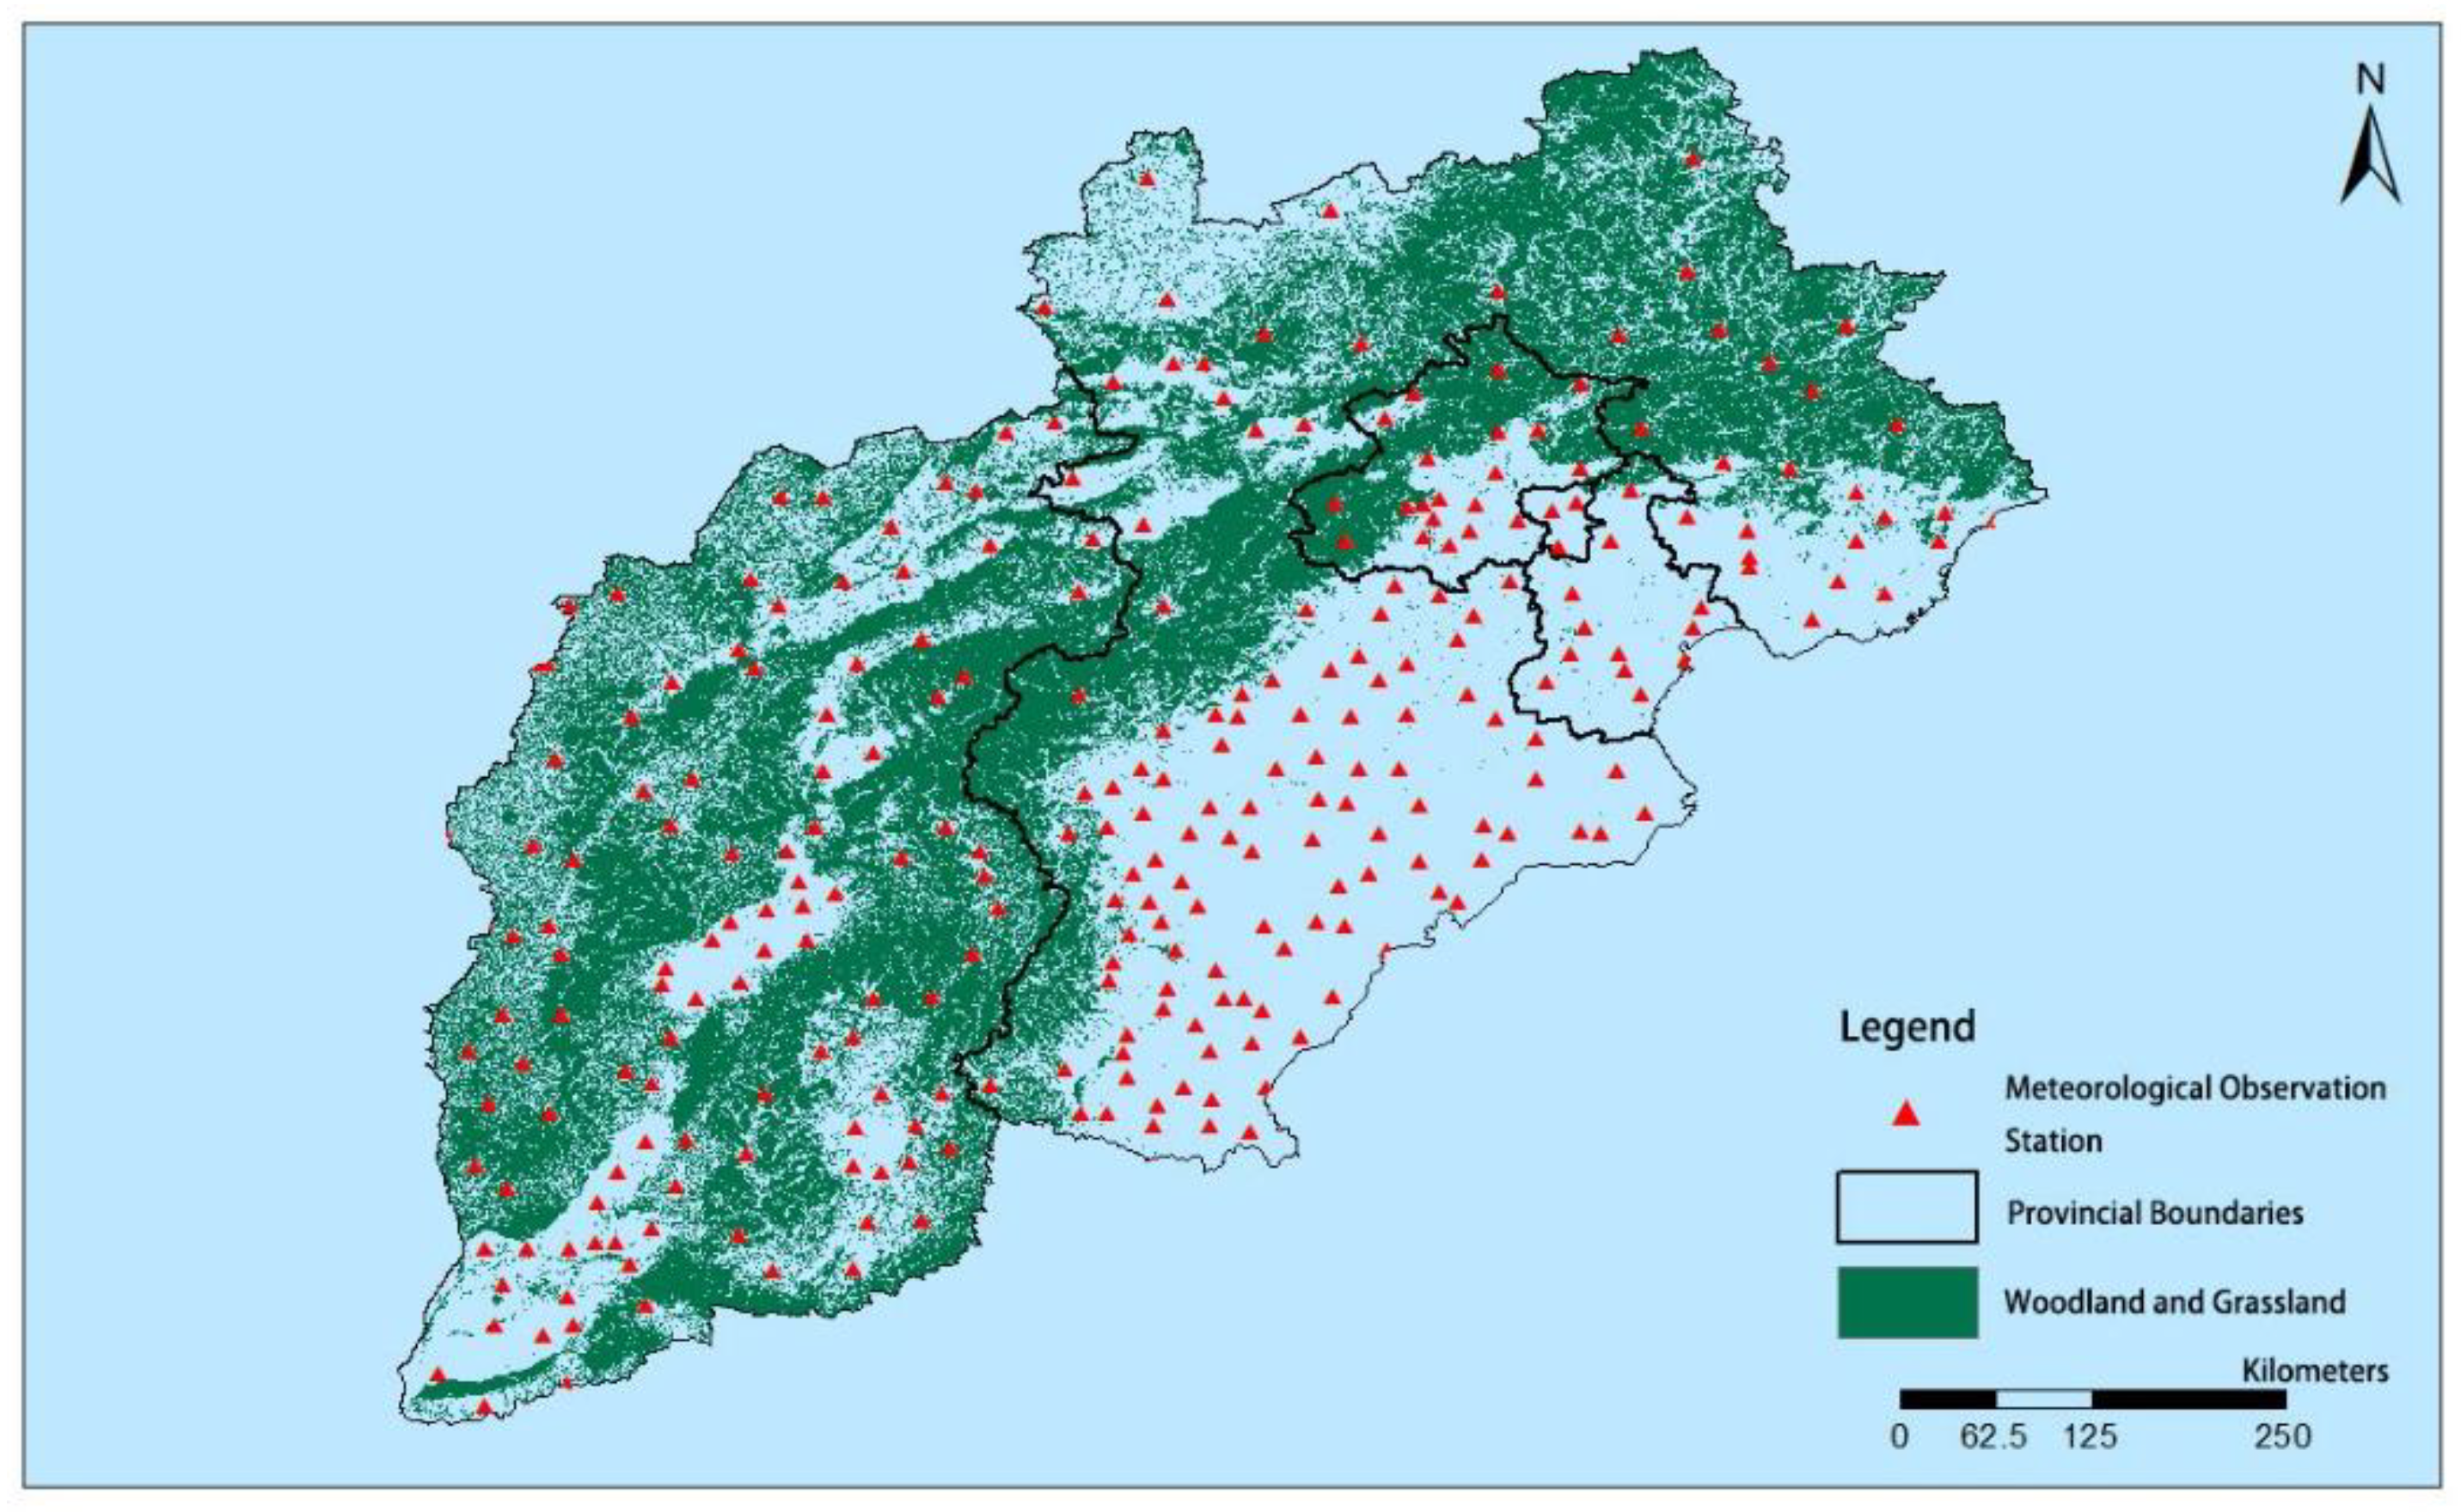
Meteorological data for this research were obtained from the meteorological stations in the Beijing-Tianjin-Hebei-Shanxi region of China Meteorological Data Service Center(http://data.cma.cn/). This paper has selected day-by-day observations from 280 meteorological stations for the period of 2011 to 2020(The distribution of national meteorological stations is as shown in Figure 2), and the elements include temperature, relative humidity, wind speed, and accumulated precipitation.
The present research conducted quality control on satellite monitoring fire point data to remove data on urban fires, industrial and mining fires, agricultural fires, mountain burning for reforestation purposes, prescribed burning, and duplicate information. From 2007 to 2017, satellite monitoring of fire points in the Beijing-Tianjin-Hebei- Shanxi region has recorded a total of 2772 data, with a total of 1381 valid fire points, primarily bush fires, forest fires, and wildfires, after eliminating data on urban fires, industrial and mining fires, agricultural fires, mountain burning for reforestation purposes, prescribed burning and duplicate information on the same fire area. In addition, in this research, the quality of meteorological data was controlled according to the requirements of the calculation and input of the forest fire risk weather index by eliminating stations with more than 3 consecutive days of missing data and stations with more than 15 cumulative days of missing data. For missing data on a single day in terms of temperature, humidity, and wind speed or other elements, The mean of the day before and the day after were used to compensate for the absence [19].

2.3. The Model Used

This research was conducted with the Canadian Forest Weather Index (FWI) system, based on the water content of three forest combustibles and the effect of wind on fire behavior. The system consists of six components: three fundamental sub-indices representing combustible moisture, including the fine fuel moisture code (FFMC), the duff moisture code (DMC) as well as the drought code (DC); two intermediate sub-indices, representing the spread rate and consumption rate of combustibles respectively, known as the initial spread index (ISI) and the build-up index (BUI); and a final index, representing the fire intensity, known as the FWI (weather index level). Each index is calculated from the day-by-day temperature, relative humidity, wind speed, and precipitation [20].
The FFMC represents the moisture content of the fine dead fuel in the forest ground cover within the FWI system, which is approximately the water content of dead leaves and other fine fuel around 1.2 cm thick [21]. Most of the fine fuel consists of dead and withered needles, leaves, lichens, mosses and other loose and fine fuel. FFMC is a relatively simple indicator of the flammability and combustibility of fine fuel. It is influenced by temperature, precipitation, relative humidity, and wind speed and its value varies with the moisture content of the combustibles, with a minimum value of 0 (100% moisture content of combustibles) and a maximum value of 101 (0 moisture content of combustibles). A higher value of FFMC denotes a higher fire risk level. The core of the FFMC calculation is the model of moisture exchange, viz [22, 23].
F F M C = 59.5 ( 250 m ) 147.2 + m
where m is the water content.
The water content m is obtained by first calculating the evaporation rate Kd and the wetting rate Kw, and then calculating the equilibrium water content in the evaporation state Ed and the equilibrium water content in the wetting state Ew, and the increase in precipitation water content Δm, respectively. The specific steps are as follows:
k o = 0.424 ( 1 R H 100 ) 1.7 ) + 0.0694 w i n d s p e e d ( 1 ( R H 100 ) 8 )
k d = k o × 0.581 e 0.0365 T
k 1 = 0.424 ( 1 100 R H 100 ) 1.7 ) + 0.0694 w i n d s p e e d ( 1 ( 100 R H 100 ) 8 )
k w = k 1 × 0.581 e 0.0365 T
E d = 0.942 R H 0.679 + 11 e R H 100 10 + + 0.18 ( 21.1 T ) ( 1 e 0.115 R H
E w = 0.618 R H 0.753 + 10 e R H 100 10 + 0.18 ( 21.1 T ) ( 1 e 0.115 R H )
Δ m r f = 42.5 e ( 100 251 m 0 ) ( 1 e ( 6.93 r f ) )
where RH is air humidity, T is temperature, rf is the revision factor for precipitation and m0 is previous day’s water content.
If previous day’s water content is higher than today’s equilibrium water content, then it is an evaporation process
m = E d + ( m 0 E d ) × 10 k d
If previous day’s water content is lower than today’s equilibrium water content, then it is a wetting process.
m = E w + ( E w m 0 ) × 10 k w
The ISI is calculated from FFMC and wind speed and it represents the potential speed of fire spread. The ISI is a well-suited indicator for the fire spread level in different forest types and can be calculated as follows:
I S I = 0.208 f W f F
f W = e 0.05039 W
f F = ( 91.9 e 0.1386 m ) ( 1 + m 5.31 4.94 × 10 7 )
where f(F) is the FFMC, W is the wind speed and m is the water content.
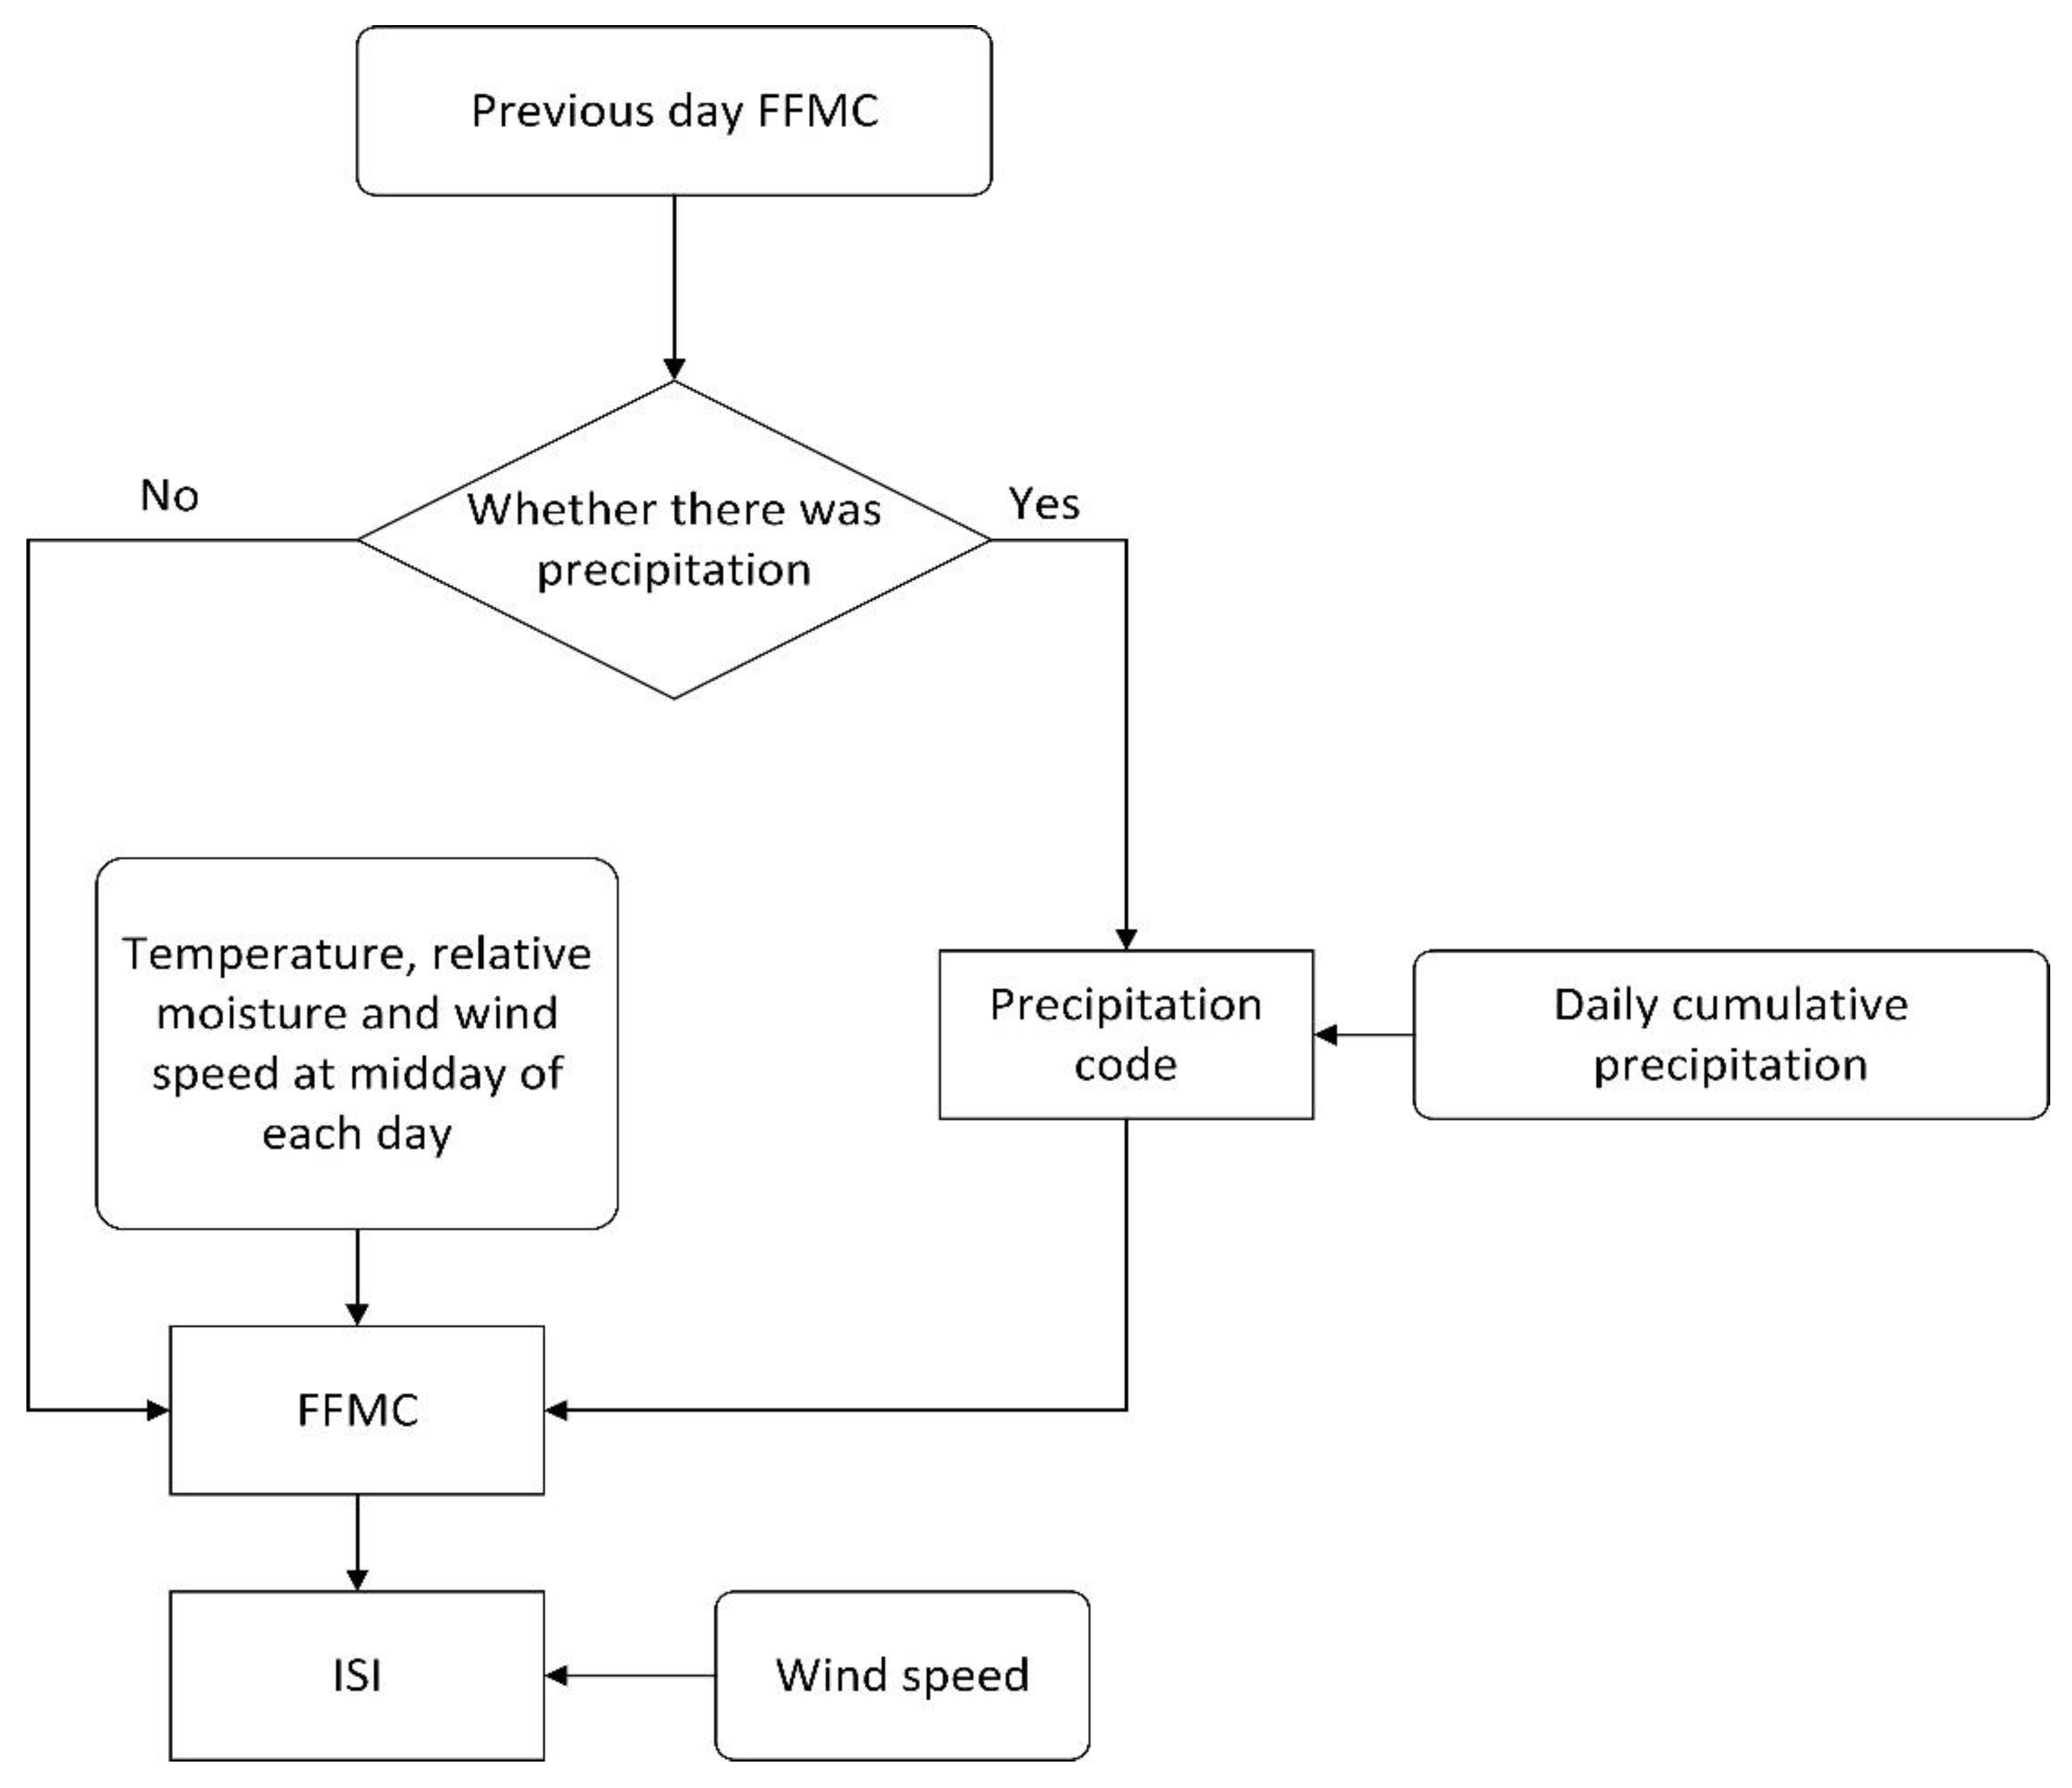
With fire risk climate and weather index analysis as the primary object of this research, the FFMC is the only index in the FWI system that can be directly converted to the water content of combustibles and is applicable to the assessment of the initial ignition risk of the fire. Whether the fire can form or not is closely related to the spread speed, therefore the ISI is applicable to the assessment of the initial fire spread risk. The flow chart of FFMC and ISI calculation is shown in Figure 3.

3. Results

3.1. Forest Fire Distribution in the Beijing-Tianjin-Hebei-Shanxi Region

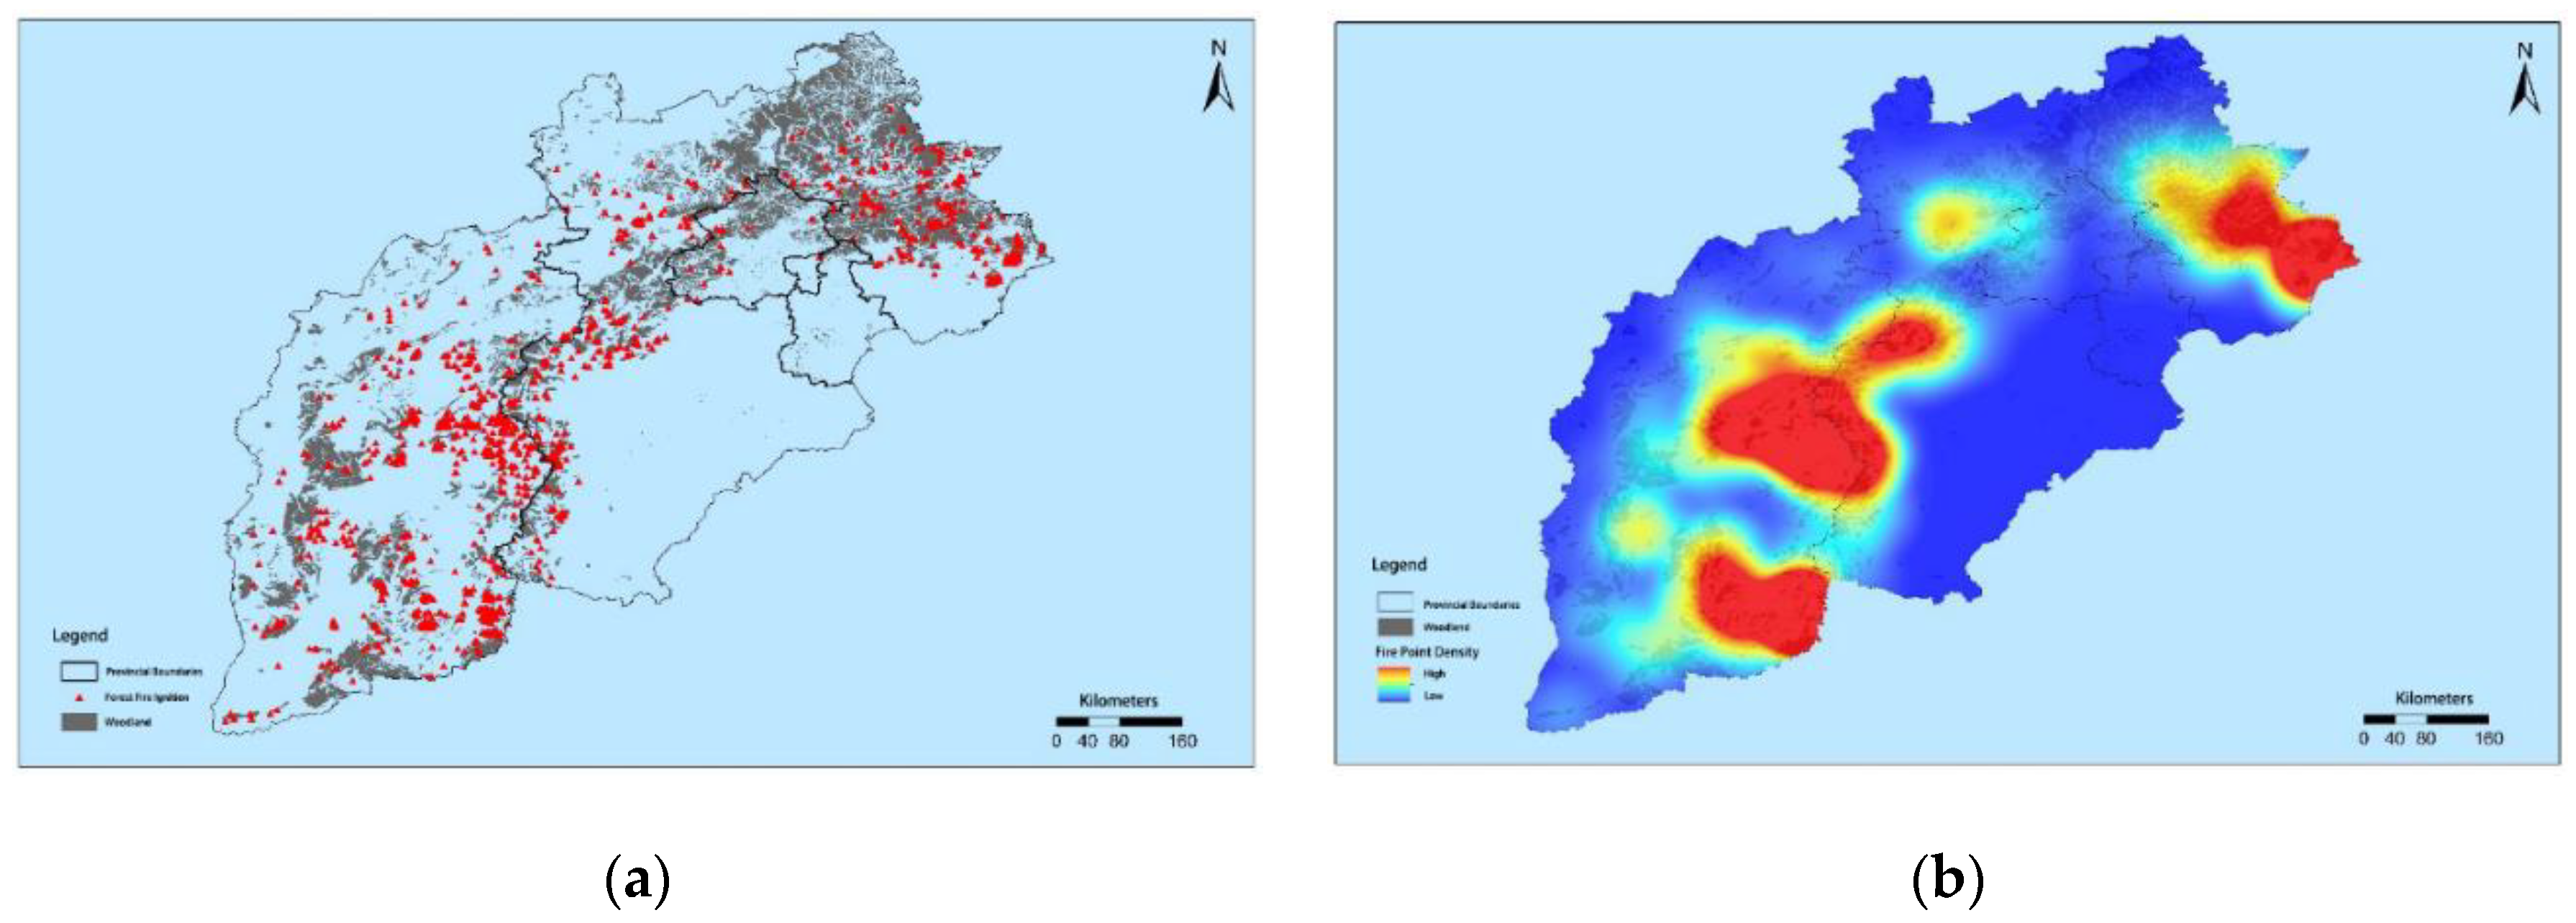
The fire points are mainly located in northeastern and western Hebei, western Beijing and eastern Shanxi (Figure 4a). The majority of fire points are located in the shallow mountain areas of the Yanshan Mountains and Taihang Mountains. As can be observed from the analysis map of forest fire points kernel density(Figure 4b), areas with higher fire point density include Xinzhou, Yangquan, Changzhi, Chengde, Shijiazhuang, Baoding and Qinhuangdao, which are cities located in the mountainous areas of the Taihang Mountains and Yanshan Mountains.
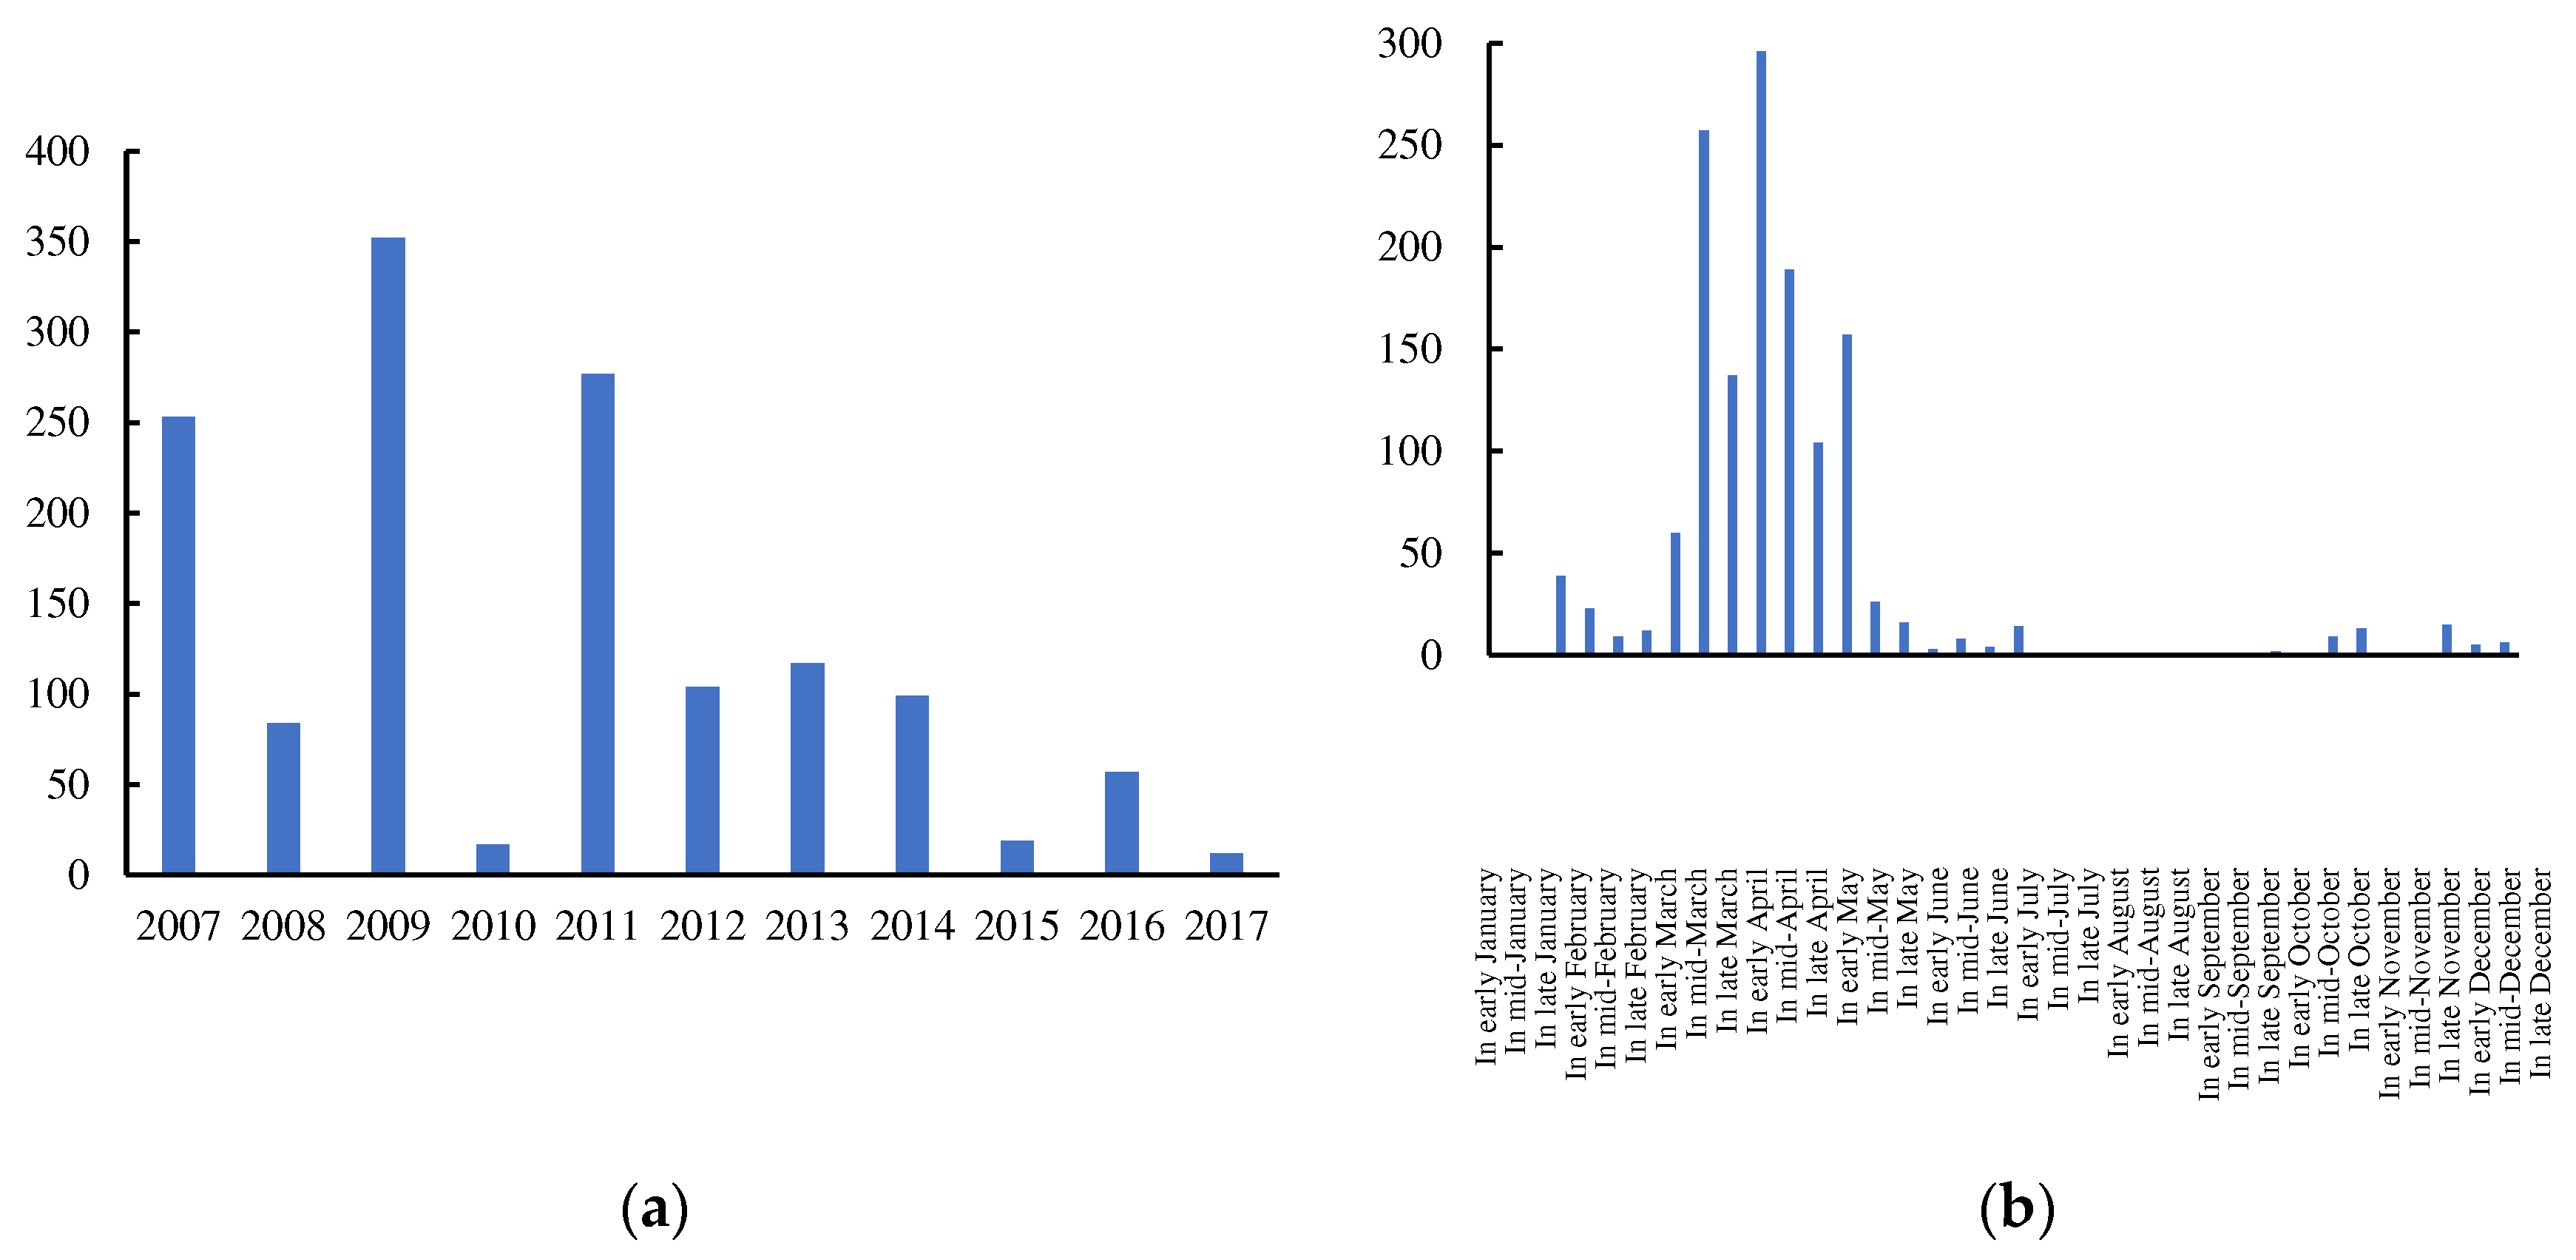
With regard to the temporal distribution, there was an average of 126 fire points per year from 2007 to 2017, with the lowest number, 17, in 2010 and as many as 352 fire points in 2009 (Figure 5a), These fire points were obtained statistically after verification. The number of forest fires is directly influenced by the meteorology and fire management of the year and varies considerably from year to year.
By counting the total number of fire points over the years in each ten-day period, this research studied the distribution characteristics of fire points across the year as is shown in Figure 5b, which showed that forest fires in the Beijing-Tianjin-Hebei-Shanxi region mainly occurred from mid-March to early May, with 81% of the fire points, of which the number of fire points was the highest in early April, while the number of forest fires was the lowest from mid-July to mid-October. This is associated with the climatic and agricultural activity characteristics of the region throughout the year. The region suffers from a dry spring with poor rainfall and a high number of windy days, while agricultural activities start from March to April, with a high frequency of agricultural fires such as burning grass in the fields, burning the soil and burning the edges of the fields, as well as sacrificial fires before the Qingming Festival, leading to a high incidence of forest fires during this time. The rainy season in northern China begins in July, and the ground remains moist with frequent rainfall, making it difficult for combustibles to ignite and fires to occur, thus forest fires are rare [24].
On the basis of the above analysis, the priority analysis of the climatic characteristics and weather indices for fires in the Beijing-Tianjin-Hebei-Shanxi region should concentrate on the winter and spring fire prevention period (i.e., from January to June), with the key areas being the Taihang Mountains and Yanshan Mountains.
Taking into account the distribution of fire points and woodlands, this paper has selected a total of 37 areas and corresponding meteorological stations that require priority analysis of the fire risk weather index, as shown in Table 2.

3.2. Fire Risk Weather Index Analysis

Forecasting and early warning of fire risk levels on a day-by-day basis during routine fire management serve as an important basis for conducting forest fire management [25], fire brigade deployment, and patrol duty arrangements. This section explores the feasibility of applying the FFMC and the ISI in the weather index system to fire risk forecasting work in the Beijing-Tianjin-Hebei-Shanxi region.

3.2.1. Characteristics of the Fire Risk Weather Index

The FFMC is calculated based on the water content of the fine fuel in the weather index system. Consequently, the moisture code is the most direct indicator of its water content and is a relatively simple indicator to represent both its flammability and combustibility, with higher values indicating higher fire risk levels. With regard to the formation of fires, in addition to the moisture of the fine fuel reaching combustible and flammable conditions, the wind speed shall determine whether it can spread to form a large fire. Hence, the ISI calculated based on FFMC and wind speed jointly can be a better representation of the daily fire risk. This research has selected 2019 and 2020 as representative years and selected Hebei Weichang Station (54311), Beijing Mentougou Station (54505), and Shanxi Qinyuan Station (53875) as the representative meteorological stations to analyze the changing characteristics of FFMC and ISI. The results, as shown in Figure 6 and Figure 7, are summarized as follows:
Firstly, FFMC fluctuates considerably more frequently during the year, particularly in summer, and the frequency is closely related to the number of effective precipitation days in that year. Furthermore, FFMC values decrease significantly on rainfall days followed by a rapid rebound as soon as the rainfall ends, demonstrating the rapid response characteristics of the fine fuel moisture to precipitation wetting and evaporation drying processes. Secondly, the FFMC values are close to around 90 for most of the year, with values above 90 occurring in every season, meaning that there are still periods when the dead fuel remains combustible and flammable during the rainy season in summer and autumn. Finally, the most frequent occurrence of FFMC values greater than 90 on multiple consecutive days appears in spring, and its highest values in the year occur from March to May, which is the 90 to 150-day sequence in the graph. The ISI is similar to the FFMC in that both are characterized by high-frequency variation throughout the year, with large numerical changes that are influenced by wind speed as well as by precipitation. The above characteristics illustrate that there is a large variation in daily fire risk during the annual winter and spring fire season, meaning that there are priority and non-priority dates for fire prevention.The ISI better reflects the trend in fire risk over the course of the year, although it can vary depending on the year, the ISI is significantly higher from March to May and significantly lower in July to early August each year than in other months.
By combining the above analysis of variations for both FFMC and ISI, it can be concluded that the occurrence of fire is characterized by high-frequency and significant fluctuating changes in daily variation due to its dependence on the moisture content of combustibles and weather conditions, that is, the risk level of a fire is not progressive and slowly changing. A very high fire risk day can change to low risk within a few hours due to rainfall, while after rainfall, the fine fuel can lose moisture so quickly that it can become flammable within a few days and the low-risk level can escalate to high-risk within a short period of time.
As a result, the prediction and analysis of the fire risk weather index enable a precise grasp of fire risk trends in daily fire management, timely monitoring and prediction of high-risk periods and the adoption of effective measures to prevent fires, as well as saving unnecessary control costs during low-risk periods.

3.2.2. Weather Index Characteristics of Fire Starting Days at Fire Points from 2010 to 2017

On the basis of the fire point data and the calculated FFMC and ISI data from 2010 to 2017, this research has extracted the local FFMC and ISI values on the fire starting day for a total of 702 fire points based on the fire starting date and coordinate information of the fire points to create the new statistical sample.
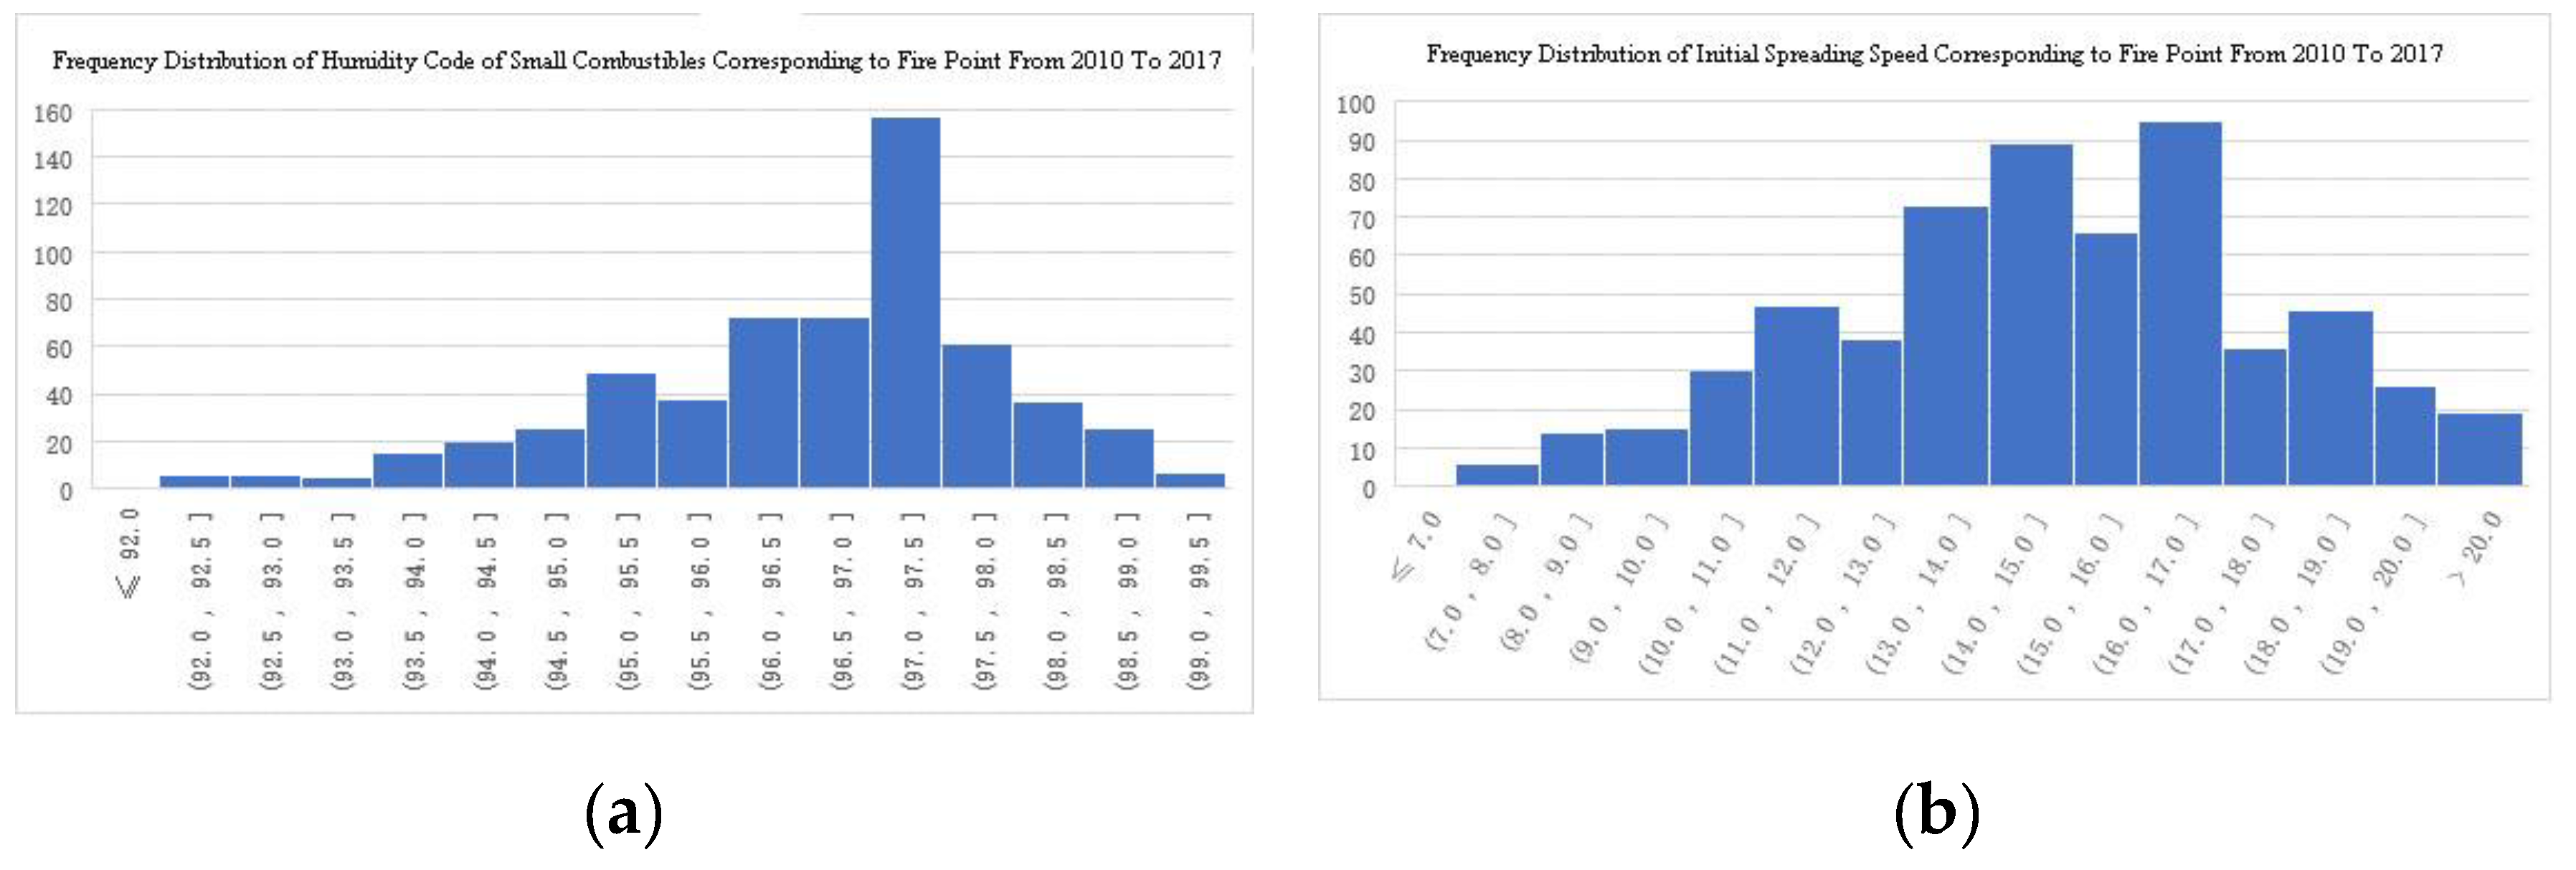
According to the new distribution of FFMC sample statistics (Figure 8a), the FFMC values corresponding to the fire starting day are all above 90, with 90% of the samples ≥ 94.7 and 50% ≥ 96.9. 95% of the samples fell within the range of 93.5 to 99.0, which is the FFMC value corresponding to the vast majority of fires. The highest concentration of samples ranged from 96.0 to 98.0, accounting for 64% and representing the FFMC values for the medium- to high-risk fire range. As for the ISI values on the fire starting day, all except two fire points with sample values of 5.2 and 6.3 are greater than 7.0. The highest concentration of samples is in the 13.0 to 17.0 value range, accounting for 49.4% of the sample (Figure 8b).
The above probability distribution characteristics of the weather index on the fire starting day also illustrate the applicability of FFMC and ISI to fire risk analysis in the Beijing-Tianjin-Hebei-Shanxi region. This allows a preliminary judgment to be made that when FFMC values reach above 94 and ISI values are greater than 10.0, the risk of fire occurrence is high; when FFMC values reach above 96 and ISI values are greater than 13.0, the risk of fire occurrence is very high. Moreover, due to the wide latitudinal span of the Beijing-Tianjin-Hebei-Shanxi region and the slight differences in climate in each area, it is appropriate to make a detailed classification and threshold determination based on specific climatic and weather index characteristics.

3.2.3. ISI Frequency Characteristics in Priority Areas
Fire risk classification and timely early warning are vital in daily fire prevention management and the classification needs to be based on the probability of a fire occurring and the difficulty of extinguishing it once it has started. In reference to the outcomes of the above analysis, ISI is a comprehensive characterization of both ignition and spreading risks compared to the degree of flammability and combustibility of superficial combustibles on the ground represented by FFMC, and therefore it is more applicable to the indication of comprehensive fire risks. Consequently, the following research presents the probability distribution analysis of ISI for priority analysis stations in the Beijing-Tianjin-Hebei-Shanxi region and provides the methodology for classifying the risk level of each station.
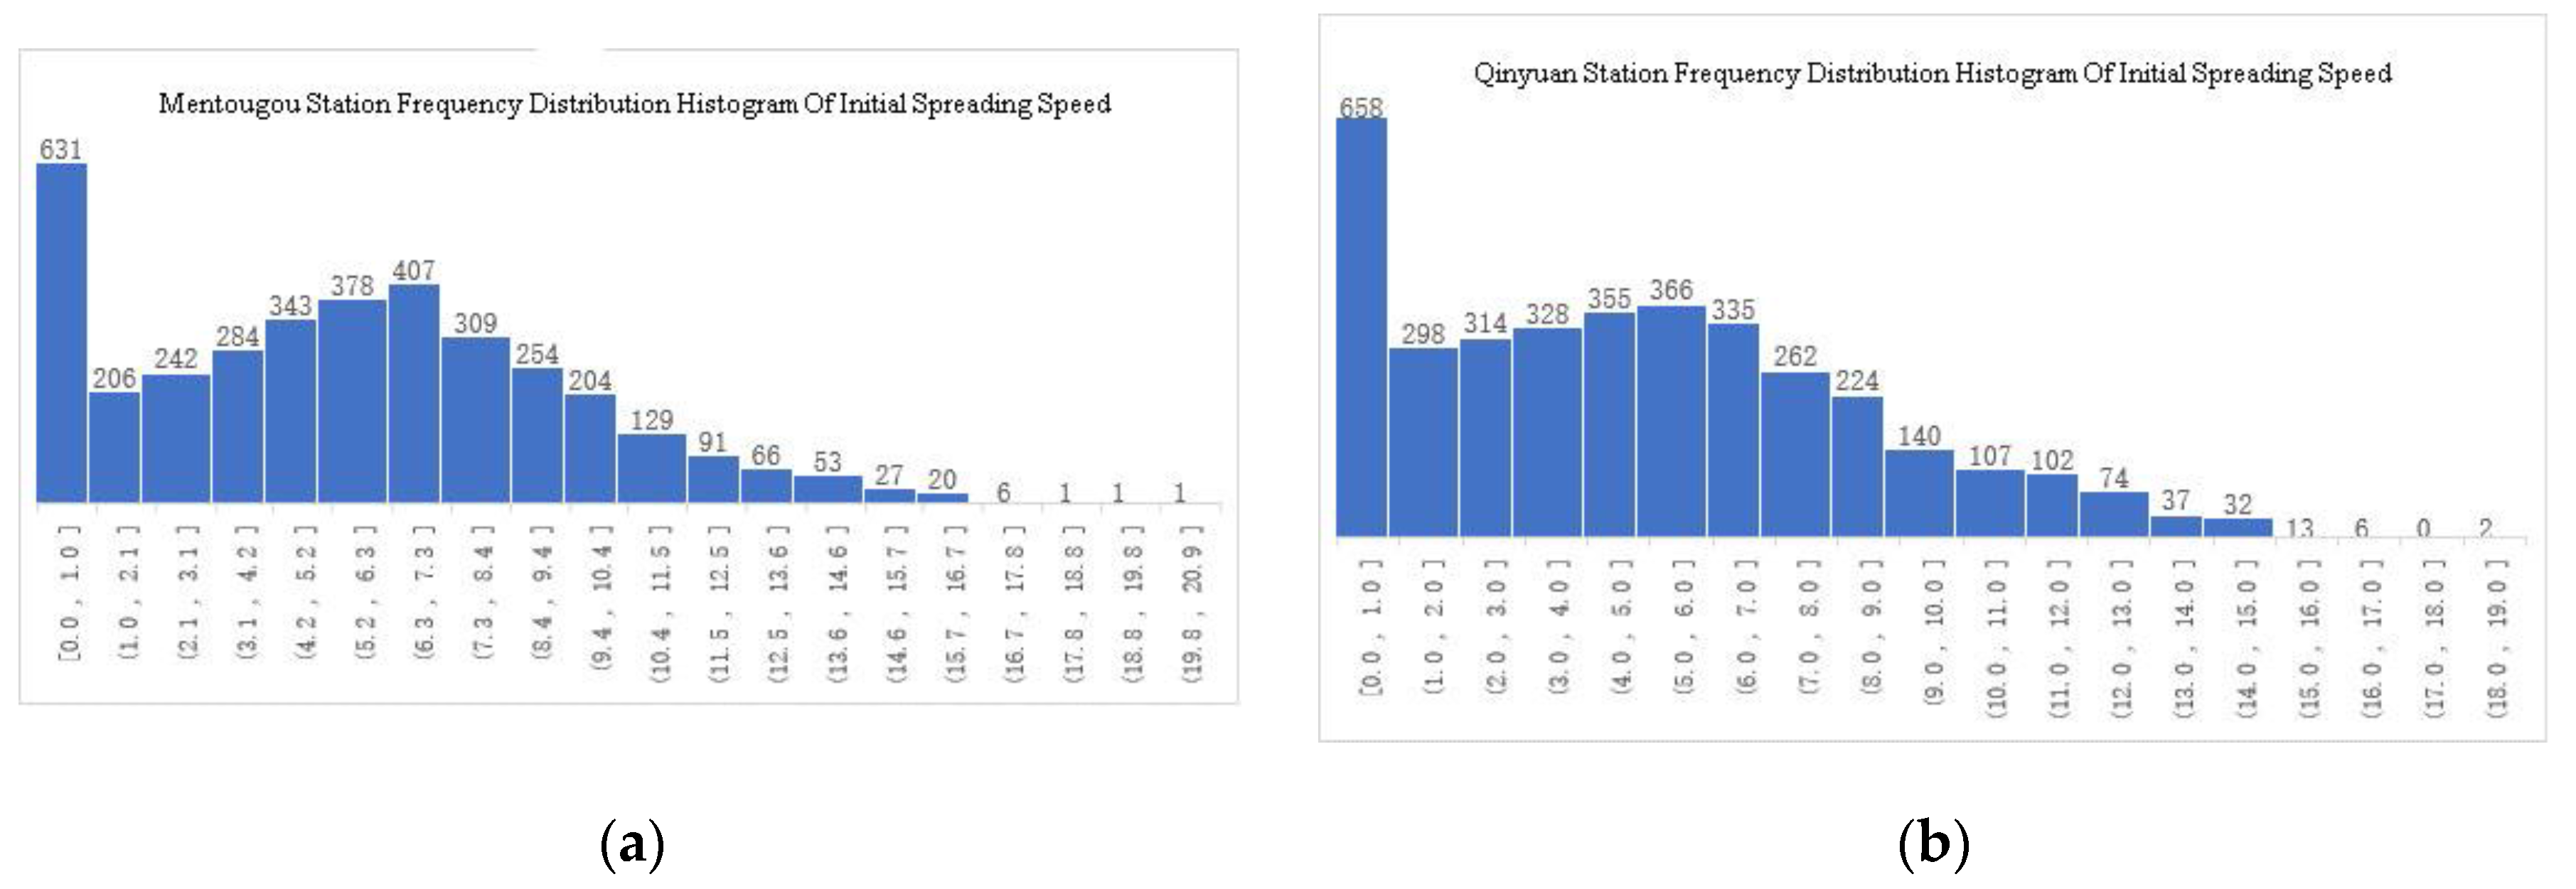
There are many rainfall days each year that make it difficult or impossible for combustibles to ignite, at which point the corresponding ISI is 0 or less than 1. For this reason, this part of the sample representing no fire risk has been removed from the statistics, and the remaining samples exhibit skewed distribution characteristics. Taking Mentougou Station (54505) and Qinyuan Station (53875) as examples, there are over 60 days per year on average with no fire risk status (Figures 9a,b).
Figure 9. (a)Histogram of ISI frequency distribution at Mentougou Station (54505).(b) Histogram of ISI frequency distribution at Qinyuan Station (53875).
Preprints 79985 g009
The remaining samples are classified as low risk, medium risk, high risk, and very high risk according to the conventional classification method. Considering the characteristics of the fire risk period in the Beijing-Tianjin-Hebei-Shanxi region, a 50% probability is set for the low risk class, 30% for the medium risk class, 15% for the high risk class, and 5% for the very high risk class. According to the statistics, Table 4 presents the classification thresholds for each priority analysis station. The analysis of thresholds coincides with the analysis of ISI values corresponding to the fire starting day of the fire points, where most stations have ISI values below 5 as low risk and above 10 as high or very high risk. On the basis of the threshold levels given in Table 4, ISI can be applied to forest fire risk level forecasting in the Beijing-Tianjin-Hebei-Shanxi region.
The above analysis of thresholds coincides with the analysis of ISI values corresponding to the fire starting day of the fire points, where most stations have ISI values below 5 as low risk and above 10 as high or very high risk. On the basis of the threshold levels given in the above table, ISI can be applied to forest fire risk level forecasting in the Beijing-Tianjin-Hebei-Shanxi region.

3.2.4. Typical Fire Weather Index Analysis

Following the characterization analysis and classification of application levels of the fire risk weather index in the previous section, this section presents the pre-disaster as well as in-disaster fire risk weather characteristics analysis of four typical fires in the Beijing-Tianjin-Hebei-Shanxi region in recent years by using FFMC and ISI in the weather index system. The four typical fires were the forest fire in Nanshi Village, Qinhe Township, Qinyuan County on 14 March 2019, Wangtao Township, Qinyuan County on 30 March 2019, Pinggu and Miyun District on 30 March 2019, and Shecheng Township, Yushe County on 17 March 2020.
Forest Fire in Qinyuan on 14 March 2019
On 14 March 2019 at 3 pm, a forest fire occurred in Nanshi Village, Qinhe Town, Qinyuan County, Shanxi Province. Ground rescue forces of more than 2000 local people in Qinyuan County were deployed to fight the fire. During the fire-fighting process, a sudden change in wind direction led to seven forest firefighters being trapped in the fire, of whom one was slightly injured and six unfortunately sacrificed after an ineffective rescue attempt. Most of the six firefighters who died were born after the 1990s, and one of them was only 19 years old. We would like to pay tribute to the memory of the deceased.
A meteorological station, the Qinyuan Station (53875), was located in the vicinity of the fire, which was in close proximity to the fire. No precipitation was recorded at the station during the previous fifteen days of the fire, while there were some fluctuations in temperature (Figure 10a), with a maximum temperature of 16°C on 5 March, followed by a maximum temperature of 13.7°C on the day that the fire started (14 March) and 13.3°C at the moment of the fire.
The relative air moisture level was generally decreasing, with a minimum daily relative moisture of 24% on 8 March, compared to 9% on the fire starting day, meaning that the air was extremely dry. The wind speed was relatively high for the fifteen days prior to the fire(Figure 10b), especially on the fire starting day when the maximum hourly average wind speed reached 6.3 m/s, while the wind speed was 5.3 m/s at the time when the fire started, that is, at 3 pm on 14 March. On the fire starting day, the temperature, relative moisture and wind speed provided favorable conditions for the rapid spread of the fire.
Figure 10. Trends in meteorological elements before and during the Qinyuan fire (14 March).
Preprints 79985 g010
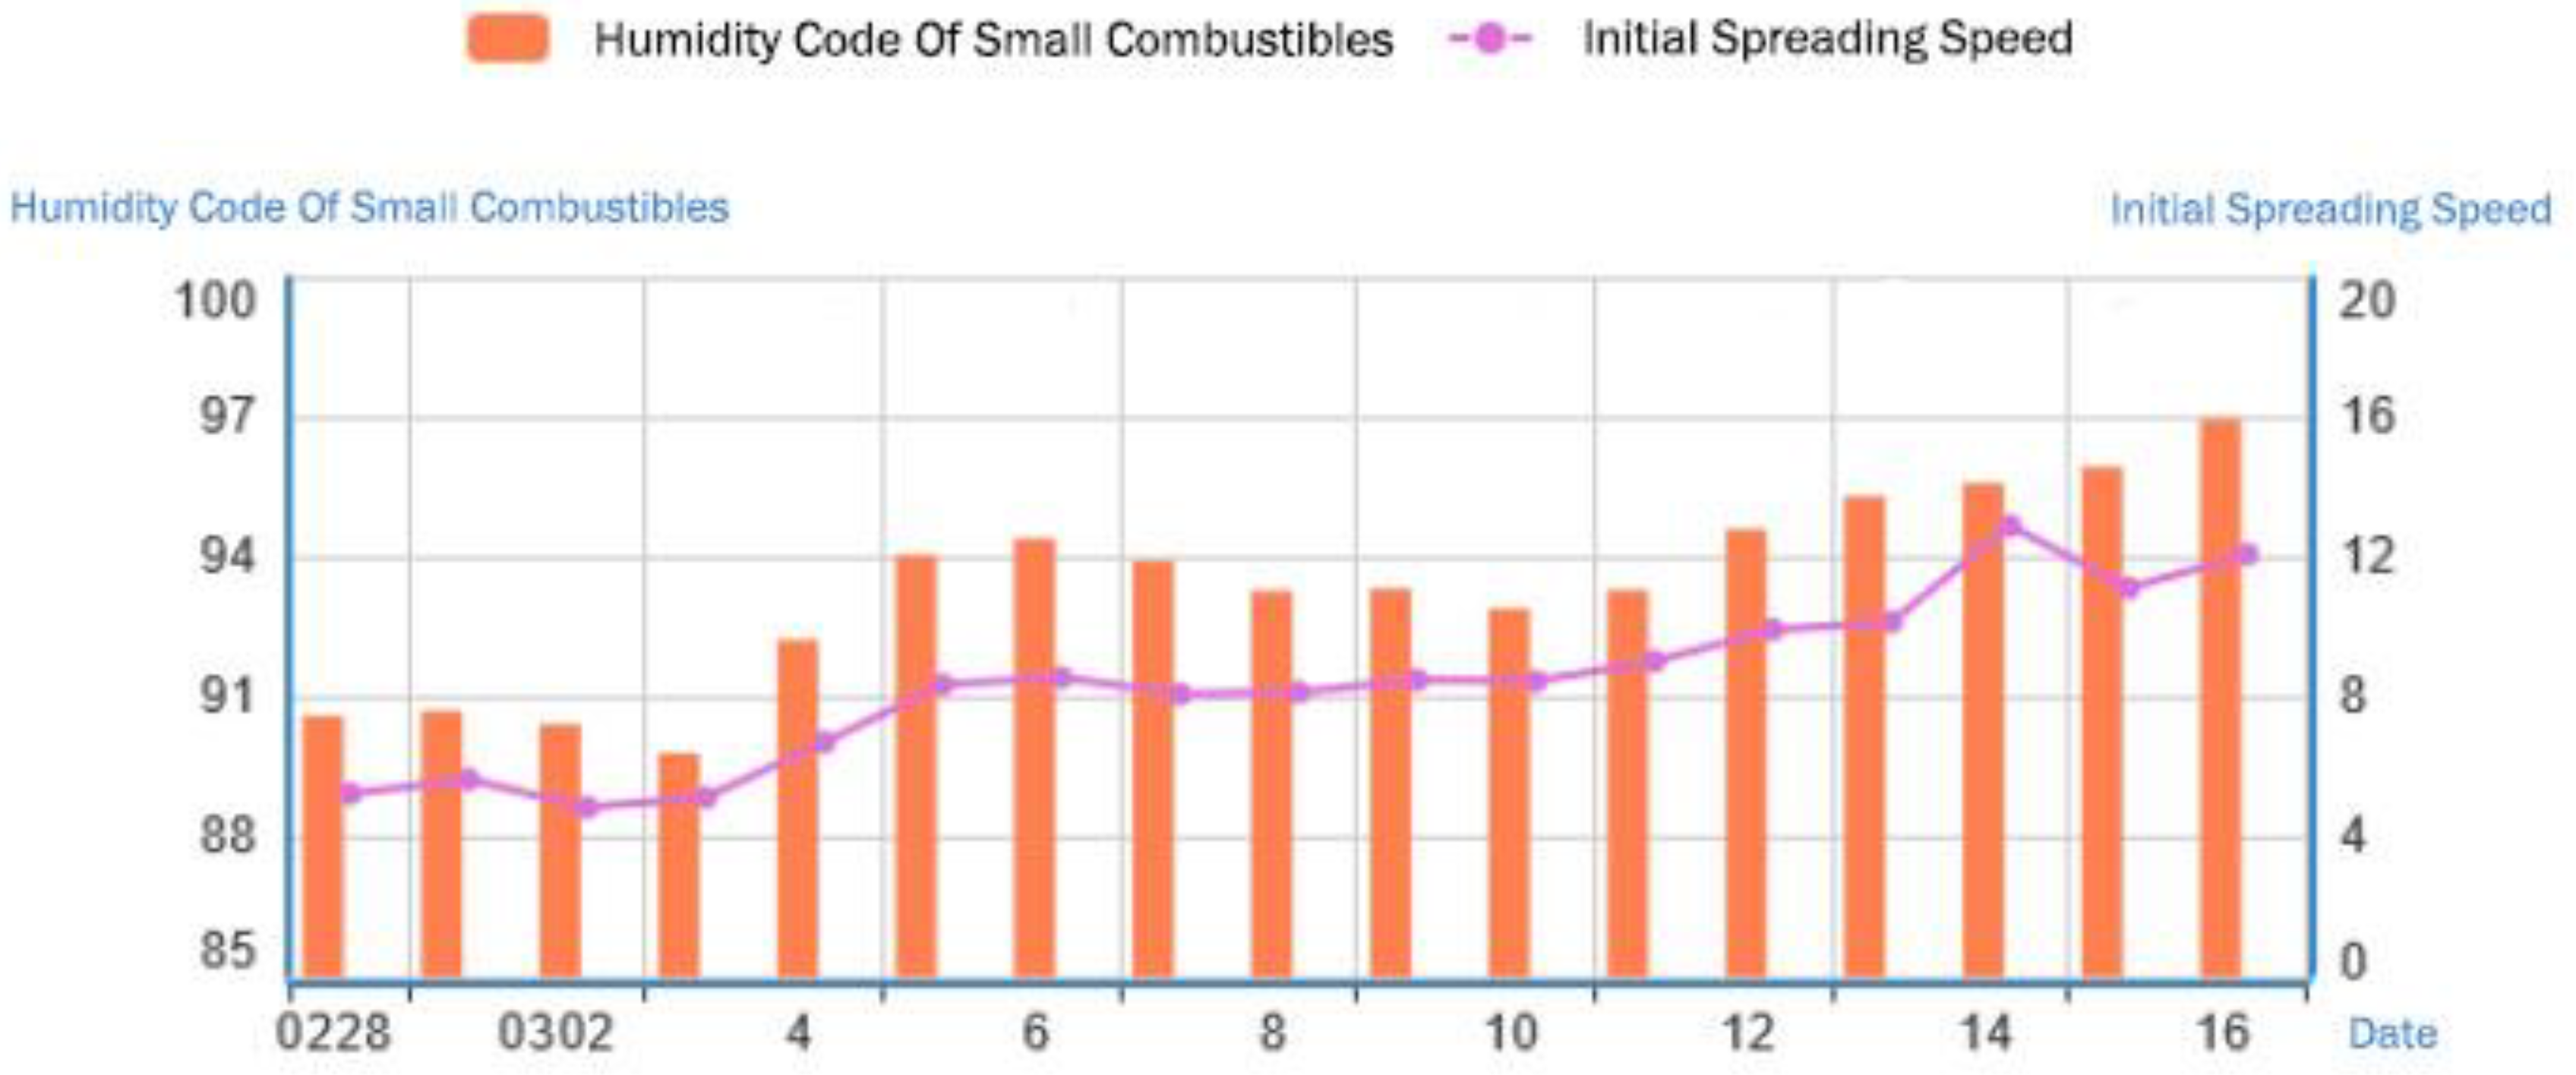
As can be observed from the FFMC and ISI in the fire risk weather index (Figure 11), the fire risk level in the Qingyuan area has gradually increased since March and remained very high after March 5. From 3 to 6 March, the temperature rebounded, the air moisture dropped and the water content of combustibles decreased rapidly, with the FFMC reaching 95.8 on 6 March and the ISI reaching 11.5. On 7 and 8 March, due to the increase in the air moisture and the drop in temperature, the water content of combustibles increased marginally. The FFMC has maintained a continuous increase since 9 March. The FFMC reached 95.9 and the ISI reached 13.8 on the fire starting day (14 March), which is in a relatively extreme high fire risk condition.
Forest Fire in Qinyuan on 30 March 2019
The forest firefighting in Qinyuan on 30 March was one of the top ten typical cases of national emergency rescue in 2019. At 13:00 on 29 March 2019, the forest fire in Wangtao Village, Wangtao Township, Qinyuan County, Shanxi Province, was sparked by a collision of overhead aluminum stranded wires in a chicken farm, which eventually led to a damaged forest area of about 942 hectares, with the fire spreading in a way that threatened 39 administrative villages and 51 natural villages in six nearby townships, as well as 18 industrial and mining enterprises with more than 20000 people.
During the firefighting process, a total of 15000 people, including forest firefighters, urban firefighters, the People’s Liberation Army, armed police officers, and professional firefighting teams, as well as more than 280 units of firefighting vehicles, excavators and other large machinery were deployed from the ground forces. In terms of air rescue forces, a total of 14 aircraft were mobilized. More than 9000 people from affected villages and townships were relocated during the firefighting, and various technical means of firefighting such as chemical, aviation, engineering, and manual work were implemented. Eventually, after seven days of uninterrupted fighting, the open fire was all put out at 10:00 on 5 April.
The meteorological station closer to the fire was the Qinyuan Station (53875), where no effective precipitation was observed in the fifteen days prior to the occurrence of the fire, and there were wide fluctuations in temperature, moisture and wind speed (Figure 12a). The temperature on March 26 was slightly higher than 18°C and on March 29 was slightly lower than 12°C.. From 21 to 27 March, the air was very dry for several consecutive days, with a daily minimum relative moisture on March 26 was higher than 5%. The daily minimum relative air moisture on March 30 (fire incident) was higher than 13%.The wind was gusty on 19, 28 and 29 March, with a daily maximum hourly average wind speed of 6.6m/s on the day when the fire started(Figure 12b).
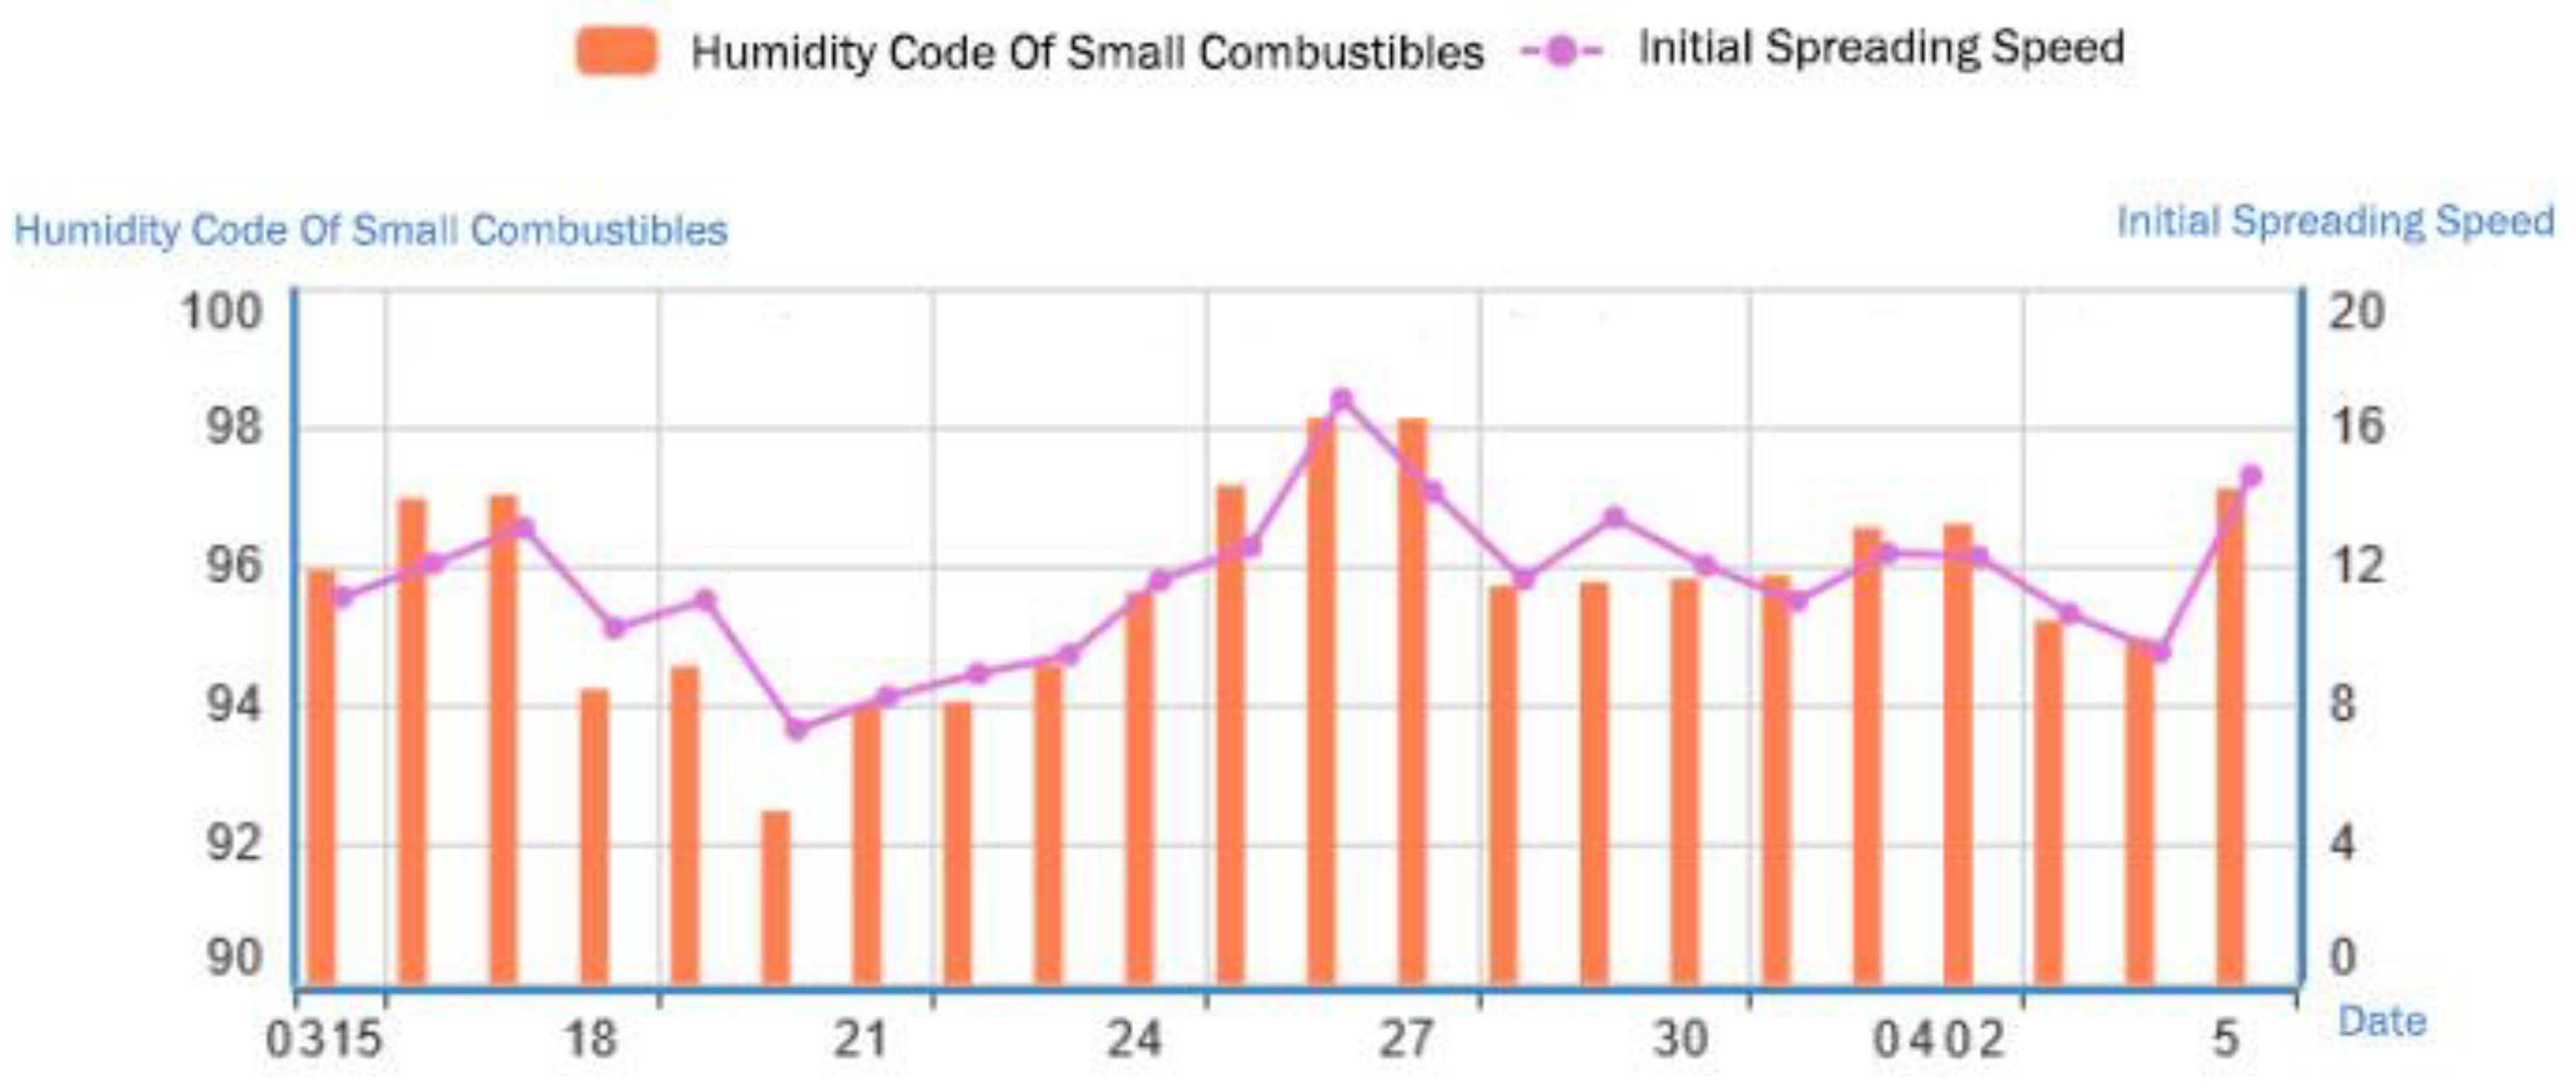
As can be observed from the FFMC and ISI prior to the fire (Figure 13), the FFMC was above 92 during the fifteen days prior to the fire, placing it above the high fire risk level. Affected by the relative moisture of the air, the combustible moisture increased slightly from 16 to 20 March and the ISI decreased. However, from 21 March onwards, temperatures rebounded rapidly, with the relative moisture of the air remaining extremely low, the moisture of combustibles decreased quickly and the fire risk level continued to rise. On 26 March, the FFMC reached an extreme level of 98.2 with the ISI reaching 16. On the day when the fire started (29 March), the FFMC was 95.8 with the ISI reaching 13.5 and remained at this level for the next four days, making combustibles dry and flammable and not conducive to fire fighting.
From the above analysis, and combined with the distribution frequency of the weather indices at the Qinyuan Station, the Qinyuan area has reached a very high fire risk level on 24 March and the day when the fire started should be in the red fire risk level period.
Forest Fire in Pinggu and Miyun District on 30 March 2019
At around 12:00 on 30 March 2019, a hill fire occurred in the south of the village of Gaogezhuang, East Shaoqu Town, Miyun District, Beijing. Six villagers, including Zheng, were repairing a water pipe in a woodland in Gaogezhuang Village when they accidentally set the weeds on fire and triggered a hill fire, which caused the fire line to spread rapidly to the direction of North Jishan Village, Liujiadian Town, Pinggu District due to the high wind speed on that day. About 3000 personnel and over 500 forest firefighters, including over 150 from the mobile detachment of Forest Fire Control Bureau of the State Ministry of Emergency Management and over 350 from the Jilin Forest Fire Brigade based in Tangshan, were involved in the rescue. In addition, more than 400 people from 19 teams from various districts and counties in Beijing, Hebei and Tianjin, and more than 2000 people from local troops and militia emergency units also participated in the firefighting. By the morning of 31 March, all open fires were put out, with an area of about 0.43 km2 of forest damage and no casualties (https://baijiahao.baidu.com/s?id=1629435982617314632&wfr=spider&for=pc&searchword=2019%E5%B9%B43%E6%9C%8830%E6%97%A5%E5%AF%86%E4%BA%91%E7%81%AB%E7%81%BE).
According to the meteorological stations close to the fire, Miyun Station (54416) and Pinggu Station (54424), there was 1mm of precipitation in Miyun on 20 March and 1.9mm in Pinggu in the fifteen days before the fire, while there was no precipitation on the other days.
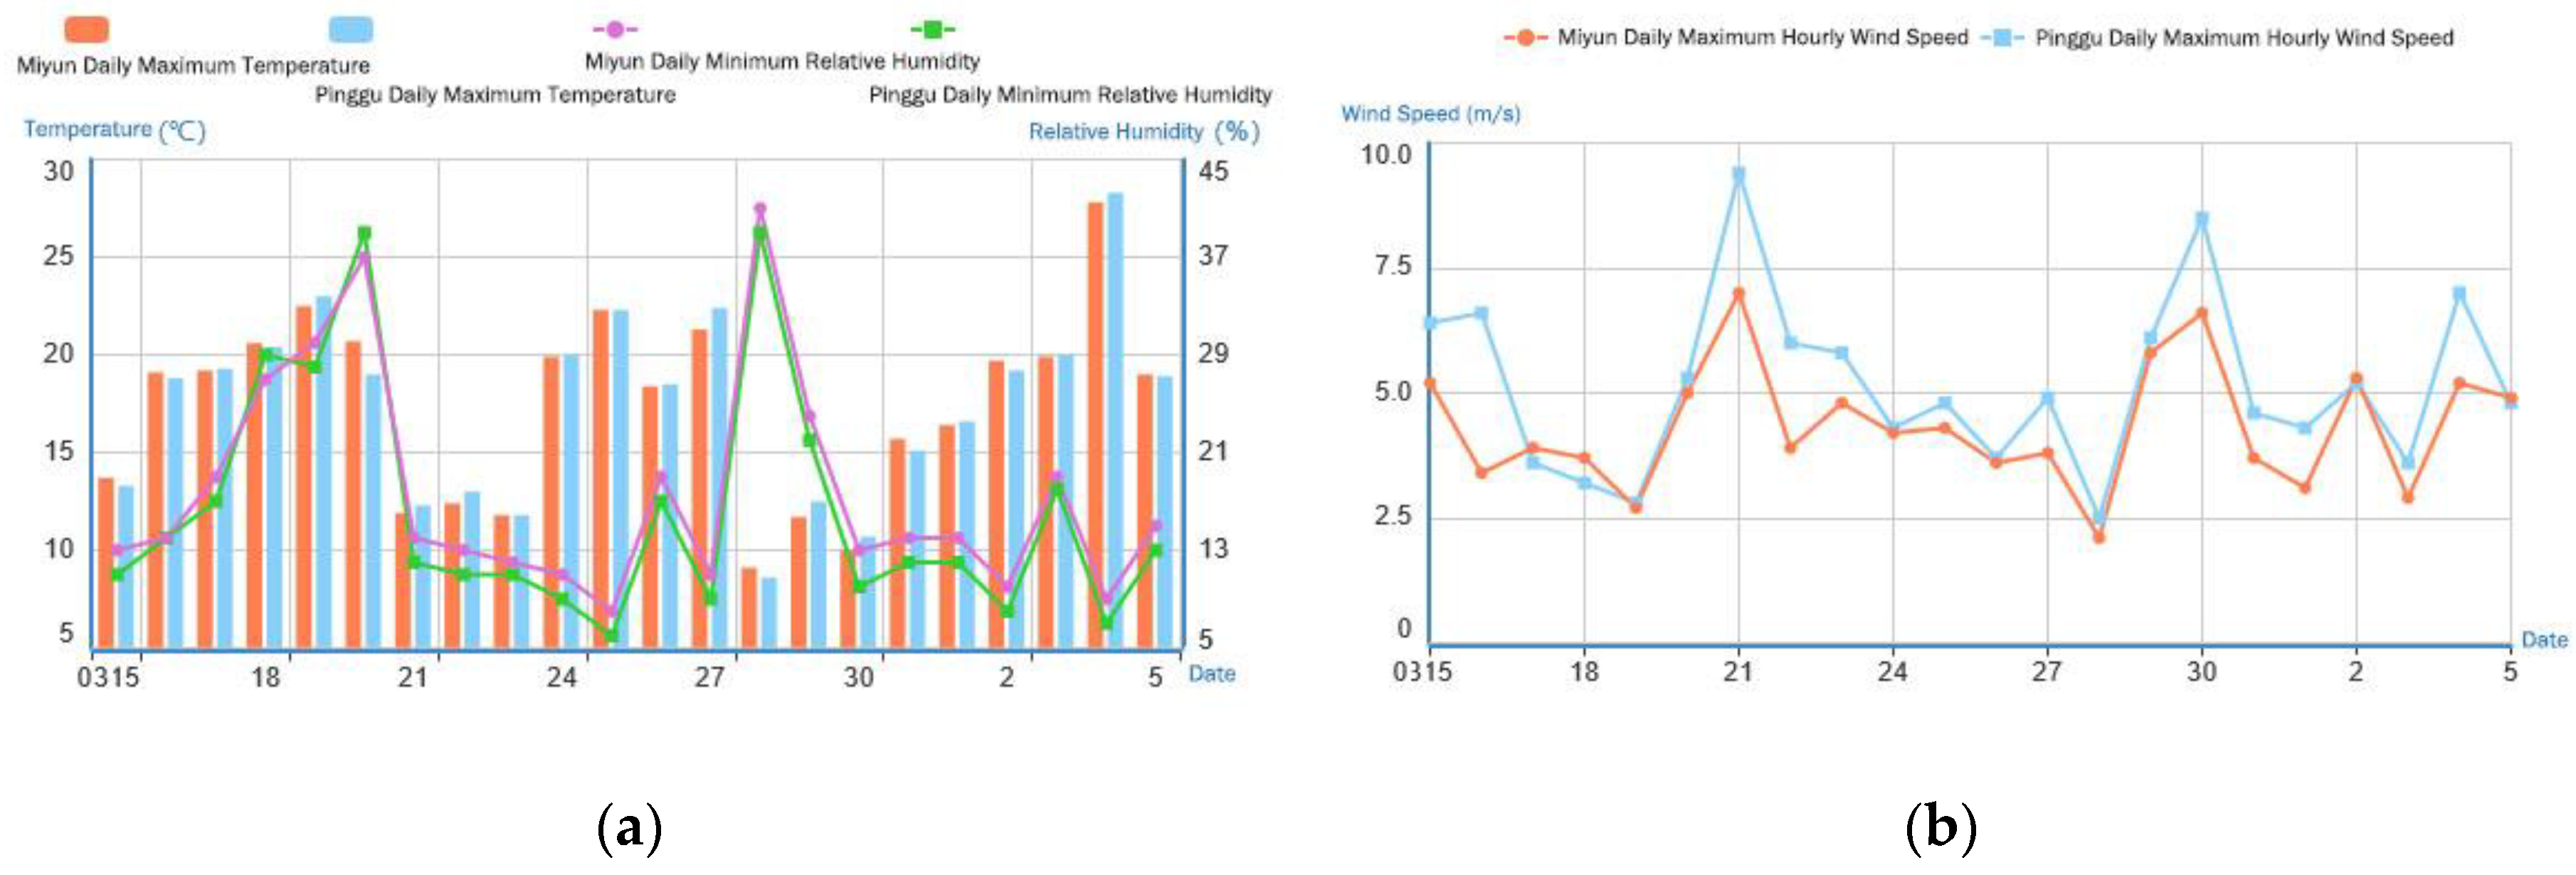
In terms of temperature, there was a large variation in temperature prior to the fire (Figure 14), which, combined with the variation in wind speed, indicates that there were two significant wind and cooling processes, with daily maximum temperatures reaching 23°C and 22.5°C in Pinggu and Miyun respectively on 18 March, compared to 8.6°C in Pinggu and 9.1°C in Miyun on 28 March. At the moment of the fire starting at 12:00 on 30 March, the temperature in Pinggu was 9.1°C and 8.4°C in Miyun.
Both the relative moisture and wind speed were also affected by the two weather processes, with the maximum hourly average wind speed of 8.5m/s in Pinggu and 6.6 m/s in Miyun on the day when the fire started, and the minimum relative moisture of 10% in Pinggu and 13% in Miyun. At 12:00 on 30 March, the time when the fire started, the hourly average wind speed was 7.5 m/s in Pinggu and 4.3 m/s in Miyun, and the relative moisture was 14% in Pinggu and 17% in Miyun. The above-mentioned conditions of moisture and wind speed were very conducive to the spread of the fire and created a tremendous challenge for the firefighting and rescue work.
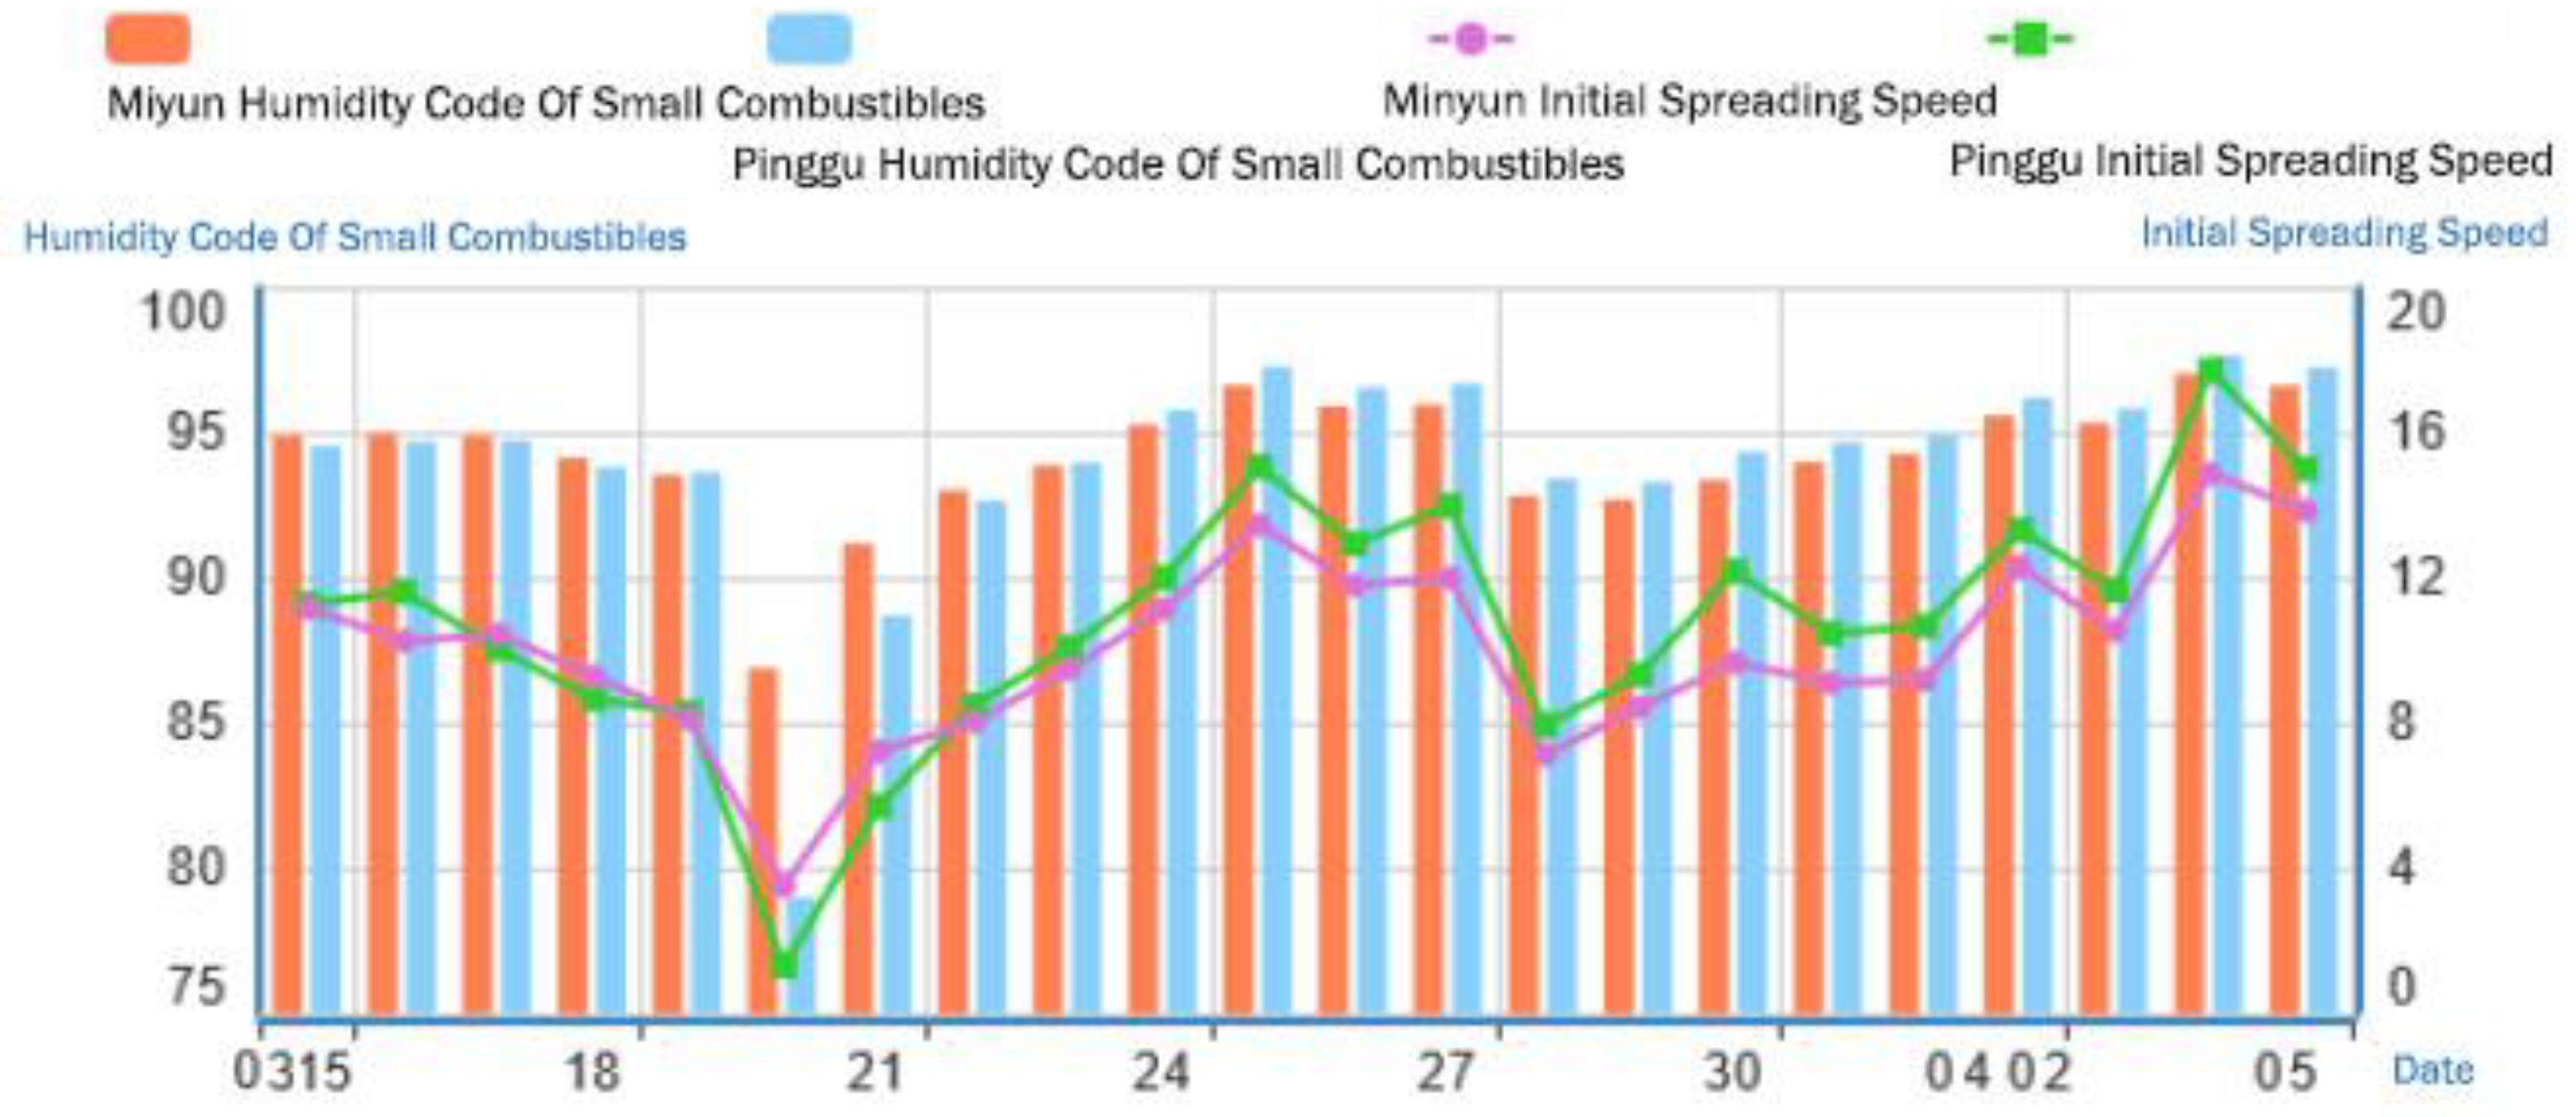
Both FFMC and ISI (Figure 15) provide a comprehensive view of the change in risk before and after the fire. In particular, influenced by precipitation, the FFMC in both areas was below 90 on 20 March and the fire risk level dropped to low risk. After 21 March, as temperatures rebounded and air moisture levels continued to be low, the water content of combustibles dropped rapidly and the FFMC in both districts exceeded 96 on 25 March, and the ISI also exceeded 13, making it a very high fire risk level. Despite the increase in relative moisture and drop in temperature on 28 March, the moisture content of combustibles rebounded more slowly and the FFMC remained above 93. On the day when the fire started, the FFMC was 94.4 in Pinggu and 93.4 in Miyun, while the ISI was 12.2 in Pinggu and 9.7 in Miyun.
Forest Fire in Yushe on 17 March 2020
At 11:00 on 17 March 2020, a fire occurred in the west of Jiao Hongsi Village, Shecheng Town, Yushe County, Shanxi Province. The location of the fire was in the mountainous area at the junction of Yushe County, Heshun County, Taigu County and Yuci County, with complicated terrain, several cliffs, and dense vegetation. A total of 1400 people, including Inner Mongolia forest firefighters, Jilin forest firefighters and Gansu forest firefighters, 1666 people from the Shanxi Armed Police Force, 1126 people from the Militia Emergency Response Unit, 726 people from professional firefighting teams in Shanxi Province, and about 2000 local cadres and residents, were put in to fight the fire on the ground. A total of five helicopters and six fixed-wing aircraft were put into the air rescue force. During the rescue process, 121 villagers were evacuated and properly housed. The firefighting process took seven days in total, and by 7:00 on 24 March 2020, all open fires were put out and entered the stage of cleaning and guarding the area.
According to the meteorological station closer to the fire, Yushe Station (53787), which recorded 0.1mm and 0.2mm of precipitation on 8 March and 9 March respectively in the fifteen days before the fire, it was difficult to effectively mitigate the fire danger with the trace amount of precipitation. On the last day of the fire rescue, 24 March, there was 3.9 mm of precipitation, which effectively contributed to putting out the open fire and clearing the fire area.
Temperatures in the Yushe area fluctuated over the fifteen days prior to the fire but showed an overall upward trend (Figure 16). The daily maximum temperature on the day when the fire started reached 19.4°C and remained high for several days afterwards. The relative air moisture level was the opposite of the temperature trend, with the daily minimum relative moisture level remaining high at the beginning of the month, with a corresponding average of 27.4% from 2 to 8 March, but dropping rapidly from 9 March to only 8% on the day when the fire started. In terms of wind speed, the hourly average wind speed at midday on the day when the fire started reached 5.2m/s and the maximum hourly average wind speed on 18 March was 12.1m/s, reaching a force 6 wind level, making it extremely difficult for fire fighting and rescue.
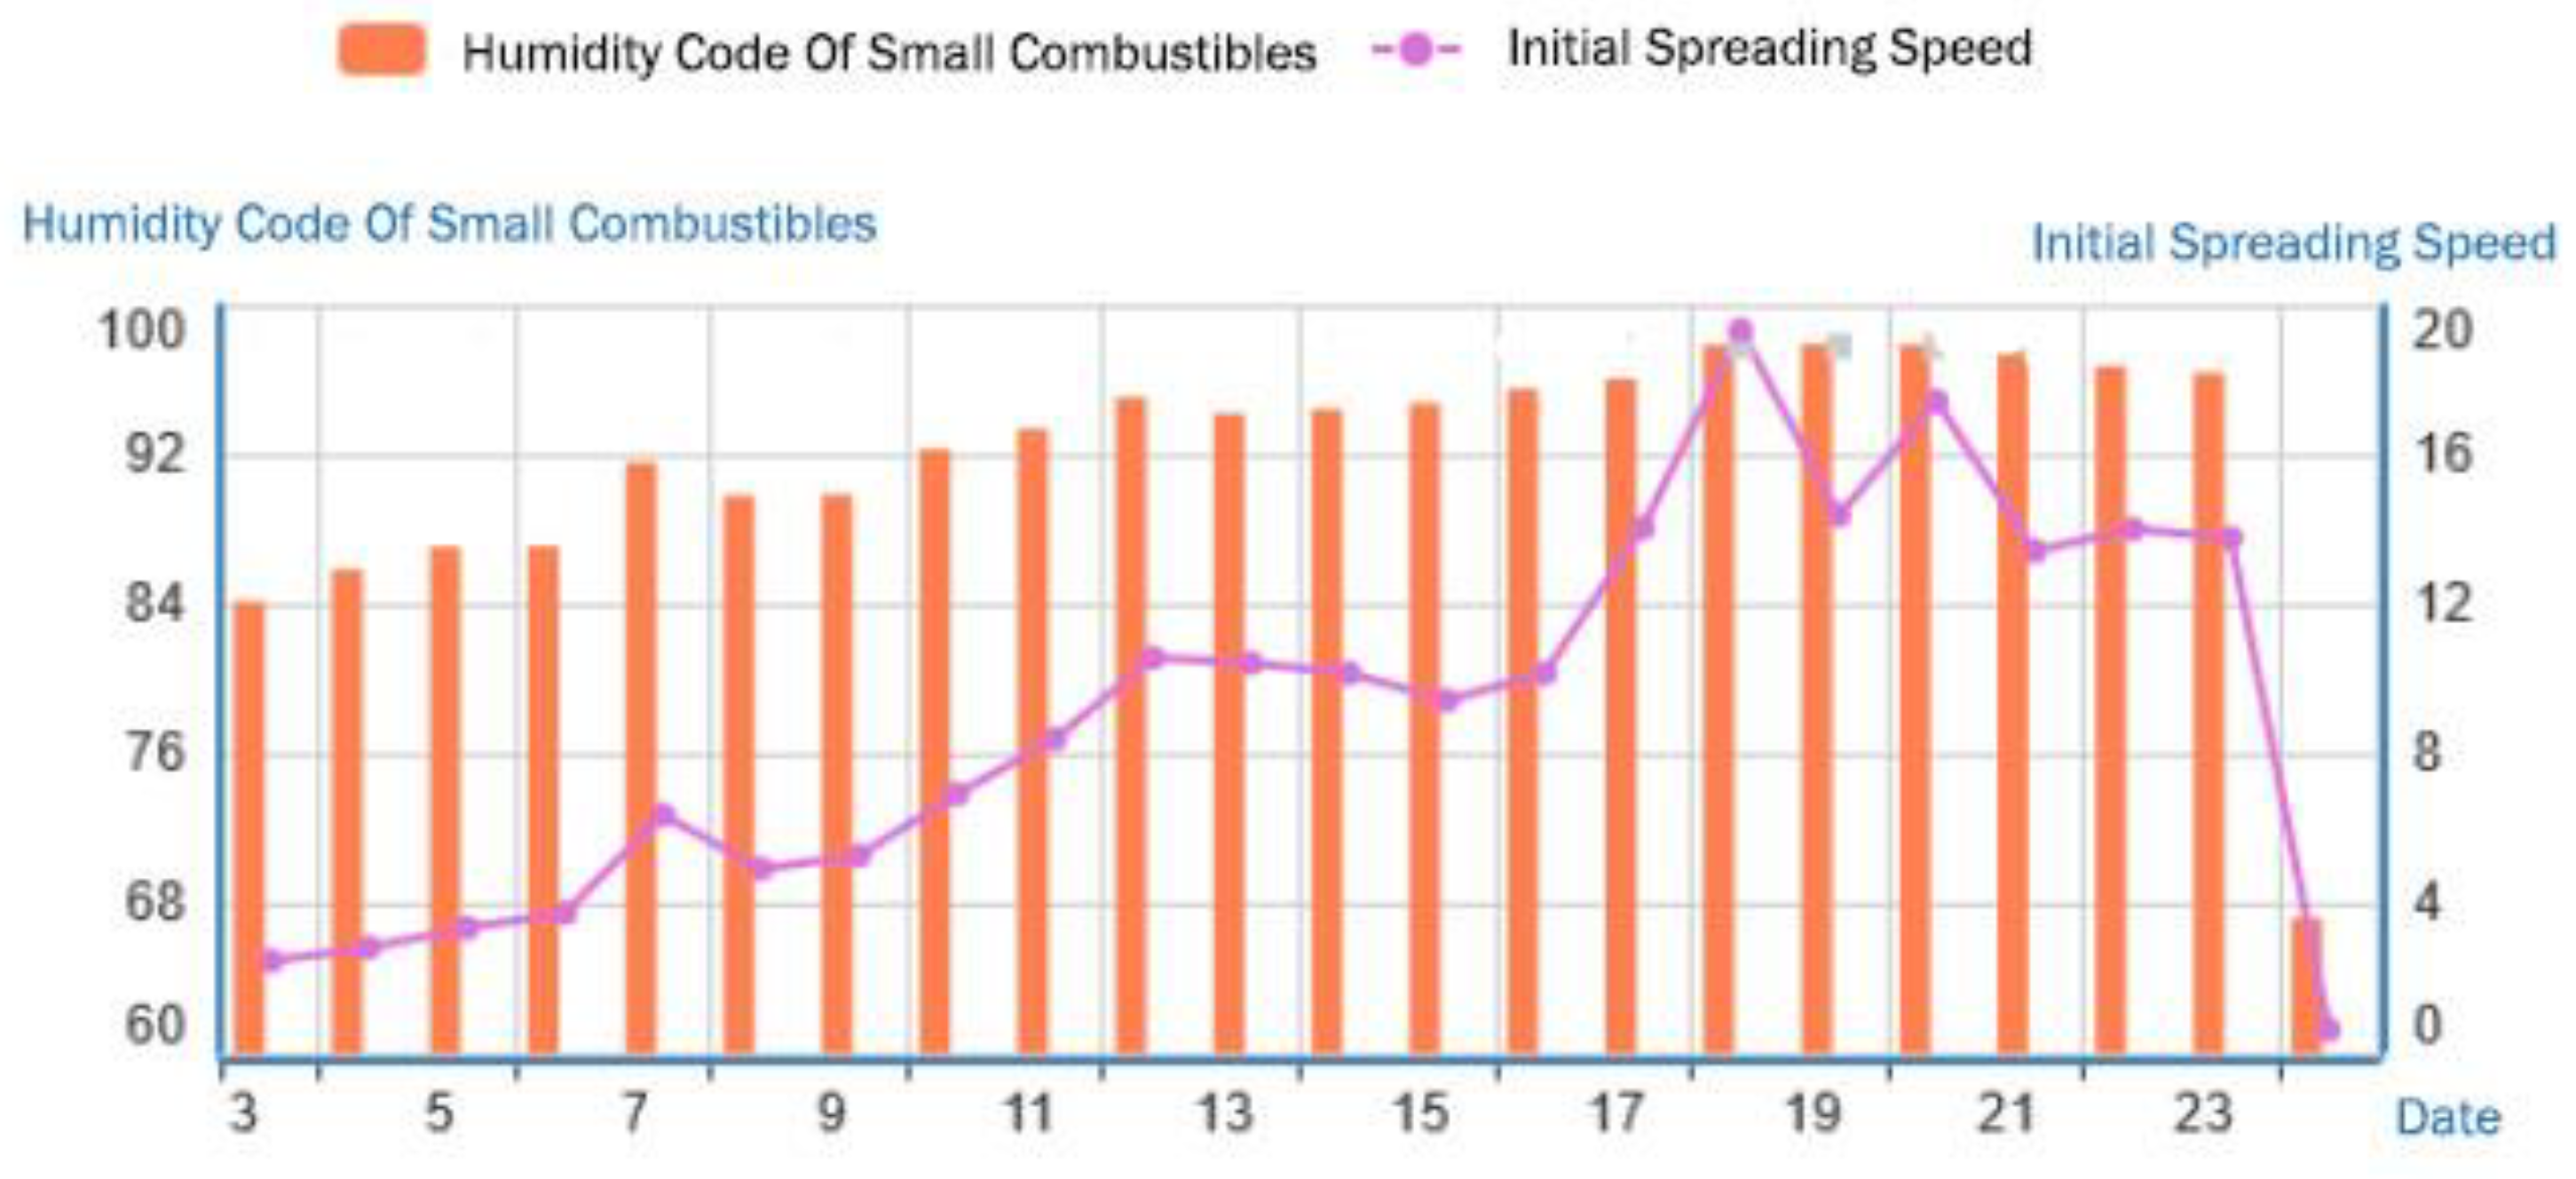
In terms of the weather indices (Figure 17), the FFMC rose continuously from 84.2 at the beginning of the month to a very high level of 96.7 on the day when the fire started, while the ISI rose from 2.5 at the beginning of the month to 14.1 on the day when the fire started, which was a very high fire risk level, and remained high for the next 6 days, indicating that the weather conditions and the water content of combustibles after the fire started were very conducive to the spread of the fire. By 24 March, with 3.9mm of precipitation on that day, the moisture content of combustibles rose rapidly and the FFMC decreased to 65, reaching a difficult-to-ignite level, with a consequent decrease in ISI to 0.6, to a difficult-to-spread level, and the fire risk level turned to low risk.
With the significant losses, long duration and negative social impacts, these four fires are very typical forest and grassland fire events, which are of great analytical and research significance. This chapter provides a preliminary review of the meteorological conditions and fire risk indices before and during the four fires as well as a brief analysis of the weather factors of the fires [26].
On balance, the FFMC values on the day when the above four fires started were 94, 95.8, 96.7 and 95.9, respectively, with ISI values of 12, 13.5, 13.8 and 14, respectively, all of which are high or very high risk levels. It can be concluded that in daily fire prevention management, it is important to take the weather indices as reference to timely issue high level fire risk warnings and take fire source control measures.

4. Discussion

This research has combined the satellite data (fire points) with well-established meteorological fire risk indices (FFMC and ISI) to conclude and verify the fire risk classification of each index and establish a method to identify dynamically high fire risk periods for the Beijing-Tianjin-Hebei-Shanxi region. The results show that this method can accurately reflect the characteristics of forest fire in the Beijing-Tianjin-Hebei-Shanxi region. It can provide technical support for forest fire monitoring. however, there are still some problems. First of all, the national meteorological stations were selected as the reference for fire risk climate. but the meteorological stations are not forest stations, and the values of the elements observed by them are different from the actual values in the forest area, and there is a certain error in the calculation of the weather index. Moreover, the spatial distribution of national meteorological stations is uneven and sparse, making it difficult to detect the climatic characteristics of many small areas. Secondly, the winter and spring precipitation in the Beijing-Tianjin-Hebei-Shanxi region involves not only rainfall but also snowfall, and the frequency of snowfall is higher at high latitudes and high altitudes, while there are differences in the influencing mechanisms of rainfall and snowfall on the moisture content of combustibles. However, this research has not yet analyzed the snowfall. An in-depth research on snowfall, snow accumulation and snowmelt processes, and the mechanism of their impact on fire risk, which will be incorporated into the calculation model of the fire risk weather index, will be of great practical significance for fire risk management in the Beijing-Tianjin-Hebei- Shanxi region in the future.

5. Conclusions

The pressure on forest fire risk management in the Beijing-Tianjin-Hebei-Shanxi region originates from three major sources: firstly, the increase in ecological protection and ecological restoration of woodland resources leads to an increase in the load of the combustible under the forest; secondly, the typical climatic characteristics of the region lead to a longer fire risk period; thirdly, with the development of mountain tourism and rural revitalization, the amount of human activities in the shallow mountain areas of the Taihang Mountains and Yanshan Mountains has increased, together with the rise of activities such as self-drive tours, off-roading and camping, more tourists have emerged to move deeper into the mountains and the risk of man-made fire sources has grown. The results of the analysis are summarized as follows:
(1)
Historically, the Beijing-Tianjin-Hebei-Shanxi region has a high frequency of fires, which means that it is a key area for fire prevention and should be strengthened with the construction of fire prevention projects in areas with a high density of fire points (Xinzhou, Yangquan, Changzhi, Chengde, Shijiazhuang, Baoding, Qinhuangdao and other cities located in the Taihang Mountains and Yanshan Mountains).
(2)
The winter and spring fire prevention periods in the Beijing-Tianjin-Hebei- Shanxi region are lengthy, while the period from March to May in spring is a priority fire prevention time, during which the fire prevention, emergency and meteorological departments should pay close attention to high risk weather such as drought, wind and high temperatures, to forecast early on weather processes that have a strong impact on fires, and to issue fire risk warning information promptly.
(3)
This research provides a preliminary analysis for the beginning and end of the fire prevention period. There are significant differences in the timing of the beginning and end of fire prevention periods in different areas of the Beijing-Tianjin-Hebei-Shanxi region in different years, which are closely related to the weather of the year. The present research recommends changing the time for the beginning and end of the fire prevention period from a fixed date to a dynamically managed date, according to the comprehensive evaluation of the actual weather conditions of the year and the medium- and long-term fire risk weather index forecasts. For example, if the precipitation is earlier and more frequent in May, the fire prevention period can be ended in advance; or if a drought occurs, with late and less frequent rainfall, and combustibles remain dry and flammable, the fire prevention period can be extended in June.
(4)
The climatic characteristics of the Beijing-Tianjin-Hebei-Shanxi region are highly consistent. In spring, the high temperature, windy and low moisture weather processes are often synchronized and consistent as well, meaning that the areas where high fire risk level weather occurs tend to be relatively large and there is a great risk of concurrent as well as multiple regional fires, putting considerable pressure on fire prevention. Consequently, the allocation of fire prevention resources, especially the deployment of firefighting forces and resources for fire suppression, should take this risk characteristic into account.

Author Contributions

Conceptualization, Methodology, Validation, Formal Analysis, F.L.; Q.C. and D.X; Software, F.L. and Q.C.; supervision, F.L.; Q.C. and D.X; Funding Acquisition, F.L.; Writing— original draft preparation, F.L. and Q.C.; Writing—review and editing, F.L.; Q.C. and D.X; All authors have read and agreed to the published version of the manuscript.

Funding

This research was funded by National Science and Technology Major Project of 578 China’s High Resolution Earth Observation System (grant numbers: 21-Y30B02-9001-19/22).

Institutional Review Board Statement

Not applicable.

Informed Consent Statement

Not applicable.

Data Availability Statement

The data presented in this study are available in Section 2.

Acknowledgments

We thank the editors and two anonymous reviewers for their insightful and constructive comments and suggestions.

Conflicts of Interest

The authors declare no conflict of interest.

Appendix A

Table A1. Statistics on forest fires in the Beijing-Tianjin-Hebei-Shanxi region (2011 to 2014).
Region Year Number of forest fires (times) General fire Large fire Major fire Especially significant fire Total fire area (hectare)
Beijing 2011 3 3       2
Tianjin 5 5       24
Hebei 108 94 13 1   2169
Shanxi 40 18 18 4   6372
Beijing 2012 1 1       3
Tianjin 11 11       46
Hebei 83 73 10     2112
Shanxi 20 10 10     480
Beijing 2013 1   1     6
Tianjin 4 1 3     31
Hebei 52 43 9     422
Shanxi 32 15 17     2145
Beijing 2014 1 1       1
Tianjin 2 2       2
Hebei 93 78 15     1168
Shanxi 10   10     760
Beijing-Tianjin-Hebei-Shanxi region 2011-2014 466 355 106 5 15743

References

  1. Zhou, G.; Lu, Q. Forest grassland fire hazard and disaster situation. In Meteorology & Forest and grassland fires, China Meteorological Press: Beijing, 2009, pp, 4-6.
  2. Restaino, J.C.; Peterson, D.L. Wildfire and fuel treatment effects on forest carbon dynamics in the western United States. For.Ecol.Manage. 2013, 303, 46-60. [CrossRef]
  3. Hu, H.Q.; Wei, S.J.; Sun, L.; Wang, M.Y. Interaction among climate change, fire disturbance and ecosystem carbon cycle. Arid.L.Geography. 2013, 36, 57-75. [CrossRef]
  4. Gomes, V.H.F.; VieiraI, C.G.; Salomão, R.P.; Steege, H. Amazonian tree species threatened by deforestation and climate change. Nat.Clim.Change. 2019, 9, 547-553. [CrossRef]
  5. Chambers, J.Q.; Roberts, D.A. Drought in the Congo Basin. Nature,2014, 509, 36-37. [CrossRef] [PubMed]
  6. Yang. G. Climate Change and Forest Fire Danger: A Case Study of the Greater Khingan Mountainous Area, Heilongjiang Province, China. Heilongjiang Science and Technology Press: Harbin, 2011, pp, 3-5.
  7. Wang, X.; Wang, C.; Zhao, G.; Ding, H.; Yu, M. Research Progress of Forest Fires Spread Trend Forecasting in Heilongjiang Province. Atmosphere. 2022, 13, 2110. [CrossRef]
  8. Wang, M.; Shu, L. Characteristics of forest fire response and trend under the scenarios of climate change in China(In Chinese with English preface), Science Press: Beijing, China, 2015, pp, 18-20.
  9. Di, G.F.; Pappenberger, F.; Wetterhall, F.; Krzeminski, B.; Camia, A.; Libertá, G.; Miguel, J.S. The potential predictability of fire danger provided by numerical weather prediction. J Appl Meteorol Climatol, 2016, 55:2469-2491. [CrossRef]
  10. Yao, T. A study on liability for environmental pollution in Beijing-Tianjin-Hebei Region. Procedia Computer Science. 2022, 214, 859–866. [CrossRef]
  11. Wu, S.; Tian, B.; Gu, S.; Hu, Y. Spatial-temporal Evolution of Ecological Vulnerability in Beijing-Tianjin-Hebei Region Based on PSRM Model[J/OL]. Environ. Sci.(Beijing, China). [CrossRef]
  12. Natural Resources Canada. Forest Fire Danger Rating Tool--The Canadian Forest Fire Danger Rating System. [EB/OL] https://www.nrcan.gc.ca/forests/fire-insects-disturbances/fire/14470, 2018.7.25.
  13. Tian Xiaorui, D·J·McRae, Zhang Youhui. Assessment of Forest Fire Danger Rating Systems. World Forestry Research, 2006 (2): 39-46.
  14. Masinda, M.M.; Li, F.; Qi, L.; Sun, L.; Hu, T. Forest fire risk estimation in a typical temperate forest in Northeastern China using the Canadian forest fire weather index: case study in autumn 2019 and 2020. Nat Hazards, 2022, 111, 1085–1101. [CrossRef] [PubMed]
  15. Huang Baohua, Sun Zhijun, Zhou Lixia, et al. Forest Fire Danger Forecast Based on Comprehensive Fire Danger Index [J], Fire Management Study, 2011, 30 (12): 1181-1185.
  16. Dimitrakopoulos, A.P.; Bemmerzouk, A.M.; Mitsopoulos, I.D. Evaluation of the Canadian fre weather index system in an eastern Mediterranean environment. Meteorol Appl, 2011, 18:83–93. [CrossRef]
  17. Vitolo C, Di Giuseppe F, Krzeminski B, San-Miguel-ayanz J. Data descriptor: a 1980–2018 global fre danger re-analysis dataset for the Canadian fire weather indices. Sci Data,2019, 6:1–10. [CrossRef]
  18. National Rural Fire Authority. Fire Weather Index System Tables for New Zealand [R]. Wellington: National Rural Fire Authority, 1993.
  19. Yin L, Kong, X.G., Ma, H.B., Wang R. Missing value filling method of meteorological data based on adaptive genetic algorithm. CN201810512093.4[P]. CN201810512093.4[2023-07-04].
  20. Xin Xiaoying, Jiang Hong, Zhou Guomo, et al. Canadian Forest Fire Weather Index (FWI) System: A Review [J]. Journal of Zhejiang A & F University, 2011, 28 (2): 314-318.
  21. TAYLOR S W,ALEXANDER M E. Science,technology,and human factors in fire danger rating: The Canadian experience [J]. International Journal of Wildland Fire,2006,15 ( 1) : 121-135. [CrossRef]
  22. Equations and FORTRAN program for the Canadian Forest Fire Weather Index System. 1985. Van Wagner, C.E.; Pickett, T.L. Canadian Forestry Service, Petawawa National Forestry Institute, Chalk River, Ontario. Forestry Technical Report 33.
  23. Shen Jiaojiao, et al. Characteristics of Forest Fires and the Relationship between Forest Fires and Key Climate Factors in Shaanxi Province [J]. Journal of Catastrophology, 2016 (02): 99-105.
  24. Zhang Heng, Ma Yunjia. Temporal and Spatial Characteristics of Forest Fires in Northern China from 2003 to 2016 [J]. Journal of Northwest Forestry University, 2019, 34 (1): 163-169.
  25. SAN-MIGUEL-AYANZ J, BARBOSA P, LIBERTA G, et al. The European Forest Fire Information System: a European Strategy Towards Forest Fire Management [R]. Washington D C: U S Dep Interior, Bur Land Manage CD-ROM, 2003.
  26. He Zeneng, Tang Xiaoping, Tan Bingquan. Study on Meteorological Conditions and Forecast of Forest Fire Danger Grading – A Case Study in Shapingba District of Chongqing [J]. Journal of Catastrophology, 2013 (02): 46-50.
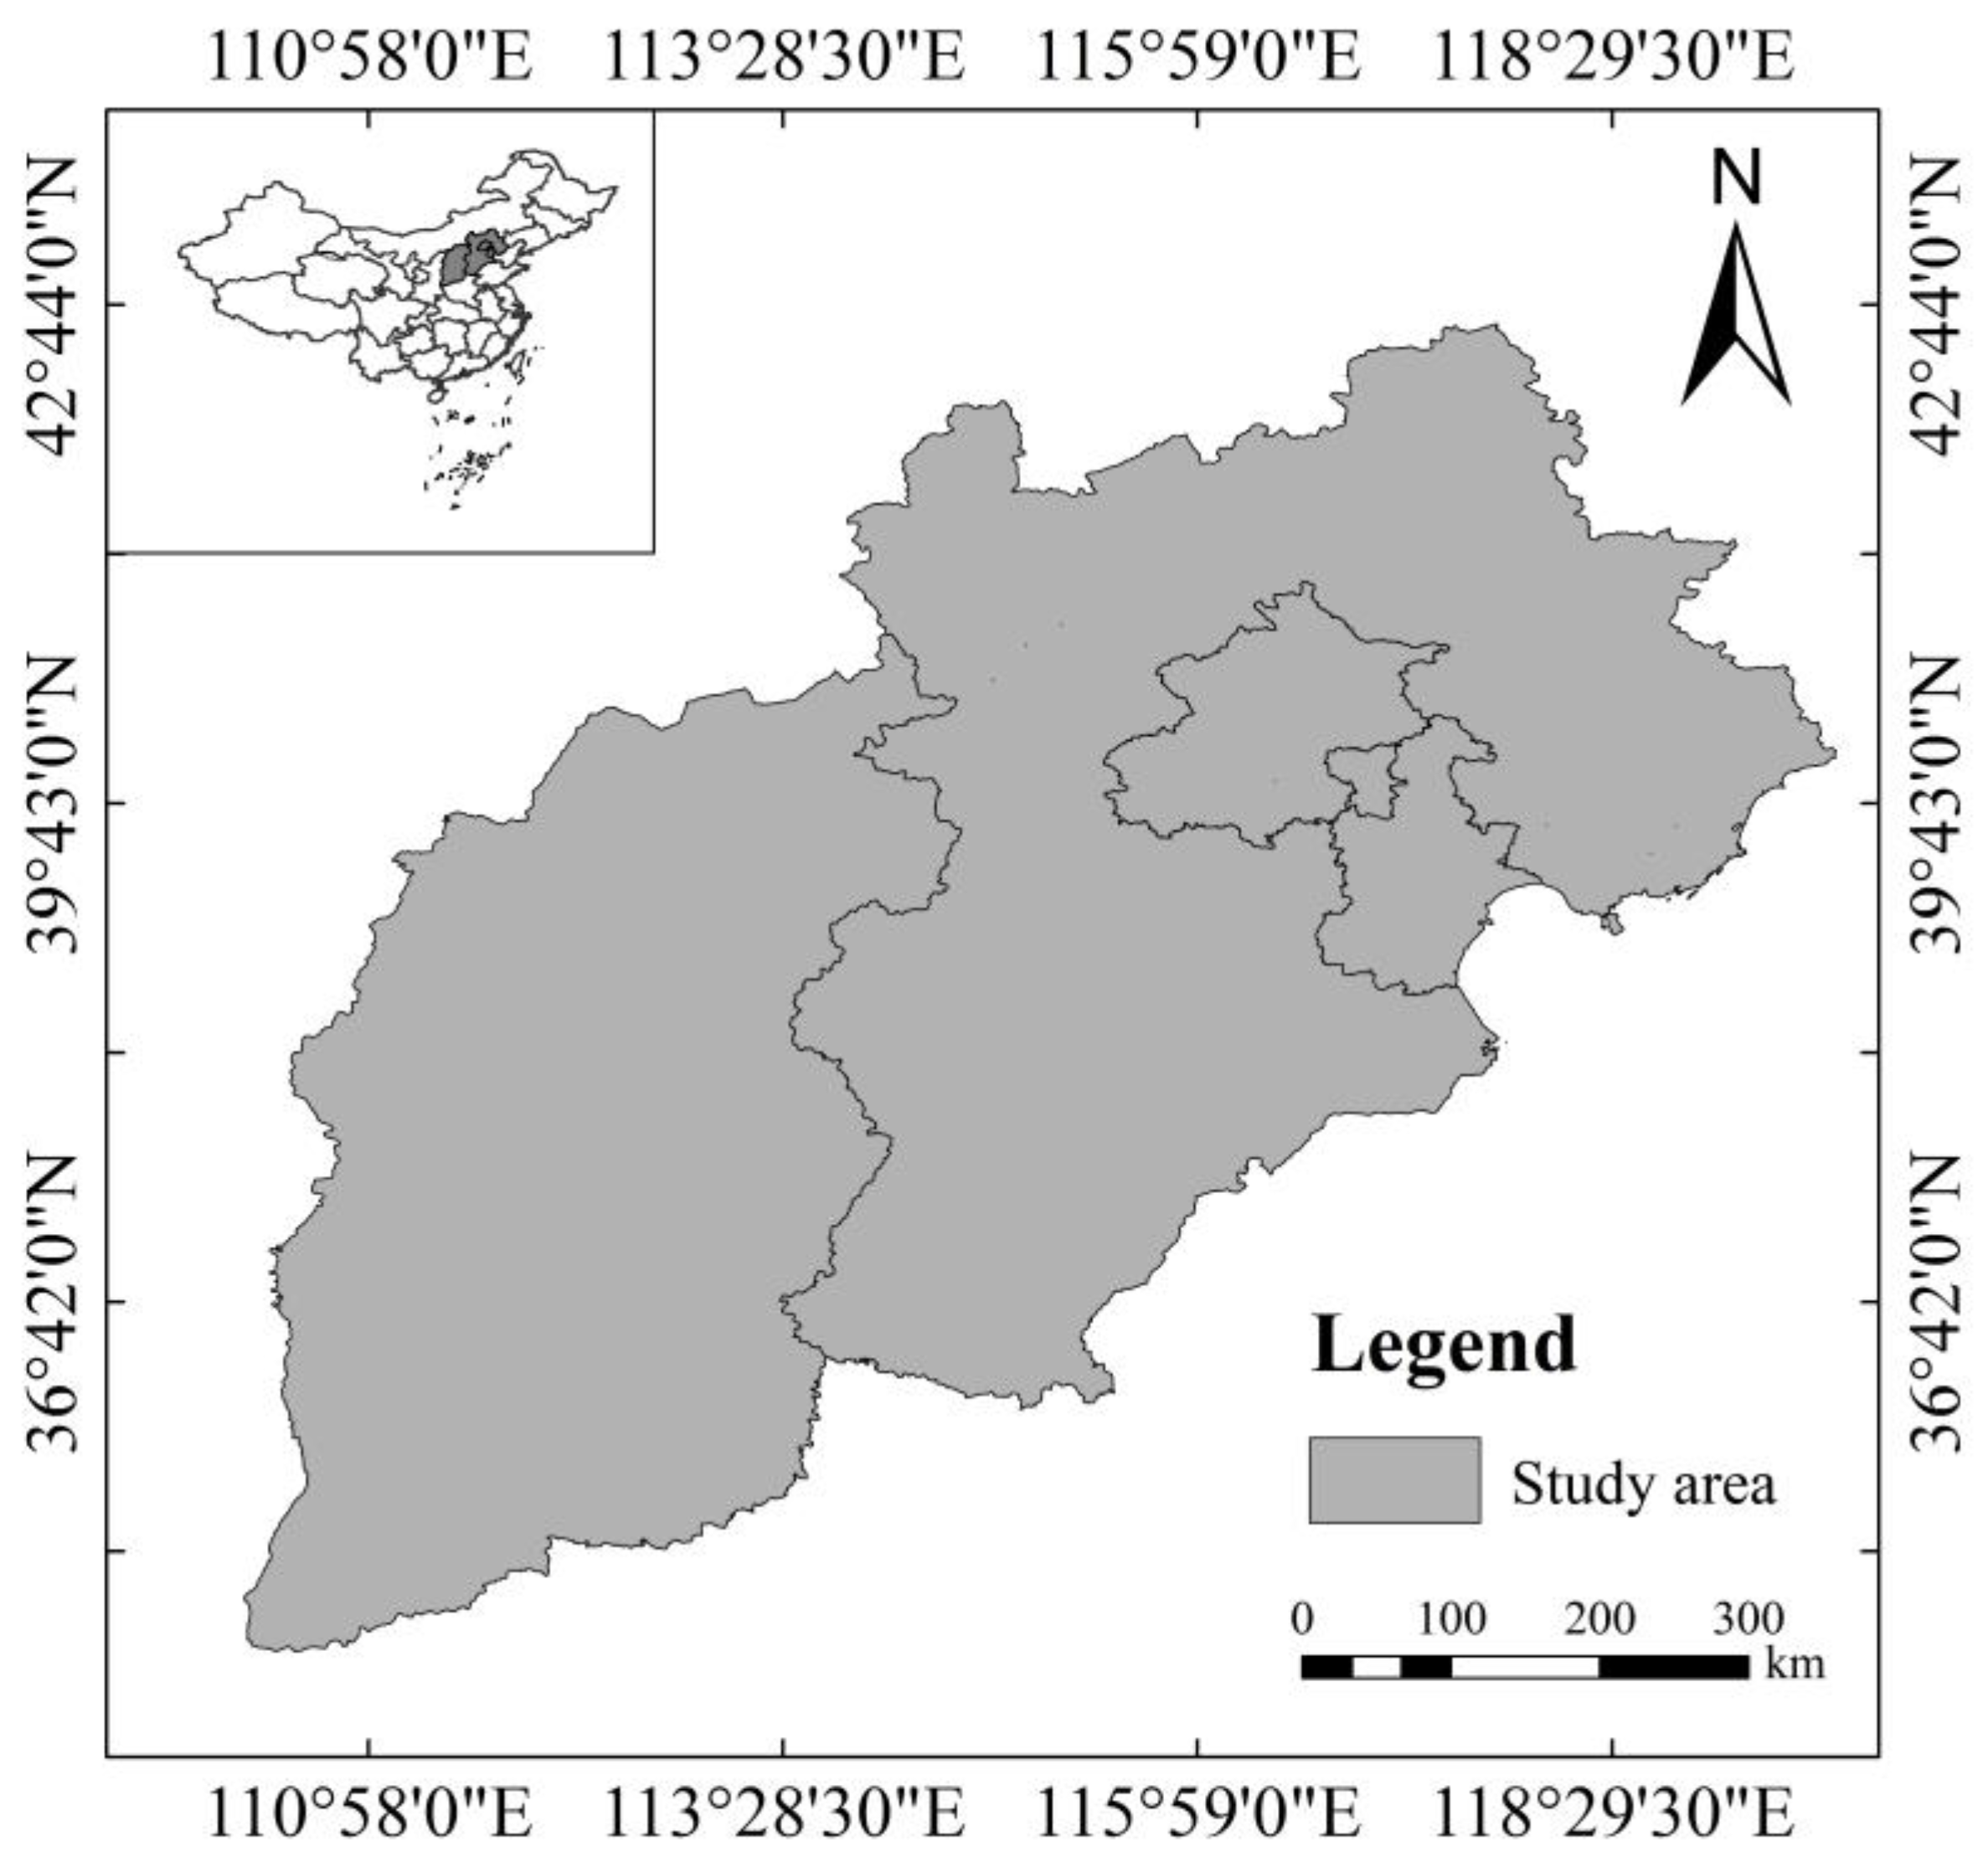
Figure 1. Location map of the study area.
Preprints 79985 g001
Figure 2. Distribution of national meteorological stations in the Beijing-Tianjin-Hebei-Shanxi region.
Preprints 79985 g002
Figure 3. Flow chart of FFMC and ISI calculation.
Preprints 79985 g003
Figure 4. (a)Distribution of satellite monitoring forest fire points in the Beijing-Tianjin-Hebei- Shanxi region (from 2007 to 2017);(b)Satellite monitoring forest fire points kernel density map in the Beijing-Tianjin-Hebei-Shanxi region (from 2007 to 2017).
Preprints 79985 g004
Figure 5. (a)Annual Fire Points From 2007 To 2017; (b)Annual distribution characteristics of accumulated fire points from 2007 to 2017.
Preprints 79985 g005
Figure 6. FFMC line graph for Weichang Station, Mentougou Station and Qinyuan Station in 2019 and 2020.
Preprints 79985 g006
Figure 7. ISI line graph for Weichang Station, Mentougou Station and Qinyuan Station in 2019 and 2020.
Preprints 79985 g007
Figure 8. (a)Frequency distribution of humidity code of small combustibles corresponding to fire point from 2010 to 2017;(b)Frequency Distribution of Initial Spreading Speed Corresponding to Fire Point From 2010 To 2017.
Preprints 79985 g008
Figure 11. Trends in forest fire weather indices before and during the Qinyuan fire (14 March).
Preprints 79985 g011
Figure 12. Trends of the meteorological elements before and during the fire (30 March) observed at the Qinyuan Station.
Preprints 79985 g012
Figure 13. Trends in forest fire weather indices before and during the Qinyuan fire (30 March).
Preprints 79985 g013
Figure 14. Trends in meteorological elements before and during the Miyun and Pinggu fires.
Preprints 79985 g014
Figure 15. Trends in forest fire weather indices before and during the Miyun and Pinggu fires.
Preprints 79985 g015
Figure 16. Trends in meteorological elements before and during the Yushe fire.
Preprints 79985 g016
Figure 17. Trends in forest fire weather indices before and during the Yushe fire.
Preprints 79985 g017
Table 2. Meteorological stations for priority analysis.
No. Province Station No. Station name
1 Hebei 54311 Weichang
2 Hebei 54318 Longhua
3 Hebei 54420 Luanping
4 Hebei 54308 Fengning
5 Hebei 54430 Chengde County
6 Hebei 54436 Qinglong
7 Hebei 54434 Qianxi
8 Hebei 54425 Xinglong
9 Hebei 54404 Chicheng
10 Hebei 54304 Chongli
11 Tianjin 54428 Jixian County
12 Beijing 54416 Miyun
13 Beijing 54424 Pinggu
14 Beijing 54505 Mentougou
15 Beijing 54597 Xiayunling
16 Hebei 53599 Laiyuan
17 Hebei 53690 Fuping
18 Hebei 53693 Jingxing
19 Hebei 53890 Wu’an
20 Hebei 53886 Shexian County
21 Shanxi 53681 Doucun Town, Wutai County
22 Shanxi 53760 Fangshan
23 Shanxi 53767 Zhongyang
24 Shanxi 53860 Jiaokou
25 Shanxi 53864 Puxian County
26 Shanxi 53875 Qinyuan
27 Shanxi 53788 Heshun
28 Shanxi 53878 Licheng
29 Shanxi 53884 Xiangyuan
30 Shanxi 53663 Wuzhai
31 Shanxi 53888 Pingshun
32 Shanxi 53981 Lingchuan
33 Shanxi 53973 Gaoping
34 Shanxi 53968 Yuanqu
35 Shanxi 53965 Jiangxian County
36 Shanxi 53970 Qinshui
37 Shanxi 53786 Zuoquan
Table 4. Classification thresholds for ISI levels at priority analysis stations.
No. Province Station No. Station name Threshold for very high risk Threshold for high risk Threshold for medium risk Threshold for low risk
1 Hebei 54311 Weichang 12.0 8.6 6.4 4.5
2 Hebei 54318 Longhua 12.0 9.1 6.8 5.0
3 Hebei 54420 Luanping 12.4 9.0 7.0 5.3
4 Hebei 54308 Fengning 14.2 10.3 7.7 5.7
5 Hebei 54430 Chengde County 11.7 9.0 6.9 5.3
6 Hebei 54436 Qinglong 11.7 9.0 6.8 5.3
7 Hebei 54434 Qianxi 11.7 9.1 7.0 5.3
8 Hebei 54425 Xinglong 10.5 7.9 6.1 4.6
9 Hebei 54404 Chicheng 13.3 10.1 7.6 5.6
10 Hebei 54304 Chongli 11.1 8.3 6.3 4.3
11 Tianjin 54428 Jixian County 11.4 8.9 7.1 5.4
12 Beijing 54416 Miyun 11.1 8.7 7.1 5.4
13 Beijing 54424 Pinggu 11.1 8.8 7.0 5.4
14 Beijing 54505 Mentougou 13.0 10.1 8.2 6.4
15 Beijing 54597 Xiayunling 11.9 9.3 7.6 6.0
16 Hebei 53599 Laiyuan 13.0 10.0 7.9 6.1
17 Hebei 53690 Fuping 13.6 10.8 8.7 6.8
18 Hebei 53693 Jingxing 12.8 10.3 8.2 6.1
19 Hebei 53890 Wu’an 13.5 10.5 8.2 6.0
20 Hebei 53886 Shexian County 12.7 10.1 8.1 6.4
21 Shanxi 53681 Doucun Town, Wutai County 12.2 9.6 7.3 5.6
22 Shanxi 53760 Fangshan 11.8 8.9 6.6 4.8
23 Shanxi 53767 Zhongyang 12.0 9.1 6.4 4.6
24 Shanxi 53860 Jiaokou 10.7 8.0 6.0 4.2
25 Shanxi 53864 Puxian County 12.5 9.8 7.2 5.5
26 Shanxi 53875 Qinyuan 12.2 9.4 7.4 5.6
27 Shanxi 53788 Heshun 11.6 9.1 7.5 5.7
28 Shanxi 53878 Licheng 12.7 9.8 7.7 6.1
29 Shanxi 53884 Xiangyuan 13.0 9.6 7.3 5.5
30 Shanxi 53663 Wuzhai 12.4 9.4 6.9 4.9
31 Shanxi 53888 Pingshun 11.3 8.4 6.7 5.1
32 Shanxi 53981 Lingchuan 10.7 7.8 6.0 4.3
33 Shanxi 53973 Gaoping 12.4 9.4 7.3 5.6
34 Shanxi 53968 Yuanqu 11.6 8.7 6.8 5.1
35 Shanxi 53965 Jiangxian County 10.4 7.7 5.7 4.3
36 Shanxi 53970 Qinshui 12.2 9.2 7.2 5.4
37 Shanxi 53786 Zuoquan 12.6 10.0 7.6 5.7
Disclaimer/Publisher’s Note: The statements, opinions and data contained in all publications are solely those of the individual author(s) and contributor(s) and not of MDPI and/or the editor(s). MDPI and/or the editor(s) disclaim responsibility for any injury to people or property resulting from any ideas, methods, instructions or products referred to in the content.
Copyright: This open access article is published under a Creative Commons CC BY 4.0 license, which permit the free download, distribution, and reuse, provided that the author and preprint are cited in any reuse.
Prerpints.org logo

Preprints.org is a free preprint server supported by MDPI in Basel, Switzerland.

Subscribe

© 2024 MDPI (Basel, Switzerland) unless otherwise stated