1. Introduction
Bivalve mollusks such as scallops, mussels, and clams accumulate toxins in their digestive glands by consuming toxic microalgae [1, 2]. Paralytic shellfish poisoning, diarrhetic shellfish poisoning, and amnesic shellfish poisoning have been widely studied [3-5]. The most well-known paralytic shellfish poisoning, diarrhetic shellfish poisoning, and amnesic shellfish poisoning are saxitoxin, okadaic acid, and domoic acid, respectively. These toxins exhibit acute toxicity, and regular testing is conducted to ensure that shellfish carrying these toxins do not enter the market. We revealed that feeding mice a diet containing the mantle tissue of scallops available on the market led to increased levels of the liver damage markers aspartate aminotransferase and alanine aminotransferase, an increase in the kidney damage marker urea nitrogen, and subsequent death of the mice within a few weeks [6-8]. Furthermore, we isolated a complex consisting of the N-terminal region of a gelsolin-like protein with a molecular weight of 18 kDa and actin fragments with a molecular weight of 25 kDa as a novel scallop toxin. The gelsolin-like protein is expressed in the mantle tissue, ovary, and gill tissue but not in the adductor muscle, testis, or digestive gland [
9]. Toxicity was observed only in scallop tissues expressing the 18 kDa gelsolin-like protein [
9].
Although many proteinaceous toxins have been identified [10-12], little is known about those that exhibit toxicity after oral administration because proteinaceous toxins are degraded by digestive enzymes in the gastrointestinal tract. In contrast, abrin and ricin, which are isolated from plants, exhibit acute toxicity [
13] even after oral administration, although their subacute or chronic toxicity has not been reported. However, the novel toxin from scallops is proteinaceous and exhibits subacute toxicity even after oral administration [
6].
Scallops are among the main marine products of Hokkaido, Japan. Scallop mantle, ovary tissues, and adductor muscle are often eaten raw, boiled, and smoked in Japan. To further determine the characteristics of mantle tissue toxicity, we investigated its stability against digestive enzymes, the conditions under which mantle tissues exhibit toxicity, and toxicity in the small intestine.
2. Materials and Methods
2.1. Materials
Commercially available scallops (Patinopecten yessoensis) harvested from Mutsu Bay (Aomori), Funka Bay (Hokkaido), Tokoro (Hokkaido), and Saruhutsu (Hokkaido), Japan, were purchased during different seasons (spring, summer, autumn, and winter). Unless otherwise stated in the figure legends, scallops from Mutsu Bay (Aomori) were used. Smoked mantle products were purchased from different companies.
2.2. Extract from the scallop mantle tissue
The mantle tissue was isolated, washed with deionized water, lyophilized, and ground in a mill. The product (20 g) was suspended in 500 mL of 20 mM Tris-HCl (pH 7.5) and centrifuged at 12,000 ×g for 15 min at 4 °C. The supernatant was used as the mantle extract [6-8].
2.3. Stability of toxicity of the mantle tissue or mantle extract
To evaluate the stability of toxic substances in the mantle tissue, the mantle tissue was treated under various conditions used in the manufacturing of processed foods. Mantle tissue was treated with 1 mM HCl or 1 mM NaOH at 25 °C for 6 h, rinsed with deionized water, and used for toxicity evaluation. Additionally, the mantle tissue was treated with 1 mM H2O2 for 6 h or 1 mM dithiothreitol (DTT) for 6 h at room temperature for sterilization and reduction. The mantle tissues were rinsed with deionized water and used for toxicity evaluation. Furthermore, the mantle tissue was treated at 100 °C for 2 h, rinsed with deionized water, and used for toxicity evaluation.
To investigate the stability of the toxicity of the mantle extract, the extract pH was adjusted to 2 using 1 M HCl or to 11 using 1 M NaOH and then left at 25 °C for 6 h. After adjusting the pH of each solution to 7, dialysis was performed using deionized water. The denatured proteins were removed by centrifugation at 12,000 ×g for 15 min at 4 °C, and the supernatant was freeze-dried and used for toxicity evaluation. The mantle extract was also treated at 100°C for 2 h; after removing denatured proteins by centrifugation at 12,000 ×g for 15 min at 4 °C, the supernatant was freeze-dried and used for toxicity evaluation.
2.4. Stability of toxicity of the mantle extract against pepsin or pancreatin treatments
To evaluate the stability of toxicity of the mantle extract against digestive enzymes, the mantle extract was treated with pepsin (50:1(w/w)) at pH 2 at 37 °C overnight. Additionally, the mantle extract was treated with pancreatin (50:1 (w/w)) at pH 7 at 37 °C overnight. After treatment, each sample was freeze-dried and subjected to toxicity evaluation. Samples containing only proteases without mantle extract were used as controls for toxicity evaluation.
2.5. Evaluation of toxicity of mantle tissues
Four-week-old male ICR mice were obtained from CLEA (Tokyo, Japan). The mice were housed individually in a room maintained at 22 °C. Three or four mice were housed in cages and maintained at 22 °C with free access to water and food. The mice were acclimatized for at least seven days and used in each experiment. The mice were fed either a normal AIN-93G-based diet (control diet) or an AIN-93G-based diet containing 1% mantle tissue or 1-20% mantle extract at 4 g/d for 4–12 weeks [
6]. The protein, carbohydrate, and lipid concentrations in the mantle extract were determined using a BCA protein assay kit (Thermo Fisher Scientific, Waltham, MA, USA), the phenol-sulfate method, and the method of Bligh and Dyer [
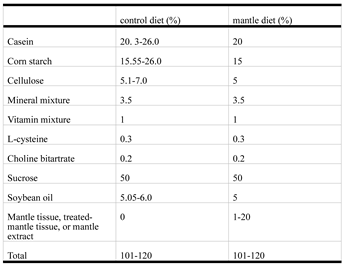
14], respectively. The protein, carbohydrate, lipid, and fiber contents in the mantle tissue were 30%, 50%, 5%, and 1%, respectively. The diet composition is shown in
Table 1. Food intake was monitored daily. Toxicity was evaluated in three mice. The amount of mantle extract or tissue in the diet was determined based on previous studies [
6] and preliminary experiments.
The small intestines and cecum were isolated at three weeks after the mice started consuming a diet containing mantle tissue or control diet. Small intestine (1 mg) was homogenized in 20 mL of deionized water and centrifuged at 12,000 ×g for 15 min at 4 °C. The supernatant was used as the small intestine extract.
Animal experiments were conducted according to the Guidelines for Experimental Animal Care issued by the Office of the Prime Minister of Japan and the Muroran Institute of Technology. All experiments were approved by the Committee on Ethics, Care, and Use of Animal Experiments of the Muroran Institute of Technology (Permit Number: H29-KS04). All mice were monitored for their health status by checking their daily food and water intake and observing their appearance during the experimental period.
2.6. Electrophoresis
SDS-polyacrylamide gel electrophoresis (SDS-PAGE) was performed as previously described [
9].
After 2% SDS, bromophenol blue and 2-mercaptoethanol were added to the mantle extract, pepsin-treated extract, and pancreatin-treated extract are heated at 100 °C for 5 min. SDS-PAGE was performed as described by Laemmli [
15].
2.7. Real-time polymerase chain reaction
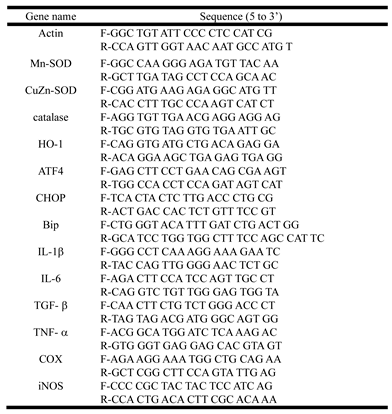
Total RNA from the small intestinal tissues was prepared using an RNAiso Plus Kit (Takara, Shiga, Japan). Reverse transcription reactions were performed, and real-time polymerase chain reaction (PCR) was performed using primers specific for genes encoding actin, Mn-superoxide dismutase (SOD), Cu, Zn-SOD, catalase, heme oxigenase (HO)-1, activating transcription factor 4 (ATF4), CCAAT-enhancer-binding protein homologous protein (CHOP), binding immunoglobulin protein (BiP), interleukin (IL)-1β, IL-6, tumor necrosis factor (TNF)-α, transforming growth factor (TGF)-β, cyclooxygenase (COX)-2, and inducible nitric oxide synthase (iNOS) (
Table 2). Real-time PCR was conducted using iTaq Universal SYBR Green Supermix (Bio-Rad, Hercules, CA, USA), as previously described [
16]. Target gene expression was normalized to the mean expression of β-actin using the comparative Ct method.
2.8. Measurement of lipid peroxidation
Malondialdehyde level as a marker of oxidative stress was evaluated using thiobarbituric acid as previously described [16, 17]. Briefly, a mixture containing intestine extract and 50% trichloroacetic acid was prepared and centrifuged at 14,000 ×g for 1 min at 25 °C. Thiobarbituric acid solution (0.67%) was incubated with the supernatant at 100 °C for 1 min and absorbance at 540 nm was measured.
2.9. Measurements of short-chain fatty acids
The concentrations of short-chain fatty acids (SCFAs) in the cecal contents were detected using gas chromatography [
18]. Briefly, 10 mg of cecal contents was vigorously vortex-mixed with deionized water (500 μL) five times. After the mixture was centrifuged (12,000 ×
g for 1 min at 25 °C), 5 μL of 20 mM 2-ethylbutyric acid (internal standard) solution and 5 μL of 35% HCl solution were added to the supernatant. Diethyl ether (200 μL) was added to the mixed solution, centrifuged at 12,000 ×
g for 1 min at 25 °C; the upper layer was used to measure the SCFAs contents using gas chromatography (GC-201 plus, Shimadzu, Kyoto, Japan).
2.10. Statistical analysis
Data are expressed as the mean ± standard deviation (SD). Data were analyzed using Student’s t-test.
3. Results
3.1. Stability of toxicity in the mantle tissue or mantle extract
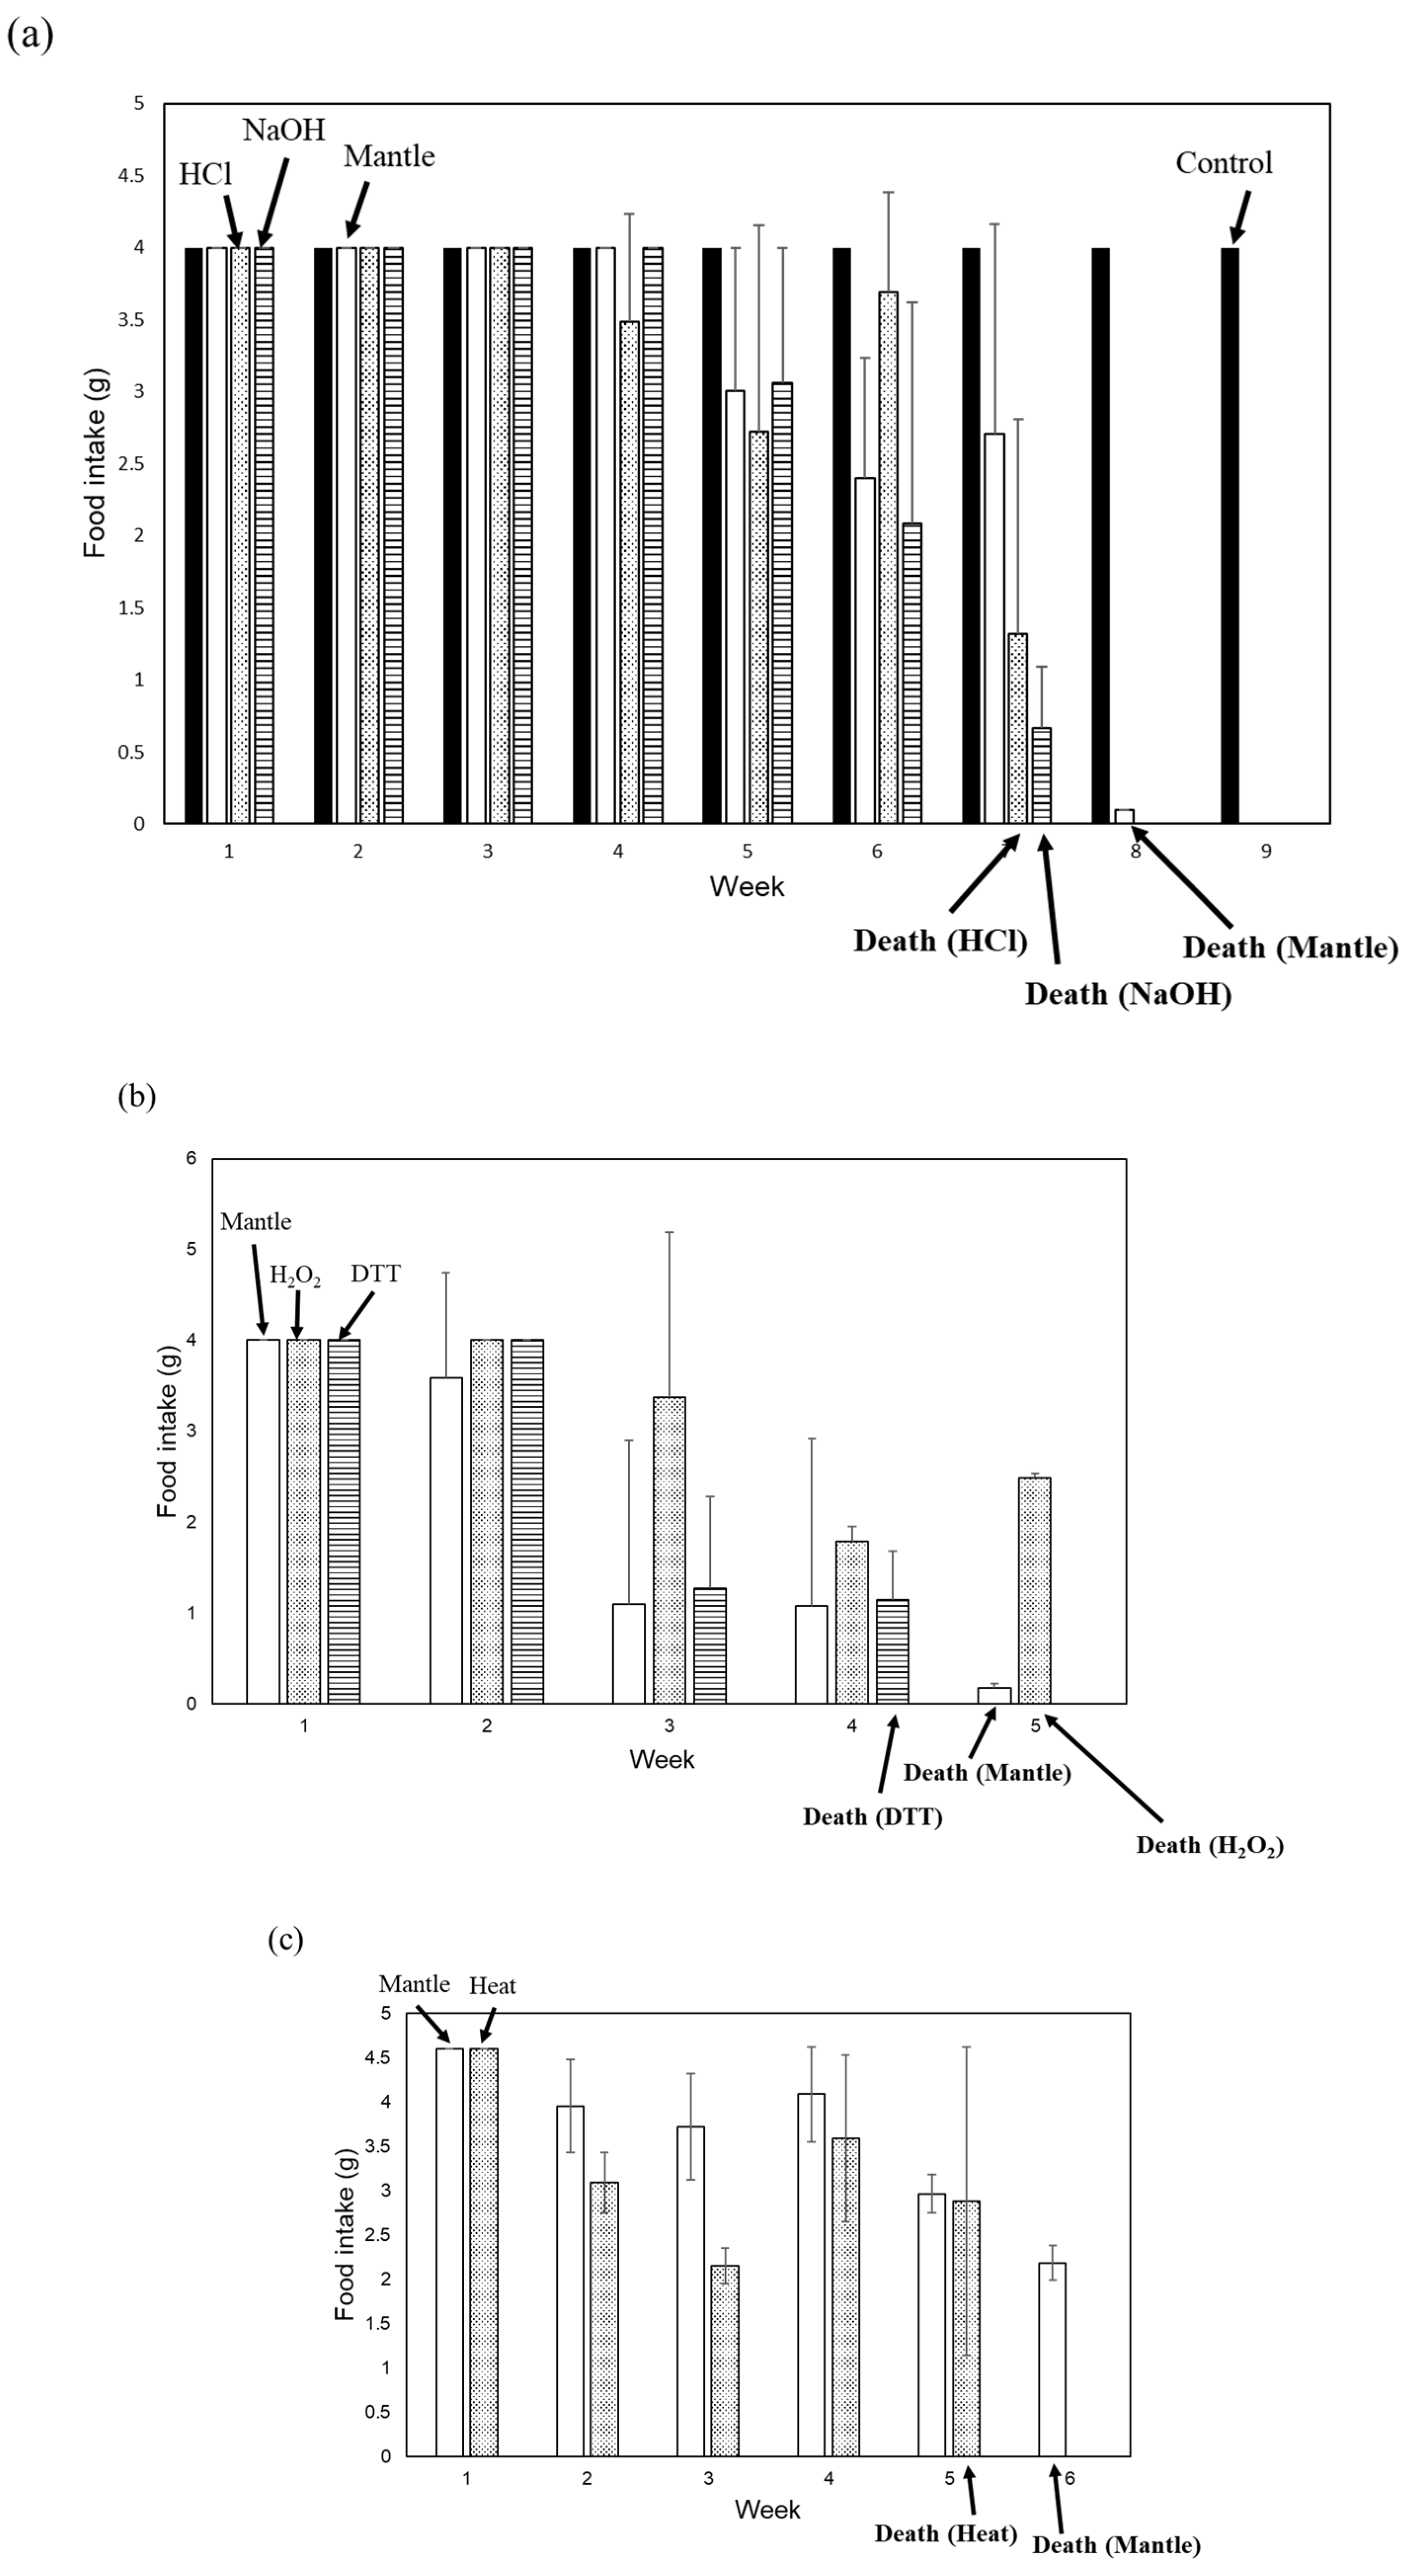
We examined stability of mantle tissue toxicity under various conditions. Tissue toxicity was assessed following treatment of the mantle tissue with 1 mM HCl or 1 mM NaOH for 6 h at 25 °C (
Figure 1a). Treatment with 1 mM HCl or 1 mM NaOH did not affect the toxicity of the mantle tissue. We also investigated the toxicity after heating, sterilization, and reduction treatments of the mantle tissue (
Figure 1b and c). After treating the mantle tissue at 100 °C for 20 min or with 1 mM H
2O
2 or 1 mM dithiothreitol at 25 °C for 6 h, the toxicity of the tissue remained unchanged. These results suggest that the toxic substances were stable within the mantle tissue.
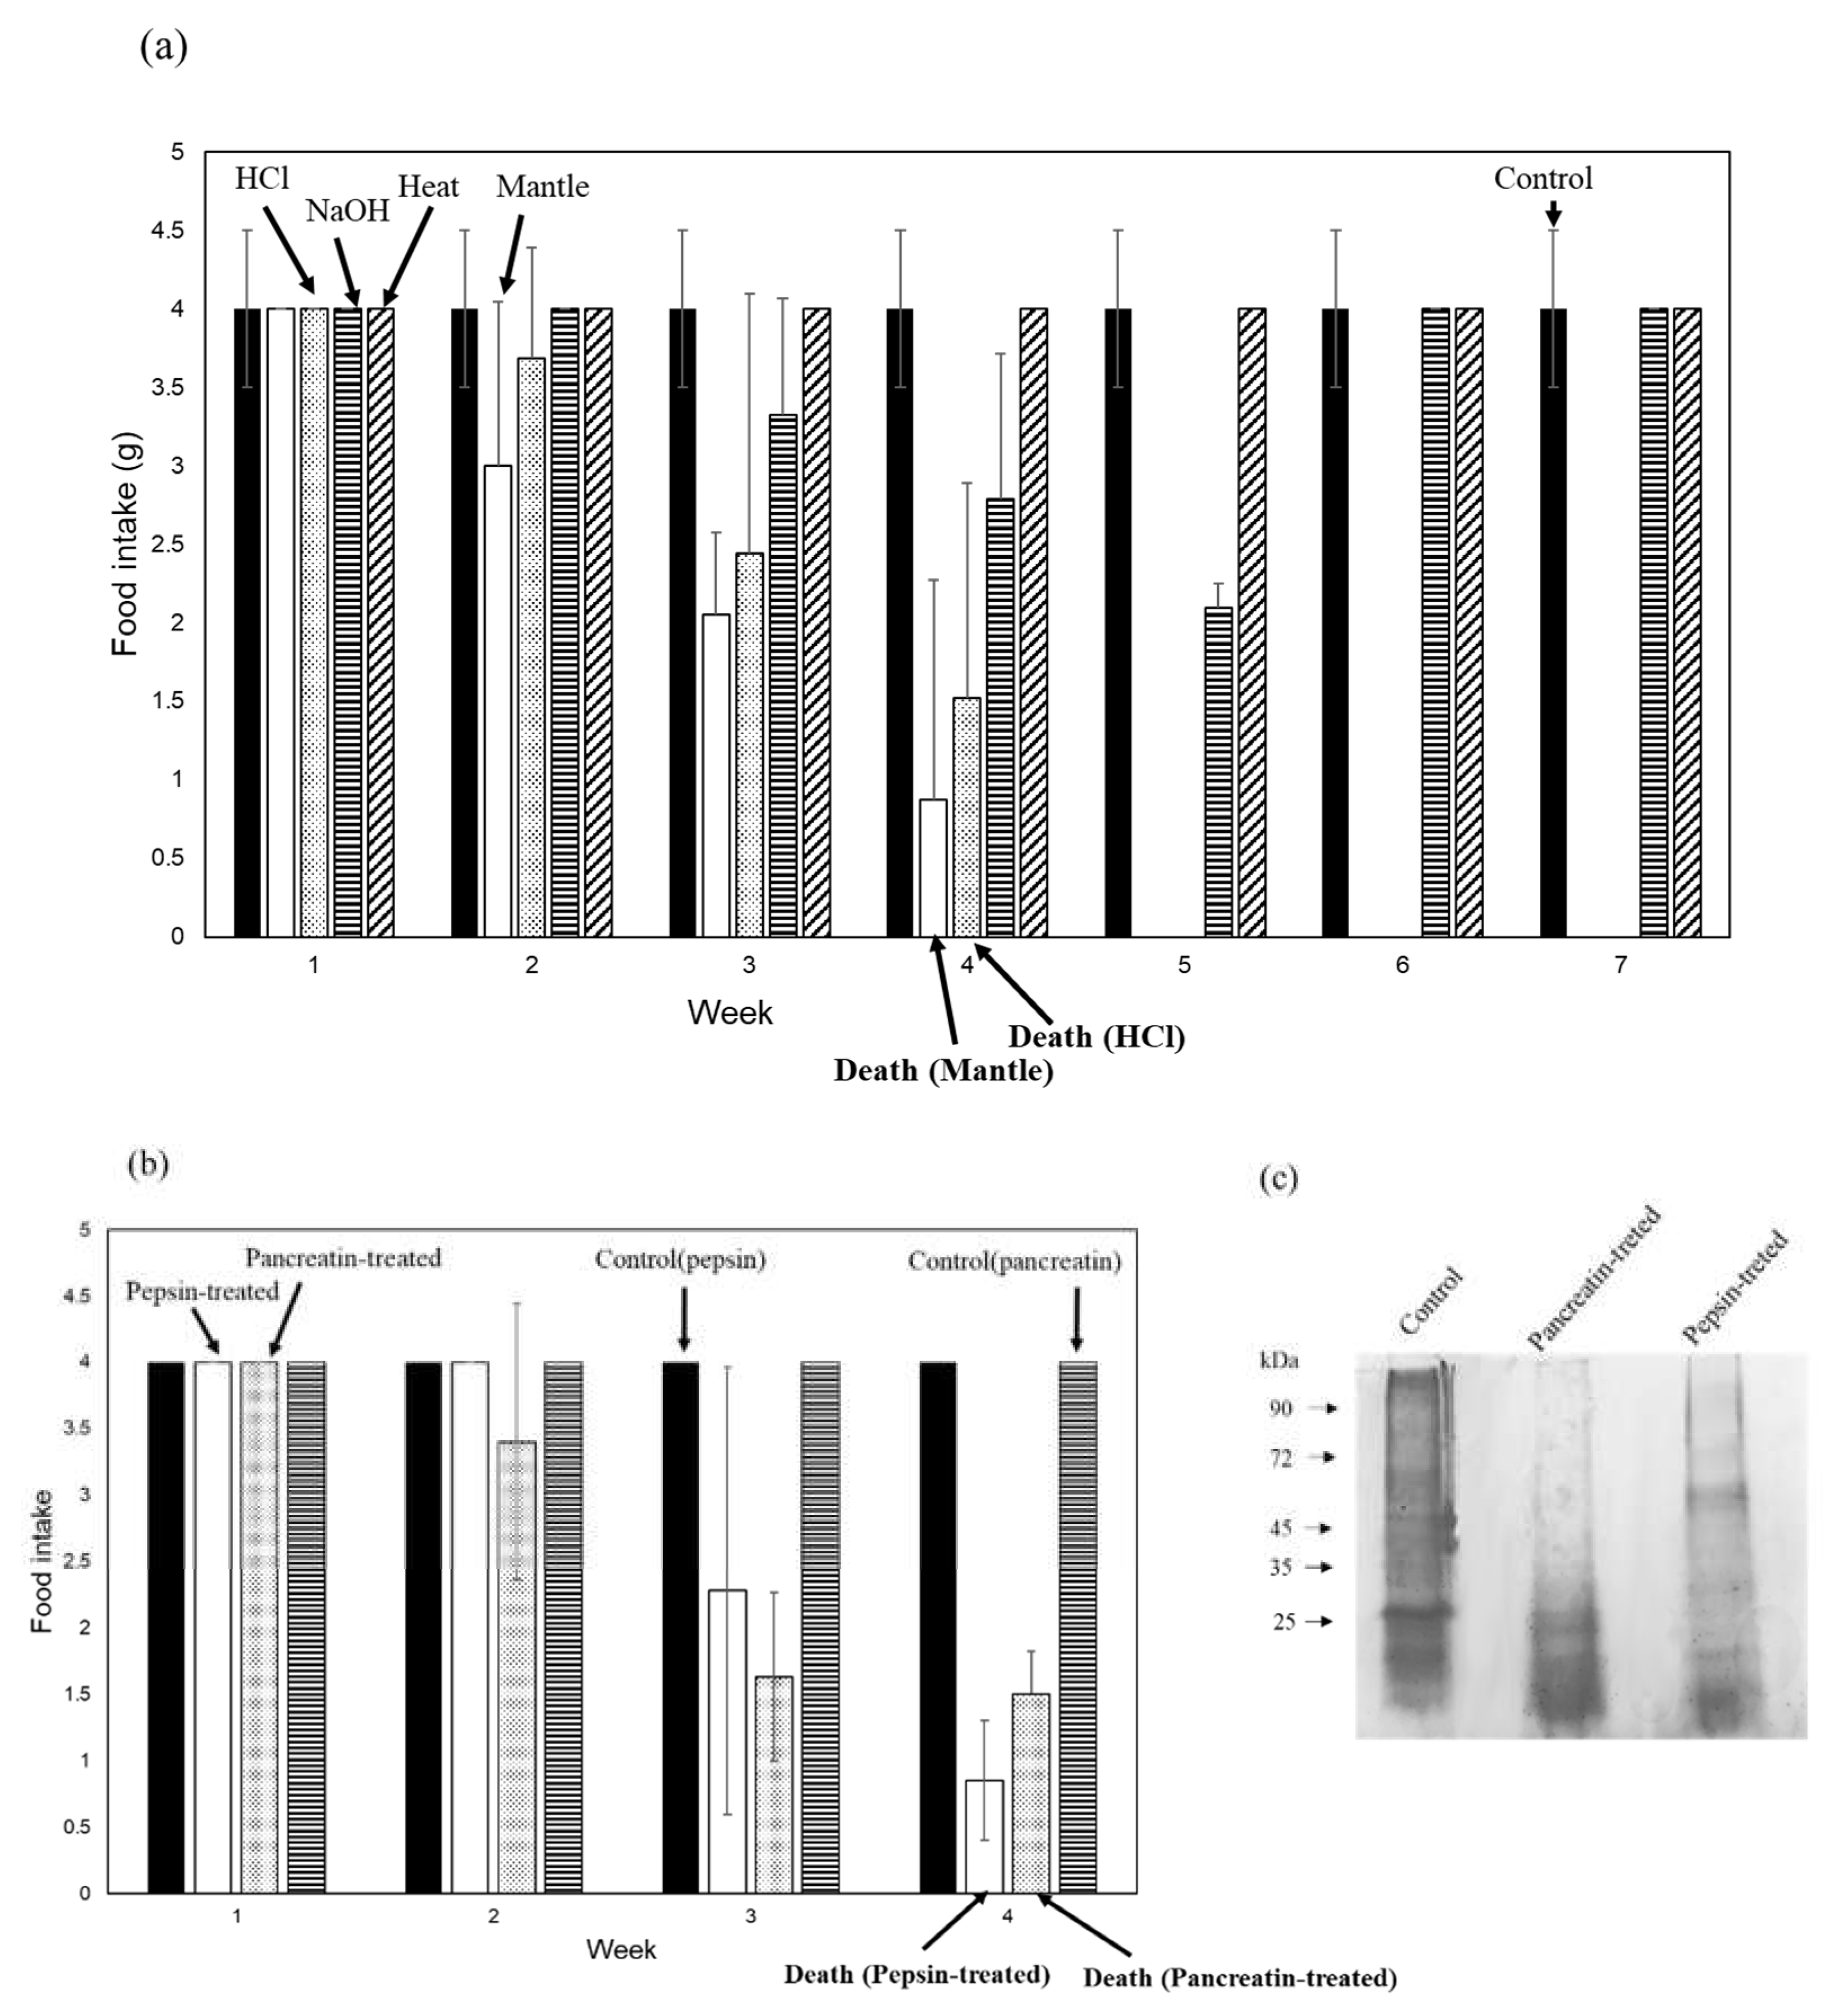
Furthermore, we examined the stability of mantle extract toxicity (
Figure 2a). After treatment with 1 mM NaOH or heating, the toxicity of the mantle extract was lost, whereas treatment with 1 mM HCl had no effect on mantle extract toxicity. This result was consistent with our previous finding [
9] that toxic substances remain stable under acidic conditions. We also examined the stability of the mantle extract against the digestive enzymes pepsin and pancreatin. Treatment with pepsin or pancreatin degraded the mantle extract; however, the toxicity of the protease-treated mantle extract remained unchanged (
Figure 2b and c).
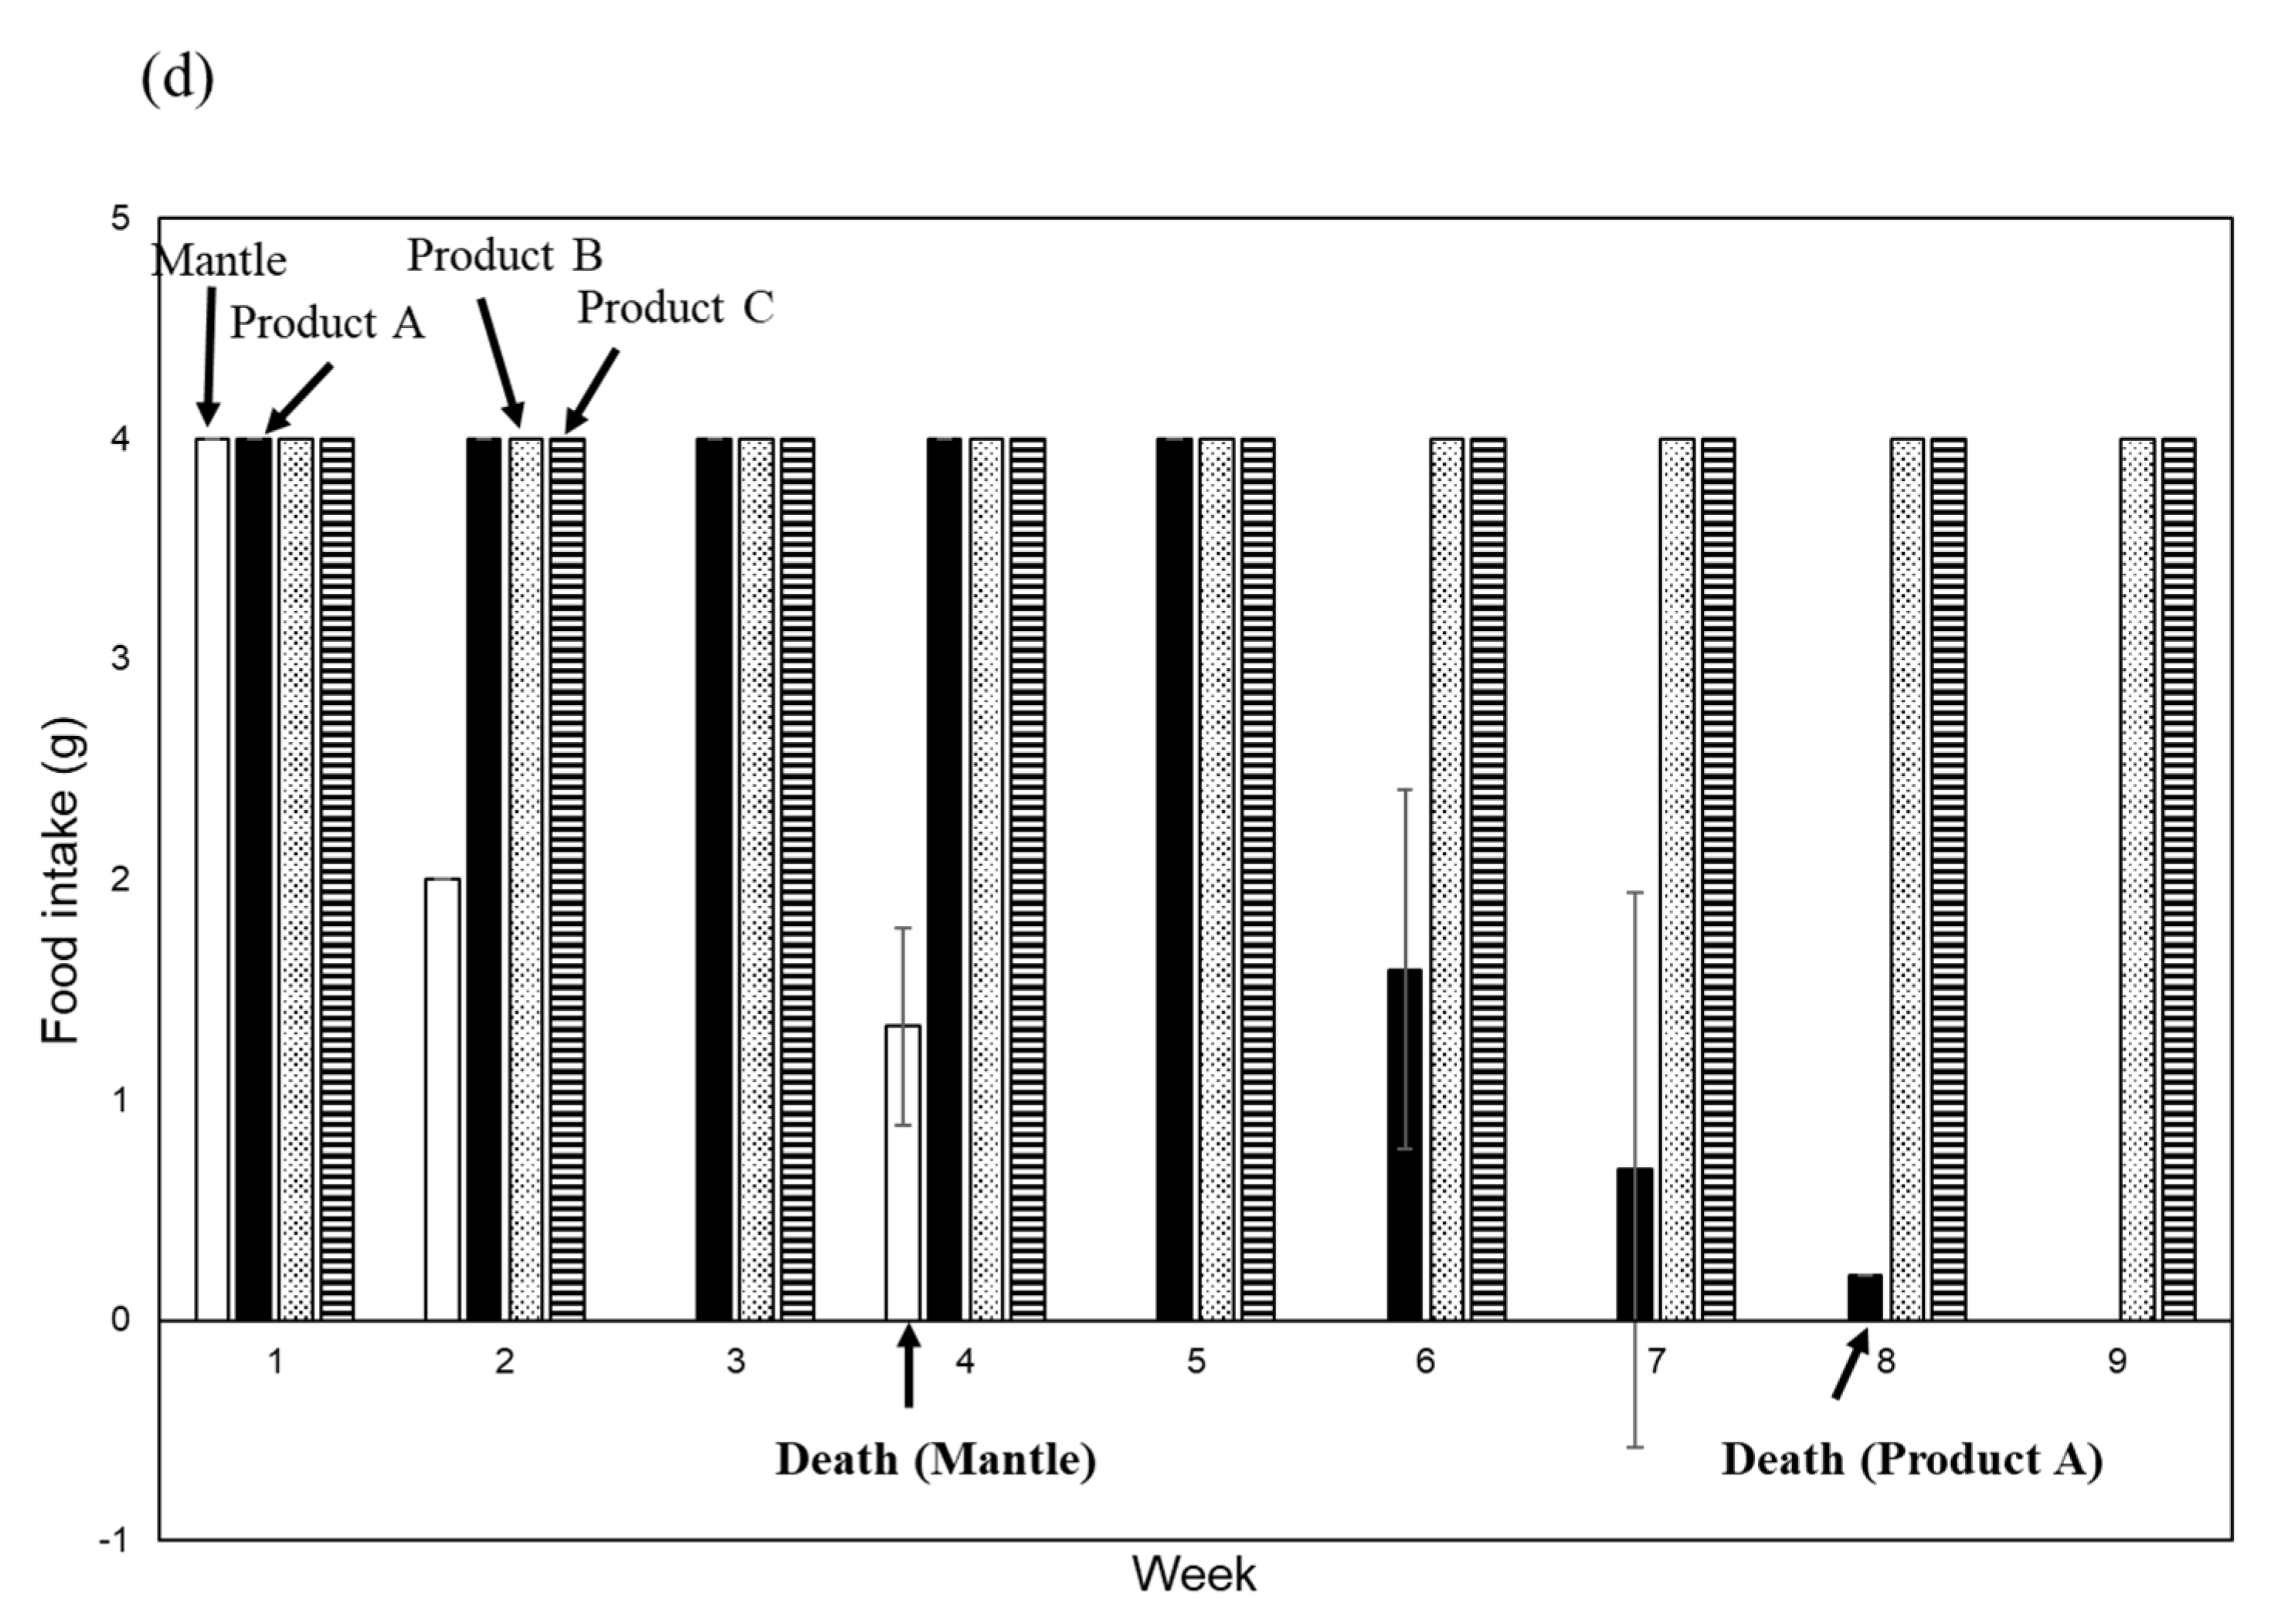
Finally, we evaluated the toxicity of three smoked mantles produced by various companies. One of the processed mantle foods exhibited toxicity, whereas the other products showed no toxicity (
Figure 2d).
3.2. Toxicity of the mantle tissue under different conditions
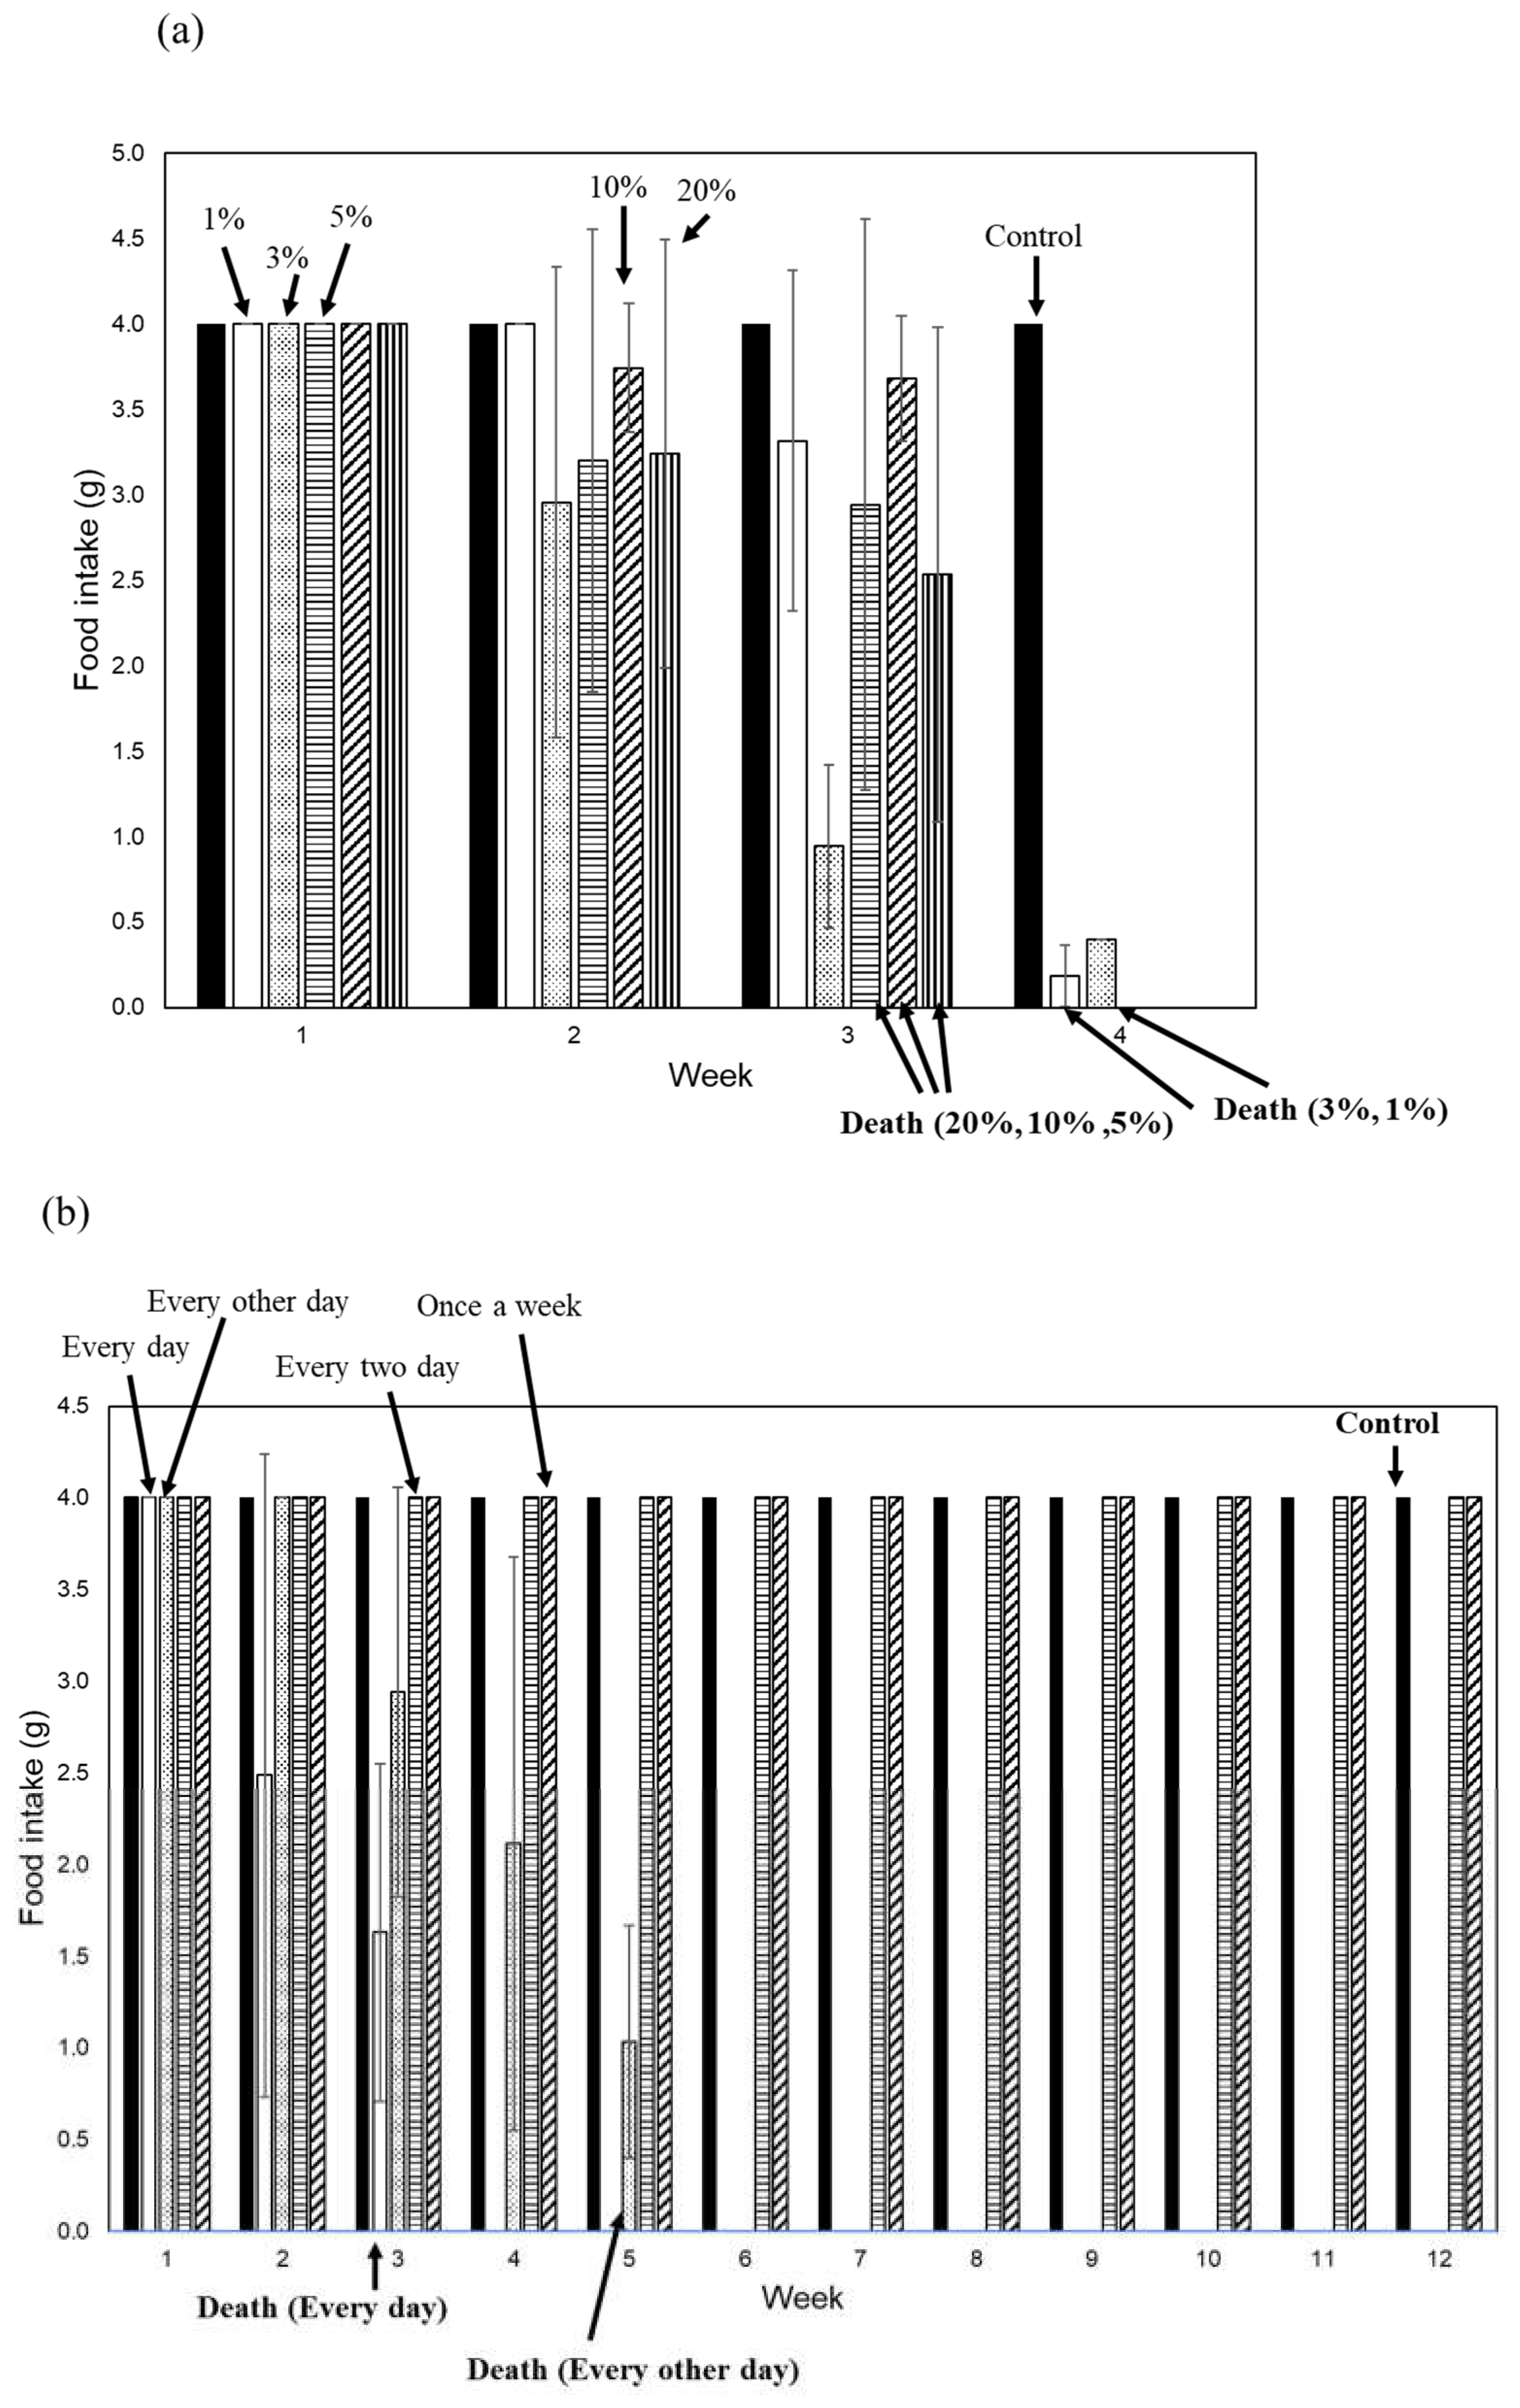
To investigate whether toxic substances in the mantle tissue exhibit acute toxicity, we fed diets containing different amounts of mantle extract (1%, 3%, 5%, 1%, and 20%) to mice (
Figure 3a). Mice consuming a diet containing 20% mantle extract showed a decrease in food intake starting at two weeks and died by the third week. Mice fed diets containing 1% and 3% mantle extract exhibited decreased food intake after two weeks and died by the fourth week. These results indicate that even when consuming a large amount of mantle tissue, it does not exhibit acute toxicity.
To investigate whether a toxic substance accumulates in tissues, we examined the toxicity when mantle tissue was administered every other day, every two days, and once per week to mice (
Figure 3b). When administered to mice every other day, food intake began decreasing starting from the third week, and the mice died in the fifth week. However, when mantle tissue was administered every two or seven days, food intake did not decrease or mouse mortality did not occur for up to 12 weeks. This result suggests that mantle tissue must be continuously ingested in order to observe its toxic effects.
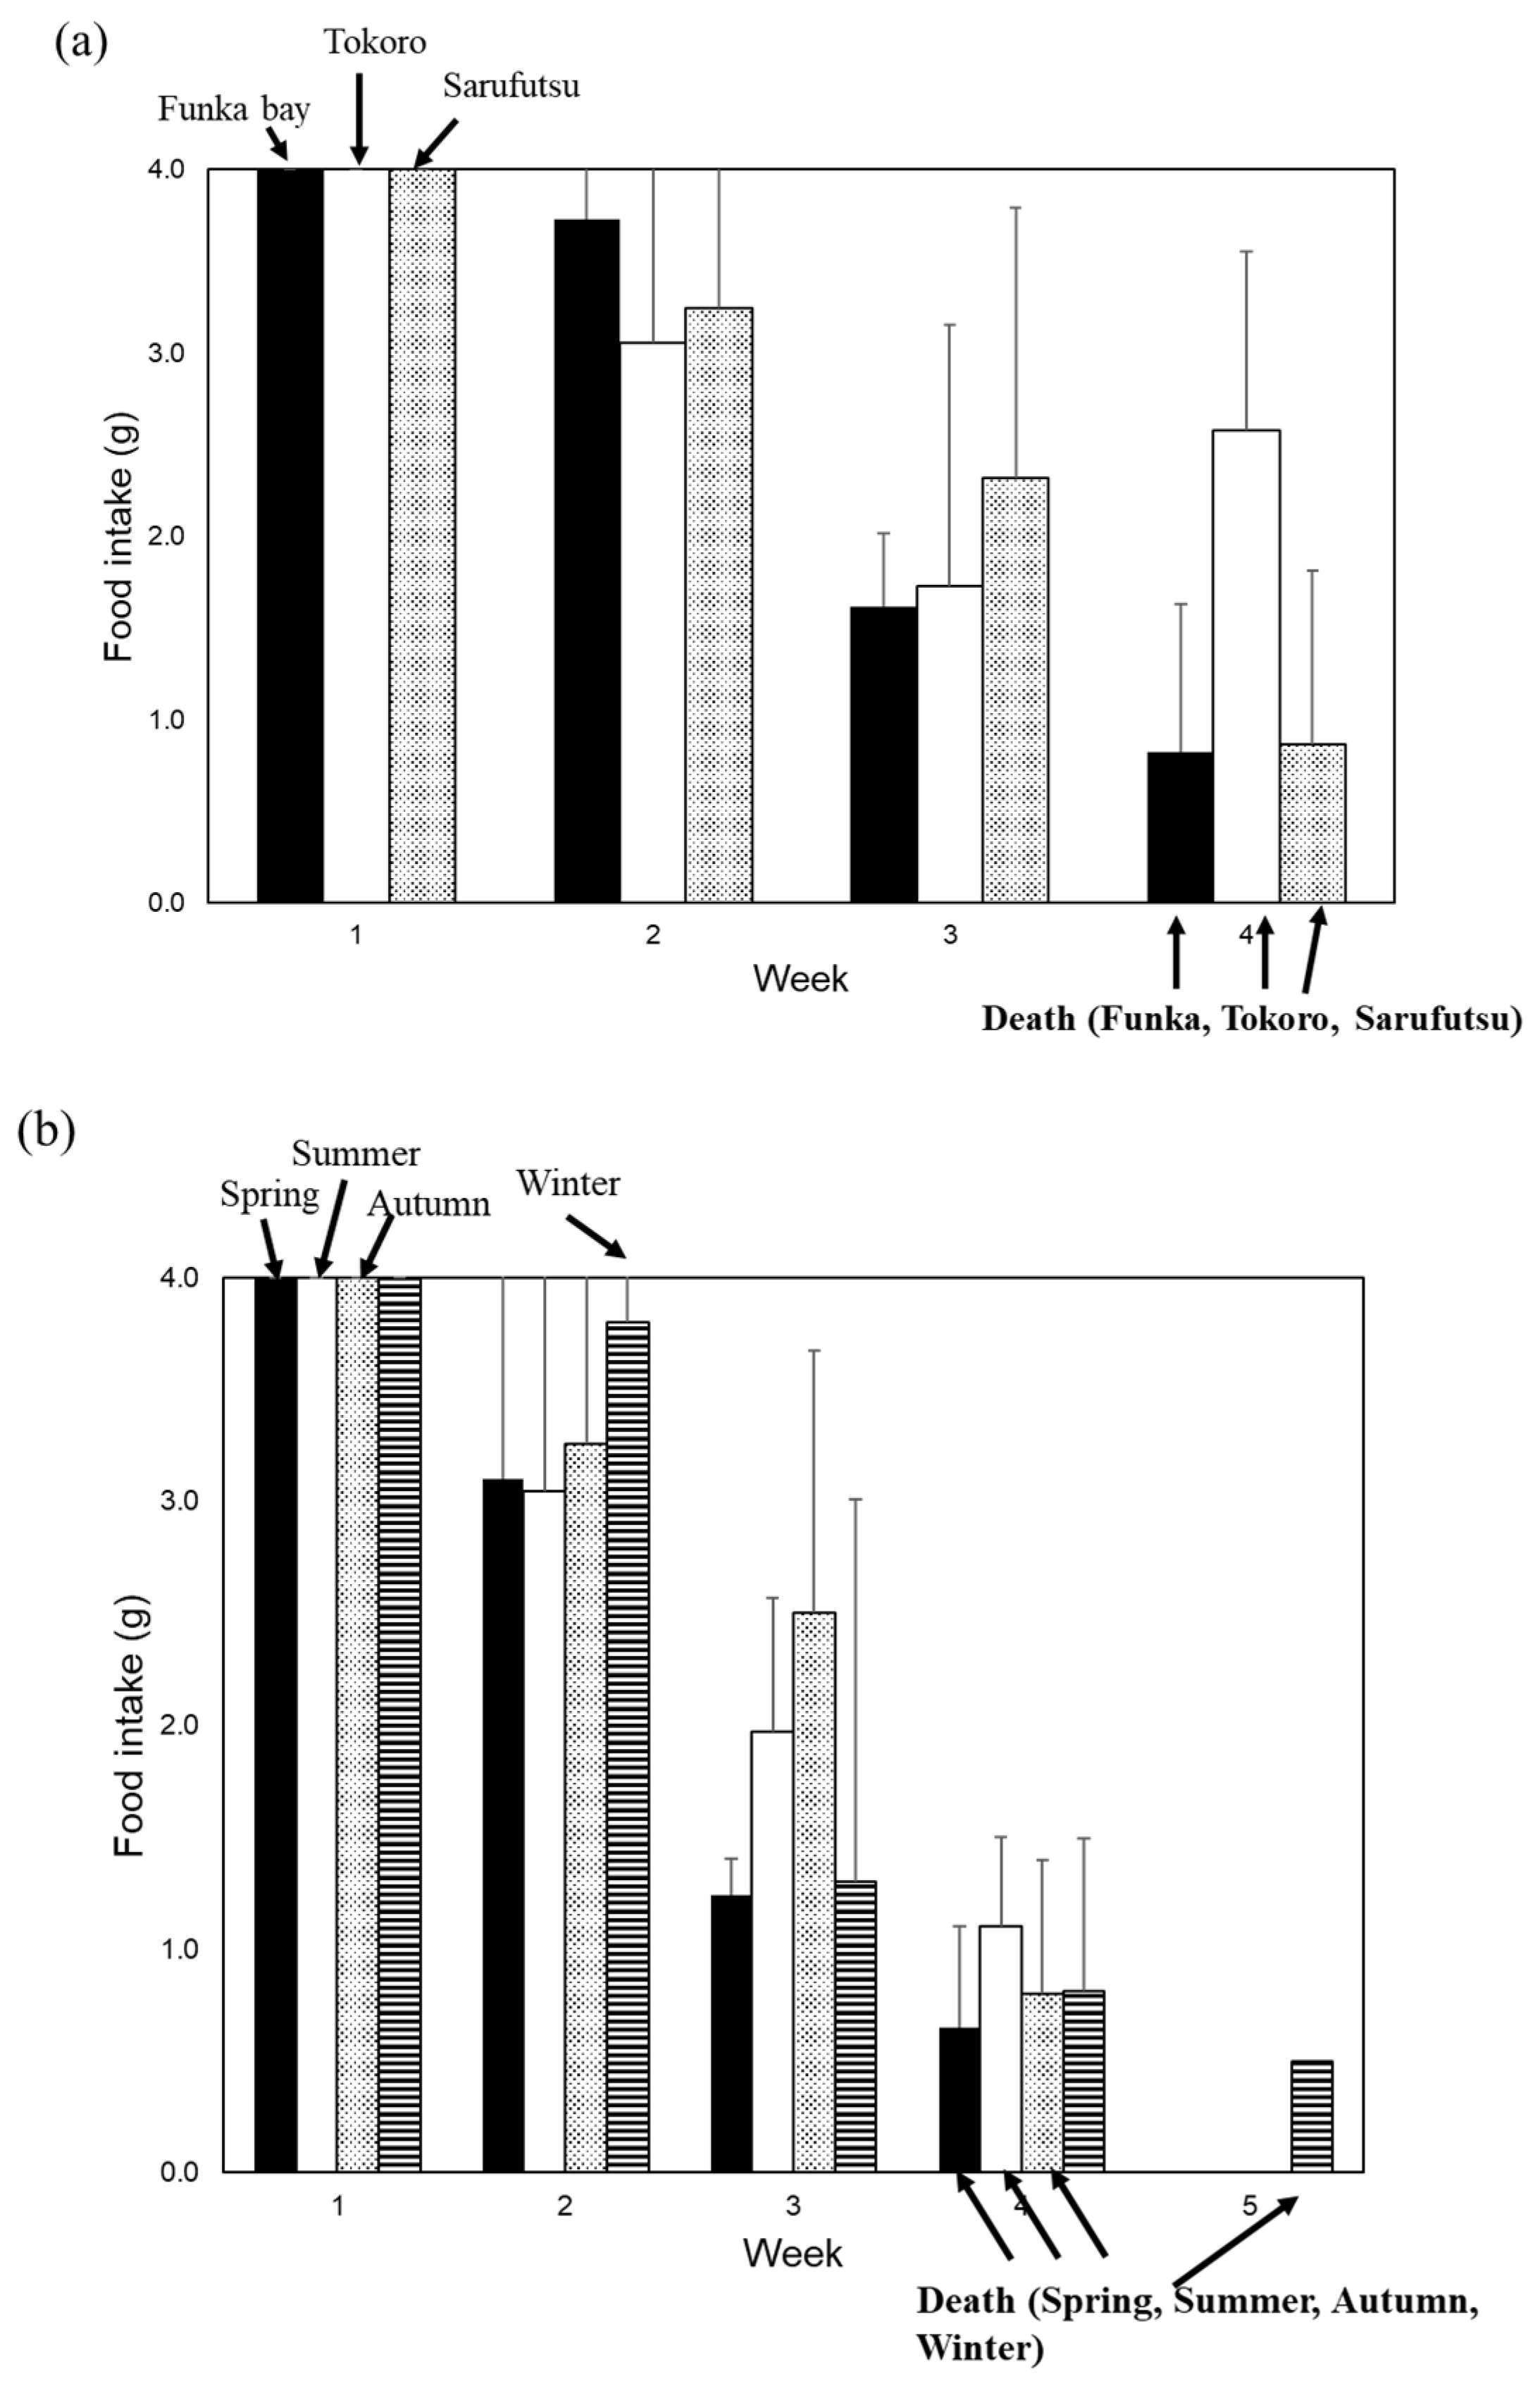
Finally, we examined whether the toxicity of the scallop mantle tissue varied depending on the location and season of collection (
Figure 4a and b). We found that all scallops collected from any location or season had toxic effects in mice.
3.3. Toxicity of the mantle tissue against small intestine
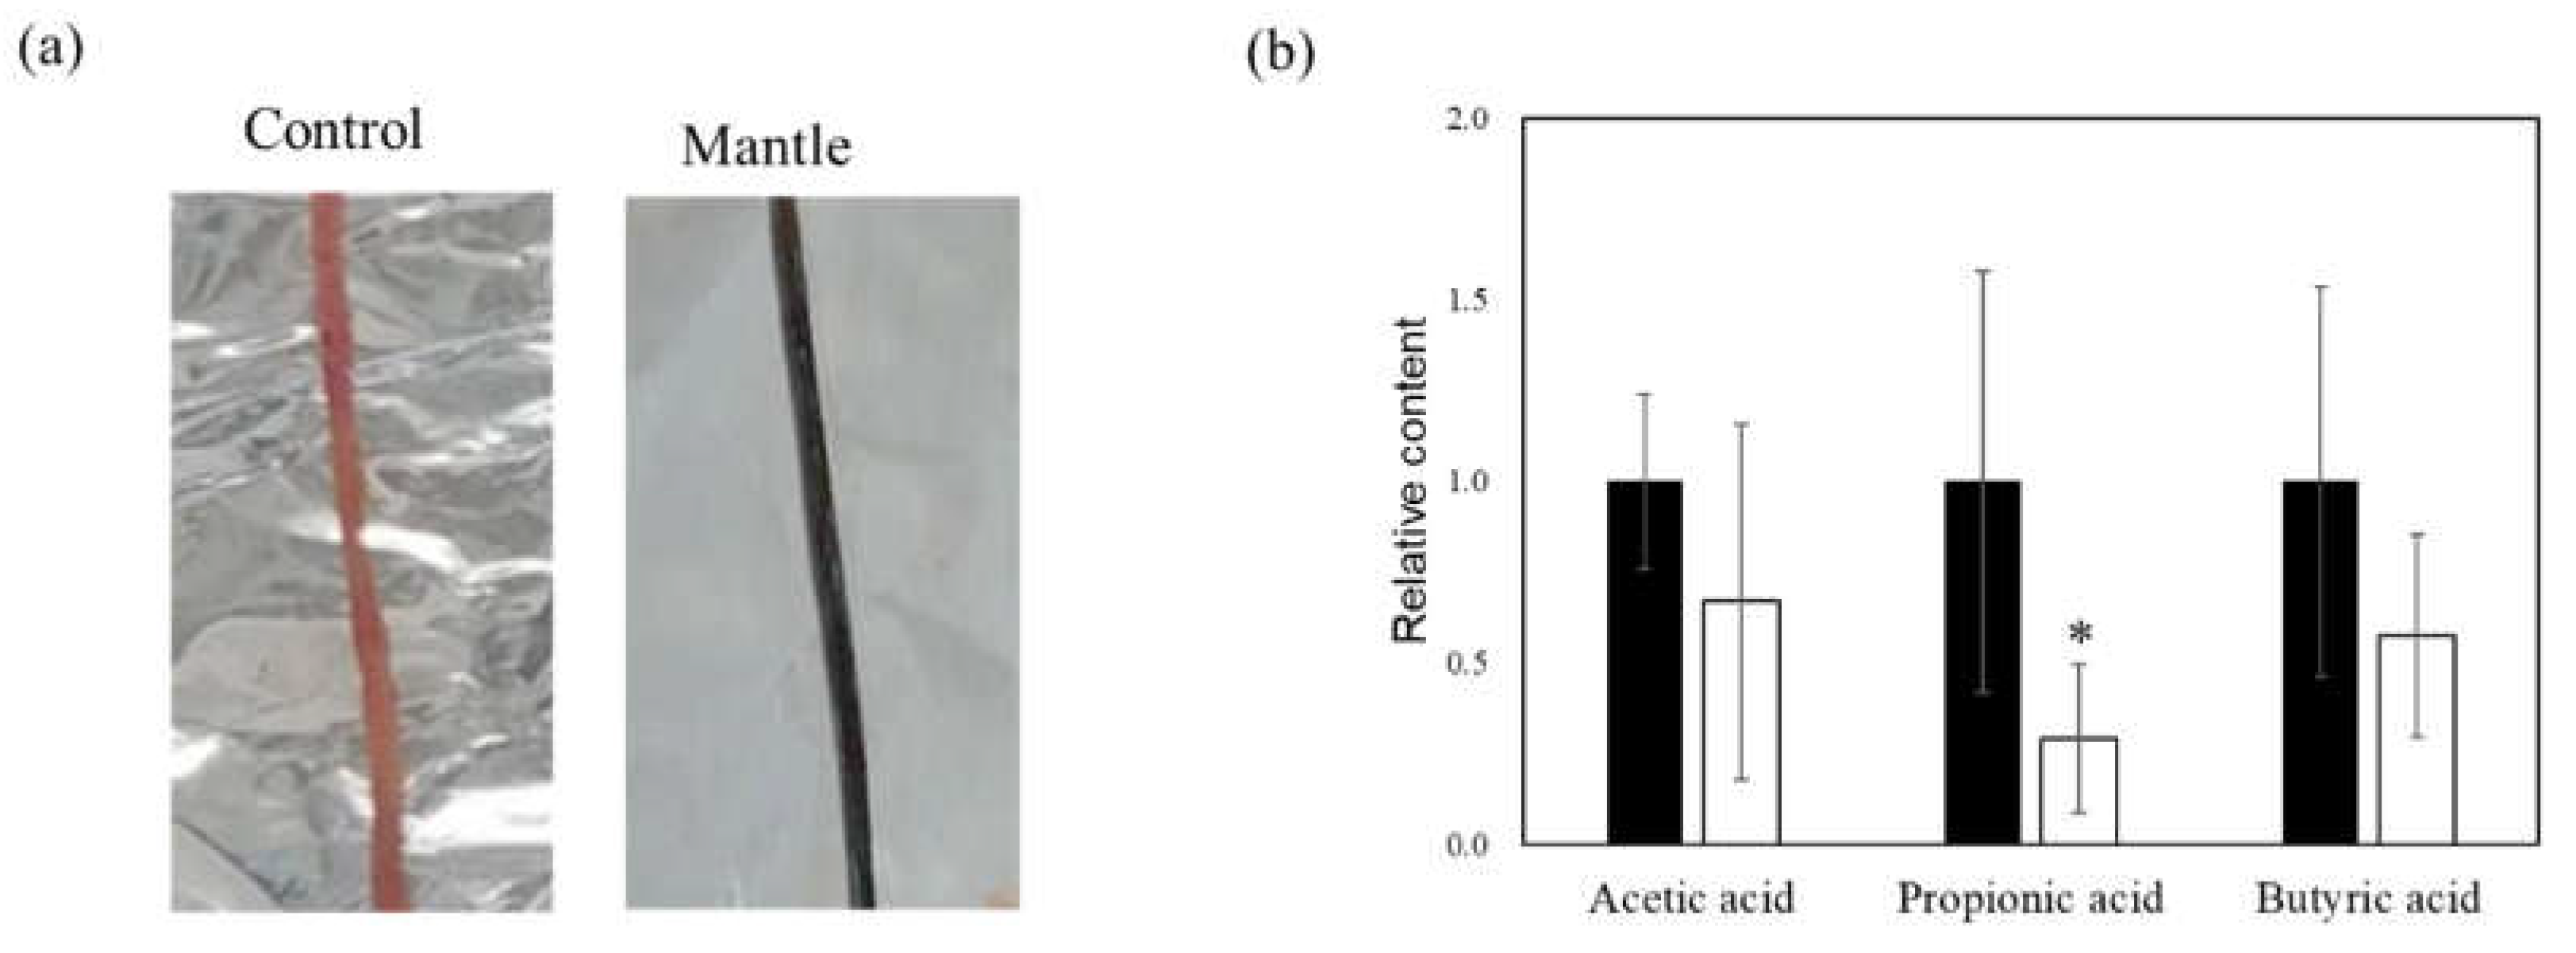
In a previous study, we showed that a diet containing scallop mantle tissue caused liver and kidney injury. We investigated mantle tissue toxicity in the small intestine. Mice fed a diet containing 1% mantle tissue for three weeks showed a change in the color of the small intestine (
Figure 5a). We examined the levels of SCFAs involved in intestinal barrier function. In mice fed a diet containing mantle tissue, SCFA levels tended to decrease, and propionic acid significantly decreased (
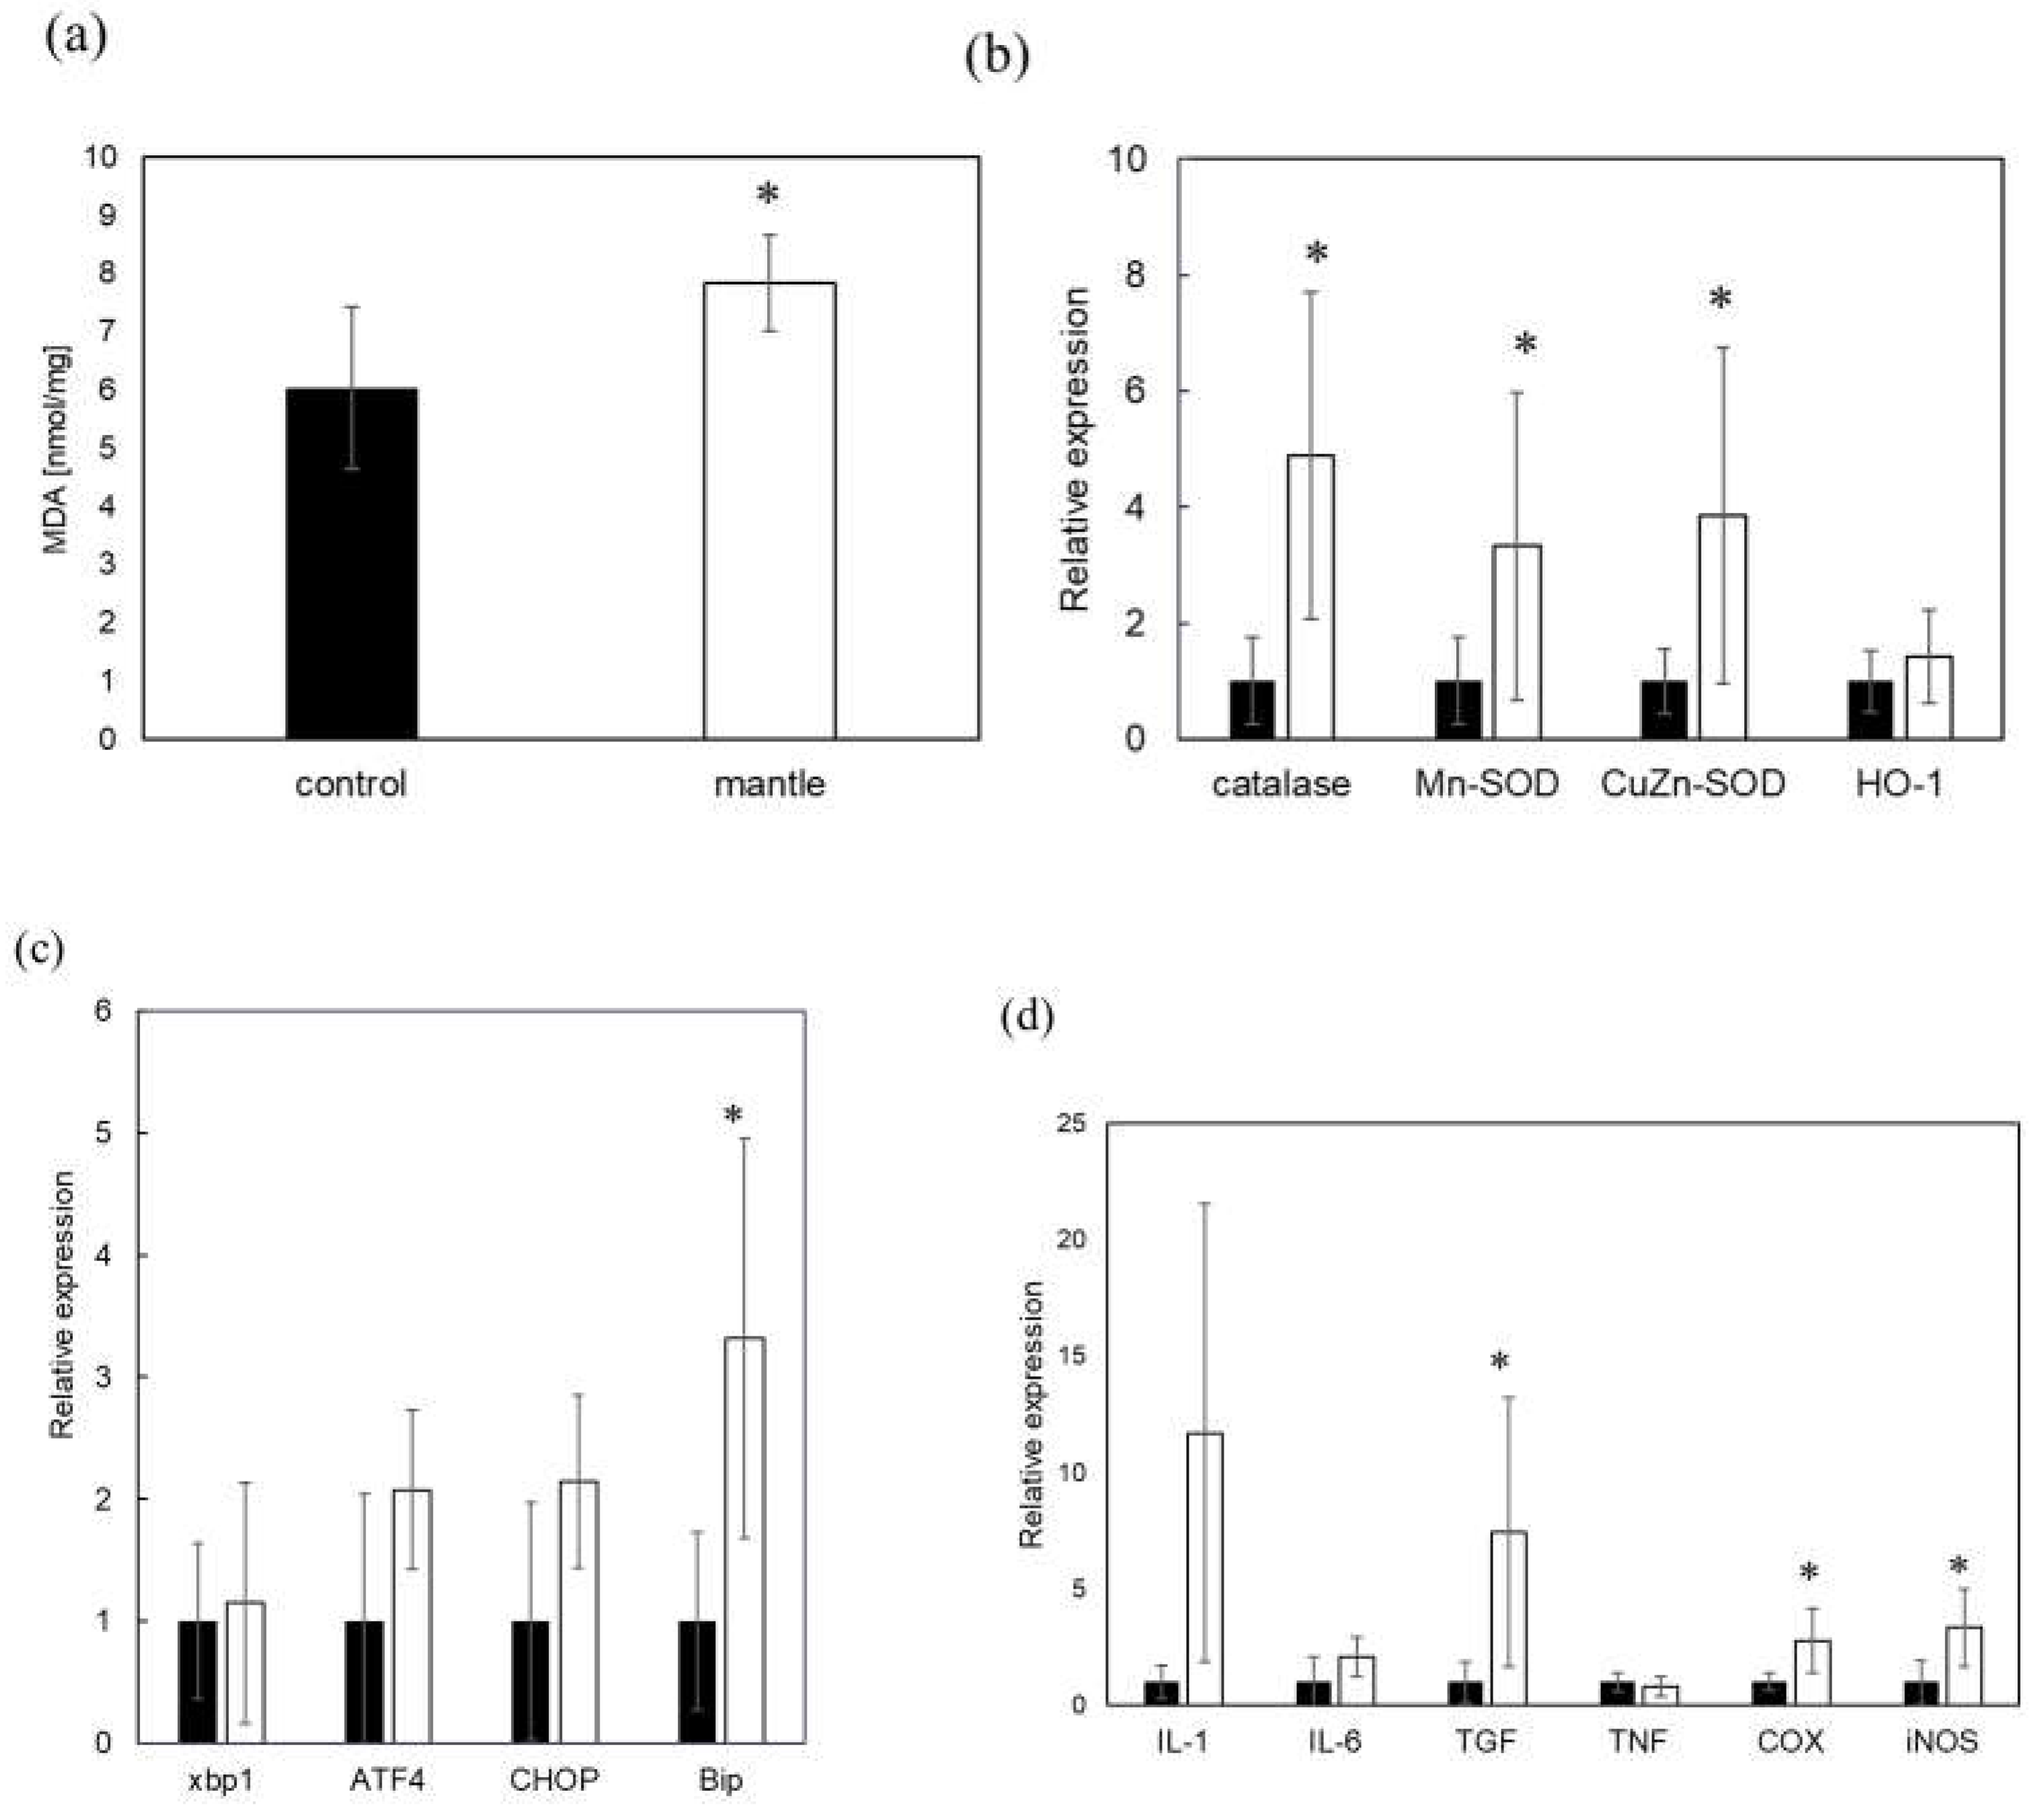
Figure 5b). Next, we examined oxidative damage and inflammation in the small intestine tissue. In the small intestine of mice fed mantle tissue, there were significant increases in the levels of peroxidized lipids (
Figure 6a); additionally, the expression levels of the antioxidant enzymes catalase, Cu,Zn-SOD and Mn-SOD were increased (
Figure 6b). Additionally, to determine whether endoplasmic reticulum (ER) stress occurred, we examined the expression levels of CHOP, BiP, and ATF4, which are upregulated during ER stress (
Figure 6c). The expression level of BiP increased significantly, and those of ATF4 and CHOP tended to increase in mice fed the mantle diet. The expression levels of iNOS, COX2, and TGF-β, which are inflammatory cytokines, also significantly increased (
Figure 6d), suggesting that ingested mantle tissue causes oxidative stress, ER stress and inflammation.
4. Discussion
We isolated and identified a novel proteinaceous toxin from scallops that exhibits subacute toxicity [
6]. Although most proteinaceous toxins are not toxic when administered orally, the evaluated toxin is toxic even after oral administration. This toxin appears to reach the small intestine without being degraded, as it remains highly stable within the mantle tissues and exhibits resistance to pepsin treatment under acidic conditions and to pancreatin treatment.
Several studies have reported that resistant proteins are resistant to digestive enzymes and behave as a dietary fiber, similar to cellulose, pectin, gum, and lignin [19, 20]. Additionally, resistant proteins have been reported to influence the gut microbiota [
21]. Murray et al. [
22] reported that pigs fed a diet containing highly resistant proteins experienced weight loss and exhibited changes in the gut microbiota. Changes in the gut microbiota can lead to alterations in SCFAs [
23], which play a crucial role in maintaining intestinal barrier function by preventing intestinal inflammation and oxidative stress [24, 25]. In mice fed a diet containing mantle tissue, SCFAs levels were significantly decreased, along with inflammation, ER stress, and oxidative damage. The toxins in the mantle tissue may have also influenced the gut microbiota, leading to a decrease of SFCAs. Some toxic substances, such as T2 toxin, can induce toxicity by causing ER stress and inflammation, leading to destruction of the small intestinal mucosa [
26]. Toxins produced by
Bacteroides fragilis also induce inflammation in the small intestine and disrupt barrier function [
27]. Similarly, these toxic substances, the toxins in mantle tissue appears to disrupt the barrier function of the small intestine.
We previously isolated a complex of gelsolin-like proteins and actin as a toxin, which acts on the actin cytoskeleton in cells, causing changes in cell morphology and exhibiting toxicity [
9].
Clostridium toxin A, which causes inflammation in the human small intestine, was reported to affect the actin cytoskeleton of small intestinal epithelial cells, resulting in barrier dysfunction [28, 29]. Toxins in the mantle tissue may also disrupt the barrier function by affecting the actin cytoskeleton of small intestinal epithelial cells.
When mice were fed a diet containing 20% or 1% mantle extract, no significant difference was observed between the two in a decrease in food intake and time to death. This result indicates that even ingestion of large amounts of mantle tissue does not cause acute toxicity. The amount of toxin absorbed into the small intestinal tissues may be limited. Furthermore, when mantle tissue was ingested every other day, toxicity was observed; however, when ingested every two days, no toxicity was observed. Because the toxicity of mantle tissues occurs with continuous ingestion, the toxin in mantle tissue does not appear to accumulate gradually in the intestines, liver, and kidneys.
Our results show that mantle tissue toxicity was highly stable against various treatments. This result was supported by the fact that one of the smoked mantle products maintained its toxicity. In this study, we focused on scallop mantle tissue. Our previous study showed that scallop ovarian tissue, which is often eaten in Japan, is also toxic. In addition, the toxin that we identified may also be present in other shellfish species. Thus, further investigations of various processed products and shellfish are necessary.
Whether ingestion of mantle tissue causes toxicity in humans has not been reported, likely because feeding of mantle tissue does not cause acute toxicity, and continuous ingestion of mantle tissue is necessary to induce toxicity. However, the possibility that chronic ingestion of mantle tissue affects human health, such as intestinal inflammation and kidney and liver injuries, cannot be excluded. Therefore, epidemiological studies are necessary to investigate their effects on human health.
5. Conclusions
The toxicity was observed only when mantle tissue was consumed continuously, and ingestion of a large amount of mantle tissue did not result in acute toxicity. The present results showed that ingestion of mantle tissue triggers inflammation, ER stress, and oxidative stress in the small intestine, leading to the incorporation of toxic substances into the body, liver, and kidneys.
Author Contributions
Research design, Y.H.; experiment and data analysis, N.M., T.Y., and G.X.; Manuscript preparation, Y.H.
Fundings: This research received no funding.
Institutional Review Board Statement
This study was approved by the Animal Ethics Committee of the Muroran Institute of Technology (number H29KS04). The study was conducted in accordance with the Guidelines of Experimental Animal Care issued by the Office of the Prime Minister of Japan, the Muroran Institute of Technology, and the Animal Ethics Committee of the Muroran Institute of Technology (number H29KS01).
Acknowledgments
The authors thank Marina Hiramura and Kota Matsumoto for their technical support.
Conflicts of Interest
The authors declare no conflicts of interest.
References
- Wang, D.Z. Neurotoxins from marine dinoflagellates: A brief review. Mar. Drugs 2008, 6, 349–371. [Google Scholar] [CrossRef] [PubMed]
- Kumar, T.; Ghosh, A.; Nandi, J. Seafood and shellfish poisoning: A review. Int. J. Sci. Dev. Res. 2021, 6, 2455–2631. [Google Scholar]
- Matsushima, R.; Uchida, H.; Nagai, S.; Watanabe, R.; Kamio, M.; Kaneiwa, M.; Suzuki, T. Assimilation, accumulation, and metabolism of dinophysistoxins (DTXs) and pectenotoxins (PTXs) in the several tissues of Japanese scallop patinopecten yessoensis. Toxins 2015, 7, 5141–5154. [Google Scholar] [CrossRef]
- Young, N.; Sharpe, R.A.; Barciela, R.; Nichols, G.; Davidson, K. ; Berdalet E.; Fleming, L.E. Marine harmful algal blooms and human health: a systematic scoping review. Harmful Algae 2020, 98, 11901. [Google Scholar]
- Pradhan, B.; Kim, H. ; Abassi,S.; Ki, J.S. Toxic effects and tumor promotion activity of marine phytoplankton toxins: a review. Toxins 2022, 14, 397. [Google Scholar]
- Hasegawa, Y.; Itagaki, D.; Konno, K.; Hasegawa, C. Feeding of scallop mantle epithelial cell layer causes subacute toxicity against rodents. Fish. Sci. 2018, 84, 91–10. [Google Scholar] [CrossRef]
- Kariya, T.; Hasegawa, Y. Scallop mantle toxin induces apoptosis in liver tissues of mice. Food Sci. Nutr. 2020, 8, 3308–3316. [Google Scholar] [CrossRef]
- Kariya, T.; Takahashi, K.; Itagaki, D.; Hasegawa, Y. Scallop mantle extract inhibits insulin signaling in HepG2 cells. Food Sci. Nutr. 2019, 7, 2159–2166. [Google Scholar] [CrossRef] [PubMed]
- Maeda, N.; Yoshida, F.; Matsumoto, K.; Takahashi, S.; Geng, X.; Hasegawa, Y. Isolation and identification of a novel toxin in scallop mantle tissue. Front. Mar. Sci. 2023, 1–2023. [Google Scholar] [CrossRef]
- Sandvig, K.; Torgersen, M.L.; Engedal, N.; Skotland, T.; Iversen, T.G. Protein toxins from plants and bacteria: Probes for intracellular transport and tools in medicine. FEBS Lett. 201, 584, 2626–2634. [Google Scholar]
- Janik, E.; Ceremuga, M.; Saluk-Bijak, J.; Bijak, M. Biological toxins as the potential tools for bioterrorism. Int. J. Mol. Sci. 2019, 20, 1181. [Google Scholar] [CrossRef] [PubMed]
- Polito, L.; Bortolotti, M.; Battelli, MG.; Calafato, G.; Bolognesi, A. Ricin: An ancient story for a timeless plant toxin. Toxins 2019, 11, 324. [Google Scholar] [CrossRef]
- Garber, E.A. Toxicity and detection of ricin and abrin in beverages. J. Food Prot. 2008, 71, 1875–1883. [Google Scholar] [CrossRef]
- Bligh, E. G, Dyer, W. J. A rapid method of total lipid extraction and purification. Can J Biochem Physiol 1959, 37, 911–917. [Google Scholar]
- Laemmli, U.K. Cleavage of structural proteins during the assembly of the head of bacteriophage T4. Nature 1970, 227, 680–685. [Google Scholar] [CrossRef] [PubMed]
- Yamagami, H.; Fuji, T.; Wako, M.; Hasegawa, Y. Sulfated polysaccharide isolated from the nacre of pearl oyster improves scopolamine-induced memory impairment. Antioxidants 2021, 1, 505. [Google Scholar] [CrossRef]
- Omachi, T.; Matsuyama, N.; Hasegawa, Y. Nacre extract from pearl oyster suppresses LPS-induced depression and anxiety. J. Funct. Foods 2023, 10, 15373. [Google Scholar] [CrossRef]
- Du, X.; Xiang, Y.; Lou, F.; Tu, P.; Zhang, X.; Hu, X.; Lyu, W.; Xiao, Y. Microbial community and short-chain fatty acid mapping in the intestinal tract of quail. Animals (Basel) 2020, 1(6), 106. [Google Scholar] [CrossRef]
- Jones, J.M. CODEX-aligned dietary fiber definitions help to bridge the ‘fiber gap’. Nutr. J. 2014, 13, 34. [Google Scholar] [CrossRef]
- Davidson, M.H.; McDonald, A. Fiber: Forms and functions. In Proceedings of the Nutrition Research; Elsevier: Amsterdam, The Netherlands, 1998, 18, 617–624.
- Zannini, E.; Sahin, A.W.; Arendt, E.K. Resistant protein: forms and functions. Foods 2022, 11, 2759. [Google Scholar] [CrossRef]
- Murray, M.; Coughlan, M.T.; Gibbon, A.; Kumar, V.; Marques, F.Z.; Selby-Pham, S.; Snelson, M.; Tsyganov, K.; Williamson, G.; Woodruff, T.M.; Wu, T.; Bennett, L. Reduced growth, altered gut microbiome and metabolite profile, and increased chronic kidney disease risk in young pigs consuming a diet containing highly resistant protein. Front. Nutr. 2022, 9, 816749. [Google Scholar] [CrossRef]
- Morrison, D.J.; Preston, T. Formation of short chain fatty acids by the gut microbiota and their impact on human metabolism. Gut Microbes 2016, 7, 189–200. [Google Scholar] [CrossRef]
- Chambers, E.S.; Preston, T.; Frost, G.; Morrison, D.J. Role of gut microbiota-generated short-chain fatty acids in metabolic and cardiovascular health. Curr. Nutr. Rep. 2018, 7, 198–206. [Google Scholar] [CrossRef]
- Portincasa, P.; Bonfrate, L.; Vacca, M.; De Angelis, M.; Farella, I.; Lanza, E.; Khalil, M.; Wang, D.Q.-H.; Sperandio, M.; Di Ciaula, A. Gut microbiota and short chain fatty acids: implications in glucose homeostasis. Int. J. Mol. Sci. 2022, 23, 115. [Google Scholar] [CrossRef] [PubMed]
- Lin, R.; Sun, Y.; Ye, W.; Zheng, T.; Wen, J.; Deng, Y. T-2 toxin inhibits the production of mucin via activating the IRE1/XBP1 pathway. Toxicology 2019, 424, 152230. [Google Scholar] [CrossRef] [PubMed]
- Alexandrov, P.N.; Hill, J.M.; Zhao, Y.; Bond, T.; Taylor, C.M.; Percy, M.E.; Li, W.; Lukiw, W.J. Aluminum-induced generation of lipopolysaccharide (LPS) from the human gastrointestinal (GI)-tract microbiome-resident Bacteroides fragilis. J. Inorg. Biochem. 2020, 203, 11886. [Google Scholar] [CrossRef] [PubMed]
- Bobo, L.D.; El Feghaly, R.E.; Chen, Y.S.; Dubberke, E.R.; Han, Z.; Baker, A.H.; Li, J.; Burnham, C.A.; Haslam, D.B. MAPK-activated protein kinase 2 contributes to Clostridium difficile-associated inflammation. Infect. Immun. 2013, 81(3), 713–722. [Google Scholar] [CrossRef]
- Shen, A. Clostridium difficile Toxins: Mediators of inflammation. J. Innate Immun. 2012, 4(2), 149–158. [Google Scholar] [CrossRef]
Figure 1.
Toxicities of the NaOH-, HCl-, H2O2-, DTT-, and heating-treated mantle tissue. (a) Diets containing 1% HCl-treated mantle tissue (dotted bar), 1% NaOH-treated mantle tissue (striped bar), 1% non-treated mantle tissue (open bar), or control diet (closed bar) were fed to mice. (b) Diets containing 1% H2O2-treated mantle tissue (dotted bar), DTT-treated mantle tissue (striped bar), or 1% non-treated mantle tissue (open bar) were fed to mice. (c) Diets containing 1% heating-treated mantle tissue (dotted bar) or 1% non-treated mantle tissue (open bar) fed to mice. The food intake of each week is shown. Data were combined from 3 mice and the bars show the SD.
Figure 2.
Toxicities of the NaOH-, HCl-, and heating-treated mantle extract. (a) Diets containing 1% HCl-treated mantle extract (dotted bar), 1% NaOH-treated mantle tissue (striped bar), 1% non-treated mantle tissue (open bar), 1% heating-treated mantle extract (hatched bar), or control diet (closed bar) were fed to mice. (b) Diets containing 1% pepsin-treated mantle extract (open bar), 1% pancreatin-treated mantle extract (dotted bar), control diet containing pepsin (closed bar), or control diet containing pancreatin (striped bar) were fed to mice. (c) SDS-PAGE of mantle extract, pepsin-treated mantle extract, and pancreatin-treated mantle extract. (d) Diets containing 1% smoked mantle product A (closed bar), 1% smoked mantle product B (dotted bar), 1% smoked mantle product C (striped bar), or 1% mantle tissue (open bar) were fed to mice. The food intake of each week is shown. Data were combined from 3 mice and the bars show the SD.
Figure 3.
Toxicities of the mantle extract or mantle tissue under different conditions. (a) Diets containing 1% mantle extract (open bar), 3% mantle extract (dotted bar), 5% mantle extract (striped bar), 10% mantle extract (hatched bar), 20% mantle extract (vertical striped bar) or without mantle extract (closed bar) were fed to mice. (b) Diets containing 1% mantle tissue were fed to mice every day (open bar), every other day (dotted bar), every two days (striped bar), and every seven days (hatched bar); a control diet (closed bar) was fed to control group mice. The food intake of each week is shown. Data were combined from 3 mice and the bars show the SD.
Figure 4.
Toxicities of the scallop mantle tissue from different locations and seasons. (a) Diets containing 1% mantle tissue from Funka Bay (Hokkaido) (closed bar), 1% mantle tissue from Tokoro (Hokkaido) (open bar), and 1% mantle tissue from Saruhutsu (Hokkaido) (dotted bar) were fed to mice. (b) Diets containing 1% mantle tissue from scallop harested from Mutsu Bay (Aomori) in spring (closed bar), in summer (open bar), autumn (dotted bar), or winter (striped bar) were fed to mice. Data were combined from 3 mice and the bars show the SD.
Figure 5.
Toxicity of the mantle tissue against small intestine. (a) Photograph of small intestine of mice fed control diet (left) or a diet containing 1% mantle tissue (right). (b) Short-chain fatty acid concentrations in cecal contents. Control diet (closed bar) or a diet containing 1% mantle tissue (open bar). The values of 12 mice are presented as the means ± SD. *p < 0.05 relative to control diet (Student’s t-test).
Figure 6.
Changes in oxidative stress, inflammation, and ER stress in the small intestine of the mice fed the control and mantle diets. (a) Malondialdehyde (MDA) content in the small intestine. Lipid peroxidation in the small intestine of mice fed either the control diet (closed bar) or mantle diet (open bar) was expressed as the MDA content. (b–d) Changes in the expression of enzymes in the small intestine of mice fed the control and mantle diets were measured using real-time polymerase chain reaction. (b) Antioxidant enzymes, (c) ER stress-related proteins, and (d) inflammation-related proteins. The values of 12 mice are presented as the means ± SD. Asterisks indicate statistically significant differences relative to the control diet (*p < 0.05).
Table 1.
Composition of control diet and mantle diet.
Table 1.
Composition of control diet and mantle diet.
Table 2.
Primer sequences.
Table 2.
Primer sequences.
|
Disclaimer/Publisher’s Note: The statements, opinions and data contained in all publications are solely those of the individual author(s) and contributor(s) and not of MDPI and/or the editor(s). MDPI and/or the editor(s) disclaim responsibility for any injury to people or property resulting from any ideas, methods, instructions or products referred to in the content. |
© 2023 by the authors. Licensee MDPI, Basel, Switzerland. This article is an open access article distributed under the terms and conditions of the Creative Commons Attribution (CC BY) license (http://creativecommons.org/licenses/by/4.0/).
