Preprint
Article

Mechanical Simulation on the Vertical Migration of Ore-forming Elements in Soil Cover

Altmetrics

Downloads

106

Views

22

Comments

0

This version is not peer-reviewed

Submitted:

19 July 2023

Posted:

20 July 2023

You are already at the latest version

Alerts
Abstract
For deep-penetrating geochemistry, there is a frontier issue as to how to explore ore-bearing information deep in covered areas, while it is, too, important to investigate the geochemical migration of ore-forming elements for the development of exploration geochemistry. In this study, a 380-day migration column experiment was conducted with surface soil and pure Cu powder collected from the Yujiashan study area in Wuhan City, Hubei Province taken as the object of research to simulate the migration process of ore-forming elements under natural conditions. The results showed obvious vertical migration of the ore-forming elements and conversion of mobile metal forms in the process; further, according to 6 groups of simulation experiments that took 45 days to conduct on migration column samples and the surface oil and Cu powder collected from the Pulang mining area in Yunnan Province, the vertical migration of the ore-forming element was still visible, and the exogenous substance (pure Cu powder) could enhance the anomaly without changing the basic migration mechanism. This indicates that Cu might migrate in a stable manner in soil cover in the Pulang mining area, and its migration was mostly driven by the transformation of Fe-Mn oxide bound state and organic bound state; finally, a multifractal analysis was conducted, revealing that the ore-forming elements presented a nonlinear and complex structure during their upward migration, which caused anomalies in the covered area, and multiple parameters exerted a certain indicative effect on different source intensities and properties of soil. In this study, laboratory simulations were performed to summarize the active-state evolution pattern and migration mechanism of ore-forming elements with a view to providing technical support and theoretical guidance for geochemical prospecting in the covered region.
Keywords: 
Subject: Environmental and Earth Sciences  -   Geophysics and Geology

1. Introduction

As easy-to-exploit mineral resources are gradually exploited (Baudeta et al., 2018; Farahbakhsh et al., 2020), the prospecting work in covered areas draws increasing attention from the geoscience community (Arai et al., 2021;Li et al., 2021;Salama et al., 2021). In recent years, new techniques have been brought forth one after another for prospecting in covered areas, while lots of researchers have studied the path of element migration and its influencing factors using unconventional geochemical prospecting technology (Mohammadi et al., 2016; Schumacher, 2000; Cohen et al., 2014). Most of them adopt the deep-penetrating geochemical prospecting technology and make use of geochemical data-based mathematical models and computer techniques to sort out, evaluate and predict relevant information, so as to reveal the migration process of elements and establish a quantitative model. For example, the information related to active and weakly bound elements selectively extracted from soil and air (including the air in soil) (Wen et al., 2012, 2013) plays a great role in mineral prospecting and prediction in the covered region. For prospecting in a covered region with poor outcrop, the information related to element migration is also used to identify the source of geochemical anomalies (Dobretsov et al., 2010; Wang et al., 2005; Xie, 2012).
Considering the ease of controlling variables and simulating diffusion and leaching, the laboratory migration column experiment method is widely applied to the research of environmental science and agricultural science research (Charles, 2002), but his experimental analysis technique is rarely utilized in the field of geochemistry. Some academic researchers, such as Wang Xueqiu, succeeded in simulating the migration of Nanoparticles in overburden soil by using the laboratory migration column experiment method in combination with deep-penetrating geochemistry. These Nanoparticles were then compared with those observed in ores, geogas above the ore body and soil. The results showed highly similar size, morphology and element association, indicating that there is a genetic relationship between the two types of Nanoparticles. This discovery provides a means for the study of Nanomaterials in overburden areas by geogas method and also offers new ideas to the application of migration column experiments in geosciences (Wang Q.X. et al., 2012; Wang et al., 2016; Liu et al., 2019).
This study aims to explore how to use the deep-penetrating geochemical prospecting technology for prospecting in overburden areas. Creatively, according to Wang Xueqiu (2012) et al.’s experiments on overburden areas in deserts, a laboratory migration column experiment and a tube migration experiment were designed and developed for simulating the migration process of elements; MOMEO, a method for mobile metal form measurement proposed recently (Wang & Xie, 1995; Ge & Shen, 1997; Liu et al., 1997; Tong & Li, 1999), was used to investigate the mechanism of the vertical upward migration of elements in overburden areas; based on the nonlinear theory, a quantitative evaluation model was established for the vertical distribution of elements in the overburden to provide a new idea for quantitative prediction of concealed deposits in desert overburden areas.

2. Geographical and Geological Settings

2.1. Pulang Mining Area

The study area is located in the northeastern part of Shangri-La City, Diqing Tibetan Autonomous Prefecture, Northeastern Yunnan Province, China and at the southeastern margin of the Qinghai-Tibet Plateau, the northeastern part of the Hengduan Mountains in Northwestern Yunnan Province, close to the Three Parallel Rivers World Natural Heritage Area. There are high mountains and dense forests in the mining area, which is sparsely populated, with the highest altitude of 4,702m and lowest altitude of 3,450m. The mean annual temperatures is 4°C, the highest mean monthly temperature is 10°C, and the lowest mean monthly temperature is -8°C. Situated in the hinterland of the Hengduan Mountains at the southeastern margin of the Qinghai-Tibet Plateau, the mining area is high in northwest and low in southeast, with a large altitudinal gradient, obvious climate difference and significant vertical variation. The area has a subtropical alpine monsoon climate, a mean annual temperature of 5.5°C, mean annual precipitation of 618 mm, obviously wet and dry season, and a significant vertical climate difference (Le’anwangdui, 2003). The main soil types are dark brown soil, brown coniferous forest soil and alpine meadow soil (Yang et al., 2015).
Mineralization occurred in the complex porphyry, composed of several ore bodies, of which the main ore body, KT1, occurred in the potassic-silicified phyllic zone at the center of No. 1 Porphyry in Pulang, barrel-shaped, with outcrop elevation of 3,868~4,023m and overall length of more than 1,400m, spreading in NNW direction. The southern part is 360~600m wide, while the northern part is narrower, 120~300m wide. At present, the elevation of the ore body controlled by drilling is 2,673m at the deepest point. The ore body is huge in size and simple in form.
The main ore-forming element is Cu, while there are also useful constituents such as Au, Ag, Mo, S, etc. Cumulative prospective copper resources: 1,449,330,000t of ore and 4800,084t of metal, with an average grade of 0.33%. Total resources containing beneficial components: gold (Au), 146,414kg of metal, with an average grade of 0.10g/t; silver (Ag), 2601,856kg of metal, with an average grade of 1.80g/t; 194,288t of molybdenum (Mo), with an average grade of 0.01%; sulfur (S), 1,144,300t of metal, with an average grade of 0.79%.

2.2. Yujiashan Study Area

The study area, located in southeastern Wuhan City, Hubei Province, is a humid region with a subtropical monsoon climate that boasts superior climatic conditions. It is generally 60~110 m above sea level, relatively rainy in spring and summer, and less rainy in autumn and winter, especially a bit arid in winter. The mean annual temperature is 16.3°C, but the value of temperature changes greatly from month to month, with a difference of about 25°C between the hottest month and the coldest month. The highest mean monthly temperature is about 29°C (July) and the lowest mean monthly temperature is about 4°C (January), i.e., the temperature is typically high in summer and low in winter. The mean annual precipitation is 1,163 mm, i.e., rainfall is abundant in this region. Moreover, the area is surrounded by the Yangtze River and lakes, including the East Lake. There are low hills in the area, so it boasts an obvious lake effect, mound effect and urban effect.
The study area spans two primary stratigraphic regions, including Qinling and Yangzi. Quaternary deposits are widely distributed in the area, accounting for about 90% of the total area (Yufen Zhang et al., 2019). The exposed bedrocks fall broadly into Silurian siltstone, Devonian quartz sandstone, Carboniferous limestone, dolomitic limestone, and Permian silicolite, which mostly outcrop in low hills. The Yujiashan study area is also a low-hilly region, but it is a quaternary cover area. Additionally, owing to the impact of structural factors, etc., the exposed bedrocks do not cover all types, while there are only the following types: middle Silurian fentou formation (S2f), lower Permian gufeng formation (P1g) and Quaternary sediments (Q). Carboniferous strata do not outcrop.

3. Materials and Methods

3.1. Migration Column Experiment

Surface soil samples were collected from the Yujiashan study area, Hongshan District, Wuhan City, Hubei Province and dried.
A migration column experiment device was set up in the laboratory (Figure 1): The main body of the migration column was a lead-free lucite tube (with an inner of diameter 30 cm and height of 100 cm), sealed at the top, with four sampling apertures set up at 20 cm, 40 cm, 60 cm and 80 cm away from the bottom of the column. To simulate the actual soil conditions as much as possible to reveal the original soil structure and physicochemical properties, the bottom layer of the migration column was first lined with 300 g of Cu powder (natural pure Cu powder) and then stuffed in the order of natural stratigraphic stacking.
Owing to the low migration rate of elements in the natural environment and the natural settlement of fluvial sand in the migration column under the action of gravity, the device was kept unmoved for one year and samples were taken when fluvial sand was stabilized. Considering that the velocity of element migration would be low under natural conditions, necessitating a long geological period for the migration from the bedrocks to the surface, whereas the amount of element migration was not significant within a short period under a single laboratory condition, four samples were taken from the top down at each sampling point at an interval of one month, two months and three months, respectively. Samples were collected for a total of four times, with pXRF (Niton XL2950) used to measure the content of Cu in the samples.

3.1.2. Migration Micro-Column Experiment

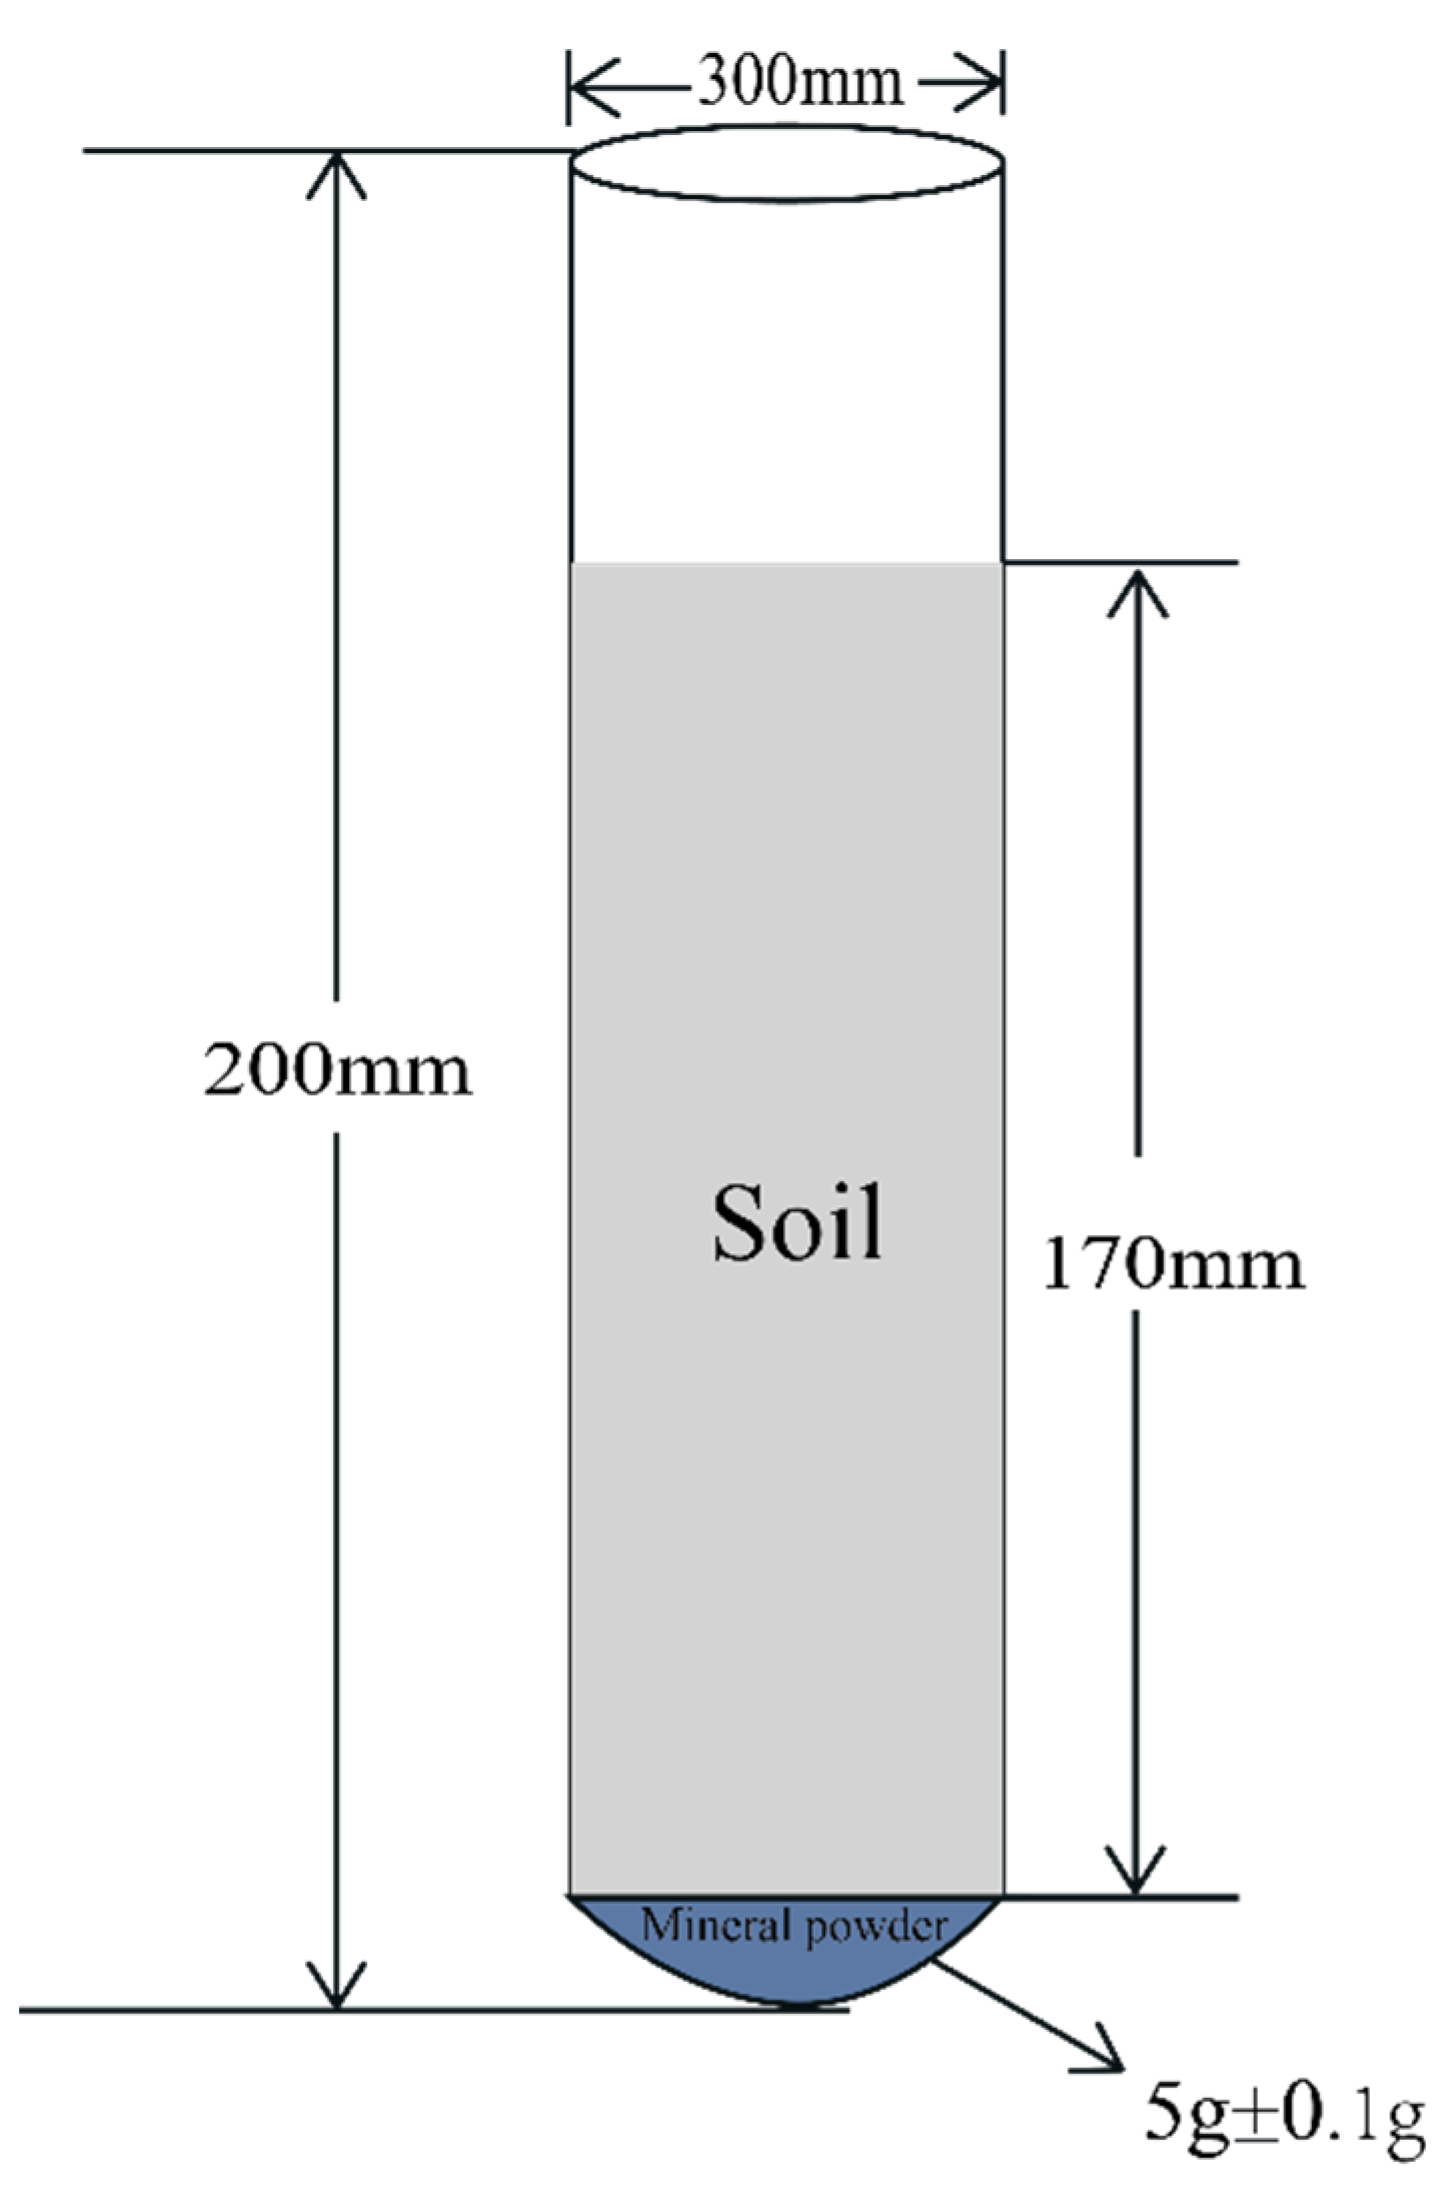
To further investigate the vertical migration characteristics of different elements in soil on a temporal scale, as well as the relevant influencing factors, so as to further reveal the complex migration process of elements, multiple sets of laboratory test-tubes were designed in this study to simulate a migration column experiment (Figure 2): A lead-free glass test tube (200 mm in length and 30 mm in mouth diameter) was used. First of all, a layer of mineral powder/ore powder (2 mm in thickness and 5 g in weight) was spread at the bottom of the test tube (the mineral powder was natural Cu powder; the ore powder was made from the copper ore exploited in the Pulang study area and ground into 200 mesh). Then, the soil samples collected from different study areas were dried and filled into the test tube so that the total height of soil samples and mineral powder should be about 170 mm, sealed with the plug at the top.
Six groups of parallel experiments were designed and conducted in the test tube. Bottom ore and migrating soil samples were added to each parallel experiment group while corresponding soil samples in equal quantity to the simulated ore were added to the control group to simulate the vertical migration of elements deep in the ore body. The test tube was heated slowly in a thermostatic water bath device (50°C) to accelerate the vertical migration of the elements. The sampling frequency was set to 5d/time as heating began, and the experimental period was set to 45d.
The samples in each group were numbered 0Y-1…0Y- 9,0P-1…0P- 9,CuY-1…CuY- 9,CuP-1…CuP- 9,PY-1…PY-9, and PP-1…PP-9. The specific experimental and sampling information is shown in Table 1.

3.2. Analysis on the Mobile Forms of Metal

At present, there is no uniform definition or classification for research on the existing forms of metal in soil. For the analysis of the existing forms of metal, there are two methods: single extraction and sequential extraction. Multi-level continuous extraction is mostly used in geochemical studies, i.e., a specific extractant is used for continuously extract each form of metal in soil level by level. Then, instruments were used to analyze and determine the concentration of the metal in the leachate to measure the content of each form.
Several scholars have proposed different approaches to classify the active states of metal. Two widely used classification methods are Tessier classification (1979) and BCR classification (1993). According to Tessier classification, mobile metal forms are divided into exchangeable form, carbonate-bound form, Fe-Mn oxide bound form, organic bound form and residual form; according to BCR classification, the mobile forms of heavy metal are divided into acid soluble form, reducible form, oxidizable form and residual form. There are also many other classification methods such as Forstner classification (1980), Gambrell classification (1994) and Leleyter classification (1999).
Ye Junwen (2018) compared Tessier classification with BCR classification in terms of their accuracy in measuring the content of the available forms of heavy metal in soil when studying the mobile forms of Cu and Cd under different soil conditions, finding that Tessier classification could be used to determine the content of the mobile forms of Cu more accurately.
Therefore, in this study, Tessier’s sequential extraction method (J.W. Ye, 2018) was used in combination with the inductively coupled plasma-mass spectrometry (ICP-MS) (PerkinElmer NexION 2000) to extract and determine the content of each form in the samples, analyze the change rule of ore-forming element content and the heterogeneity of migration, and observe the migration process of major ore-forming elements and associated useful components.

3.3. Multifractal Theory

Numerous research findings show that as a frontier research orientation in geoscience, modern nonlinear and complexity theories can be used together for geochemical prospecting and evaluation. Recent research (Cheng et al., 2021) shows that the nonlinear theory, especially fractal and multifractal theories, and singularity theory, can be introduced into geoscience to develop mathematical geochemistry to reveal the complex process of ore formation and the enrichment regularity of metallogenic materials and obtain metallogenic information.
As an important part of nonlinear and complexity theories, the fractal and multifractal theory can be used in the study of metallogenic theory to reveal the formation and growth of minerals, the regularity of element enrichment and diffusion, and the information of the ore source (Xie et al., 2002; Cheng, 2006). When raw geochemical data are analyzed in a nonlinear theoretical model such as a fractal theoretical model, it is unnecessary to eliminate the geochemical data with extreme values, thereby maintaining the integrity of the data and better reflecting the characteristics of the raw data.
Furthermore, the fractal theory model, which not only considers the frequency distribution of geochemical data and the spatial variability of anomalies, but also measures the self-similarity of geochemical fields, is more consistent with the inhomogeneity and randomness of element distribution, so that the mineralization anomalies extracted are more objective and realistic. MOMEO, which is highly sensitive in extracting anomalies from desert-covered areas and hidden ore bodies, can be used to directly obtain mineralization information from the ore body (Lu, 2019).
Fractals were first proposed by Hausdroff in 1919. With increasingly intensive studies on fractal self-similarity and singularity, lower-order moments could no longer be used alone to well describe fractal characteristics. For more complex fractal measurement, it should have the properties of multifractal, which emphasizes the inhomogeneous distribution of singularities, but scale homogeneous invariance is considered in simple fractals. The statistical orders in multifractal analysis can be positive, negative or fractional.
Multifractal analysis methods are divided into moment estimation, histogram and quadratic moment, etc., which have been upgraded to lattice method and moving lattice method (Chen-Zhen, 2005). Among multifractal spectrum calculation methods, moment estimation is one of the most common methods.
Let the density be Pi (r) in any lattice i of size r. So,
P i r = M i r M
where Mi (r) represents the total amount of metal elements in lattice i; M represents the total amount of metal elements in the whole study space. The distribution function χ q (r) was established by q-squared weighted summation of the density Pi (r).
The quality index τ q was introduced by Cheng (1996) to obtain the following mathematical expression:
τ q = lim r 0 ln χ q ( r ) ln r n
If τ q is also a smooth function of q, then α q can be found by the following equation:
α q = τ q q
The fractal dimension spectrum function f α is obtained by Legendre transform.
f α = α q q τ q
As can be seen from Eqs. (3) and (4), the singularity exponent α and multifractal spectrum function f α are two characteristic parameters of the multifractal spectrum. Moment statistics q is correlated to the singularity exponent α q and multifractal spectrum function f α . The richer the hierarchy is, the more likely it is to be a concealed deposit. With multifractal characteristics, the elements cannot be described with a single simple fractal model. To further reveal the practical significance of the mobile form characteristics of the spectrum function, the asymmetry index R was introduced by Xie et al. (2010) to determine the mineralization potential of element distribution. The mathematical expression of he asymmetry index R is as follows:
R = α 0 α min α max α 0 α
where α 0 = α (q = 0). When R = 0, the fractal spectrum function f α is perfectly symmetric to the curve. For the major ore-forming element, its singularity is described with R. The larger the value of R, the more significant the variation of the major ore-forming element in the high-content area.

4. Results and Discussion

4.1. Migration Column Experiment

4.1.1. Characteristics of Element Migration

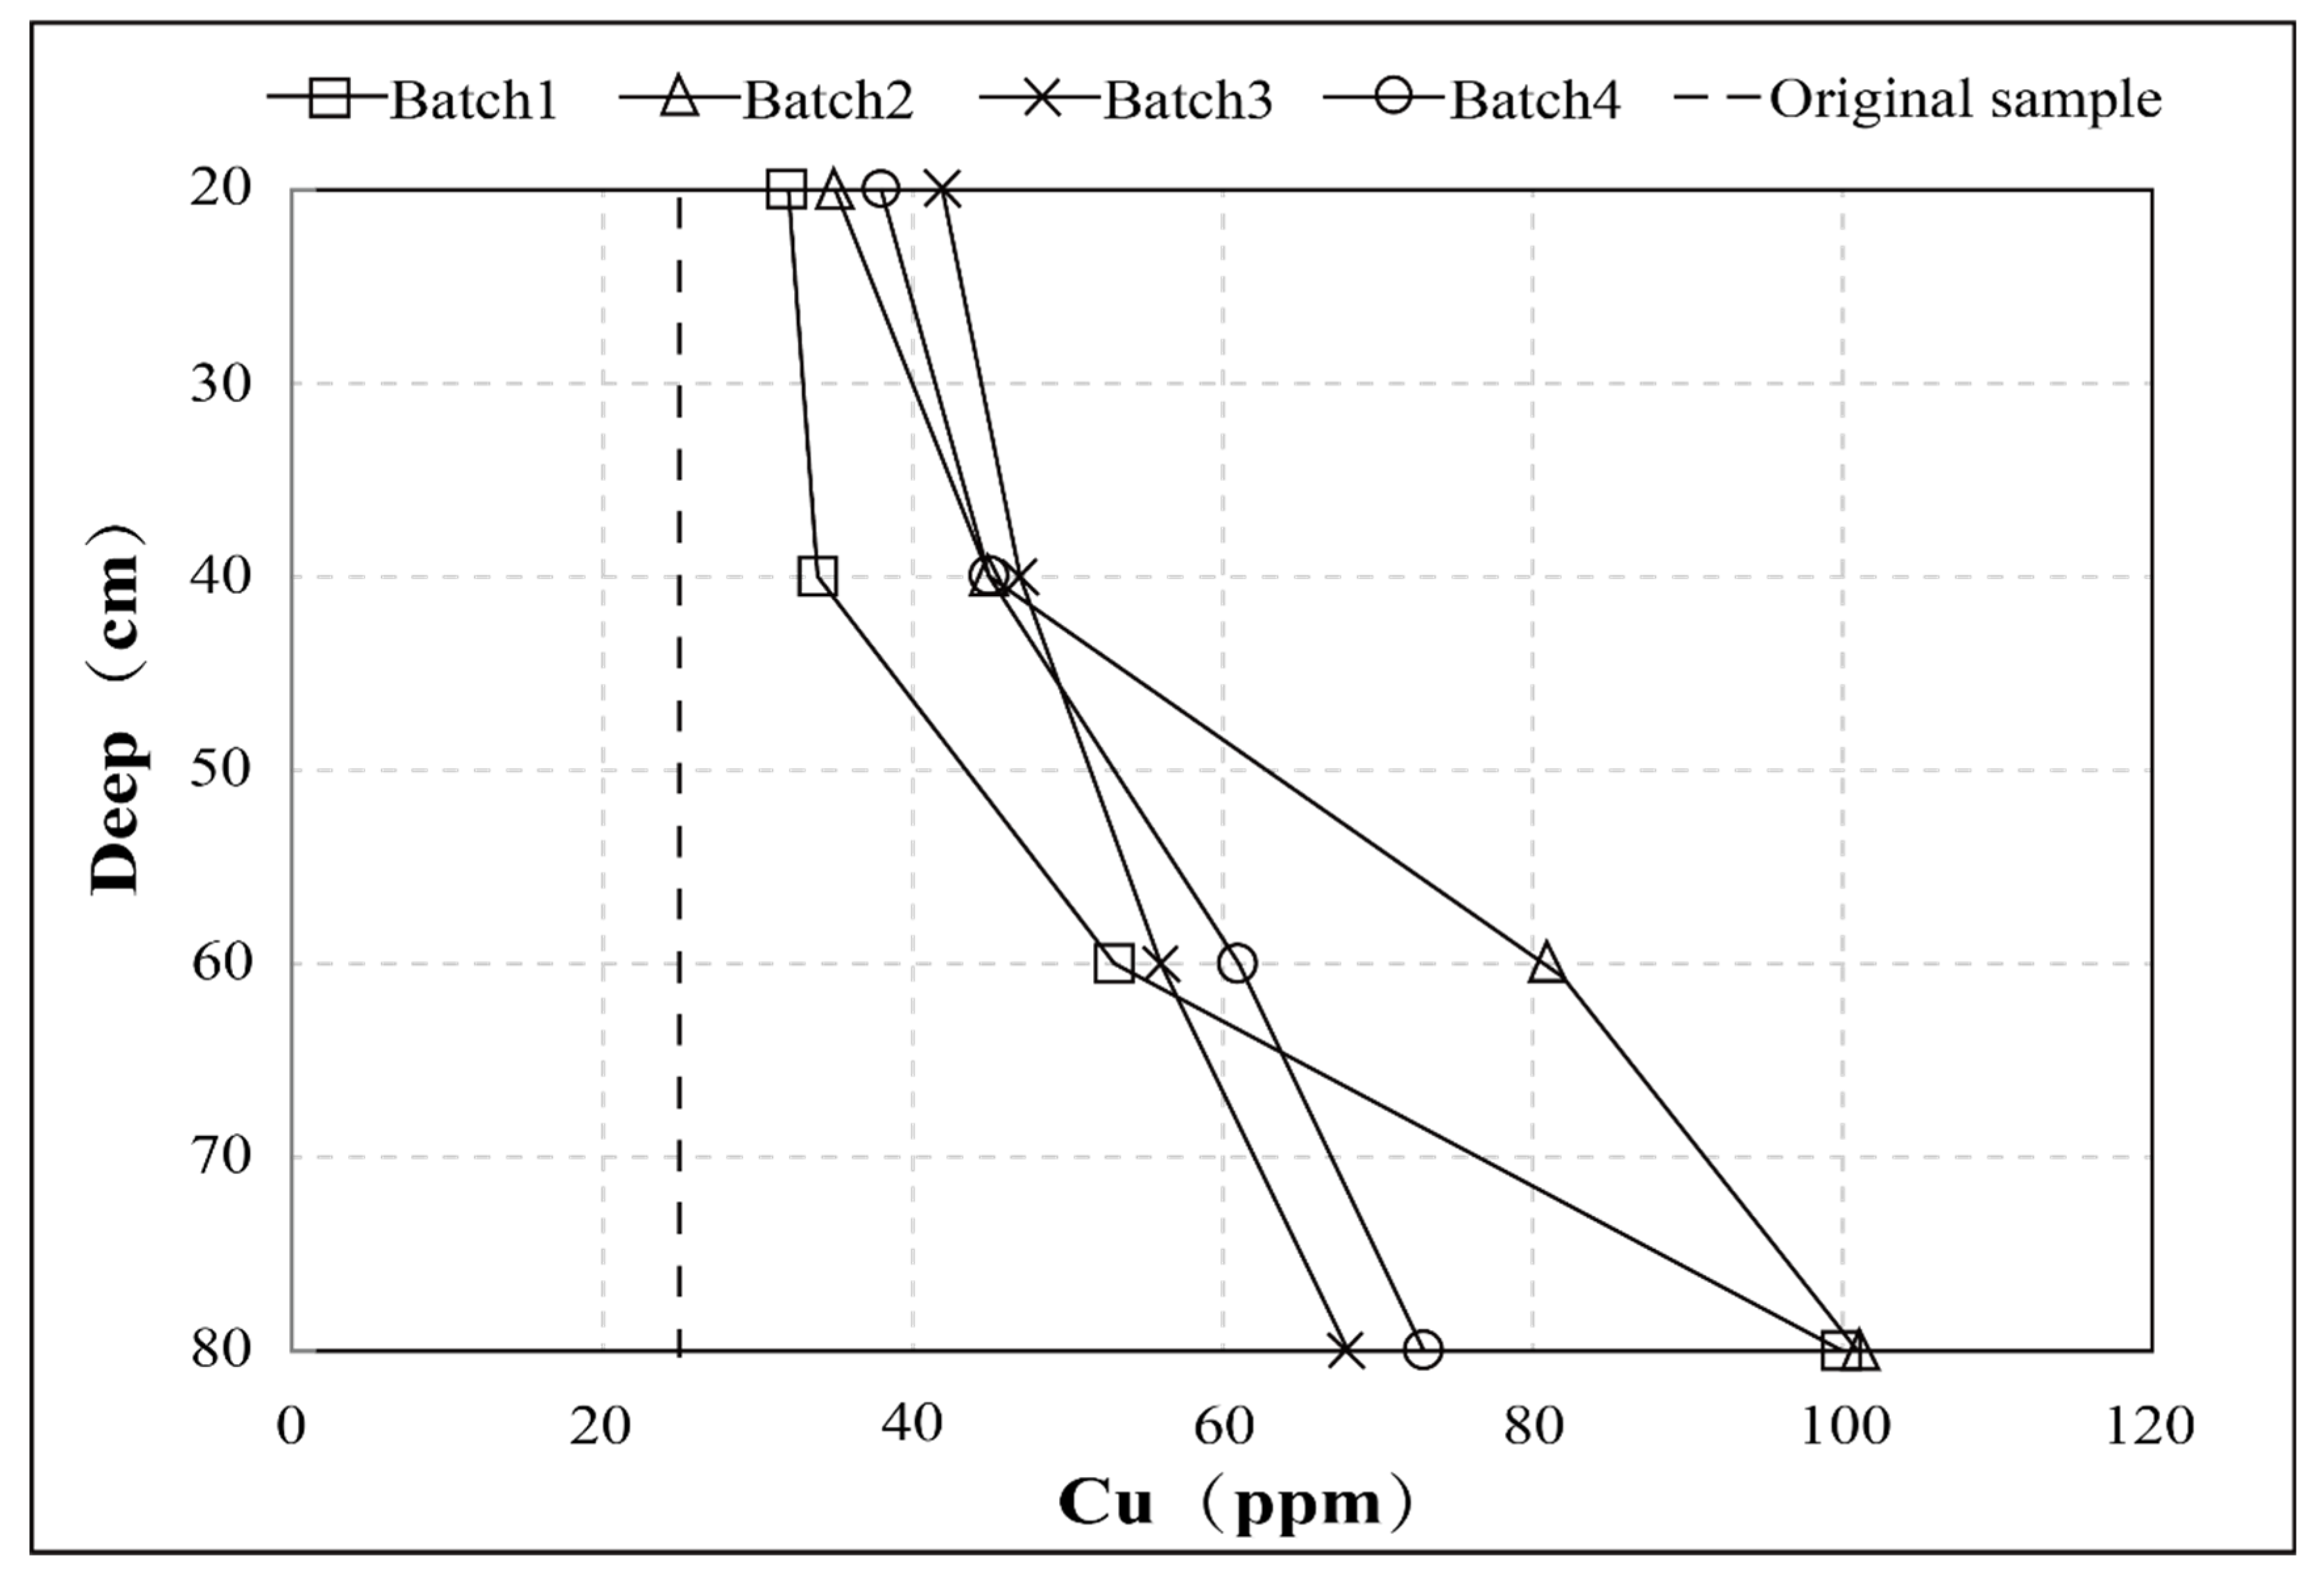
A total of 17 samples (including background samples) were collected during the migration column experiment, and their pXRF data were measured (Figure 3; Table 2).
As can be seen from the comparison with Cu content in the original sample (25 mg/kg), Cu content at any sampling point was higher than that in the original sample (Figure 3), proving that the element content changed in the upper layer of soil under the impact of the ore source.
On the spatial scale, the variation of Cu content in each batch of samples showed an increasing trend with increasing depth (Liao & Zhang, 2015). For the first batch, the Cu content at sampling point 1 was 32 mg/kg while that at sampling point 4 was 100 mg/kg, with a maximum content difference of 68 mg/kg. This shows that the elements could indeed migrate upwards in the vertical direction, and migration was not just caused by simple physical diffusion, while there must be other dynamic factors. The multi-batch comparison showed that the variation of element content at the sampling points of the same depth did not present a one-way increasing trend with time, but a complex change rule (Kelly et al., 2003). The Cu content at a large distance from the ore source basically showed an increasing trend, but there was a difference in Cu content at a large distance from the ore source: The Cu content in the last samples was about 70 mg/kg, while it was around 100 mg/kg in the early samples, i.e., the Cu content in the last samples was lower than that in the early samples.
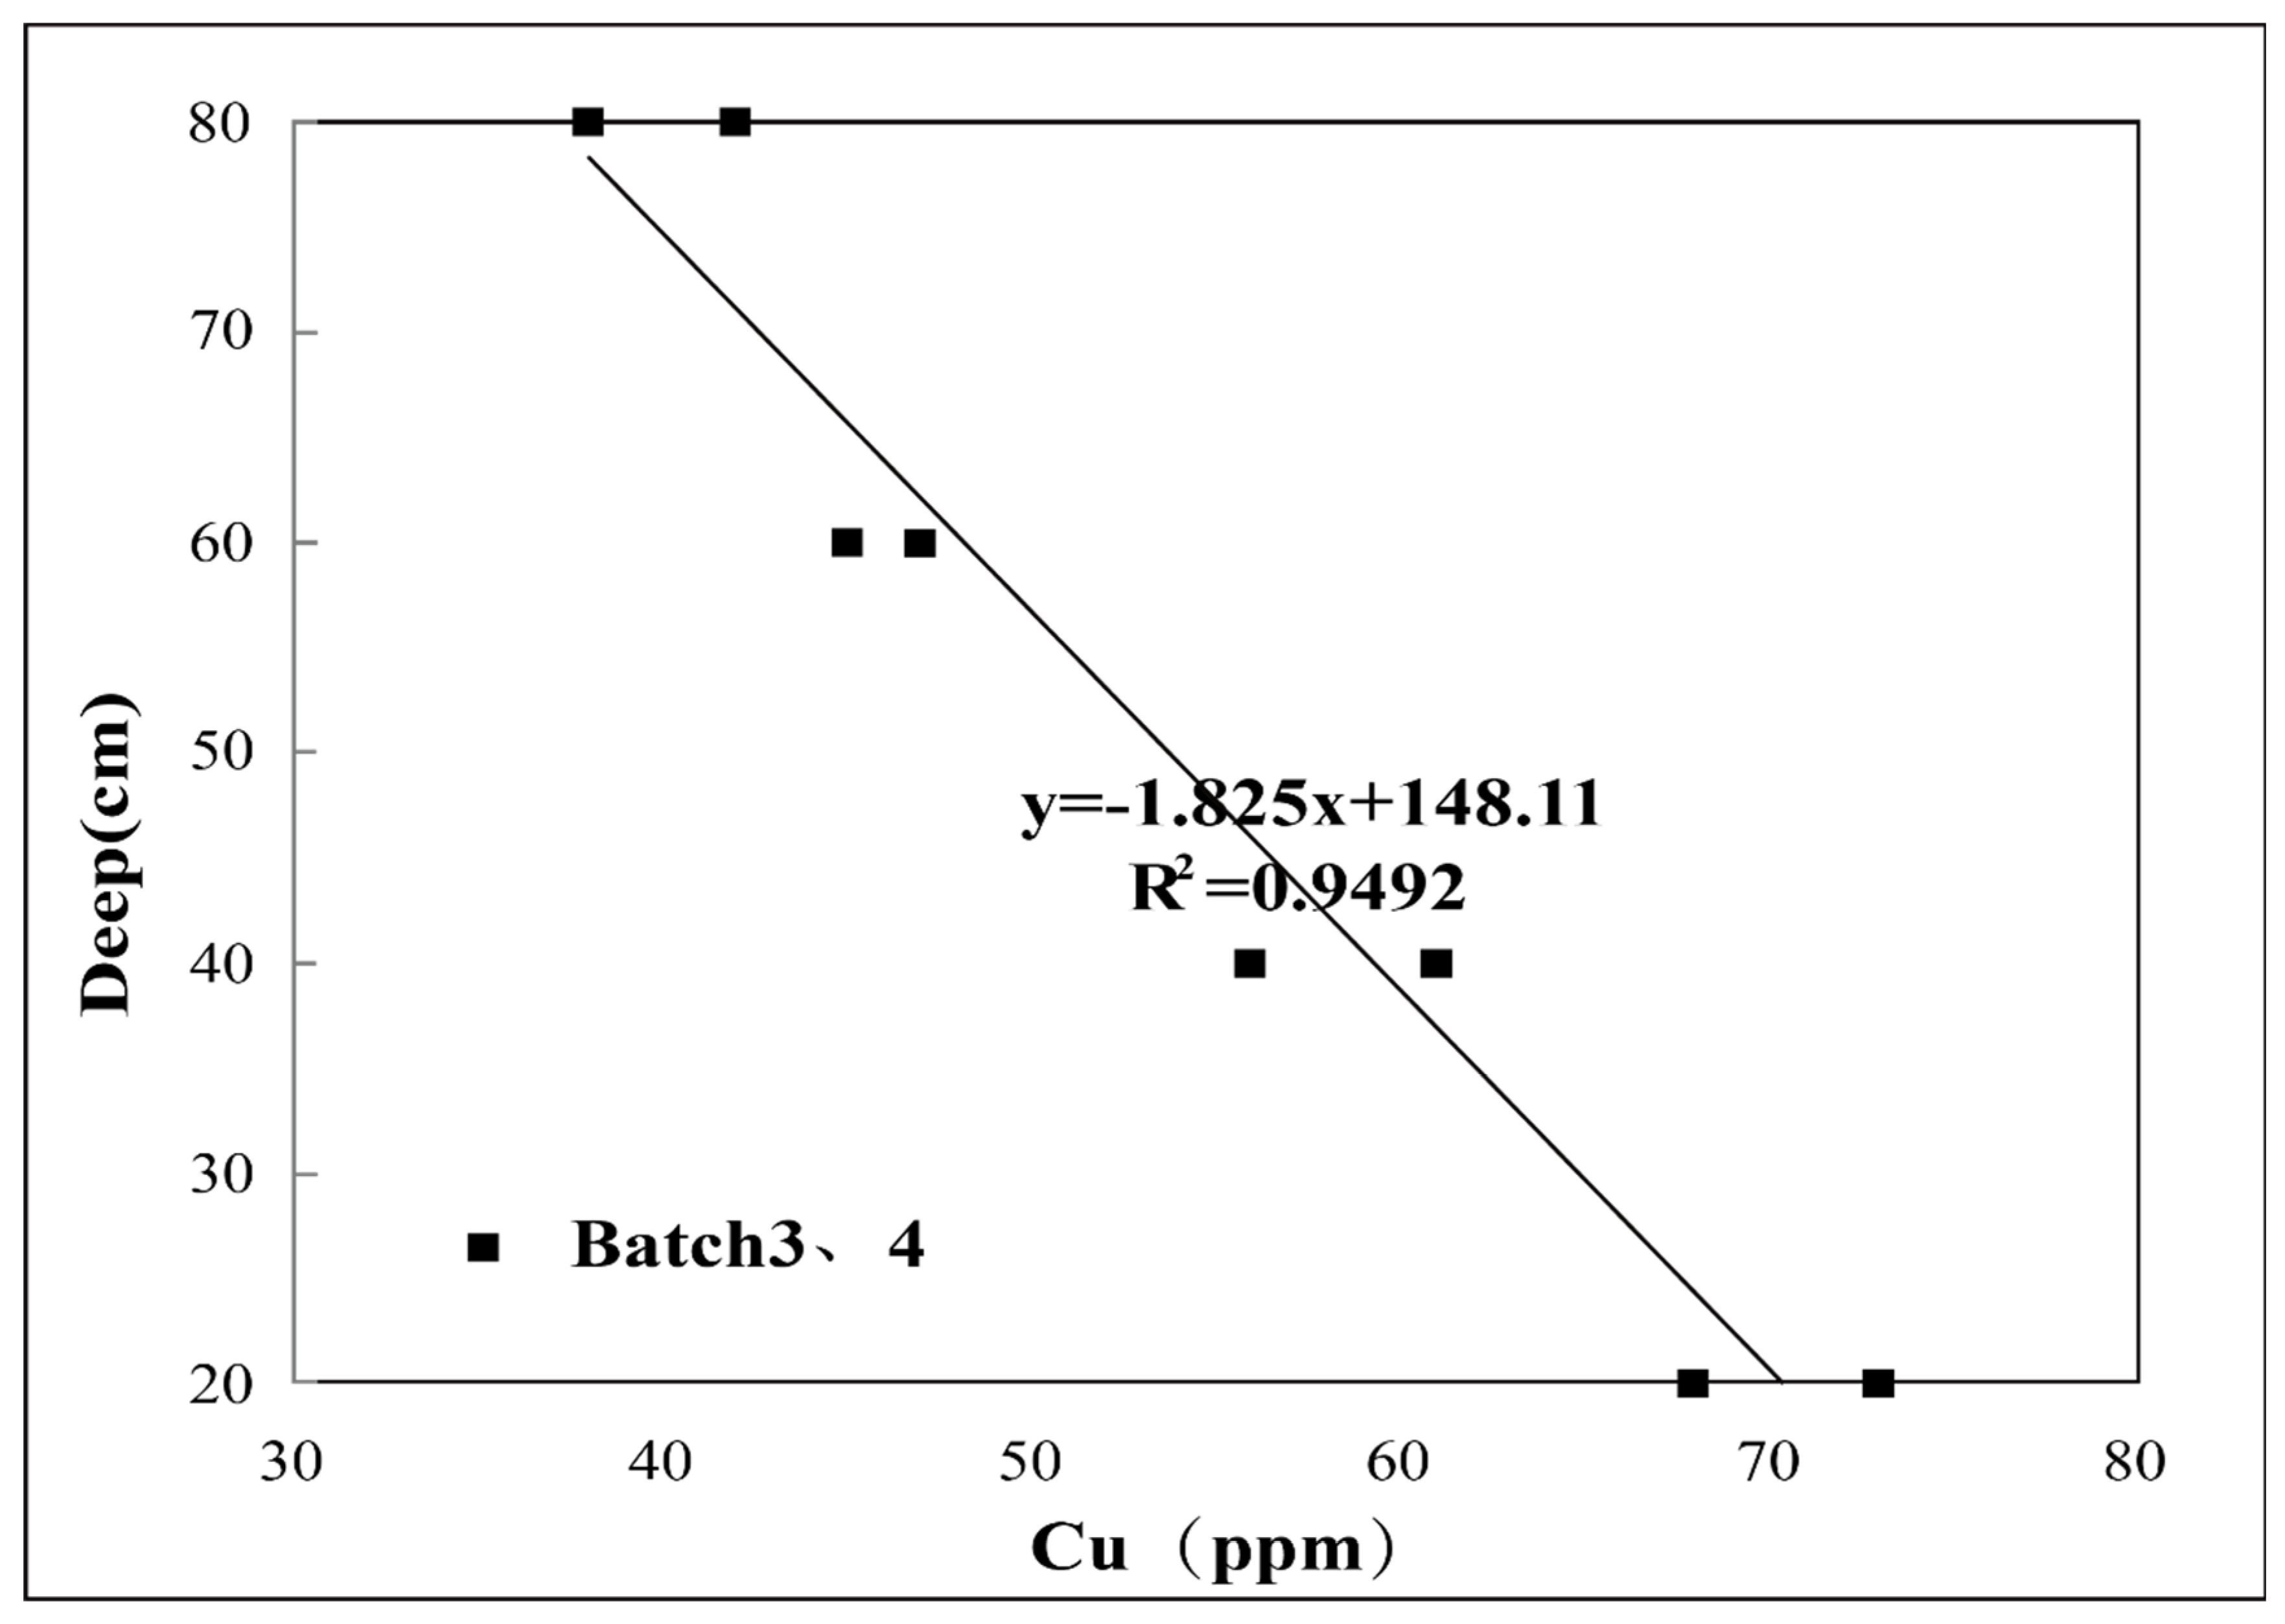
The net migration quantity and rate of elements changed with distance from the source: At the earlier stage of migration (batches 1 and 2), the migration quantity and rate of elements reached their peaks from the near to the distant; at the later stage of migration (batches 3 and 4), the migration quantity and rate of the elements at a greater depth (20 cm) from the source were higher than that of the elements closer to the source, indicating that element migration is not a continuous or stable process, but a complex process with local enrichment occurring in the slow migration process. On the other hand, for the third and fourth batches of samples, the content of elements at a greater depth, 80 cm, was significantly lower than that in the first and second batches of samples, indicating that the elements in the original position continued to migrate vertically upwards and element content stayed stable at 60 cm, 40 cm, and 20 cm, not showing a upward migration trend as the elements in the first and second batches of samples did. Meanwhile, the variation quantity and rate of Cu content were relatively stable. Moreover, the third and fourth batches of samples’ distance from the source showed a linear relationship with the content of Cu (Figure 4), indicating that at the later stage of the vertical migration of elements, there appeared a stepwise “equilibrium distribution”, i.e., the element content became increasingly stable with a closer distance to the source.
Previous drilling results in overburden areas show an inverted C-shaped distribution of Cu in the vertical direction (Xie et al., 2012). Under natural conditions, the ore-forming elements not only underwent vertical migration in the subsurface, but also went through a weathering leaching process near the surface, so that Cu was enriched near the surface (Wang, 2020). Under the influence of multiple factors, elements were distributed in an inverted C shape. In this study, the impact of surface leaching was excluded, restoring the actual migration process of elements in soil.
The Cu content in the third and fourth batches of samples was lower than that in the first and second batches of samples. Moreover, linear stability increased at the later stage of migration. Thus it is peculated that there were two influencing factors: (1) The element content in bottom soil and the ore source formed a dynamic balance with each other under the influence of gravity and many other agents, slowing down element migration at the later stage; (2) There was an excessive difference in concentration between the soil and the ore source, bringing into being a barrier effect, delaying element migration toward the soil. However, the balance was not dynamic, and further research should be conducted on relevant issues such as the form of element migration. (3) Cu Nanoparticles are easily attached to fine soil granules containing clay, colloids, oxides and organic matter, while the physicochemical properties of soil also affect the vertical migration distribution of ore-forming elements. (Xueqiu, 2015)

4.1.2. Analysis of Metal Activity

By Tessier’s five-step continuous extraction (1979), different mobile elements existing in different metal element carriers were extracted from 17 samples collected during the experiment. Then, the content of each form was determined by ICP-MS (Table 3), where F1-F5 represent exchangeable form, carbonate-bound form, Fe-Mn oxide bound form, organic bound form and residual form.
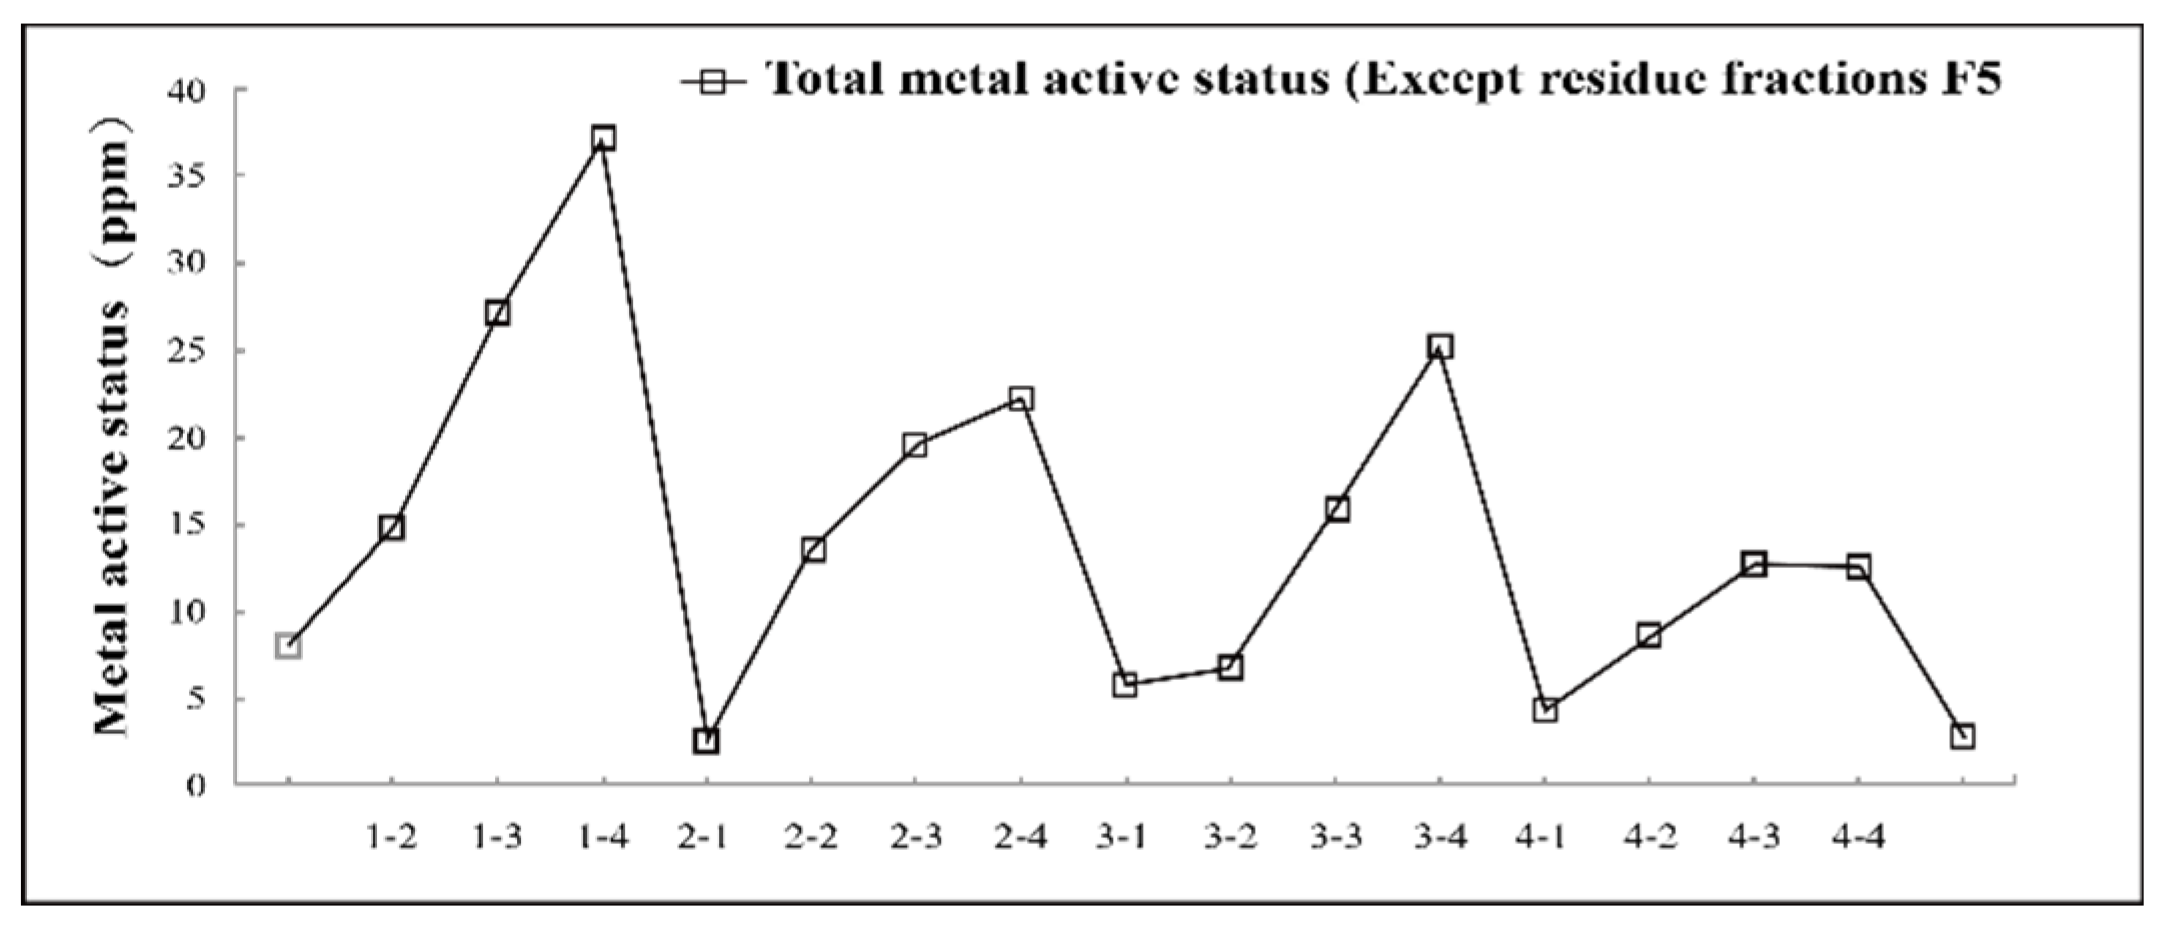
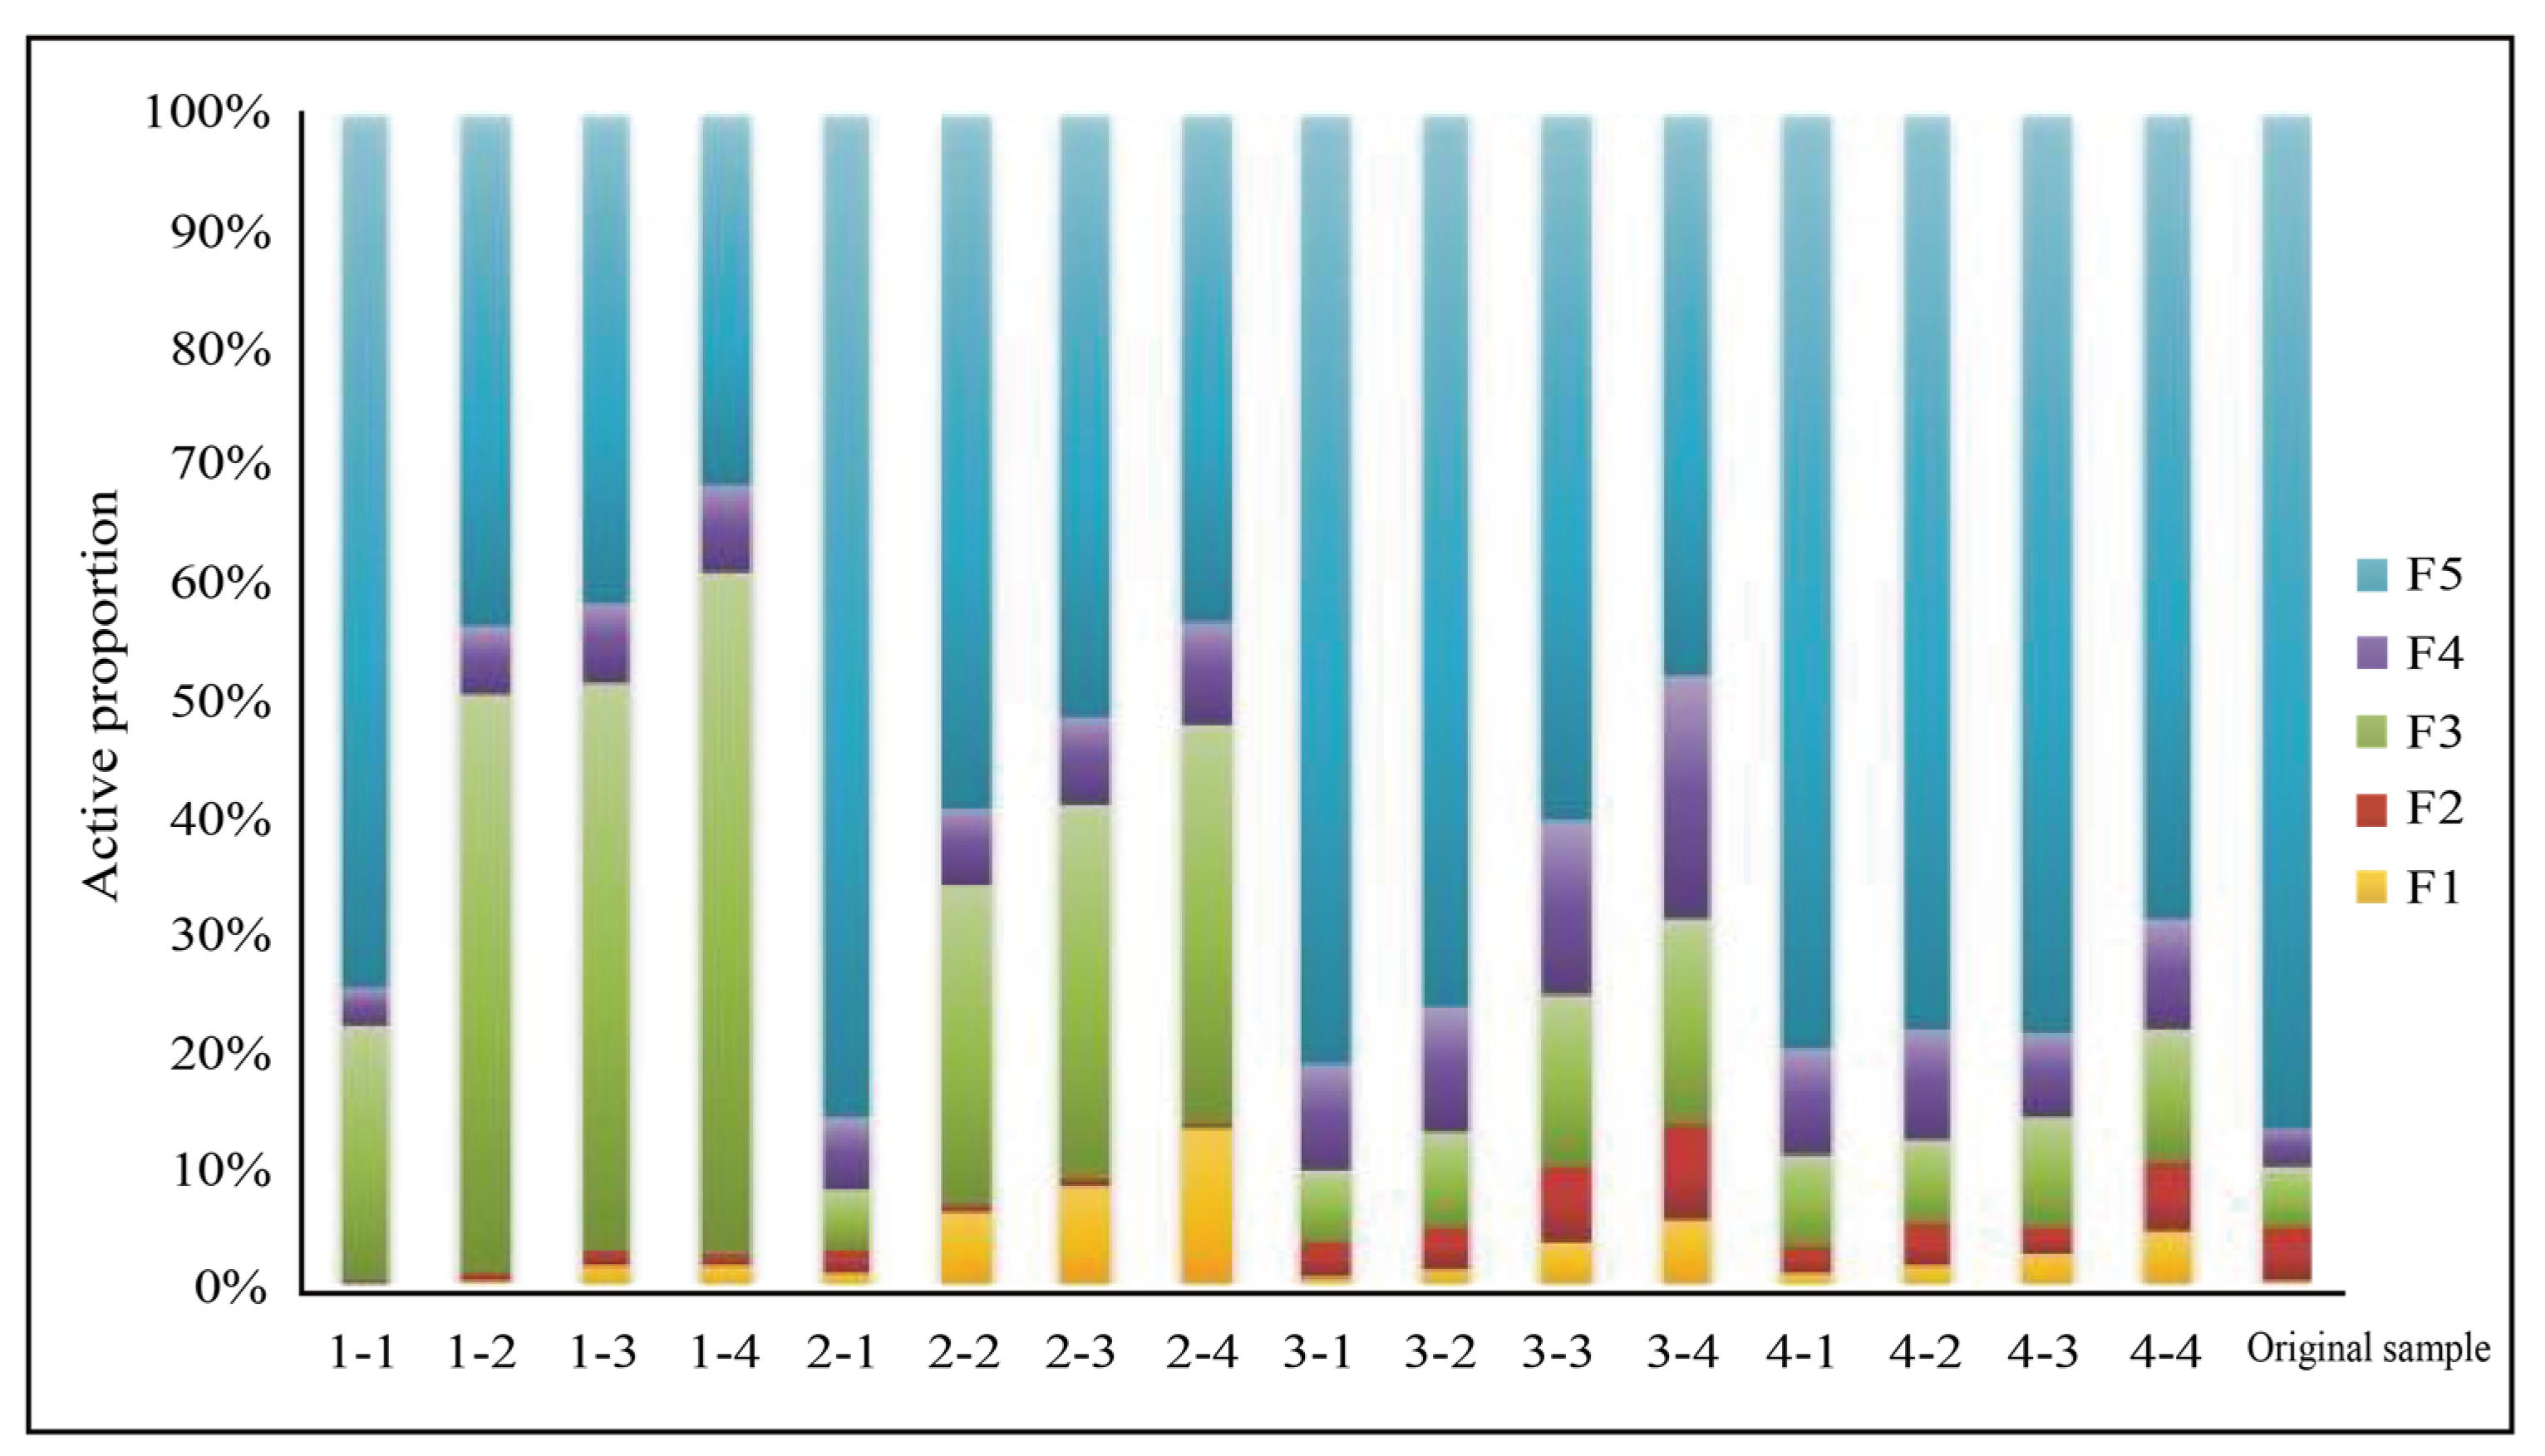
Considering that the residual form F5 was basically not capable of migrating, the contents of the other form mobile metal forms were summed for statistics (Figure 5). The results showed that the sum of the mobile metal forms but residual form in the samples 1-1 to 4-4 was higher than that in the original sample, and this was consistent with the migration characteristics of their total amount. Moreover, with the development of vertical migration, the content of mobile metal forms showed a decreasing trend, indicating that element migration and transformation was not constant. At the earlier stage of migration (batch 1), the content of every mobile metal form stayed at a higher level, with migration and transformation in the most active state, but at the later stage of migration (batch 4), the content of mobile metal forms decreased significantly, with migration weakened. In addition, it was found that there was a higher content of mobile metal forms in the samples collected from the sampling points closer to the source, suggesting that metal elements had indeed undergone migration and transformation in soil. Moreover, the information could be effectively “captured” by means of the extraction of mobile metal forms.
As can be seen from Figure 6, the composition of mobile metal forms in soil was different in terms of batch and depth from the original sample, and a variety of mobile metal forms were involved in the migration process of elements. Moreover, the proportion of every such mobile metal form was constantly changing, indicating that the mobile metal forms did not follow a fixed pattern or stay in a constant proportion during element migration, but in constant transformation. Besides, the total content of mobile metal forms was not the only thing to show a decreasing trend, so that a further analysis was conducted on the transformation rule of different mobile metal forms in element migration to comprehensively compare the characteristics of mobile metal forms on different spatial and temporal scales. The results indicated that the proportion of different mobile metal forms showed obvious changing rules at different depths of single sampling, i.e., the closer the sampling point was to the ore occurrence, the higher the proportion of exchangeable form, carbonate-bound form, Fe-Mn oxide bound form and organic bound form, while there was also a constant change in difference of proportion between different depths. As time went by, the difference in the proportion of mobile metal forms, F1, F2, F3, and F4, between different depths, decreased constantly with the proportion gradually stabilized, while the proportion of different mobile metal forms also gradually approached that in the original soil sample with the development of migration (Figure 6), indicating that the migration of elements was decreasing. This also suggests that the migration of elements was an orderly process rather than an endless one, i.e., when migration developed to a certain level, there would be an “equilibrium” causing the vertical migration to slow down or even stop.
In the first and second batches of samples, F3 occupied an absolutely dominant position, while the proportion of F1 increased significantly in the second batch (Figure 6). With the development of element migration, the proportion of various mobile metal forms and their transformation in the third and fourth batches of samples were gradually stabilized compared to the first two batches of samples, with F3 and F4 slightly higher than F1 and F2. Fe-Mn oxides and organic matter, which exist in great quantity in the earth’s surface, have a strong adsorptive capacity (Basta et al., 2005). Because of this feature, F3 and F4 hold a higher proportion. The proportion of mobile-form composition in the third and fourth batches of samples becomes closer and closer to that in the original soil sample, while the ratio of different mobile metal forms also becomes closer and closer to one another’s, indicating that the this migration process is tending to be stable. The obvious difference in the composition of mobile metal forms in different batches of samples indicates that element migration is not only a process jointly involved by various mobile metal forms, but also a process in which different mobile metal forms play different roles at different stages of migration.
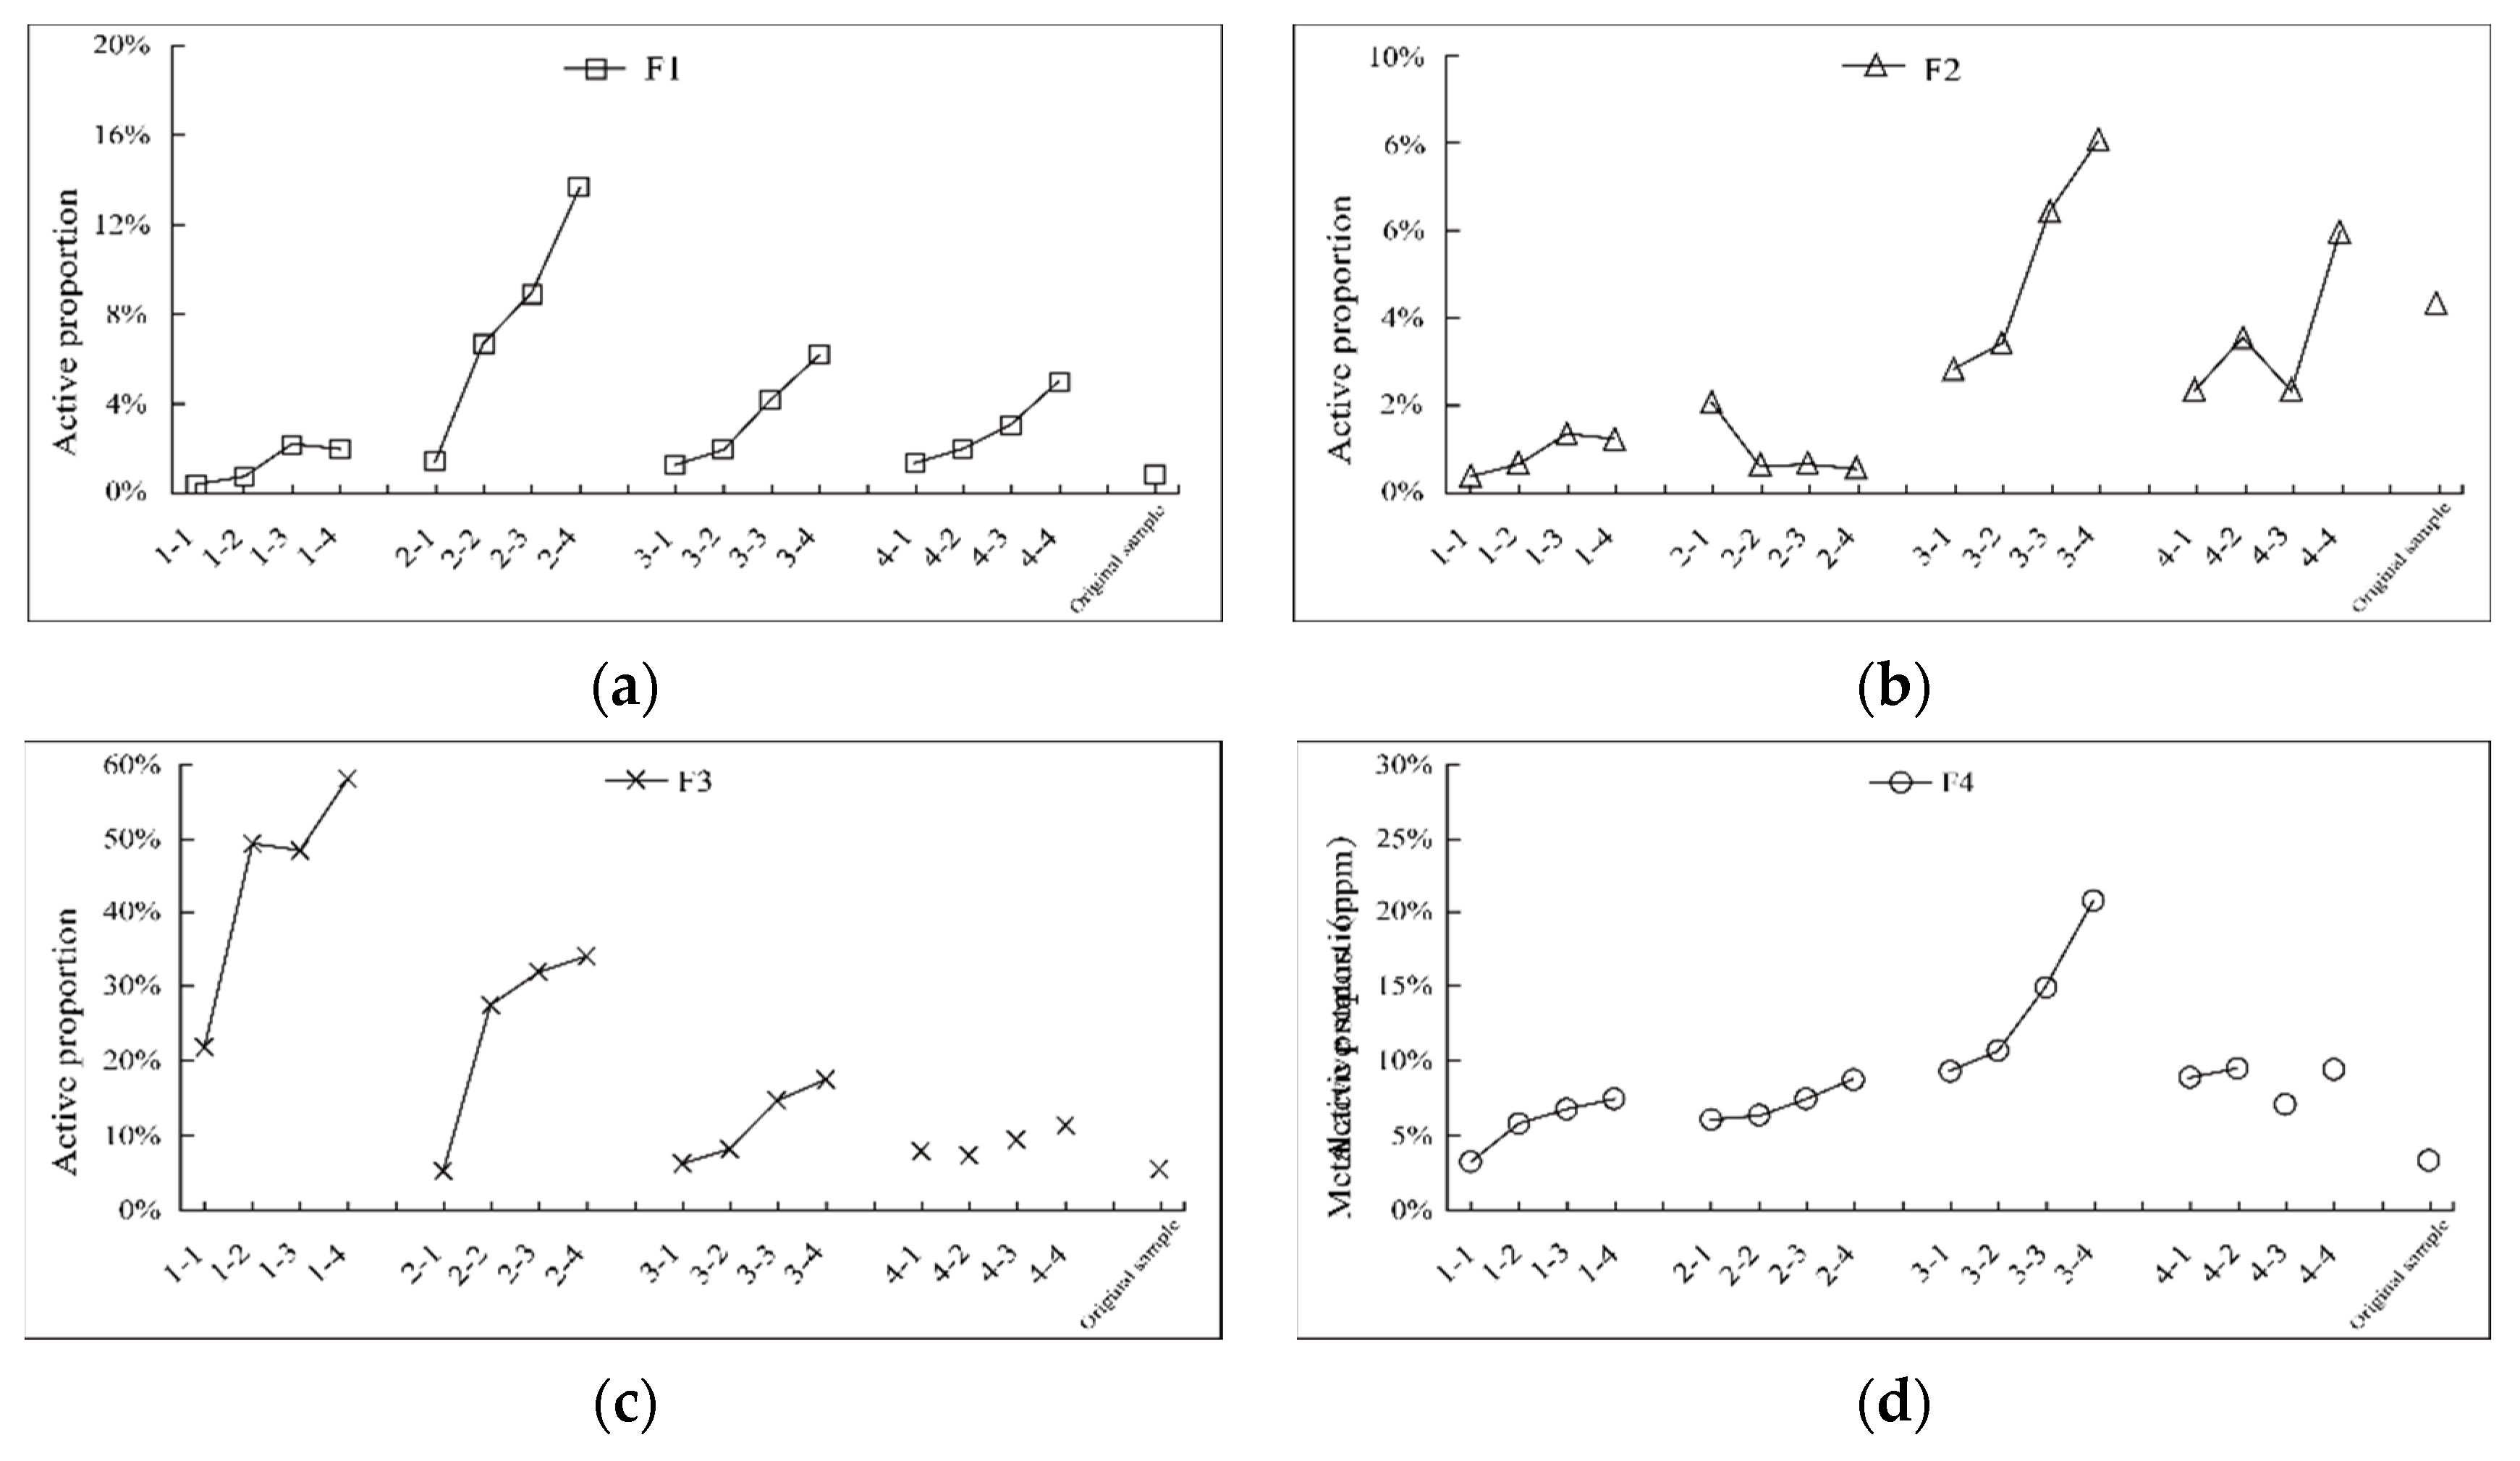
The separate analysis of the changes in the proportion of each mobile metal form at different stages of migration (Figure 7) showed that F1 did not hold a high proportion in the whole migration process, almost lower than 10% throughout the process, while its proportion just increased slightly in the second batch of samples, but the proportion of F1 in almost all experimental samples was higher than that in the original soil sample. Moreover, there was a significant change in the second batch and the rest two, proving that Cu, an exogenous component from the ore source, did enter the migration column soil in this mobile form, and that a significant transformation occurred during the process of element migration (regardless of the distance from the ore source). Also, throughout the migration process, F1 showed an increasingly high proportion in the same batch as it got closer to the source (Figure 7a), indicating that the transformation of mobile metal forms began at the earlier stage of element migration, and mobile metal forms were undergoing a process of vertical migration from the bottom up during the same period of migration, with the carbonate-bound form transformed to a higher degree at the soil depth closer to the ore source.
The carbonate-bound form F2 (Figure 7b) had its content significantly increased in the third batch, and the proportion of all mobile metal forms in the same batch rose with a closer distance to the ore source, suggesting that F1 and F2 might be in the migration column experiment or have something in common in the migration and transformation mechanism.
As shown by Figure 7c, Fe-Mn oxide bound form F3 was the main mobile metal form at the earlier stage of migration (batch 1 and 2), and its proportion was even above 50% near the source. However, this phenomenon did not persist. The proportion of F3 in the third and fourth batches of samples was close to that in the original soil sample, and except for the main active period, the proportion of F3 would not exceed that in the soil sample except near the source, indicating that it made only a limited contribution to element migration during inactive periods. According to the previous research results (Huang, 2011; Hu et al., 2012), the transformation of mobile forms might be cyclical and needs further research.
The organic bound form F4 behaved somewhat distinctively in different batches: At the earlier stage of migration (batch 1 and 2), it was not active, but its proportion rose obviously in the third batch (Figure 7d). However, its proportion decreased again in the fourth batch, indicating that this mobile form of metal was not stable during the migration process and varied from stage to stage.

4.2. Migration Micro-Column Experiment

In this study, the process of element migration in soil was simulated on a small temporal scale in a tube migration experiment. Because the experimental process was accelerated by water-bath heating method and the sampling interval time was far shorter than large-scale migration experiments, it was necessary to consider verifying how much the changes in the content and mobile forms of the elements existing in the soil samples affected the experimental results during the water-bath heating process. The metal elements in soil can be divided into exogenous components and endogenous components by origin (Cameron et al., 2004). The endogenous components stem from parent rocks to varying degree; the exogenous components are mobile forms of elements migrating from the depth of the ore source to the soil cover, and they react with soil constituents, binding to soil secondary minerals in the form of adsorption, weak binding or inclusion (Yao, 2011).
Therefore, what was obtained by total analysis was the gross content of two components. To exclude the possible influence of endogenous soil components on the experiment, blank tests were conducted first on the soil samples from the Yujiashan study area and from the Pulang copper mine to judge whether it was necessary to exclude the effect of primary ore-forming elements in soil. Therefore, 18 samples in the blank group, obtained from two batches of parallel experiments, underwent major element content determination, with the coefficient of variation calculated, followed by an analysis of mobile metal forms (Tisser’s five-step extraction).
The results of the blank experiments showed that Cu content did not change significantly with water-bath heating, the coefficient of variation was less than 0.1. In addition, the ratio of every mobile metal form was basically constant without changing significantly, with all showing relative stability form in the figure. indicating that in the absence of additional ore-forming elements, the element existing originally in migrating soil would not significantly interfere with the experimental results under the condition of water-bath heating, and exogenous substances could be added in order to effectively explore the change rule and mechanism of element migration.

4.2.1. Test Tube Migration Experiment of Ore-Forming Elements Based on Soil in Covered Areas

After control verification, primary copper ore powder, pure Cu powder and covering soil were collected from the Pulang mining area to conduct a tube experiment in thermostatic water bath with the aim of analyzing the vertical migration characteristics of natural and pure ore sources. 9 samples (PP-1…PP-9) in the experimental group underwent Cu content determination (pXRF) (Table 4) as well as mobile metal form extraction (Table 4).
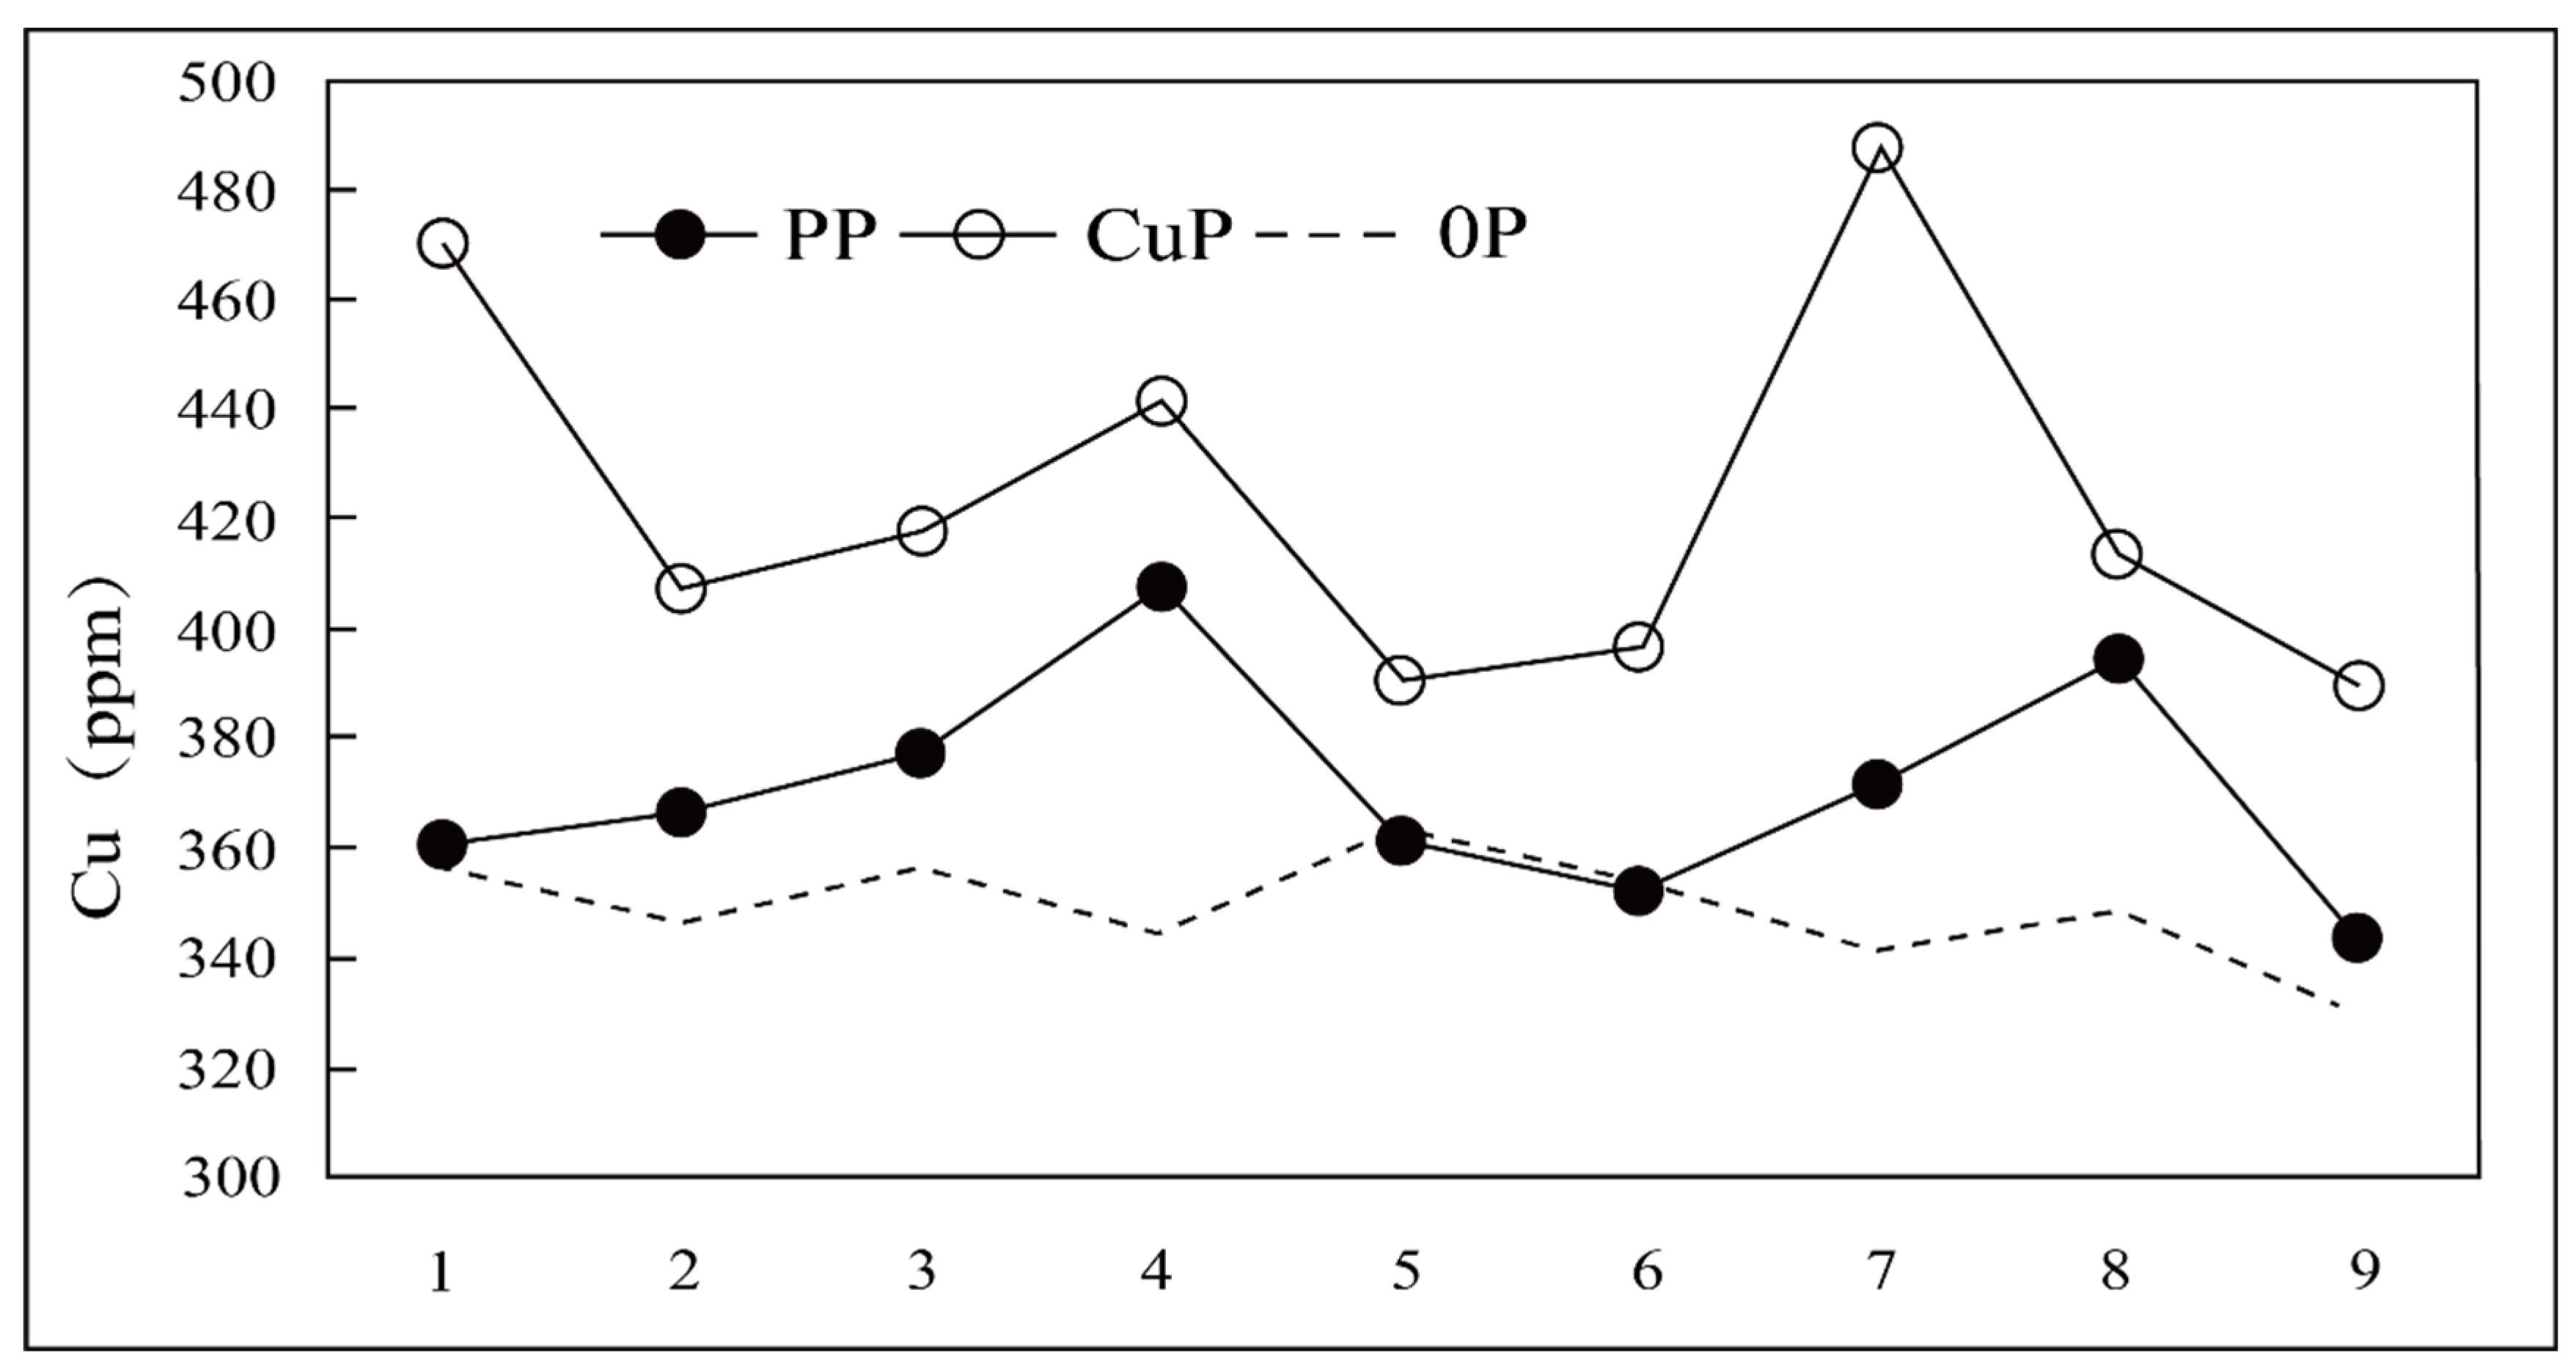
As can be seen, the content of PP and CuP in the experimental group underwent a significant increase compared with that of Cu in the blank group (Figure 8), indicating that the ore-forming elements migrated vertically in the tube experiment. The content of Cu in the two experimental showed a similar change trend, indented, indicating that Cu might migrate in a stable manner in Pulang covered soil. In contrast, the variation of Cu content was more obvious when pure Cu powder was adopted as the ore source, indicating that Cu powder migrated more intensely and obviously in soil. Therefore, it might be better to study the migration of pure Cu powder in soil in order to investigate the vertical migration characteristics of ore-forming elements.
The analysis of various mobile metal forms (Figure 9a,b) showed that the proportions of Fe-Mn oxide bound form F3 and organic bound form F4 were significantly higher than those of exchangeable form F1 and carbonate-bound form F2 in both groups of experiments. This phenomenon was more obvious in the tube experiment conducted on the basis of pure Cu powder and the soil samples from the Pulang covered area. Moreover, the proportion of these two main mobile metal forms showed clear periodicity. The various mobile metal forms occupied relatively stable proportions in the tube experiment conducted on the basis of Pulang ore powder and soil samples. This might be related to the high soil background value of Cu, i.e., high soil background value caused interference to the migration of Cu in the ore powder, making the experimental results insignificant. Therefore, the blank group was taken as a standard group to standardize the mobile forms of F1-F4, so as to eliminate the high soil background value of Cu to some extent. As can be seen, for batches 2-5 and 6-9, F3 and F4 in the same batch showed the same growth trend in both groups of experiments (Xu et al., 2008): Both showed a convex change and were far higher than F1 and F2, indicating that the migration and transformation of Pulang copper powder and pure Cu powder in soil had similar characteristics. This might also indicate that they have similar vertical migration mechanisms. On the other hand, since the migration of Pulang copper powder was not obvious and was easily disturbed by the background value, the vertical migration experiment conducted with pure Cu powder could strengthen the characteristics and provide a new entry point for revealing the vertical migration mechanism of ore-forming elements in covered areas and deep-penetrating geochemistry.

4.2.2. Vertical Migration Characteristics of Cu in Soil Samples with Different Physical and Chemical Backgrounds

As was seen in the previous experimental exploration, pure Cu powder could not only simulate the vertical migration of a deep ore body to some extent, but also enhance this process. To compare the difference in the vertical migration of ore-forming elements in mining soil and urban soil, we investigated the influence and controlling effect of mining soil and urban soil, two migrating soils with different physicochemical characteristics, on the vertical migration mechanism, and added exogenous pure Cu powder to the soil samples from the two study areas to investigate the vertical migration characteristics of Cu in different migrating soil samples. 18 samples went through Cu content determination (pXRF) and mobile metal form extraction in the two groups of experiments.
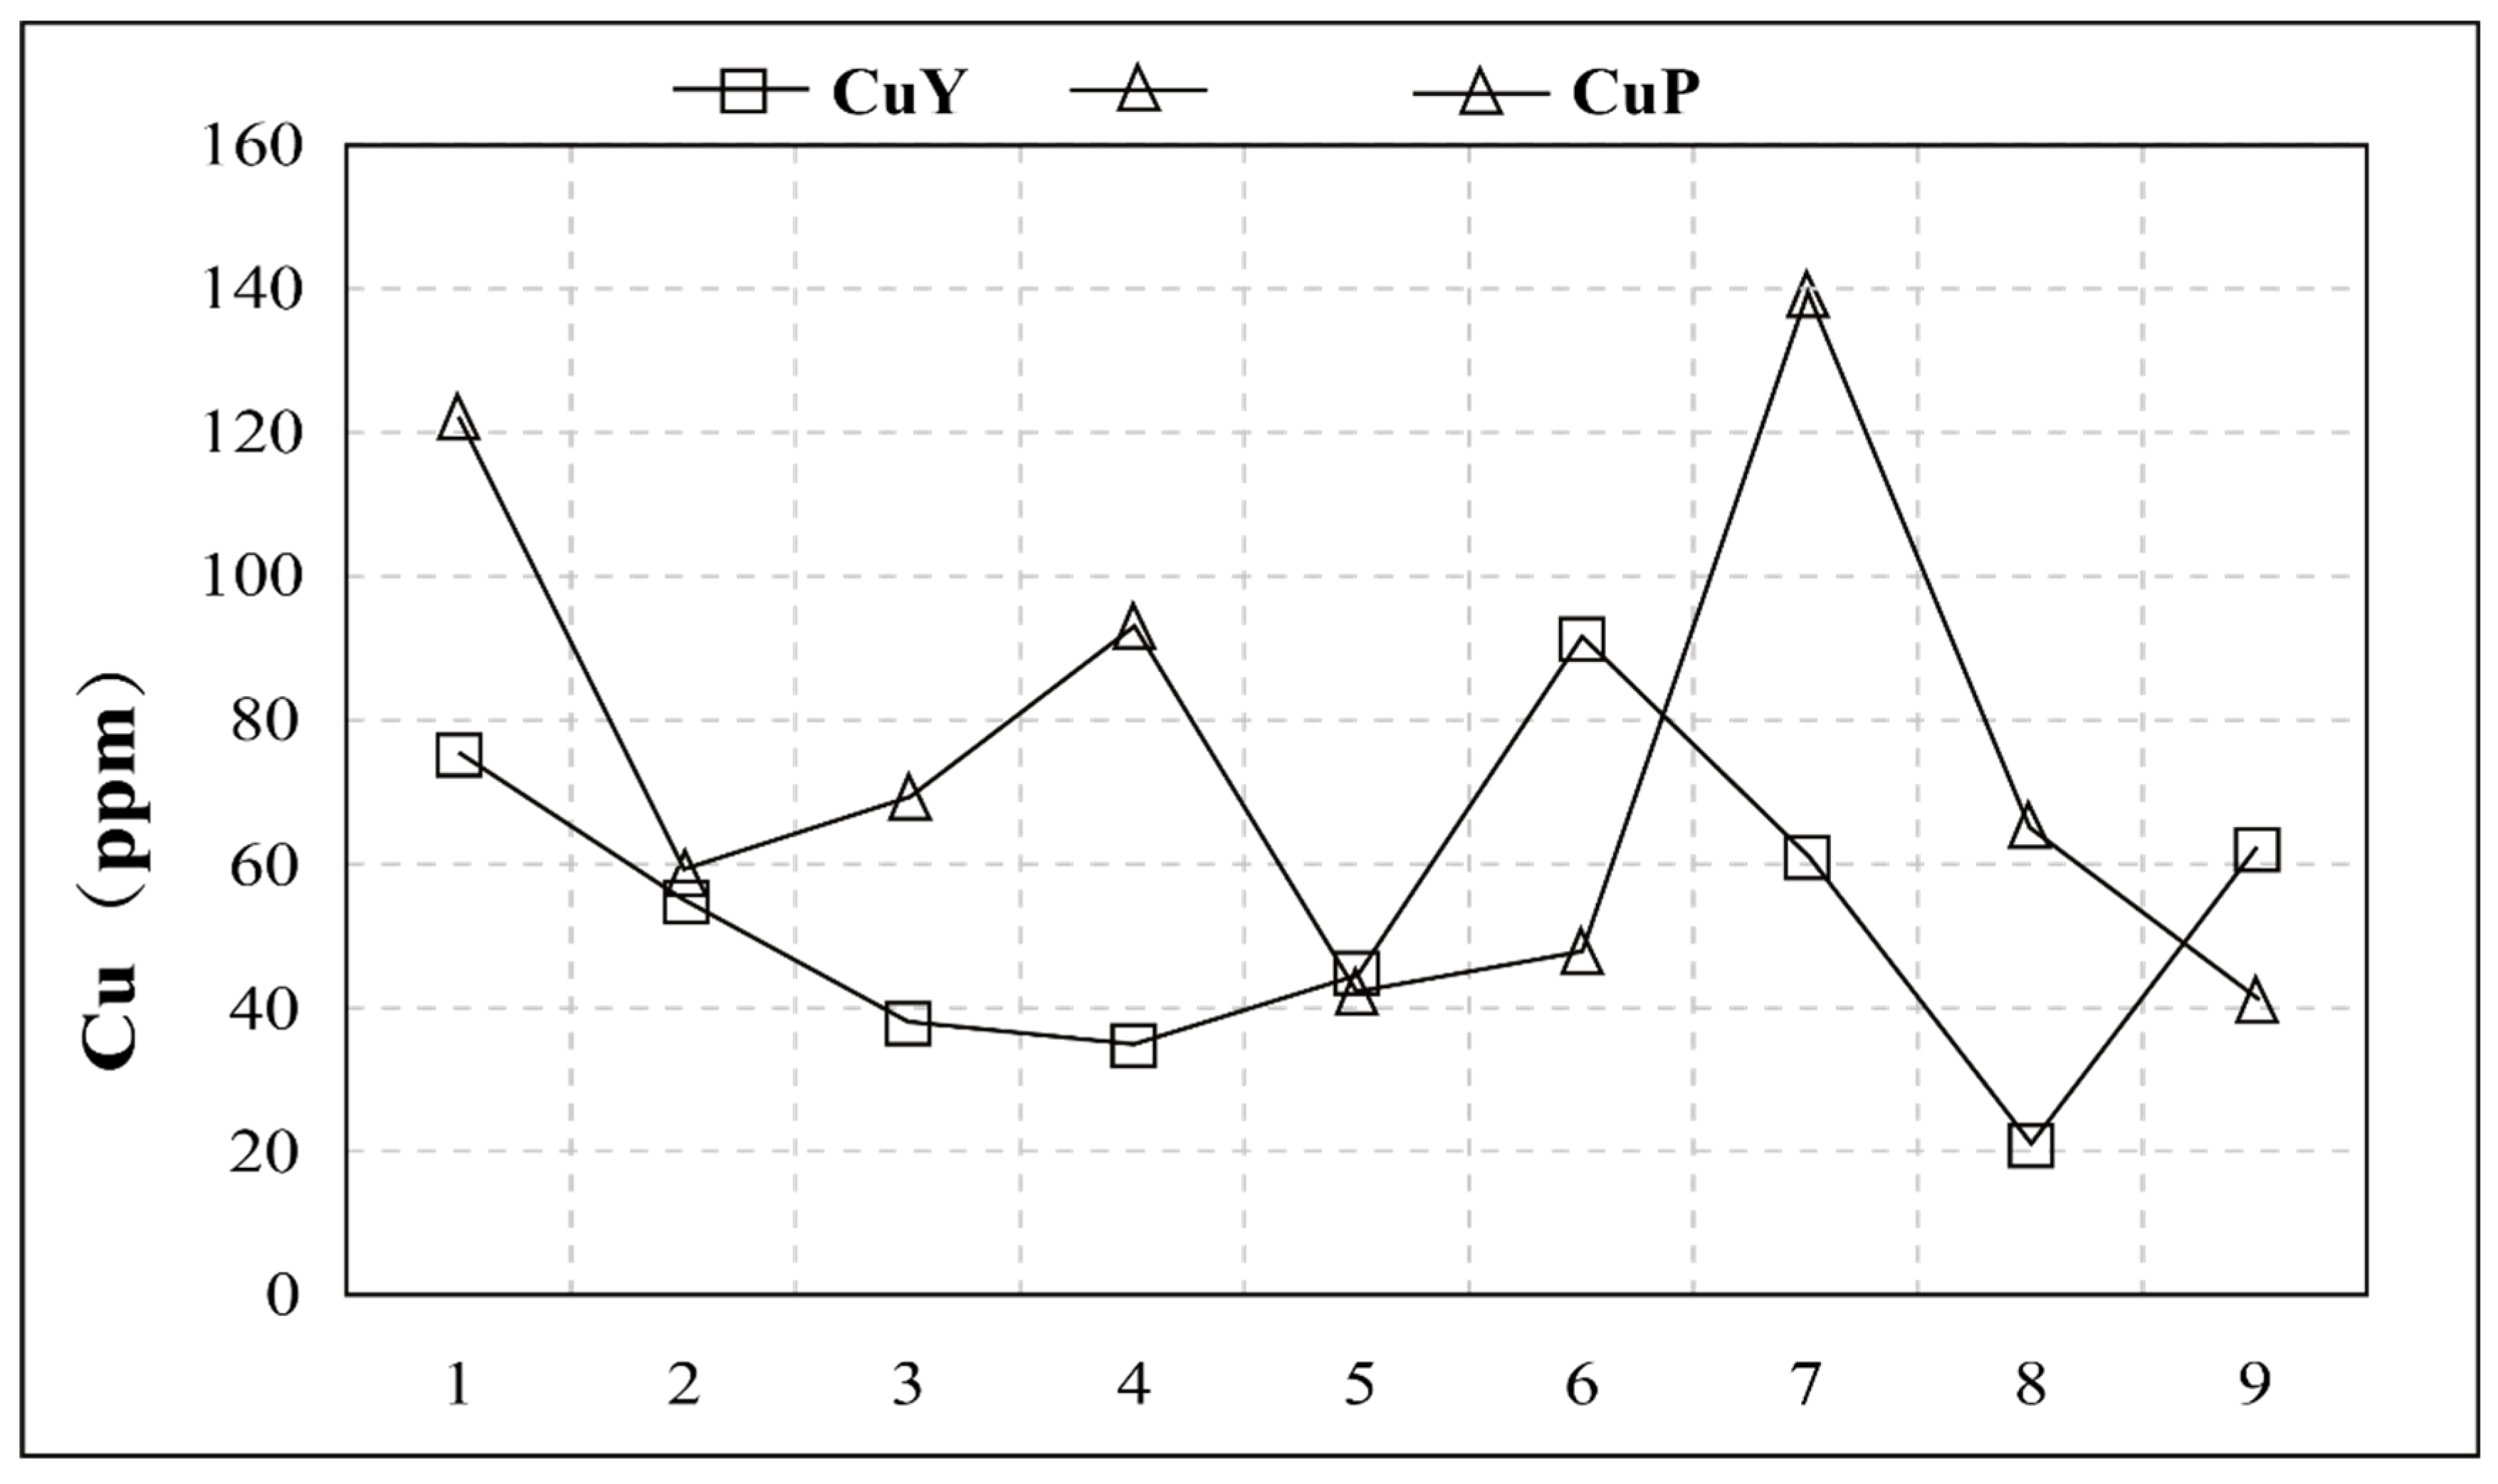
The results showed that the content of Cu in Pulang soil cover was more variable (Figure 10), and the variability of Cu was high, indicating that the process of element migration was more complex and variable, i.e., Cu migrated more easily and showed higher heterogeneity in the soil samples from the Pulang covered area.
Preprints 80007 i001
Also, the content of Cu in the soil samples from the Pulang covered area reached its peak twice during the 45-day experiment, while the content of Cu in the Yujiashan soil just reached one peak, which was quite low. This indicated that there was a difference in the change of Cu content between the two groups of experiments, with Cu migrating more rapidly in the soil samples from the Pulang covered area, reaching the first peak on the 20th day of the experiment, while Cu in the soil samples from the Yujiashan study area reached a peak of migration on the 30th day of the experiment.
The analysis of mobile metal forms (Figure 11) showed that Fe-Mn oxide bound form F3 and organic bound form F4 were active in the process of element migration as the two most important mobile metal forms. Moreover, F3+F4 and their total content showed the same change trend in the two groups of experiments (Figure 12), indicating that Fe-Mn oxide bound form F3 and organic bound form F4 controlled the migration of elements to a certain extent, and by analyzing the characteristics of mobile metal forms, we could reveal the mechanism of element migration in soil.
Compared with the migration column experiment, the variation of Fe-Mn oxide bound form F3 in the soil samples from the Yujiashan study area was significantly higher than that of organic bound form F4, while the variation of Fe-Mn oxide bound form F3 and organic bound form F4 in the soil samples from the Pulang covered area was close to each other’s. The content of MnO in the Yujiashan soil samples was relatively higher, and the significant change in the content of surface Fe-Mn oxide bound form F3 might be related to the content of FeMnO in soil, where the higher the content of FeMnO was, the more elements were absorbed, and therefore the higher the content of Fe-Mn oxide form was. Besides, in the experiment on the Yujiashan soil samples, the total content of Cu, as well as Fe-Mn oxide bound form F3 and organic bound form F4 reached an obvious peak during the 45-day experiment on the Yujiashan soil samples (Figure 12a), while there appeared two relatively low peaks during the experiment on the Pulang soil samples. Given high content of Cu in the Pulang covered soil, it was speculated that the migration and transformation of exogenous Cu were inhibited to some degree by the high background value of the Pulang soil samplings, achieving a “balance” in advance, so that the content reached a peak within a short time and then decreased fast, showing high-frequency undulation. Such a rapid change might lead to higher heterogeneity in the migration of same-type elements in soil given a high background value, and this might be the reason for the serious heterogeneity of ore-forming elements in the covered soil (Cheng, 2001).

4.3. Nonlinear Analysis of Long Range Migration Characteristics of Metal Activity

The tube experiment on micro-migration showed that the ore-forming elements varied significantly in long-range migration characteristics in migrating soil media with different morphologies and physicochemical backgrounds, and showed an obviously nonlinear trend of migration. In this study, multifractals, a nonlinear analysis tool (Xie et al., 2002; Cheng, 2006), were used to quantitatively characterize the nonlinear migration characteristics of elements.
(Quality Map: Calculate the slope of each straight line in the distribution function diagram to obtain the quality function; Singularity Exponent: the singularity exponent obtained by Numerical differentiation of the curve in the quality chart; Multifractal Spectrogram: multifractal spectral function obtained through Legendre transformation).
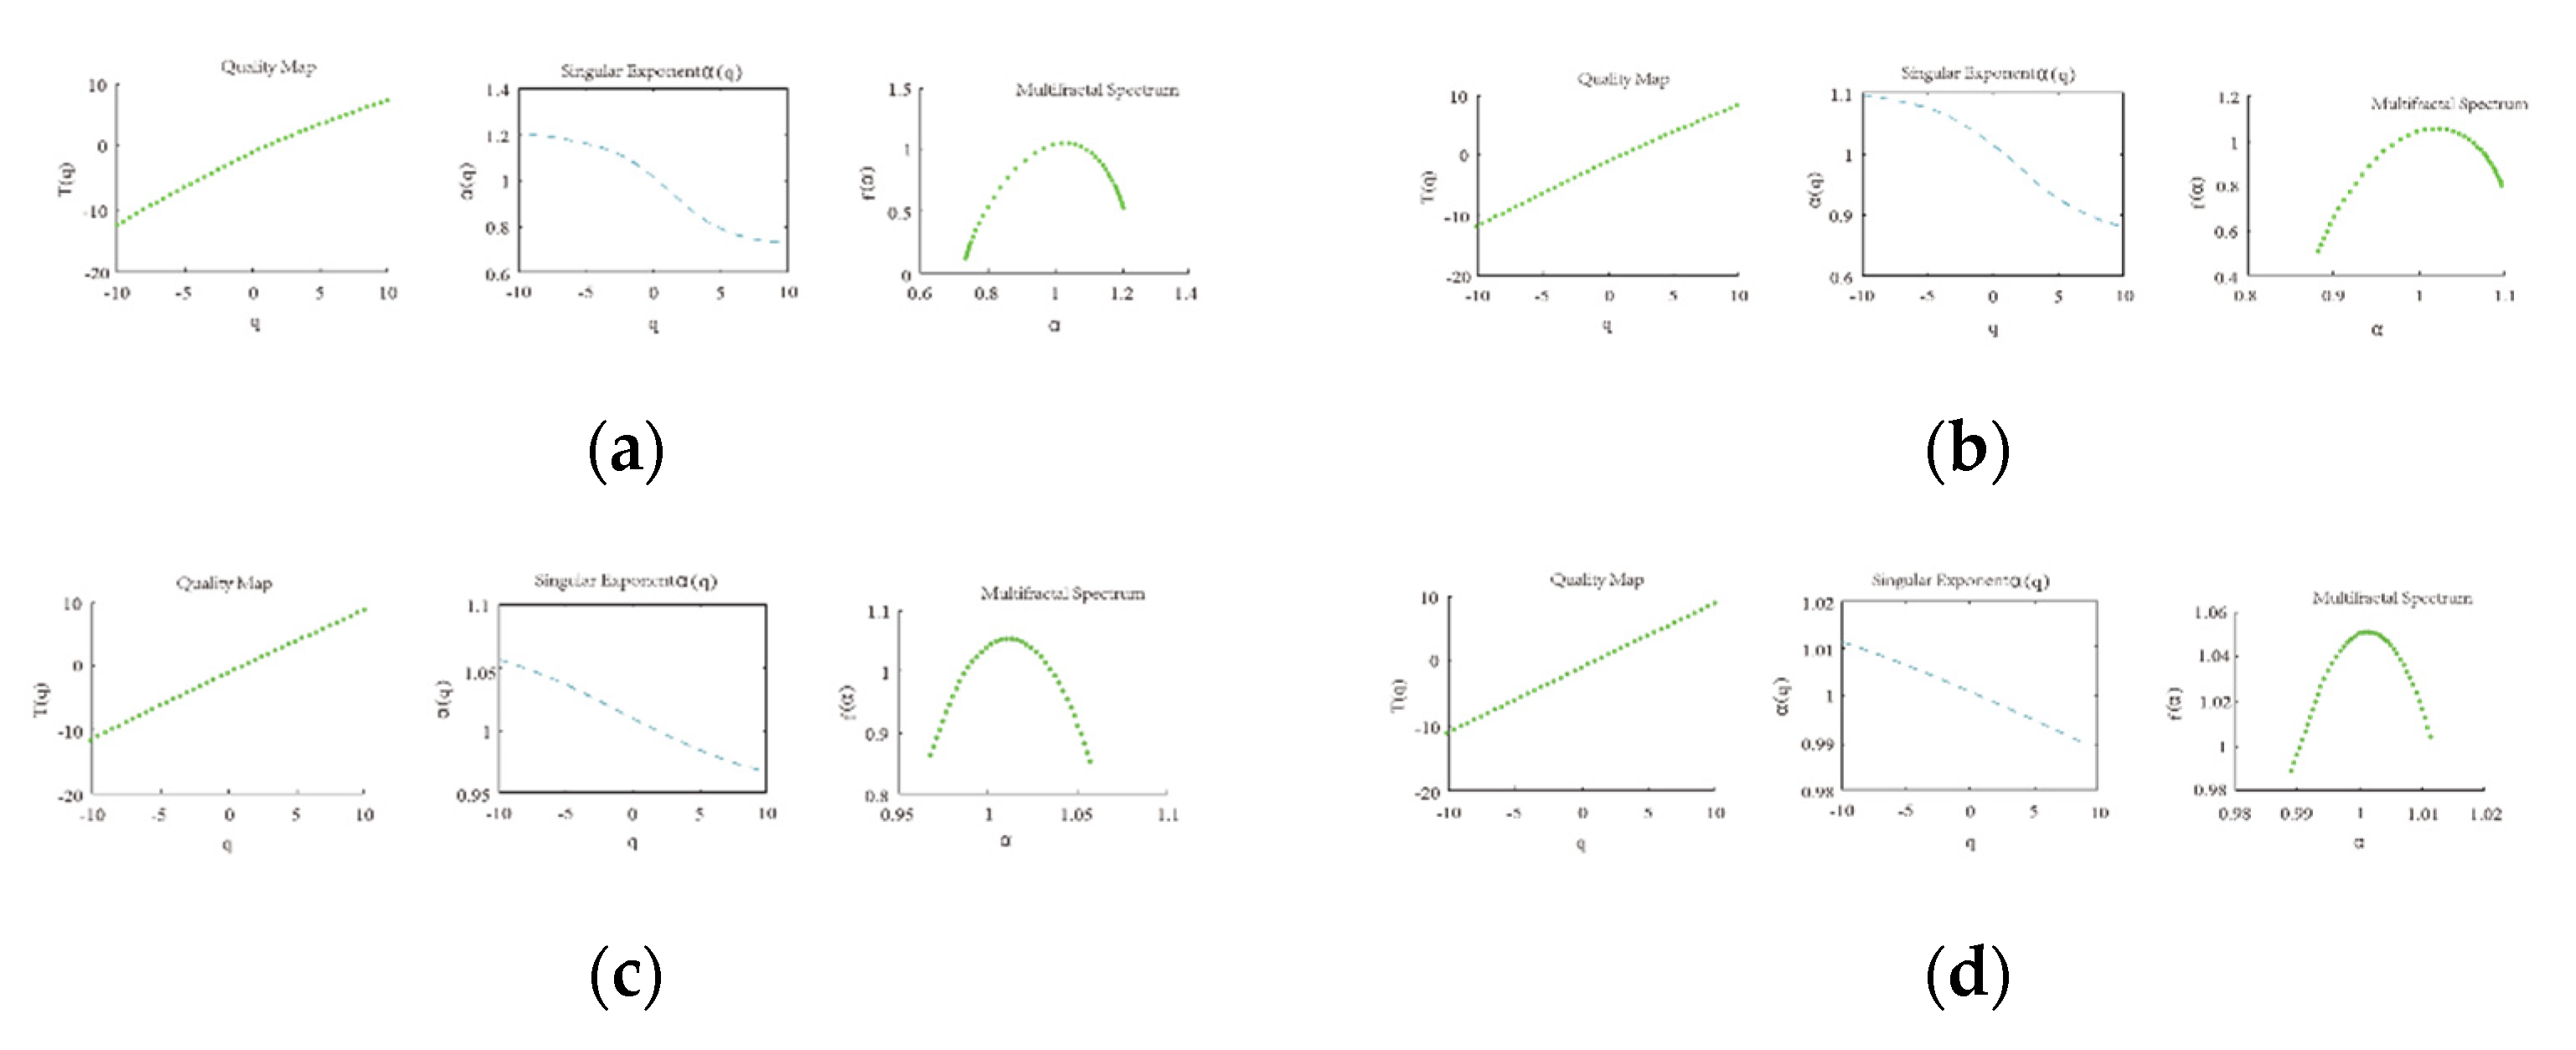
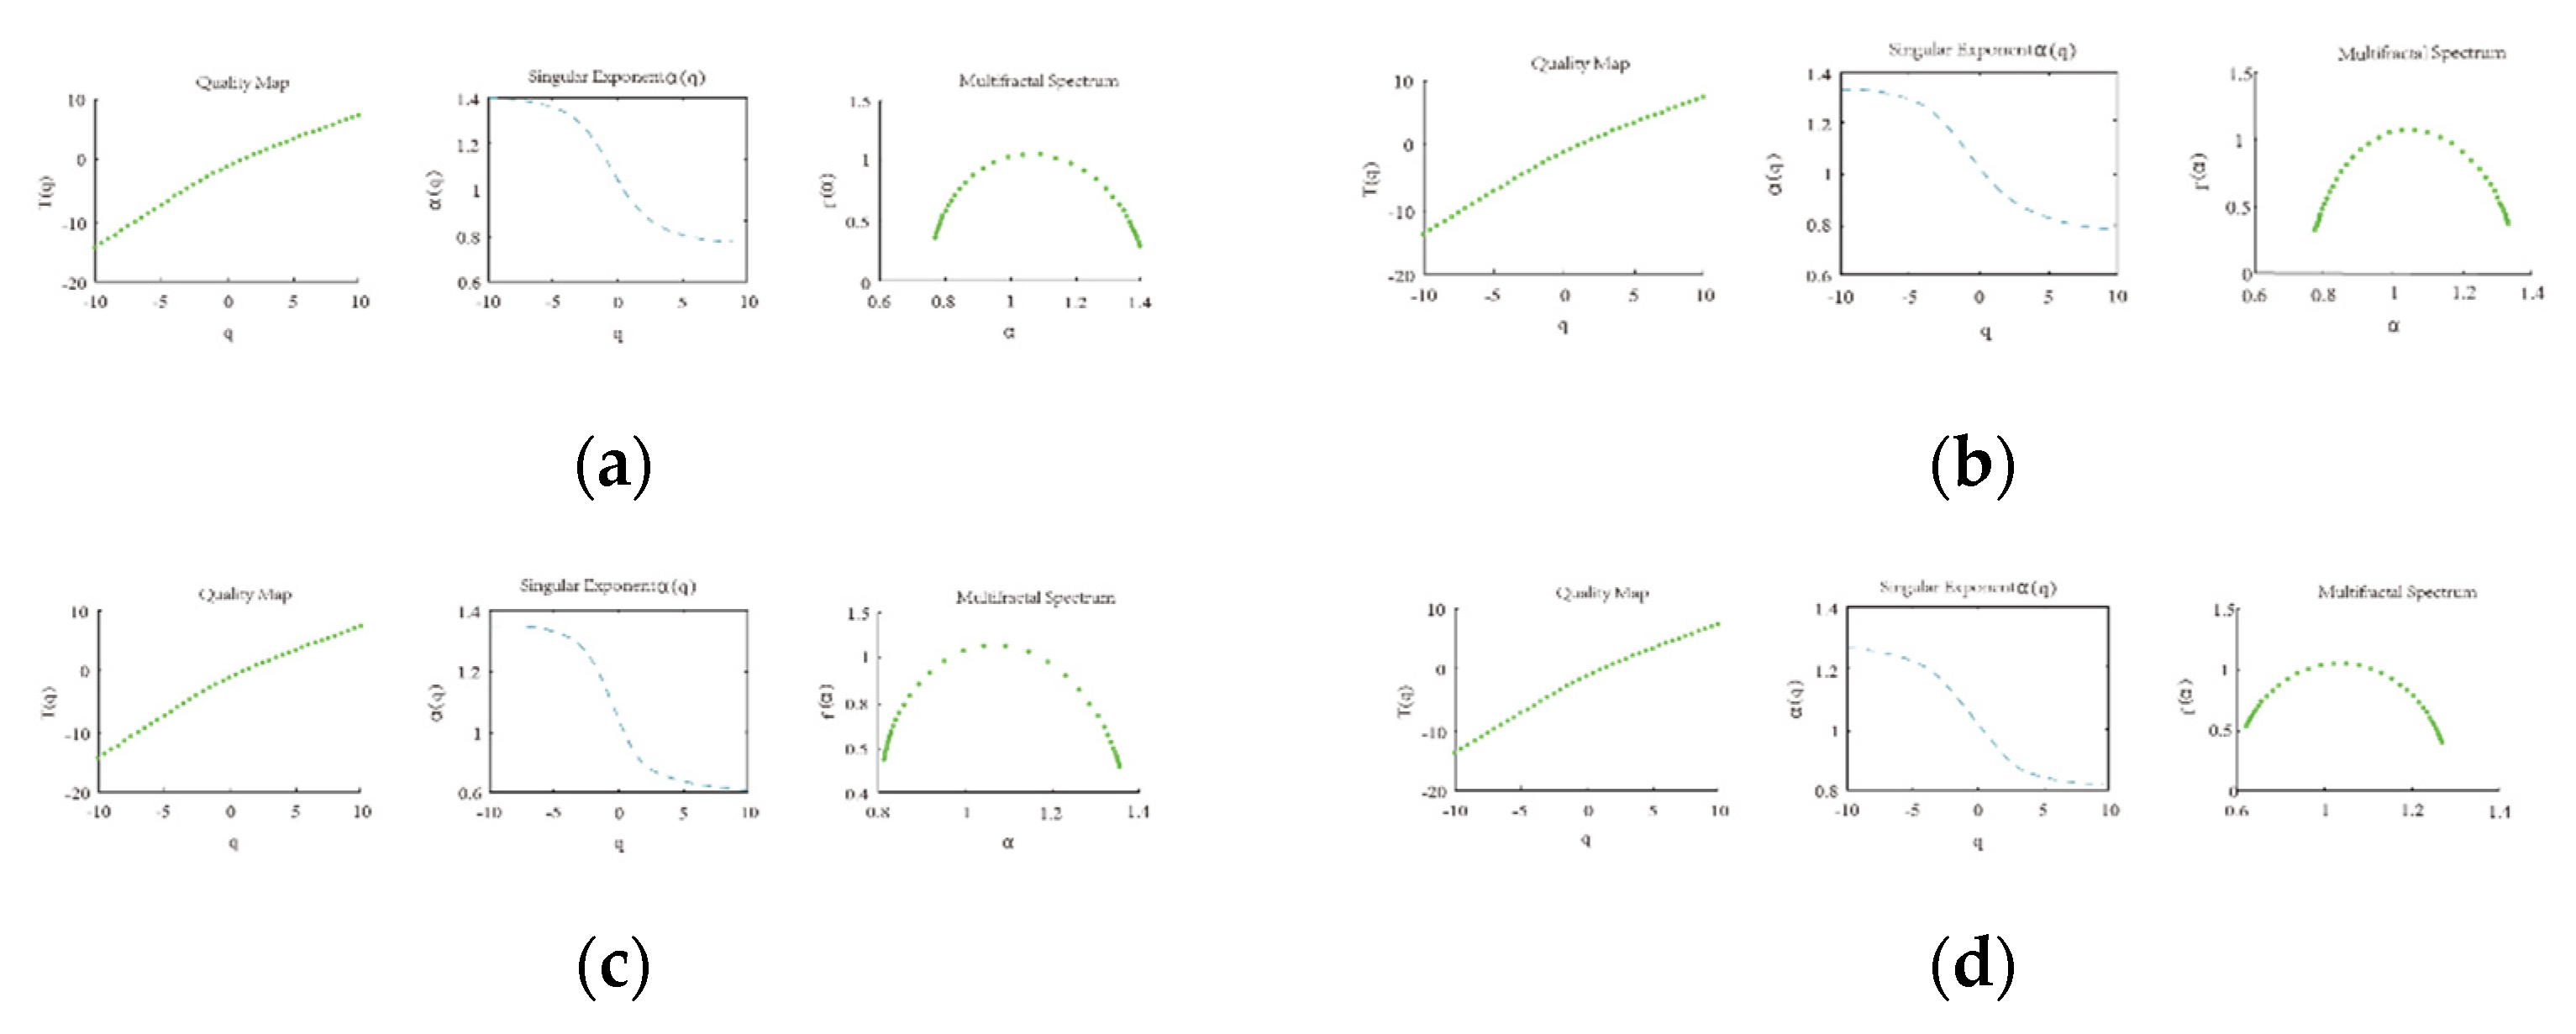
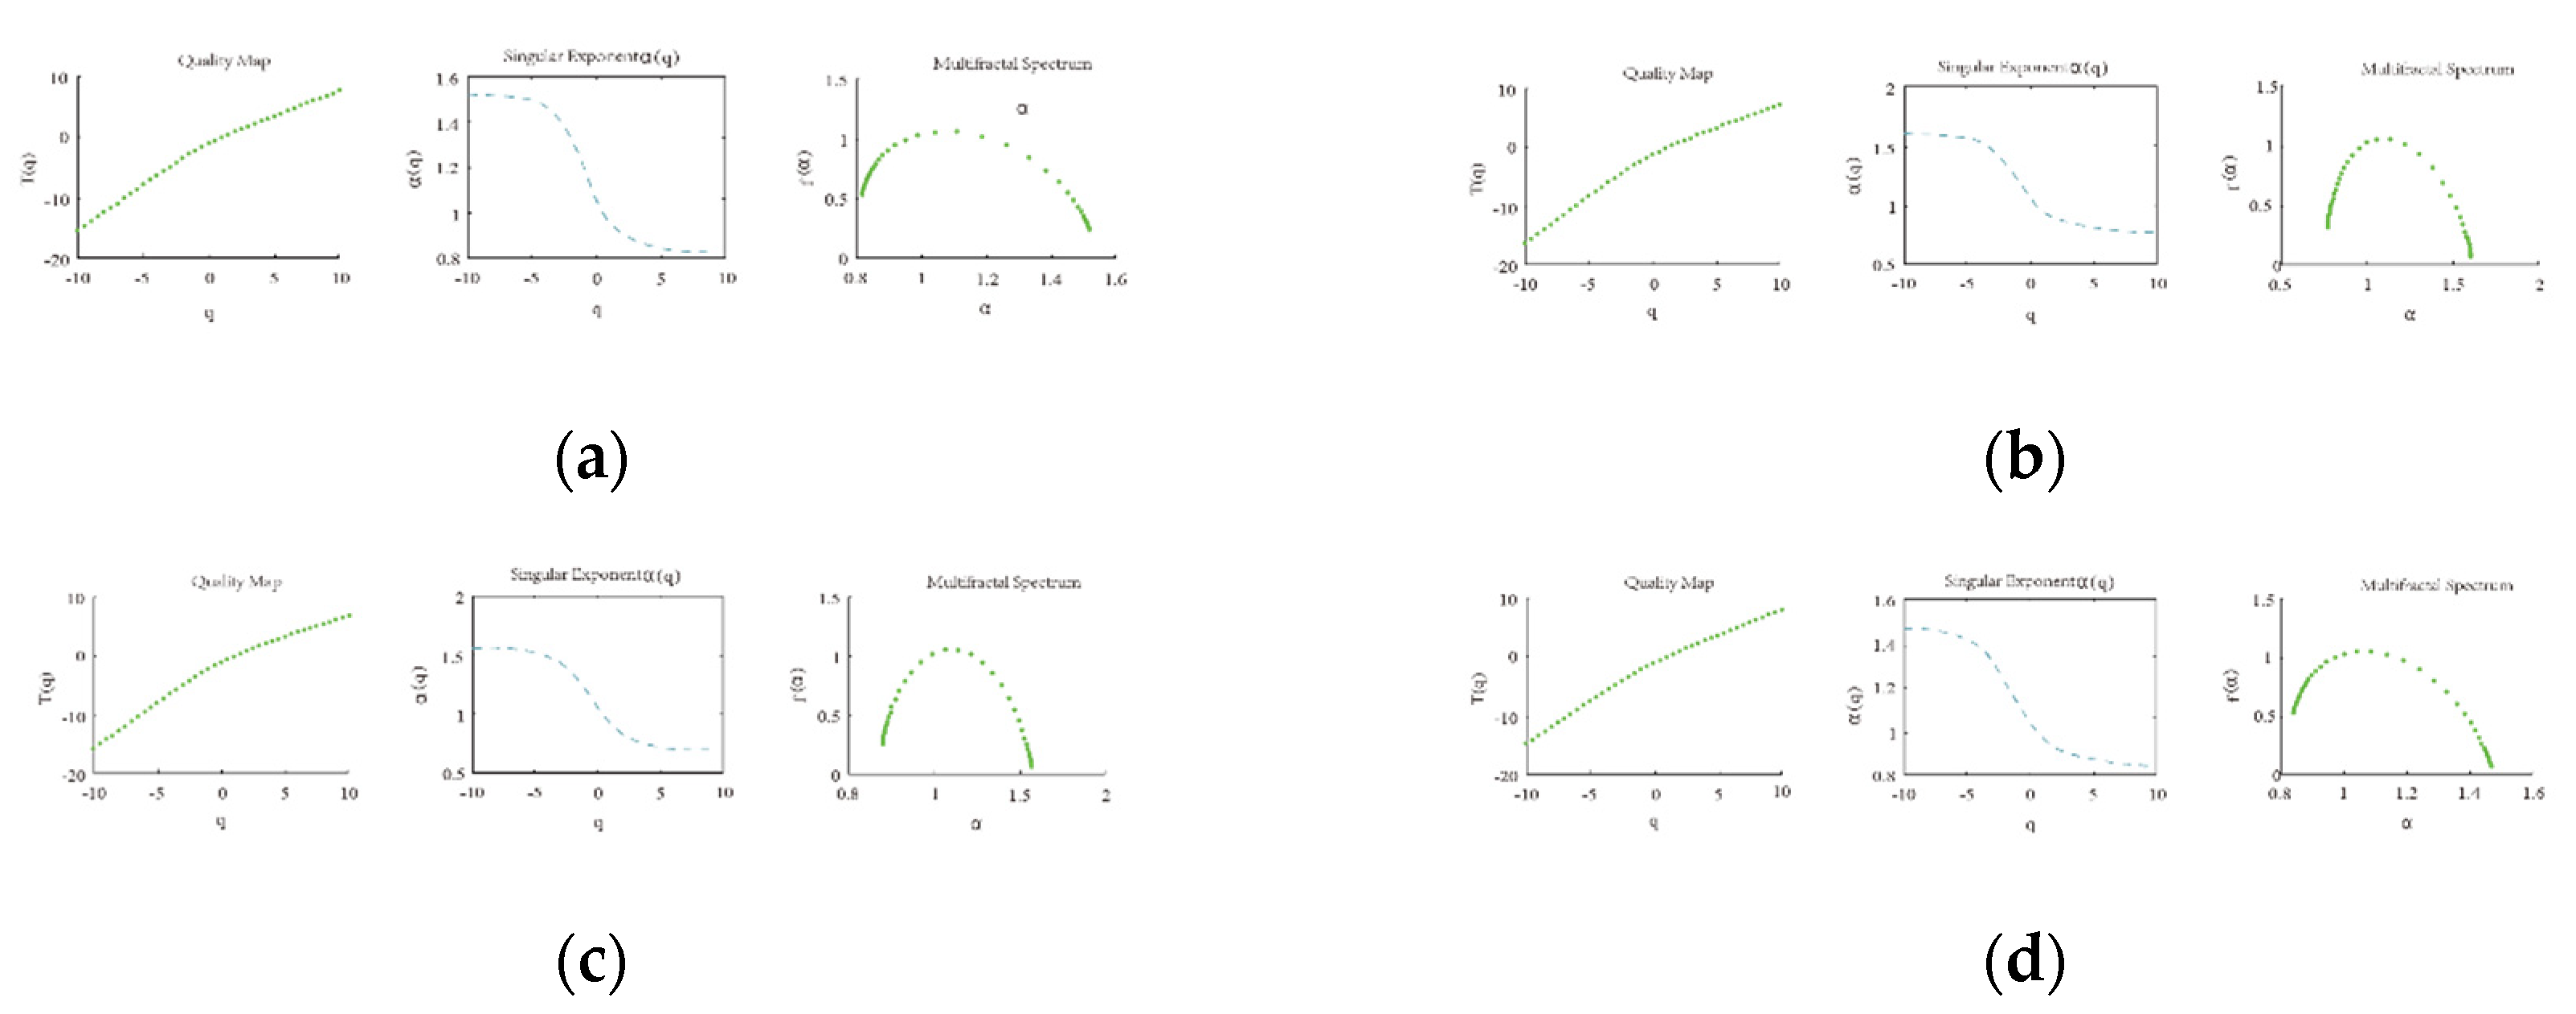
Figure 13, Figure 14 and Figure 15 show the fractal spectra of the changes of mobile metal forms in the three groups of experiments, and the mass diagrams were all displayed as nonlinear upward convex curves, indicating that the various mobile forms of Cu all conformed to multifractal characteristics in the migration process, while the quality curves of the PP1-9 experimental groups deviated slightly, showing inconspicuous nonlinear characteristics. The other two groups’ mass curves showed obvious nonlinear characteristics.
The three groups of multifractal spectra were all displayed as asymmetric upward convex curves, suggesting that the ore-forming elements were subject to complex geologic agents during the migration process, presenting migration characteristics resulting from multiple transformation effects to varying degree (Cheng, 2001), i.e., typical multifractal characteristics, which cannot be described with a single fractal model.
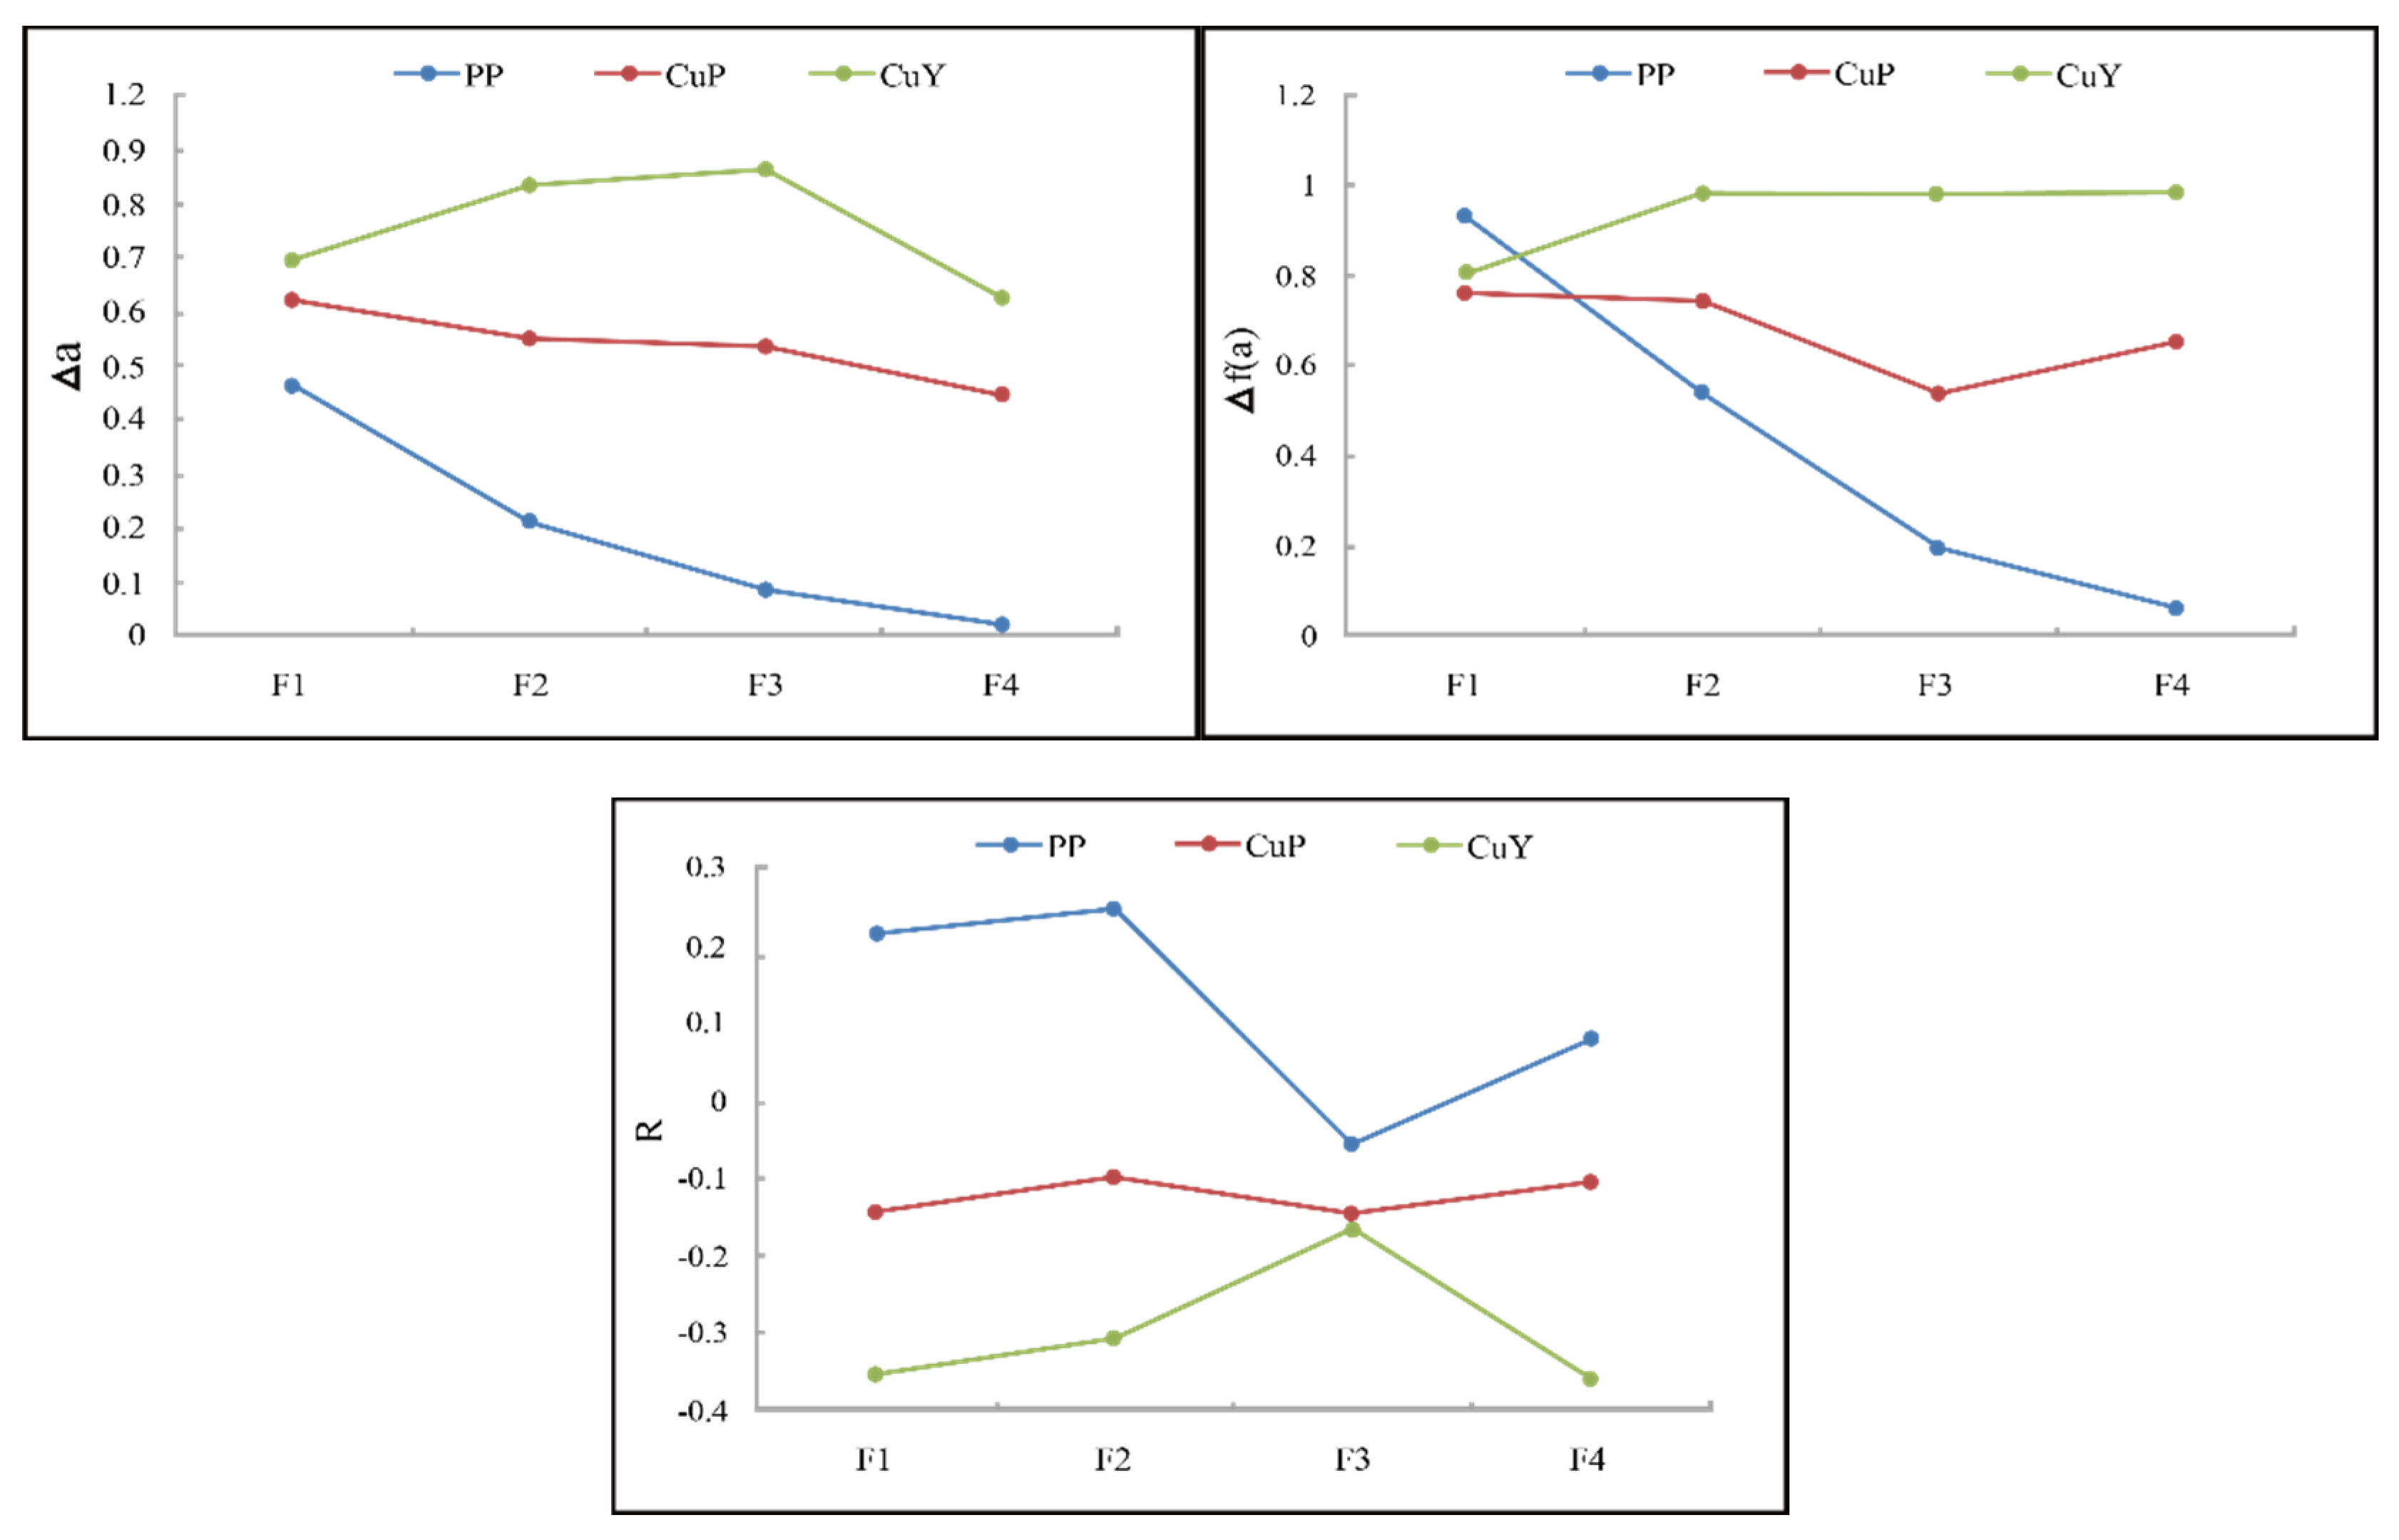
The multifractal parameters of elements were obtained by calculation (Table 5), where △α is the width of the opening below the multifractal spectrum, representing the multifractal singularity, reflecting the uniformity and singularity of element distribution in the entire measurement range; f(α) is the multifractal spectral function; △f(α) is the difference in multifractal spectrum (f(α)max-f(α)min), reflecting the variability of elemental content; R represents the asymmetry index of multifractal spectrum, and can be used to determine the mineralization potential of element distribution; for the asymmetry index R, its mathematical expression R=(αL-αR)/△α (Xie et al. 2003); the calculation of singular value can, to a certain extent, enhance the weak mineralization anomaly caused by the deep ore source (Cheng Q, 2012).
*Δα is the width of multifractal singular spectrum; Δf(α) is the height difference between the left and right sides of the multifractal spectral curve; R=(αL-αR)/Δα is asymmetric index of multifractal spectrum.
From the perspective of moment analysis, the left half of the multifractal spectrum function curve primarily reflects the fractal characteristics of value distribution at q>=0, especially the variation characteristics of high content value. In contrast, the right half, where q<0, primarily reflects the characteristics of tiny fractal structures shown during the measuring process, i.e., the characteristics of low content can be highlighted (Cheng Q. et al., 2000; Xie et al., 2017). Δα reflects the heterogeneity of element distribution in the whole measurement range. The larger Δα is, the more inhomogeneous and less continuous the distribution of elements is; Δf(α) spectrum difference reflects the proportion of the high-value area and low-value area of elements. The higher the proportion of the high-value area is, the more likely the elements are to migrate when the migration process is dynamically driven; The asymmetry index R can further reflect the difference between the high content and low content of elements, and reveal the difference in average density variation at different levels of sub-areas between the high content and low content of elements (Xie et al., 2004).
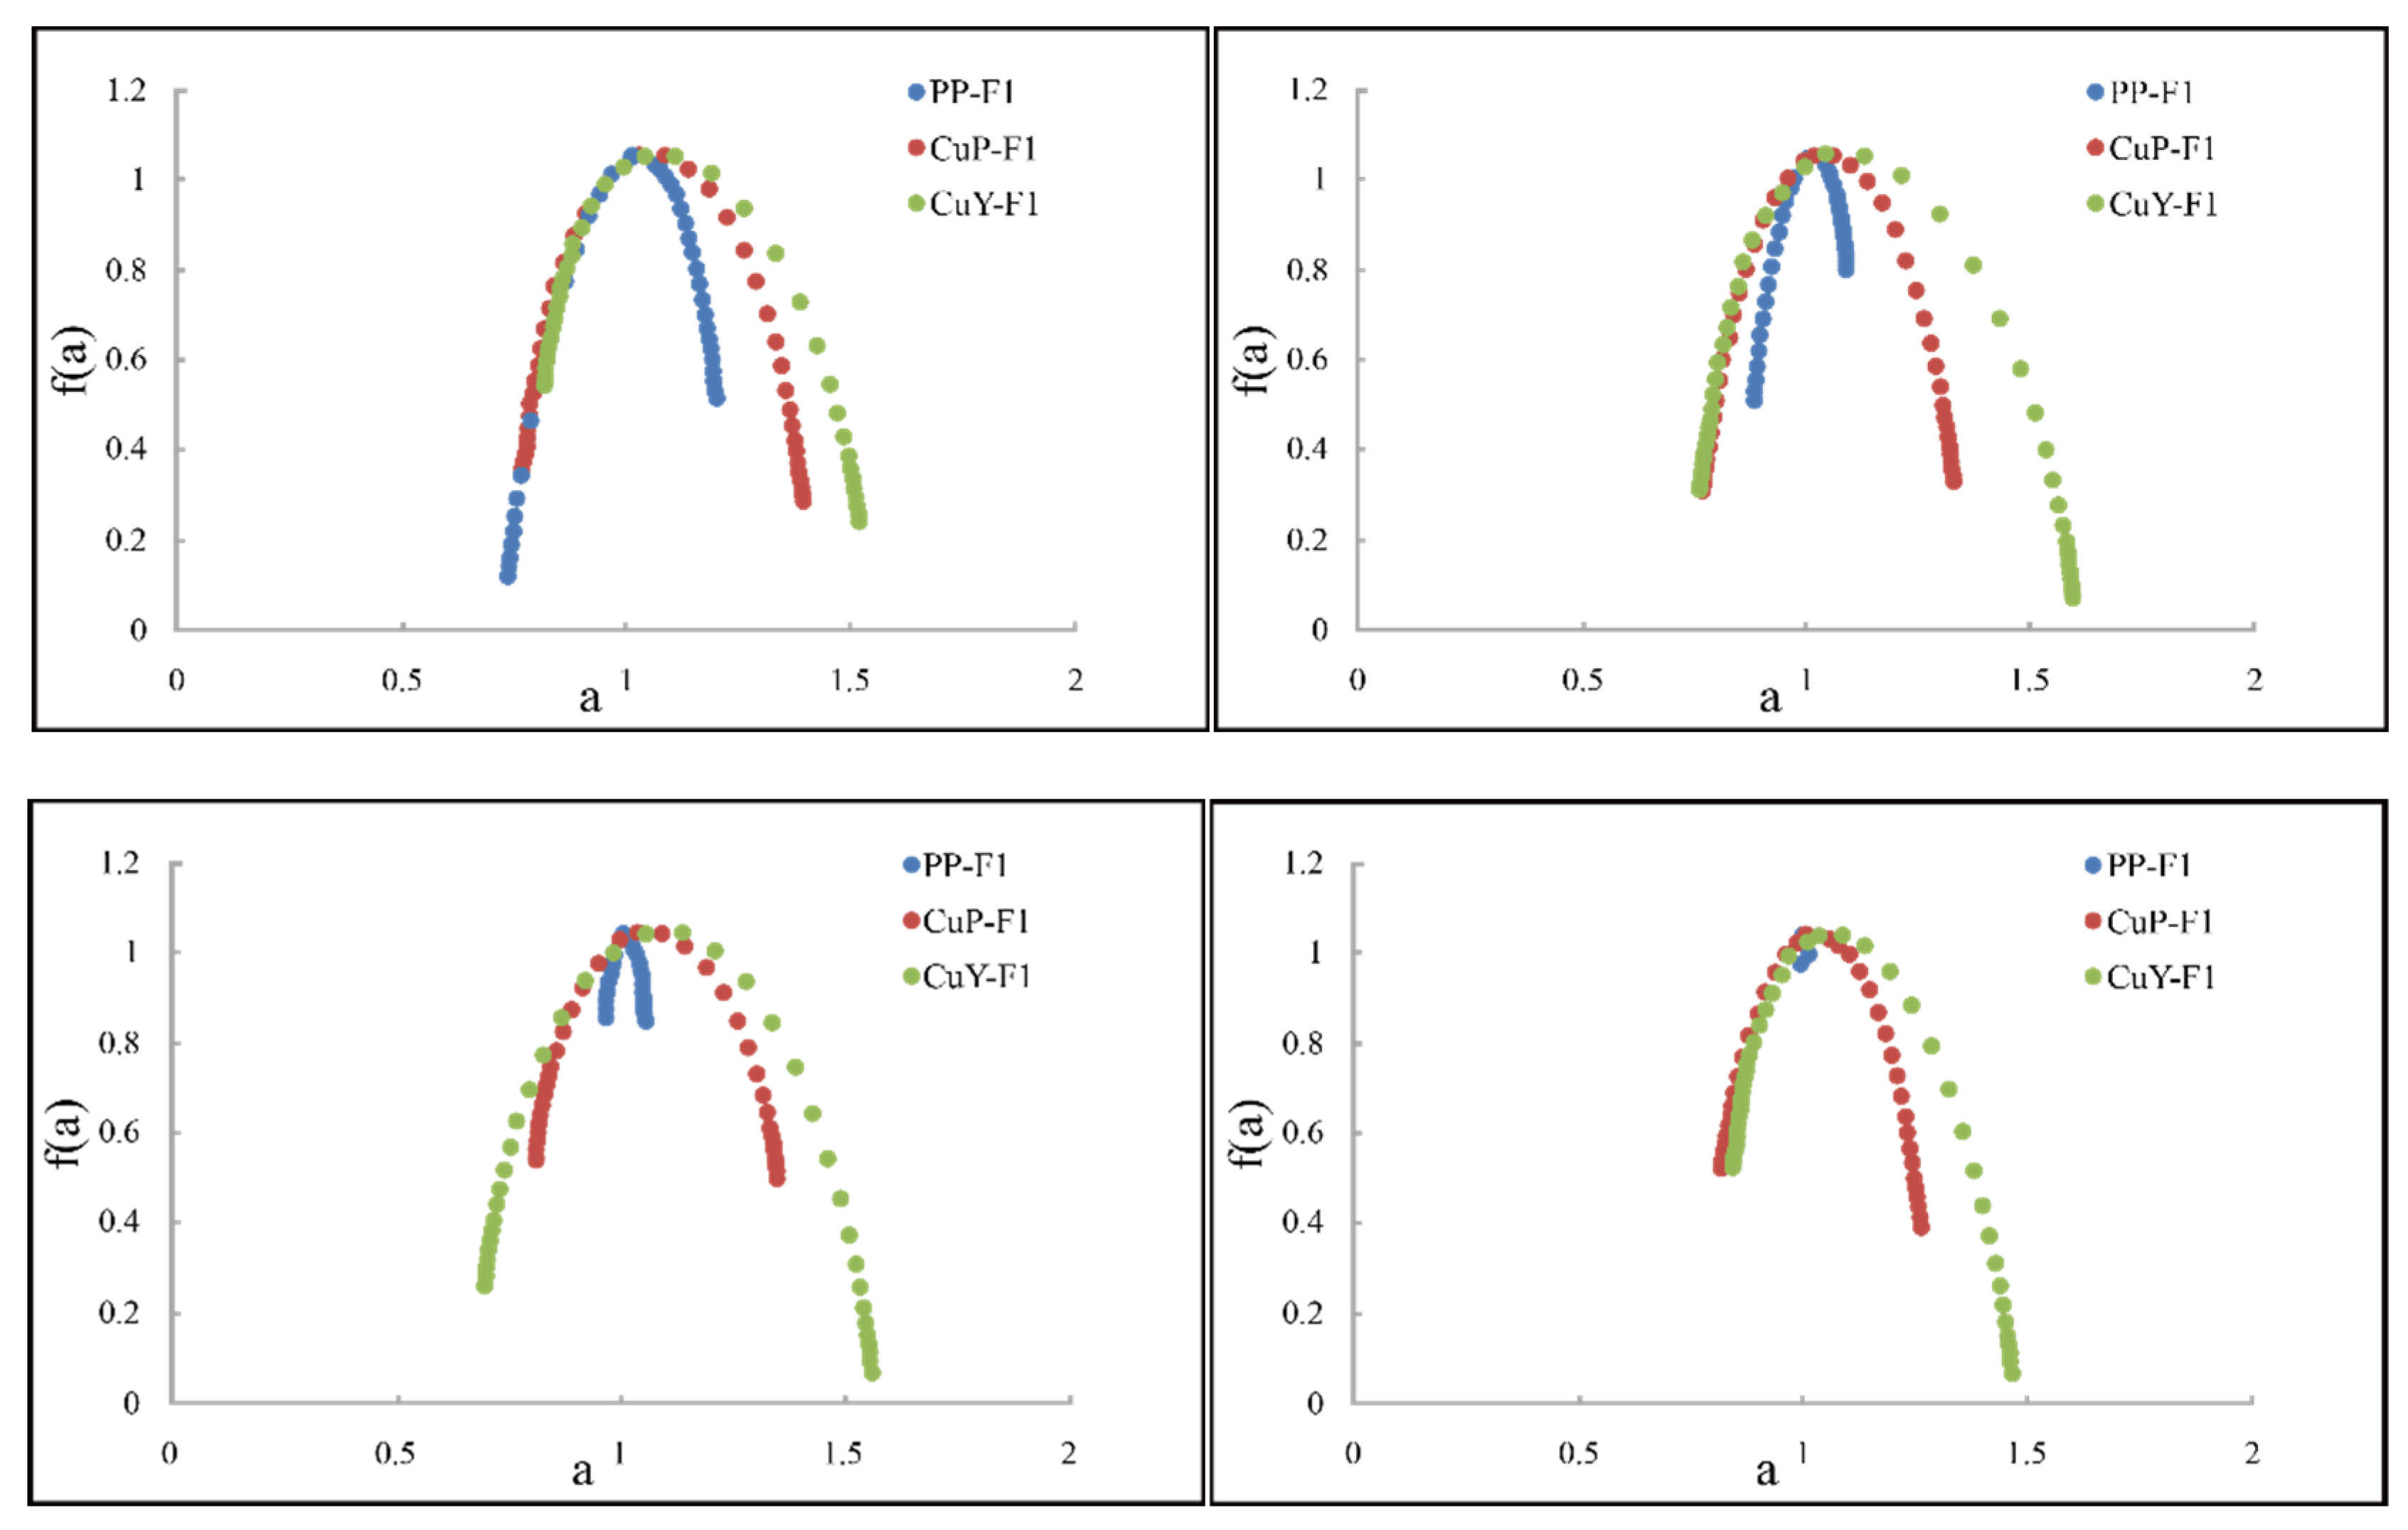
Figure 16 shows the multifractal spectra of the mobile forms of Cu in three groups. There is a significant spectrum difference among different mobile forms, indicating that there is a difference in the nonlinear characteristics of vertical element migration in different physicochemical contexts.
The nonlinear characteristics of mobile metal forms were further compared among the three experimental groups (Figure 17). The Δα of the opening in the multifractal spectrum of the PP group was the smallest among the three groups, and the multifractal spectrum difference Δf(α) was lower than that of the CuP and CuY groups except for F1, indicating that the content of mobile metal forms stayed stable on the temporal scale and changed slightly, with element concentration at a low level. Moreover, its asymmetry index R was greater than 0 except for F3, indicating that its high-content mobile metal forms occupied a high proportion; the multifractal spectrum of the CuY group boasted the highest △α of opening and the highest multifractal spectrum difference Δf(α), suggesting that the content of mobile metal forms was poorly continuous on the temporal scale and changes in a large range, with local concentration at a high level, implying that its mobile metal forms underwent more intense migration and transformation; on the other hand, the multifractal spectrum of the CuY group had the lowest asymmetry index R, which was less than 0, implying that its low-content mobile metal forms occupy a high proportion; the CuP group was in between.
In this study, tube experiments were conducted on Pulang cooper copper ore powder and Pulang soil samples (PP1-9), on pure Cu powder and Pulang soil samples (CuP1-9), and on pure Cu powder and Yujiashan soil samples (CuY1-9). A comprehensive analysis was performed on the multifractal characteristics of the mobile forms of Cu in the three groups of experimental samples (Figures 19–22) as well as the experimental conditions (Table 5). The results showed that the strong ore source (pure Cu powder) showed higher α and f α , larger intensity of migration, and higher local concentration level of mobile metal forms. This might be due to the reason that the strong ore source caused a large concentration difference, bringing into being a stronger driving force for migration. In the soil sample experiment conducted given high background value of ore-forming elements, the multifractal spectrum of mobile metal forms boasted large asymmetry index R. This might be due to the reason that the migration characteristics of ore-forming elements were weakened under the impact of the high background value of soil, and thus, there was a decrease in the concentration difference between the migration medium and the ore source, reducing the driving force for migration.
On the other hand, the multifractal characteristics of mobile metal forms with low α and f α and high R value might indicate the later-stage migration of ore-forming elements or a low-concentration-difference weak migration driving environment away from the source.
On the contrary, the multifractal characteristics of mobile metal forms with high α and f α and low R value might indicate the earlier-stage migration of ore-forming elements or a low-concentration-difference strong migration driving environment near the source.
Therefore, the multifractal analysis revealed that mobile metal forms underwent complex changes with local singularity, while the long-range migration and transformation of mobile metal forms had obvious multifractal characteristics. Also, a multifractal analysis was performed on the long-range migration and transformation characteristics of mobile metal forms, revealing a significant difference in the migration and transformation characteristics of mobile metal forms under different physicochemical conditions: In the experiment on high-concentration ores (pure Cu powder) and low ore-forming elements (Yujiashan soil), the multifractal characteristics of mobile metal forms presented high Δα and Δf(α) and low R value; in contrast, in the experiment on low-concentration ores (ore powder) and high ore-forming elements (Pulang soil), the multifractal characteristics of mobile metal forms presented low Δα and Δf(α) and high R value.

5. Conclusion

(1) There is an obvious vertical migration of ore-forming elements on both spatial and temporal scales. The total amount of Cu increases with depth on the spatial scale, while the total amount of Cu fluctuates nonlinearly at the same depth on the temporal scale and tends to be stable with time. The laboratory simulation experiments show that there is indeed a dynamic basis for the upward migration of ore-forming elements, causing local anomalies in the covered soil.
(2) Later-stage stacking can strengthen anomalies without changing the migration system of elements. The experimental results without later-stage stacking show that the total amount and mobile forms of the endogenous components of soil elements are basically stable in the vertical direction, not migrating at all, whereas experimental results with later-stage stacking show that the exogenous material (pure Cu powder) can strengthen migration without changing the total amount of migration and characteristics of mobile forms caused by the original medium (ore powder), making it possible to effectively explore the migration law and mechanism of elements.
(3) The distribution pattern of mobile metal forms. At the earlier stage of migration, the proportions of exchangeable form F1 and Fe-Mn oxide bound form F3 undergo a significant increase, and especially, F3 occupies an absolute dominant position; at the later-stage of migration, the proportions of carbonate-bound form F2 and organic bound form F4 increase significantly, and in general, the content variation of F3 and F4 occupies a dominant position. Spatially, the proportions of Fe-Mn oxide bound form F3 and organic bound form F4 are significantly higher than those of exchangeable form F1 and carbonate-bound form F2; furthermore, the proportions of these two major mobile metal forms show obvious periodicity, which is basically consistent with the change trend of the total amount, indicating that the upward vertical migration of elements is mainly induced by the transformation of mobile forms, especially of F3 and F4.
(4) Multifractals help to quantitatively characterize and effectively identify the vertical migration of ore-forming elements. The mobile forms of Cu present obvious multifractal characteristics in the vertical distribution of soil, indicating that ore-forming elements present a nonlinear and complex structure in the process where anomalies are caused to the covered area by upward migration, and multiple parameters have a certain indicating effect on different ore intensities and migrating soils, making it possible to effectively identify strong ore sources and offer guidance on deep-penetrating geochemical prospecting.

References

  1. Anand R R, Robertson I. The role of mineralogy and geochemistry in forming anomalies on interfaces and in areas of deep basin cover: implications for exploration. Geochemistry: Exploration, Environment, Analysis. 2012, 12, 45–66. [CrossRef]
  2. Anand R R, Aspandiar M F, Noble R. A review of metal transfer mechanisms through transported cover with emphasis on the vadose zone within the Australian regolith. Ore Geology Reviews 2016, 73, 394–416. [Google Scholar] [CrossRef]
  3. Arai, E. State-of-the-art geophysics for metal exploration. Resource Geology 2021, 71, 470–491. [Google Scholar] [CrossRef]
  4. Basta N T, Ryan J A, Chaney R L. Trace element chemistry in residual – treated soil: key concepts and metal bioavailability. Journal of Environmental Quality 2005, 34, 49–63. [Google Scholar] [CrossRef] [PubMed]
  5. Baudeta E, Gilesa D, Tiddya, C et al. Evaluation of cover sequence geochemical exploration sample media through assessment of element migration processes. Ore Geology Reviews 2018, 102, 449–473. [Google Scholar] [CrossRef]
  6. Butt C, Lintern M J, Anand R R. Evolution of regoliths and landscapes in deeply weathered terrain - implications for geochemical exploration. Ore Geology Reviews 2000, 16, 167–183. [Google Scholar] [CrossRef]
  7. Cameron E M, Hamilton S M, Leybourne M I, et al. Finding deeply buried deposits using geochemistry. Geochemistry Exploration Environment Analysis 2004, 4, 7–32. [Google Scholar] [CrossRef]
  8. Cao J, Liu C, Qin X, et al. Particles carried by ascending gas flow at the Tongchanghe copper mine, Guizhou Province, China. Science China 2010, 53, 1647–1654. [Google Scholar] [CrossRef]
  9. Cao J, Hu R, Liang Z, et al. TEM observation of geogas - carried particles from the Changkeng concealed gold deposit, Guangdong Province, South China. Journal of Geochemical Exploration 2009, 101, 247–253. [Google Scholar] [CrossRef]
  10. Chen Y, Wu W. Mapping mineral prospectivity using an extreme learning machine regression. Ore Geology Reviews 2017, 80, 200–213. [Google Scholar] [CrossRef]
  11. Cheng Q, Agterberg F. Multifractal modeling and spatial statistics. Mathematical Geology 1996, 28, 1–16. [Google Scholar] [CrossRef]
  12. Cheng Q. Singularity theory and methods for mapping geochemical anomalies caused by buried sources and for predicting undiscovered mineral deposits in covered areas. Journal of Geochemical Exploration 2012, 122, 55–70. [Google Scholar] [CrossRef]
  13. Cheng, Q. Ideas and methods for mineral resources integrated prediction in covered areas. Earth Science 2012, 37, 1109–1125. [Google Scholar]
  14. Cohen D R, Kelley D L, Anand R, et al. Major advances in exploration geochemistry, 1998-2007. Geochemistry Exploration Environment Analysis. 2010, 10, 3–16. [CrossRef]
  15. Cohen D R, Bowell R J. 13.24 - Exploration Geochemistry. Treatise on Geochemistry 2014, 17, 623–650. [Google Scholar] [CrossRef]
  16. Dobretsov N L, Pokhilenko N P. Mineral resources and development in the Russian Arctic. Russian Geology & Geophysics 2010, 51, 98–111. [Google Scholar] [CrossRef]
  17. Dunn C, E. Biogeochemistry in mineral exploration. Economic Geology 2007, 102, 1354–1354. [Google Scholar] [CrossRef]
  18. Farahbakhsh E, Hezarkhani A, Eslamkish T, et al. Three-dimensional weights of evidence modelling of a deep-seated porphyry Cu deposit. Geochemistry:exploration, environment, analysis. 2020, 20, 480–495. [CrossRef]
  19. Forstner U, Patchineelam S R. Chemical associations of heavy metals in polluted sediments from the Lower Rhine River. Particulates in Water 1980, 0189, 177–193. [Google Scholar] [CrossRef]
  20. Gambrell R, P. Trace and toxic metals in Wetlands- A Review. Journal of Environmental Quality 1994, 23, 883–891. [Google Scholar] [CrossRef] [PubMed]
  21. Griepink, B. An account of the improvement and harmonization of extraction techniques undertaken under the BCR. Speciation of Heavy Metals in Soils and Sediments 1993, 51, 135–151. [Google Scholar] [CrossRef]
  22. Hammarstrom J M, Mihalasky M J, Ludington S, et al. Undiscovered porphyry copper resources in the Urals- A probabilistic mineral resource assessment. Ore Geology Reviews 2017, 85, 181–203. [Google Scholar] [CrossRef]
  23. Kelly D L, Hall G M, Closs L G, et al. The use of partial extraction geochemistry for copper exploration in northern Chile. Geochemistry: Exploration, Environment, Analysis 2003, 3, 85–104. [CrossRef]
  24. Kong, M. A tentative discussion on geochemical exploration in forest-swamp terrain, northeastern china. Geophysical & Geochemical Exploration 2003, 3, 165–166. [Google Scholar] [CrossRef]
  25. Leleyter L, Probst J L. A new sequential extraction procedure for the speciation of particulate trace elements in river sediments. International Journal of Environmental Analytical Chemistry 1999, 73, 109–128. [Google Scholar] [CrossRef]
  26. Li T, Shouting Z, Liang W, et al. Exploration of concealed fluorite deposit in shallow overburden areas: A case study in Elimutai, Inner Mongolia, China. Earth Science Frontiers 2021, 28, 208, (In Chinese with English abstract). [Google Scholar] [CrossRef]
  27. 27. Liu X, Cao J, Li Y, et al. A study of metal-bearing nanoparticles from the Kangjiawan Pb-Zn deposit and their prospecting significance. Ore Geology Reviews 2019, 105, 375–386. [CrossRef]
  28. Liu Y, Cheng Q, Xia Q, et al. Identification of REE mineralization-related geochemical anomalies using fractal/multifractal methods in the Nanling belt, South China. Environmental Earth Sciences 2014, 72, 5159–5169. [Google Scholar] [CrossRef]
  29. Liu Y, Zhou K, Cheng Q. A new method for geochemical anomaly separation based on the distribution patterns of singularity indices. Computers & Geosciences 2017, 105, 139–147. [Google Scholar] [CrossRef]
  30. Mann A, W. Strong versus weak digestions: ligand-based soil extraction geochemistry. Geochemistry Exploration Environment Analysis 2010, 10, 17–26. [Google Scholar] [CrossRef]
  31. McKenna I M, Chaney R L, Williams F M. The effects of cadmium and zinc interactions on the accumulation and tissue distribution of zinc and cadmium in lettuce and spinach. Environmental Pollution 1993, 79, 113–120. [Google Scholar] [CrossRef] [PubMed]
  32. Mohammadi N M, Hezarkhani A, Saljooghi B S. Separation of a geochemical anomaly from background by fractal and U-statistic methods, a case study: Khooni district, Central Iran. Chemie der Erde - Geochemistry - Interdisciplinary Journal for Chemical Problems of the Geosciences and Geoecology 2016, 76, 491–499. [Google Scholar] [CrossRef]
  33. Morris, P. A. Fine fraction regolith chemistry from the East Wongatha area, Western Australia: tracing bedrock and mineralization through thick cover. Geochemistry Exploration Environment Analysis 2013, 13, 21–40. [Google Scholar] [CrossRef]
  34. Parsa M, Maghsoudi A, Yousefi M, et al. Recognition of significant multi-element geochemical signatures of porphyry Cu deposits in Noghdouz area, NW Iran. Journal of Geochemical Exploration 2016, 165, 111–124. [Google Scholar] [CrossRef]
  35. Ronen-Eliraz G, Russak A, Nitzan I, et al. Investigating geochemical aspects of managed aquifer recharge by column experiments with alternating desalinated water and groundwater. Science of The Total Environment 2017, 574, 1174–1181. [Google Scholar] [CrossRef]
  36. Salama W, Anand R, Schoneveld L, et al. Significance of ferruginous pisoliths and interface sampling for gold exploration in the covered terrains. Journal of Geochemical Exploration 2021, 106794. [Google Scholar] [CrossRef]
  37. Schumacher, D “Deet”. Surface geochemical exploration for oil and gas: New life for an old technology. The Leading Edge 2000, 19, 258–261. [Google Scholar] [CrossRef]
  38. Smee B, W. A new theory to explain the formation of soil geochemical responses over deeply covered gold mineralization in arid environments. Journal of Geochemical Exploration 1998, 61, 149–172. [Google Scholar] [CrossRef]
  39. Sun T, Liu L. Delineating the complexity of Cu-Mo mineralization in a porphyry intrusion by computational and fractal modeling: A case study of the Chehugou deposit in the Chifeng district, Inner Mongolia, China. Journal of Geochemical Exploration 2014, 144, 128–143. [Google Scholar] [CrossRef]
  40. Tessier, A. Sequential extraction procedure for the speciation of particle trace metals. Analytical chemistry 1979, 51, 844–851. [Google Scholar] [CrossRef]
  41. Wang, M. From exploration geochemistry to applied geochemistry:a review of the 21th international geochemical exploration symposium. Geophysical & Geochemical Exploration 2005, 96–100, (In Chinese with English abstract). [Google Scholar]
  42. Wang X, Zhang B, Lin X, et al. Geochemical challenges of diverse regolithcovered terrains for mineral exploration in China. Ore Geology Reviews 2016, 73, 417–431, (In Chinese with English abstract). [Google Scholar] [CrossRef]
  43. Wen X, Duan C, Zhang D. Effect of simulated acid rain and rare earth contamination on soil enzyme activities in rare earth ming area, South Jiangxi, China. Advanced Materials Research 2012, 610–613, 2954–2958. [CrossRef]
  44. Wen X, Duan C, Zhang D. Effect of simulated acid rain on soil acidification and rare earth elements leaching loss in soils of rare earth mining area in southern Jiangxi Province of China. Environmental Earth Sciences 2013, 69, 843–853. [Google Scholar] [CrossRef]
  45. Xie S, Cheng Q, Zhang S, et al. Assessing microstructures of pyrrhotites in basalts by multifractal analysis. Nonlinear Processes in Geophysics 2010, 17, 319–327. [Google Scholar] [CrossRef]
  46. Xie X, Lu Y, Yao W, et al. Further study on deep penetrating geochemistry over the Spence porphyry copper deposit, Chile. Geoscience Frontiers 2011, 2, 303–311. [Google Scholar] [CrossRef]
  47. Zou Y, Yu X, Lu X, et al. Vertical migration and distribution of added dissolved iron in Carex lasiocarpa marsh soil. Ecological Engineering 2012, 44, 43. [Google Scholar] [CrossRef]
  48. 48. Zuo R, Wang J. Fractal/multifractal modeling of geochemical data: A review. Journal of Geochemical Exploration 2016, 33–41. [CrossRef]
  49. Chen Y, Lu L, Li X. Kernel Mahalanobis Distance for Multivariate Geochemical Anomaly Recognition. Journal of Jilin University 2014, 44, 396–408, (In Chinese with English abstract). [Google Scholar] [CrossRef]
  50. Cheng Q. Multifractal and geostatistic methods for characterizing local structure and singularity properties of exploration geochemical anomalies. Earth Science-journal of China University of Geosciences 2001, 26, 161–166, (In Chinese with English abstract). [Google Scholar] [CrossRef]
  51. Cheng Q M. Singularity-generalized self-similarity-fractal spectrum (3S) models. Diqiu Kexue - Zhongguo Dizhi Daxue Xuebao/Earth Science - Journal of China University of Geosciences 2006, 31, 337–348. [Google Scholar] [CrossRef]
  52. Ge L, Tong C, He Z, et al. The character of geogas anomaly on concealed faults and its mechanism. Journal of Chengdu University of Technology 1997, 24, 29–35, (In Chinese with English abstract). [Google Scholar]
  53. Han Z, Liao J, Zhang Y, et al. Review of Deep-Penetrating Geochemical Exploration Methods. Advances in Earth Science 2017, 32, 828–838, (In Chinese with English abstract). [Google Scholar] [CrossRef]
  54. Hao L B, Tian M, Zhao X Y, et al. The application of projection pursuit model combined with RAGA to identifying stream sediment geochemical anomalies: A case study of a Zn-Pb deposit in Hunan Province. Geophysical and Geochemical Exploration 2016, 40, 1151–1156, (In Chinese with English abstract). [Google Scholar] [CrossRef]
  55. He F, Zhang Z, Wang S. Modeling vertical migration characteristics of polycyclic aromatic hydrocarbons in soil columns by leaching. Huanjing Kexue Xuebao / Acta Scientiae Circumstantiae 2009, 29, 988–996. [Google Scholar] [CrossRef]
  56. Hu B, Liang D L, Zhao W L, et al. Transformation and influences of copper and selenium fractions on heavy metals bioavailability in co-contaminated soil. Environmental Science 2012, 33, 2817–2824, (In Chinese with English abstract). [Google Scholar]
  57. Bin J I, Zhou T, Yuan F, et al. A method for identifying geochemical anomalies based on spatial autocorrelation. Science of Surveying and Mapping 2017, 42, 24–27, (In Chinese with English abstract). [Google Scholar] [CrossRef]
  58. Shukui L E, Duan Y. Determination of Heavy Metal Elements in Soil by ICP-MS. Chinese Journal of Inorganic Analytical Chemistry. 2015, 5, 16–19, (In Chinese with English abstract). [CrossRef]
  59. Chun-Hua L I, Lai-Jun L U. The Combination of Geochemistry Elements in Space Quantitative of Different Model and Its Application. Journal of Jilin University(Earth Science Edition) 2010, 40, 461–468, (In Chinese with English abstract). [Google Scholar] [CrossRef]
  60. Liu Y H, Ren T X, Wang M Q. Application of underground nano-size matter to mineral resources exploration. Bulletin of Mineralogy Petrology and Geochemistry 1997, 16, 250–253, (In Chinese with English abstract). [Google Scholar]
  61. Song C, Song W, Ding R, et al. Phytogeochemical Characteristics of Seriphidium terrae-albae(Krasch) Poljak in the Metallic Ore Deposits in North Part of East Junggar Desert Area,Xinjiang and their Prospecting Significance. Geotectonica et Metallogenia 2017, 41, 122–132, (In Chinese with English abstract). [Google Scholar] [CrossRef]
  62. Wang X, Xie X, Lu Y. Dynamic Collection of Geogas and its Preliminary Application in Search for Concealed Deposits. Geophysical And Geochemical Exploration 1995, 19, 161–171, (In Chinese with English abstract). [Google Scholar]
  63. 63. Wang X Q, YE Rong. Findings of Nanoscale Metal Particles: Evidence for Deep-penetrating Geochemistry. Acta Geoscientica Sinica 2011, 7–12, (In Chinese with English abstract). [CrossRef]
  64. Wang X Q, Zhang B M, Liu X M. Nanogeochemistry: deep-penetrating geochemical exploration through cover. Earth Science Frontiers 2012, 19, 101–112, (In Chinese with English abstract). [Google Scholar]
  65. Xie S Y, Jiao Y, Yan M, et al. Geochemical Vertical Transportation along Soil Profiles in Baiyinnuoer Pb-Zn Deposit Areas,Mongolia,China. earth science(journal of china university of geosciences) 2012, 40-48. (In Chinese with English abstract).
  66. Xie S, Bao Z. Multifractal and Geochemical Element Distribution Patterns. Geology-geochemistry 2003, 31, 97–102, (In Chinese with English abstract). [Google Scholar] [CrossRef]
  67. Yu T. The transport of heavy metals in soils with different initial redox potentialⅠ:Single Cd, Cu, Zn in the soil column experiments. Acta Pedologica Sinica 2012, 49, 688–697, (In Chinese with English abstract). [Google Scholar]
  68. Zhang B M, Wang X Q, Rong Y E, et al. Fine-grained soil prospecting method for mineral exploration in loess covered areas and discussion on the origin of geochemical anomalies. Journal of Guilin University of Technology 2019, 39, 301–310, (In Chinese with English abstract). [Google Scholar]
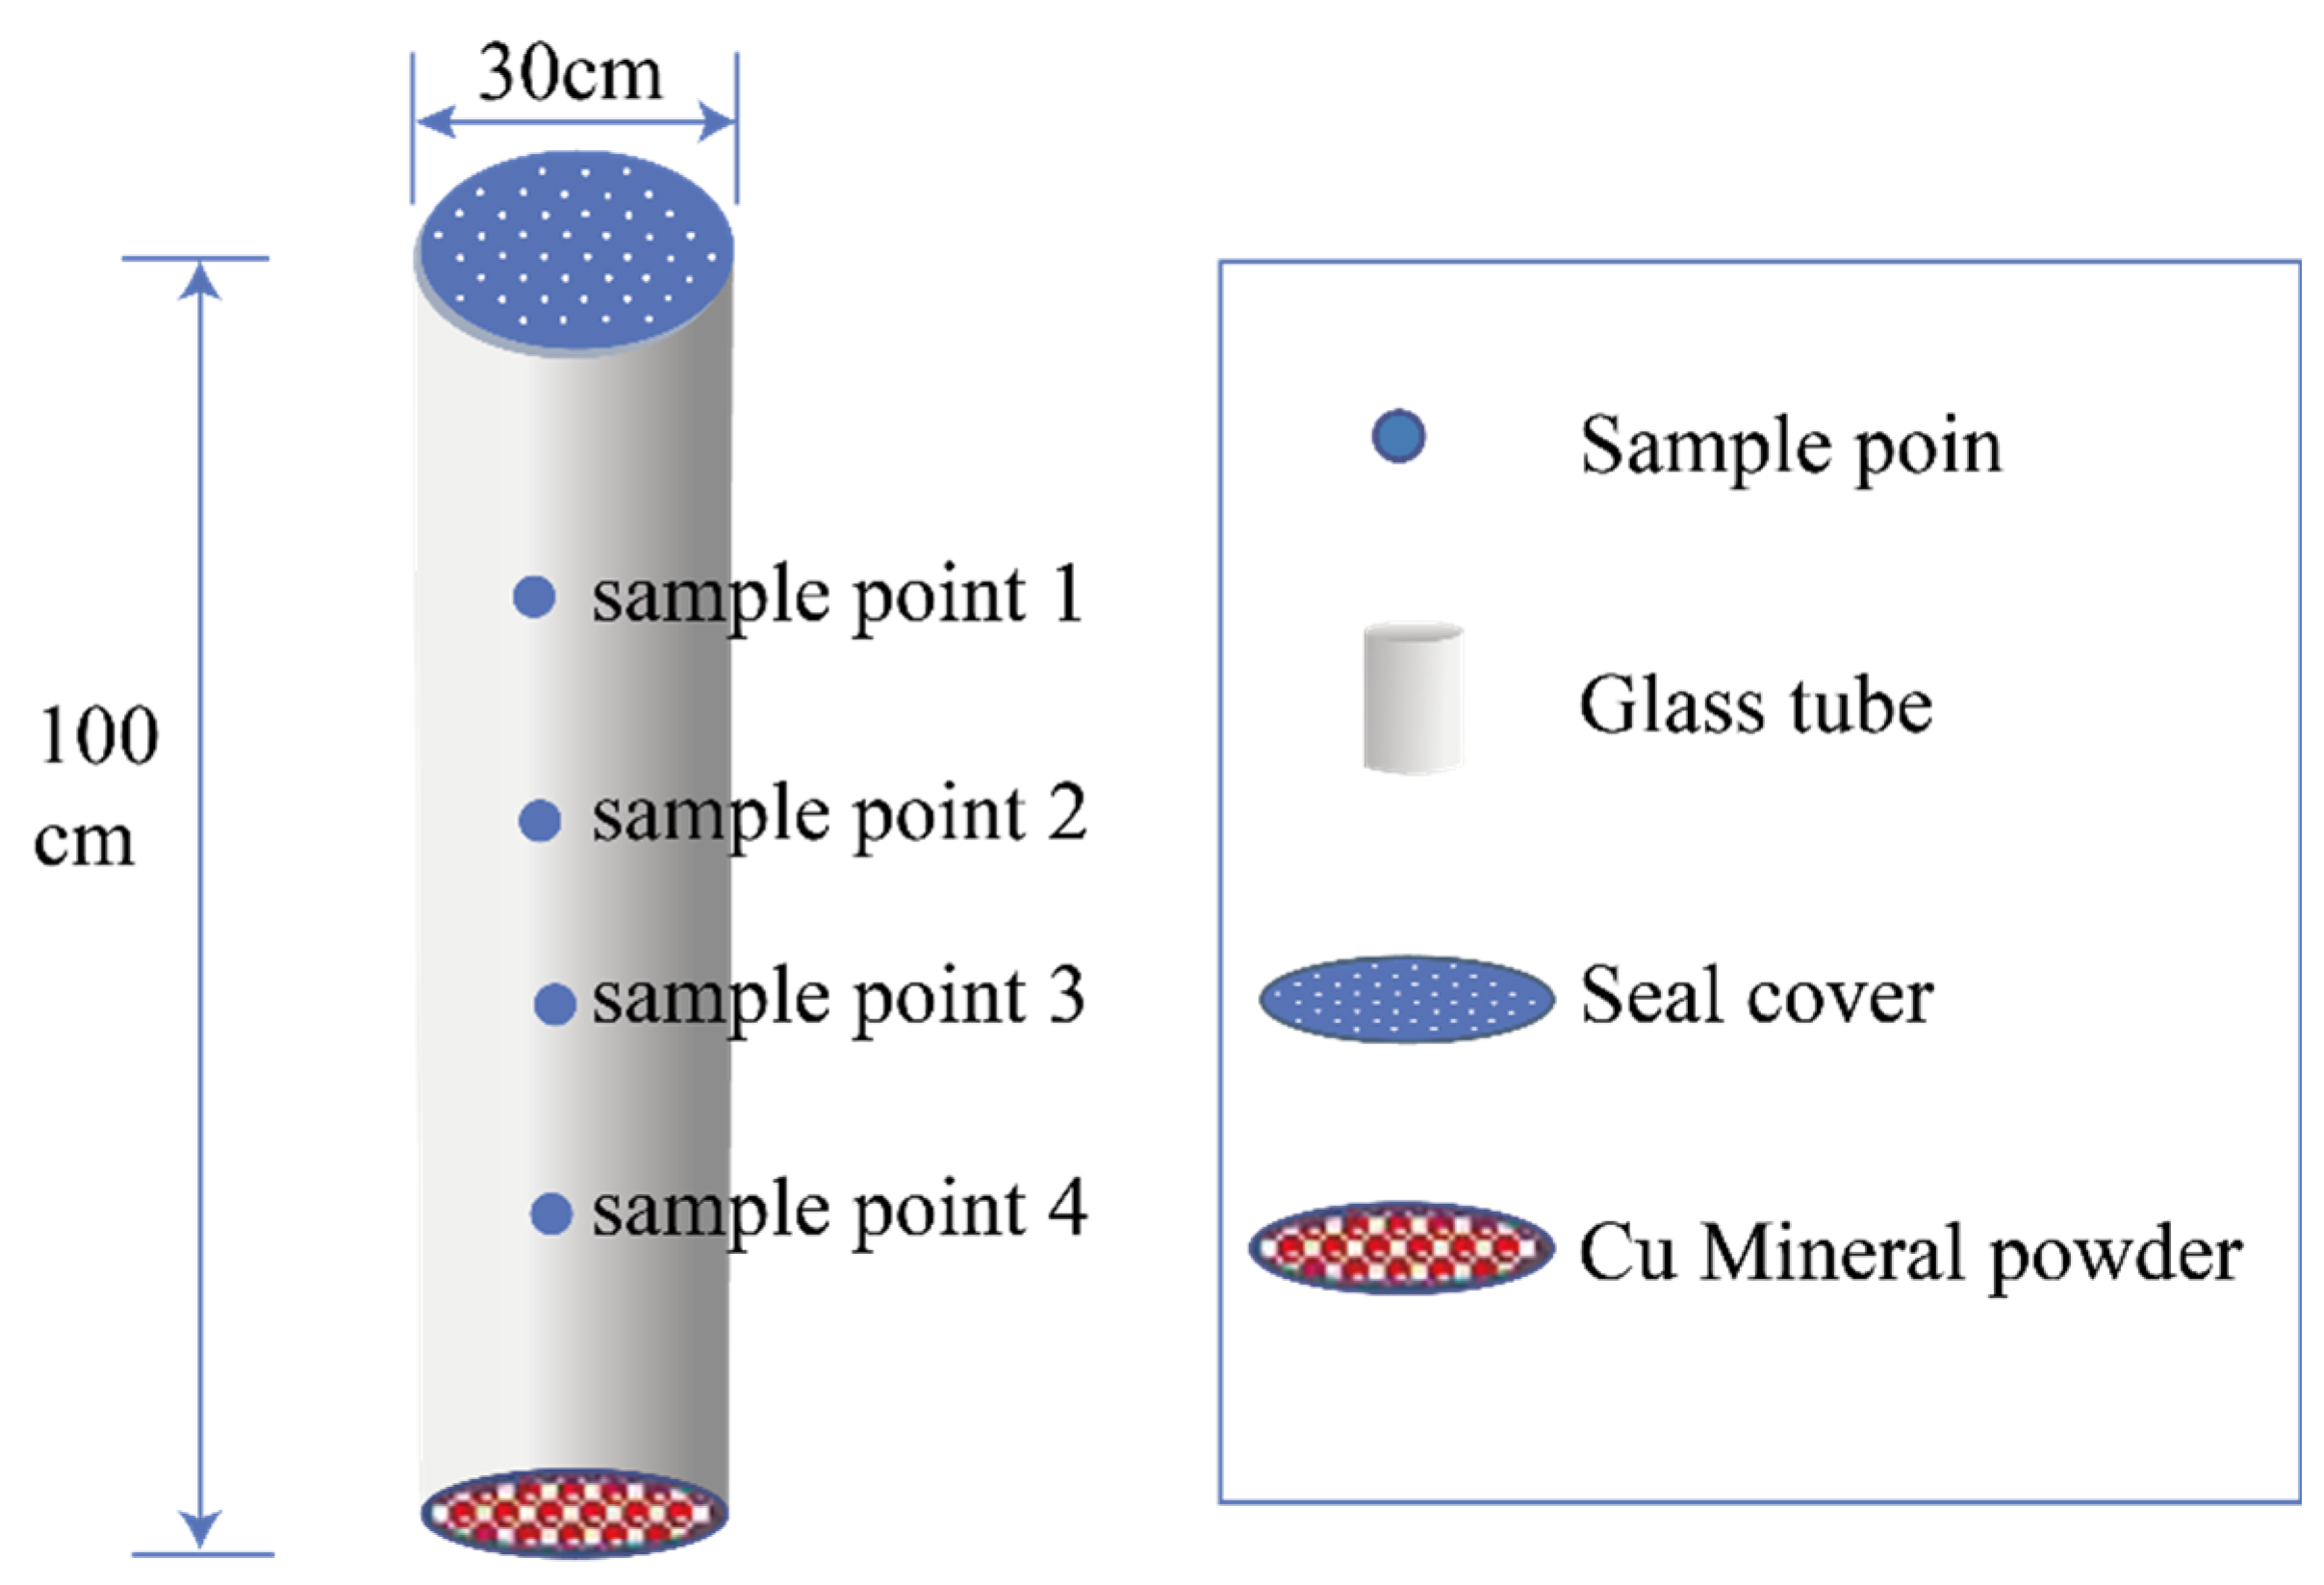
Figure 1. The indoor migration column model.
Preprints 80007 g001
Figure 2. The model of migration micro-column experiment.
Preprints 80007 g002
Figure 3. The content of Cu varies with depth in migration column experiment.
Preprints 80007 g003
Figure 4. Linear fitting relationship of spatial distribution of element content.
Preprints 80007 g004
Figure 5. Variation curve of the sum of each phase state (excluding F5).
Preprints 80007 g005
Figure 6. Cumulative proportion of active states of Cu.
Preprints 80007 g006
Figure 7. Active proportion (a-F1, b-F2, c-F3, d-F4).
Preprints 80007 g007
Figure 8. Changes in Cu content in different component of migration micro-column experiment.
Preprints 80007 g008
Figure 9. Dynamic changes of metal activity in different combinations of in vitro experiments. (a-Cu powder and soil are both from Pulang; b-pure Cu powder with soil of Pulang).
Preprints 80007 g009
Figure 10. Changes in Cu content corrected based on blank experiments.
Preprints 80007 g010
Figure 11. Change in active metal content.
Preprints 80007 g011
Figure 12. Changes in total elemental content and dynamic changes in metal activity (a. CuY; b. CuP).
Preprints 80007 g012
Figure 13. Multifractal spectrogram of Cu active state in Migration Micro-column experiment(PP1-9). (a) F1 (b) F2 (c) F3 (d) F4.
Preprints 80007 g013
Figure 14. Multifractal spectrogram of Cu active state in Migration Micro-column experiment (CuP1-9). (a) F1 (b) F2 (c) F3 (d) F4.
Preprints 80007 g014
Figure 15. Multifractal spectrogram of Cu active state in Migration Micro-column experiment (CuY1-9). (a) F1 (b) F2 (c) F3 (d) F4.
Preprints 80007 g015
Figure 16. Multifractal spectra of metal activity states of Cu in migration micro-column experiment. (a) F1 (b) F2 (c) F3 (d) F4.
Preprints 80007 g016
Figure 17. Comparison of multifractal parameters.
Preprints 80007 g017
Table 1. Information of samples and experimentals.
Number Mineral Source Soil Quantity Method
0Y-1...0Y-9 Yujia soil Yujia soil 9 pXRF, Tessier Classification, ICP-MS
0P-1...0P-9 Pulang soil Pulang soil
CuY-1...CuY-9 Natural Cu powder Yujia soil
CuP-1...CuP-9 Natural Cu powder Pulang soil
PY-1...PY-9 Pulang ore powder Yujia soil
PP-1...PP-9 Pulang ore powder Pulang soil
Table 2. Content information of Cu element in the sample of migration column experiment (mg/kg).
Samples The First Batch The Second Batch The Third Batch The Fourth Batch
Original sample 25 25 25 25
Sample point I 32 35 42 38
Sample point II 34 45 47 45
Sample point III 53 81 56 61
Sample point IV 100 101 68 73
Table 3. Analysis Results of Cu Element Activity in Migration Column Experiment (mg/kg).
Samples F1 F2 F3 F4 F5
Original sample 0.164 0.885 1.074 0.686 17.541
1-1 0.109 0.110 6.750 1.019 23.183
1-2 0.190 0.172 12.967 1.530 11.483
1-3 0.986 0.616 22.328 3.147 19.197
1-4 1.050 0.648 31.301 4.047 16.970
2-1 0.246 0.899 1.078 0.365 15.175
2-2 2.198 9.095 2.115 0.206 19.569
2-3 3.553 12.784 3.002 0.258 20.536
2-4 6.038 15.069 0.920 0.237 19.072
3-1 0.357 0.826 1.783 2.741 23.741
3-2 0.532 0.954 2.280 3.008 21.297
3-3 1.635 2.561 5.727 5.941 23.815
3-4 2.928 3.894 8.357 9.998 23.001
4-1 0.279 0.490 1.665 1.871 16.774
4-2 0.768 1.369 2.836 3.700 30.313
4-3 1.760 1.358 5.484 4.154 45.617
4-4 1.950 2.391 4.463 3.794 27.371
Table 4. Cu content for in vitro experiments of Pulang Ore /Pure Cu/Blank-Pulang soil.
Samples Cu (mg/kg) Samples Cu (mg/kg) Samples Cu (mg/kg)
PP-1 360 CuP-1 470 0P-1 356
PP-2 366 CuP-2 407 0P-2 346
PP-3 377 CuP-3 417 0P-3 356
PP-4 407 CuP-4 441 0P-4 344
PP-5 361 CuP-5 390 0P-5 363
PP-6 352 CuP-6 396 0P-6 353
PP-7 371 CuP-7 487 0P-7 341
PP-8 394 CuP-8 413 0P-8 348
PP-9 343 CuP-9 389 0P-9 329
Table 5. Multifractal parameters of Migration Micro-column experiment.
Samples Active state α f α R
PP F1 0.4652 0.9292 0.2147
F2 0.2117 0.5426 0.2471
F3 0.0883 0.1972 -0.0547
F4 0.0222 0.0614 0.0798
CuP F1 0.6249 0.7638 -0.1447
F2 0.555 0.7441 -0.0973
F3 0.5401 0.5417 -0.1479
F4 0.4472 0.6528 -0.104
CuY F1 0.6968 0.81 -0.3527
F2 0.8324 0.982 -0.3051
F3 0.8662 0.9826 -0.1655
F4 0.6247 0.9844 -0.3597
Disclaimer/Publisher’s Note: The statements, opinions and data contained in all publications are solely those of the individual author(s) and contributor(s) and not of MDPI and/or the editor(s). MDPI and/or the editor(s) disclaim responsibility for any injury to people or property resulting from any ideas, methods, instructions or products referred to in the content.
Copyright: This open access article is published under a Creative Commons CC BY 4.0 license, which permit the free download, distribution, and reuse, provided that the author and preprint are cited in any reuse.
Prerpints.org logo

Preprints.org is a free preprint server supported by MDPI in Basel, Switzerland.

Subscribe

© 2024 MDPI (Basel, Switzerland) unless otherwise stated