1. Introduction
Precipitation outlooks are becoming increasingly important because of the impact on agroecology and socioeconomic activities around the world. Seasonal forecasts have focused on the climatic variable of precipitation, in the long term they are socially relevant because they have the potential to inform about the operational management of water administration systems such as reservoirs in dams or irrigation systems in agriculture (Wedgbrow et al., 2002). Therefore, a lot of farming activities depend on the climate effects on a specific region, Recently, several droughts of importance have been reported in different countries, for example in South Africa (2014-2016), Australia (2012-2016), Brazil (2012-2015), New Zealand (2012-2013), Marshall Islands (2012-2013), Southern U.S., and Mexico (2011-2012) (NOAA, 2020). In Mexico, water availability for rainfed and irrigated agriculture is crucial, and it represents a high risk for the latter sector, since more than half of Mexican agriculture is based on seasonal rainfall (Conde et al., 2006). In North-Central Mexico, the 2011–2012 droughts impacted the states of Chihuahua, Coahuila, Durango, Zacatecas, San Luis Potosi, and Aguascalientes which was the worst drought in 70 years, according to officials (CONAGUA/SMN, 2012). During this prolonged dry period, national grain volumes dropped drastically; for example, bean production reached roughly 40% (SIAP, 2019), which wreaked havoc on the national grain supply. Likewise, the cost of the 1982-83 El Niño event for Mexico and Central America is estimated at about six hundred million dollars (NOAA, 1994). The El Niño event of 1997-1998 resulted in an even more dramatic economic loss of two billion dollars for Mexico alone (Delgadillo et al., 1999).
Successful monthly-seasonal precipitation outlooks depend mostly on a revolution in our understanding of the coupled ocean-atmosphere system. Large-scale factors such as El Niño, the North Atlantic Oscillation, the Intertropical Convergence Zone, Hurricanes, Easter Waves, and Jet Currents behave differently in intensity and frequency from year to year, implying that the rainfall prediction for an area or region is a complex task. Notwithstanding, a known phenomenon with direct influence on global climate is El Niño Southern Oscillation (ENSO) (Butler & Polvani, 2011; Vera et al., 2014; Hegyi and Deng, 2011; Di Lorenzo et al., 2010; Yang & DelSole, 2012; Bell et al., 2009; Cagnazzo and Manzini, 2009) that usually alters global/regional precipitation during its different phases (Vicente-Serrano et al., 2011). ENSO are instances of warm temperature anomalies of the sea surface in the east and center of the Equatorial Pacific. During warmth, temperature anomalies (consecutive three monthly indices above 0.5 °C) signify the presence of an El Niño event; while inversely indicate the presence of La Niña (indices below -0.5 °C). In Mexico, Mendez-Gonzalez (2007), Adams et al. (2003), Corrales-Suastegui (2015), Englehart & Douglas (2001), Gay-García (2004) found a connection between ENSO phases and precipitation and used them as seasonal/monthly precipitation outlooks. The latter forecasts are constrained to empirical or statistical techniques since the lack of computational power to run dynamic models (geophysical models require a lot of investment that poor or developed countries cannot afford).
Thus, in this study, the objective was to test seasonally the monthly precipitation outlooks in Mexico by using a straightforward decision tree classifier model to identify similar historical ENSO events. The technique can be used as an operational tool for decision-makers, farmers, and potential users to plan their activities in the long-range.
2. METHODOLOGY
2.1. Area of Study
Mexico is located in the northern part of the American Continent; it is the northernmost Latin American country, its territory covers 1,953,162 km
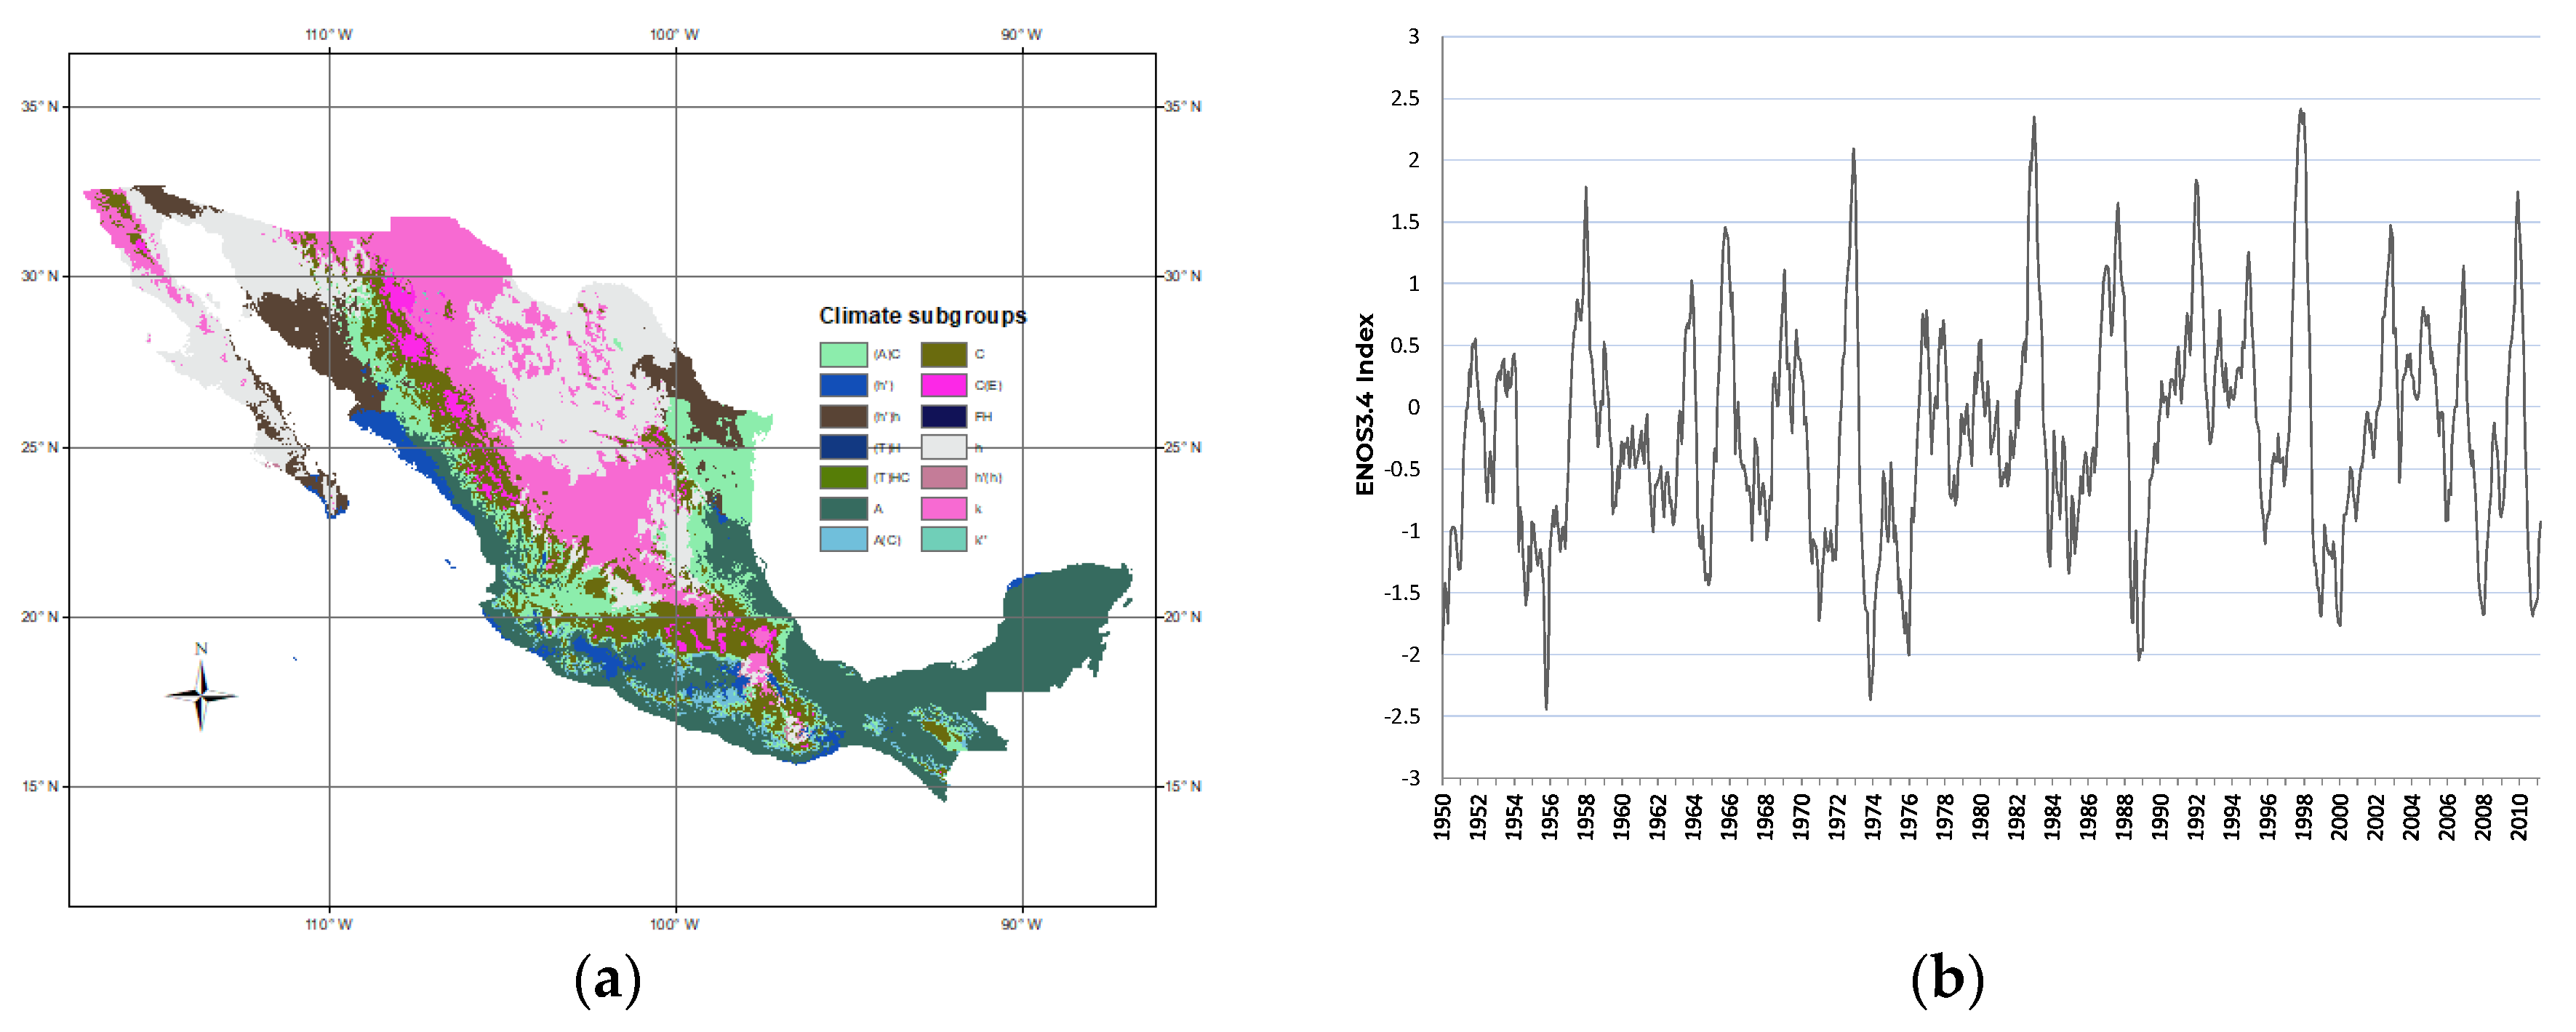
2 and is distributed, almost equally, on both sides of the Tropic of Cancer. In most of the country, the topography is rough and contains many climatic groups and subgroups, where there are variations from dry to humid climates in short distances. Up north of the Tropic of Cancer (23° 26´), the arid and semi-arid climate prevails, and to the south the humid and semi-humid climate as well (
Figure 1a). Climate seasons are December-February (winter), March-May (spring), June-Aug (summer), and September-November (fall).
The country is highly influenced by seasonal trade winds and cyclones that occur in this area from the Pacific and Atlantic oceans (Ramirez-Carlos, 2017). In Mexico, the average annual rainfall is 777 mm, though, in the northwest and northeast, it hardly reaches 100 mm, while in the southeast and parts of the southern Pacific coast, an average of between 2,000 mm and up to 4,000 mm are recorded (Lopez-Cruz et al., 2021). The largest annual amount of precipitation occurs during the summer in most of the country (Perdigon-Morales et al., 2018), though a midsummer minimum is detected (MSD (MidSummer Drought) (Corrales et al., 2019) and the extreme northwest is influenced by a Mediterranean climate with a rainy season during the winter (Walkowiak and Solana, 1989).
2.2. ENSO indices and precipitation
A seasonal outlook model proposed in this study takes into account the historical condition of warming or cooling of the Tropical Pacific Ocean, determined by the ENSO phenomenon in Region 3.4 (ENSO3.4). ENSO3.4 is located between ENSO3 and ENSO4 (overlapping), this is the region where index anomalies reflect most of the ENSO phenomenon (Barnston et al., 1997) (
Figure 2a). Monthly ENSO3.4 indices were obtained from the CPC-NOAA (
https://www.cpc.ncep.noaa.gov/data/indices/ersst5.nino.mth.91-20.ascii).
Figure 2b shows the monthly ENSO3.4 indices for the period December 1950 – February 2011. Significant oscillations are observed between cold events (negative indices) and warm events (positive indices) of the phenomenon. In the decades of the 70s and 2000s, La Niña prevailed, while in the 80s, 90s, and 2010s, El Niño prevailed. The years 1954, 1973, 1975, 1988, and 2010 stand out as the coldest events, and the years 1983, 1987, and 1997 as the warmest (
Figure 1b).
A historical database of daily historical precipitation (1950 to 2011) from Livneh et al. (2015) was collected. This geospatial information is embedded in continuous surfaces (grids) at daily temporal resolution and at a spatial resolution of 0.06° (~6 km X ~6 Km) (
Figure 1). Thereafter, historical monthly precipitation data from December 1951 to February 2011 was calculated.
1.3. Decision tree classifier index-precipitation model and assessments
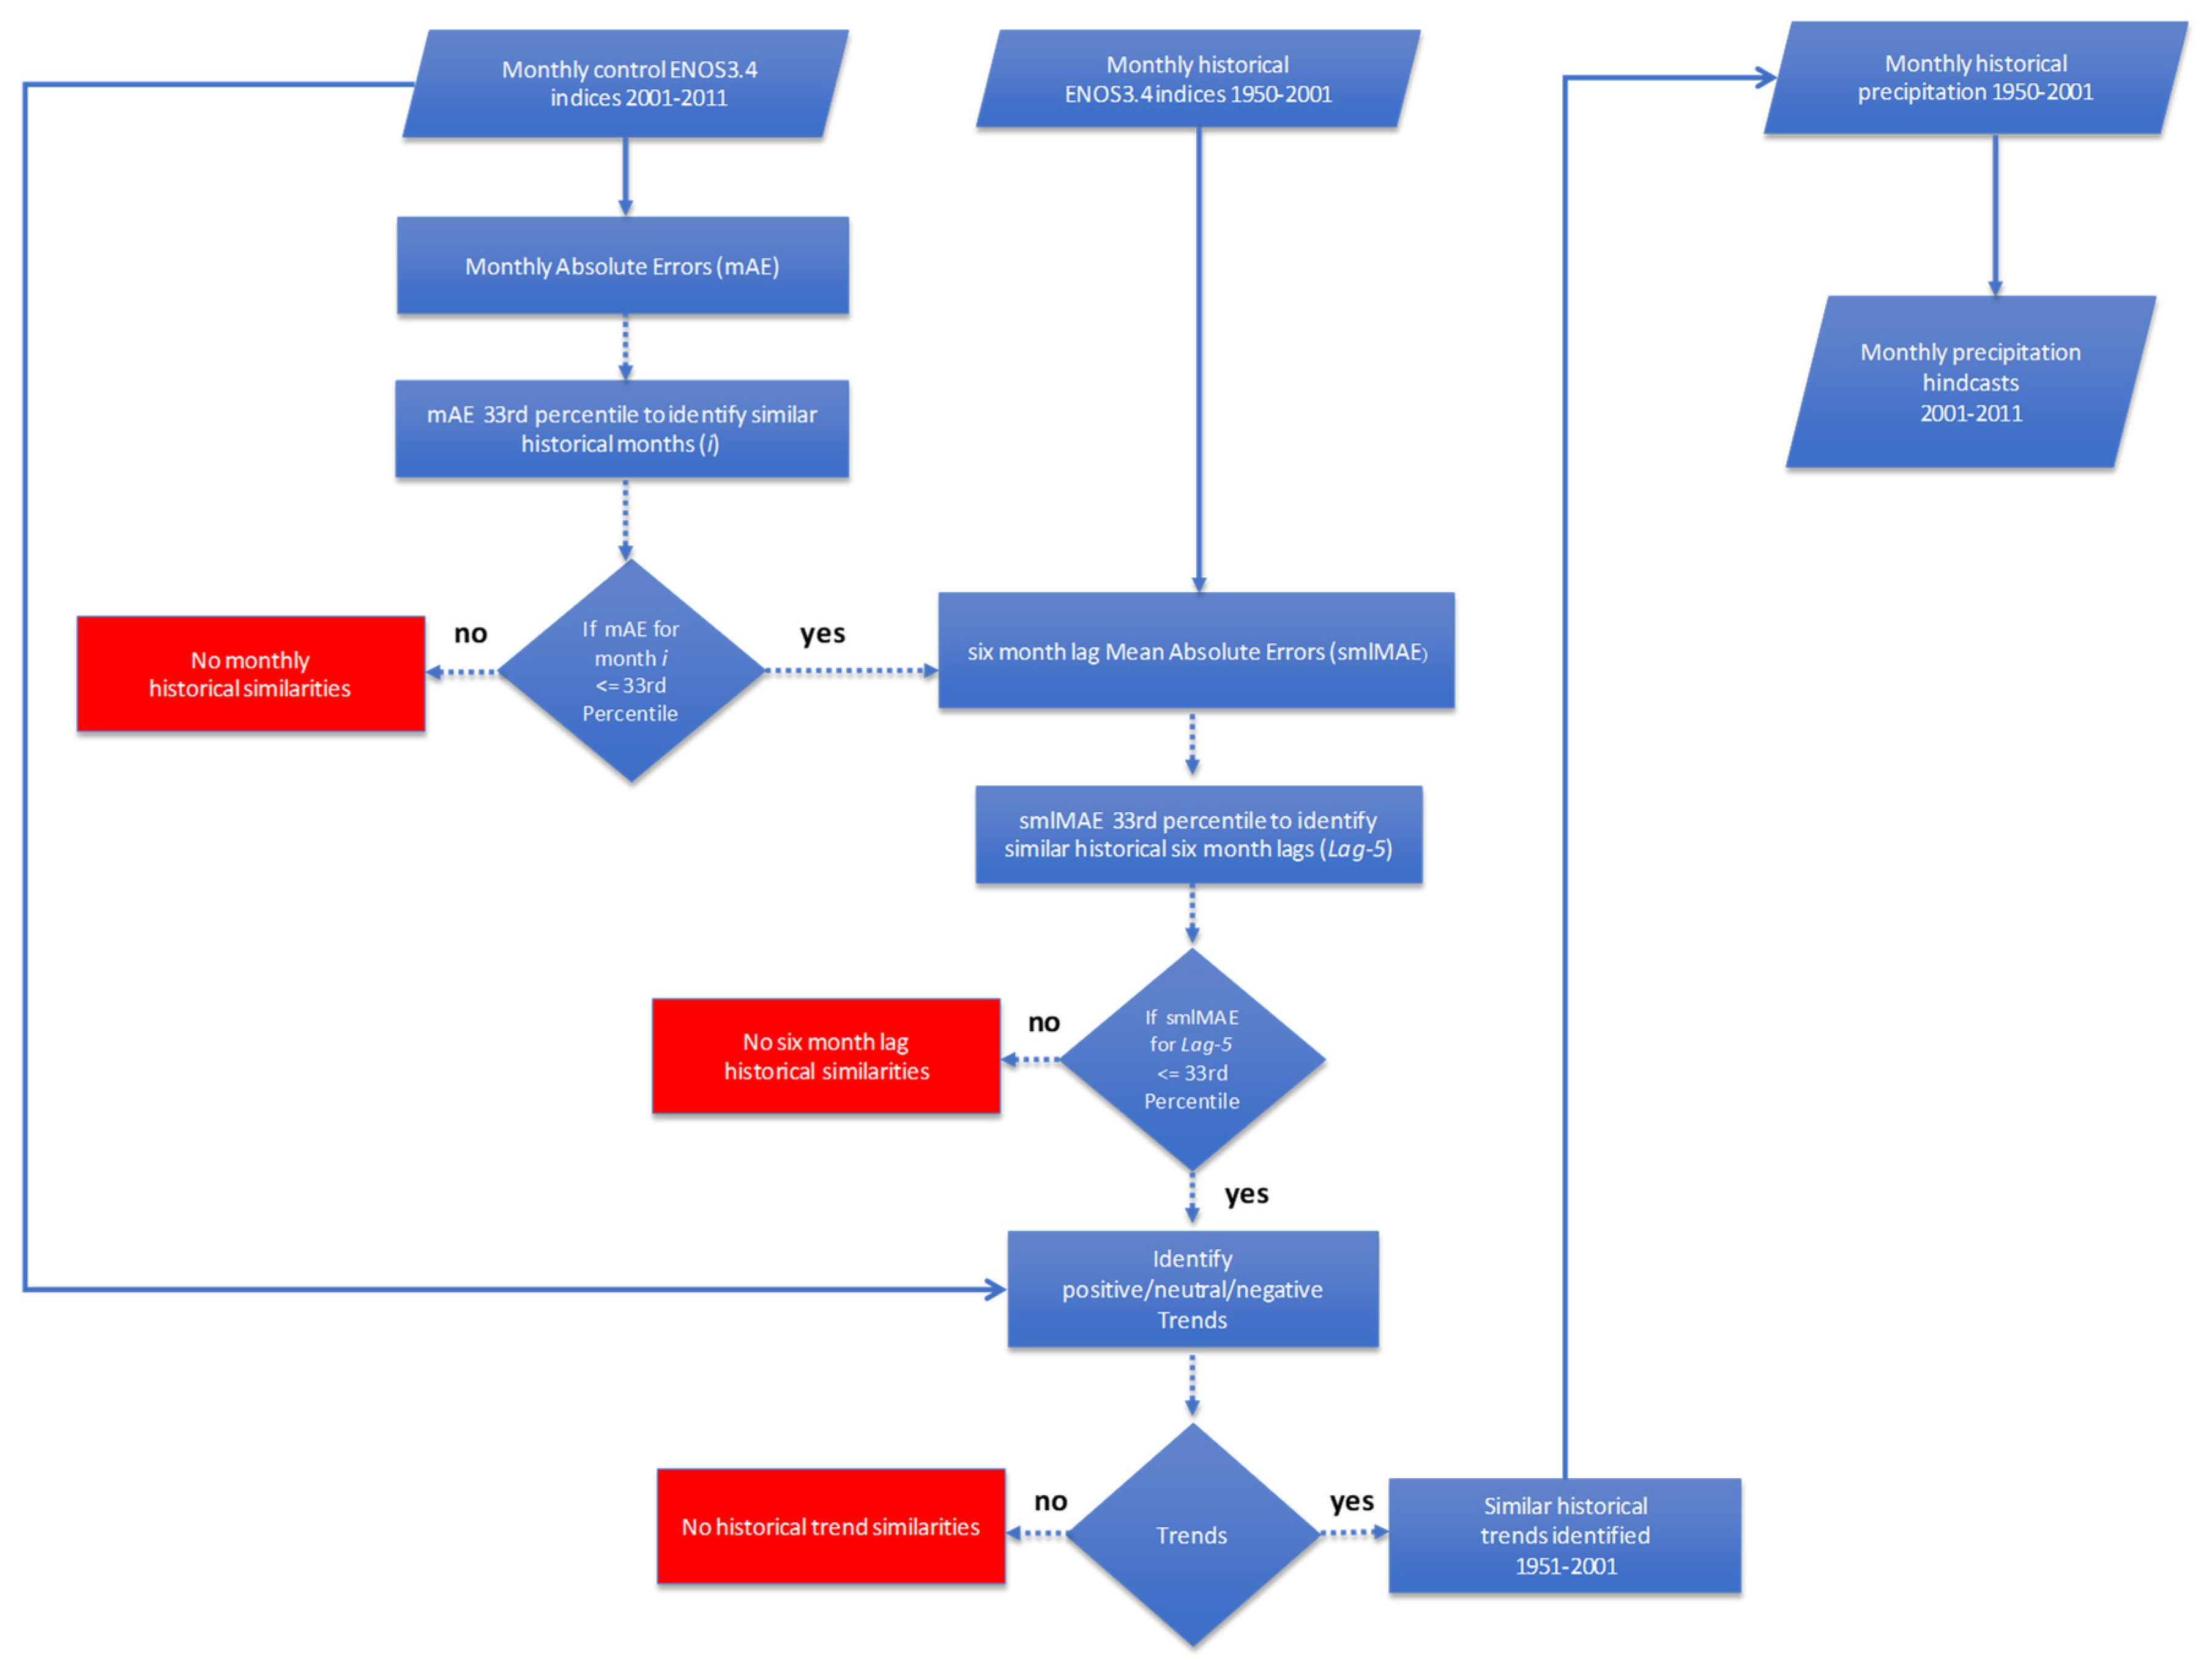
Based on a decision tree classifier model developed within the R software, monthly ENSO 3.4 indices (March 2001-February 2011) during the last decade (monthly control indices) were compared to monthly historical indices (December 1950-February 2001) to find their similar historical months. The group of similar historical index months identified for each monthly control index was used to extract monthly historical precipitation grids and derived monthly precipitation grid ensembles (averages). This process resulted in monthly precipitation training outlooks/hindcasts from March 2001 to February 2011, i.e., 12 hindcasts X 10 years = 120 hindcasts.
In principle, to identify similar months, the monthly El Niño 3.4 index database was coupled at a bi-monthly level (average of the index of the month in question -1), that is, the index of the month of June 2001 corresponds to the average of the monthly indices of May 2001 and June 2001. The latter is to smooth index values. To procure similar historical ENSO 3.4 index months to the control 3.4 index months, the decision tree classifier model consisted of three main criteria:
a) To detect historical monthly similarities, it was calculated the monthly Absolute Errors (mAE) between each monthly control index values (2001-2011) and their respective monthly historical index values (1950-2001). mAE low values accounted for more similar historical months to the target month (each monthly control index). Then, all mAE were classified in percentiles and only those years (historical months) in which the mAE was equal to or less than the 33rd percentile were selected.
b) Subsequently, it was also computed a six-month lag Mean Absolute Errors (smlMAE) between each monthly control index and monthly historical indices. For instance, for the first monthly control index, i.e., for March 2001, it was compared to the smlMAE between October 2000-March 2001 and October 1950-March 1951 (first year), then October 2000 -March 2001 and October 1951-March 1952 (second year), until October 2000-March 2001 and October 1999-March 2000 (last year); and so forth to the last month (February 2011). The monthly lag of six months (Lag-5) served to capture seasonal analogies (lower smlMAE values). Thus, the monthly smlMAE that remained below the first 33rd percentile was used as the similar years (similar historical months) for each monthly control index.
c) The third filter regarded a sudden change in the ENOS3.4 indices by calculating the trend of monthly control index and extracting the same trends of monthly historical indices. The trend was computed by the sum of the Lag0 and Lag-1, minus Lag-3 and Lag-4 sum, if the index remained between 0.5 °C and -0.5 °C, there was no trend, but if the value outpaced 0.5 there was a positive trend, and if the value was less than -0.5 °C, a negative trend was detected. So, the decision tree classifier model identified several historical months with the same trend as each monthly control index.
So, these historical index months for each monthly control index were used to select historical monthly precipitation and compute their training outlooks based on ensembles (arithmetic averages of similar historical months identified), i.e., 120 monthly hindcasts (2001-2011) (
Figure 2).
2.4. Assessments
Each hindcast was compared with its monthly precipitation observation to assess the skill of this decision tree classifier model. Formerly, both precipitation data sets (hindcasts and observations) were classified into six categories: 1 - 20 mm, 21 - 75 mm, 75 - 150 mm, 150 - 300 mm, 300 - 450 mm, and above 450 mm.
Monthly categorized precipitation hindcasts and observations were compared by the following metrics: a) an overall seasonal assessments were performed employing the Heidke Skill Score discriminant (HSS) and the Hansen Kuipers Skill Score (KSS), b) probability of detection for each precipitation classification (POD), c) a spatial assessment was performed through the spatial percent of correct/hit rates (sPC), spatial Bias (sBias), and a spatial significant Spearman correlation (srho p < 0.05) to detect statistical reliability. Then, it was summarized those metrics in the following three-month seasons: winter (DJF), spring (MAM), summer (JJA) and fall (SON). To summarize the skills seasonally, global monthly KSS, HSS, POD assessments were vector-averaged, and monthly sPC, sBias were mapped-averaged, while three-month significant srho was mapped-intersected.
3. RESULTS AND DISCUSSION
3.1. ENSO 3.4 indices and similar months
It analyzed the frequency of cold, warm, and neutral monthly events, based on the average of ENSO3.4 Lag0, Lag-1…, Lag-5 indices for each monthly control index, to detect where most of the precipitation hindcasts were performed. When the index drops below -0.5 °C, it signifies a cool ENSO event, while values above 0.5 °C indicate a warm ENSO event. Index readings falling between these two thresholds represent a neutral ENSO event. In
Table 1, it was detected that neutral events in all seasons dominated the 2001 - 2011´s decade (62 monthly events), followed by a similar number of cold and warm events (31 and 27 monthly events, respectively). In the winter (DJF) and spring seasons (MAM), warming and cooling monthly events outpaced the neutral monthly events; on the other hand, the neutral events clearly outpaced the summer and fall trimesters, especially in summer where 24 neutral monthly events (out of the 30) took place. An 83-year ENSO3.4 indices' reconstruction coincided with this work fairly well (Hanley et al., 2003). Therefore, it showed that neutral monthly events occurred mostly in the summer, cool monthly events in the spring trimester and warm monthly events in the winter (
Table 2).
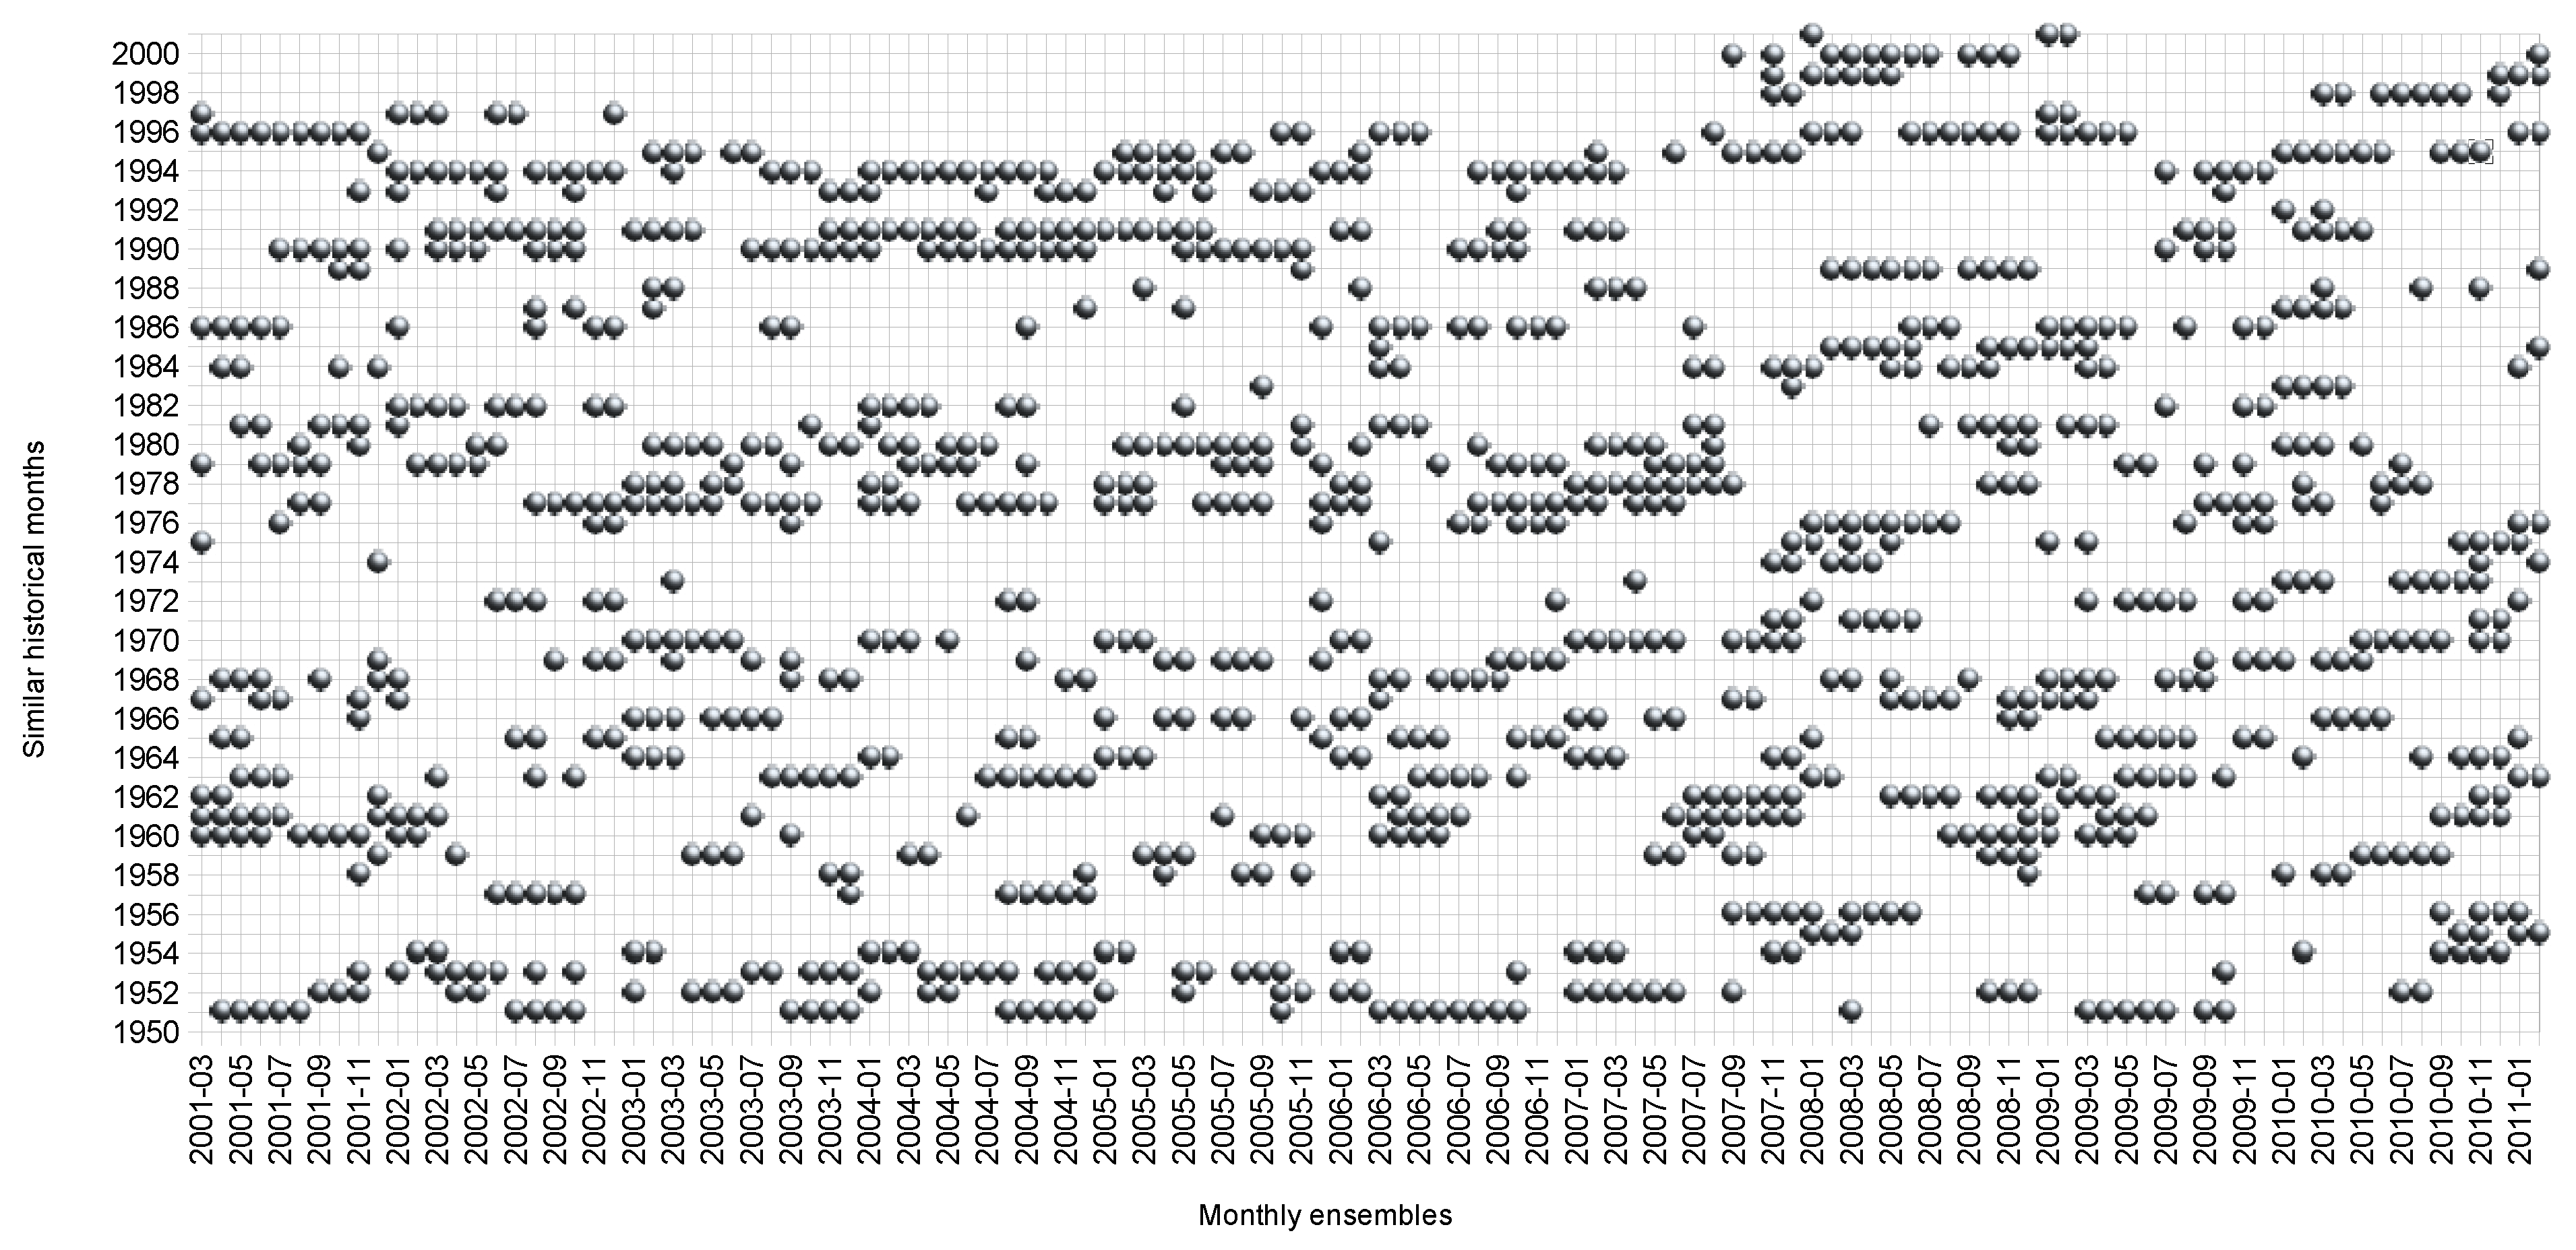
A minimum number of seven similar months (historical months) and a maximum of 14 were identified to obtain each monthly ensemble (hindcasts). It is observed that most of the similar months (March 2001- February 2011) were in the 1960s (260), followed by the 1970s (231), 1990s (220), 1950s (212), and 1980s (187) (
Figure 3).
3.2. Overall model efficiency and probability of detection
The overall model performance across the country is acceptable for each season analyzed, according to the HSS and KSS (above 0.24). The highest is detected during the spring and fall (0.37 and 0.36) and the lowest in the winter (0.25). Comparable performances are reported by Fuentes-Franco et al. (2018) for hybrid precipitation outlooks (statistical and dynamical) in Mexico.
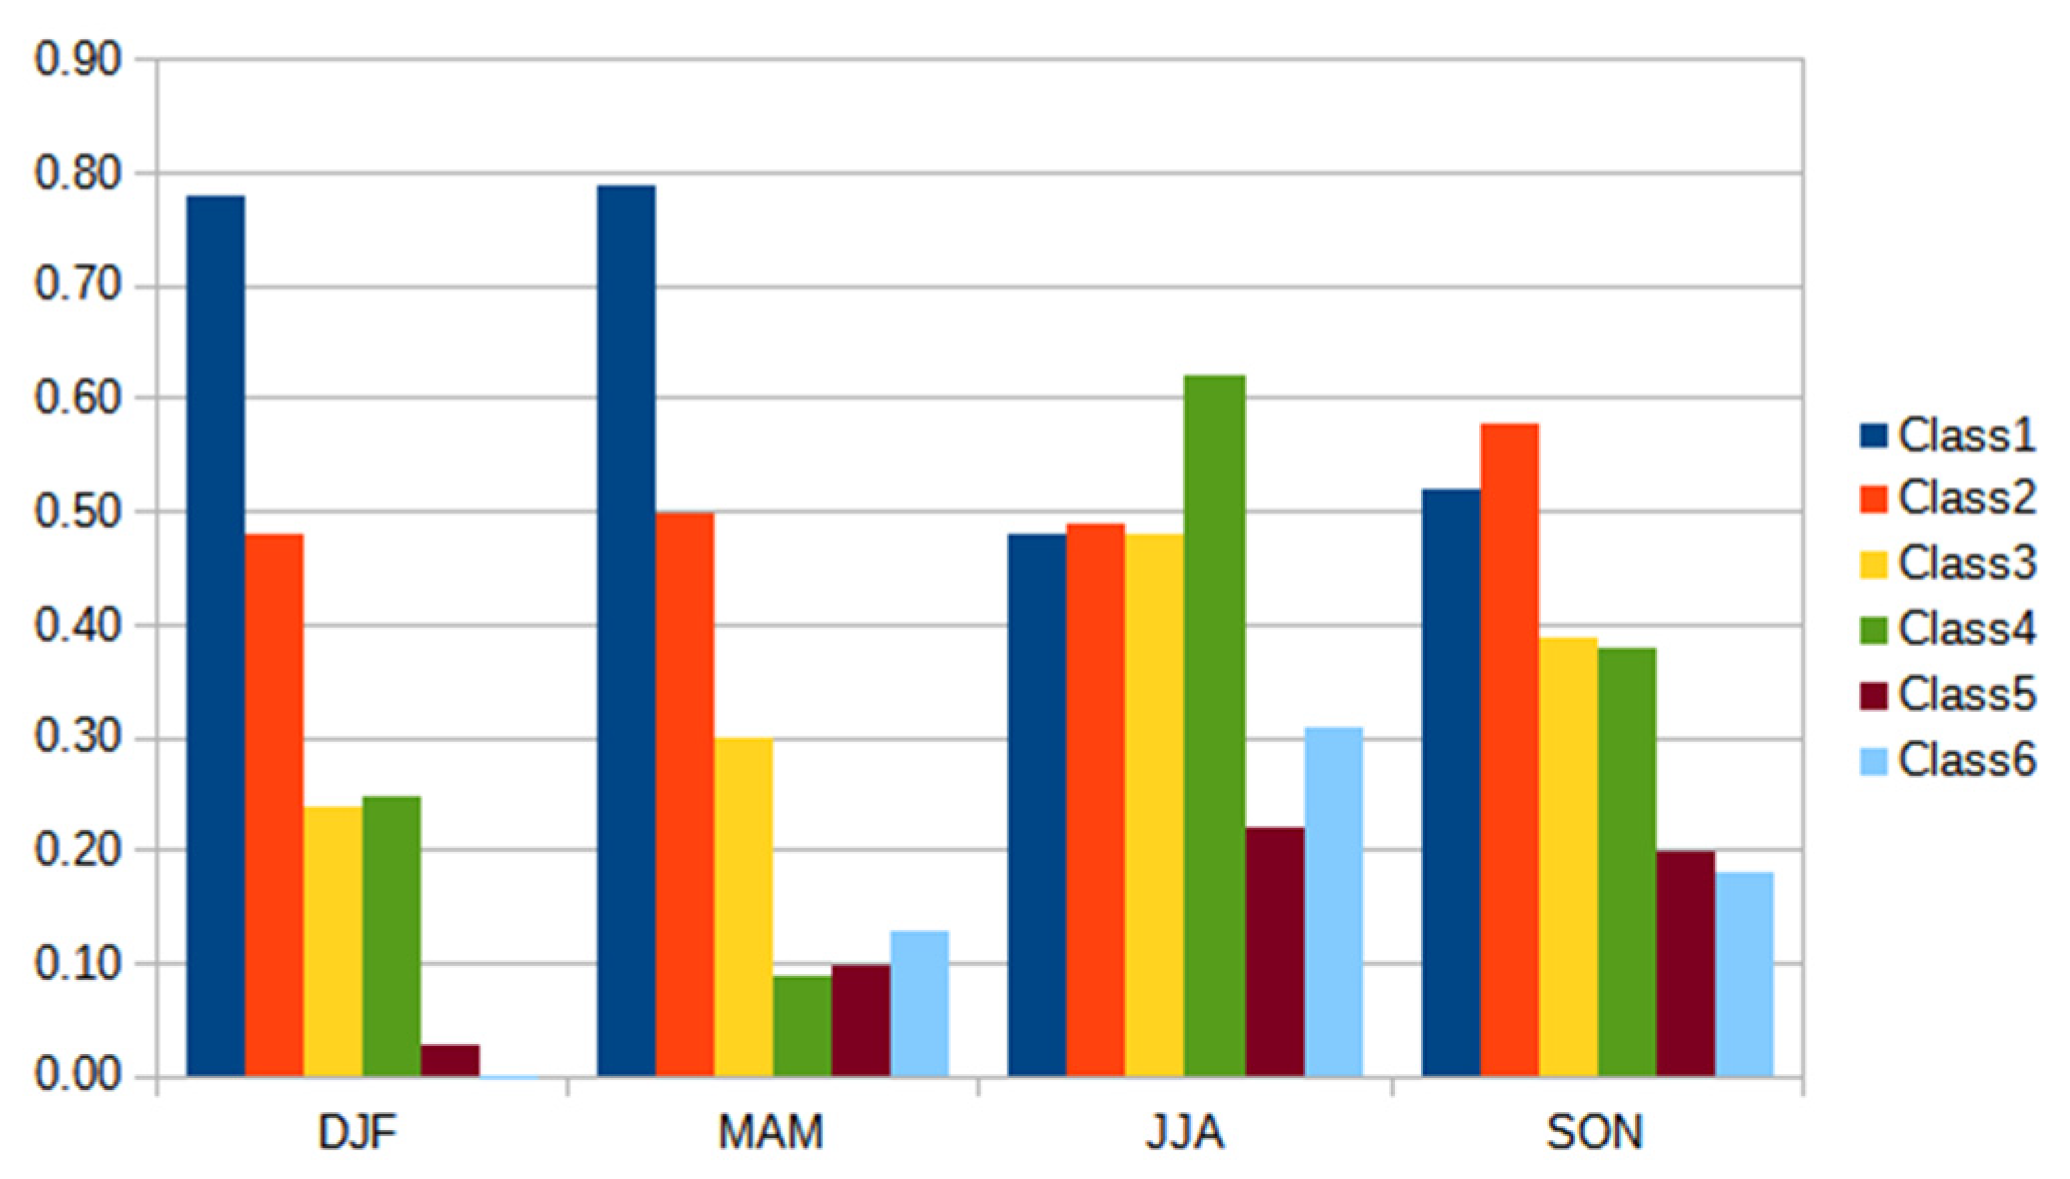
A high POD of the first category is observed during the winter and spring, due to low precipitation observations and hindcasts (dry season in most of the country). In summer and fall, a moderate POD is observed for the first four classifications because it is where the rainy season begins and ends (
Figure 4), and thus more classifications for the model to miss. In all seasons, higher classification performances are poor because of the drawback of the model to forecast extreme events, i.e., averaging similar years remove higher values or outliers, and hence the skill tends to be close to a climatology outlook (Palmer, 1994).
3.1. Spatial hits, bias, and correlations
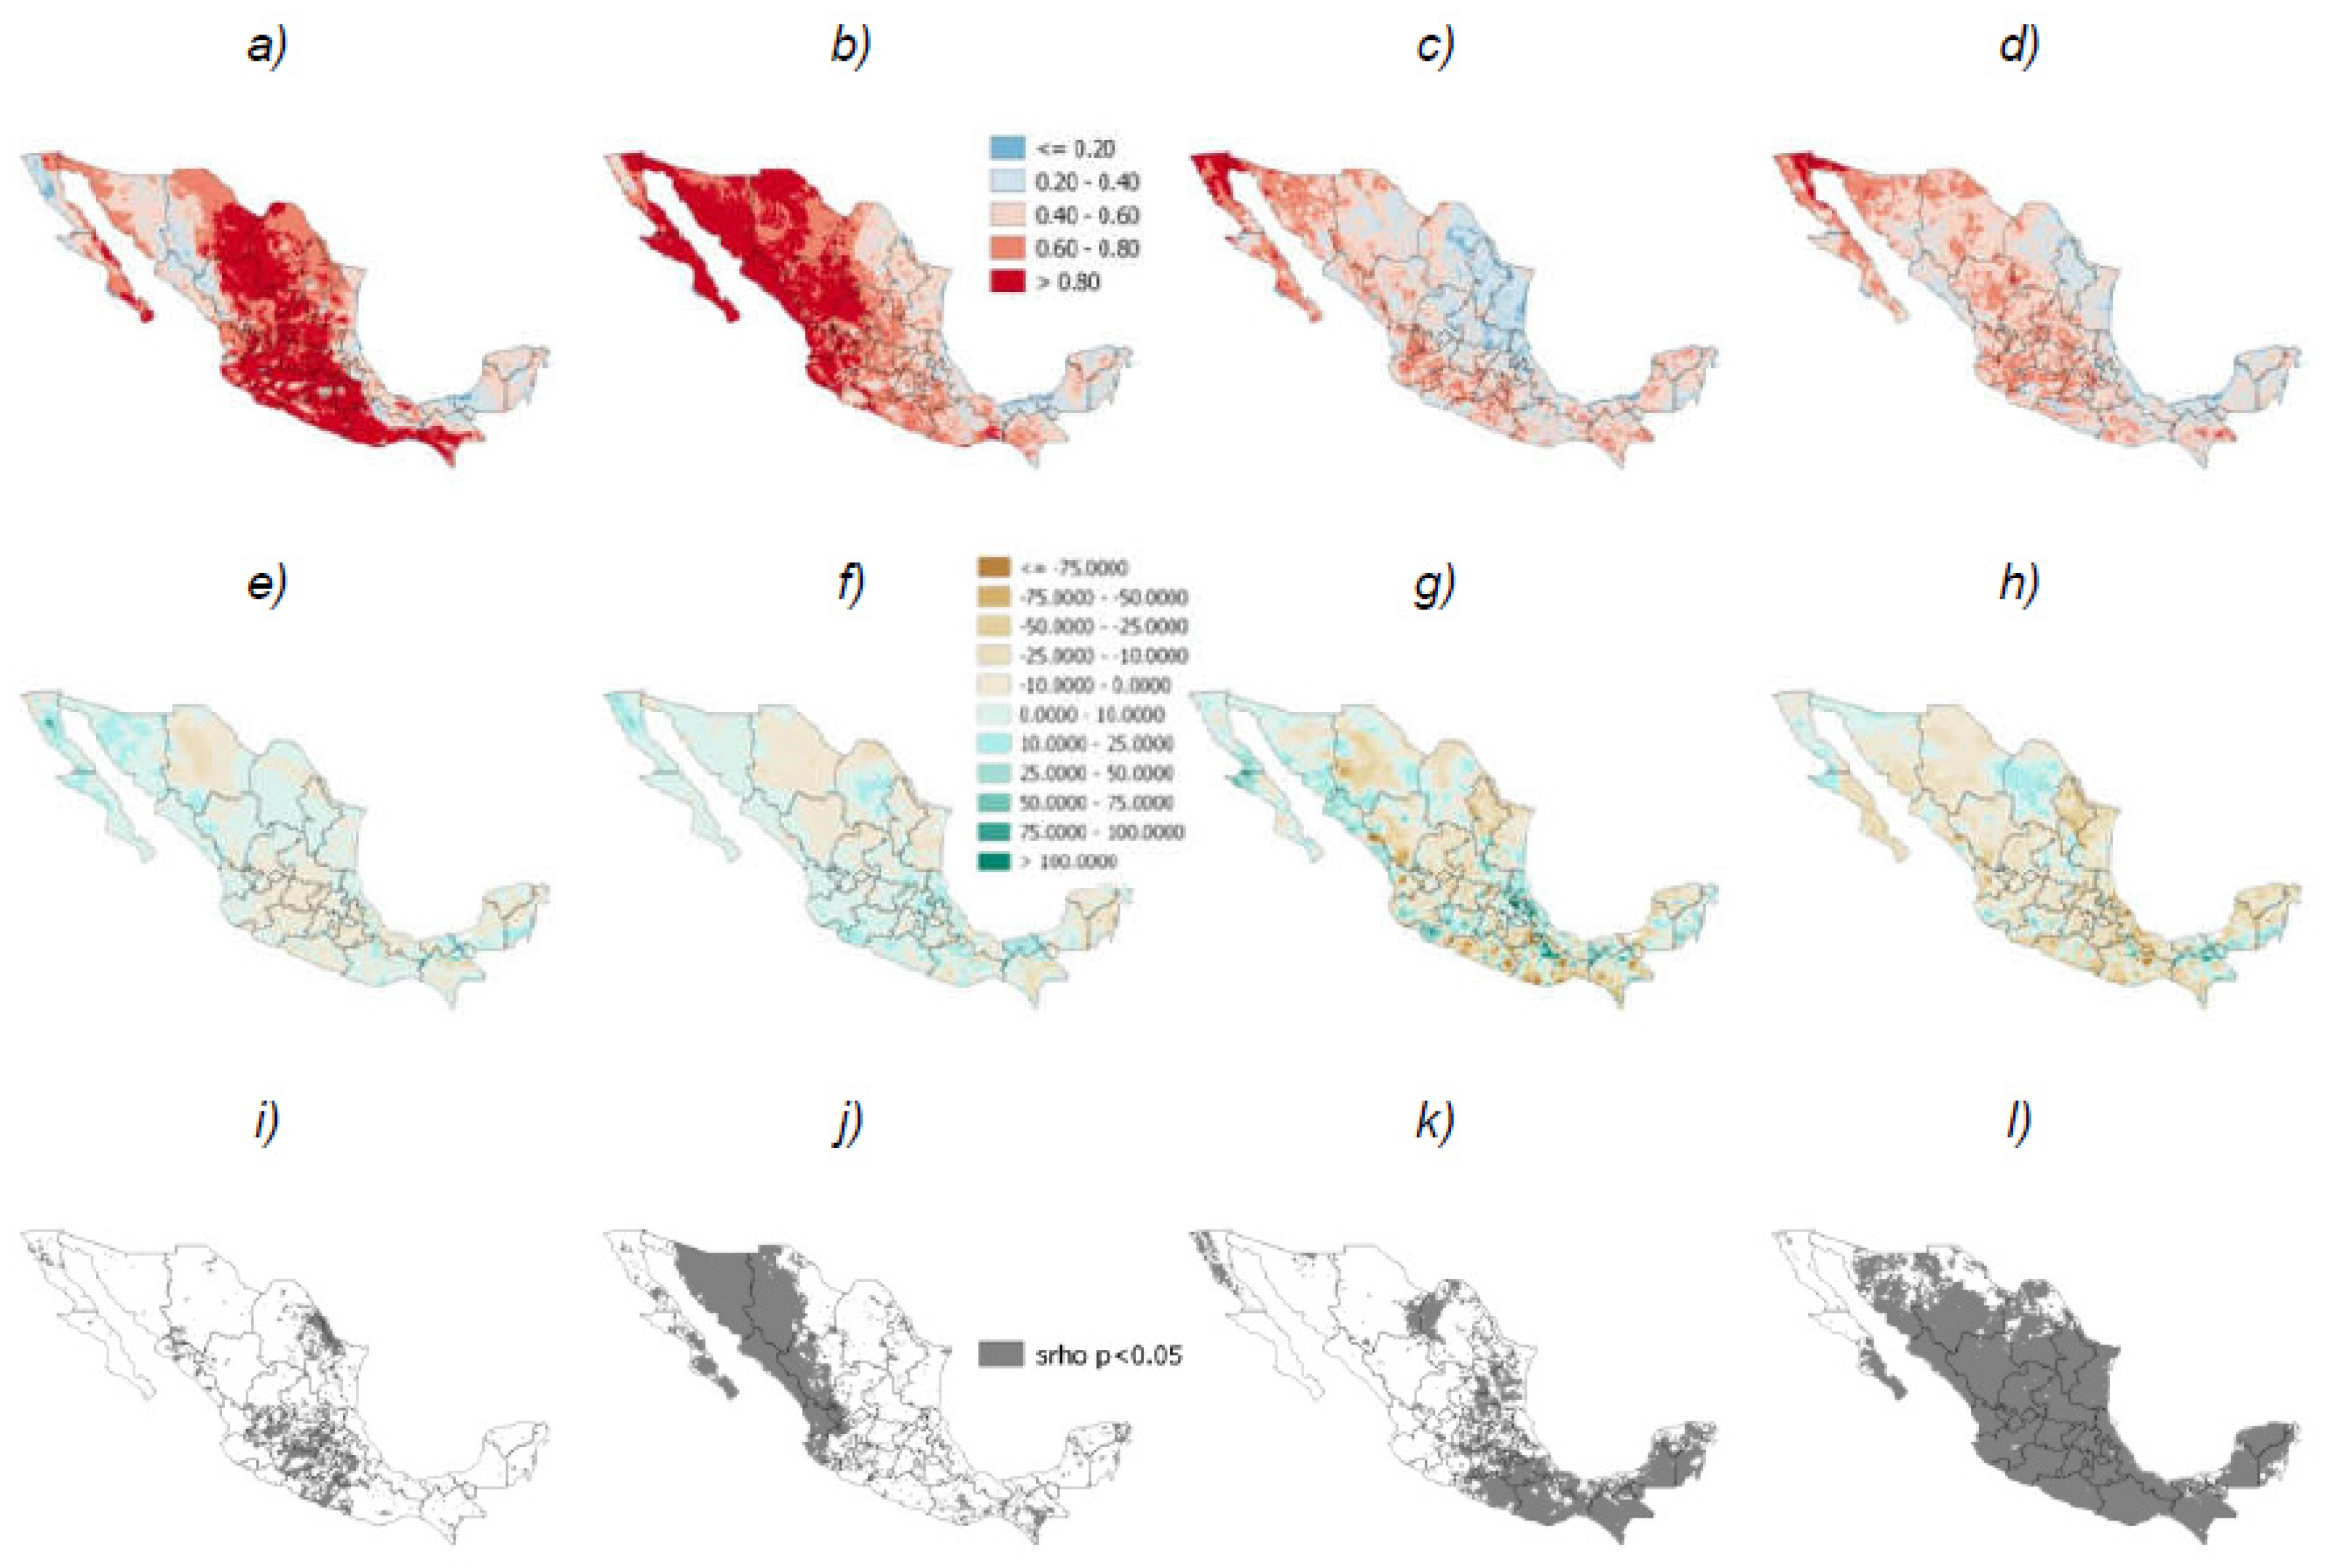
The sPC indicates a high number of hit rates during the winter in most of Mexico (national average of 0.68); only areas in northwestern, east, and southeastern Mexico showed hit rates less than 0.40. The latter is due to this period the dry season in Mexico is established, and thus hindcasts and observations classifications matched more frequently. Meanwhile, negative sBias (precipitation underestimations) is detected mainly in central Mexico and positive sBias (precipitation overestimation) is detected in areas of northwestern and southeastern Mexico. However, only significant spatial correlations are in central, southern Pacific, and northeastern parts of Mexico (
Figure 6a,e,i). Unlike Bravo-Cabrera et al. (2017) and Mendez-Gonzalez et al. (2007) that found significant correlations between winter precipitation and ENSO, spatial correlations (srho), utilizing this ENSO-like method, are not significant in northwestern Mexico in this season.
In spring (MAM), the sPC´s national average is 0.71. Higher hit rates (>0.60) are revealed in large parts of Mexico, especially in the western, only lower hit rates (< 0.40) are discernible in some areas in eastern and southeastern Mexico. Likely, low precipitation (driest season) and frontal storm movements in North America caused by the dominant signal of cooling and warming ENSO phases during winters and springs (Leavitt et al., 2002) allowed those high hit rates. There is a precipitation overestimation (positive sBias) in most of Mexico, using this method, and underestimations (negative sBias) are observable in areas of northern and northeastern Mexico, particularly. Precipitation hindcasts during this period foresaw more favorable rains, though observations implied otherwise. In the meantime, spatial correlations are only significant in eastern, southeastern, and far northwestern Mexico (
Figure 6b,f,j).
The sPC´s national average is 0.50 during the summer (JJA). Hit rates are above 0.40 in northwestern, southern, and southeastern Mexico, especially. Lower hit rates (< 0.40) are identified in the northeastern parts of Mexico. Due to the beginning of the rainy season, more precipitation classifications provide more hindcasts to be tested; therefore less hit rates are noticeable. Positive and negative sBias are sparse, and no special pattern can be described (it depends on the locality of interest). Moreover, spatial correlations are significant in western and northwestern Mexico (
Figure 6c,g,k), despite the high spatial and temporal variability of the North American monsoon (Adams and Comrey, 1997).
Similar to summer, during fall (SON), the sPC´s national average is 0.52. Notwithstanding, there are larger areas of higher hit rates than in the summer, in spite of the national hit rate average resemblance. The former is because of lower precipitation than in the summer in most of Mexico, i.e., easterly flows (humid) dwindle in September – October and finally western flows (dry) begin in November (Bravo-Cabrera et al., 2014). Higher hit rates > 0.4 are in central, west, northern, and northwestern Mexico, and lower hit rates (< 0.40) are in the far northeast, east and southeastern Mexico. Low hit rates in the summer can be explained by some other external factors (ocean-atmosphere) since ENSO´s phase remained neutral most of the time during the training 10 season´s period. Negative sBias is predominant in most of Mexico, in particular, in the northeast and east. This season is where spatial correlations are significant nearly across the country, except the far north and northwestern Mexico (
Figure 6d,h,l).
4. SUMMARY AND CONCLUSIONS
In the present study, we introduced an empirical method to improve seasonal precipitation outlooks over the Mexican territory. The method takes as input monthly ENSO3.4 indices as a predictor for monthly precipitation over Mexico, and also uses in the current month, a 6-month lag, and an index tendency in the last four months. During the model training period (March 2001 – February 2011), ENSO events were neutral most of the time, balanced by cooling and warming events afterwards, so it implies that the proposed model takes into account any ENSO event to predict monthly precipitation.
The model is essentially composed of a straightforward decision tree classifier technique to find monthly ENSO3.4 similar historical indices and extract monthly similar historical precipitation grids and compute their monthly ensembles (averages). A key underlying aspect of the model is its skill based on global vector data and map verification metrics between hindcasts and observed precipitations (KSS, HSS, sPC, sBias, and srho), in which we have tested monthly precipitation hindcasts (March 2001 - February 2011) and grouped seasonally (winter, spring, summer, and fall).
We first find that the forecast method in all seasons is acceptable in accordance with global KSS and HSS metrics. The spring and fall showed the highest skills, and spatially they are noticeable with larger areas than the summer and winter (significant correlations). Although there are large areas with high hit rates (> 0.40) during the winter, it is “masked” by the low precipitation observed (dry season) and the precipitation ensembles (hindcasts) that also computed low precipitation values. The former is verified by the lower KSS and HSS values and non-significant spatial correlations. So, winter and summer ENSO3.4 signal is not as strong utilizing this method, aside from other works, and it implies that the strongest ENSO signal in Mexico is confined to fall months. In regard to spatial Bias, there are usually more precipitation underestimations than overestimations in most of the seasons because of the method that averages historical precipitation values and hinders high precipitation predictions, which is also a drawback of using this empirical method to forecast extreme precipitation events.
To be used as a long range operational forecast tool, it is necessary to acquire skillful forecast ENSO3.4 indices. Namely, if we want to perform a precipitation three-month forecast (Lead 3), we must be used the three-month ENOS3.4 index forecasts with high certainty. That can be a drawback when there is high uncertainty in the ENOS index forecasts in the next months, primarily, if we want to perform a precipitation forecast more than six months ahead (Lead 6) that only provides reasonable skills (Chen et al., 2023).
The scientific high mesh resolution data is becoming a standard instead of point weather stations to cover areas with no weather data, though it must be updated as possible since this monthly forecast method utilizes historical data. In this work, it was not procured updated monthly data since Livenh et al.’s data spans until December 2013 and the analysis intends to analyze in a decadal manner the ENSO decision tree classifier model skill. Therefore, future works are aimed to use updated scientific mesh data to analyze the next decade (March 2011-February 2021), e.g., CHIRPS 2.0 (
https://earlywarning.usgs.gov/fews/datadownloads/Global/CHIRPS%202.0), WorldClim (
https://www.worldclim.org/data/monthlywth.html), or ERA5 (
https://cds.climate.copernicus.eu/cdsapp#!/dataset/reanalysis-era5-single-levels?tab=form). Overall, we find that our model approach provides skill, although some areas of interest should be identified to be certain (skillful) on its use for monthly-seasonal prediction of precipitation over Mexico. The direct influence of El Niño in Mexico provides a straightforward model to benefit from and also promise for usage in other developing countries.
References
- Adams, D. K., and A. C., Comrie (1997) The North American Monsoon. Bull. Amer. Meteor. Soc., 78, 2197–2214. [CrossRef]
- Adams, R. M., Houston, L. L., McCarl, B. A., Tiscareño, M., Matus, J., & Weiher, R. F. (2003) The benefits to Mexican agriculture of an El Niño-Southern Oscillation (ENSO) early warning system. Agricultural and Forest Meteorology, 115(3-4), 183-194.
- Bell, C.J., Gray, L.J., Charlton-Perez, A.J., Joshi, M.M. & Scaife, A.A. (2009) Stratospheric Communication of El Niño Teleconnections to European Winter. Journal of Climate 22, 4083-4096.
- Bravo, J. L., Azpra, E., Zarraluqui, V., & Gay, C. (2014) Some variations of the rainfall in Mexico City from 1954 to 1988 and their statistical significance. Atmósfera, 27(4), 367-376.
- Bravo-Cabrera, J. L., Azpra-Romero, E., Zarraluqui-Such, V., & Gay-García, C. (2017). Effects of El Niño in Mexico during rainy and dry seasons: an extended treatment. Atmósfera, 30(3), 221-232.
- Cagnazzo, C. & Manzini, E. (2009) Impact of the stratosphere on the Winter tropospheric teleconnections between ENSO and the North Atlantic and European Region. Journal of Climate, 22, 1223-1238.
- Chen, Y., Huang, X., Luo, J. J., Lin, Y., Wright, J. S., Lu, Y., ... & Lin, P. (2023) Prediction of ENSO using multivariable deep learning. Atmospheric and Oceanic Science Letters, 100350.
- CONAGUA/smn -Comision Nacional del Agua/Servicio Meteorologico NacionaL-, Seguimiento mensual de afectacion por sequia (December 2019). Consulted on: http://smn.cna.gob.mx/.
- Conde, C., Ferrer, R., & Orozco, S. (2006) Climate change and climate variability impacts on rain-fed agricultural activities and possible adaptation measures. A Mexican case study. Atmósfera (19): 181-194.
- Corrales-Suastegui, A., Gonzalez-Jasso, L.A., Narvaez-Mendoza. M.P., Gonzalez Gonzalez, M.A., Ruiz Alvarez, O., & Maciel-Perez, L. H. (2014) PronEst: aplicación informática para generar pronósticos estacionales de lluvias y heladas de uno a tres meses. Folleto Técnico Núm. 62, INIFAP-CIRNOC-CEPAB 21 p.
- Corrales-Suastegui, A., Fuentes-Franco, R., Pavia, E.G. (2019) The mid-summer drought over Mexico and Central America in the 21st century. Int J Climatol. [CrossRef]
- Delgadillo, J., Rodriguez D., & Aguilar, T. (1999) Los aspectos económicos y sociales de El Niño. In: Los Impactos de El Niño en México. V. Magaña (editor). Dirección General de Protección Civil, Secretaría de Gobernación. México. 238 p. (In Spanish) Copies available.
- Di Lorenzo, E., Cobb, K. M., Furtado, J., Schneider, N., Anderson, B., Bracco, A., Alexander, M.A. & Vimont D. (2010), Central Pacific El Niño and decadal climate change in the North Pacific. Nature Geosciences 3, 762-765.
- Englehart, P. J., & Douglas, A. V. (2001). The role of eastern North Pacific tropical storms in the rainfall climatology of western Mexico. International Journal of Climatology: A Journal of the Royal Meteorological Society, 21(11), 1357-1370.
- Fuentes-Franco, R., Giorgi, F., Pavia, E. G., Graef, F., & Coppola, E. (2018). Seasonal precipitation forecast over Mexico based on a hybrid statistical–dynamical approach. International Journal of Climatology, 38(11), 4051-4065.
- Gay-García, C., Hernández-Vazquez, J., Jiménez-López, J., Lezama-Gutiérrez, J., Magaña-Rueda, V.M., Morales-Acoltzi, T., and Orozco-Flores, S. (2004) Evaluation of Climatic forecasts of rainfall for the Tlaxcala State (Mexico): 1998-2002. Atmósfera (2004) 127-150.
- Hanley, D. E., Bourassa, M. A., O'Brien, J. J., Smith, S. R., & Spade, E. R. (2003). A quantitative evaluation of ENSO indices. Journal of Climate, 16(8), 1249-1258.
- Hegyi, B.M. & Deng, Y. (2011), A Dynamical Fingerprint of Tropical Pacific Sea Surface Temperatures on the Decadal-Scale Variability of Cool-Season Arctic Precipitation. Journal of Geophysical Research, D016001.
- Leavitt, S. W., Wright, W. E., & Long, A. (2002) Spatial expression of ENSO, drought, and summer monsoon in seasonal 2013C of ponderosa pine tree rings in southern Arizona and New Mexico, J. Geophys. Res., 107( D18), 4349. [CrossRef]
- Livneh, B., Bohn, T.J., Pierce, D.S., Munoz-Ariola, F., Nijssen, B., Cayan, D., Vose, R., & Brekki, L.D. (2015) Development of a spatially comprehensive, daily hydrometeorological data set for Mexico, the.
- conterminous U.S., and southern Canada: 1950-2013, Nature Scientific Data, 2, 150042. [CrossRef]
- Lopez-Cruz, A., Soto-Pinto, L., Salgado-Mora, M. G., & Huerta-Palacios, G. (2021). Simplification of the structure and diversity of cocoa agroforests does not increase yield nor influence frosty pod rot in El Soconusco, Chiapas, Mexico. Agroforestry Systems, 95(1), 201-214.
- Mendez González, J., Návar Cháidez, J. D. J., González Rodríguez, H., & Treviño Garza, E. J. (2007) Teleconexiones del fenómeno ENSO a la precipitación mensual en México. Ciencia UANL, 10(3).
- NOAA-National Oceanic and Atmospheric Administration-, National Centers for Environmental Information, Global Climate Reports: 2011, 2012, 2013, 2014, 2015, 2016 (July 2020). Consulted on: https://www.ncdc.noaa.gov/sotc/global/.
- Palmer, T.N. (1994) Chaos and predictability in forecasting the monsoon. Proc. Indian Nat. Sci. Acad., 60, 57–66.
- Perdigon-Morales, J., Romero-Centeno, R., Perez, P.O., Barrett, B.S. (2018) The midsummer drought inMexico: perspectives on duration and intensity from the CHIRPS precipitation database.Int. J. Climatol.38, 2174–2186. [CrossRef]
- Ramirez-Carlos, B.(2017) Manual del Busca ciclones versión 3.0. Subdirección de Riesgos Hidrometeorológicos. Sistema Nacional de Protección Civil Centro Nacional de Prevención de Desastres SEGOB-CENAPRED 12p.
- SIAP - Sistema de Información Agroalimentaria y Pesquera-, Cultivos Anuales 2019. Consulted on: www.siap.gob.mx.
- Vicente-Serrano, S. M., Lopez-Moreno, J. I., Gimeno, L., Nieto, R., Moran-Tejeda, E., Lorenzo-Lacruz, J., ... & Azorin-Molina, C. (2011) A multiscalar global evaluation of the impact of ENSO on droughts. Journal of Geophysical Research: Atmospheres, 116(D20).
- Walkowiak, A.M., and Solana, E. (1989) Distribución Estacional De Lluvias En Baja California, México. Análisis De Probabilidades. Atmósfera 2(4).
- Wedgbrow, C.S.,Wilby, R.L.,Fox, H.R., & O´Hare, G. (2002) Prospects for seasonal forecasting of summer drought and low river flow anomalies in England and Wales. International Journal of Climatology. 22:219-236.
- Yang, X., & DelSole, T. (2012) Systematic comparison of ENSO teleconnection patterns between models and observations. J. Climate, 25, 425–446. [CrossRef]
|
Disclaimer/Publisher’s Note: The statements, opinions and data contained in all publications are solely those of the individual author(s) and contributor(s) and not of MDPI and/or the editor(s). MDPI and/or the editor(s) disclaim responsibility for any injury to people or property resulting from any ideas, methods, instructions or products referred to in the content. |
© 2023 by the authors. Licensee MDPI, Basel, Switzerland. This article is an open access article distributed under the terms and conditions of the Creative Commons Attribution (CC BY) license (http://creativecommons.org/licenses/by/4.0/).
