Preprint
Article

A Pilot Fuzzy System with Virtual Reality for Mild Cognitive Impairment forecasting

Altmetrics

Downloads

139

Views

65

Comments

0

A peer-reviewed article of this preprint also exists.

This version is not peer-reviewed

Submitted:

20 July 2023

Posted:

21 July 2023

You are already at the latest version

Alerts
Abstract
Mild cognitive impairment (MCI) is when brain function declines. It is a transition stage between normal aging and Alzheimer's disease (AD) and may be an underlying symptom of AD. Improper use of test instruments or imperfect test methods in clinical practice often leads to variations in test results. In addition, there may be resistance from the subject if he/she has to undergo multiple screening tests simultaneously. Therefore, the objective of this study was to use virtual reality to create an image testing scenario that integrates Mini-Cog, Short Portable Mental Status Questionnaire (SPMSQ), Mini-mental Status Examination (MMSE), Saint Louis University Mental Status Examination (SLUMS), Clinical Dementia Rating (CDR), and Cognitive Abilities Screening Instrument (CASI), and combine fuzzy logic control (FLC) technology to develop an MCI forecasting system. There were 24 middle-aged to older adults aged 50 to 65 years who participated in the evaluation experiment. The results showed that the MCI forecasting system developed in this study is highly correlated with the traditional screening tests, including Mini-Cog, SPMSQ, MMSE, SLUMS, and CASI. The forecasting system can provide an integrated reference score for testers in making judgments. In addition, the distribution of the System Usability Scale (SUS) evaluation scores for the MCI forecasting system revealed that 87.5% were grade C (good to use) or above, and 29.2% were grade B (extremely good to use) or above. The forecasting system receives positive feedback from the subjects.
Keywords: 
Subject: Public Health and Healthcare  -   Public Health and Health Services

1. Introduction

The Diagnostic and Statistical Manual of Mental Disorders, 5th edition (DSM-5), published by the American Psychiatric Association in 2013, classified dementia into six major categories, namely neurodegenerative dementia, vascular dementia, dementia caused by general medical conditions (AIDS, Huntington’s disease), dementia induced by substances (anticonvulsants, organophosphate insecticides), dementia with multiple etiologies, and dementia due to other factors [1]. Alzheimer’s disease (AD), frontotemporal dementia, and Dementia with Lewy bodies account for 50%–75%, 5%–10%, and <5% of neurodegenerative dementia, respectively [2]. The earliest signs of AD, which account for most patients with neurodegenerative dementia, are memory decline and difficulties in identifying time, place, people, and objects. AD is a progressive and irreversible neurodegenerative disease [3]. The earliest apparent symptom of AD is forgetfulness. However, family members often dismiss progressive memory decline as a normal aging phenomenon, resulting in delayed treatment and worsening patients’ conditions [4]. There is currently no protocol for treating or slowing the progression of AD. However, many new treatments are in different stages of clinical trials. Various studies have found that if AD is detected early, patients can reduce their disease risk by exercising regularly, quitting smoking, avoiding alcohol consumption, controlling weight, consuming a healthy diet, and maintaining healthy blood pressure, cholesterol, and blood glucose levels. Although age is the most important known risk factor for AD, the disease does not only affect the elderly; 9% of AD cases occur at a younger age (i.e., symptoms occur before the age of 65 years). Therefore, early detection, proper treatment, and care can reduce the impact on family members and society [5].
Regarding cognitive impairment, the National Institute of Mental Health was the first to propose the term “age-associated memory impairment” in 1986 [6]. Following that, the International Psychogeriatric Association proposed the term “age-associated cognitive decline” in 1994 to describe mild cognitive impairment (MCI) in patients who do not meet the criteria for dementia and whose activities of daily living are not affected [7]. With advances in cognitive impairment research, the term “MCI” first appeared in tertiary symptoms in the Global Deterioration Scale developed by Reisberg et al. (1982) [8]. Patients with these symptoms have decreased processing capacity when faced with complex tasks or environments, but simple activities of daily living are unaffected. Subsequently, Petersen et al. (2009) defined patients with classical MCI as those with a memory defect, have poorer memory than people their age, do not have other cognitive problems, and do not meet the medical criteria for suspected AD [9]. They also proposed a related definition:
  • Patients who have a subjective complaint of memory decline that family members or an observer confirm.
  • Patients with poorer memory than those of the same age and education level.
  • Patients with no defects in most normal cognitive functions.
  • Patients who have basic activities of daily living.
  • Patients who do not have dementia.
Therefore, MCI is a decline in brain function that includes cognitive impairment, memory defects, and learning or attention difficulties but does not meet the criteria for dementia [10]. Although the manifestations of patients with MCI do not interfere with activities of daily living, some patients with MCI may exhibit dementia symptoms, such as difficulty in calculation, persistent amnesia, and organizational difficulties. Therefore, MCI is a transition stage between normal aging and AD, and it may be an underlying symptom of AD, a gray area between normal cognition and dementia [11]. Epidemiological studies have shown that MCI may be a prodromal stage of dementia [10,12]. According to Petersen et al. (2014), the mean prevalence of MCI in older people aged >70 years is 14%–18% [13]. If the patient was referred from a memory defect center, the likelihood of future AD was 10%–15%. In Taiwan, approximately 33% of patients with MCI identified through community screening will develop AD within five years, and 10%–15% of cases will progress to AD every year, compared to 1%–2% in the same age group. Therefore, MCI can be considered a high-risk AD factor [14]. Related studies showed that AD's most common pathological phenomenon is hippocampal atrophy, associated with amnestic MCI. If patients with MCI have significant hippocampal atrophy, their risk of developing AD is exceptionally high [15]. In addition, previous studies also found that progressive cerebral atrophy is a pathological phenomenon that is common in AD, and the sequence of atrophy is olfactory cortex, amygdala, and hippocampus, with the severity of atrophy in these sites being significantly related to AD memory decline [16]. In patients with AD, cerebral atrophy is asymmetrically distributed, and the severity of left cerebral atrophy is greater than that of the right brain [17]. This lateralized atrophy phenomenon often precedes apraxia in patients with AD [18]. Hence, patients diagnosed with suspected MCI will exhibit a significant abnormal reaction in dementia assessment and are more likely to develop AD.
Currently, many neuropsychological tests are often used to assess cognitive impairment and make subsequent diagnoses. Comprehensive tests can be performed when abnormalities occur. These tests include computed tomography, magnetic resonance imaging, single-photon emission computed tomography, and positron emission tomography to assist in ruling out meningioma, subdural hemorrhage, and other brain diseases or dementia subtypes [19]. In addition, medical imaging can be used to predict the progression from MCI to AD [20]. Among these methods, the diagnostic value of hippocampal volumetry is higher. However, it is difficult to find these patients for consultation in many hospitals, particularly those in the early stages of the disease [21]. Hence, the majority of early MCI diagnoses are made through neuropsychological assessment. However, each assessment tool has its diagnostic focus, and many tests are often required to obtain a complete diagnosis. Currently, the most common early screening tools used in clinical practice include Mini-Cog and the Short Portable Mental Status Questionnaire (SPMSQ). Neuropsychological tests include the Mini-mental Status Examination (MMSE), Saint Louis University Mental Status Examination (SLUMS), Clinical Dementia Rating (CDR), and cognitive abilities screening instrument (CASI). The contents and scoring methods of these screening tools and assessment scales are described below.
  • Mini-Cog
Mini-Cog was developed by Borson in 2000 to detect cognitive impairment in 3 minutes. This test measures the ability of an individual to remember three specific objects. After a brief evaluation, the subjects are required to start naming and repeatedly recalling the objects [22]. In addition, the subject is required to draw a clock within a specific time. Scoring is based on recalling the three objects and completing the clock. Further testing is required if the subject gets three wrong answers for the objects or has 1–2 correct answers but cannot or will not draw the clock correctly [23]. The Mini-Cog is a short test used to identify people with poor memory and thinking abilities, and it requires the least amount of language explanation. Subjects with test abnormalities can be quickly referred to experts for a more detailed assessment [24].
  • SPMSQ
The SPMSQ was proposed by Pfeiffer in 1975 and is used to measure consciousness, memory, orientation, attention, thinking, and general knowledge to understand the current mental health status of the subject preliminarily [25]. Because SPMSQ is a questionnaire, the test method is relatively simple, in which self-testing or taking the test with the assistance of family members can be conducted for preliminary dementia screening. In addition, 0–2, 3–4, 5–7, and 8–10 wrong answers indicate intact mental function, mild mental impairment, moderate mental impairment, and severe mental impairment, respectively. Related studies found that the test results vary based on education level but do not change with age [26].
  • MMSE
The MMSE is a cognitive function assessment form designed by Folstein et al. in 1975 and is used to assess overall cognitive function [27]. The assessment questions are related to orientation (time and place), language (reading, writing, naming, and comprehension), construction (visual drawing), attention and calculation (message confirmation and continuous subtraction of a specific number), and memory (short-term memory). There is no time limit; the maximum attainable score is 30 points. The international standard is 25 points as the threshold, with 18–24 points indicating mild dementia, 16–17 points indicating moderate dementia, and ≦15 points indicating severe dementia. The threshold value differs based on education level: illiterate is 17 points, elementary school (≦ 6 years of education) is 20 points, and high school and above is 24 points. The test duration for MMSE is approximately 5–10 minutes. The higher the score, the better the overall cognitive function. When the score is 23–25 points, attention should be paid to the possibility of MCI [28].
  • SLUMS
SLUMS was published by Morley and Tumosa in 2002 and contains 11 items, including attention, orientation, immediate recall, delayed recall, numeric calculation and registration, registration and digit span, visual-spatial, and executive function [29]. Subsequently, Zheng et al. (2012) revised it to eight cognitive functions: orientation, calculation, image recognition, animal naming, number sequence, memory, executive function, and responsiveness [30]. The test duration is 7 minutes, and the maximum attainable score is 30 points; the higher the score, the better the cognitive function. If the subject has completed senior high school and above, 27–30 points are considered normal; 21–26 points indicate possible MCI; and 20 points and below indicate dementia. If the subject’s education level is below senior high school, 25–30 points indicate normal; 20–24 points indicate possible MCI; and 19 points and below indicate dementia. SLUMS has higher sensitivity in subjects with a higher education level [31].
  • CDR
The CDR was designed by Hughes et al. in 1982 to assess senile dementia of the Alzheimer’s type [32]. Subsequently, Morris (1993) added some scope based on the evaluation rules and developed the current clinical scale [33]. The scale items include cognitive and functional performance in six areas: memory, orientation, judgment & problem-solving, community affairs, home & hobbies, and personal care. The evaluation results are divided into five grades: CDR (0 points), healthy; CDR (0.5 points), very mild; CDR (1 point), mild; CDR (2 points), moderate; and CDR (3 points), severe. Related studies showed that the CDR has some reliability in predicting MCI: At CDR 0.5 points, 37.3% of patients progressed to AD [34].
  • CASI
The CASI was published by Teng et al. in 1994 and integrated the Hasegawa Dementia Scale from Japan, MMSE, and DSM-III-R diagnostic criteria [35]. American and Japanese subjects were the first to be tested using this scale. The scale was then used on Chinese subjects and could be used for subjects from different cultural backgrounds. Hence, it can solve the problem of cultural differences. This scale includes ten items, attention, concentration, orientation, short-term memory, long-term memory, language abilities, visual construction, list-generating fluency, abstraction, and judgment. The total score is 100 points; the higher the score, the better the cognitive capacity.
All these screening tools have threshold values for determining MCI, and there are reasonably suspected intervals for determining AD, e.g., an MMSE score of 25 points indicates a sign of MCI, and attention should be paid to the possibility of mild AD if the score decreases to 23–24 points. Therefore, combining the test results of multiple tools will increase the accuracy of diagnosing MCI. However, every screening tool requires time for explanation and testing. Hence, it is not easy to simultaneously implement multiple screening tests. In addition, there may be resistance from the subject if he/she has to undergo many screening tests simultaneously, resulting in execution difficulty [36]. A 3D virtual environment is widely used due to advances in information technology. If MCI screening tests are used to construct an entertaining test scenario via a 3D virtual environment, middle-aged to older adults may be incentivized and drawn to participate in cognitive screening and subsequent continuous follow-up, resulting in more timely cognition data for detecting cognitive decline. Therefore, there are significant advantages to using an entertaining method for dementia screening, such as saving time and money, providing accurate and multiple screening records, using dynamic scenario change design to prevent subjects from being affected by prior learning effects, and decreasing psychological stress, thereby providing a pleasurable experience to subjects [36]. The primary objectives are to use virtual reality to create an image testing scenario that integrates Mini-Cog, SPMSQ, MMSE, SLUMS, CDR, and CASI; employ fuzzy logic control (FLC) technology to integrate assessment items in cognitive impairment screening tools; and construct a cognitive impairment screening module to develop an MCI forecasting system. The following objectives are expected to be completed:
  • Only one test is required to obtain the test results for multiple cognitive impairment screening tools in a subject, reducing the issue of multiple testing in subjects.
  • Integration of scenario-based image virtual situations to improve test willingness and acceptance in subjects.
  • The test results will be presented in images so that the tester and subject can intuitively understand and explain the results.

2. Materials and Methods

2.1. Development of MCI forecasting system

2.1.1. System framework

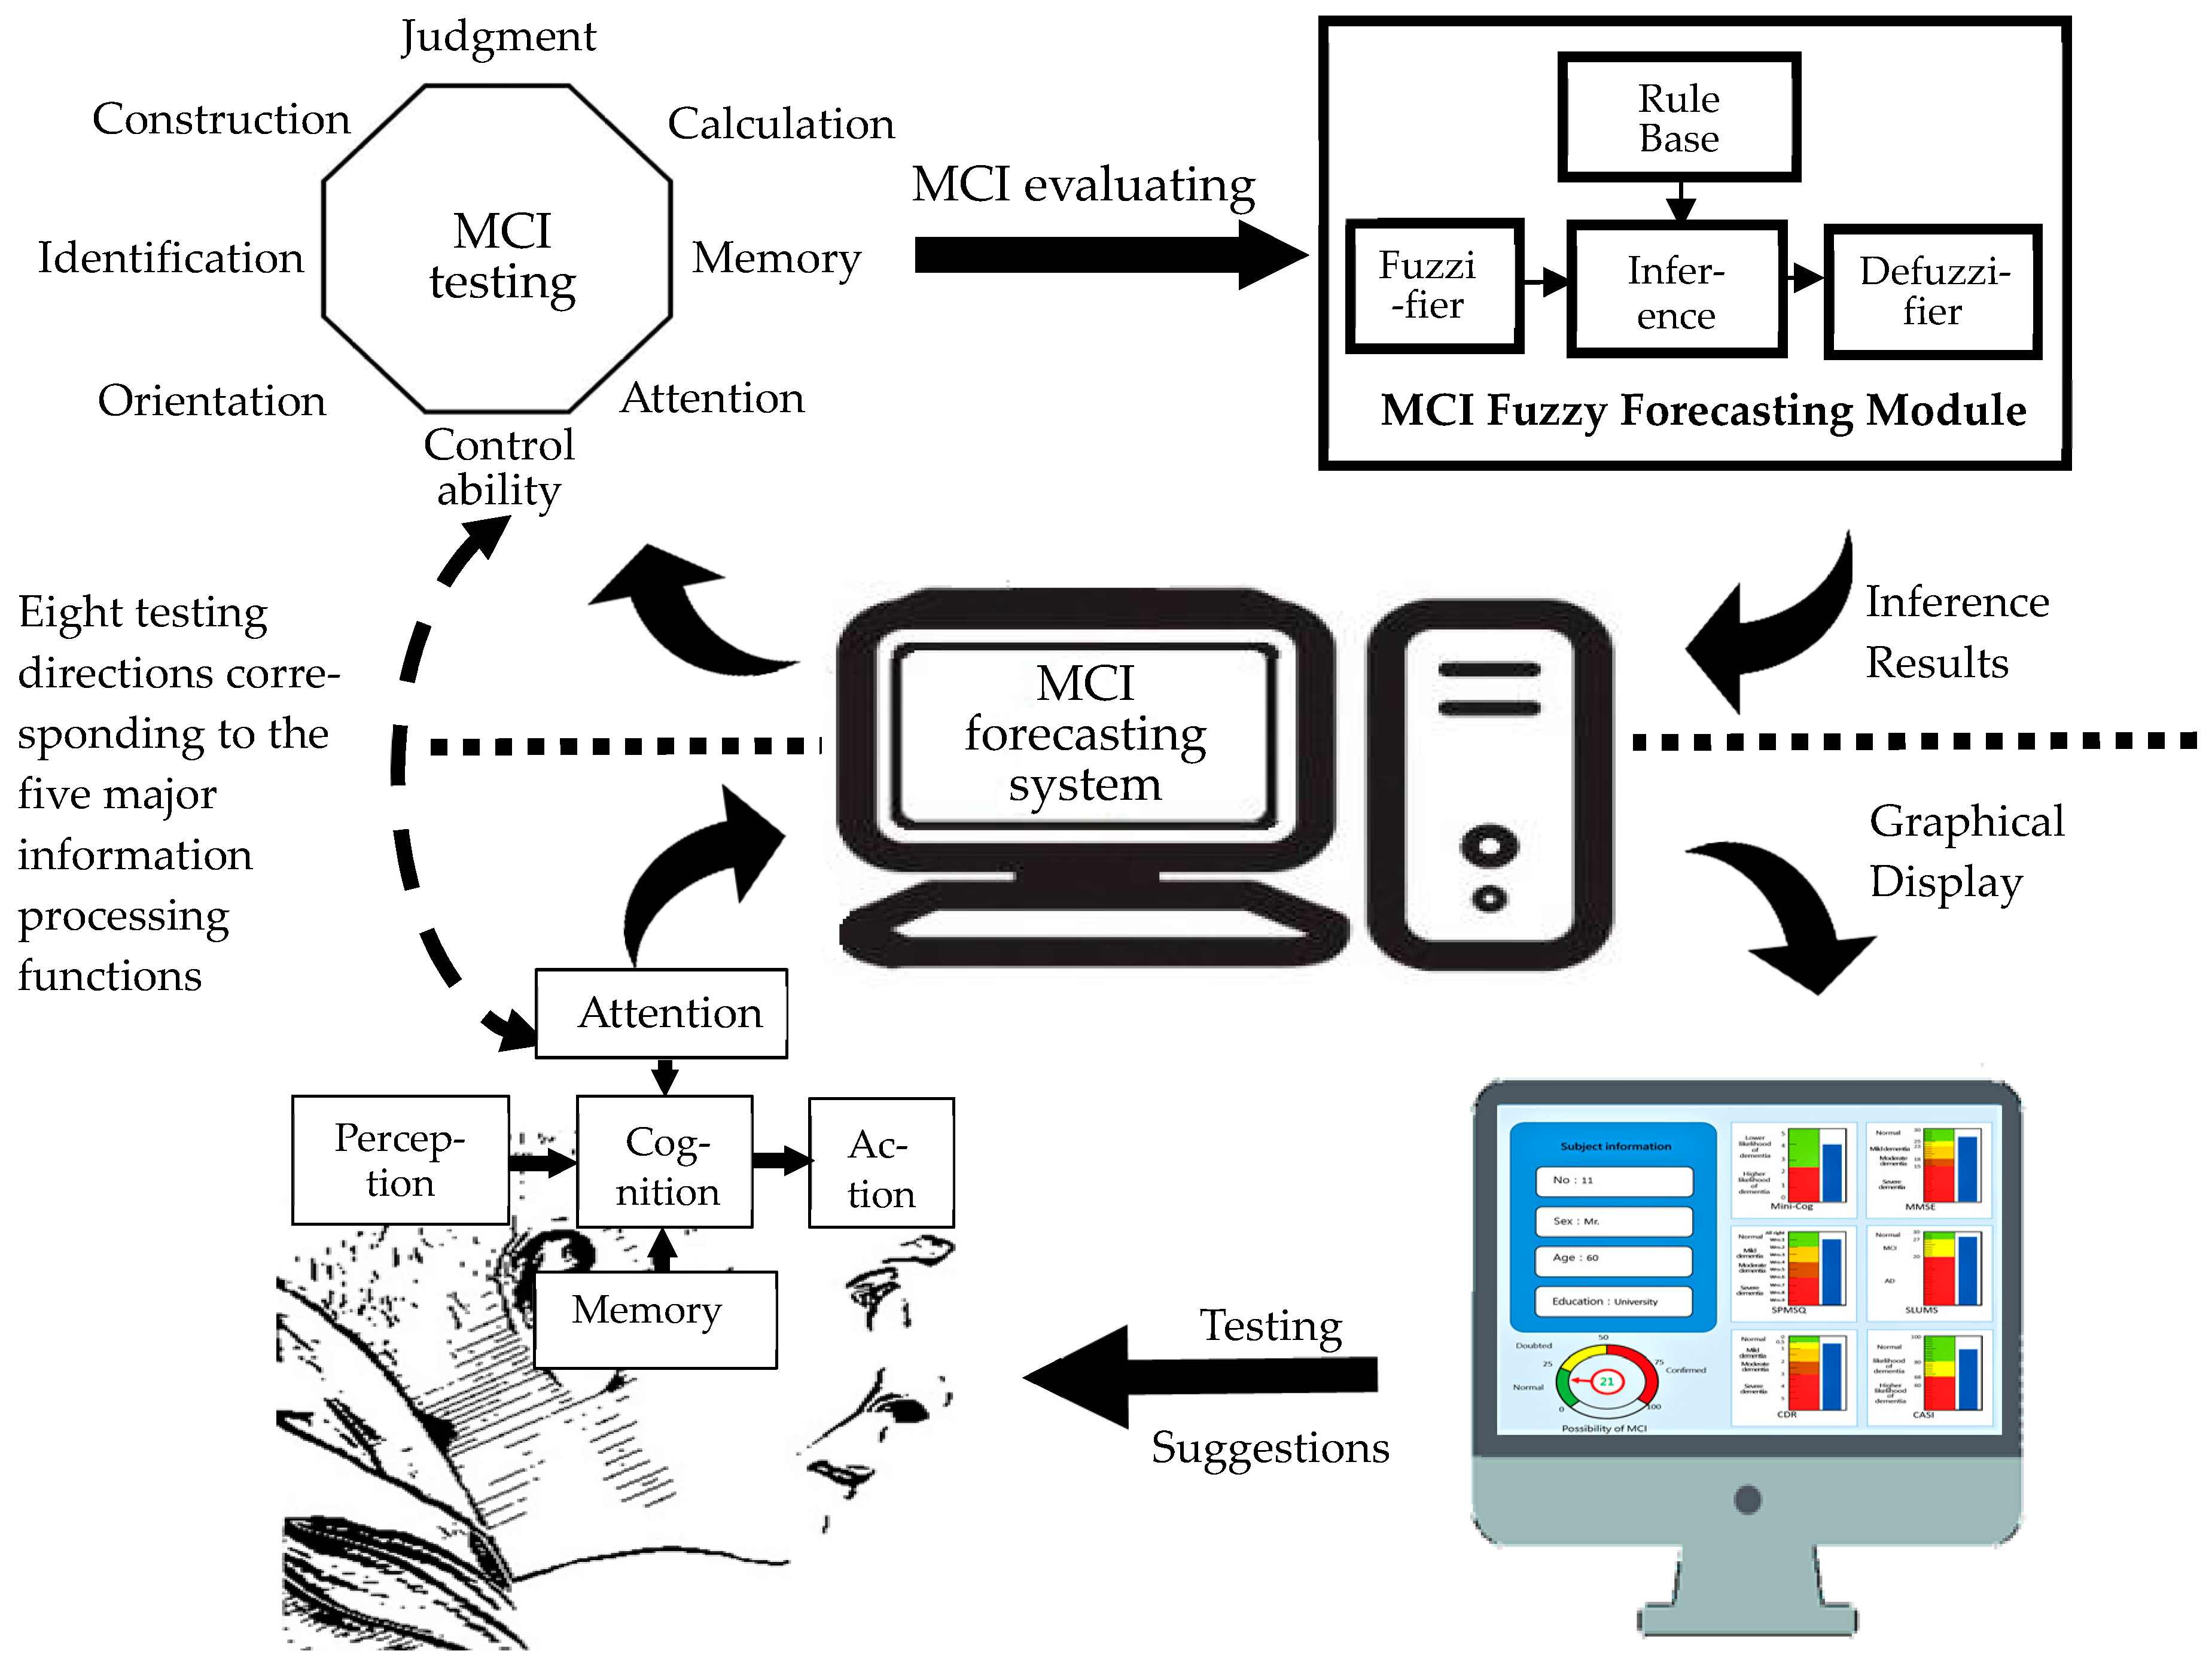
This study used virtual reality to construct a scenario-based image test environment and employed fuzzy logic control (FLC) technology to predict the possibility of MCI. Firstly, in terms of testing, MCI occurs mainly due to cerebral information processing dysfunction. Therefore, this study used the five primary information processing functions in humans (perception, cognition, attention, memory, and action) as a basis, and according to the six tools mentioned above to classify the test items into eight major test dimensions (orientation, identification, construction, judgment, calculation, attention, memory, and control ability) (Figure 1). With these different test dimensions, subjects' problematic items can be further examined in the future to determine which human information processing functions are affected. Based on the function correspondence map shown in Figure 1, we constructed an MCI forecasting system (Figure 2). This system uses a virtual reality test environment. It collects test information from eight major dimensions for MCI evaluation. It then uses FLC technology at the back-end system calculation platform to obtain more integrated forecasting on the possibility of MCI in the subject. The system's front end uses images to allow subjects to complete tests in the eight major dimensions. A weighting method is used to convert the test data to diagnostic data of the six screening test tools (Mini-Cog, SPMSQ, MMSE, SLUMS, CDR, and CASI) as a reference for medical staff. The MCI forecasting results are displayed as MCI possibilities on the dashboard. The scenario-based image test proceeding in a virtual MCI testing center can allow middle-aged to elderly subjects to undergo testing while in a visiting mood, thereby reducing anxiety and boredom associated with hardcopy tests. The navigation guides the subject to naturally integrate into the test scenario, allowing for a more precise assessment of whether the subject has MCI and an assessment of its severity.

2.1.2. System assessment method

Based on the commonly used MCI and AD screening tools (Mini-Cog, SPMSQ, MMSE, SLUMS, CDR, and CASI), the system compiles and generates eight main dimensions and eleven assessment sub-items (Table 1). These eleven assessment sub-items are also formulated based on scenario concepts, ensuring the assessment method and content of the original assessment tools. Taking calculation as an example, most screening tools use stereotyped numbers for subjects to calculate, such as SPMSQ (subtract 3 for a total of 5 times, starting from 20); MMSE (subtract 7 for a total of 5 times, starting from 100); CDR (subtract 3 for a total of 5 times, starting from 20); and CASI (subtract 3 for a total of 5 times, starting from 100). It may cause the subject to be impatient and develop psychological resistance, affecting the tools' accuracy [36]. In this study, we constructed a virtual fish tank and simulated fish swimming. The subject was invited to this test room and observed the fish swimming around naturally before answering questions on fish calculation relaxedly. It would increase subject acceptability and assessment accuracy. Furthermore, this study employed the concept of weight ratio based on the scoring method of various screening tools such that the score results of various items were matched to the evaluation scores of the original assessment tool, which allowed scores for multiple screening tools to be obtained on a single test. Therefore, the subject's frustration in undergoing multiple tests would be reduced.

2.1.3. MCI fuzzy forecasting module

After establishing the assessment items in Table 1, each assessment item's values were weighed to match the various assessment items to the original screening tool scores; however, how to combine the results of the six screening tools to obtain the best value of MCI assessment. The fuzzy analysis is a very suitable method, which was the fuzzy set theory proposed by Zadeh in 1965 [37], while fuzzy decision research began with "Decision-Making in a Fuzzy Environment," published by Bellman and Zadeh in 1970 [38]. Fuzzy logic control (FLC) is an actual application of fuzzy theory, and its core consists of a fuzzy rule base and fuzzy inference engine (FIE). This study used the FLC mode to construct the MCI forecasting module (Figure 2). The top-right block of this figure shows the fuzzy forecasting mechanism with an FLC core.
The scores of six screening tools in the MCI fuzzy forecasting mechanism were used as the FLC's membership function, and the rule base was used to generate fuzzy inference. The FIE assessed whether the subject was normal, suspected of MCI or AD. The fuzzy forecasting mechanism designed in this study first used the fuzzy inference semantic functions for variable input, membership, fuzzy inference, and output. Each variable (six screening tools) was defined as an input variable, including three membership functions (Normal, Mild, and MS (Moderate & Severe)). The output variable was defined as a cognitive impairment estimate (CI), including three membership functions (Normal, Doubted, and Confirmed). Therefore, the rule base was controlled to have 729 rules, of which seven rules belonged to Normal; 57 rules belonged to MCI (Doubted), as shown in Table 2; 665 rules belonged to MCI (Confirmed).
This study used a 5-layer mechanism of fuzzification, fuzzy inference, and defuzzification to obtain a cognitive impairment estimate (CI). The various fuzzy layer variables are defined as follows: i represents the ith inference principle; j represents the jth membership function of the Mini-Cog variable (MC); k represents the kth membership function of the SPMSQ variable (SP); m represents the mth membership function of the MMSE variable (MM); n represents the nth membership function of the SLUMS variable (SL); o represents the oth membership function of the CDR variable (CD); and p represents the pth membership function of the CASI variable (CA).
First layer: In this layer, the input variables are used to calculate the membership of Mini-Cog(MC), SPMSQ(SP), MMSE(MM), SLUMS(SL), CDR(CD), CASI(CA), and the fuzzy membership functions are a triangle and a trapezoid.
O 1 , j = μ M C j s j = 1 , 2 , 3
O 1 , k = μ S P k t k = 1 , 2 , 3
O 1 , m = μ M M m u m = 1 , 2 , 3
O 1 , n = μ S L n v n = 1 , 2 , 3
O 1 , o = μ C D o w o = 1 , 2 , 3
O 1 , p = μ C A p x p = 1 , 2 , 3
Second layer: This layer processes the operation of the fuzzy inference's front step, and the Min operator is employed in this study.
O 2 , i = ω i = μ M C j s μ S P k t μ M M m u μ S L n v μ C D o w μ C A p x = Min j , k , m , n , o , p μ M C j s , μ S P k t , μ M M m u , μ S L n v , μ C D o w , μ C A p x
i = 1 ~ 729 ; j , k , m , n , o , p = 1 , 2 , 3
The ωi represents the firing strength of the ith inference rule.
Third layer: This layer calculates the weight of the firing strength of the ith rule to the firing strength of all rules
O 3 , 1 = ω i = ω i i = 1 729 ω i   i = 1 ~ 729
Fourth layer: This layer calculates the firing strength of 729 rules and is the corresponding output function.
O 4 , 1 = ω i · f i   i = 1 ~ 729
Fifth layer: This layer sums the outputs of 729 rules, i.e., obtain the cognitive impairment estimate: CI.
O 5 , 1 = C I = i = 1 729 ω i · f i = ω i · f i i = 1 729 ω i · f i   i = 1 ~ 729

2.1.4. System scenario design

To effectively develop the “MCI forecasting system” and address issues related to hardcopy tests, this study used the following 4-step systematic development method: development of theoretical basis, system analysis, system design, and system test for system design. Since this study used virtual reality (VR) to simulate a scenario image test environment, this environment would encourage middle-aged to elderly subjects to undergo testing and reduce the anxiety and boredom associated with hardcopy tests. The navigation guided the subject to naturally integrate into the test scenario, allowing a more precise assessment of whether the subject has MCI and the possibility of transferring to AD in the future. There are nine test regions based on eight major dimensions to be designed in an MCI testing center. The center used 3D MAX to draw 3D objects. The drawing and frame were combined to obtain a 3D model for paintings. Finally, the “MCI forecasting center” was constructed to evaluate subjects’ cognitive impairment.
  • System startup
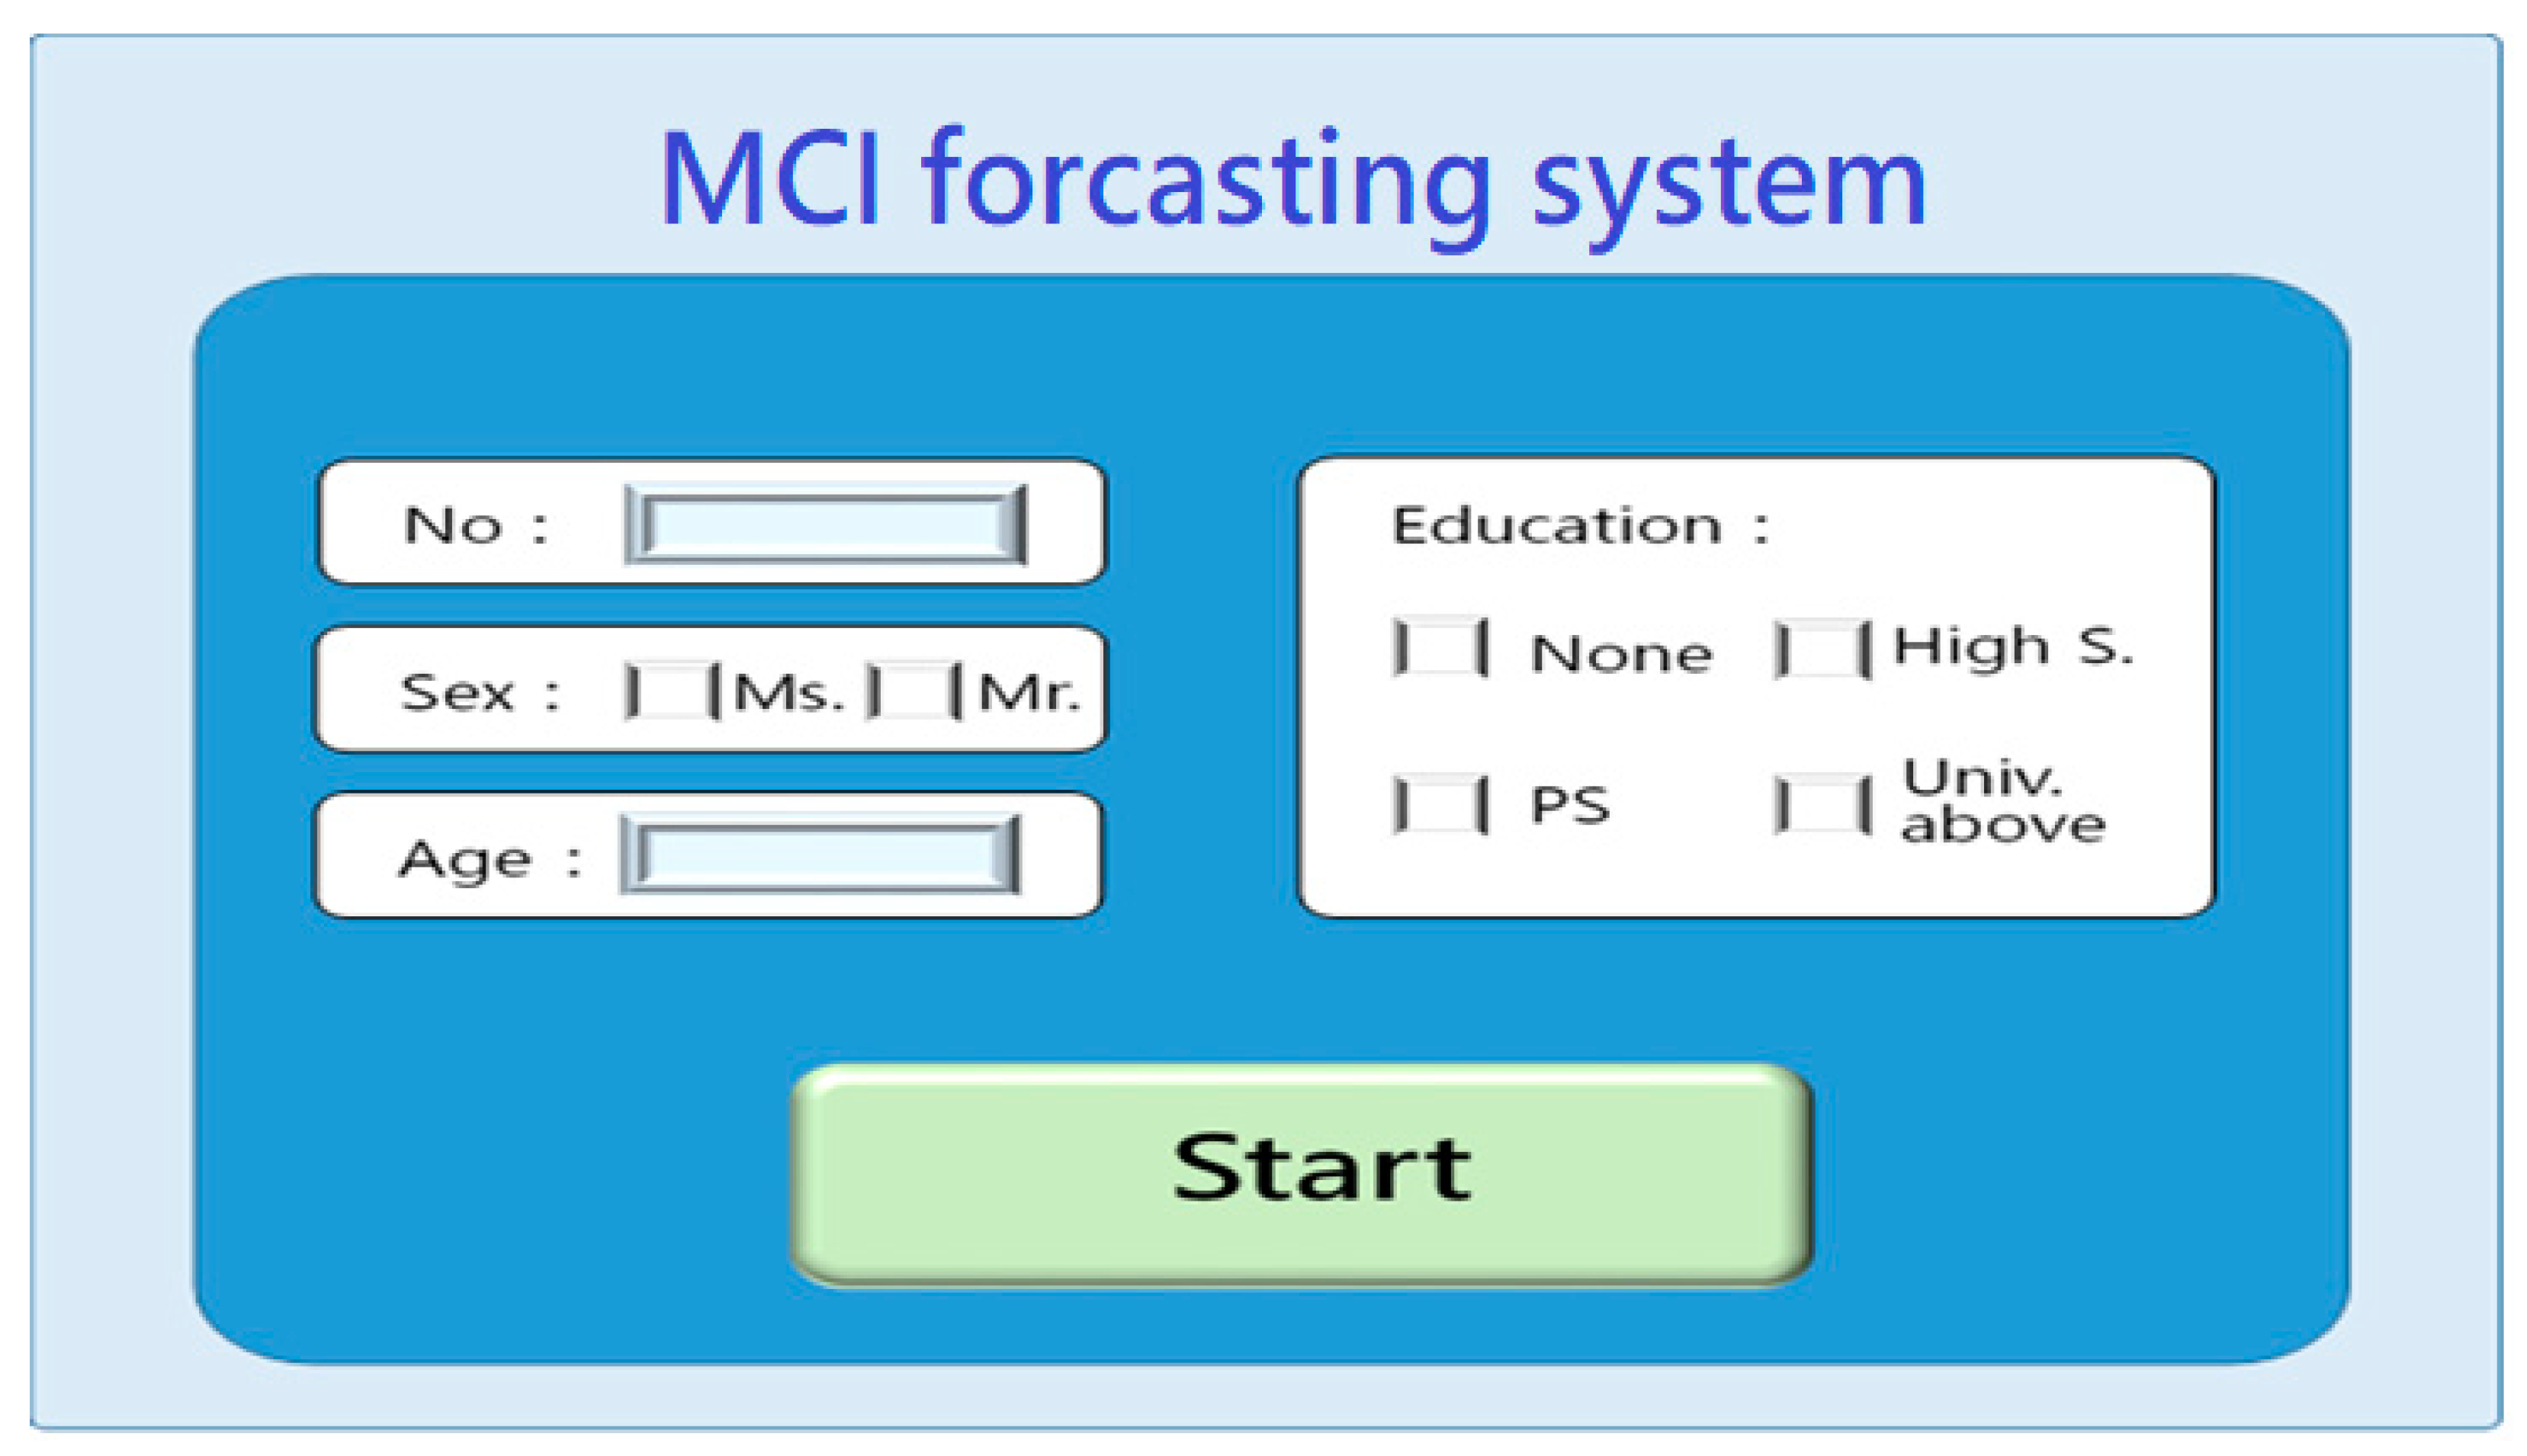
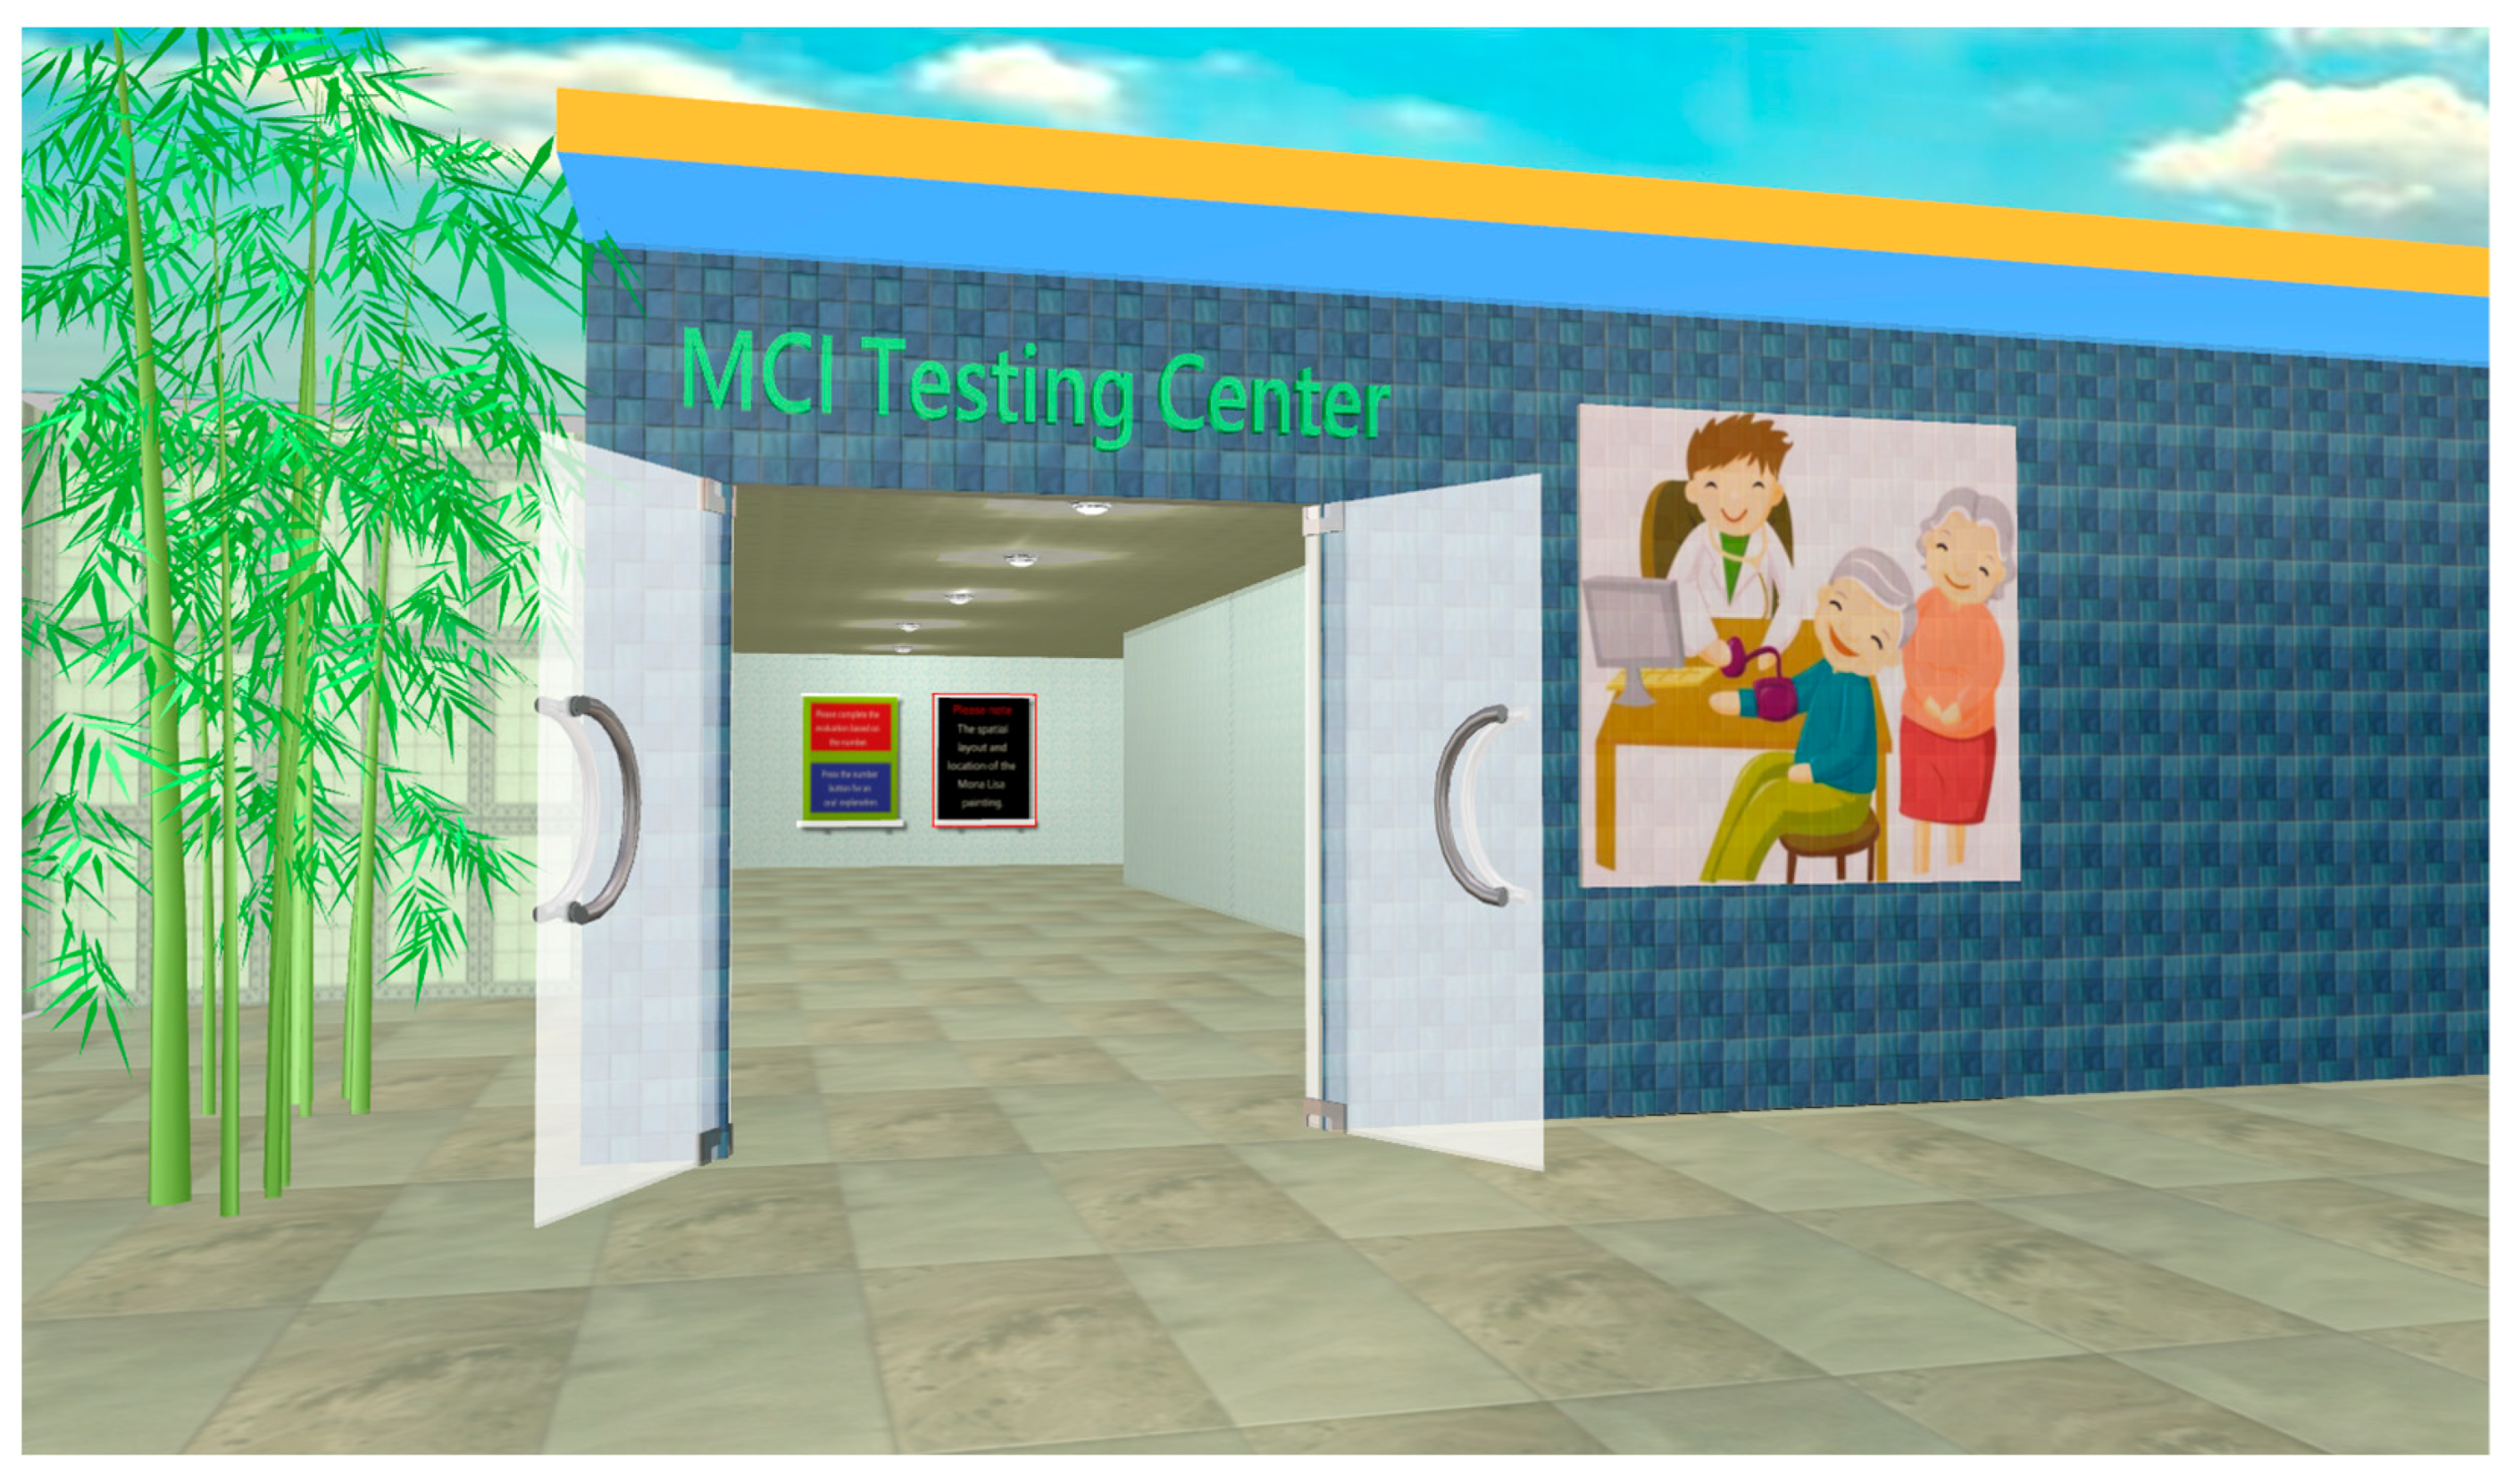
After the subject entered the "MCI forecasting system" operating platform, he/she first entered personal general information (Figure 3) for future comparative analysis of general information. After that, the MCI test center was activated, and the subject entered the center (Figure 4). The subject can use the keyboard or mouse to enter the testing area in the center.
  • Orientation test
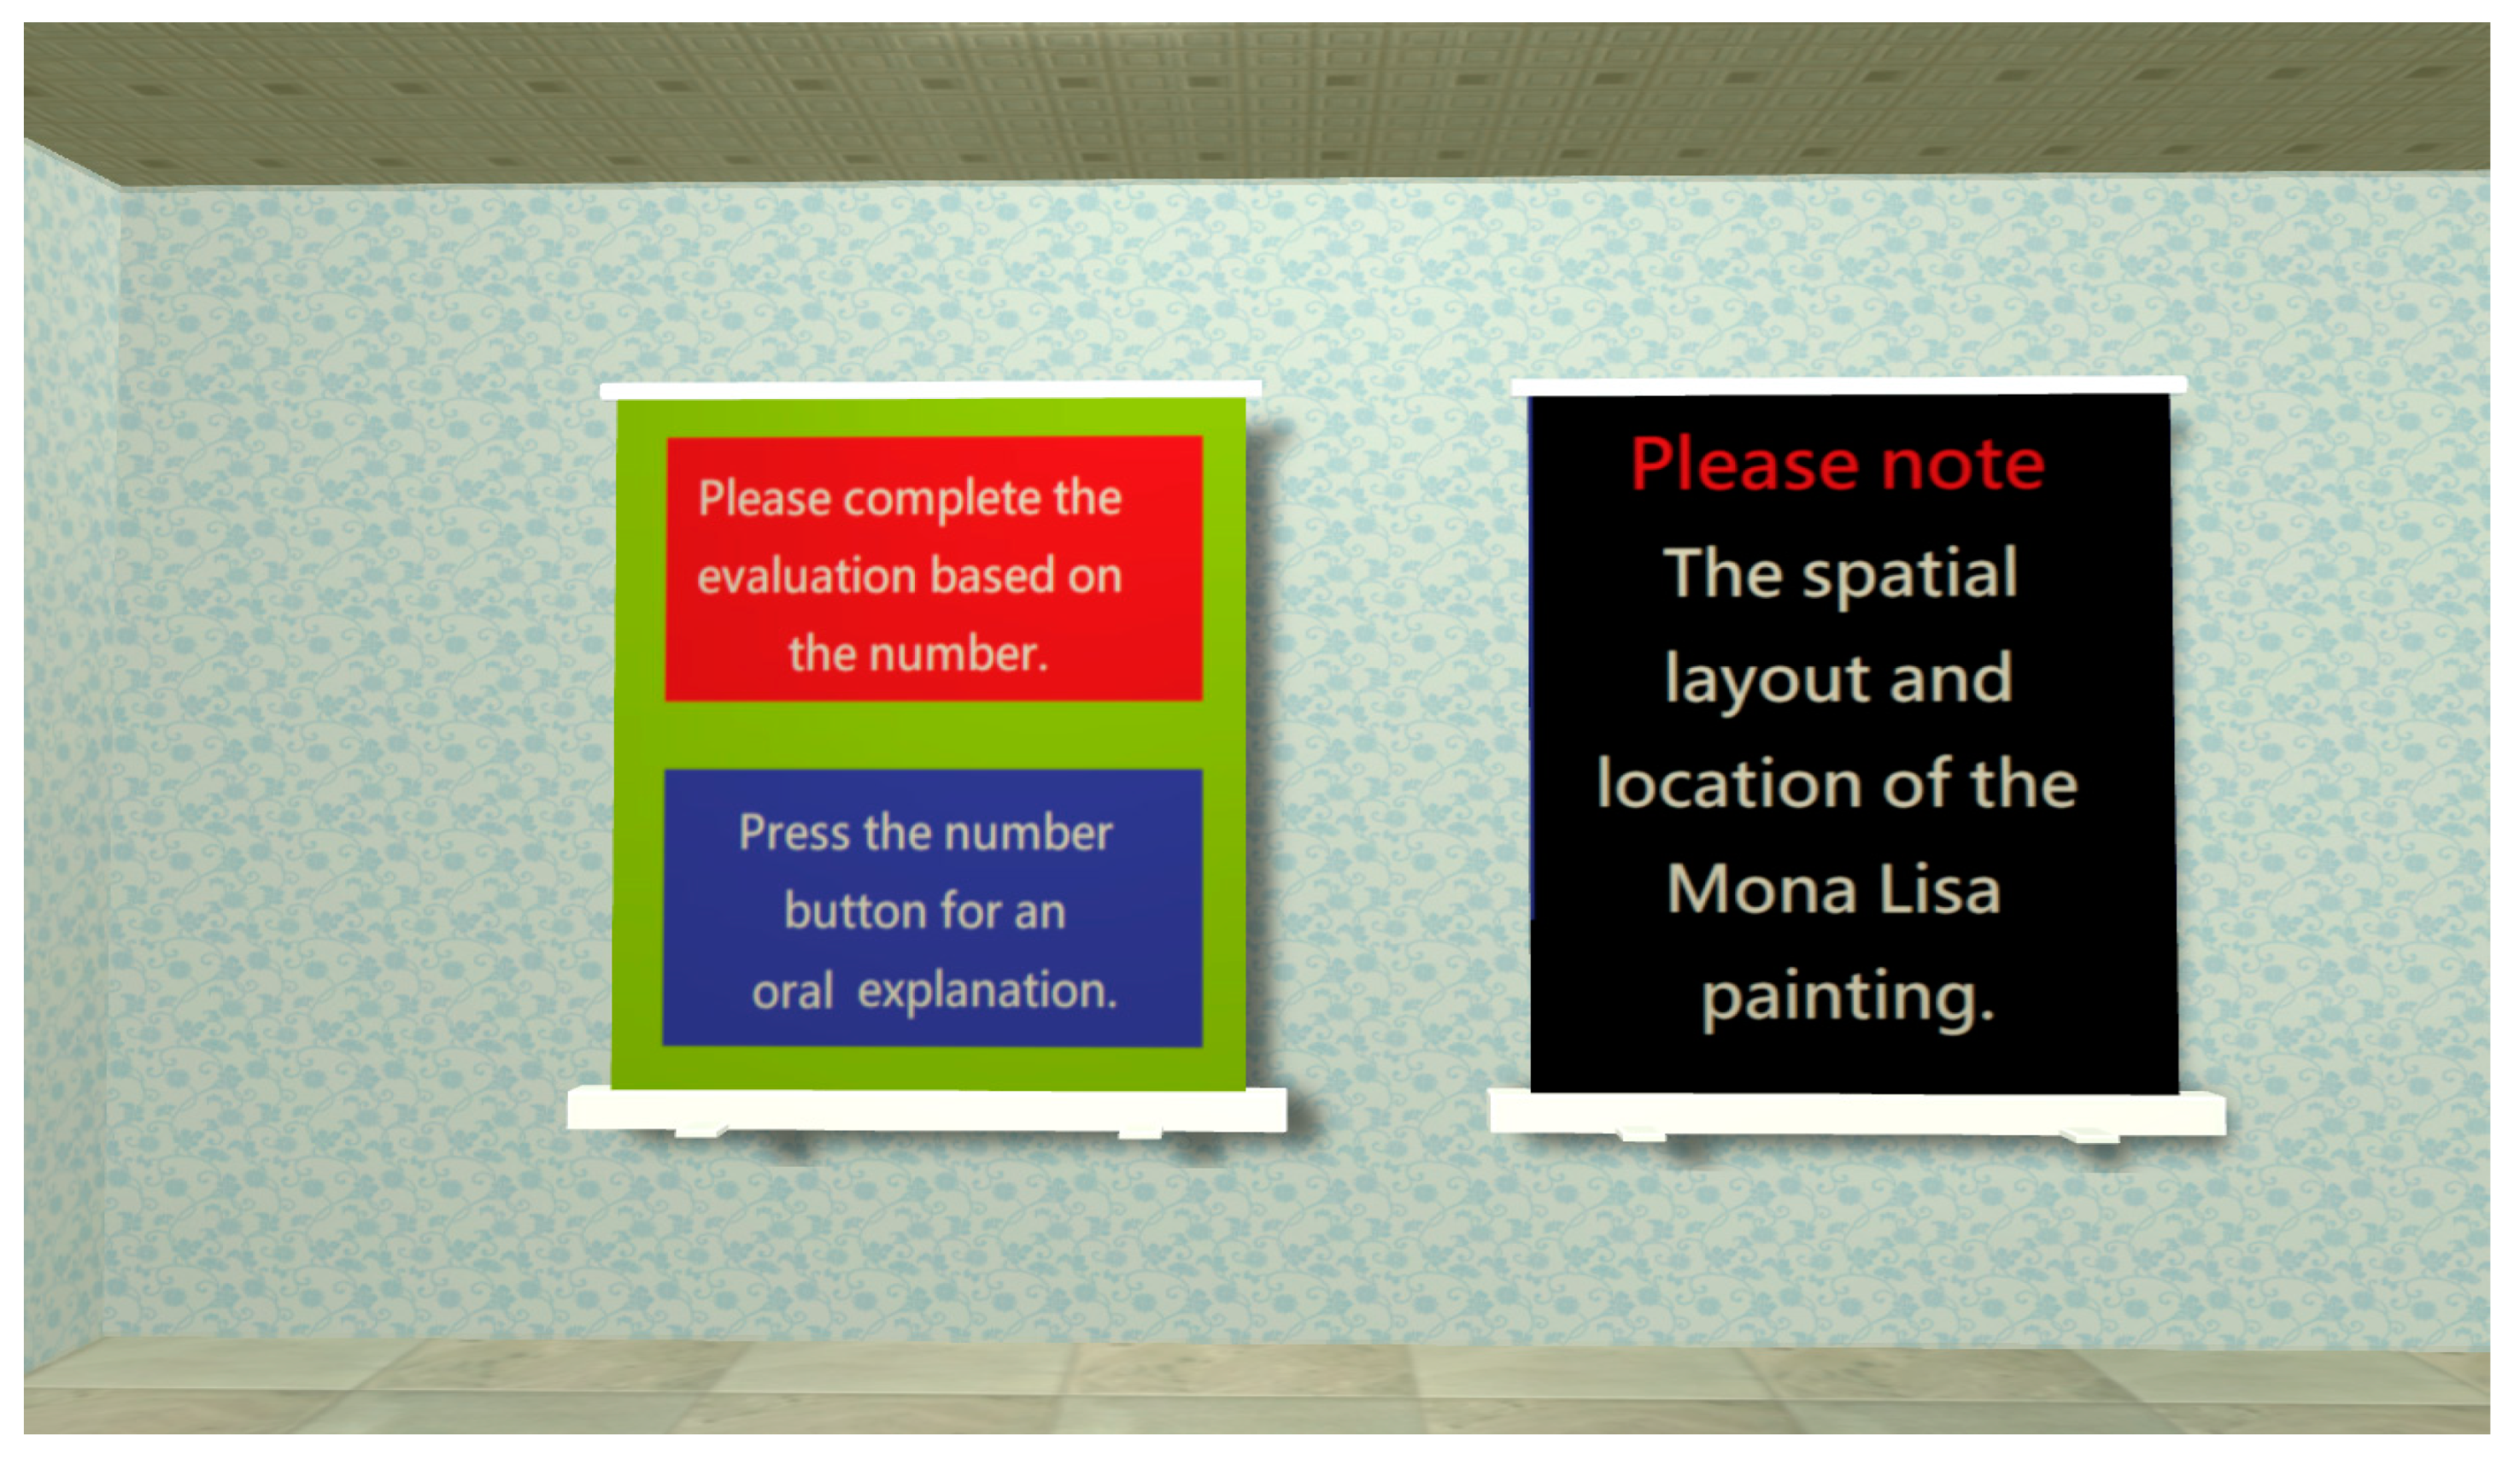
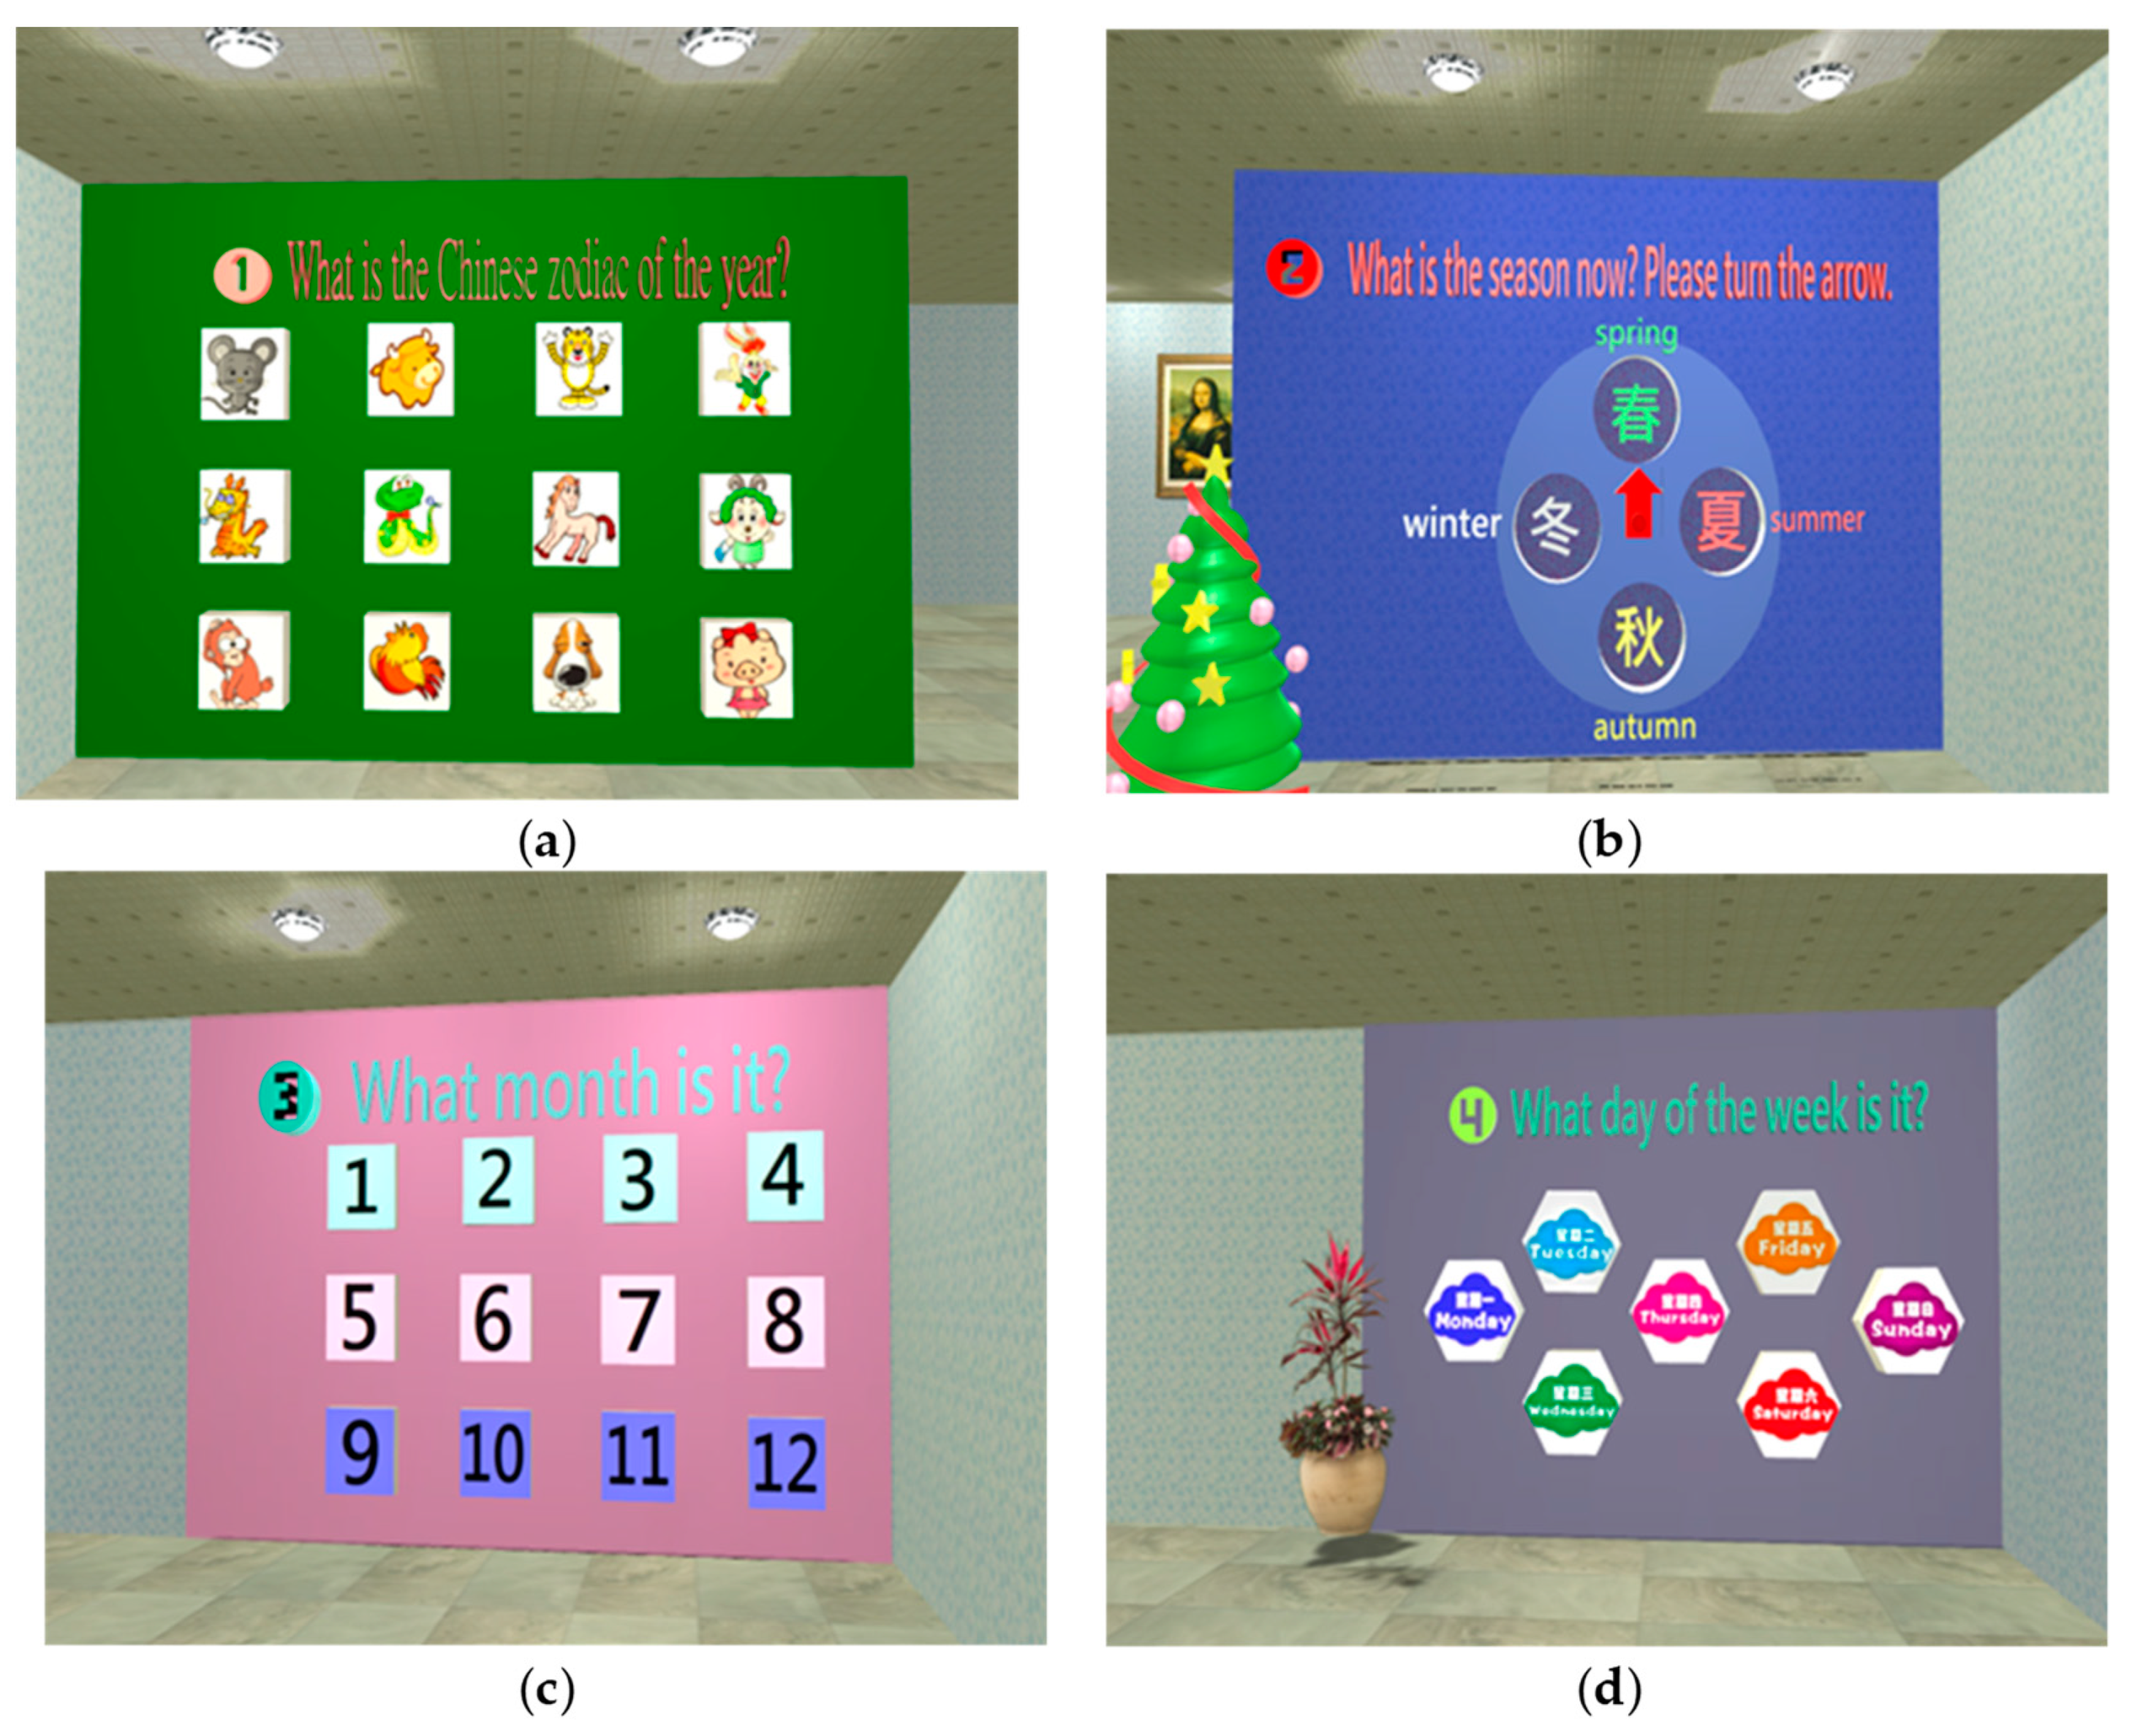
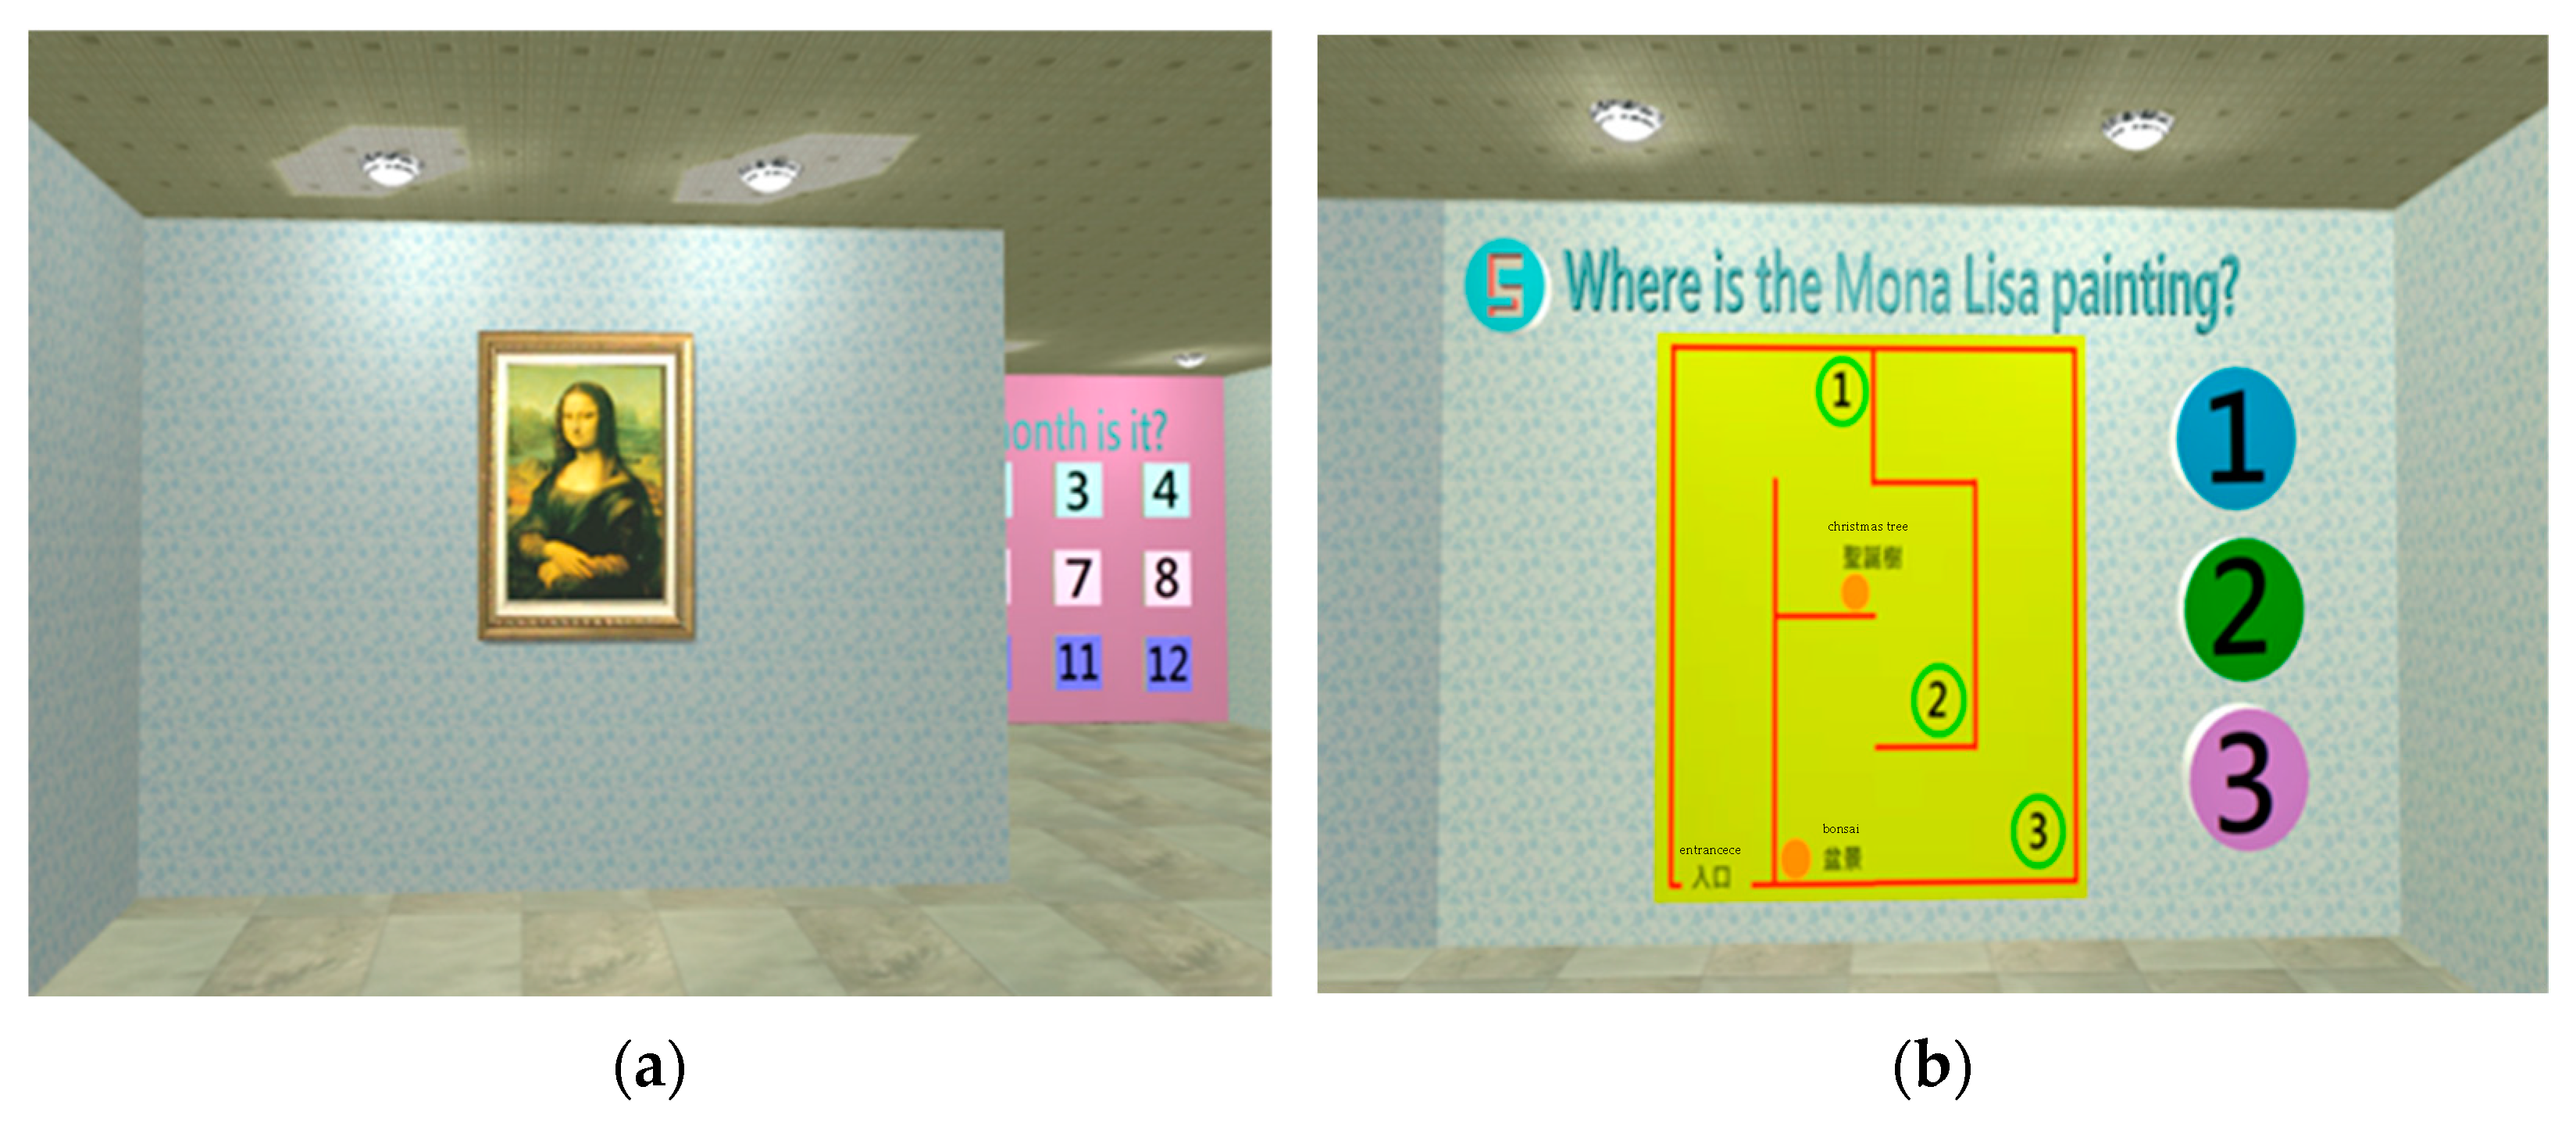
The orientation test included two dimensions (space and time), and generally, an average person should be able to observe and identify the place and time, i.e., where? and when? Figure 5 shows the operation notes to start the orientation test. Chinese zodiac, seasons, months, and weeks are used to assess the time ability of the subject (Figure 6); the Location of the Mona Lisa painting to assess space abilities (Figure 7).
  • Identification test
The left temporal lobe is mainly responsible for language expression and language comprehension. If this function is damaged, which indicates the presence of partial damage to perception, thereby indirectly affecting memory [39]. This study used language expression, image recognition, and language comprehension to assess the identification of the subject (Figure 8).
  • Memory test
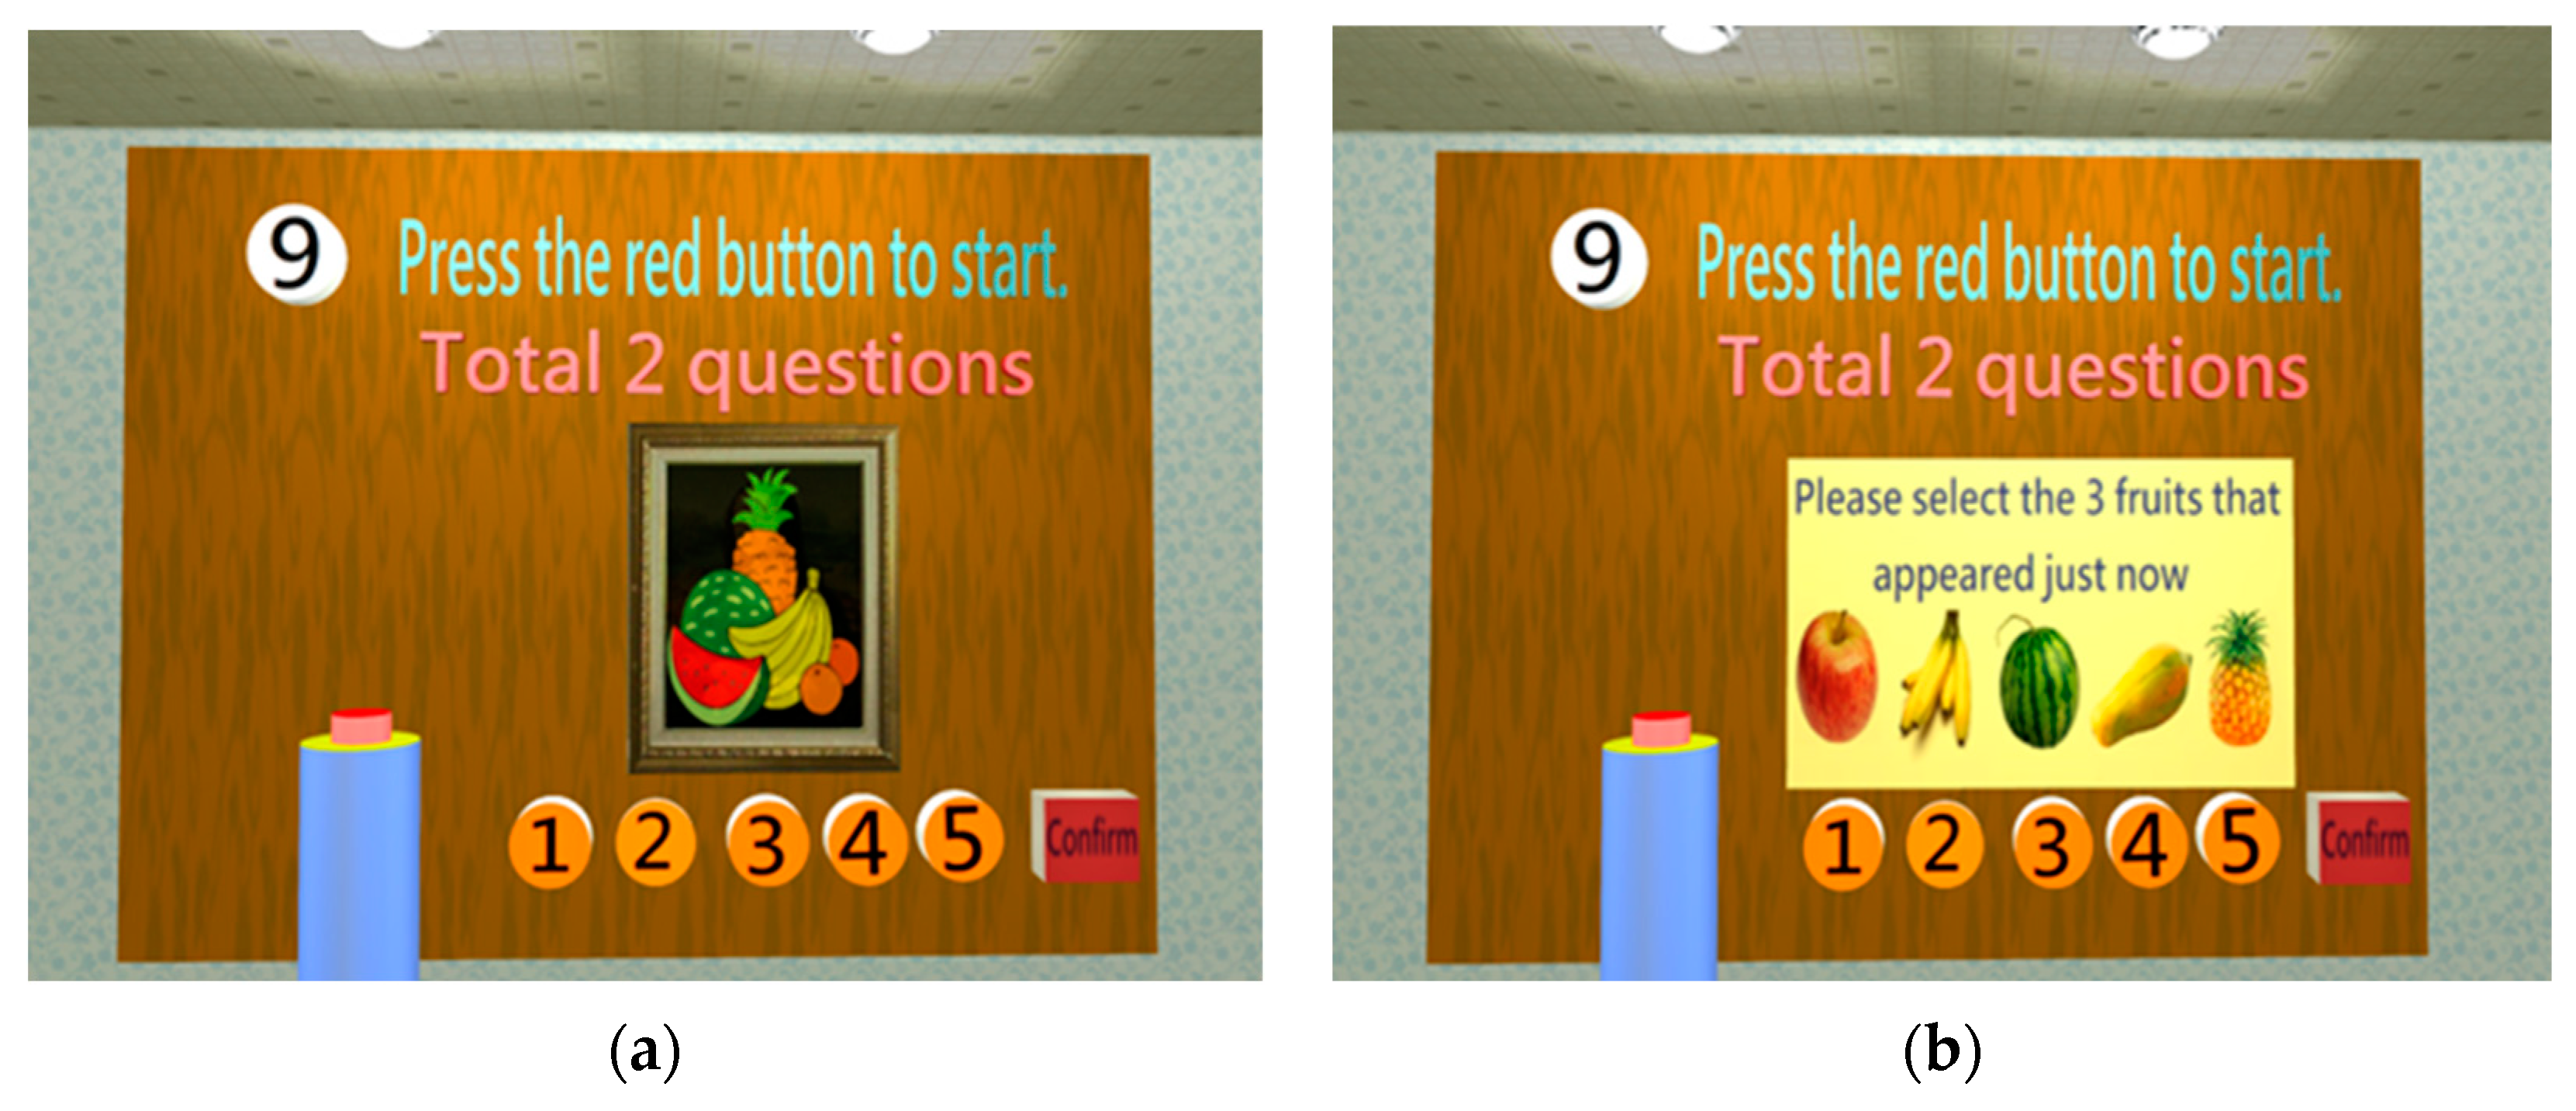
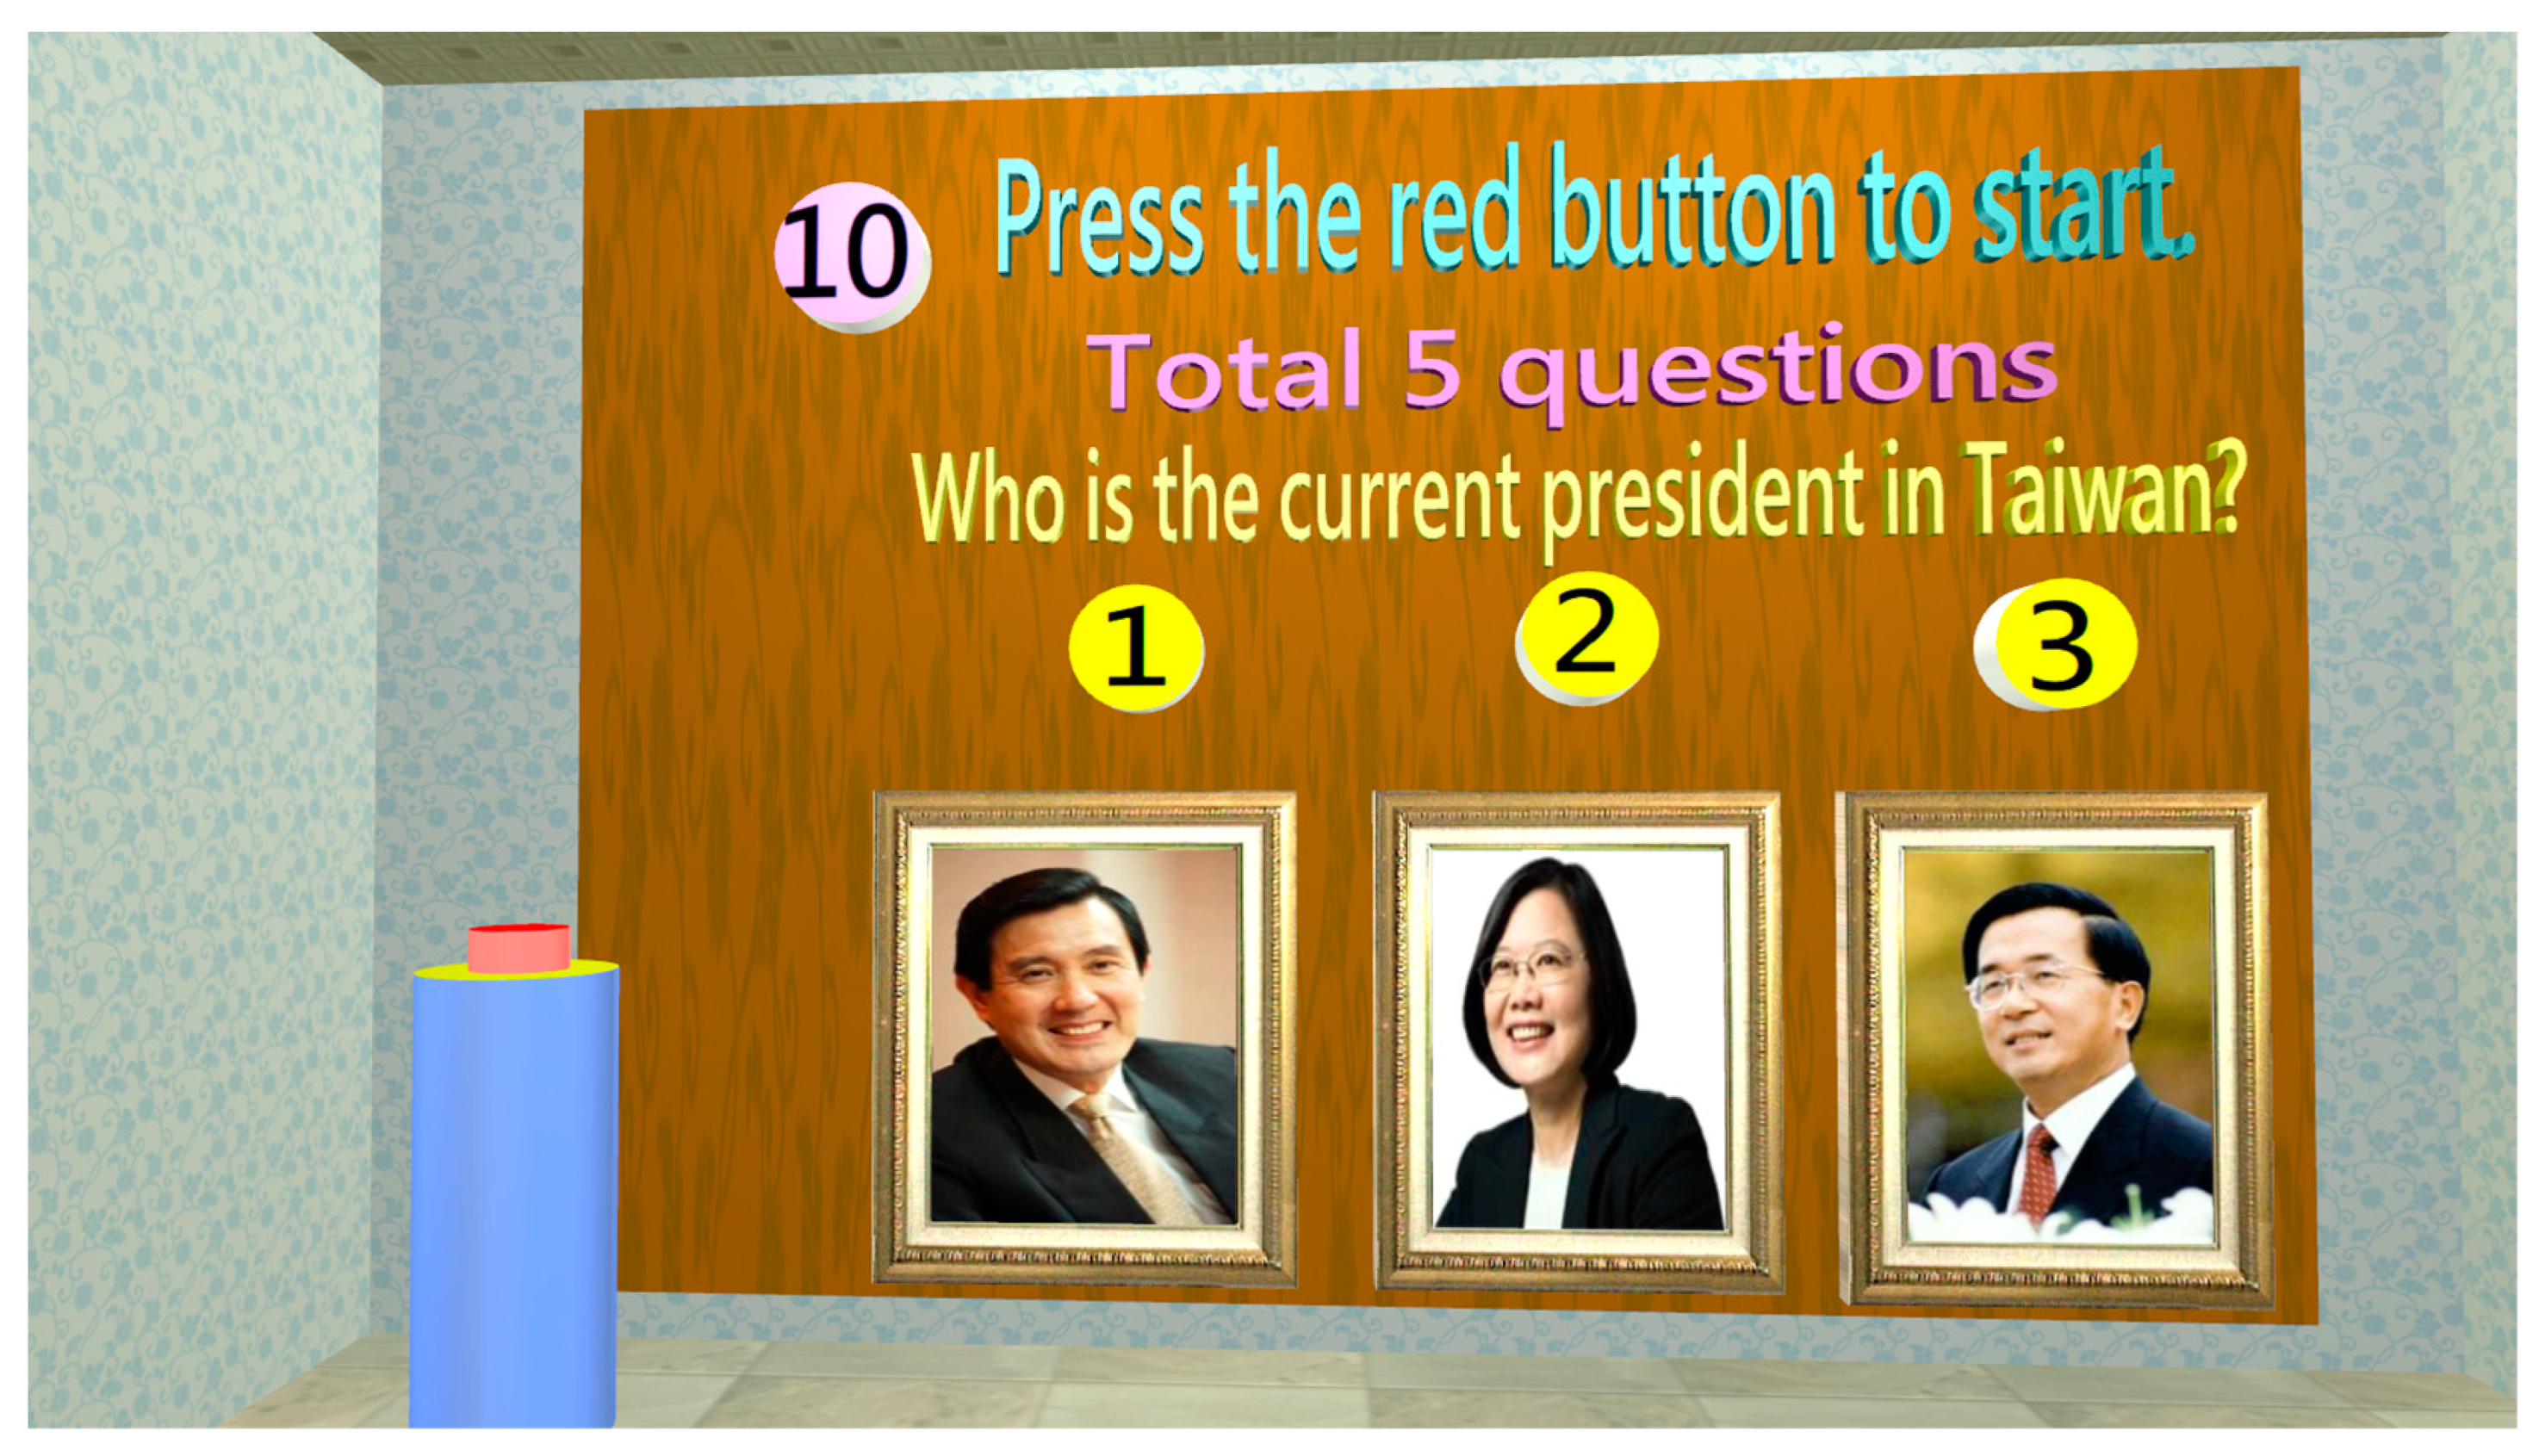
The most significant early symptom of patients with AD is memory loss. Studies showed that in cases of short-term memory loss, there is a significant decline in visual connection, e.g., Object color and image connection [40]. Therefore, the following two tests were designed in this study: object shape and image memory connection and object color and image memory connection were used for short-term memory assessment (Figure 9 (a) and (b)). Long-term memory is mainly characterized by memory loss for time sequence events (Figure 10, identification of the current president of Taiwan was used to assess long-term memory).
  • Attention test
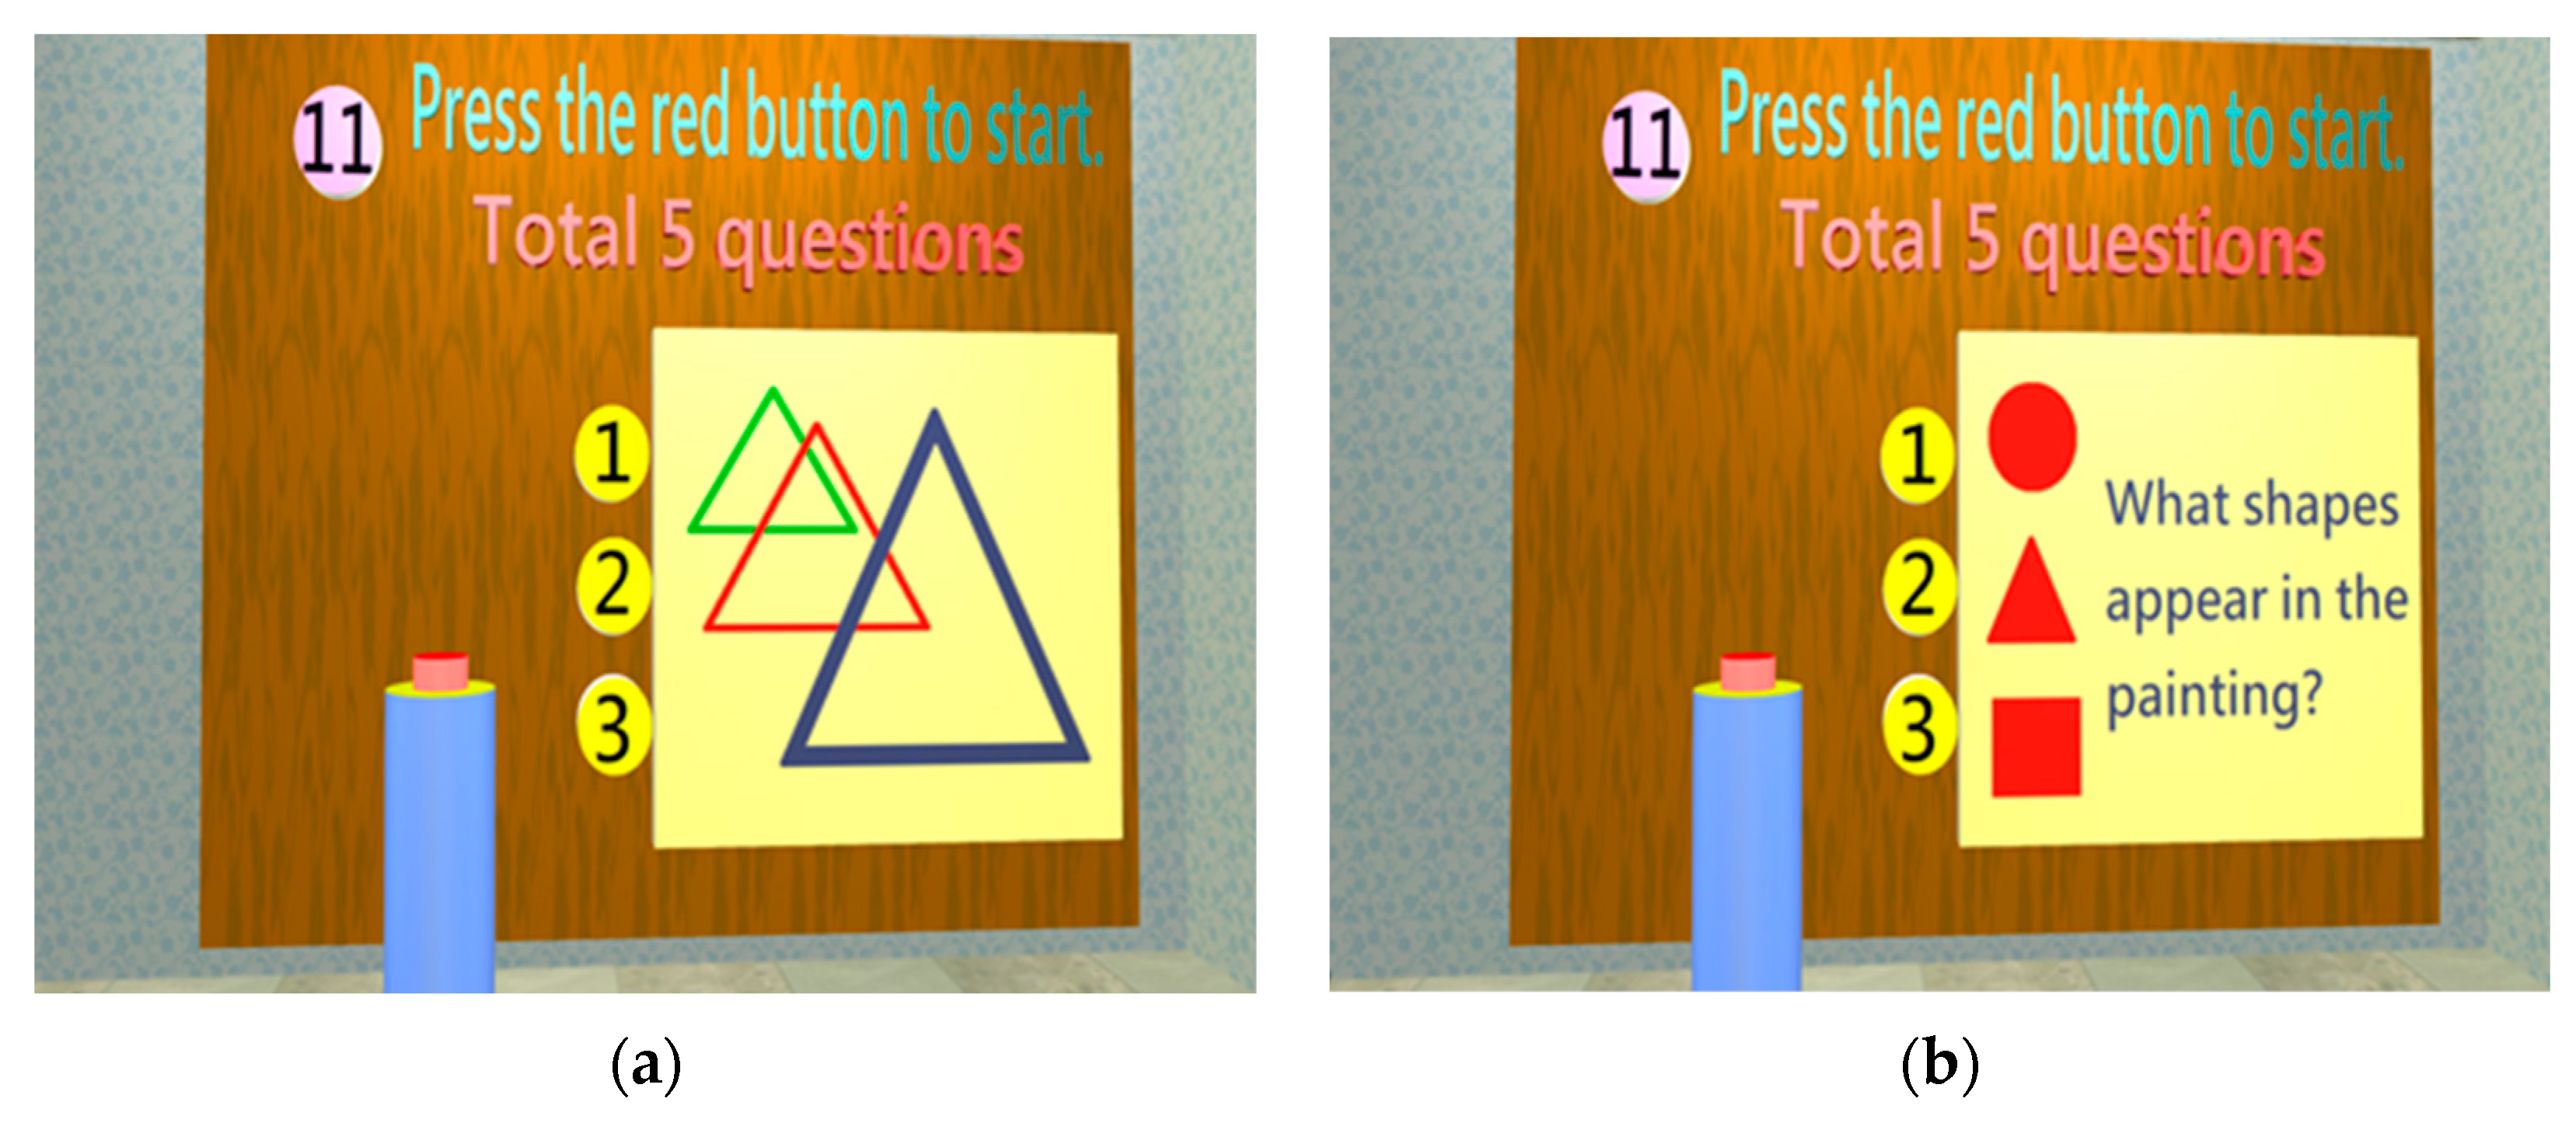
Attention is the ability to perceive the external environment. The common causes of attention loss include dementia, loss of consciousness, irritability, depression, schizophrenia, or significant illness. Attention has important clinical significance. Poor attention to a subject may suggest the presence of Alzheimer's disease [41]. In this study, several random temporary images were used to assess whether the subject could pay attention to the characteristics of events that occurred within a short period and select the correct answers (Figure 11(a)(b)).
  • Construction test
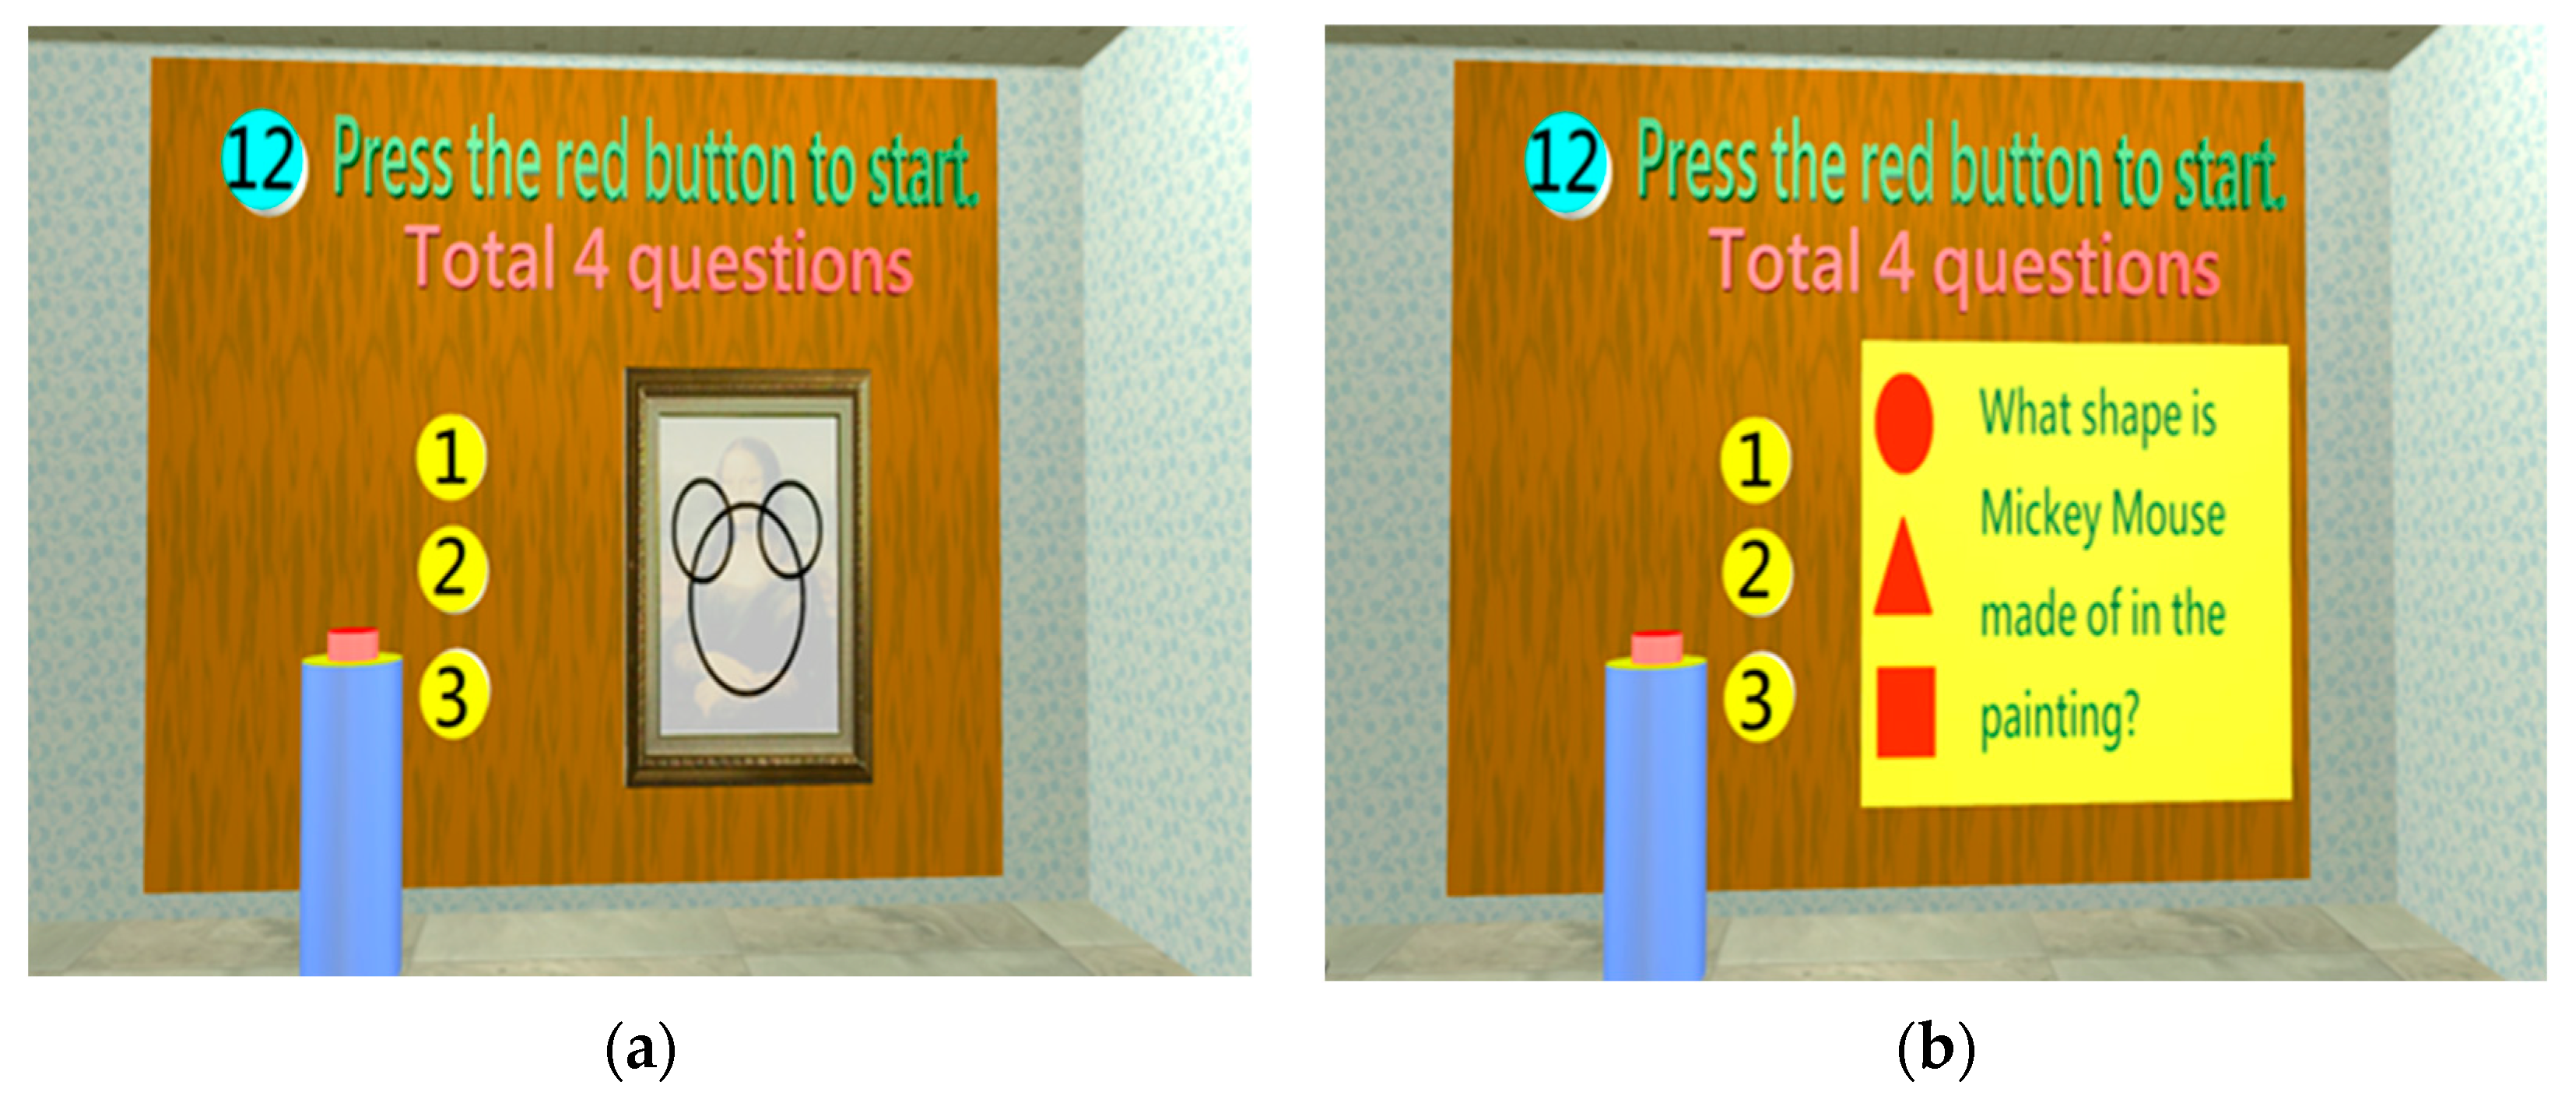
When a dementia patient develops progressive memory loss, his/her construction ability will be affected [42]. The objective of the construction test was to assess whether the subject can understand the causality of an event and the ability to understand the composition of an event. In this study, an image formed from shapes was shown, and the subject was asked what shapes were in the image. The objective of this test was to test whether the subject understands shape composition and its elements (Figure 12 (a) and (b)).
  • Judgment test
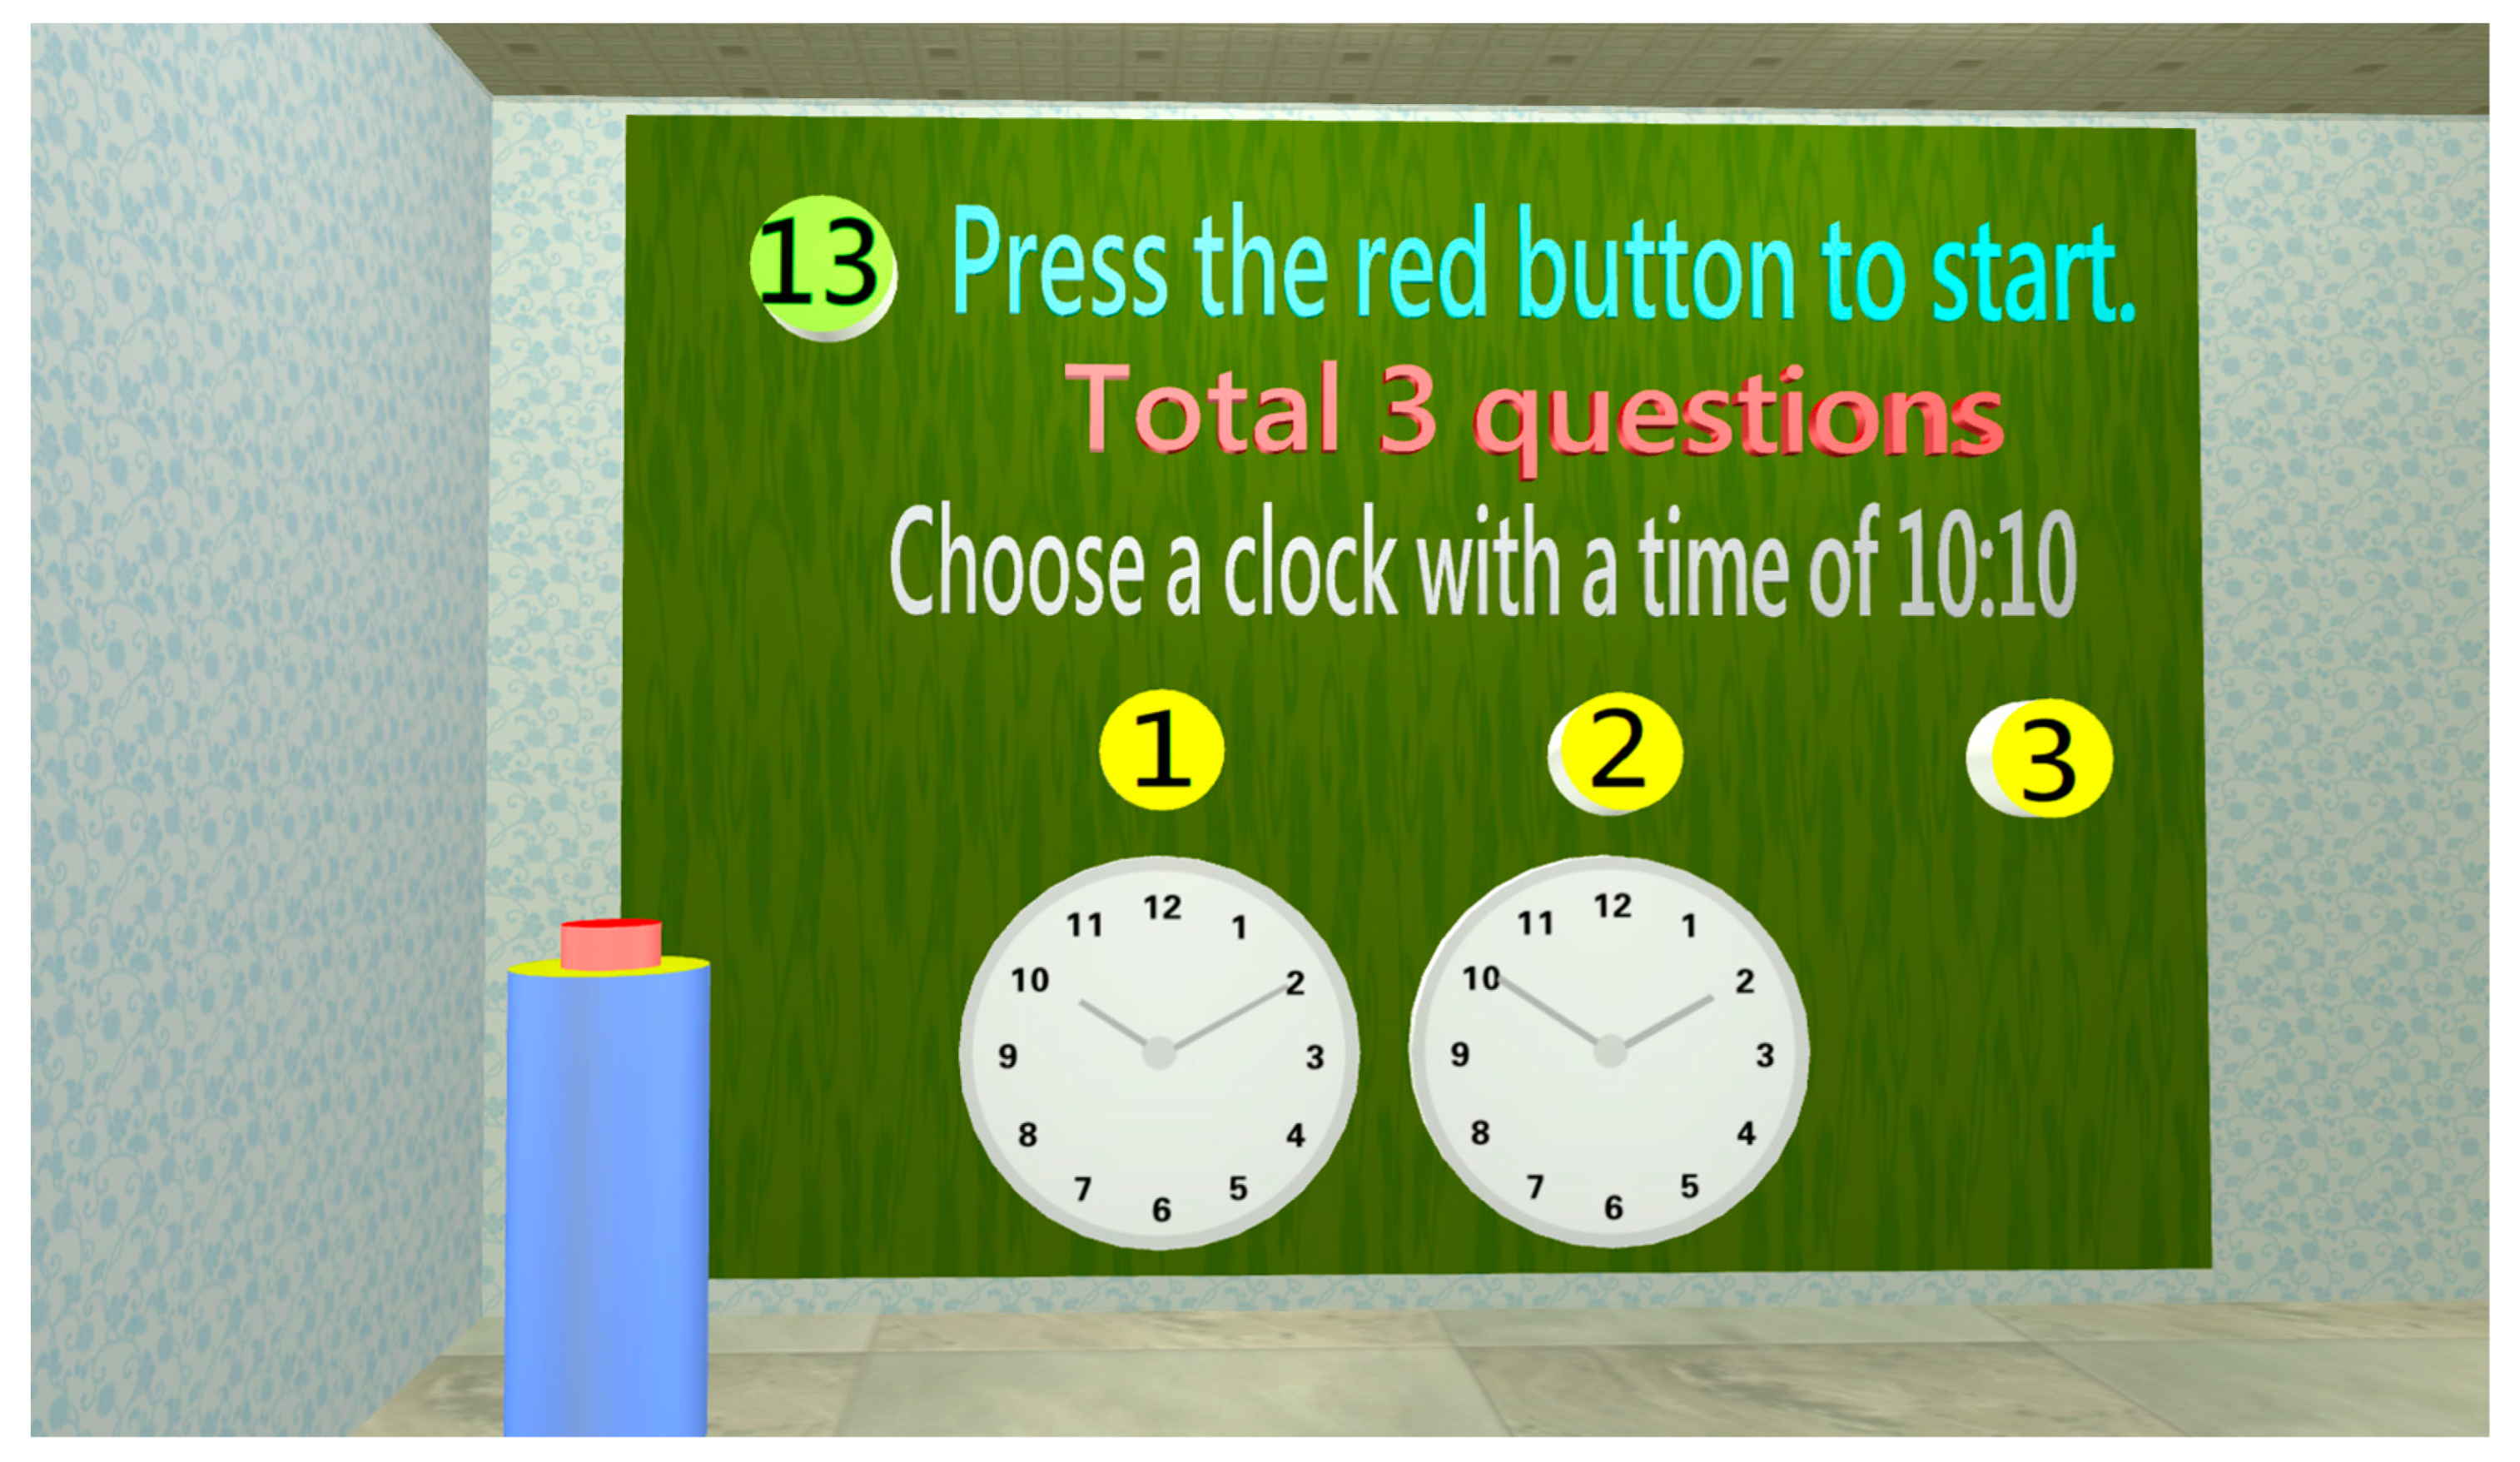
After early memory loss occurs in dementia patients, it will affect judgment [43]. In this study, (a) 10:10 o’clock judgment (Figure 13); (b) Tools used by a physician; (c) Tools used by a teacher, were used for judgment assessment of subjects.
  • Calculation test
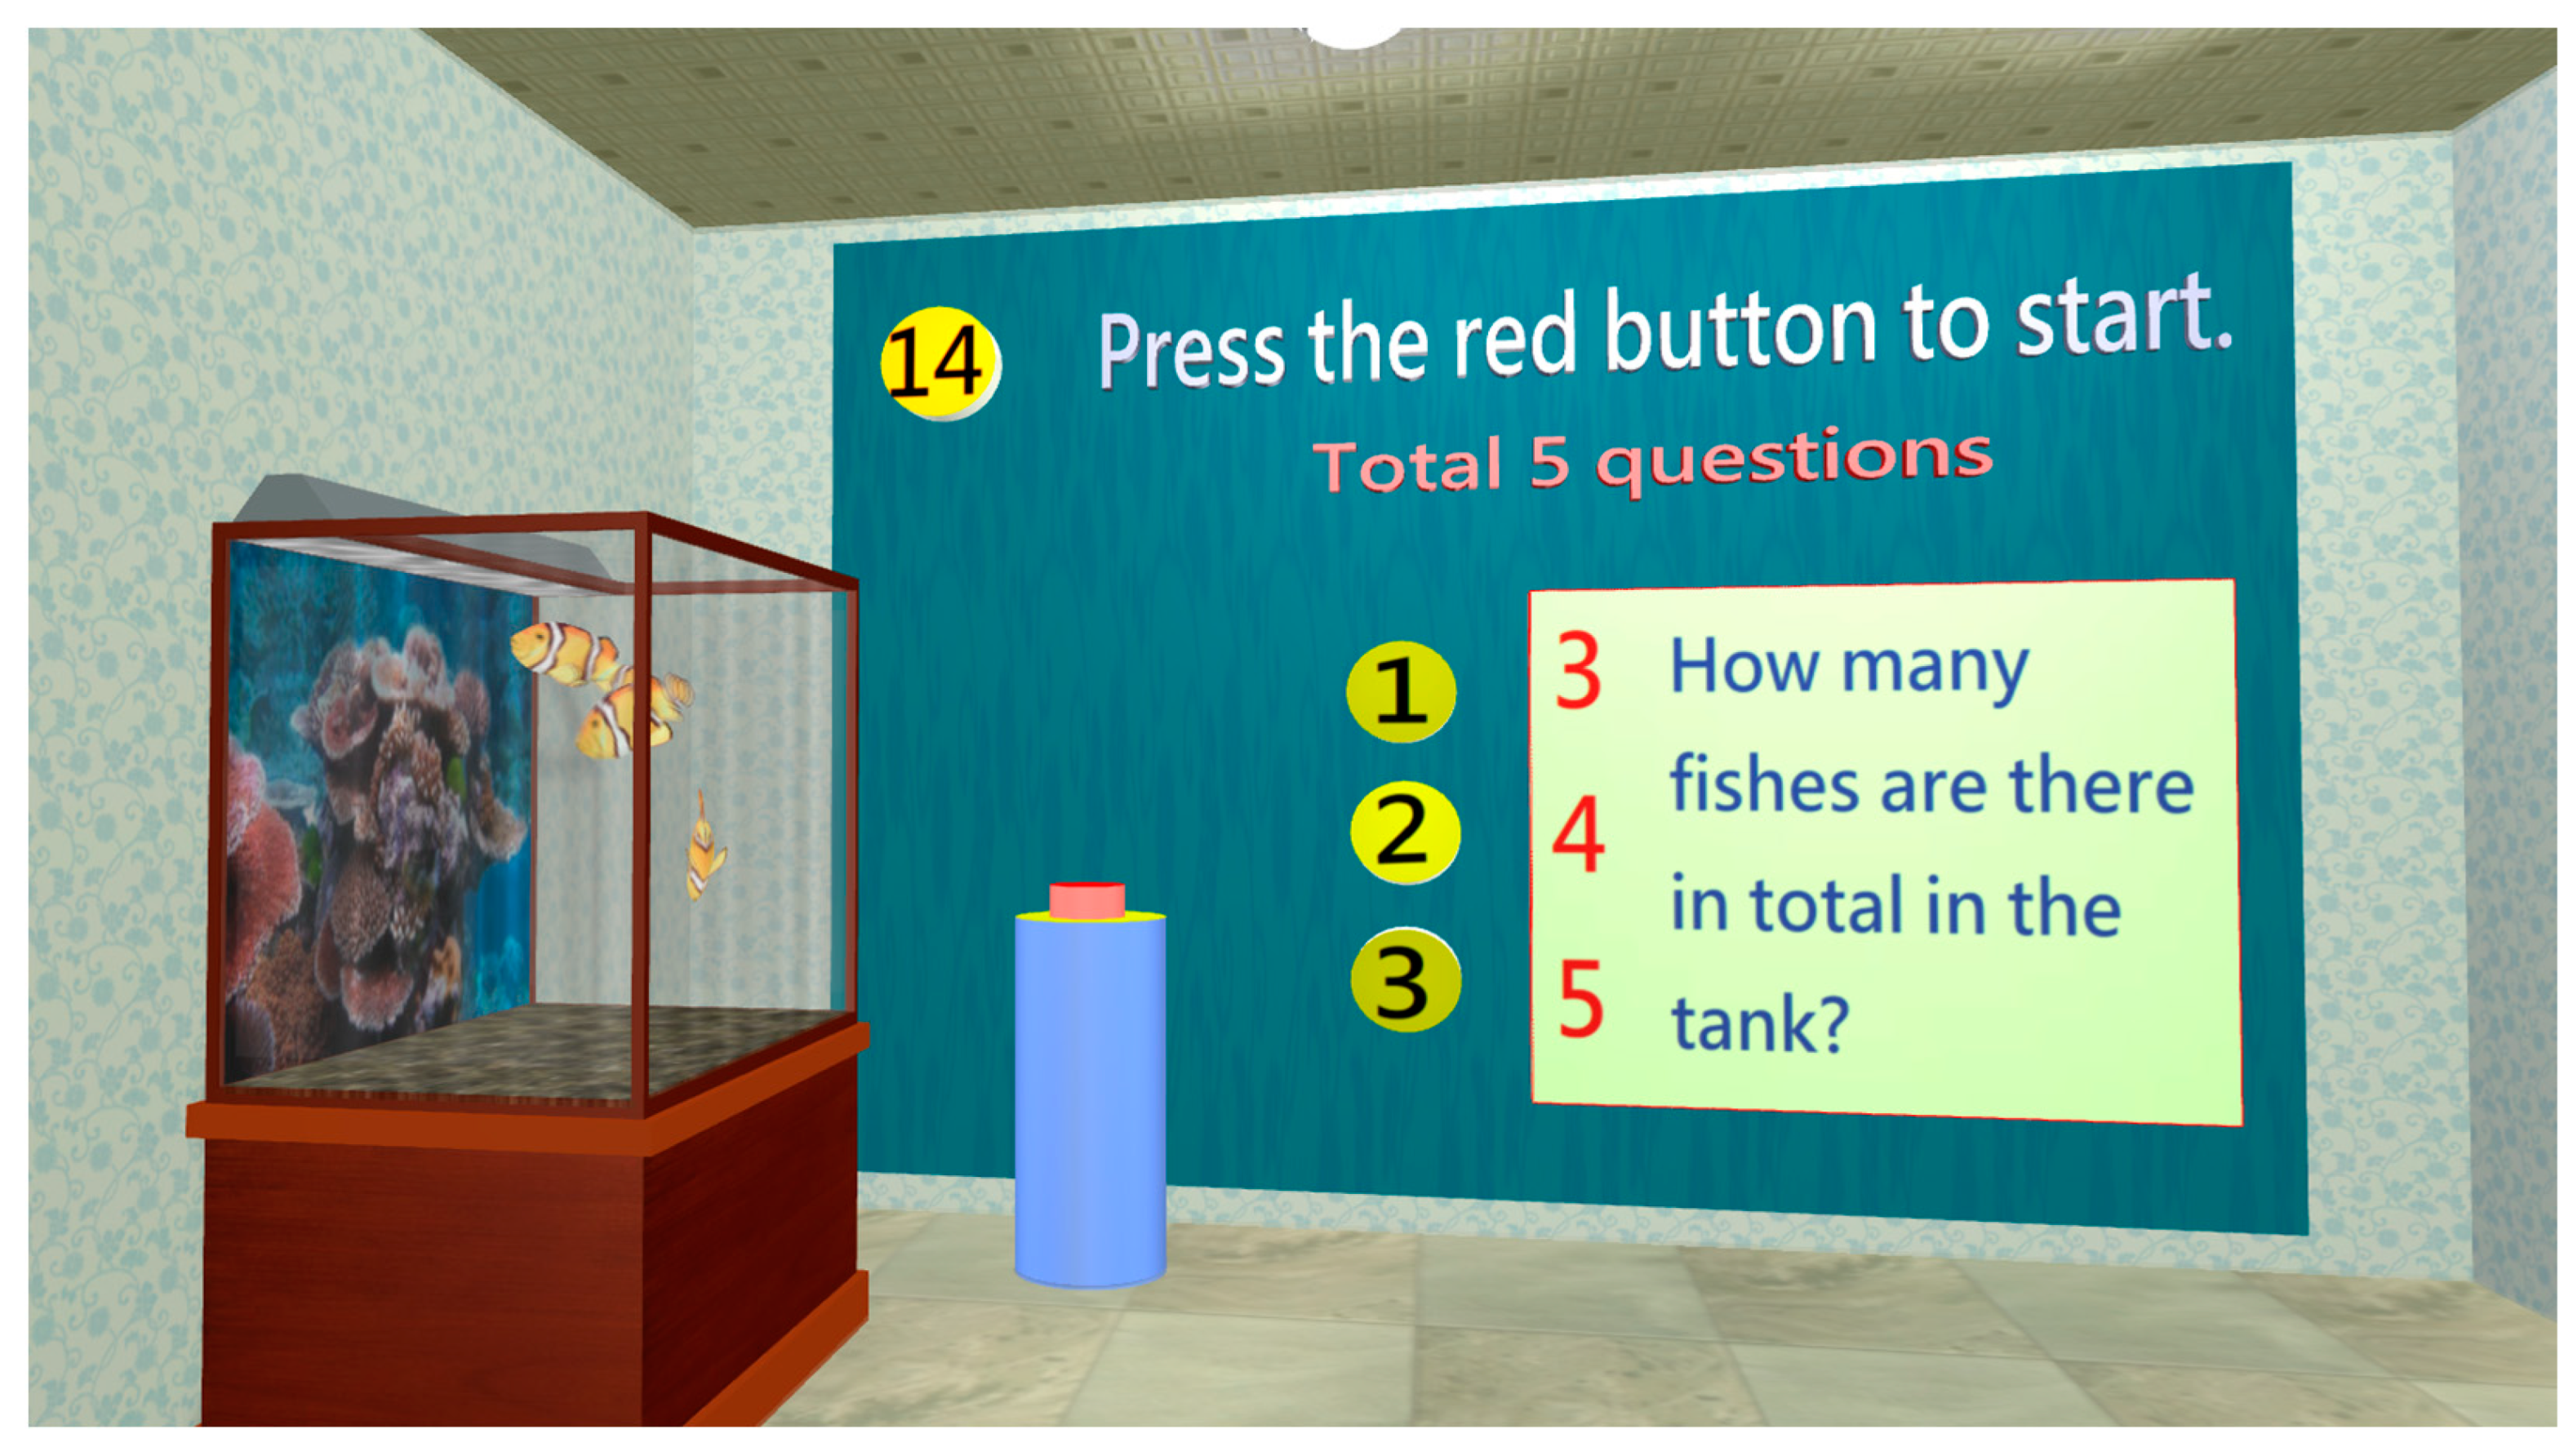
During calculation, short-term memory is required in addition to logical thinking. When cognitive impairment occurs, memory decline will affect calculation; therefore, the worsening calculation may be an auxiliary proof of cognitive impairment [44]. In this study, subjects would observe fish in a fish tank (Figure 14) and be instructed to conduct calculations relaxed to avoid sensitivity and fear toward numbers, which would result in a misjudgment.
  • Control ability test
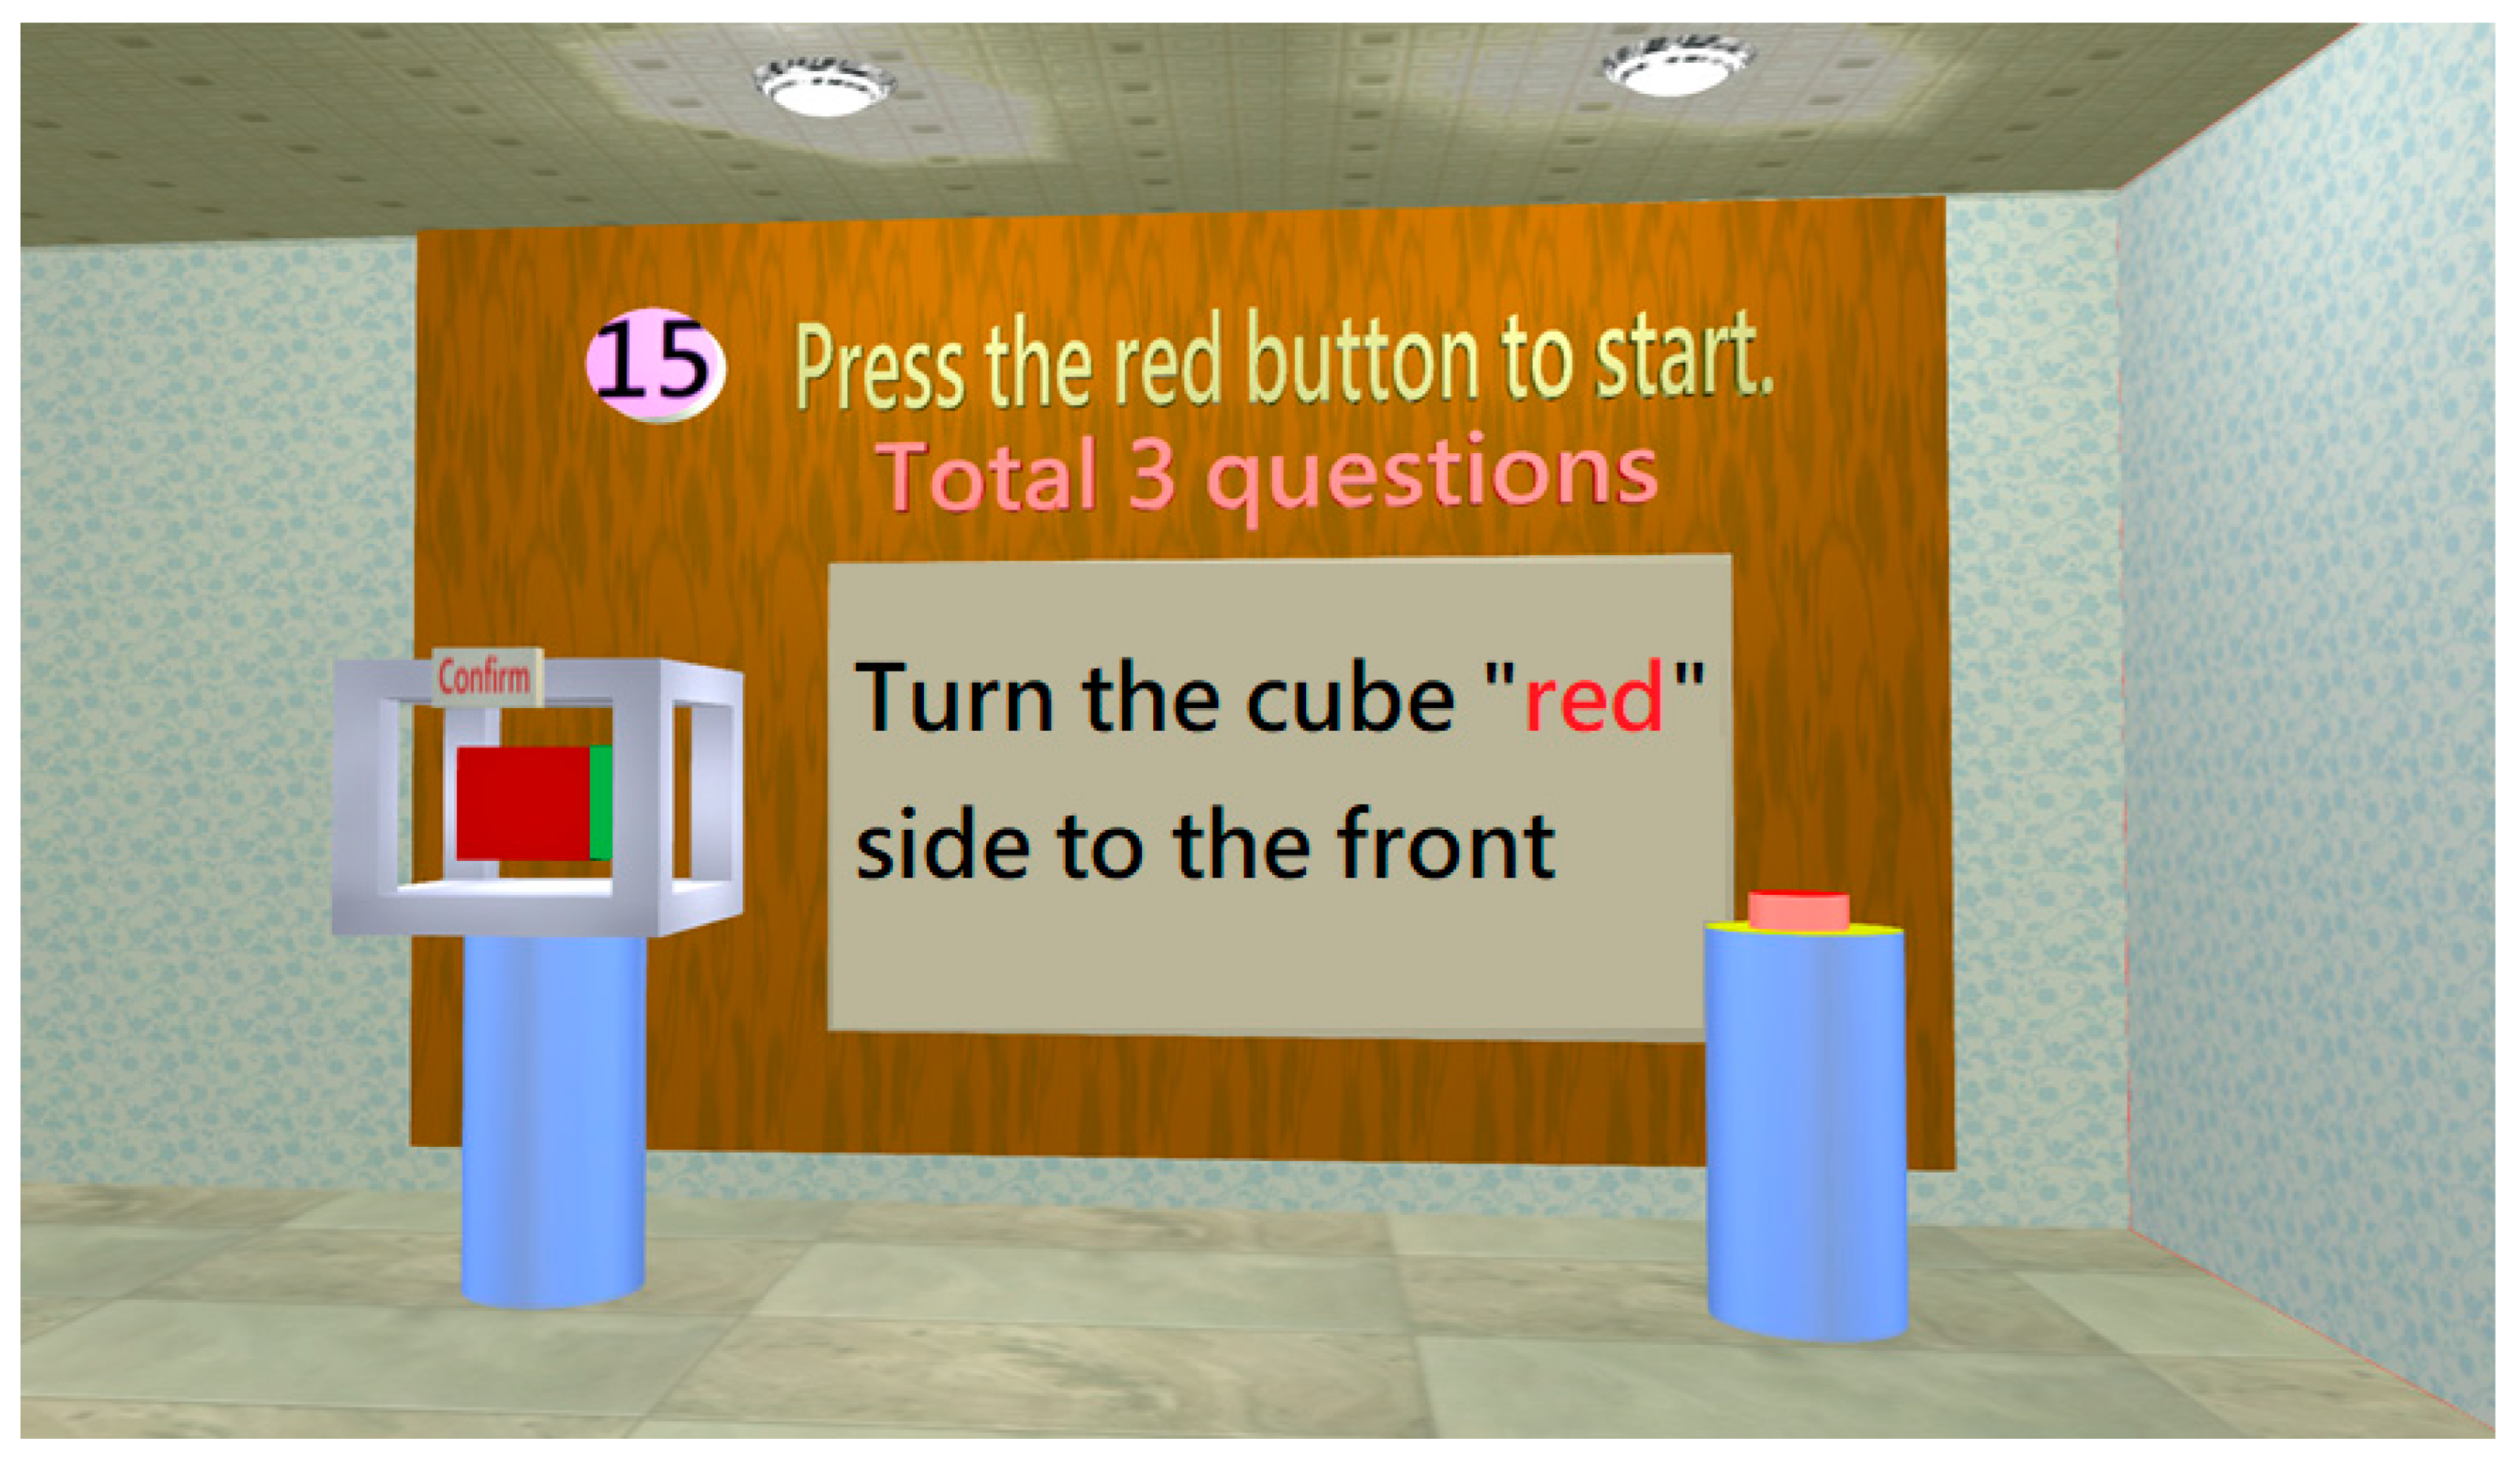
Control ability is a behavioral presentation of cognitive decision-making. When cognitive impairment occurs, it will affect control behavior to be worse. It may be an auxiliary proof of cognitive impairment [45]. In this study, mouse operation was used to assess the control ability of the subject (Figure 15).
  • Test completion screen
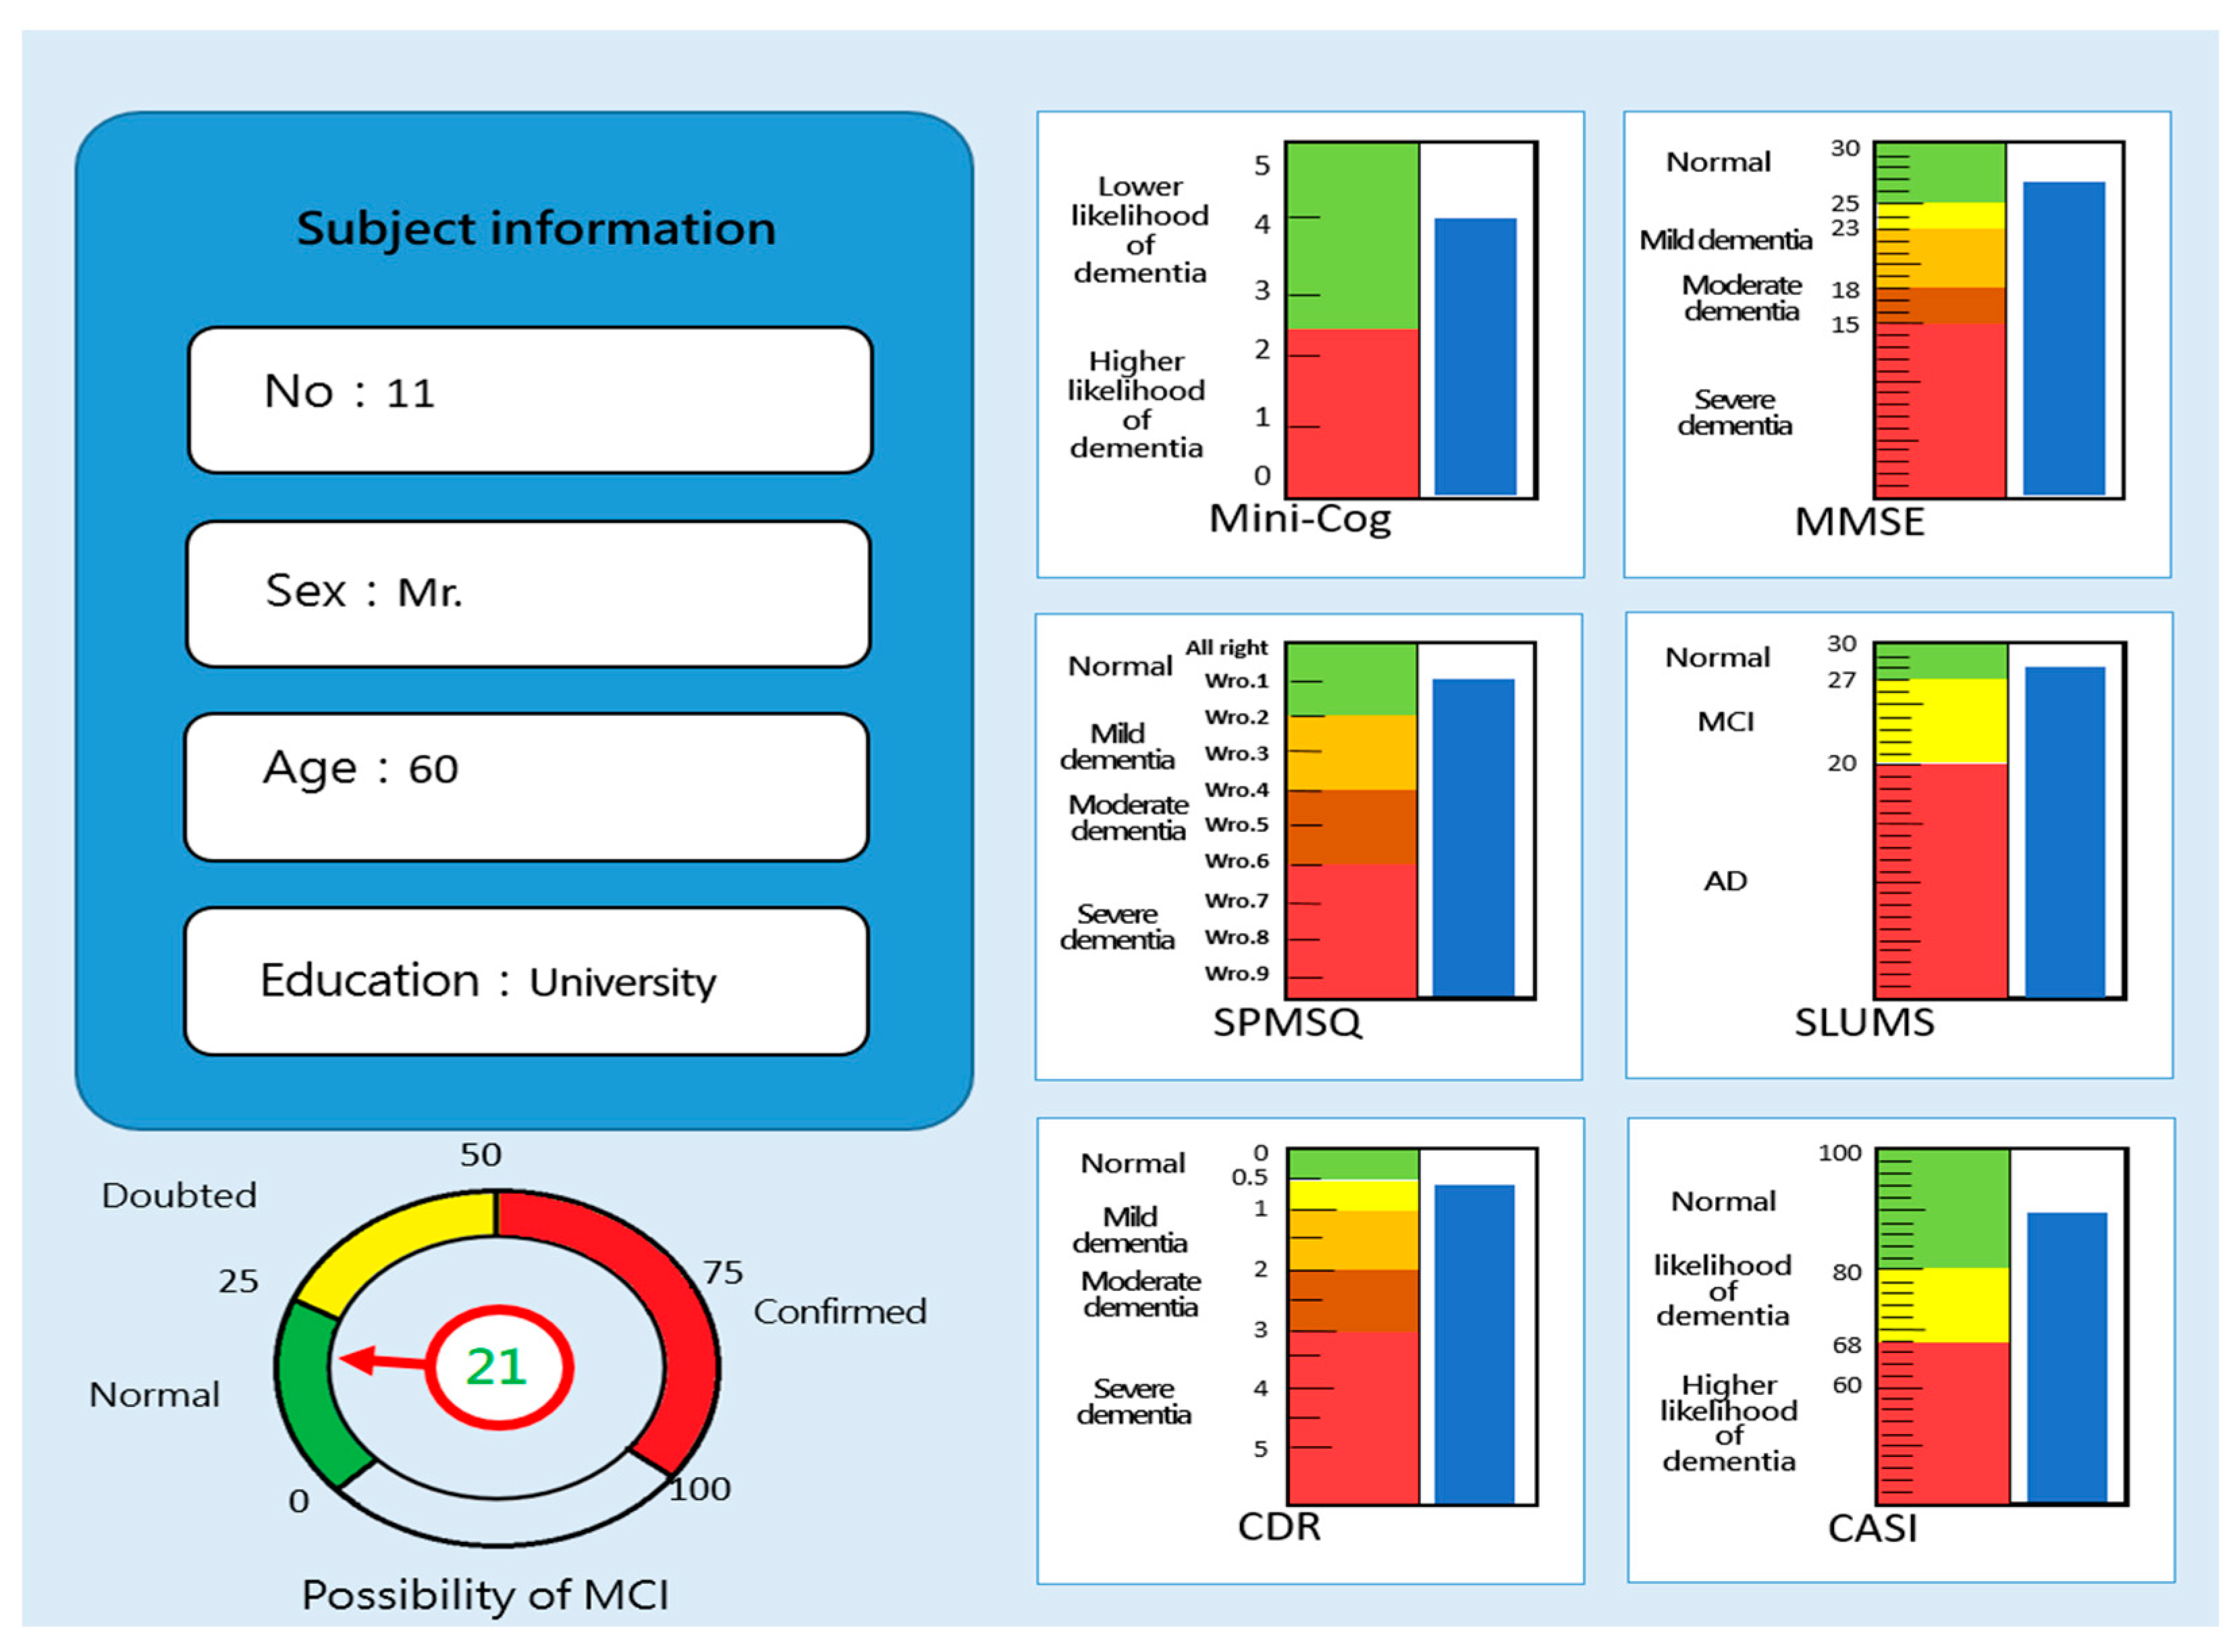
After the subject completes the eight major test dimensions, the system will carry out the MCI assessment result. One of the results is shown in Figure 16. In the figure, the right image shows the corresponding values of the six screening test tools in which the scores undergo weighted conversion (blue rectangles show the corresponding values) after the test. The evaluating grades of the six screening test tools are also displayed to facilitate identification. The various grades were presented in different colors based on the evaluating criteria (e.g., green indicated normal, and red indicated severe dementia). The lower left image shows the fuzzy warning forecasting value, which provided the forecasting score of the possibility of MCI to the subject. There are three grades in total: 0-25 points indicate the extremely low possibility of MCI and are shown by the green area; 26-50 points indicate doubted MCI and are shown by the yellow area; 51-100 points indicate confirmed MCI and are shown by the red area. Therefore, the higher the score, the more likely the subject will suffer from MCI. The presentation of this forecasting indicator can provide the tester with integrated evaluating scores, particularly when the test results of Mini-Cog, SPMSQ, MMSE, SLUMS, CDR, and CAS are inconsistent.

2.2. Experimental design

2.2.1. Subjects

In this study, 24 middle-aged to older people aged 50 to 65 years, which is the age group when early cognitive impairment tends to occur, were invited to participate in MCI forecasting system testing. All subjects received visual acuity and laptop-operated tests to decrease experimental variation due to inter-individual differences.

2.2.2. Experimental procedure

A. Before testing, the operating instructions for the MCI forecasting system were given to the subject, and the subject was taught how to operate the system. The experiment was carried out after the subject was familiar with the system’s operation.
B. When the test started, the subject operated the personal computer or laptop by himself/herself, and the assistant guided the subject to the screen entrance. After introducing the test items, the subject carried out various test operations based on instructions. During the test, the assistant would be at the side to assist. When the subject completed the test, he/she was required to complete a usability questionnaire to understand the system’s convenience. The test would be immediately stopped if the subject experiences discomfort during the test. In addition, one month after the test was completed, the subject would undergo testing with six traditional hardcopy tools: Mini-Cog, SPMSQ, MMSE, SLUMS, CDR, and CASI. One test was performed each time, followed by an interval of 1 week before the next test was performed. During the test, the assistant would be at the subject's side to assist in completing the hardcopy tests.

2.2.3. Effectiveness assessment

A. Correlation analysis
After the subjects completed the MCI forecasting system test and six traditional hardcopy tests (Mini-Cog, SPMSQ, MMSE, SLUMS, CDR, and CASI), the MCI forecasting system generated corresponding values of the six screening tests. This study used Pearson correlation analysis between the corresponding values of the six screening tests and the values of the six traditional hardcopy tools.
B. Usability analysis
This study used the System Usability Scale (SUS) developed by Brooke in 1986 for the usability assessment of the MCI forecasting system [46]. SUS is widely used to rapidly detect the usability of product system interfaces, desktops, and website pages. Based on small sample study results by experts, SUS can also be used for quantitative analysis of small sample sizes (12 people). In order to facilitate an adequate understanding of SUS scores, Bangor et al. (2009) conducted a score perception study on SUS in 2009 and divided SUS scores into five grades, namely A:90-100, B:80-89, C:70-79, D:60-69, and F:0-59 [47].

3. Results and discussion

3.1. Correlation analysis of MCI forecasting system

Table 3 shows that the MCI forecasting system developed in this study is a strong correlation with traditional hardcopy Mini-Cog, SPMSQ, MMSE, SLUMS, and CASI, of which MMSE and CASI had a very strong correlation, but the correlation with CDR was moderate. The reason may be that the CDR test is additive, the scoring method differs slightly from other tests, and the total scores are only 3. When the MCI forecasting system converts the CDR evaluation value, minor bias may increase the score by 0.5 points, resulting in a large discrepancy. Overall, forecasting system testing can preliminarily obtain results consistent with many hardcopy tests. When doubts exist in one hardcopy test, and other hardcopy tests are required, this may cause resistance in subjects, resulting in execution difficulty. Tests using our forecasting system can be converted simultaneously to many traditional hardcopy test results and correlate exceptionally well with hardcopy Mini-Cog, SPMSQ, MMSE, SLUMS, and CASI, significantly decreasing the difficulty of conducting multiple tests.

3.2. Effectiveness analysis of MCI forecasting system

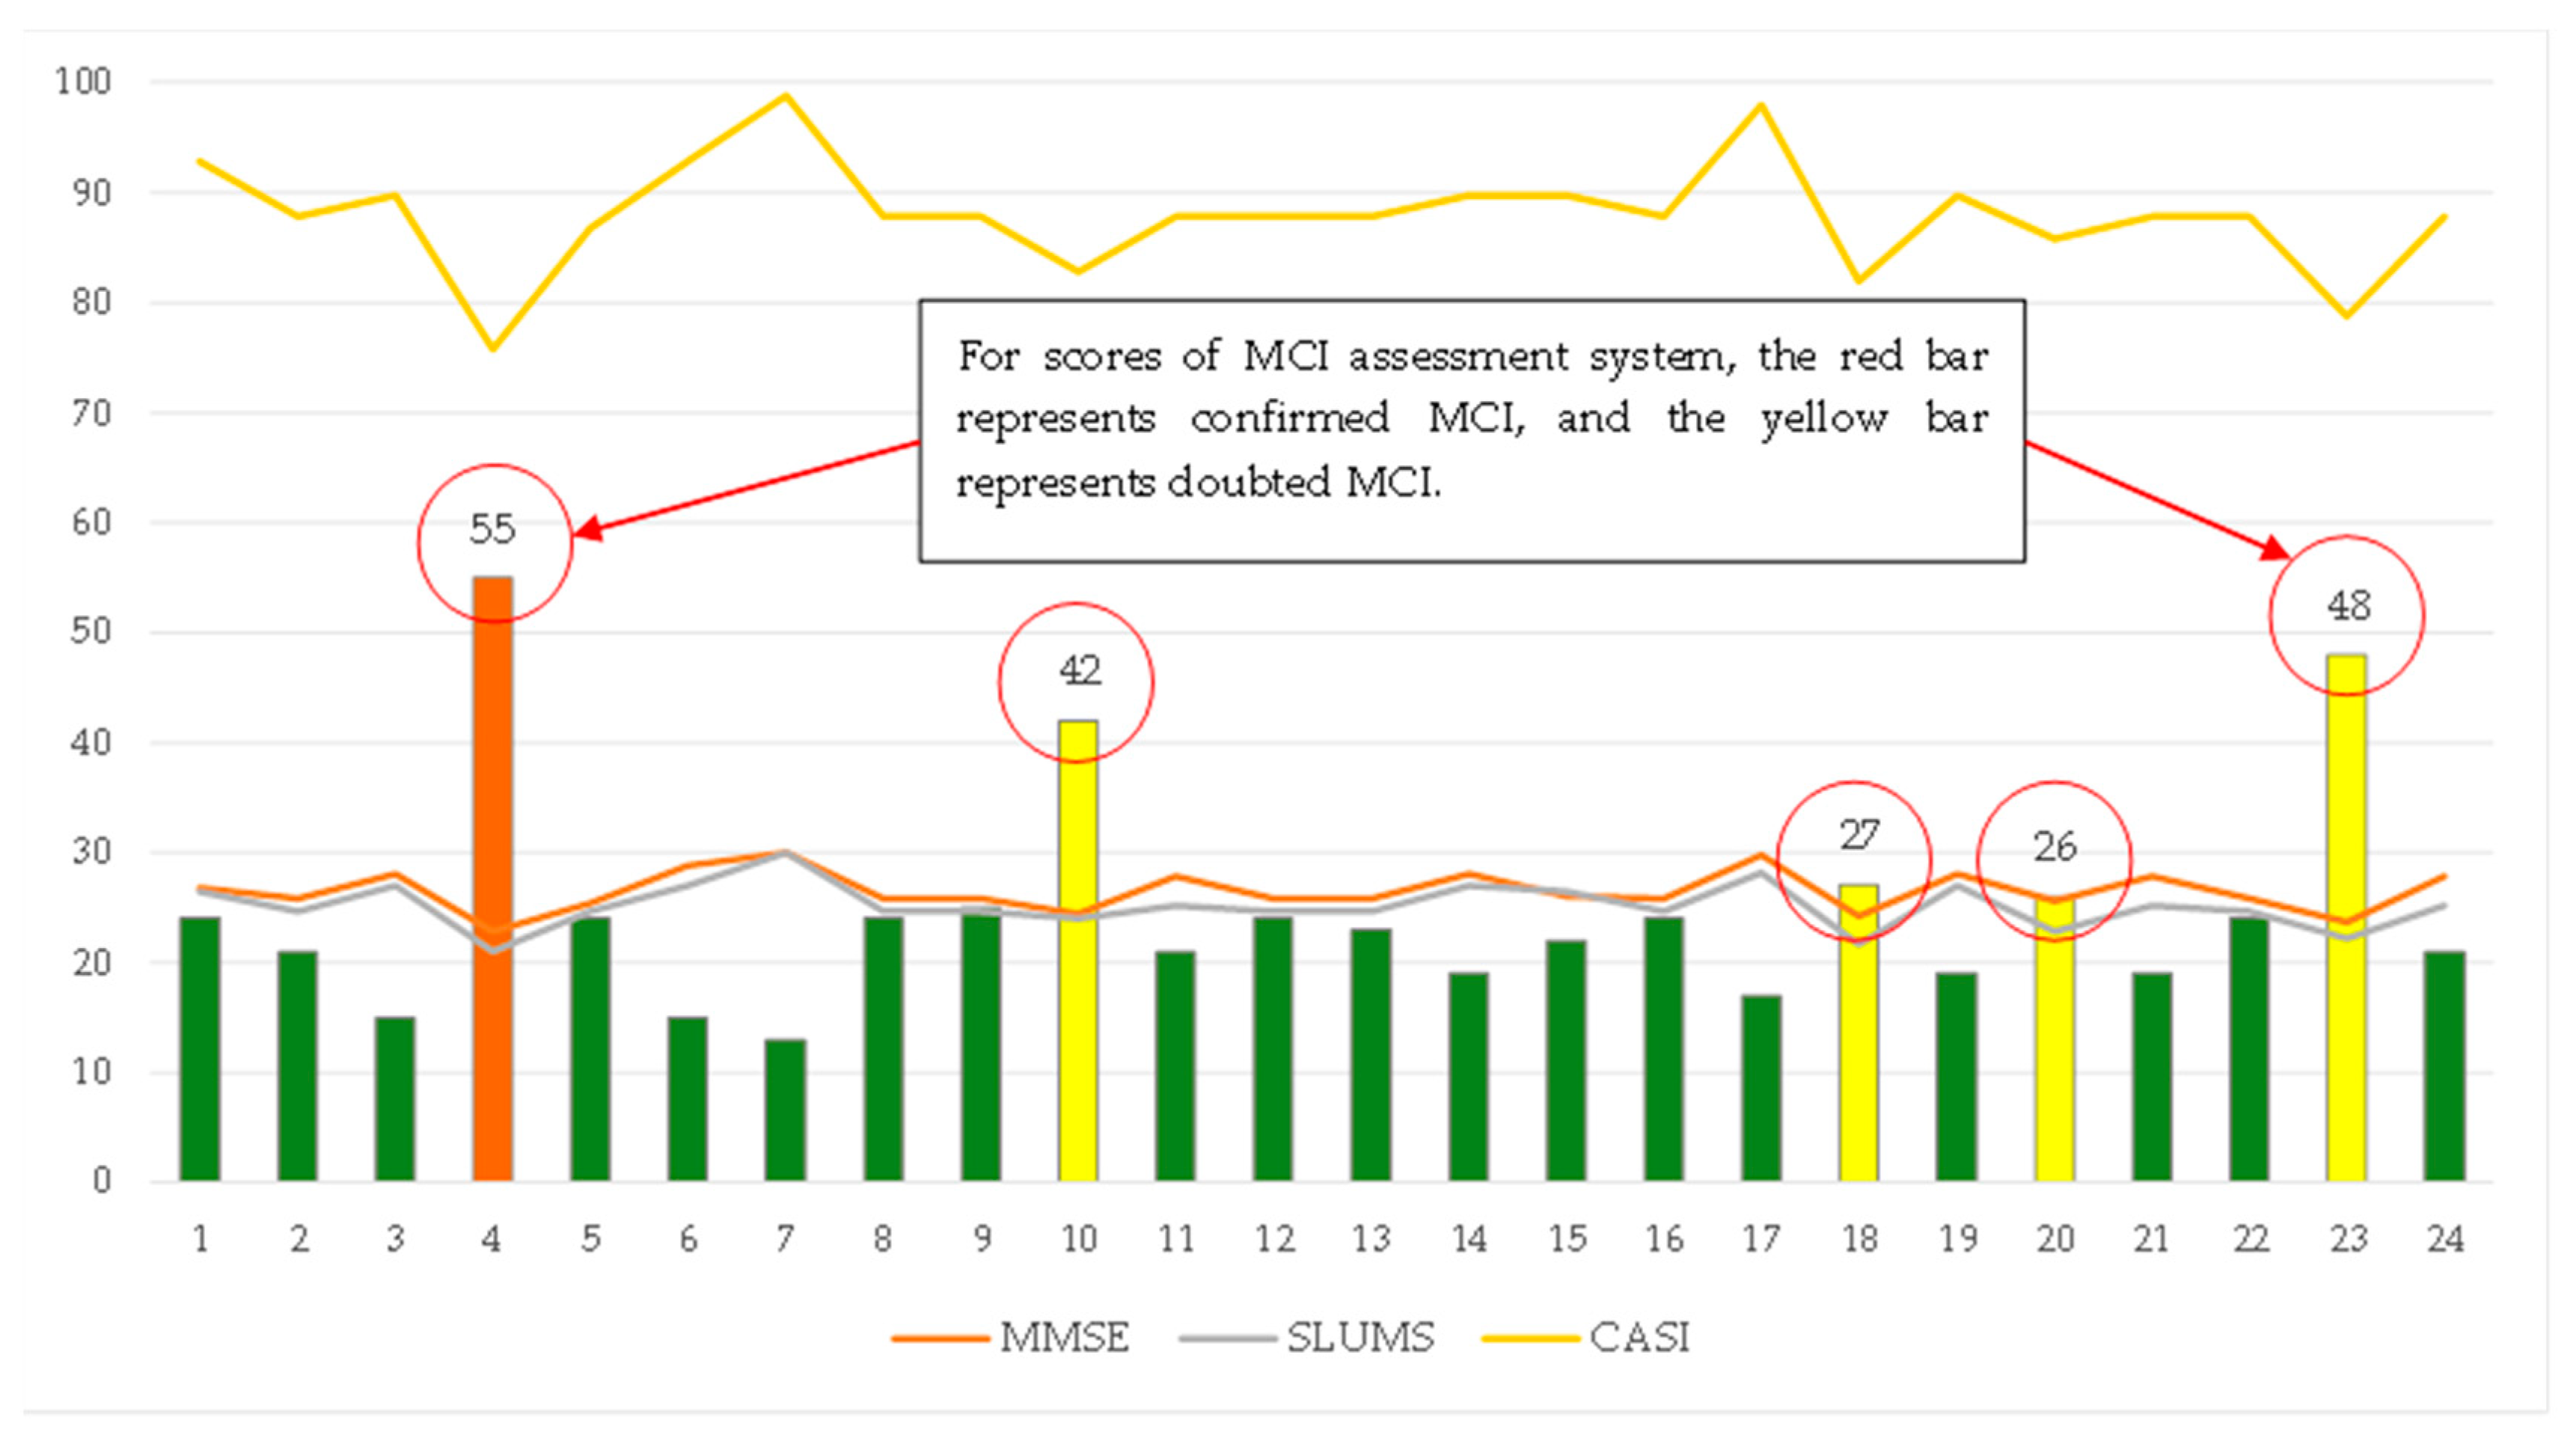
Table 4 shows the comparative analysis of the “MCI forecasting system” test and hardcopy tests. Orange areas in the table showed that the test met MCI criteria. The experiment results showed that the criteria for MCI symptoms were simultaneously met in the "MCI forecasting system" test and traditional hardcopy tests for subjects No. 4, 10, and 23, showing that it is almost confirmed that these three subjects have MCI and may even have AD symptoms. These subjects were recommended to undergo further evaluation in a medical institution or undergo related medical measures. Subject No. 20 had suspected MCI results in the traditional Mini-Cog and CDR, and the corresponding Mini-Cog and SLUMS results of this forecasting system showed suspected MCI. This result showed that the subject may be close to the cutoff for MCI, and further follow-up is required. It is recommended that the subject undergoes another test after 2-3 weeks to confirm whether the symptoms are present or to go to a medical institution to assess disease progression.
Table 4 also shows that most subjects have highly suspected MCI results for SLUMS in the forecasting system. This result showed that the forecasting system might have higher sensitivity in converting SLUMS scores, resulting in the MCI case. At this point, other test scores should be used as a basis for judgment. Generally, the screening analysis results found a high correlation between the MCI forecasting system and traditional hardcopy tests. The forecasting system would also show similar results if multiple traditional hardcopy tests showed that the subject has MCI or AD. If only a few traditional tests showed that the subject has MCI or AD, the forecasting system would also show data for these corresponding tests but with some differences. When there were differences between the forecasting system and traditional hardcopy tests, the subject should be followed up continuously. Overall, the results of this forecasting system are reliable.

3.3. Effectiveness analysis of fuzzy prediction

In order to improve forecasting in the “MCI forecasting system” test, fuzzy logic was used to construct an MCI fuzzy prediction module in this study. This module used the scores of six major assessment tools as membership functions for FLC (Fuzzy Logical Control), and a rule base was used to generate fuzzy inference. The inference engine was used to assess the MCI test results of the subject as normal, doubted, and confirmed. A high fuzzy prediction score means that the subject is incredibly likely to be an MCI patient (line chart results in Figure 17). The objective of the output result is to warn that it can provide a reference value for the tester on time. In particular, if a subject has a situation similar to subject No. 20 occurs in which the test scores between the MCI forecasting system and traditional hardcopy tests are inconsistent: traditional Mini-Cog and CDR demonstrate a result of suspected MCI, but in the forecasting system, the Mini-Cog and SLUMS demonstrate a result of suspected MCI. At that point, the fuzzy prediction score of the forecasting system was 26, which reached the warning threshold for suspected MCI. Therefore, the subject can be judged as a doubted MCI patient. In addition, subject No. 4 had a higher fuzzy prediction score, showing that it is incredibly likely that the subject has MCI. This result also demonstrated the particular function of the MCI forecasting system.

3.4. Effectiveness analysis of fuzzy prediction

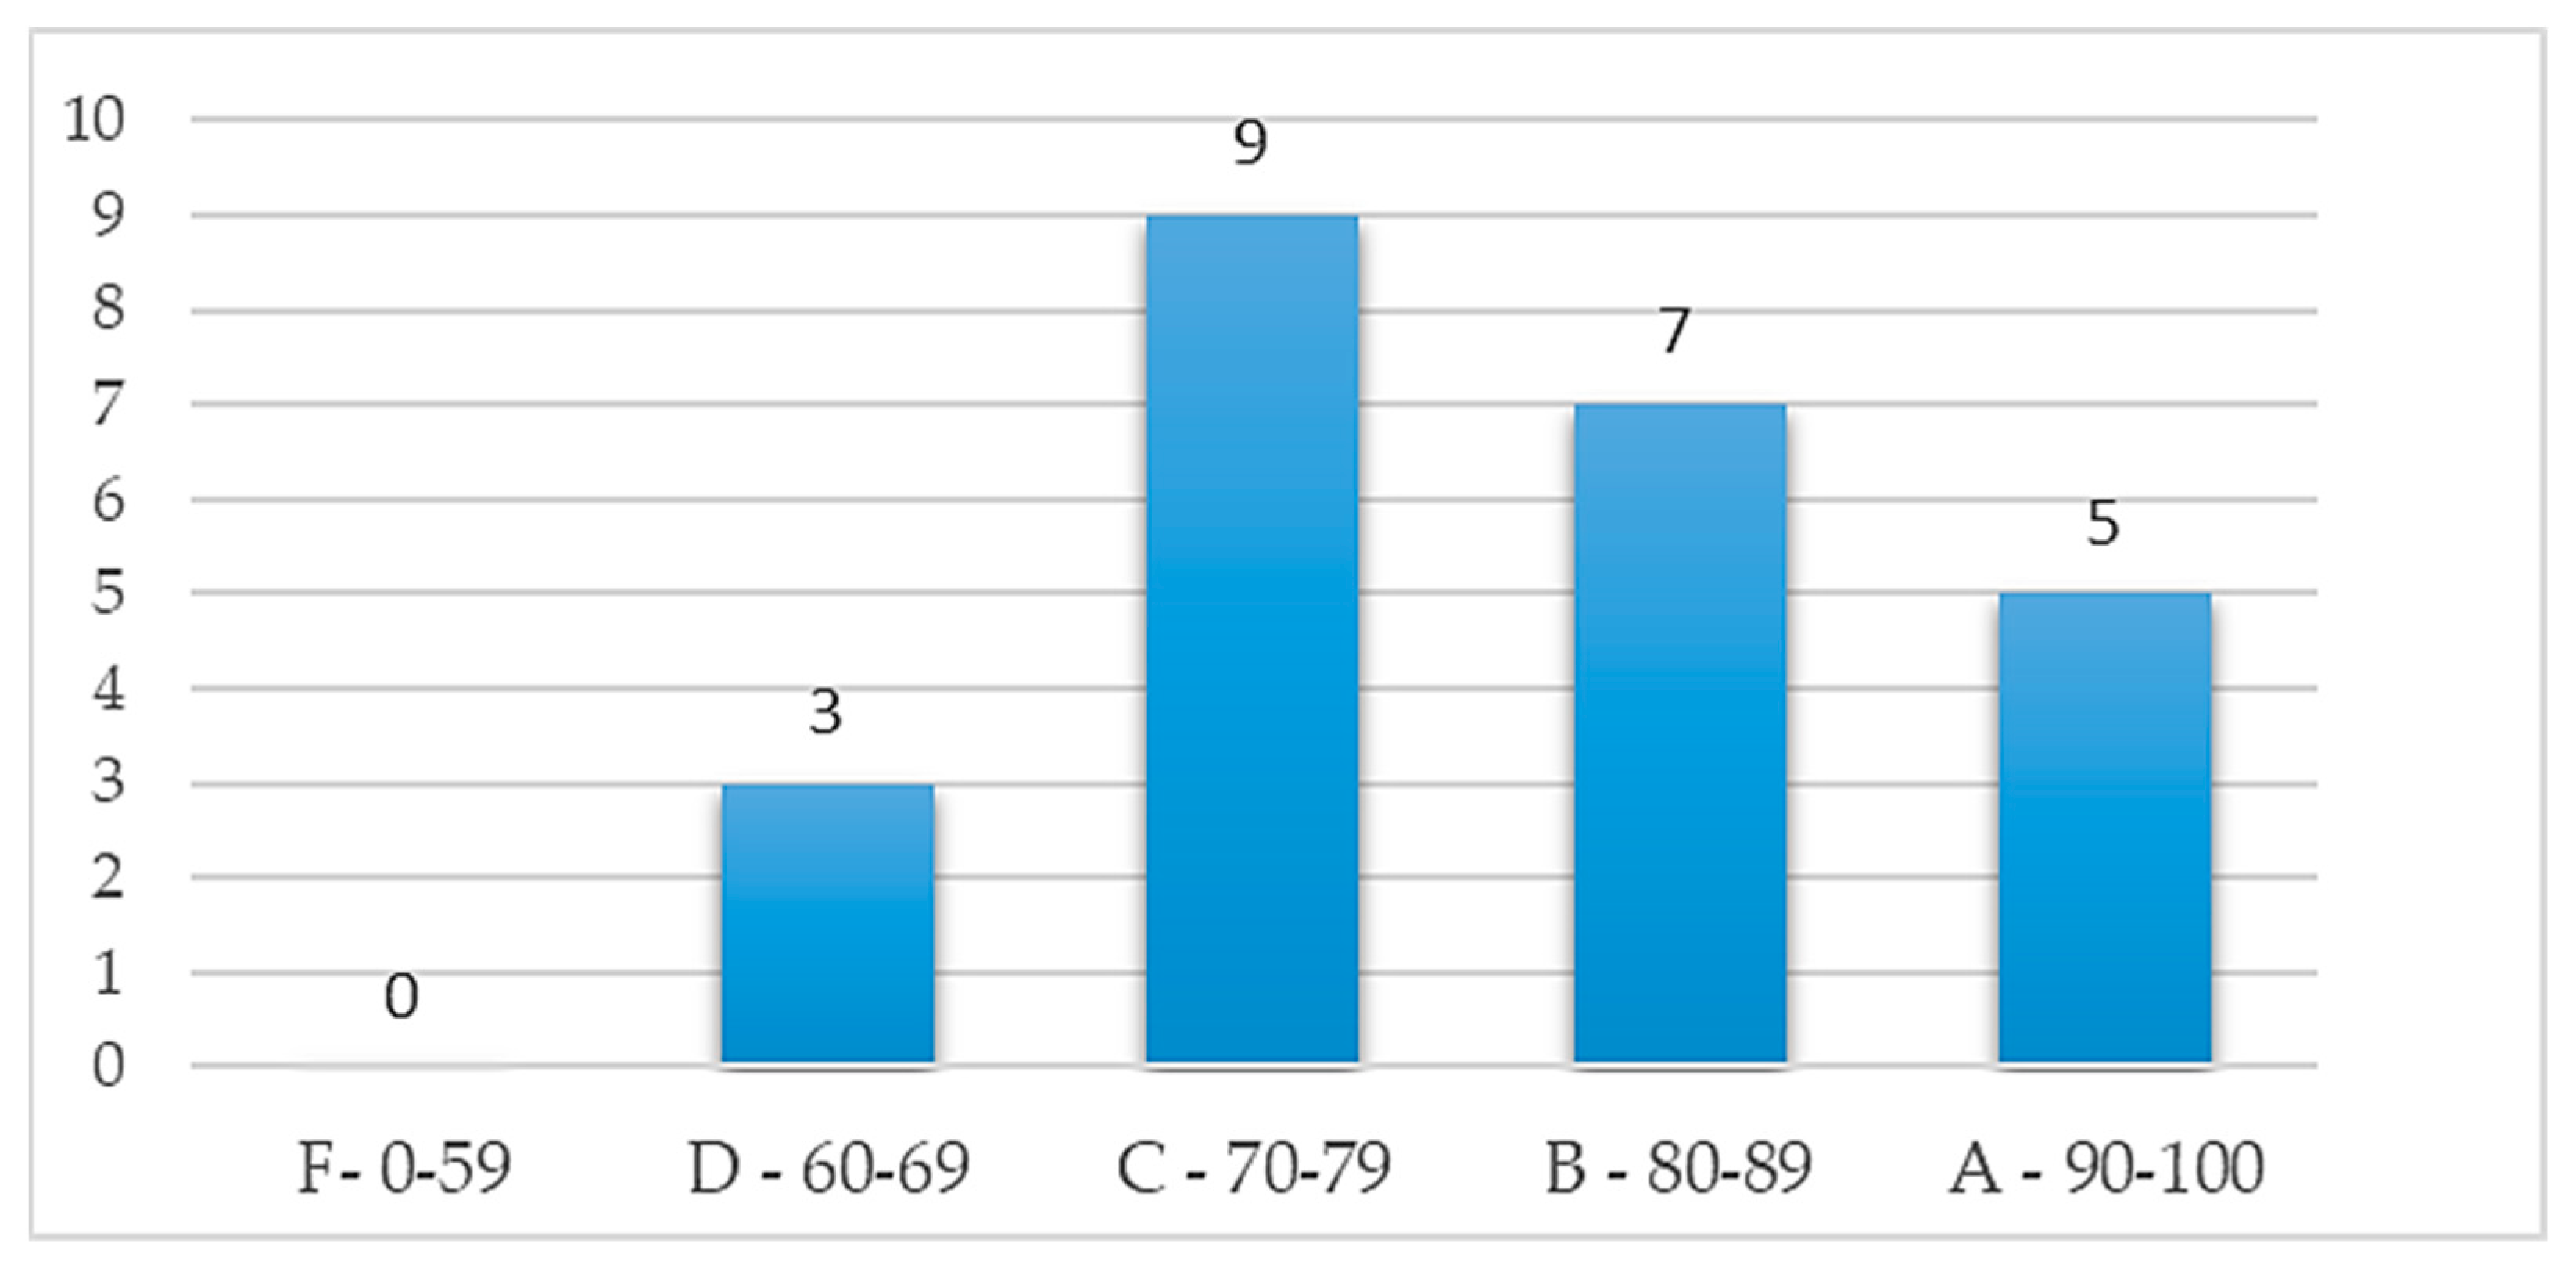
Figure 18 shows the distribution of system usability scale (SUS) evaluation scores for the MCI forecasting system, which found that 87.5% were grade C (good to use) or above, and 29.2% were grade B (extremely good to use) or above. This result shows that the forecasting system has good feedback from the subjects. In addition, Figure 19 shows that the higher the test score (better cognitive function), the greater the usability score. If the MCI screening test is constructed as an entertaining test scenario through a 3D virtual environment, middle-aged to older people may be incentivized and attracted to participate in cognitive screening and subsequent continuous follow-up, thereby obtaining more timely cognition data for identifying cognitive decline. This result is also consistent with the report of Zucchella et al. (2014): 3D virtual games can potentially be new and effective tools in managing and treating cognitive impairments for screening pre-dementia conditions [48]. Therefore, the MCI forecasting system has significant advantages by using an entertaining method for dementia screening, such as saving time and costs, and providing multiple screening records. Additionally, using dynamic scenario change design to prevent subjects from being affected by prior learning effects.

4. Conclusions

The world has become an aging society. With the rapid increase in middle-aged to older people, dementia has become an increasingly severe global public health problem. MCI is a condition characterized by a decline in brain function and is often an early sign of dementia. Currently, hardcopy questionnaires are mainly used for the evaluation of dementia signs in middle-aged to older people. However, there are some limitations of current screening methods. The test process is often unsuccessful, resulting in differences in test results. In addition, there may be resistance from the subject if he/she has to undergo many screening tests simultaneously, resulting in execution difficulty. This study employed VR technology and fuzzy logic control (FLC) to integrate Mini-Cog, SPMSQ, MMSE, SLUMS, CDR, and CASI into an image “MCI forecasting system.” The study results showed that the MCI forecasting system is a strong correlation with traditional hardcopy Mini-Cog, SPMSQ, MMSE, SLUMS, and CASI tests, of which MMSE and CASI had a very strong correlation, but its correlation with CDR was moderate. Furthermore, the fuzzy forecasting system can provide an MCI-integrated reference score. When the test score of the subject is inconsistent with the corresponding tests, the reference score can provide an integrated judgment to reduce confusion to achieve the objective of warning. In addition, concerning usability, the forecasting system was positively received by subjects. If the MCI forecasting system by using an entertaining method for dementia screening, middle-aged to older people may be incentivized and attracted to participate in cognitive screening and subsequent continuous follow-up, thereby obtaining more timely cognition data for the identification of cognitive decline. Therefore, there are significant advantages to using an entertaining method for MCI screening, such as saving time and costs, and multiple screening records to decrease psychological stress. Lastly, as the MCI forecasting system needs to be performed on a computer, there will be hardware requirements if used for testing.

Author Contributions

Conceptualization, C.-L.L.; methodology, C.-L.L.; software, C.-L.L.; validation, C.-L.L. and C.-J.C.; formal analysis, C.-L.L.; investigation, C.-J.C.; resources, C.-L.L., C.-J.C and C.-M.C.; data curation, C.-L.L.; writing—original draft preparation, C.-L.L., C.-J.C and C.-M.C.; writing—review and editing, C.-L.L., C.-J.C and C.-M.C.; visualization, C.-L.L., C.-J.C and C.-M.C.; supervision, C.-L.L. and C.-J.C.; project administration, C.-L.L.; funding acquisition, C.-L.L. All authors have read and agreed to the published version of the manuscript.

Funding

This research was funded by the National Science and Technology Council of Taiwan, grant numbers MOST 109-2221-E-238-001.

Institutional Review Board Statement

The study was conducted according to the guidelines of the Declaration of Helsinki, and ap-proved by the Research Ethics Committee for Human Subject Protection of National Chiao Tung University (No: NCTU-REC-109-058E, 27 July, 2020).

Informed Consent Statement

Informed consent was obtained from all subjects involved in the study.

Data Availability Statement

The data presented in this study are available on request from the corresponding author. The data are not publicly available due to privacy reasons.

Acknowledgments

All the participants are gratefully acknowledged. The authors also gratefully acknowledge the financial support for this work from the National Science and Technology Council of Taiwan, R.O.C.

Conflicts of Interest

The authors declare no conflict of interest. The funders had no role in the design of the study; in the collection, analyses, or interpretation of data; in the writing of the manuscript; or in the decision to publish the results.

References

  1. Nuckols, C.C. Diagnostic and Statistical Manual of Mental Disorders, Fifth Edition. VA, United States: American Psychiatric Association Publishing 2013.
  2. World Alzheimer Report. The global impact of dementia: An analysis of prevalence, incidence, cost and trends. Alzheimer's Disease International, September, 2015: https://www.alzint.org/resource/world-alzheimer-report-2015/.
  3. Matej, R.; Tesar, A.; Rusina, R. Alzheimer's disease and other neurodegenerative dementias in comorbidity: A clinical and neuropathological overview. Clinical Biochemistry 2019, 73, 26–31. [Google Scholar] [CrossRef]
  4. Torres-Berrio, A.; Nava-Mesa, M.O. The opioid system in stress-induced memory disorders: From basic mechanisms to clinical implications in post-traumatic stress disorder and Alzheimer's disease. Progress in Neuro-Psychopharmacology & Biological Psychiatry 2019, 88, 327–338. [Google Scholar]
  5. WHO report. Dementia, 19 September 2019: https://www.who.int/news-room/fact-sheets/detail/dementia.
  6. Crook, T.; Bartus, R.T.; Ferris, S.H.; Whitehouse, P.; Cohen, G.D.; Gershon, S. Age-associated memory impairment: Proposed diagnostic criteria and measures of clinical change - report of a national institute of mental health work group. Developmental Neuropsychology 1986, 2, 261–276. [Google Scholar] [CrossRef]
  7. Levy, R. ; Working Party of the International Psychogeriatric Association. Aging-associated cognitive decline. International Psychogeriatrics 1994, 6, 63. [Google Scholar]
  8. Reisberg, B.; Ferris, S.H.; DeLeon, M.J.; Crook, T. The global deterioration scale for assessment of primary degenerative dementia. The American Journal of Psychiatry 1982, 139, 1136–1139. [Google Scholar]
  9. Petersen, R.C.; Roberts, R.O.; Knopman, D.S.; Boeve, B.F.; Geda, Y.E.; Ivnik, R.J.; Smith, G.E.; Jack Jr, C.R. Mild cognitive impairment: ten years later. Arch Neurol 2009, 66, 1447–1455. [Google Scholar] [CrossRef]
  10. Rossetto, F.; Castelli, I.; Baglio, F.; Massaro, D.; Alberoni, M.; Nemni, R.; Shamay-Tsoory, S.; Marchetti, A. Cognitive and affective theory of mind in mild cognitive impairment and parkinson's disease: preliminary evidence from the italian version of the yoni task. Developmental Neuropsychology 2018, 43, 764–780. [Google Scholar] [CrossRef]
  11. Qi, H.H.; Liu, H.; Hu, H.M.; He, H.J.; Zhao, X.H. Primary disruption of the memory-related subsystems of the default mode network in alzheimer's disease: resting-state functional connectivity MRI study. Frontiers in Aging Neuroscience 2018, 10. [Google Scholar] [CrossRef]
  12. Gosztolya, G.; Vincze, V.; Toth, L.; Pakaski, M.; Kalman, J.; Hoffmann, I. Identifying Mild Cognitive Impairment and mild Alzheimer's disease based on spontaneous speech using ASR and linguistic features. Computer Speech and Language 2019, 53, 181–197. [Google Scholar] [CrossRef]
  13. Petersen, R.C.; Caracciolo, B.; Brayne, C.; Gauthier, S.; Jelic, v.; Fratiglioni, L. Mild cognitive impairment: a concept in evolution. Journal of Internal Medicine 2014, 275, 214–228. [Google Scholar] [CrossRef]
  14. Huang, Y.H. What is Mild Cognitive Impairment? Chang Gung Medical News 2018, 39(10), 28–29. [Google Scholar]
  15. Wang, P.; Lirng, J.; Lin, K.; Chang, F.; Liu, H. Prediction of Alzheimer’s disease in mild cognitive impairment: a prospective study in Taiwan. Neurobiology of Aging 2006, 27, 1797. [Google Scholar] [CrossRef]
  16. Johnson, K.A.; Fox, N.C.; Sperling, R.A.; Klunk, W.E. Brain imaging in Alzheimer’s disease. Cold Spring Harbor Perspectives in Medicine 2012, 2, a006213. [Google Scholar] [CrossRef]
  17. Karas, G.B.; Burton, E.J.; Rombouts, S.A.R.B.; van Schijndel, R.A.; O’Brien, J.T.; Scheltens, P.; Barkhof, F. A comprehensive study of gray matter loss in patients with Alzheimer’s disease using optimized voxel-based morphometry. Neuroimage 2003, 18, 895–907. [Google Scholar] [CrossRef]
  18. Pantel, J.; Schonknecht, P.; Essing, M.; Schoder, J. Distribution of cerebral atrophy assessed by magnetic resonance imaging reflects patterns of neuropsychological deficits in Alzheimer’s dementia. Neuroscience Letters 2004, 361, 17–20. [Google Scholar] [CrossRef]
  19. National Institute for Health and Clinical Excellence. Dementia: Quick Reference Guide.
  20. Schroeter, M.L.; Stein, T.; Maslowski, N.; Neumann, J. Neural correlates of Alzheimer's disease and mild cognitive impairment: A systematic and quantitative meta-analysis involving 1,351 patients. NeuroImage 2009, 47, 1196–206. [Google Scholar] [CrossRef]
  21. Flier, W.M.; Salloway, S.; Frisoni, G.B.; Strooper, B.; Breteler, M.M.B.; Blennow, K.; Scheltens, P. Alzheimer's disease. The Lancet 2016, 388, 505–517. [Google Scholar]
  22. Borson, S.; Scanlan, J.; Brush, M.; Vitaliano, P.; Dokmak, A. The Mini-Cog: a cognitive ‘vital signs’ measure for dementia screening in multi-lingual elderly. Int J Geriatr Psychiatry 2000, 15, 1021–1027. [Google Scholar] [CrossRef]
  23. Joyce, E.; Howell, E.H.; Senapati, A.; Starling, R.C.; Gorodeski, E.Z. Prospective assessment of combined handgrip strength and Mini-Cog identifies hospitalized heart failure patients at increased post-hospitalization risk. Esc Heart Failure 2018, 949–953. [Google Scholar] [CrossRef]
  24. Chan, C.C.H.; Fage, B.A.; Burton, J.K.; Smailagic, N.; Gill, S.S.; Herrmann, N.; Nikolaou, V.; Quinn, T.J.; Noel-Storr, A.H.; Seitz, D.P. Mini-Cog for the diagnosis of Alzheimer’s disease dementia and other dementias within a secondary care setting. Cochrane Database of Systematic Reviews 2019, CD011414. [Google Scholar] [CrossRef]
  25. Pfeiffer, F. A short portable mental status questionnaire for the assessment of organic brain deficit in elderly patients. Journal of the American Geriatrics Society 1975, 23, 433–441. [Google Scholar] [CrossRef] [PubMed]
  26. Malhotra, C.; Chan, A.; Matchar, D.; Seow, D.; Chuo, A.; Do, Y.K. Diagnostic performance of short portable mental status questionnaire for screening dementia among patients attending cognitive assessment clinics in Singapore. Annals Academy of Medicine Singapore 2013, 42, 315–319. [Google Scholar] [CrossRef]
  27. Folstein, M.; Folstein, S.E.; McHugh, P. Mini-mental state: a practical method for grading the cognitive state: a practical method for grading the cognitive state if patient for the clinical. Journal of Psychiatric Research 1975, 12, 12,189–198. [Google Scholar]
  28. Mahendran, R.; Chua, J.; Feng, L.; Kua, E.H.; Preedy, V.R. Chapter 109 - The Mini-Mental State Examination and Other Neuropsychological Assessment Tools for Detecting Cognitive Decline. In Diet and Nutrition in Dementia and Cognitive Decline; Martin, C.R., Preedy, V.R., Eds.; London: Academic Press 2015, Pages 1159-1174. [Google Scholar]
  29. Morley, J.E.; Tumosa, N. Saint Louis University Mental Status Examination (SLUMS). Aging Successfully 2002, XII, 4. [Google Scholar]
  30. Zheng, D.; Dong, X.; Sun, H.; Xu, Y.; Ma, Y.; Wang, X. The overall impairment of core executive function components in patients with amnestic mild cognitive impairment: a cross-sectional study. BioMed Central Neurology 2012, 12, 138. [Google Scholar] [CrossRef] [PubMed]
  31. Kaya, D.; Isik, A.T.; Usarel, C.; Soysal, P. Ellidokuz, H.; Grossberg, G.T. The saint louis university mental status examination is better than the mini-mental state examination to determine the cognitive impairment in turkish elderly people. Journal of The American Medical Directors Association 2016, 17, 370.e11-5. [Google Scholar] [CrossRef] [PubMed]
  32. Hughes, C.P.; Berg, L.; Danziger, W.L.; Coben, L.A.; Martin, R.L. A new clinical scale for the staging of dementia. Br J Psychiatry 1982, 140, 566–72. [Google Scholar] [CrossRef]
  33. Morris, J.C. The clinical dementia rating (CDR): current version and scoring rules. Neurology 1993, 43, 2412–2414. [Google Scholar] [CrossRef]
  34. Kim, J.W.; Byun, M.S.; Sohn, B.K.; Yi, D.; Seo, E.H.; Choe, Y.M.; Kim, S.G.; Choi, H.j.; Lee, J.H.; Chee, I.S.; Woo, J.I.; Lee, D.Y. Clinical dementia rating orientation score as an excellent predictor of the progression to alzheimer’s disease in mild cognitive impairment. Psychiatry Investing 2017, 14, 420–426. [Google Scholar] [CrossRef]
  35. Teng, E.L.; Hasegawa, K.; Homma, A.; Imai, Y.; Larson, E.; Graves, A.; Sugimoto, K.; Yamaguchi, T.; Sasaki, H.; Chiu, D. The Cognitive Abilities Screening Instrument (CASI): a practical test for cross-cultural epidemiological studies of dementia. Int Psychogeriatr 1994, 6, 45–58. [Google Scholar] [CrossRef]
  36. Boletsis, C.; McCallum, S. Connecting the player to the doctor: utilising serious games for cognitive training & screening. DAIMI PB 2015, 597, 5–8. [Google Scholar]
  37. Zadeh, L.A. Fuzzy Sets. Information Control 1965, 8, 338–353. [Google Scholar] [CrossRef]
  38. Bellman, R.E.; Zadeh, L.A. Decision making in a fuzzy environment. Management Science 1970, 17, 141–164. [Google Scholar] [CrossRef]
  39. Bonner, M. F.; Price, A.R. Where is the anterior temporal lobe and what does it do? Journal of Neuroscience 2013, 33, 4213–4215. [Google Scholar] [CrossRef]
  40. Marquié, M.; Castilla-Martí, M.; Valero, S.; et al. Visual impairment in aging and cognitive decline: experience in a Memory Clinic. Scientific Report 2019, 9, 8698. [Google Scholar] [CrossRef] [PubMed]
  41. Claus, J. J.; Mohr, E. Attentional deficits in Alzheimer's, Parkinson's, and Huntington's diseases. Acta Neurol Scand 1996, 93, 346–51. [Google Scholar] [CrossRef] [PubMed]
  42. Ala, T.A; Hughes, L.F.; Kyrouac, G.A.; Ghobrial, M.W. Elble, R.J. The Mini-Mental State exam may help in the differentiation of dementia with Lewy bodies and Alzheimer's disease. International Journal of Geriatric PsychiatryVolume 2002, 17, 503–509. [Google Scholar] [CrossRef]
  43. Capucho, P.H.F.V.; Brucki, S.M.D. ; Judgment in Mild Cognitive Impairment and Alzheimer's disease. Dement Neuropsychol 2011, 5, 297–302. [Google Scholar] [CrossRef]
  44. Li, X.-Y.; Zhang, Y.-Y.; Feng, L.; Meng, Q.-H. Early event-related potentials changes during simple mental calculation in Chinese older adults with mild cognitive impairment: A case–control study. Neuroscience Letters 2010, 475, 29–32. [Google Scholar] [CrossRef]
  45. Chung, J.-Y.; Yoon, H.-J; Kim, H.; Choi, K.Y.; Lee, J.J.; Lee, K.H.; Seo, E.H. Reversion from mild cognitive impairment to normal cognition: false-positive error or true restoration thanks to cognitive control ability? Neuropsychiatric Disease and Treatment 2019, 15, 3021–3032. [Google Scholar] [CrossRef]
  46. Brooke, J. SUS: A "quick and dirty" usability scale. In Usability Evaluation in Industry; Jordan, P.W., Thomas, B., Weerdmeester, B.A., McClelland, A.L., Eds.; London: Taylor and Francis, 1986. [Google Scholar]
  47. Bangor, A.; Kortum, P.; Miller, J. Determining what individual SUS scores mean: Adding an adjective rating scale. Journal of usability studies 2009, 4, 114–123. [Google Scholar]
  48. Zucchella, C.; Sinforiani, E.; Tassorelli, C.; Cavallini, E.; Tost-Pardell, D.; Grau, S. Serious games for screening pre-dementia conditions: from virtuality to reality? A pilot project. Funct Neurol 2014, 29, 153–158. [Google Scholar] [PubMed]
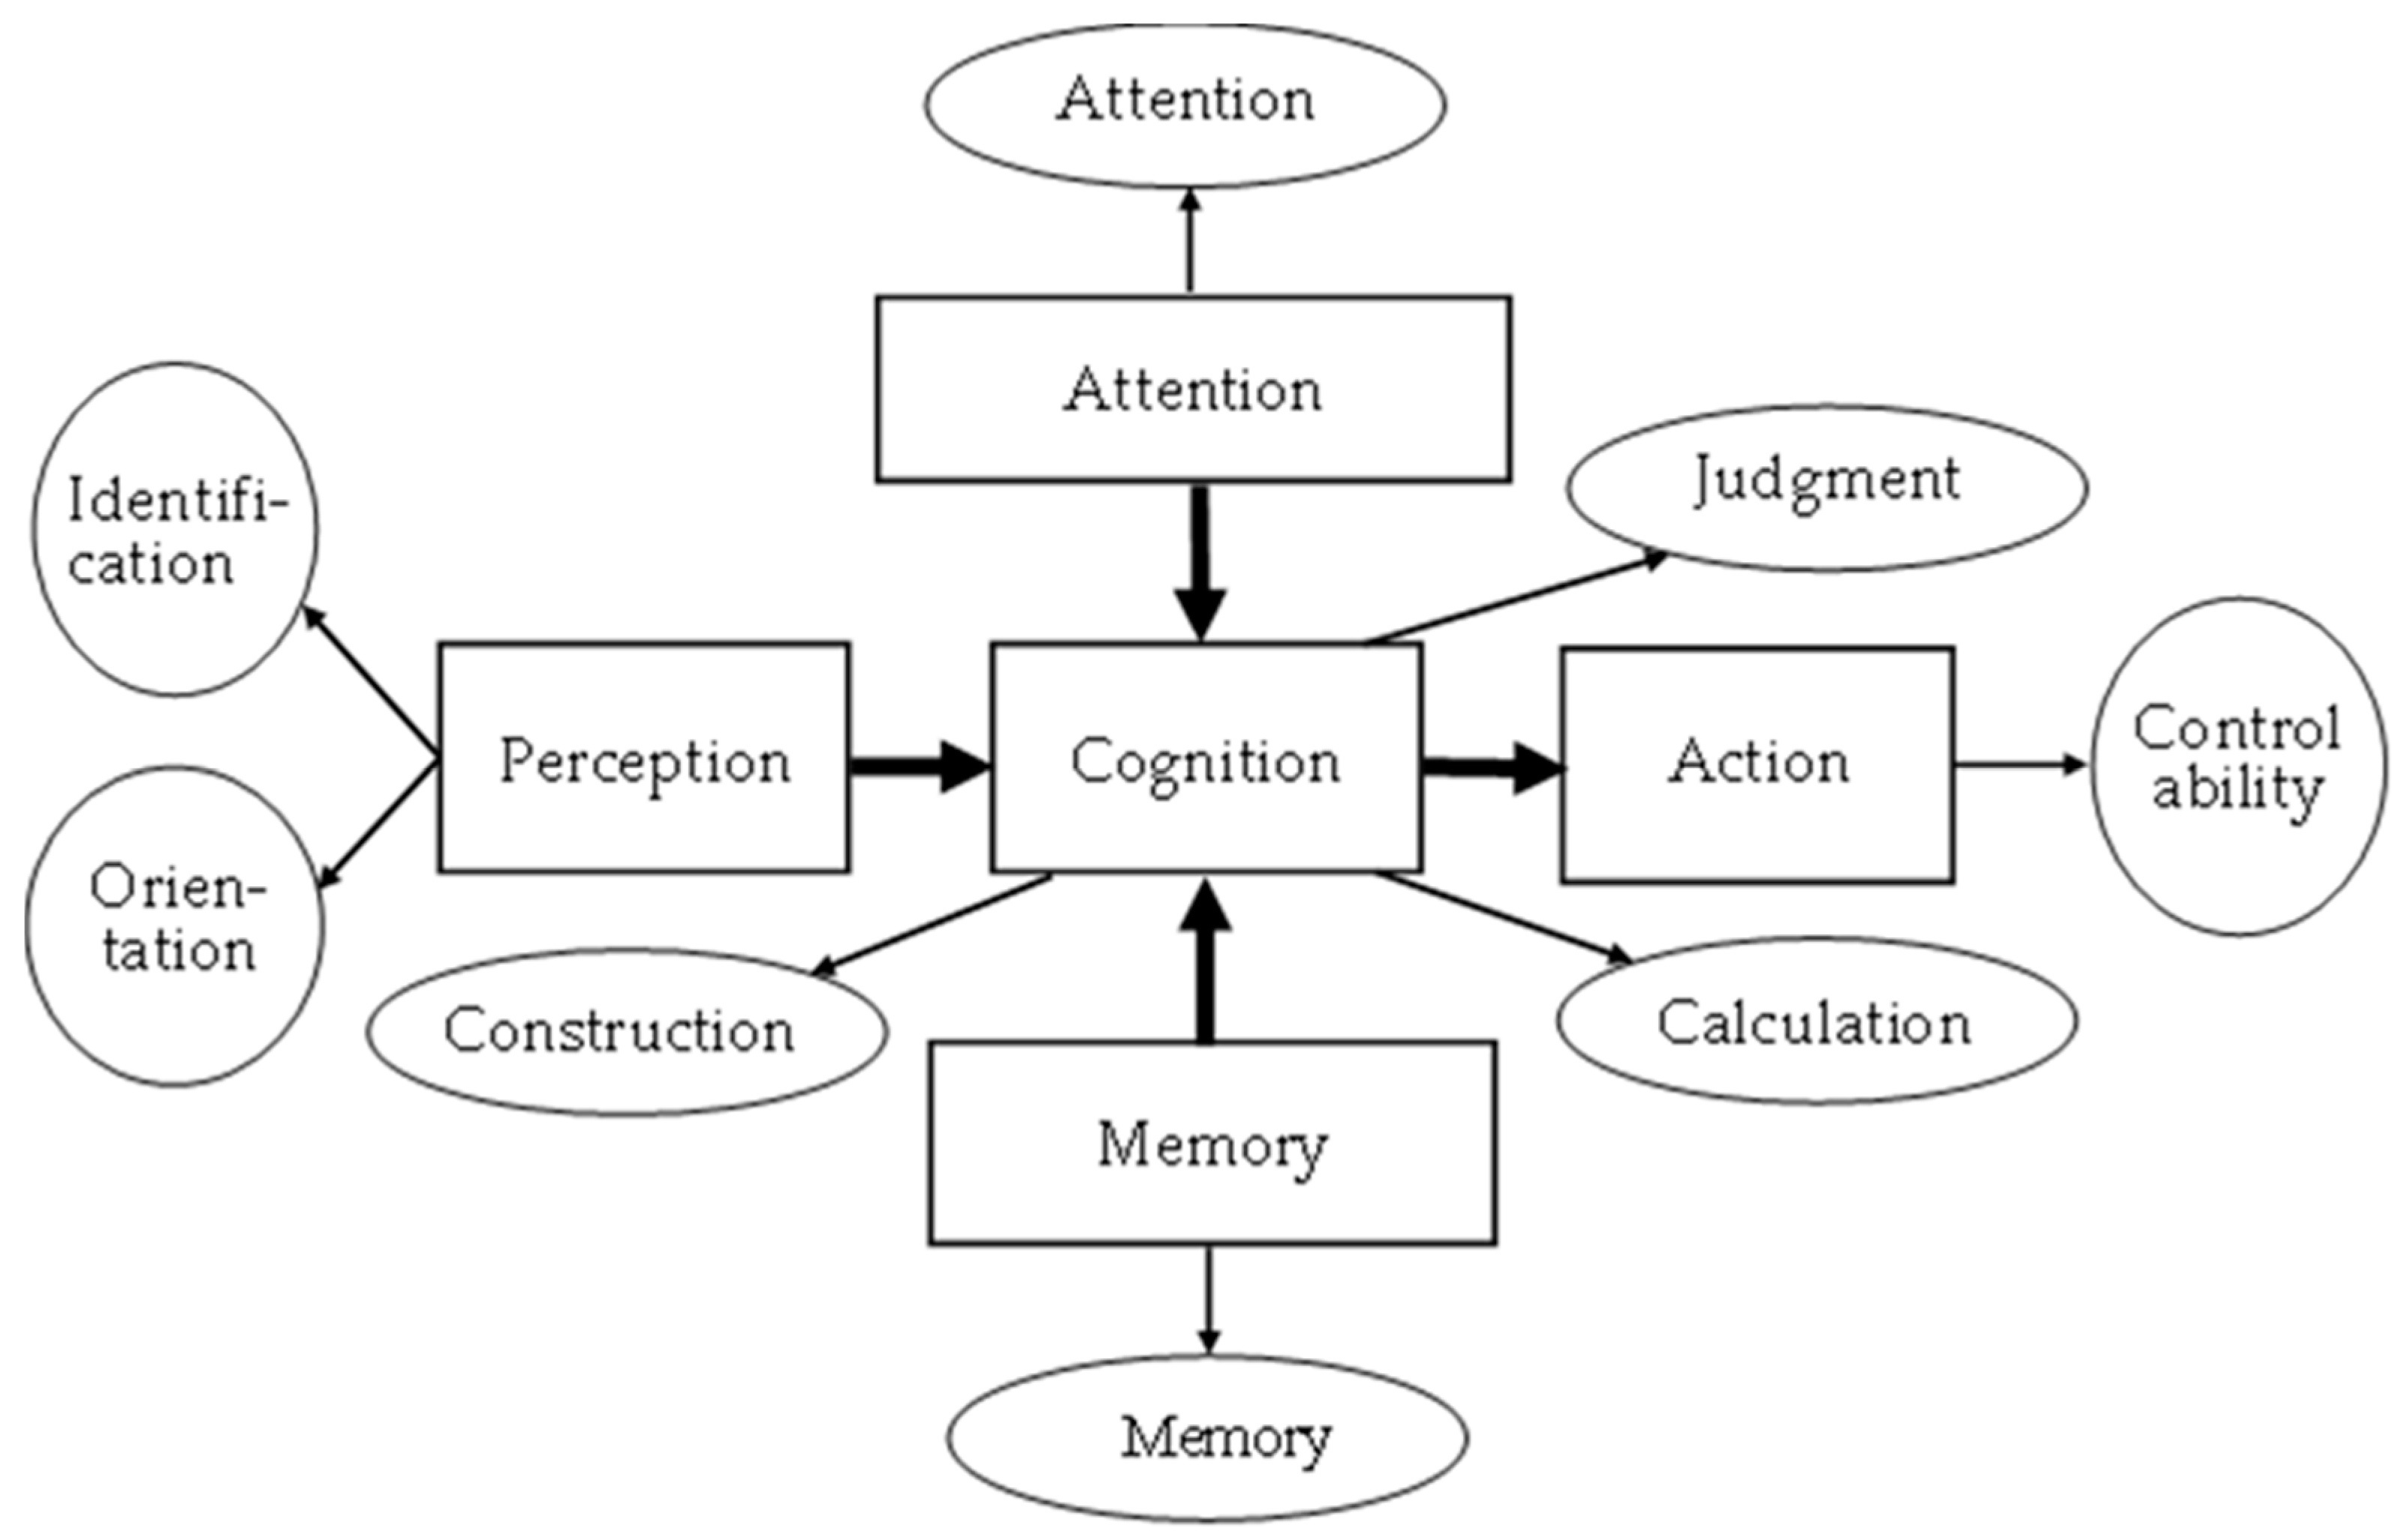
Figure 1. Relationship between eight major mild cognitive impairment tests (circle mark) and human information processing functions (square mark).
Preprints 80071 g001
Figure 2. Framework of the Mild cognitive impairment (MCI) forecasting system.
Preprints 80071 g002
Figure 3. MCI foresting system-startup screen.
Preprints 80071 g003
Figure 4. MCI testing center-entrance screen.
Preprints 80071 g004
Figure 5. When entering the orientation test, an operation prompt would appear and remind the subjects to pay attention to the appearance of the Mona Lisa painting.
Preprints 80071 g005
Figure 6. There are four types of orientation tests: (a) Chinese zodiac testing: clicking on the Chinese zodiac sign of this year; (b) Season test: rotating the arrow to confirm the current season; (c) Month test: clicking the current month; (d) Week test: clicking the day of the week today.
Preprints 80071 g006
Figure 7. (a) When the “time” tests are underway, the Mona Lisa painting will appear; (b) The subject must click the location number of the Mona Lisa painting on the map.
Preprints 80071 g007
Figure 8. When entering the orientation test, three types of tests should be completed: (a) Language expression test (total of five questions), e.g., clicking what cannot be eaten; (b) Image recognition test (total of two questions), e.g., clicking the image of a knife; (c) Language comprehension test (total of two questions), e.g., selecting the action of clapping.
Preprints 80071 g008
Figure 9. When entering the memory test, two questions should be completed, such as fruit image memory: (a) A fruit drawing appears for 5 s before disappearing; (b) A fruit list appears, and the subject must select the fruit that had just appeared.
Preprints 80071 g009
Figure 10. When the short-term memory tests are finished, five questions should be completed, such as selecting the current president.
Preprints 80071 g010
Figure 11. When entering the attention test, five questions should be completed, such as graphics in painting: (a) A triangle drawing appears for 5 s before disappearing; (b) A shape list appears, and the subject must select the shape that just appeared.
Preprints 80071 g011
Figure 12. Four questions should be completed when entering the construction test, such as the composition of Mickey mouse images: (a) A Mickey mouse drawing appears for 5 s before disappearing; (b) A shape list appears, and the subject must select the shape that just appeared.
Preprints 80071 g012
Figure 13. When entering the judgment test, three questions should be completed, such as judgment of clock time display: the subject selects the correct clock showing 10:10.
Preprints 80071 g013
Figure 14. The subject enters the calculation assessment room, and five questions should be completed, such as calculating the number of fish.
Preprints 80071 g014
Figure 15. Three questions should be completed in the control ability test. When the subject enters the control ability assessment room, he/she will first see a display shelf with a cube. The subject must use the mouse to rotate the cube to the designated color (red) cube. The subject is considered to fail if reaction time exceeds 20 s.
Preprints 80071 g015
Figure 16. Output display of testing result.
Preprints 80071 g016
Figure 17. Distribution map of MCI forecasting system fuzzy prediction scores and hardcopy test scores.
Preprints 80071 g017
Figure 18. Distribution graph of usability grads.
Preprints 80071 g018
Figure 19. Correlation between usability use score and test scores.
Preprints 80071 g019
Table 1. Assignment table of assessment items conversion to various screening tools.
Stage Dimension Sub-Item Content Mini-Cog SPMSQ MMSE SLUMS CDR CASI
Perception Orientation 1. Orientation 1. Temporal orientation:
 (1) Zodiac sign?
 (2) What season is it?
 (3) What month is it?
 (4) What day of the week is it?
2. Spatial orientation: where is the Mona Lisa painting?
Number of correct answers 2–10 0.6–3 1. 1 point: 2 or 3 wrong answers;
2 points: 4 or 5 wrong answers
2. 0.5 points: wrong answer
Identification 1. Language expression 1.    cannot be consumed (images: apple, bottle, pear)
2. Closed_(images: hands, eyes, pants)
3. I want to ride in a/an (images: mobile phone, airplane, camera)
4. I    to eat (words: want, see, drink)
5. I walk    (words: home, recollection, family)
0.4
0.4
0.4
0.4
0.4
- - 1
1
1
1
1
2. Image recognition 1. Images (toys, knives, tools); select the knife
2. Images (television, fan, refrigerator); select the television
- 0.5 points: 1 or 2 wrong answers 2.5
2.5
3. Language comprehension 1. Clapping; select an image (clapping, applause, bringing the palms together)
2. Walking; select an image (jumping, walking, squatting)
0.5
0.5
- 0.5 points: 1 or 2 wrong answers 1.5
1.5
Memory Memory 1. Short-term memory 1. Images of banana, pineapple, watermelon, etc., will appear and the subject is required to select the banana, pineapple, and watermelon from the 5 objects for a total of 2 times.
2. Preprints 80071 i001 Preprints 80071 i002 Preprints 80071 i003 Preprints 80071 i004
After memorizing, shape and color, matching is conducted twice.
1. 1 point for correctly answering all questions
2. 1 point for correctly answering all questions
1.5–6 1. 3–6
2. 3–6
0 points: 4 correct answers;
0.5 points: 3 correct answers;
1 point: 2 or fewer correct answers
5–30
2. Long-term memory 1. Who is the current president of Taiwan? Photographs of Chen Shui-Bian, Ma Ying-Jeou, and Tsai Ing-Wen
2. Place of residence? Maps of Taiwan, Japan, and Hainan Island
3. How many minutes are there in 1 h?
4. How many months are there in 1 year?
5. In which direction does the sun set?
Number of correct answers 0.4–2 0 points: 4 correct answers;
0.5 points: 3 correct answers;
1 point: 2 or fewer correct answers
2–10
Attention Attention 1. Attention 1. Random shapes: determine the shape as △, □, and ○; 5 consecutive times 1 point: 1 or more wrong answer 1.2–6
Cognition Construction 1. Construction 1. How do you draw Mickey Mouse using △, □, and ○?

2. How do you construct
Preprints 80071 i005
using △, □, and ○?

3. How do you construct

Preprints 80071 i006
using △, □, and ○?

4. Label the 2 o’clock and 8 o’clock positions in the image (2 positions).
3 points: All correct answers
2 points: 1 wrong answer
1 point: 2 wrong answers
0 points: 3 or more wrong answers
0.2–1 2.4–12 0 points: 4 correct answers;
0.5 points: 3 correct answers;
1 point: 2 or fewer correct answers
3–15
Judgment 1. Judgment 1. Determine if the time is 10:10
2. What do physicians use? (Images: scalpel, bottle, and wooden rod)
3. What do teachers use? (Images: pot, books, and hammer)
1 point: 2 wrong answers or more 2–6
Calculation 1. Calculations 1. How many fish are there in total in the tank?
2. What is 3 + the previous answer?
3. What is 3 + the previous answer?
4. What is the previous answer + 3 twice?
5. You used 100 NTD to buy a 30 NTD apple and a 20 NTD orange. How much do you have left?
Number of correct answers 1
1
1
1
1
0.6
0.6
0.6
0.6
0.6
1 point: 3 wrong answers or more 1
1
1
1
1
Action Control ability 1. Control ability 1. Rotate the cube to the front
Preprints 80071 i007
2. Rotate the cube to the front
Preprints 80071 i008
3. Rotate the cube to the front
Preprints 80071 i009
1–3 1 point: 2 wrong answers or more 1–3
Table 2. IF-Then MCI (Normal and Doubted) control rules base.
IF MC SP MM SL CD CA CI IF MC SP MM SL CD CA CI
1 Nor Nor Nor Nor Nor Nor Nor 33 Mild Nor Nor Mild Nor Mild Dou
2 Mild Nor Nor Nor Nor Nor Nor 34 Nor Mild Mild Nor Mild Nor Dou
3 Nor Mild Nor Nor Nor Nor Nor 35 Nor Mild Mild Nor Nor Mild Dou
4 Nor Nor Mild Nor Nor Nor Nor 36 Nor Mild Nor Mild Mild Nor Dou
5 Nor Nor Nor Mild Nor Nor Nor 37 Nor Mild Nor Mild Nor Mild Dou
6 Nor Nor Nor Nor Mild Nor Nor 38 Nor Mild Nor Nor Mild Mild Dou
7 Nor Nor Nor Nor Nor Mild Nor 39 Nor Nor Mild Mild Mild Nor Dou
8 Mild Mild Nor Nor Nor Nor Dou 40 Nor Nor Mild Mild Nor Mild Dou
9 Mild Nor Mild Nor Nor Nor Dou 41 Nor Nor Mild Nor Mild Mild Dou
10 Mild Nor Nor Mild Nor Nor Dou 42 Nor Nor Nor Mild Mild Mild Dou
11 Mild Nor Nor Nor Mild Nor Dou 43 Mild Mild Mild Mild Nor Nor Dou
12 Mild Nor Nor Nor Nor Mild Dou 44 Mild Mild Mild Nor Mild Nor Dou
13 Nor Mild Mild Nor Nor Nor Dou 45 Mild Mild Mild Nor Nor Mild Dou
14 Nor Mild Nor Mild Nor Nor Dou 46 Mild Mild Nor Mild Mild Nor Dou
15 Nor Mild Nor Nor Mild Nor Dou 47 Mild Mild Nor Mild Nor Mild Dou
16 Nor Mild Nor Nor Nor Mild Dou 48 Mild Mild Nor Nor Mild Mild Dou
17 Nor Nor Mild Nor Nor Mild Dou 49 Mild Nor Mild Mild Mild Nor Dou
18 Nor Nor Mild Nor Mild Nor Dou 50 Mild Nor Mild Mild Nor Mild Dou
19 Nor Nor Mild Mild Nor Nor Dou 51 Mild Nor Mild Nor Mild Mild Dou
20 Nor Nor Mild Mild Nor Nor Dou 52 Mild Nor Nor Mild Mild Mild Dou
21 Nor Nor Nor Mild Nor Mild Dou 53 Nor Mild Mild Mild Mild Nor Dou
22 Nor Nor Nor Nor Mild Mild Dou 54 Nor Mild Mild Mild Nor Mild Dou
23 Mild Mild Mild Nor Nor Nor Dou 55 Nor Mild Mild Nor Mild Mild Dou
24 Mild Mild Nor Mild Nor Nor Dou 56 Nor Mild Nor Mild Mild Mild Dou
25 Mild Mild Nor Nor Mild Nor Dou 57 Nor Nor Mild Mild Mild Mild Dou
26 Mild Mild Nor Nor Nor Mild Dou 58 Mild Mild Mild Mild Mild Nor Dou
27 Mild Nor Mild Mild Nor Nor Dou 59 Mild Mild Mild Mild Nor Mild Dou
28 Mild Nor Mild Mild Nor Nor Dou 60 Mild Mild Mild Nor` Mild Mild Dou
29 Mild Nor Mild Nor Nor Mild Dou 61 Mild Mild Nor` Mild Mild Mild Dou
30 Mild Nor Nor Mild Mild Nor Dou 62 Mild Nor Mild Mild Mild Mild Dou
31 Mild Nor Nor Mild Nor Mild Dou 63 Nor Mild Mild Mild Mild Mild Dou
32 Mild Nor Nor Mild Nor Mild Dou 64 Mild Mild Mild Mild Mild Mild Dou
Table 3. Correlation analysis of test results of the traditional screen tests and the “MCI assessment system” test.
Test Method The Corresponding Scores Generated by “MCI Assessment System” Test
Mini-Cog SPMSQ MMSE SLUMS CDR CASI
Traditional screening tests Mini-Cog 0.7894 - - - - -
SPMSQ - 0.8020 - - - -
MMSE - - 0.8875 - - -
SLUMS - - - 0.7715 - -
CDR - - - - 0.6892 -
CASI - - - - - 0.9141
Table 4. Comparison results between traditional hardcopy tests and the “MCI assessment system” test.
No Traditional Screening Tests The Corresponding Scores Generated by the “MCI Assessment System” Test
Mini-Cog SPMSQ MMSE SLUMS CDR CASI Mini-Cog SPMSQ MMSE SLUMS CDR CASI
1
2
3
4
5
6
7
8
9
10
11
12
13
14
15
16
17
18
19
20
21
22
23
24
Disclaimer/Publisher’s Note: The statements, opinions and data contained in all publications are solely those of the individual author(s) and contributor(s) and not of MDPI and/or the editor(s). MDPI and/or the editor(s) disclaim responsibility for any injury to people or property resulting from any ideas, methods, instructions or products referred to in the content.
Copyright: This open access article is published under a Creative Commons CC BY 4.0 license, which permit the free download, distribution, and reuse, provided that the author and preprint are cited in any reuse.
Prerpints.org logo

Preprints.org is a free preprint server supported by MDPI in Basel, Switzerland.

Subscribe

© 2024 MDPI (Basel, Switzerland) unless otherwise stated