1. Introduction
The propagation of fire in high-country landscapes is often more complicated, with abrupt changes of atmospheric processes than in lowlands (J. J. Sharples et al., 2012). In particular, it is difficult for fire crews to control fires when there are multiple ignitions in poorly accessible areas (Westerling et al., 2004). Mountain regions comprise one fifth of terrestrial area in the world (Becker & Bugmann, 2001). On the other hand, the mountainous regions have been often less prioritized because of low accessibility and distance despite their high biodiversity and abundant natural resources (Hofer, 2005). The Australian continent is relatively flat; for example, the average of elevation is 325 m while the global average is 870 m (Pain et al., 2012). However, the island state of Tasmania in Australia’s south, contains a large area of rugged terrains compared to the rest of the continent due to the actions of exposed glacial and peri-glacial erosion (Bowman et al., 2022). Fire-prone vegetation is common across the elevation gradient, and the mountainous regions often experience wildfire. In the summer between 2018-19, a number of fires simultaneously occurred across rugged regions of the state, such as the Riveaux Road Fire and the Gell River Fire (Richards & Spencer, 2020). It was the hottest January in Australia and the second driest February on record in Tasmania (Hague, 2021; Handmer & Keating, 2020).
Our study case in this paper is the Great Pine Tier Fire, which was ignited on 15th January 2019 by a dry lightning strike on the Tasmanian Central Plateau, which ended up burning approximately 511.86 (Foulkes et al., 2021; Land Information System Tasmania, 2020; Richards & Spencer, 2020). This fire brought about significant ecological losses. For instance, almost of all vegetation above ground in the shrubland was killed by a highly severe crown fire (Foulkes et al., 2021). There were also artificial infrastructures, such as Waddamana Power Station, a component of the hydroelectrical scheme operational across much of the Tasmanian highlands, that were threatened by fire impact, although ultimately it avoided damage (Australasian Fire and Emergency Service Authorities Council, 2019; Hydro Tasmania, n.d.).
We aim to find the relationship between dynamic winds driven by rugged highland terrain and both fire propagation and fireline intensity. Wind is one of the elements of fire weather that can have an impact on ignition, behavior and suppression of fire (Whiteman, 2000). In particular, the interaction of synoptic wind and terrain can cause atypical fire behavior. We focus on two types of dynamic winds: terrain forced flow (TFF) and forced channeling (FC). TFF is the synoptic wind modified by topographical structure which changes not only its direction but also magnitude. For example, the wind can be accelerated in the regions where the ridgelines are either perpendicular to or concave against windward flow (Whiteman, 2000). FC is a subclass of TFF which is caused by the friction between the sidewall of the valley and geostrophic wind, resulting in wind flowing down into the valley from aloft (J. J. Sharples, 2009; Whiteman, 2000). Fireline intensity is the quantity of heat energy released by fire, which is measured in units of kilowattage per length of fireline, and provides a useful criterion of difficulty for fire fighters to control the fire (Keeley, 2009; Rossi et al., 2019; The Australasian Fire and Emergency Service Authorities Council (AFAC), 2022).
We employed two approaches: interpretation of weather plots through the course of the fire at specific locations, and fire simulation followed by verification against actual fire spread. Three specific types of plots are analyzed: wind vector plots, which show the air flow with topography, and is expected to identify terrain forced flow (TFF), numerical weather model vertical soundings (NWMVS), which indicate various weather changes through the depth of the atmosphere in a time series, and fireline intensity, which shows the spatially explicit intensity of fire based on hotspot images from two types of satellite system, also in a time series. Fire spread simulations were performed using Prototype 2, a fire simulator implemented based on the specification of Australian Fire Danger Rating System (AFDRS) (Ozaki et al., 2022). Prototype 2 allows not only simulation of fire propagation but also recording the fireline intensity and detecting potential lateral fire channeling (LFC) in each prediction grid when simulating the fire propagation.
Our hypothesis is that either terrain forced flow (TFF) or forced channeling (FC) would have an impact on not only fire propagation but also fireline intensity because both TFF and FC are modified synoptic winds, which provide more air flux and therefore oxygen gas, which is required for combustion than microscale winds do.
2. Study Area, Dataset and Methodology
The Great Pine Tier Fire occurred in the Central Plateau of Tasmania, which has an average elevation of about 1 km, and where dry eucalypt accounts for more than 60% of the vegetation area (Geoscience Australia, 2020; Land Information System Tasmania, 2020). Weather conditions and fire phenomena of the study case are investigated by interpretation of various weather plots and recreation of fire spread using Prototype 2, a fire simulator.
2.1. Spatial coordinate system and datetime, study area and spatial dataset
We employed various weather datasets and fire isochrones for verification of fire simulation quality. Displayed timestamp and map coordinates are localized consistently unless represented explicitly.
2.1.1. Spatial coordinate system and datetime
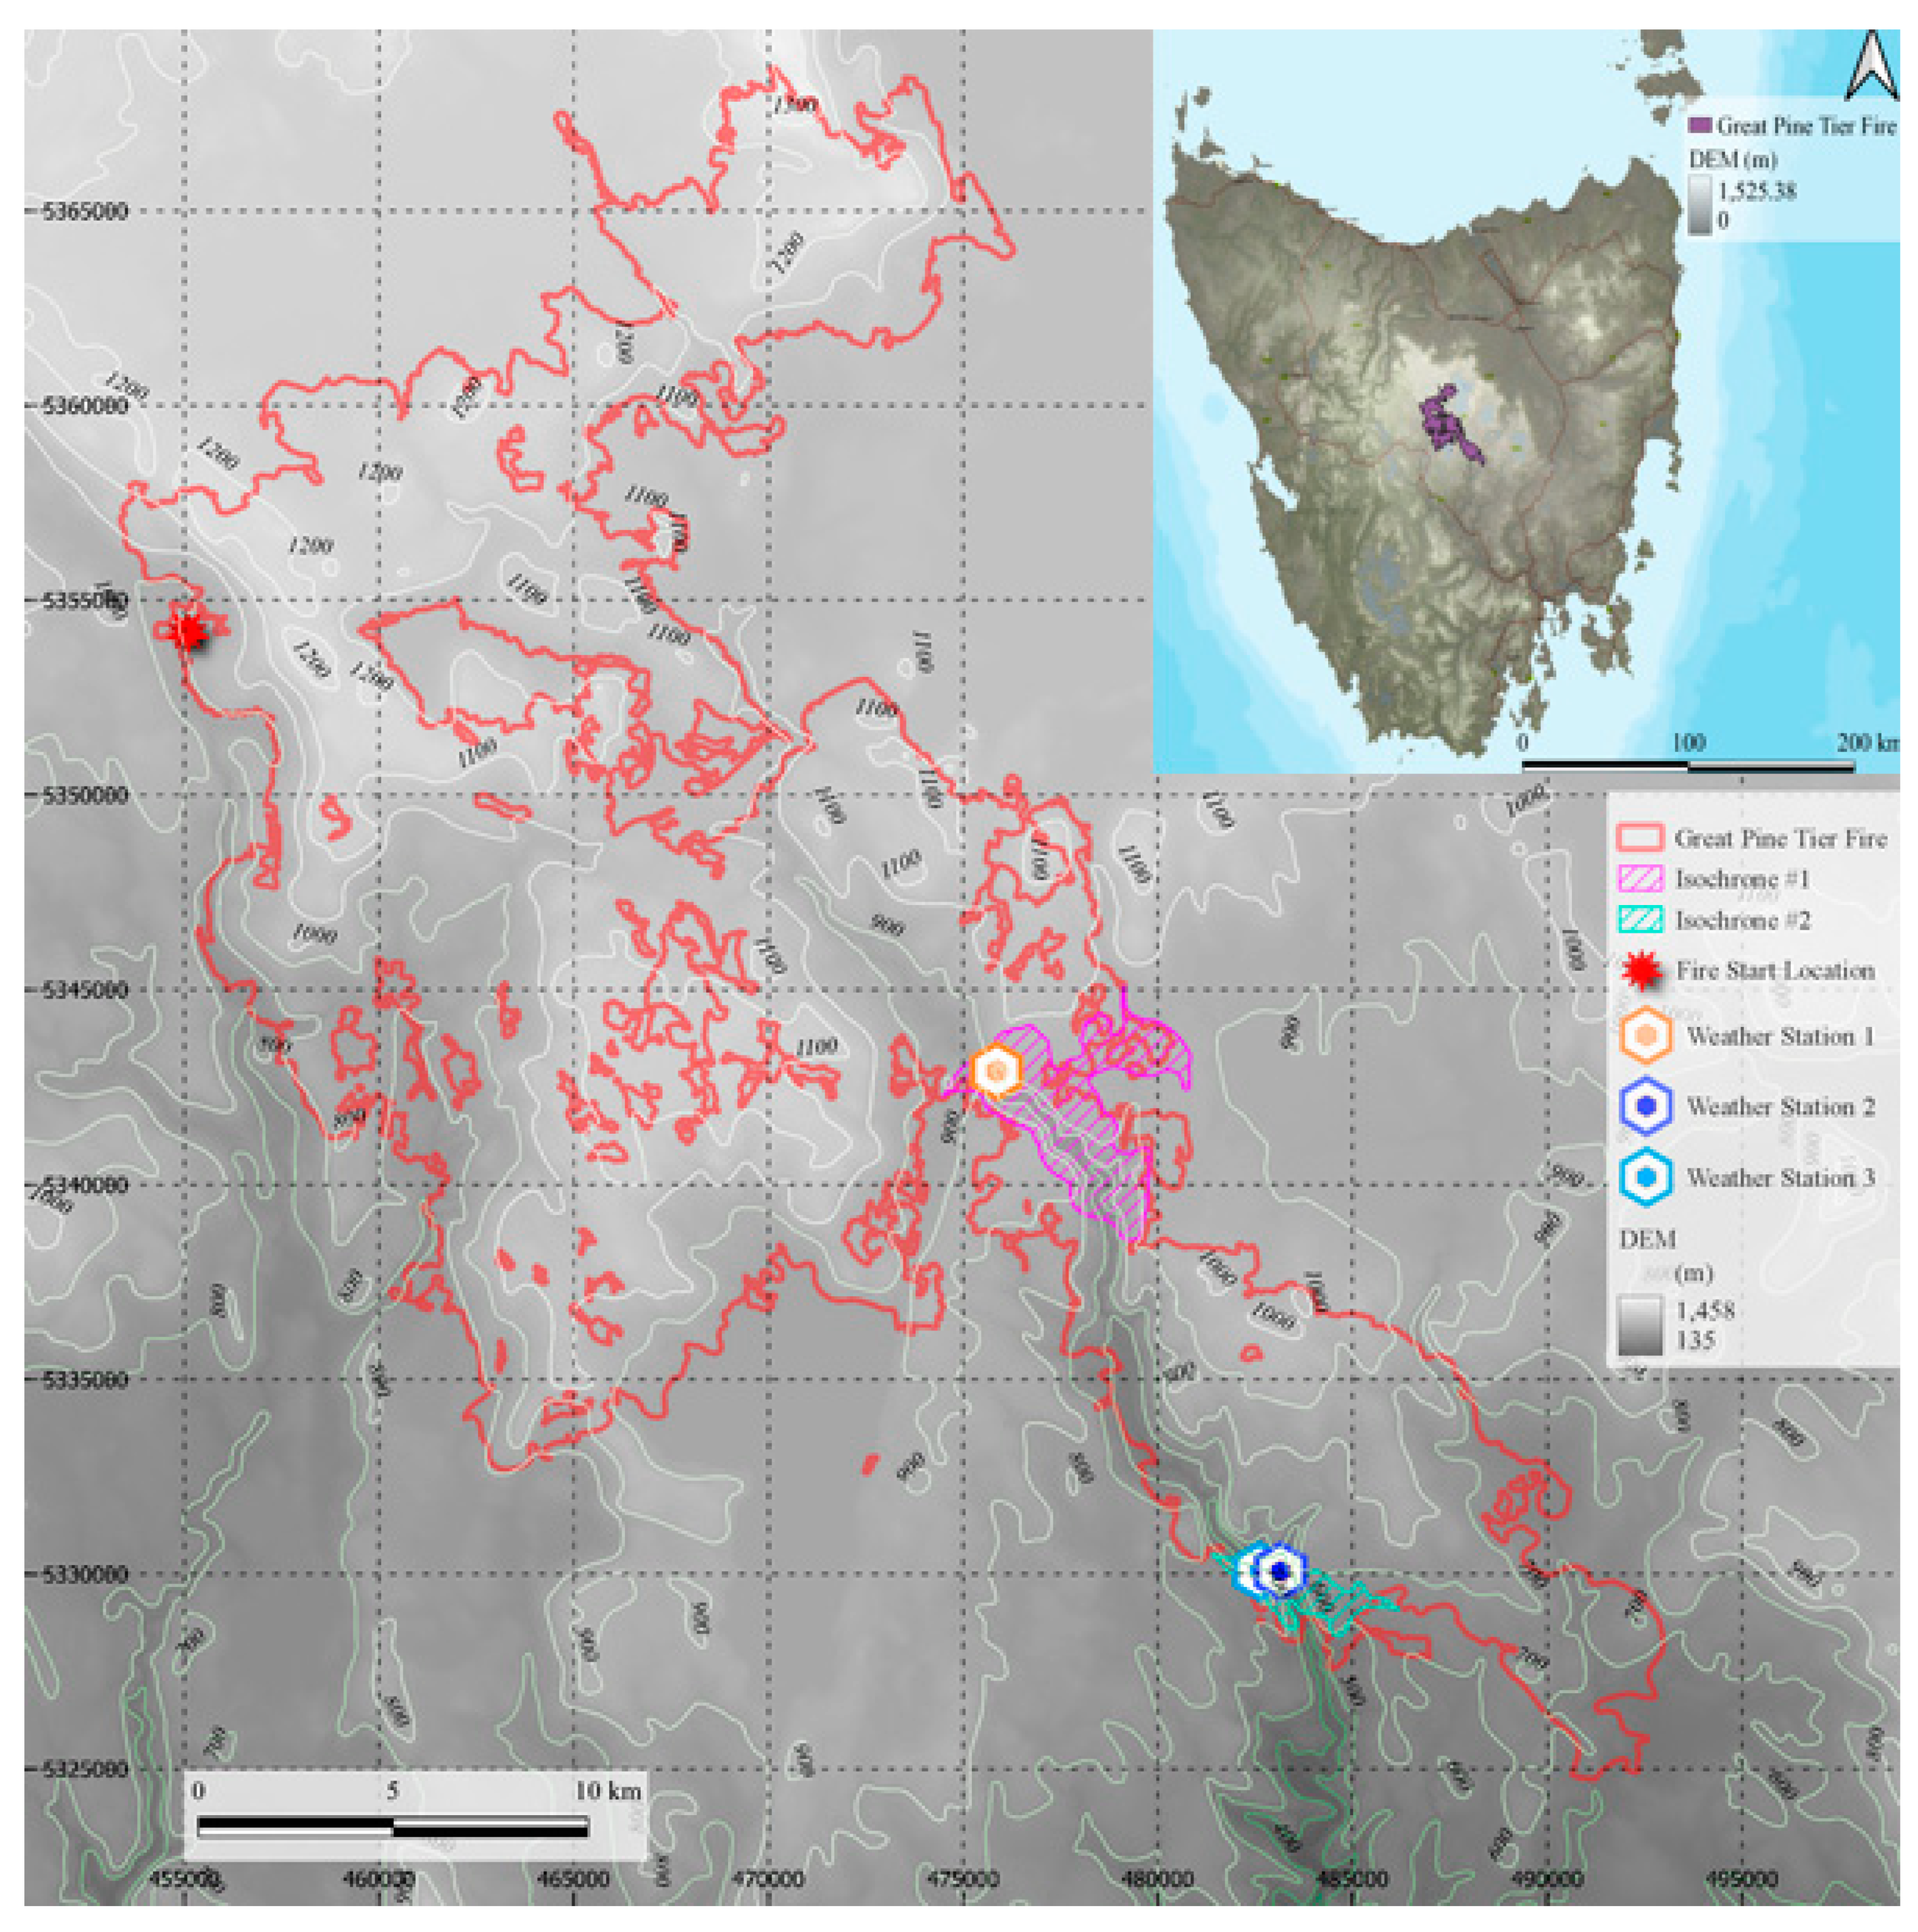
The coordinate system and time zone to represent in this study area follow GDA94 zone 55 and local time (Australia/Hobart) with yyyy-MM-dd format respectively unless mentioned explicitly. The study area is the Great Pine Tier Fire which is characterized by highland topography and rugged valleys with abundant eucalypt forest and highland vegetation. The modelling domain in that coordinate system was defined to extend beyond the mapped boundary of the Great Pine Tier (
Figure 1).
2.1.2. Study fire
The fire started on 15
th January 2019 in the far west of a plateau, is represented by star mark in red (
Figure 1). Then it moved south-west on the plateau and down into a valley, which contains two fire isochrones that were measured by fire agency staff during the course of the fire. Because the total burnt area is too large (511.86
) to simulate the entire fire all at once, two fire isochrones were employed instead to model important sections of the fire spread of relevance to dynamic wind effects. One or two pseudo weather stations were set up in each isochrone to monitor weather and to act as ignition locations (
Figure 1). Ignition time was estimated from fireline of the adjacent isochrones, each of which contained a timestamp reported by Tasmania Fire Service (TFS), because there was no precise fire-starting point location available for the study isochrones. Isochrone #1 was situated at the entrance of the valley from the plateau and started burning around noon on the 25
th and completed within that isochrone around noon on the 26
th (
Table 1).
Isochrone #2 was located in a lower elevation of the valley than #1 and started burning around the border of the preceding isochrone in the evening of the 29
th and ended within the isochrone around noon of the next day. Both isochrones were expected to identify dynamic wind in the valley. Although areas are different between these isochrones, ruggedness, which is represented by standard deviation of digital elevation model (m) in this study, is similar in each case. Details of fire isochrones are further addressed in
Section 1 in Appendix A.
2.1.3. BARRRA-TA weather datasets and downscaled wind field
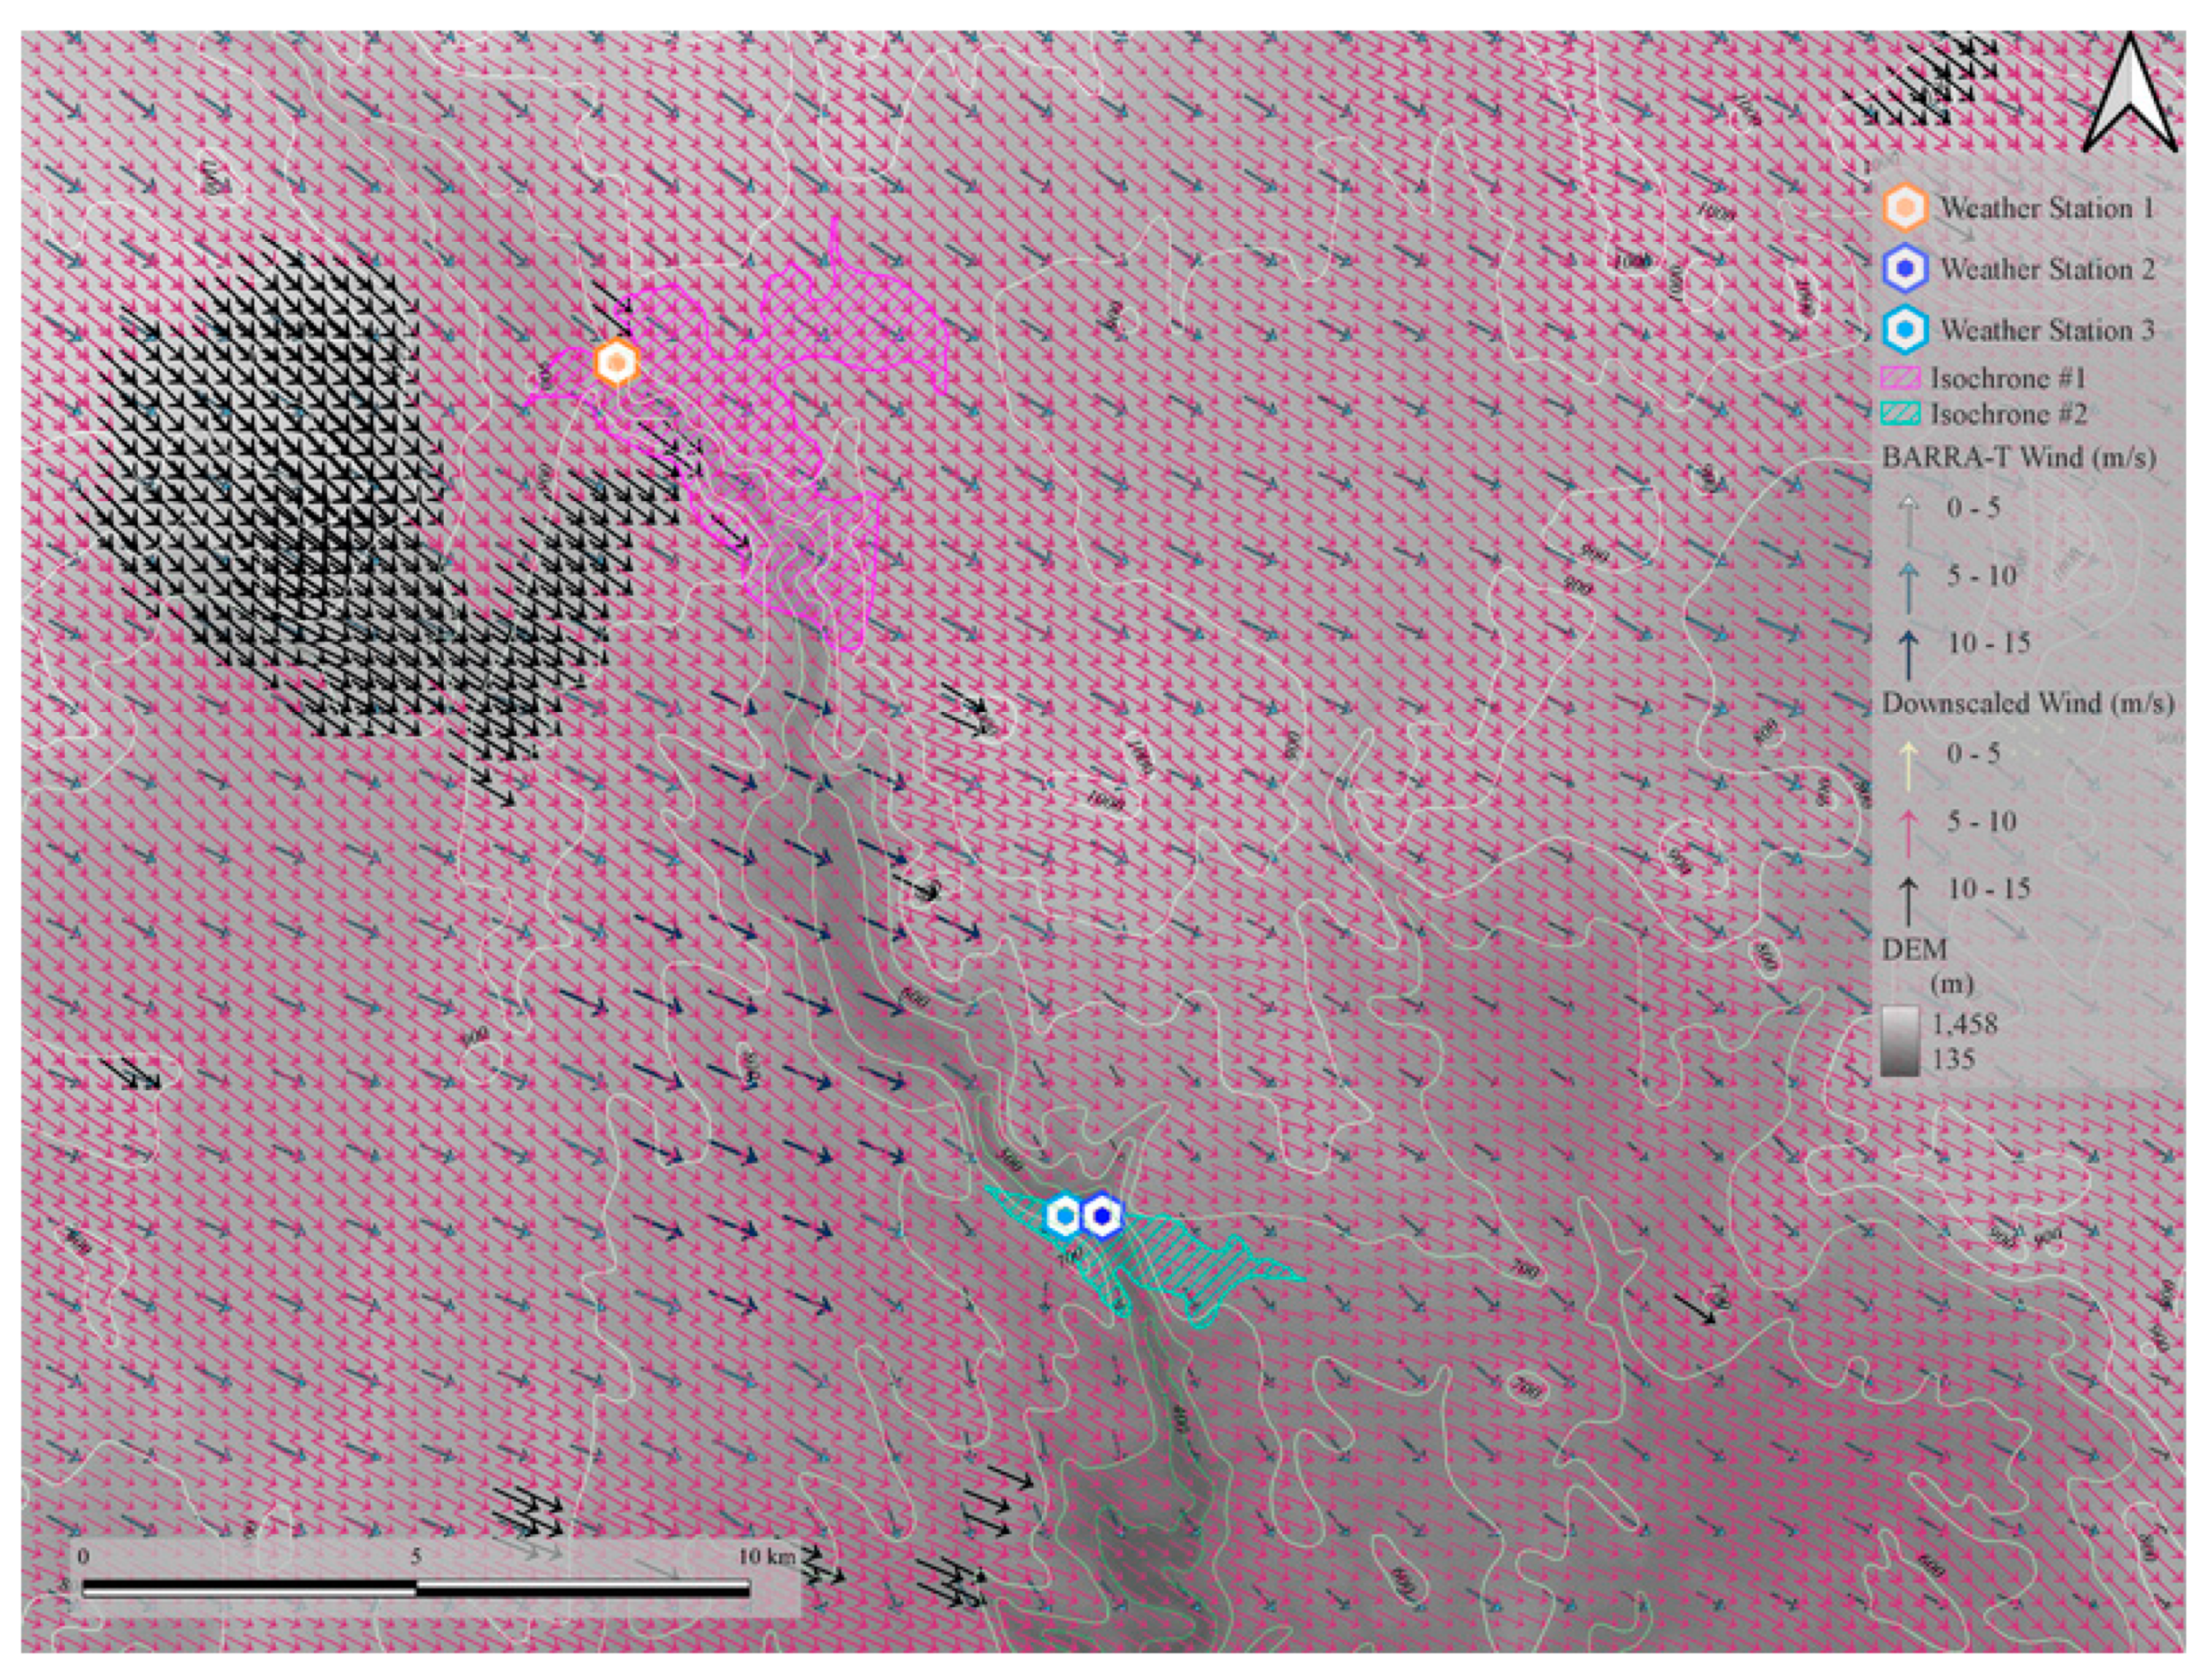
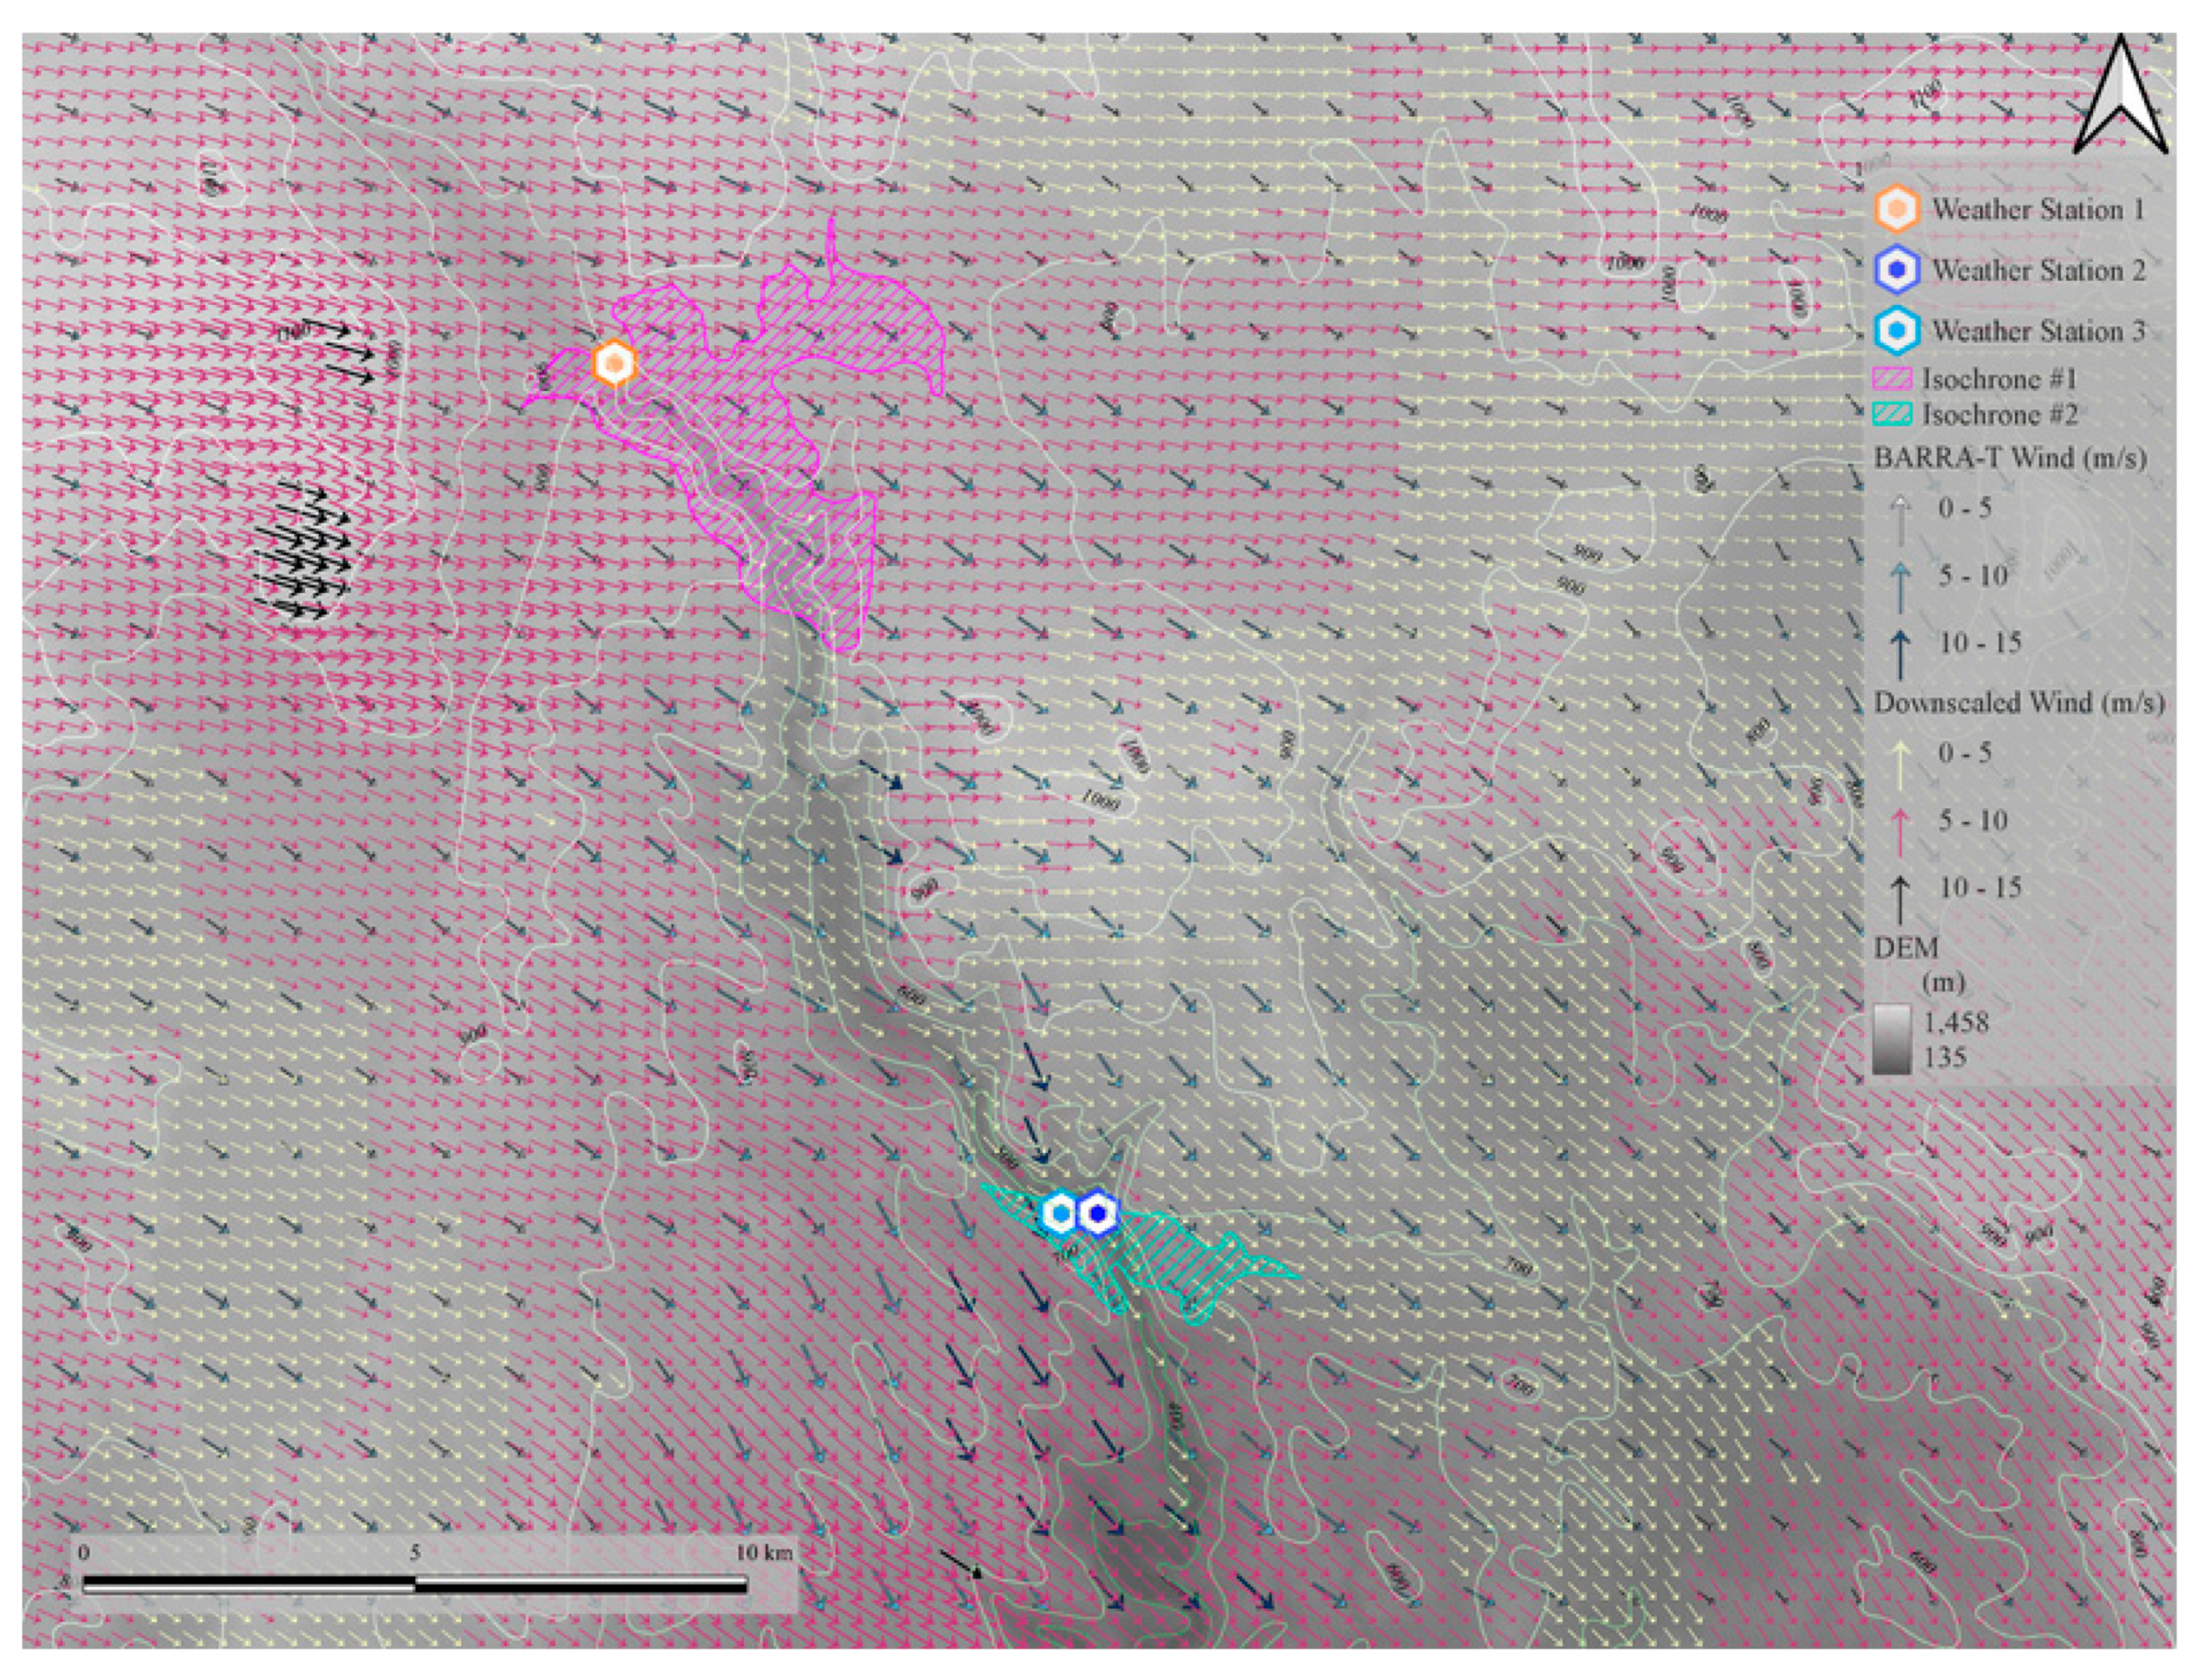
The main dataset used as the basis of this study is the Bureau of Meteorology Atmospheric high-resolution Regional Reanalysis for Australia for the Tasmanian region (BARRA-TA), which consists of various weather parameters, such as cloud coverage, precipitation, temperature, dew point temperature, geopotential height, soil moisture, and relative humidity represented at various atmospheric pressure levels (Eizenberg et al., 2021; Su et al., 2019). In addition, the surface wind in this dataset is employed to produce another surface wind field downscaled by WindNinja, a diagnostic tool (Firelab, n.d., 2020; Ozaki et al., 2022). These parameters, including two types of these surface wind fields, are used to parameterize the Prototype 2 fire simulator, and used to produce wind vector maps and numerical weather model vertical soundings (NWMVS). The resolution of BARRA-TA surface wind field and the downscaled wind field are 1500 m and 353 m respectively, and these surface winds represent flow 10 meters above the ground surface. Wind vectors at the time of the first ignitions for isochrone #1 and #2 are shown in
Figure 2 and
Figure 3 respectively.
2.2. Methods
Weather and fireline intensity at pseudo weather stations are analyzed using two types of plots: wind vector maps and numerical weather model vertical soundings (NWMSV). Meanwhile, fire propagation area, fireline intensity and lateral fire channeling (LFC) potential are simulated using the Prototype 2 simulator. The simulated fire spread is then verified against actual recorded isochrones using fractions skills score (FSS), to gauge the skill of the simulation under various wind fields (Mittermaier & Roberts, 2010; Roberts & Lean, 2008; Skok & Roberts, 2016).
2.2.1. Wind vector map and numerical weather model vertical sounding (NWMVS)
Three types of weather plots are employed to diagnose the dynamic wind effects on this fire: (1) wind vector maps, (2) numerical weather model vertical soundings (NWMVS) and (3) plots of calculated fireline intensity with satellite hotspots. The first type is further classified into two surface wind fields: BARRA-TA and the downscaled fields, by superimposing a digital elevation map (DEM) so that it is possible to identify terrain forced flow (TFF). The second type of plot consists of various weather variables in different atmospheric levels. Only atmospheric levels whose geostrophic elevations were higher than the elevation of each pseudo station were plotted in time series. NWMVS can be utilized to identify forced channeling (FC) by comparing and identifying an offset between the valley axis direction and wind directions in various atmospheric pressure levels. The third plot type shows the fireline intensity calculated by Prototype 2 in time series and compares it with fire radiation power of the hotspots monitored by two types of satellite sensors: the Visible Infrared Imaging Radiometer Suite (VIIRS) sensor on the Suomi National Polar-orbiting Partnership Program (S-NPP), and the AHI sensor on the Himawari-8 geostationary satellite (JAXA, 2022; Lee, 2014; ORNL DAAC, 2018; Schroeder, 2017). SNPP and Himawari-8 were launched in 2011 and 2016 respectively (Listi et al., 2018; Yumimoto et al., 2016). Spatial and temporal resolution varies between the two satellite hotspot products. The temporal resolution in VIIRS data is poor with observations only six times a day at most (Lee, 2014; Schroeder, 2017; Wang, 2021), while its spatial resolution is high, with a pixel size of 375 m. On the other hand, the spatial resolution in the Himawari-8 hotspot detections is low, with 2 km pixels, but its temporal resolution is extremely good, due to the geostationary nature of the satellite, with detection frequency of up to 10 minutes (Listi et al., 2018; Yumimoto et al., 2016). The fireline intensity is plotted regardless of the starting time of fire and the location of the fireline intensity in this plot is only for a pseudo station. Calculation of fireline intensity in both in plots and in fire propagation is the same and its detail is described in the section, 2.2.2.
2.2.2. Fire simulator, Prototype 2 with fireline intensity
Prototype 2 is a fire simulator that incorporates various fire models of fire spread for different vegetation types and provide two types of wind field: BARRA-TA and downscaled winds (Ozaki et al., 2019). The prototype 2 then maps simulation results on either of five geometries: Delaunay, diamond, hexagon, square and Voronoi (Ozaki et al., 2022). Primarily, fire propagation is simulated by Prototype 2. There are three sets of simulations with different ignitions: pseudo weather station 1 in isochrone #1, station 2 in #2 and station 3 in #2. Each set consists of ten simulation samples, which comprise all the five geometries with the two types of wind field. The sample which achieved the best score is selected from each set. The reason why two sets in isochrone #2 are prepared is due to a limitation of the Prototype 2 simulator. In reality, the fire entered the isochrone in a linear fashion around the border of the isochrone which had been burnt previously. However, linear ignitions have not yet been implemented, therefore, two ignitions are separately configured in isochrone #2 to analyze the effect of weather and topography on fire propagation, fireline intensity and lateral fire channeling (LFC). In addition to fire propagation, the fireline intensity, which is a new function and computed from rate of fire spread (ROS), heat yield and fuel load based on the specification of Australian Fire Danger Rating System (AFDRS) in Prototype 2, is also recorded in each grid, along with the potential for lateral fire channeling (LFC) (The Australasian Fire and Emergency Service Authorities Council (AFAC), 2022). A general equation of the intensity throughout fire models is as follows:
Where , h, w and ROS indicate fireline intensity (), heat yield (), fuel load () and rate of spread () respectively. This intensity is also used in the third weather plot. The LFC often promotes fire spotting and accelerates the fire spread (J. Sharples et al., 2011, 2017). However, currently Prototype 2 can only identify the potential for LFC and does not consider the effect of the LFC, such as spotting fire, acceleration of spread, and lateral spreading, on the fire propagation yet. Note that fire isochrones are prevented from moving back to previously burnt area in fire simulations so that the area cannot be burnt again.
2.2.3. Verification
Fractions skill score (FSS) is employed to verify the simulated fire propagation against actual recorded isochrons (Ozaki et al., 2022). The FSS provides a threshold value representing “usefulness” which is used to confirm the accuracy of fire spreading. The fireline intensity is compared in two different ignitions in fire isochrone #2.
3. Results
Synoptic wind was found to be the driving force of not only fire propagation but also high fireline intensity in its leeward. In addition, terrain forced flow (TFF) was confirmed around isochrone #2.
3.1. Wind vector map and numerical weather model vertical sounding (NWMVS)
Although synoptic wind was dominant in both isochrone #1 and #2, only terrain forced flow (TFF) appeared to influence in #2. Firstly, there were some influences of synoptic wind on the fire propagation. Wind speed stayed the same when the fire entered isochrone #1 from the north around 11:30 on the 25
th (
Table 1 and
Figure 2). At that time, BARRA-TA surface wind blew along the valley axis near isochrone #1. The BARRA-TA wind did not appear to have a significant TFF effect, as its magnitude and direction remained mostly constant, unaffected by the elevated topography even though the elevations vary (
Figure 2). Although downscaled wind showed only a few stronger wind vectors around pseudo weather station 1 in isochrone #1 compared to its surroundings, there were many greater wind vectors around the ridge to the west of station #1 (
Figure 2). BARRA-TA surface wind started blowing along the axis at 11:30 on the 25
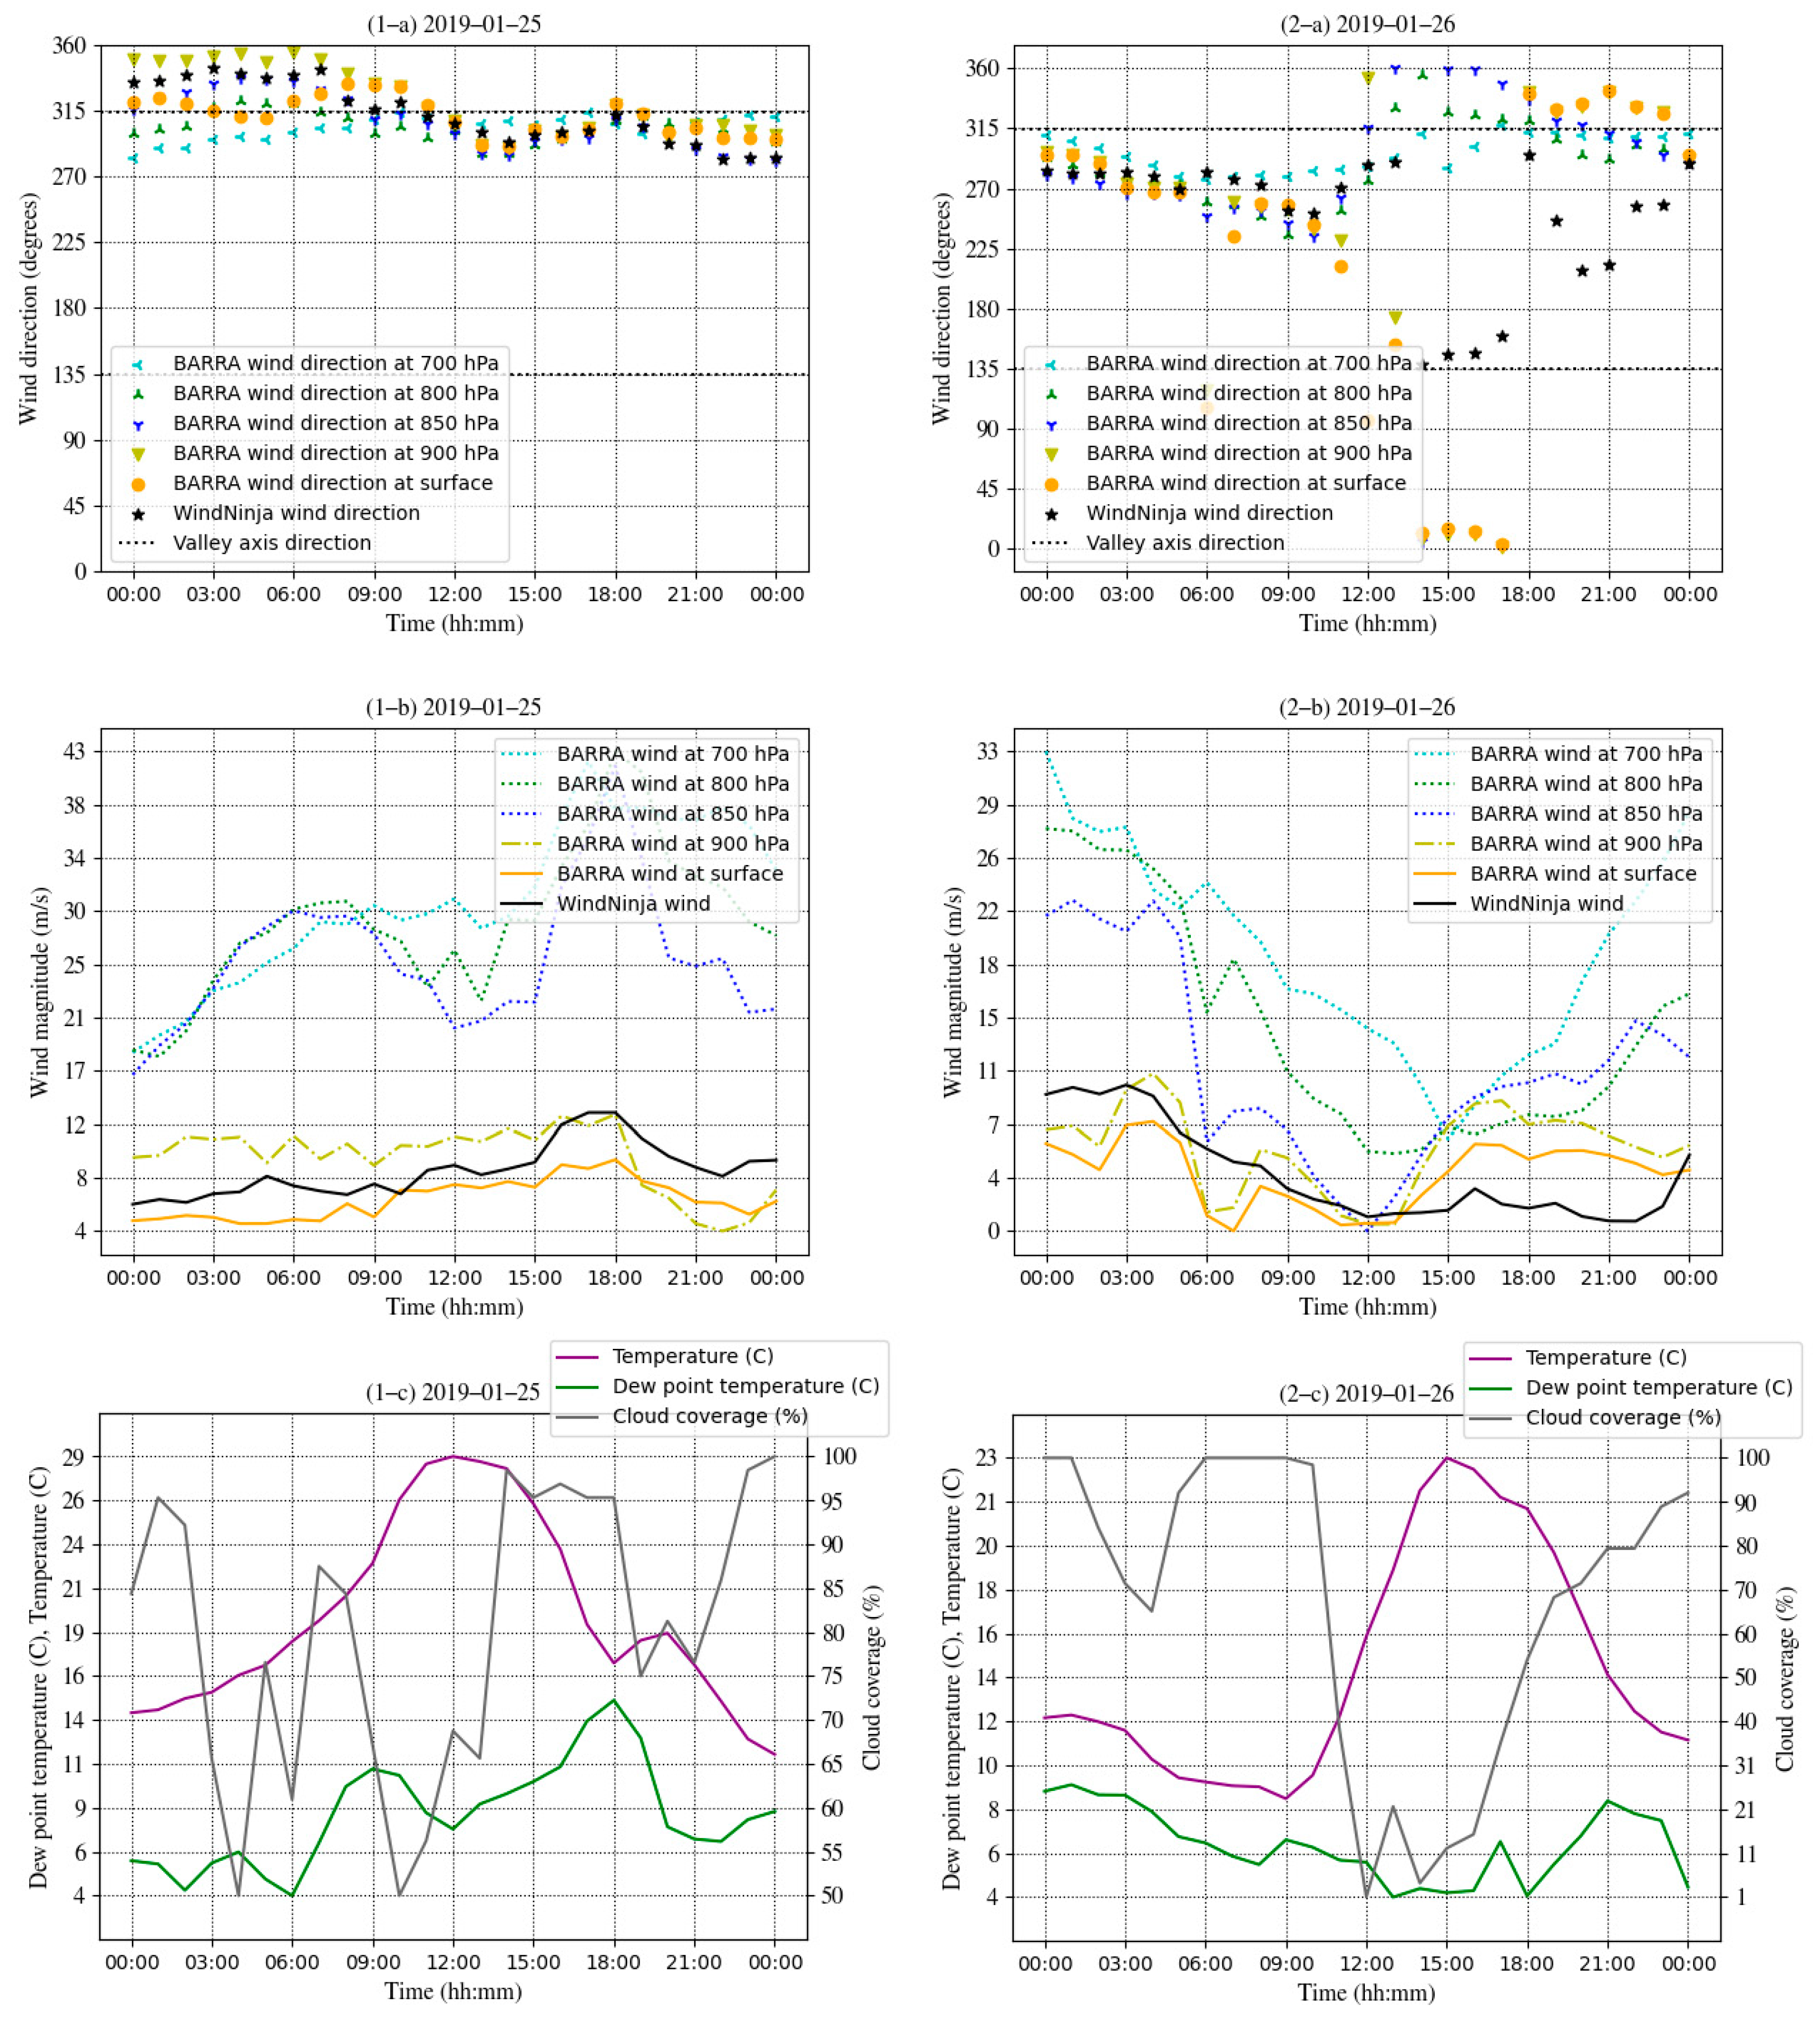
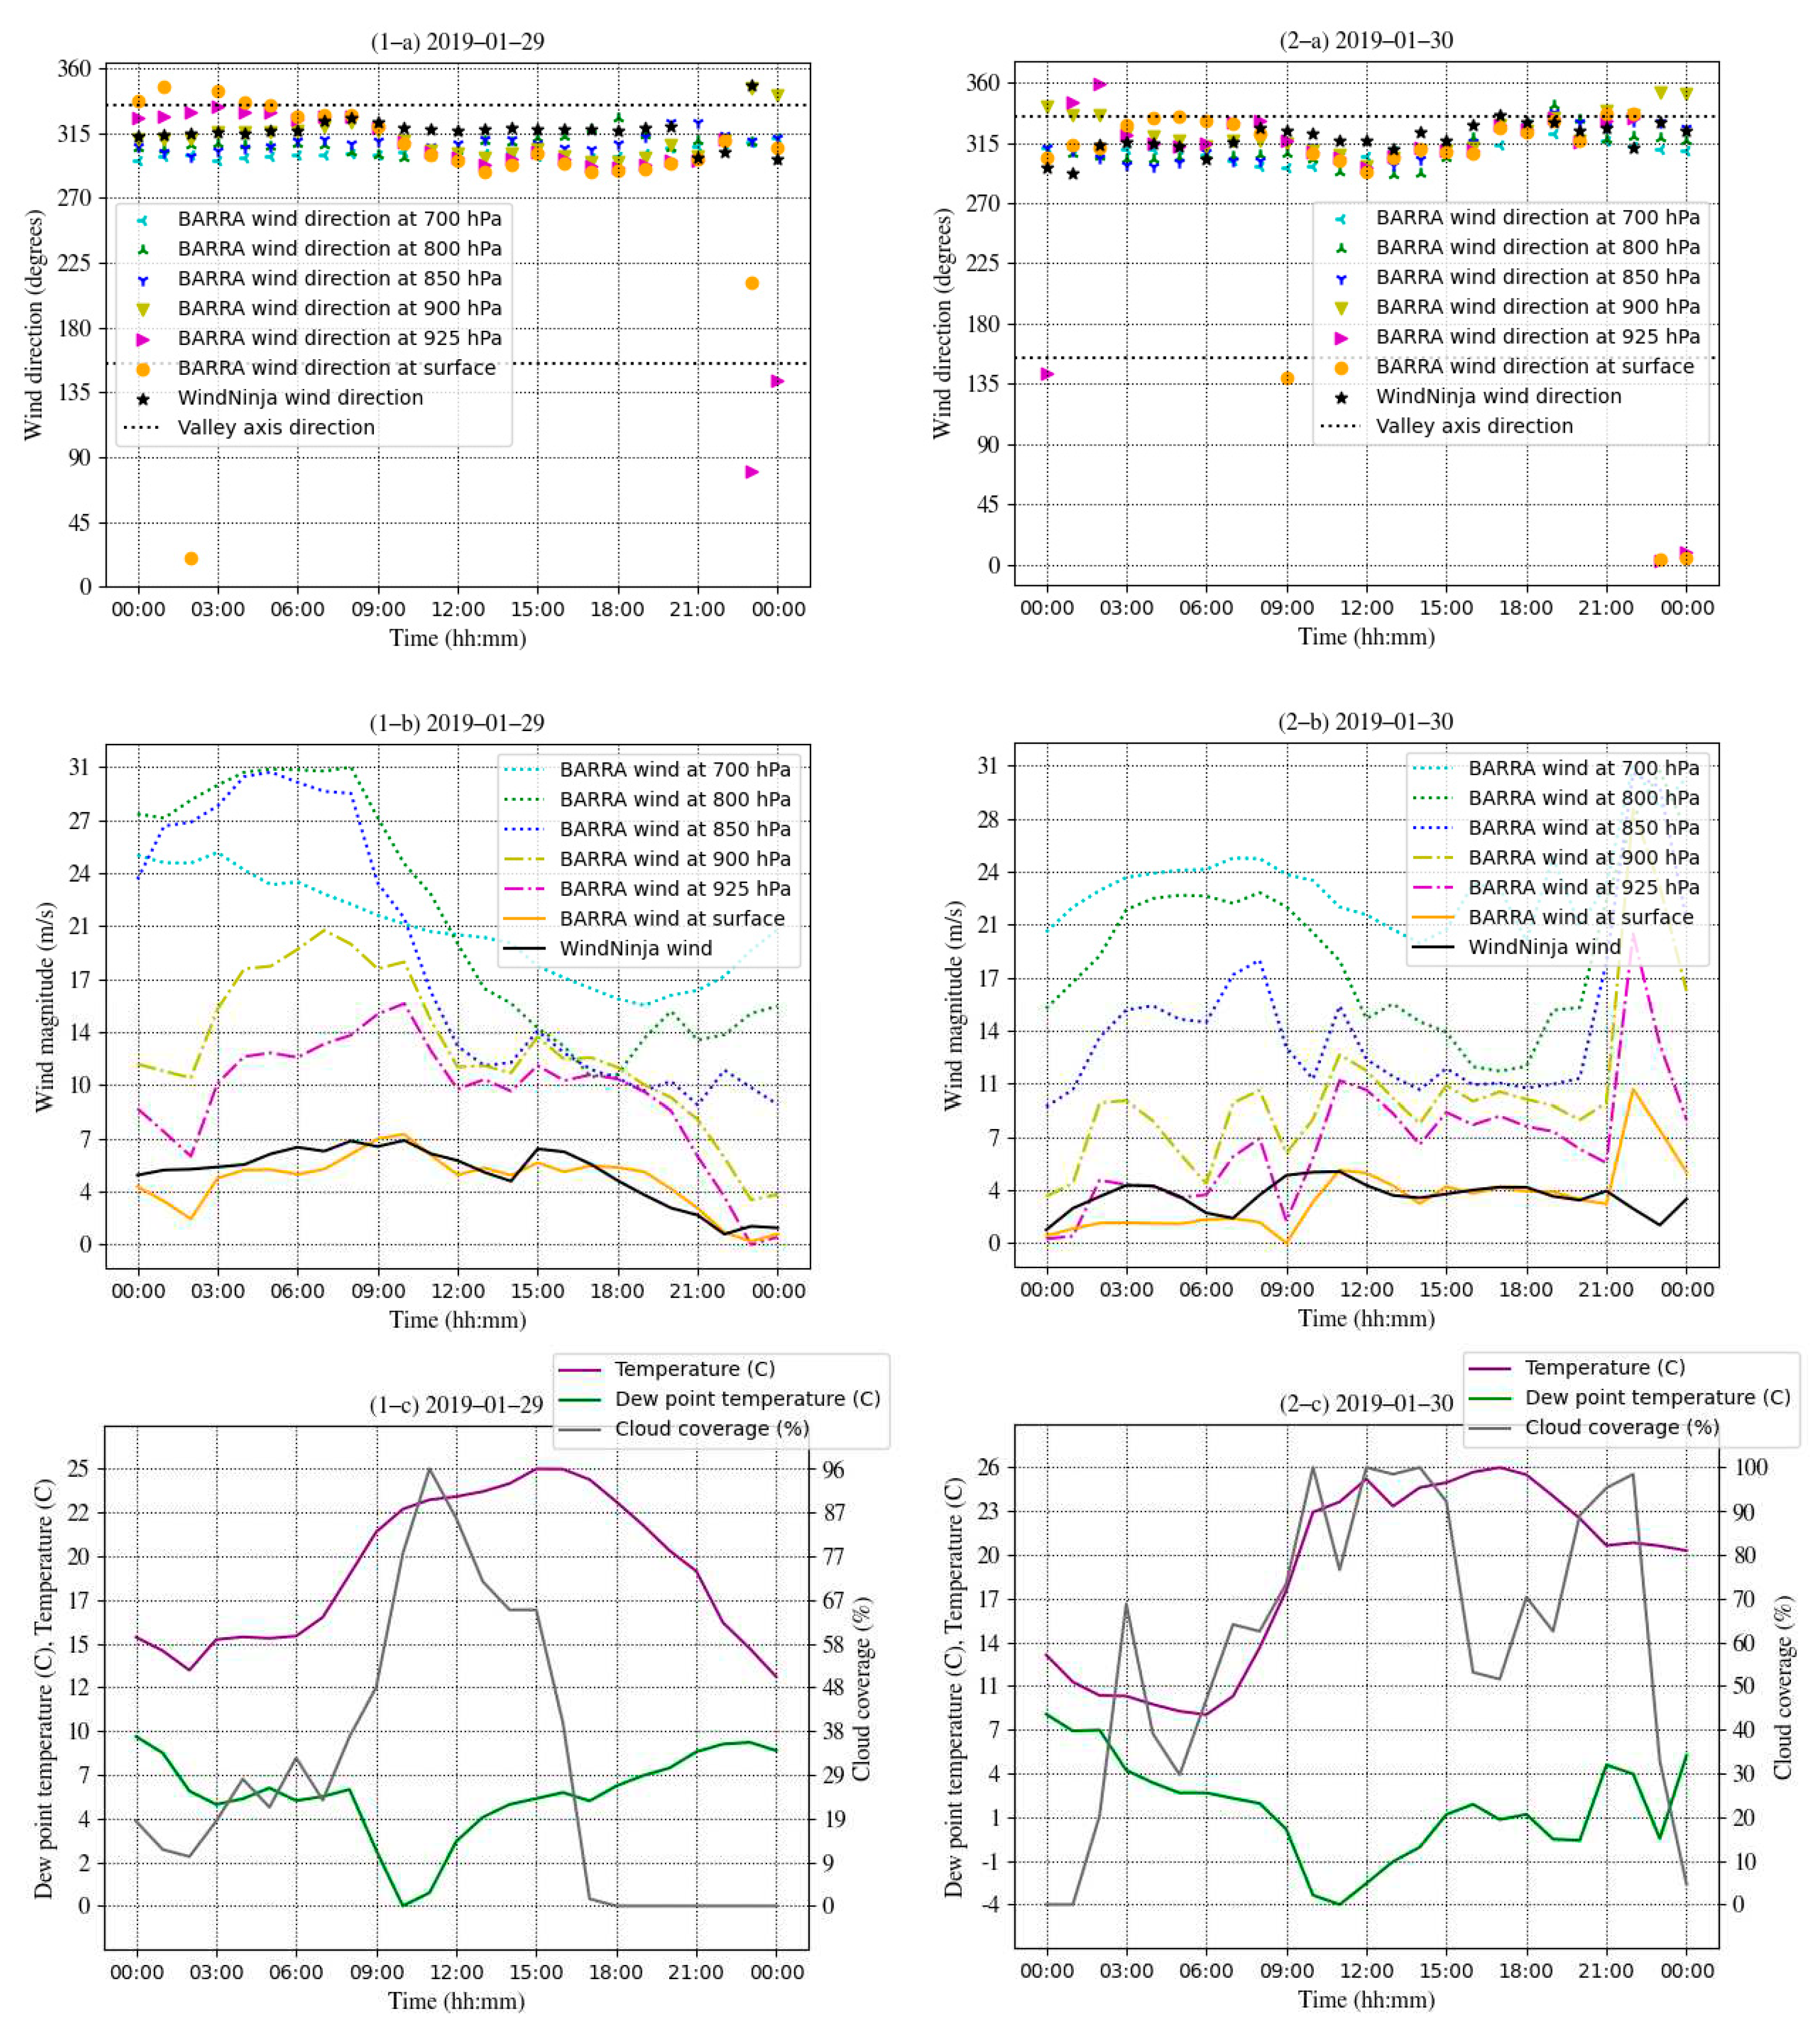
th and remained the direction largely constant until midnight while the upper air at 700 hPa kept blowing along the axis at station 1 in isochrone #1 (1-a in
Figure 4).
The small gap between the direction of surface wind and upper air indicates the possible forced channeling (FC) from 18:00 till 19:00 on the 25
th because the surface wind fields in orange and black were closer to the valley axis represented by black horizontal line around 315
o than other higher elevated winds (1-a in
Figure 4). This gap shows that the surface wind fields were potentially derived from its mainstream and channeled along the valley. On the 26
th, the wind direction gap became larger (2-a in
Figure 4). The reason why the wind direction gap was small on the 25
th is because of both high geostrophic winds’ magnitude and high cloud coverage from noon till midnight on the 25
th (1-b and 1-c in
Figure 4). Note that diurnal wind is generally less active under high cloud coverage and therefore synoptic wind tends to dominate than under low cloud coverage (Whiteman, 2000). Although the directions of these winds were close together, the direction gap between these winds and the valley axis increased as the magnitude of geostrophic winds decreased (2-a and 2-b in
Figure 4). To sum up the weather, the synoptic wind, which appeared to be FC temporarily, was dominant in the first half of the fire period while local wind overweighed during the rest of period when the fire propagated through isochrone #1. No TFF effect was evident in the isochrone.
Secondly, terrain forced flow (TFF) appeared to have an impact on isochrone #2 in addition to the synoptic wind. Wind vectors show the increase of both surface wind types: BARRA-TA and downscaled wind types, above the valley side in isochrone #2 at 18:00 on the 29
th when the fire started propagation in this isochrone (
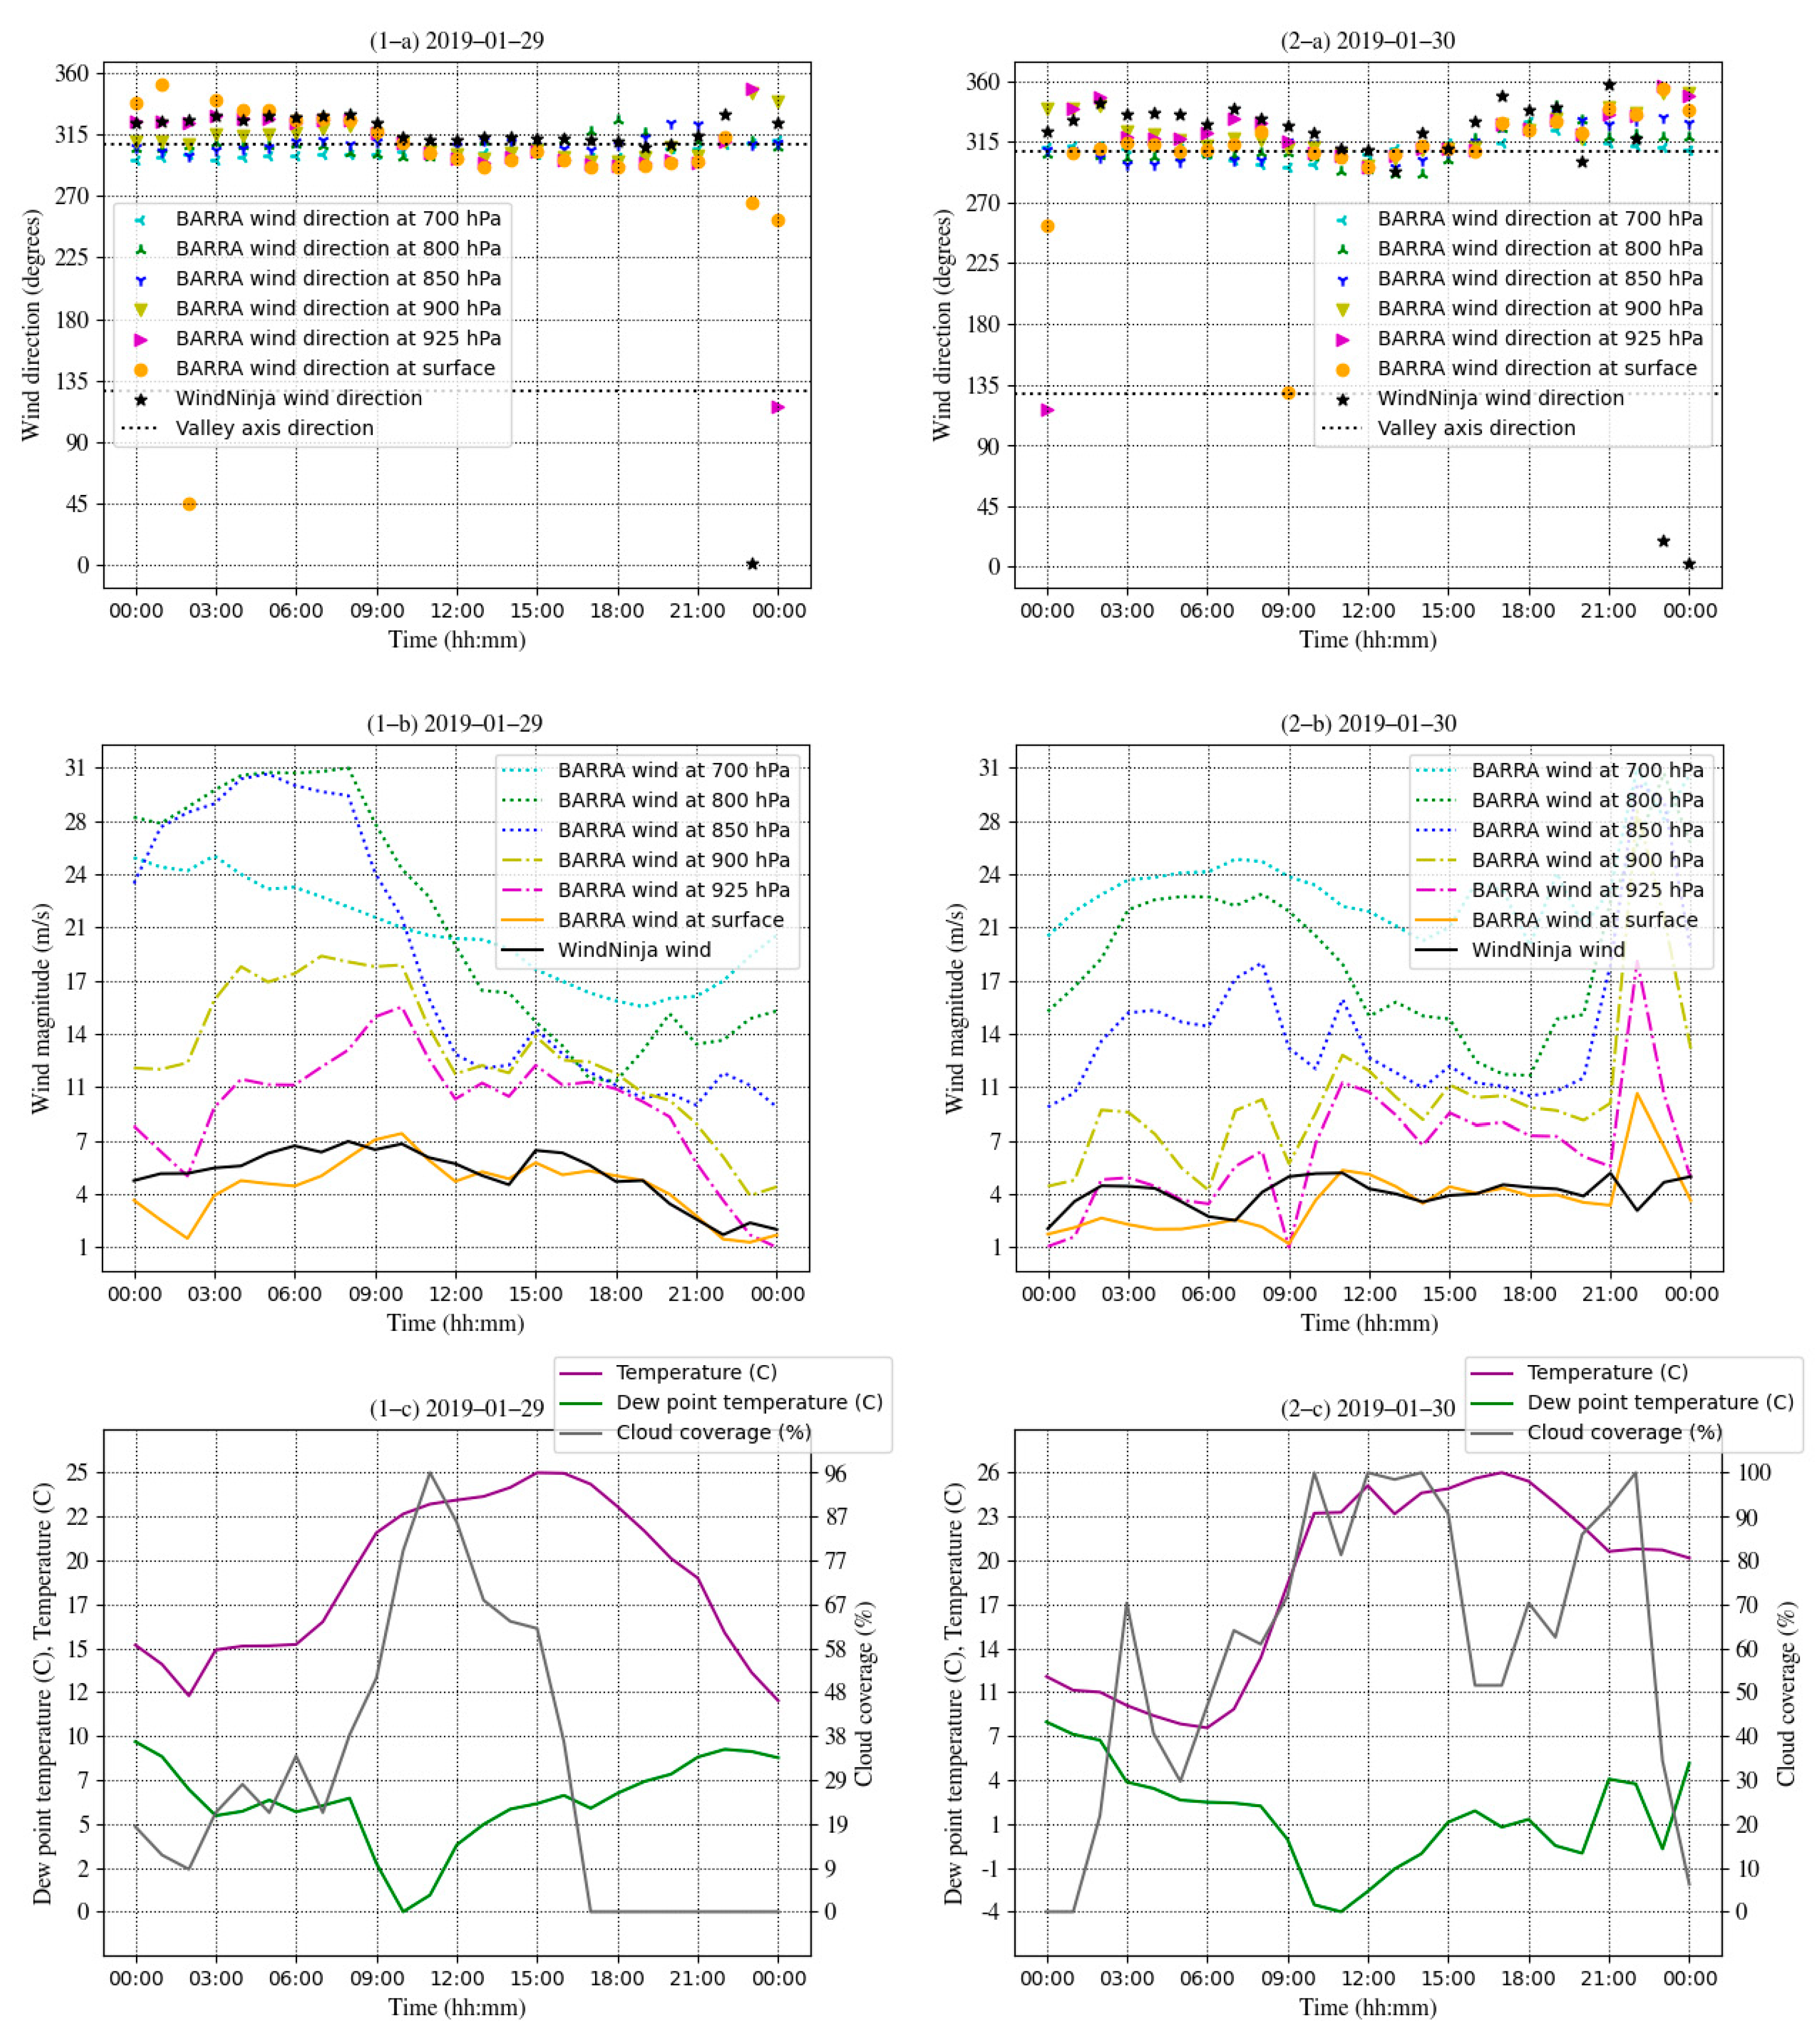
Figure 3). This is because the air was compressed vertically when it passed through on slightly higher elevation than that of windward location. On the other hand, the NWMSV plot shows good alignment of wind in all atmospheric levels (1-a and 2-a in
Figure 5 and
Figure 6).
Although there were gaps of wind direction among atmospheric levels as well as the valley axis, these gaps were considered to be caused by the meandering topography of valley (1-a and 2-a in both
Figure 5 and
Figure 6). Indeed, the valley axis, in which two separate pseudo weather stations were configured, showed different directions in the figures in isochrone #2. The valley axis for station 2 is aligned more north-south, approximately 160
o or 340
o than that for station 3, which is approximately 130
o or 310
o (
Figure 3, 1-a and 2-a in both
Figure 5 and
Figure 6). From the broader view, these gaps between the valley axis and wind direction, therefore, were marginal enough to consider that synoptic wind was dominant during the fire period from 18:00 on the 29
th till noon on the 30
th. There were a few exceptions in these time series plots. For example, the wind directions varied from 23:00 on the 29
th until at 0:00 on the 30
th when the winds at 850, 900 and 925 hPa and temperature dropped, and cloud coverage had continued to be nearly zero (
Figure 5 and
Figure 6). This means that diurnal wind was dominant, however, the diurnal surface winds were very weak, nearly zero (1-b and 1-c in both
Figure 5 and
Figure 6).
Thirdly, fireline intensity at pseudo weather stations in fire isochrone #2 showed some correlation with hotspots detected by infrared channel in Himawari while it did not in isochrone #1.
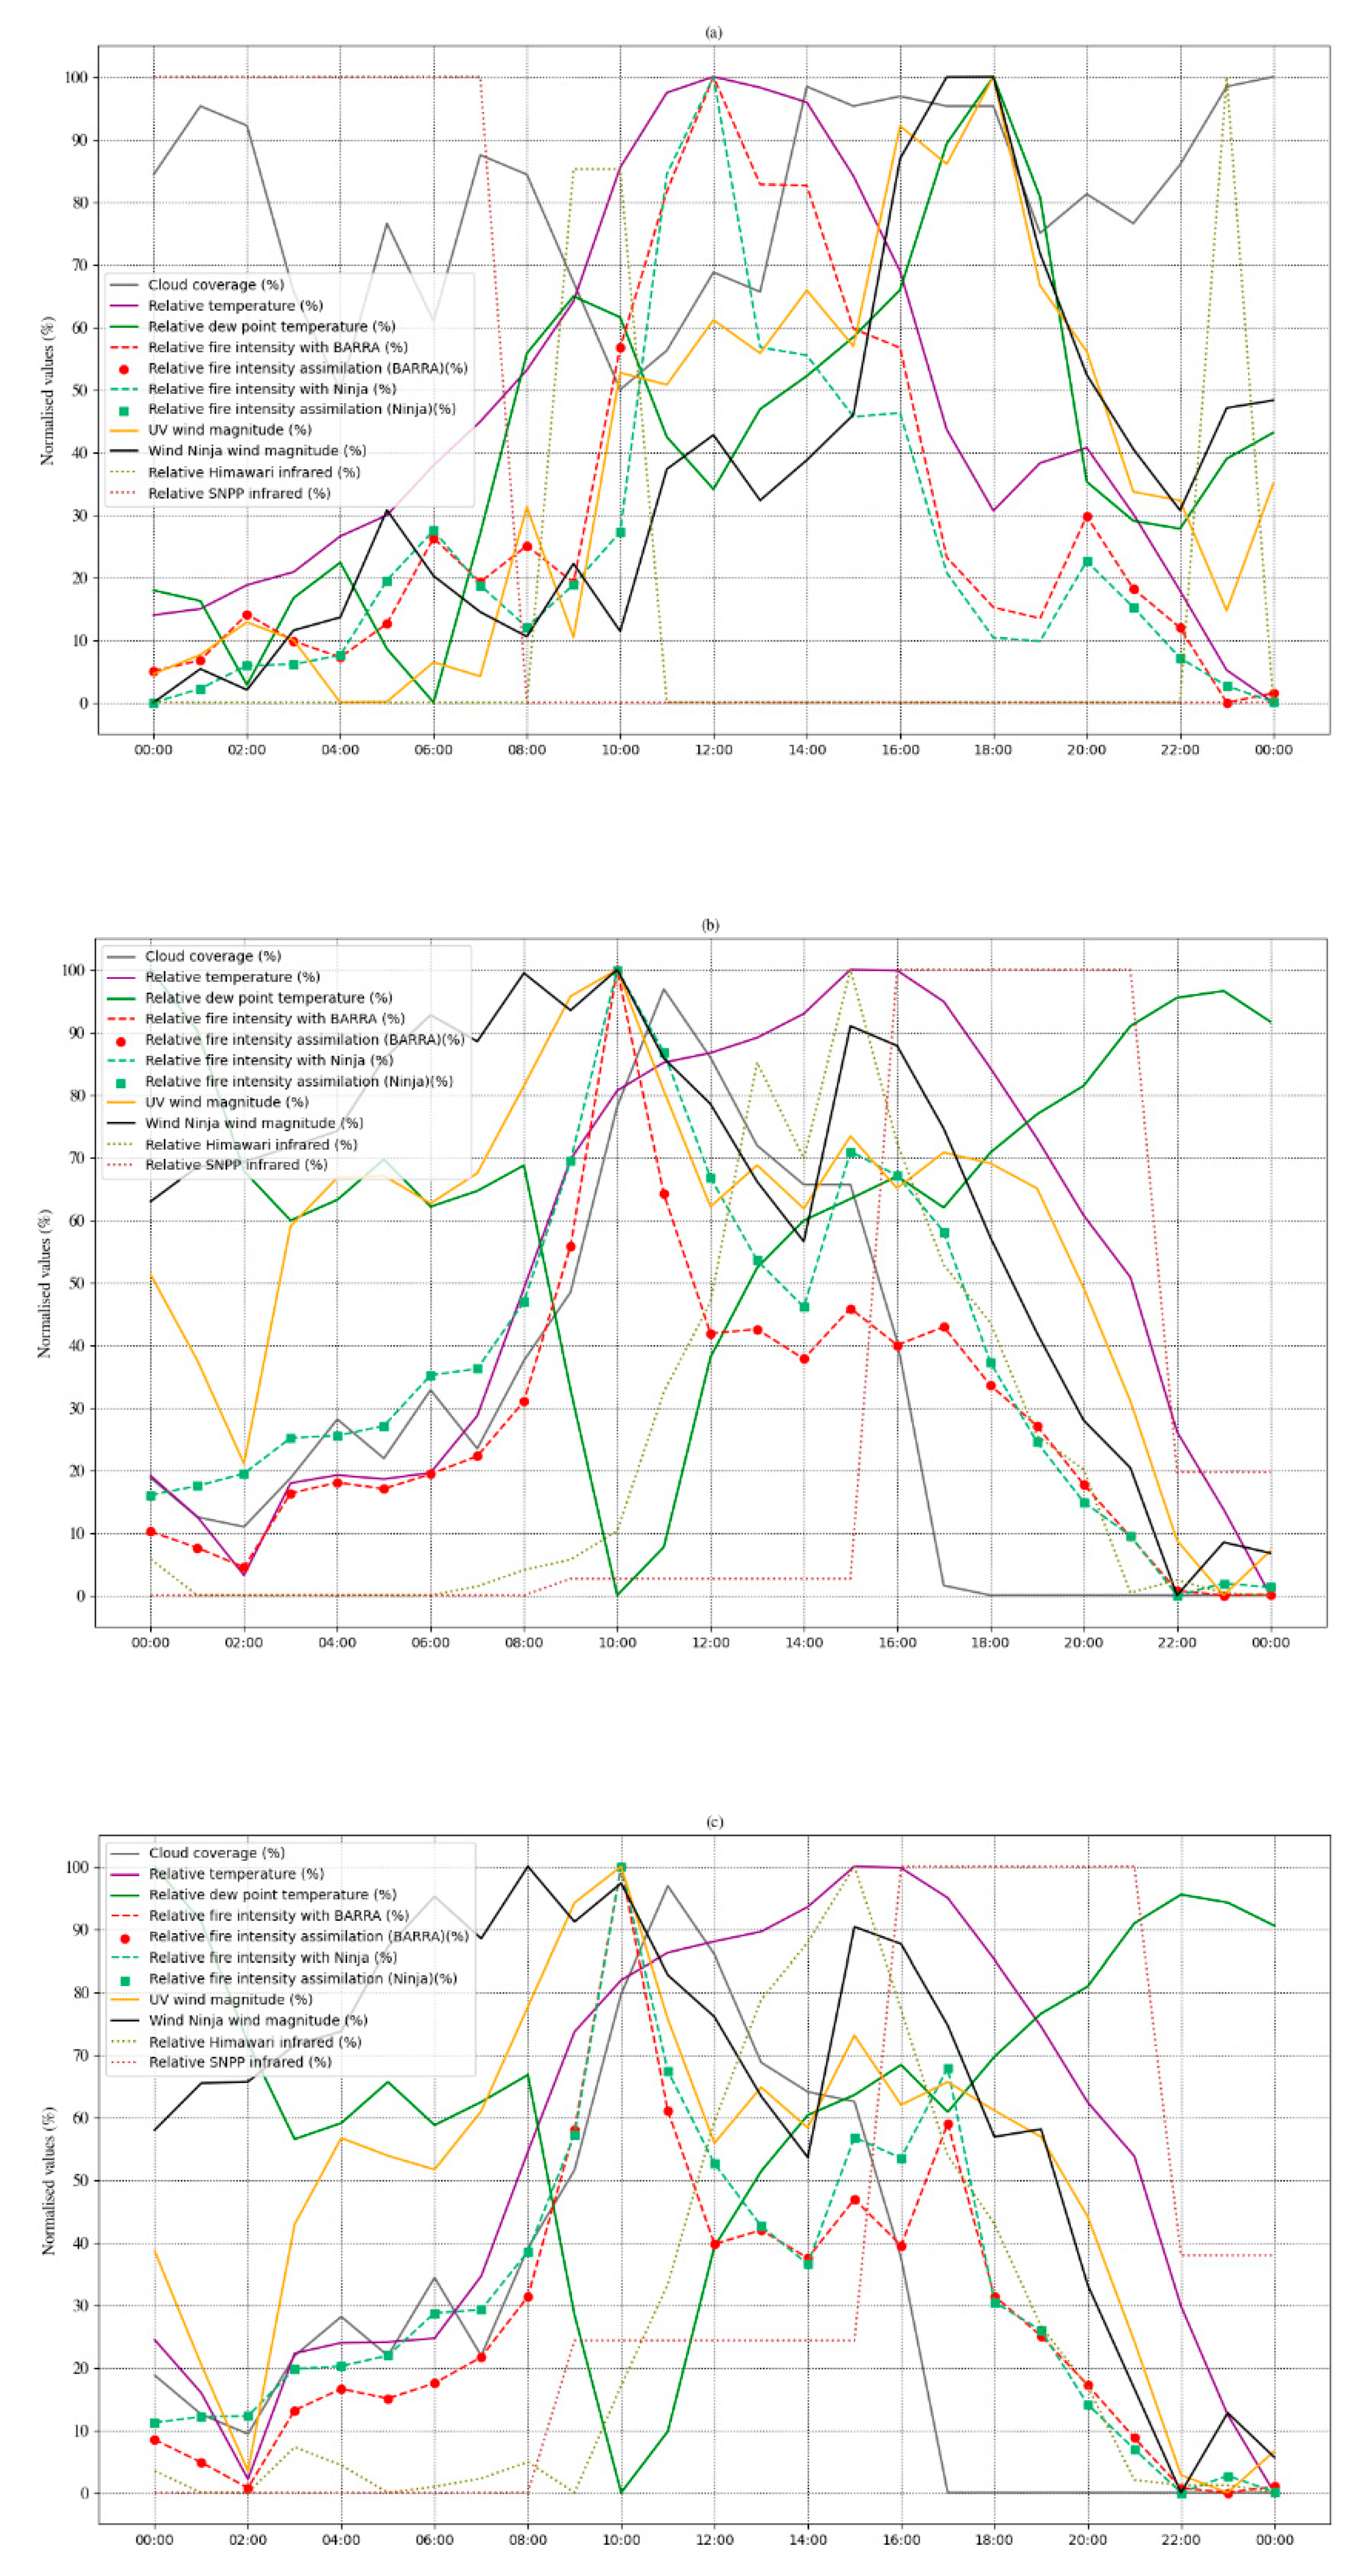
Figure 7 shows percentage of relative values for fireline intensity with two type of surface wind fields, wind magnitude, hotspots, cloud coverage, temperature and dew point temperature.
The simulated fireline intensity rapidly rose between 11:00 and 12:00 when the fire entered in isochrone #1 while no hotspot was identified by any satellite sensors (
Figure 7-a). The cloud coverage retrieved from BARRA-TA was moderate, below 70%, for satellite sensors to detect the fireline intensity at the start of fire in the isochrone. On the other hand, hotspots were identified near station 1 before 11:00 and after 19:00. With regard to isochrone #2, both pseudo station 2 and 3 showed some association between the simulated fireline intensity and hotspots detected by a satellite sensor. The fireline intensity with both wind fields showed a decline around 18:00, when the fire entered this isochrone (
Figure 7-b and -c). At the same time, hotspots identified by Himawari, and represented by olive color dotted line in the figures, also exhibited a decline. In addition, both surface wind types: BARRA-TA represented by orange solid line and downscaled wind in black solid line, showed decreases from 18:00 till 22:00 (
Figure 7-b and -c). After this, both hotspots detected by Himawari and the simulated intensity flattened out. Interestingly, both the BARRA-TA surface wind field in yellow solid line and the downscaled wind in black solid line also showed decreases for several hours from 18:00 (
Figure 7-b and -c).
3.2. Fire simulator, Prototype 2 with terrain filter
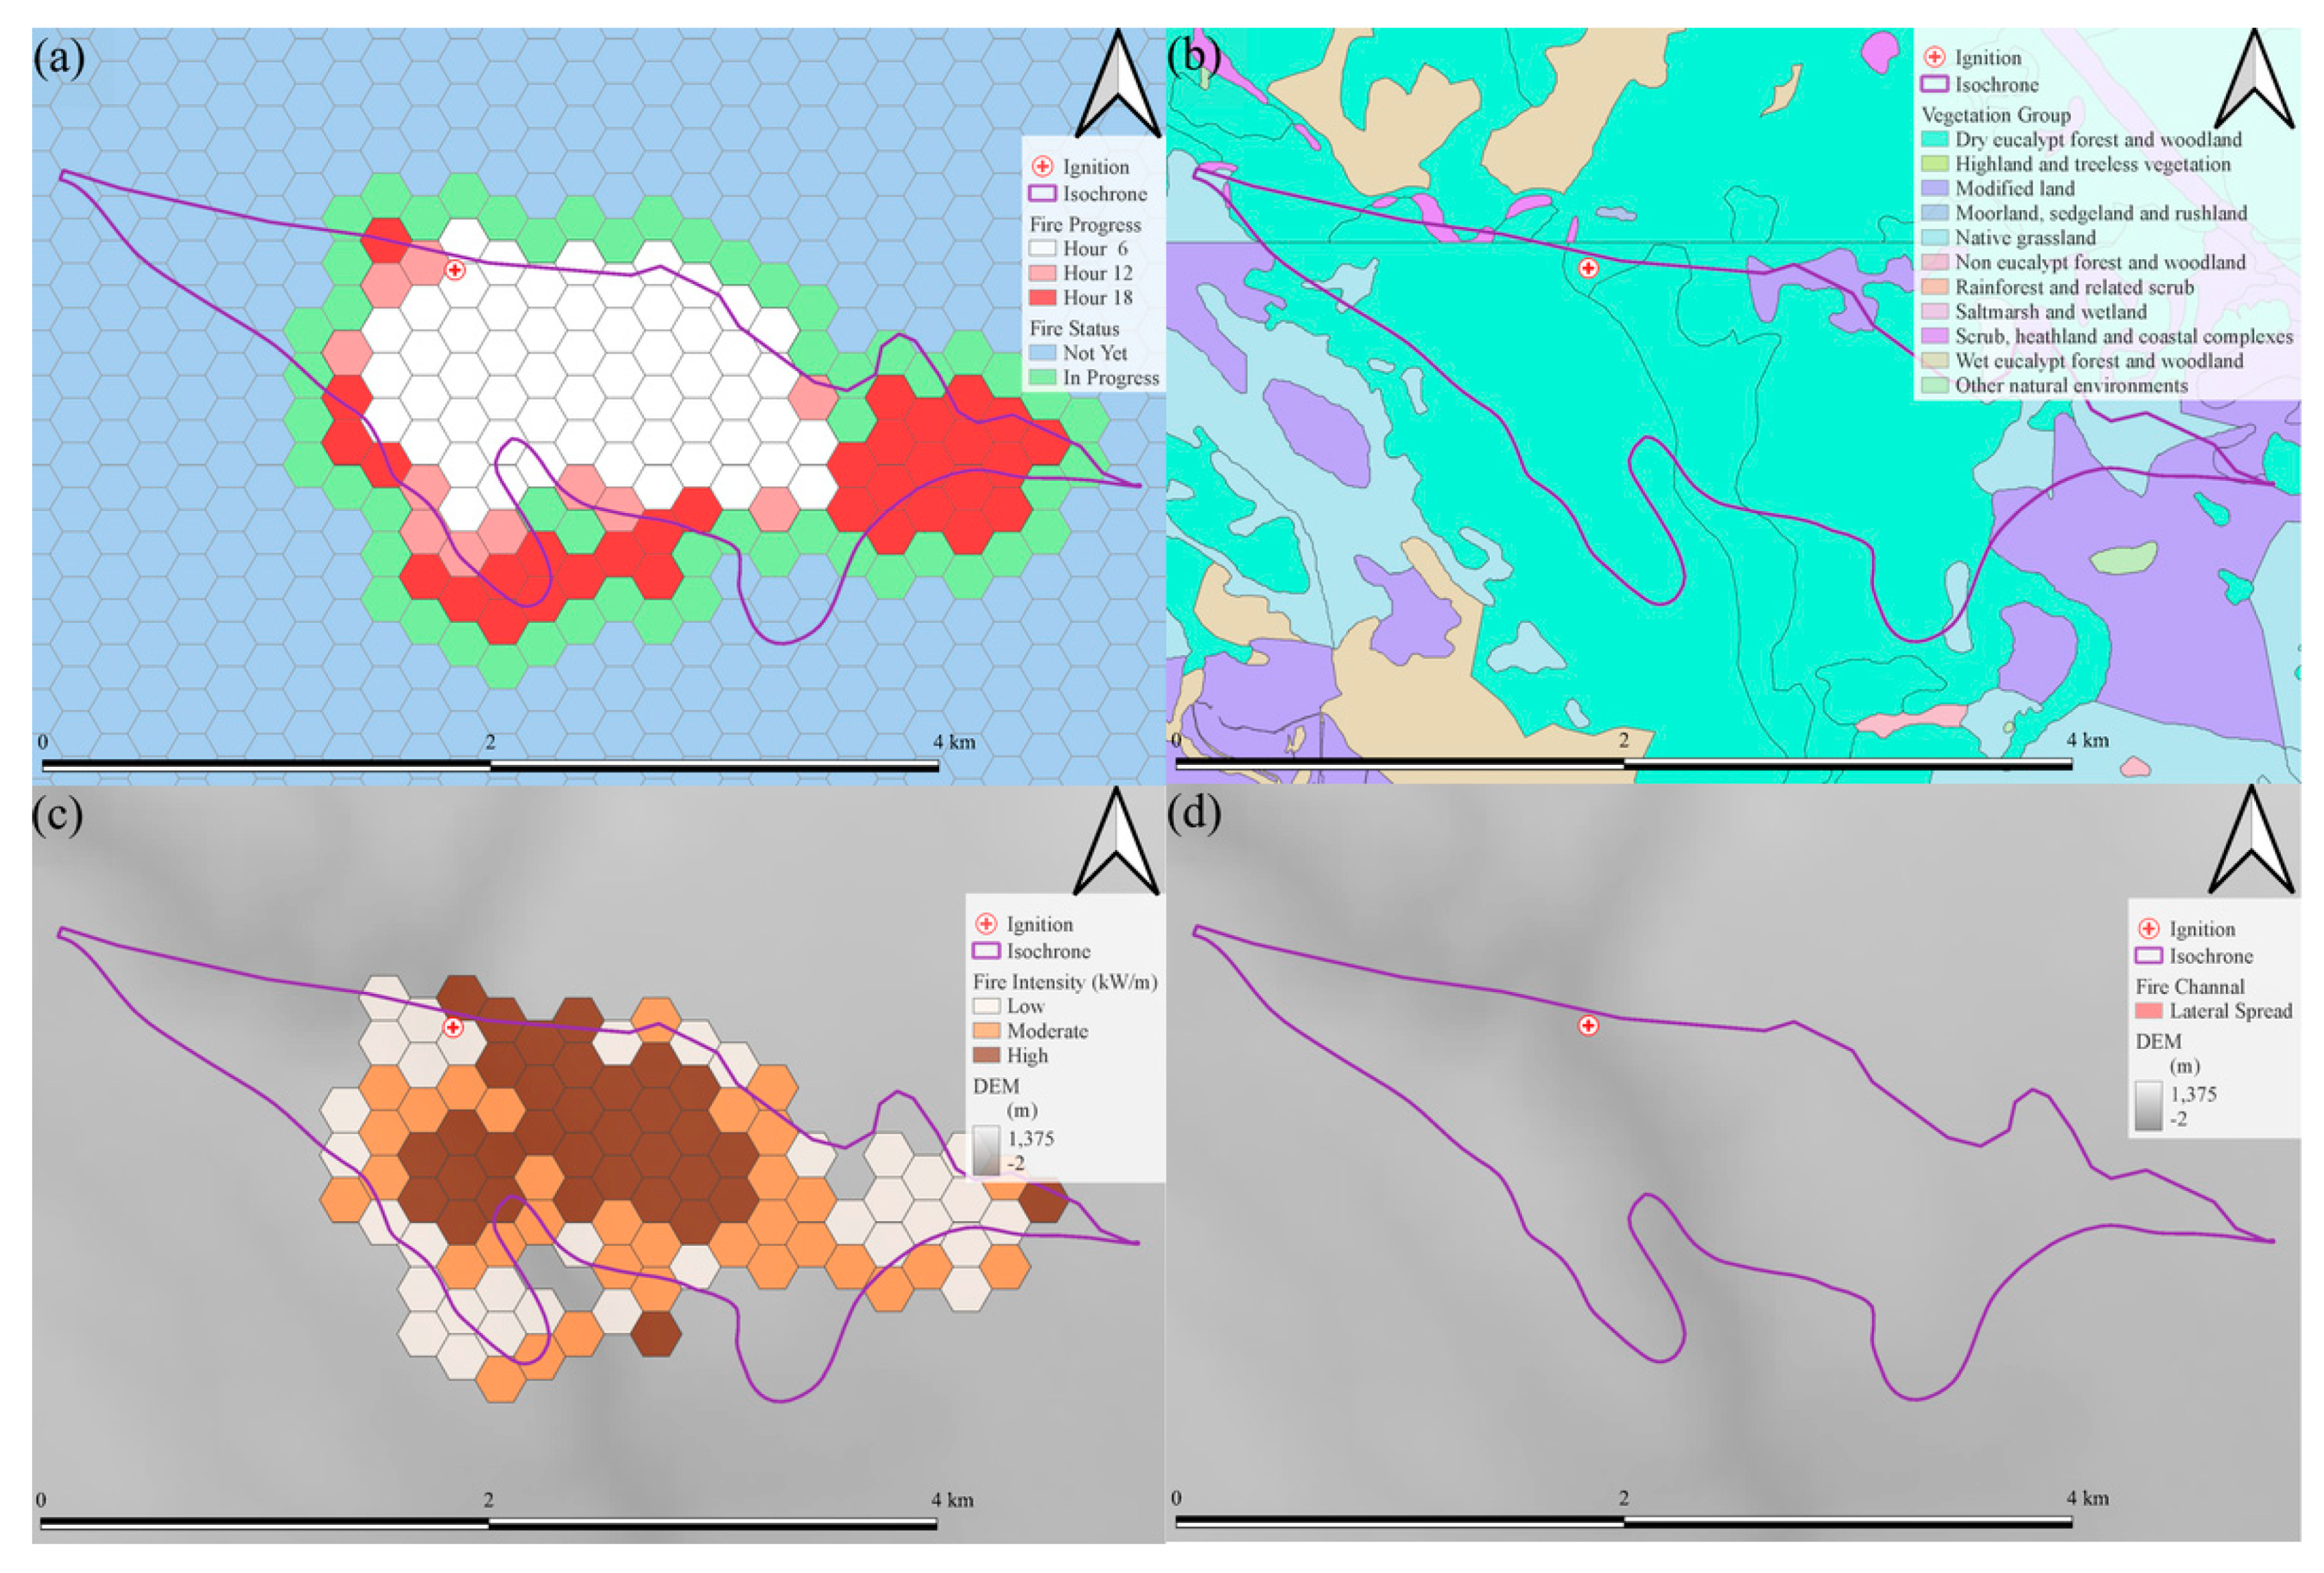
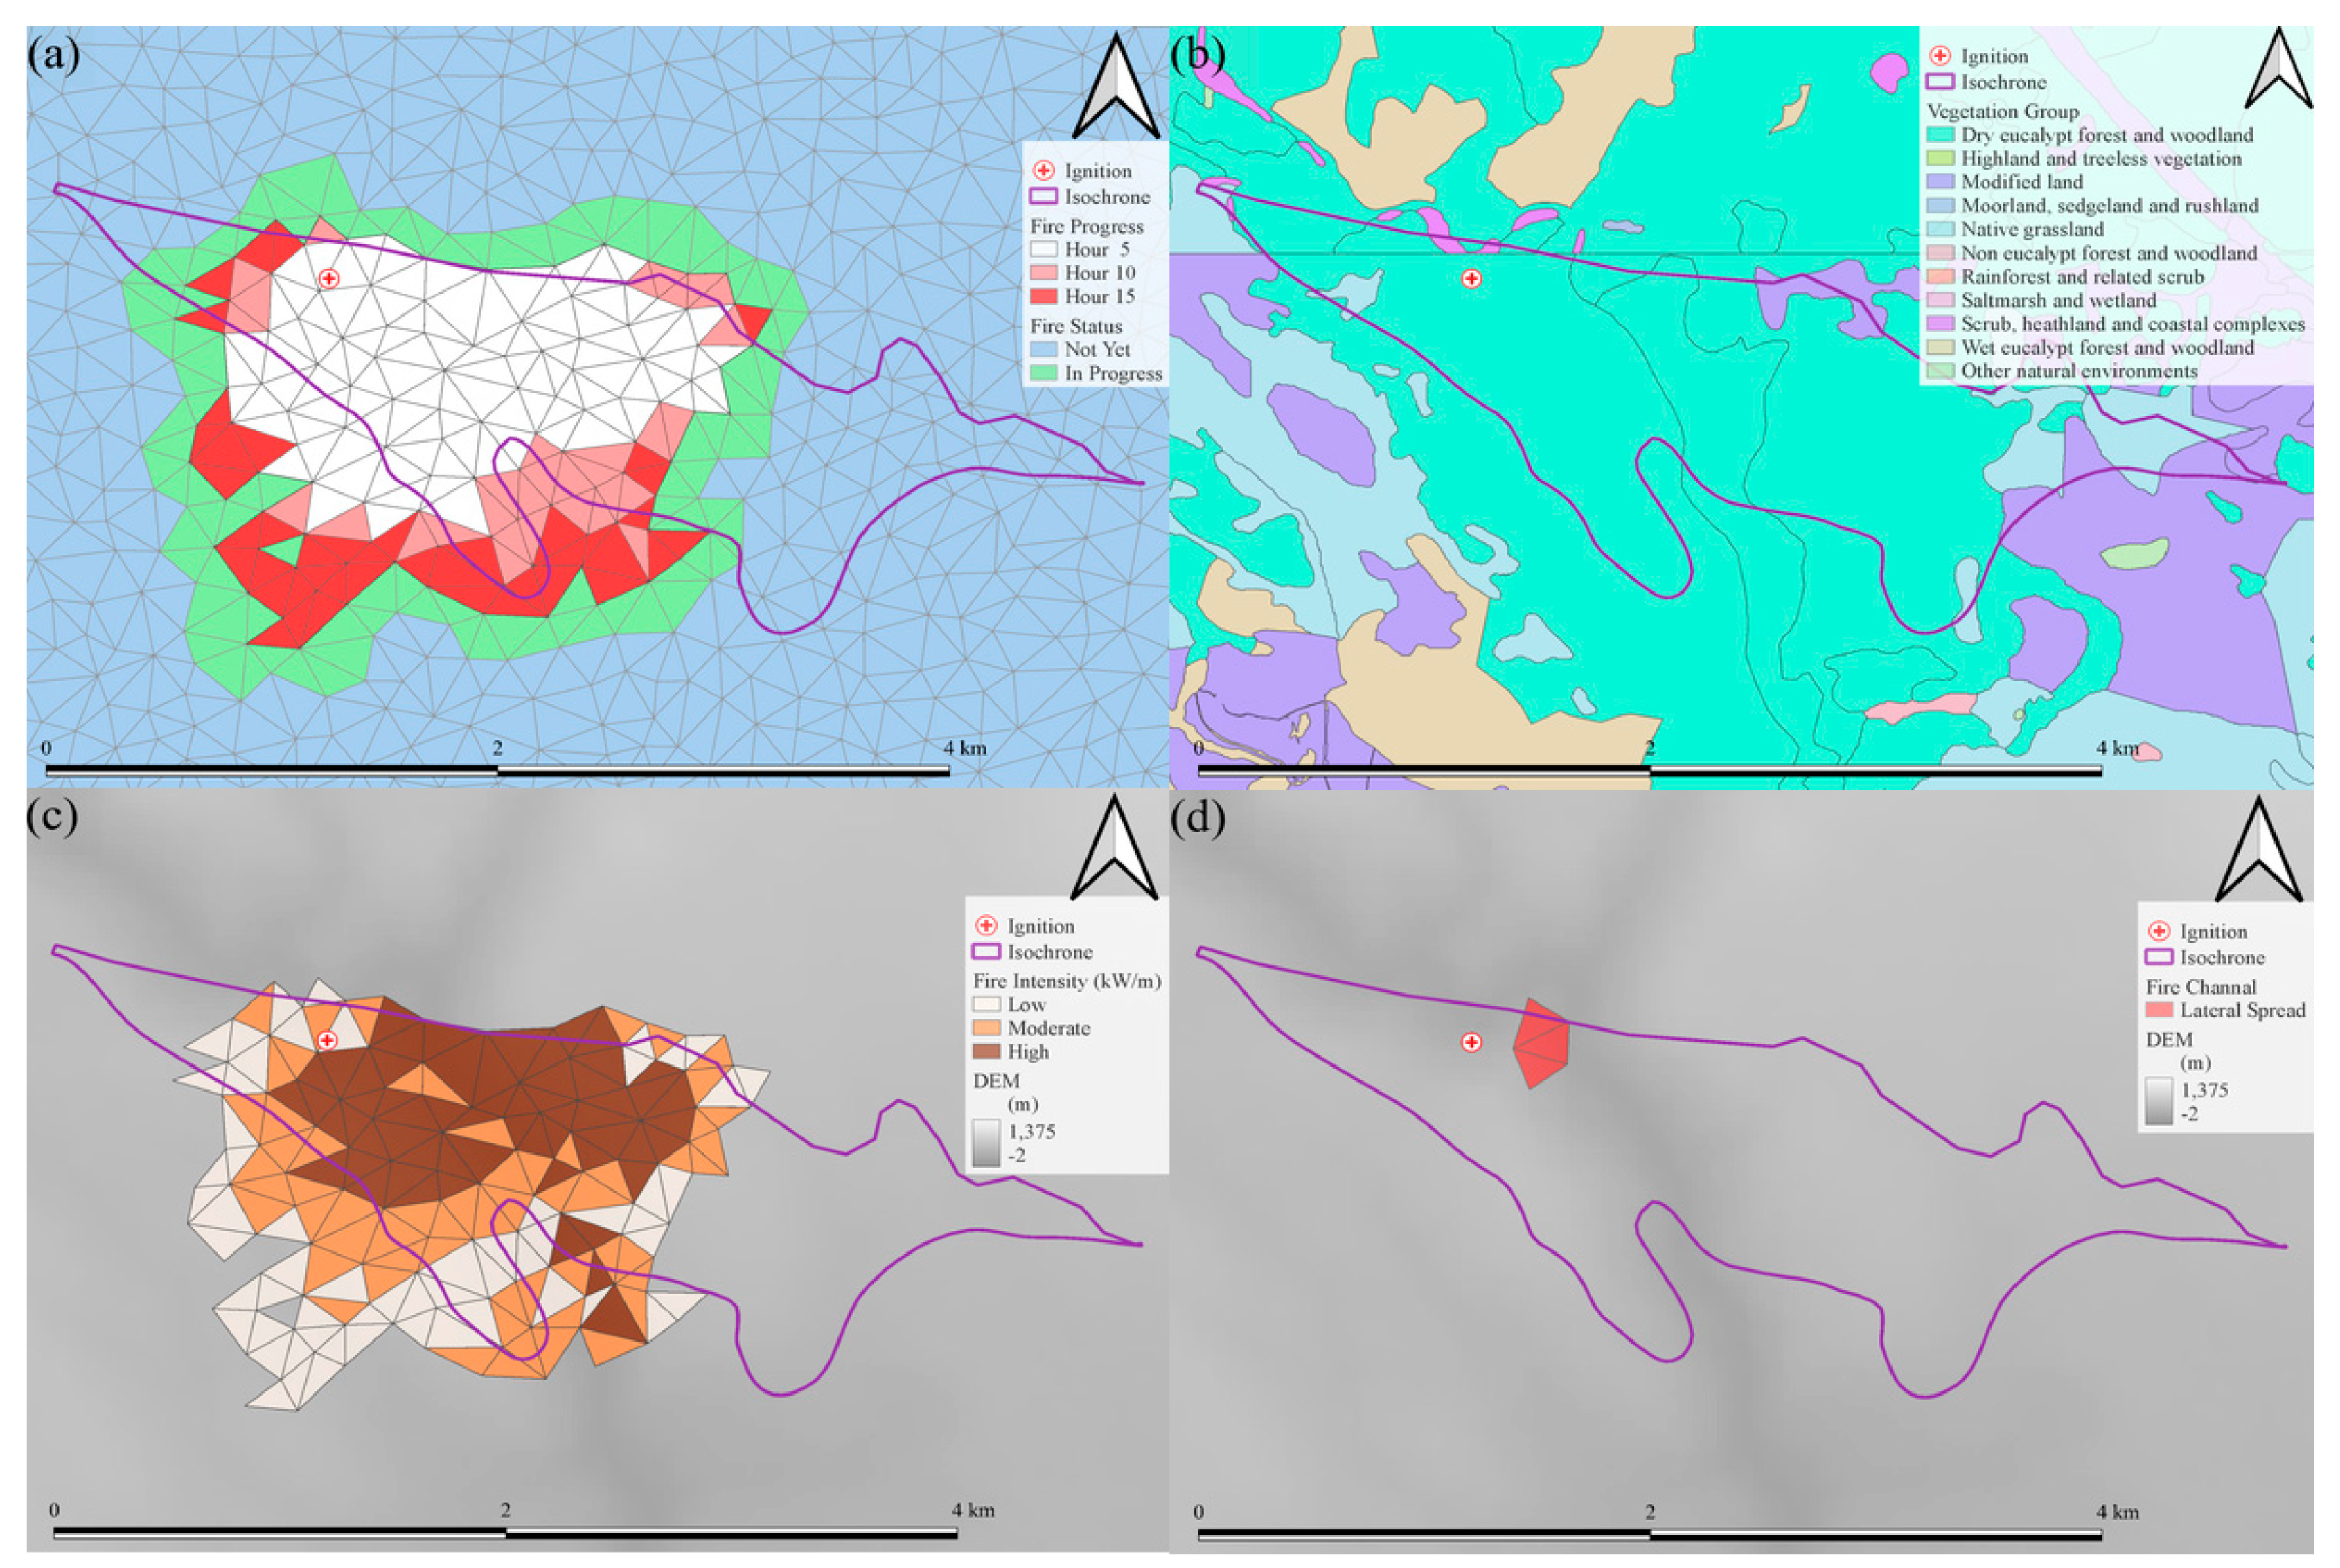
The fire simulations showed a strong ability to accurately model these propagations. The percentages of fractions skill scores (FSS) above threshold in the samples of fire isochrone #1 with pseudo station 1, #2 with station 2 and #2 with station 3 were 100%, 90% and 100% respectively. Fire appeared to intensify mostly along leeward direction of the starting point of fire regardless of topography. Lateral fire channelings (LFC) were confirmed along the valley axis in isochrone #1 while there were none or few LFCs in isochrone #2.
Figure 8,
Figure 9 and
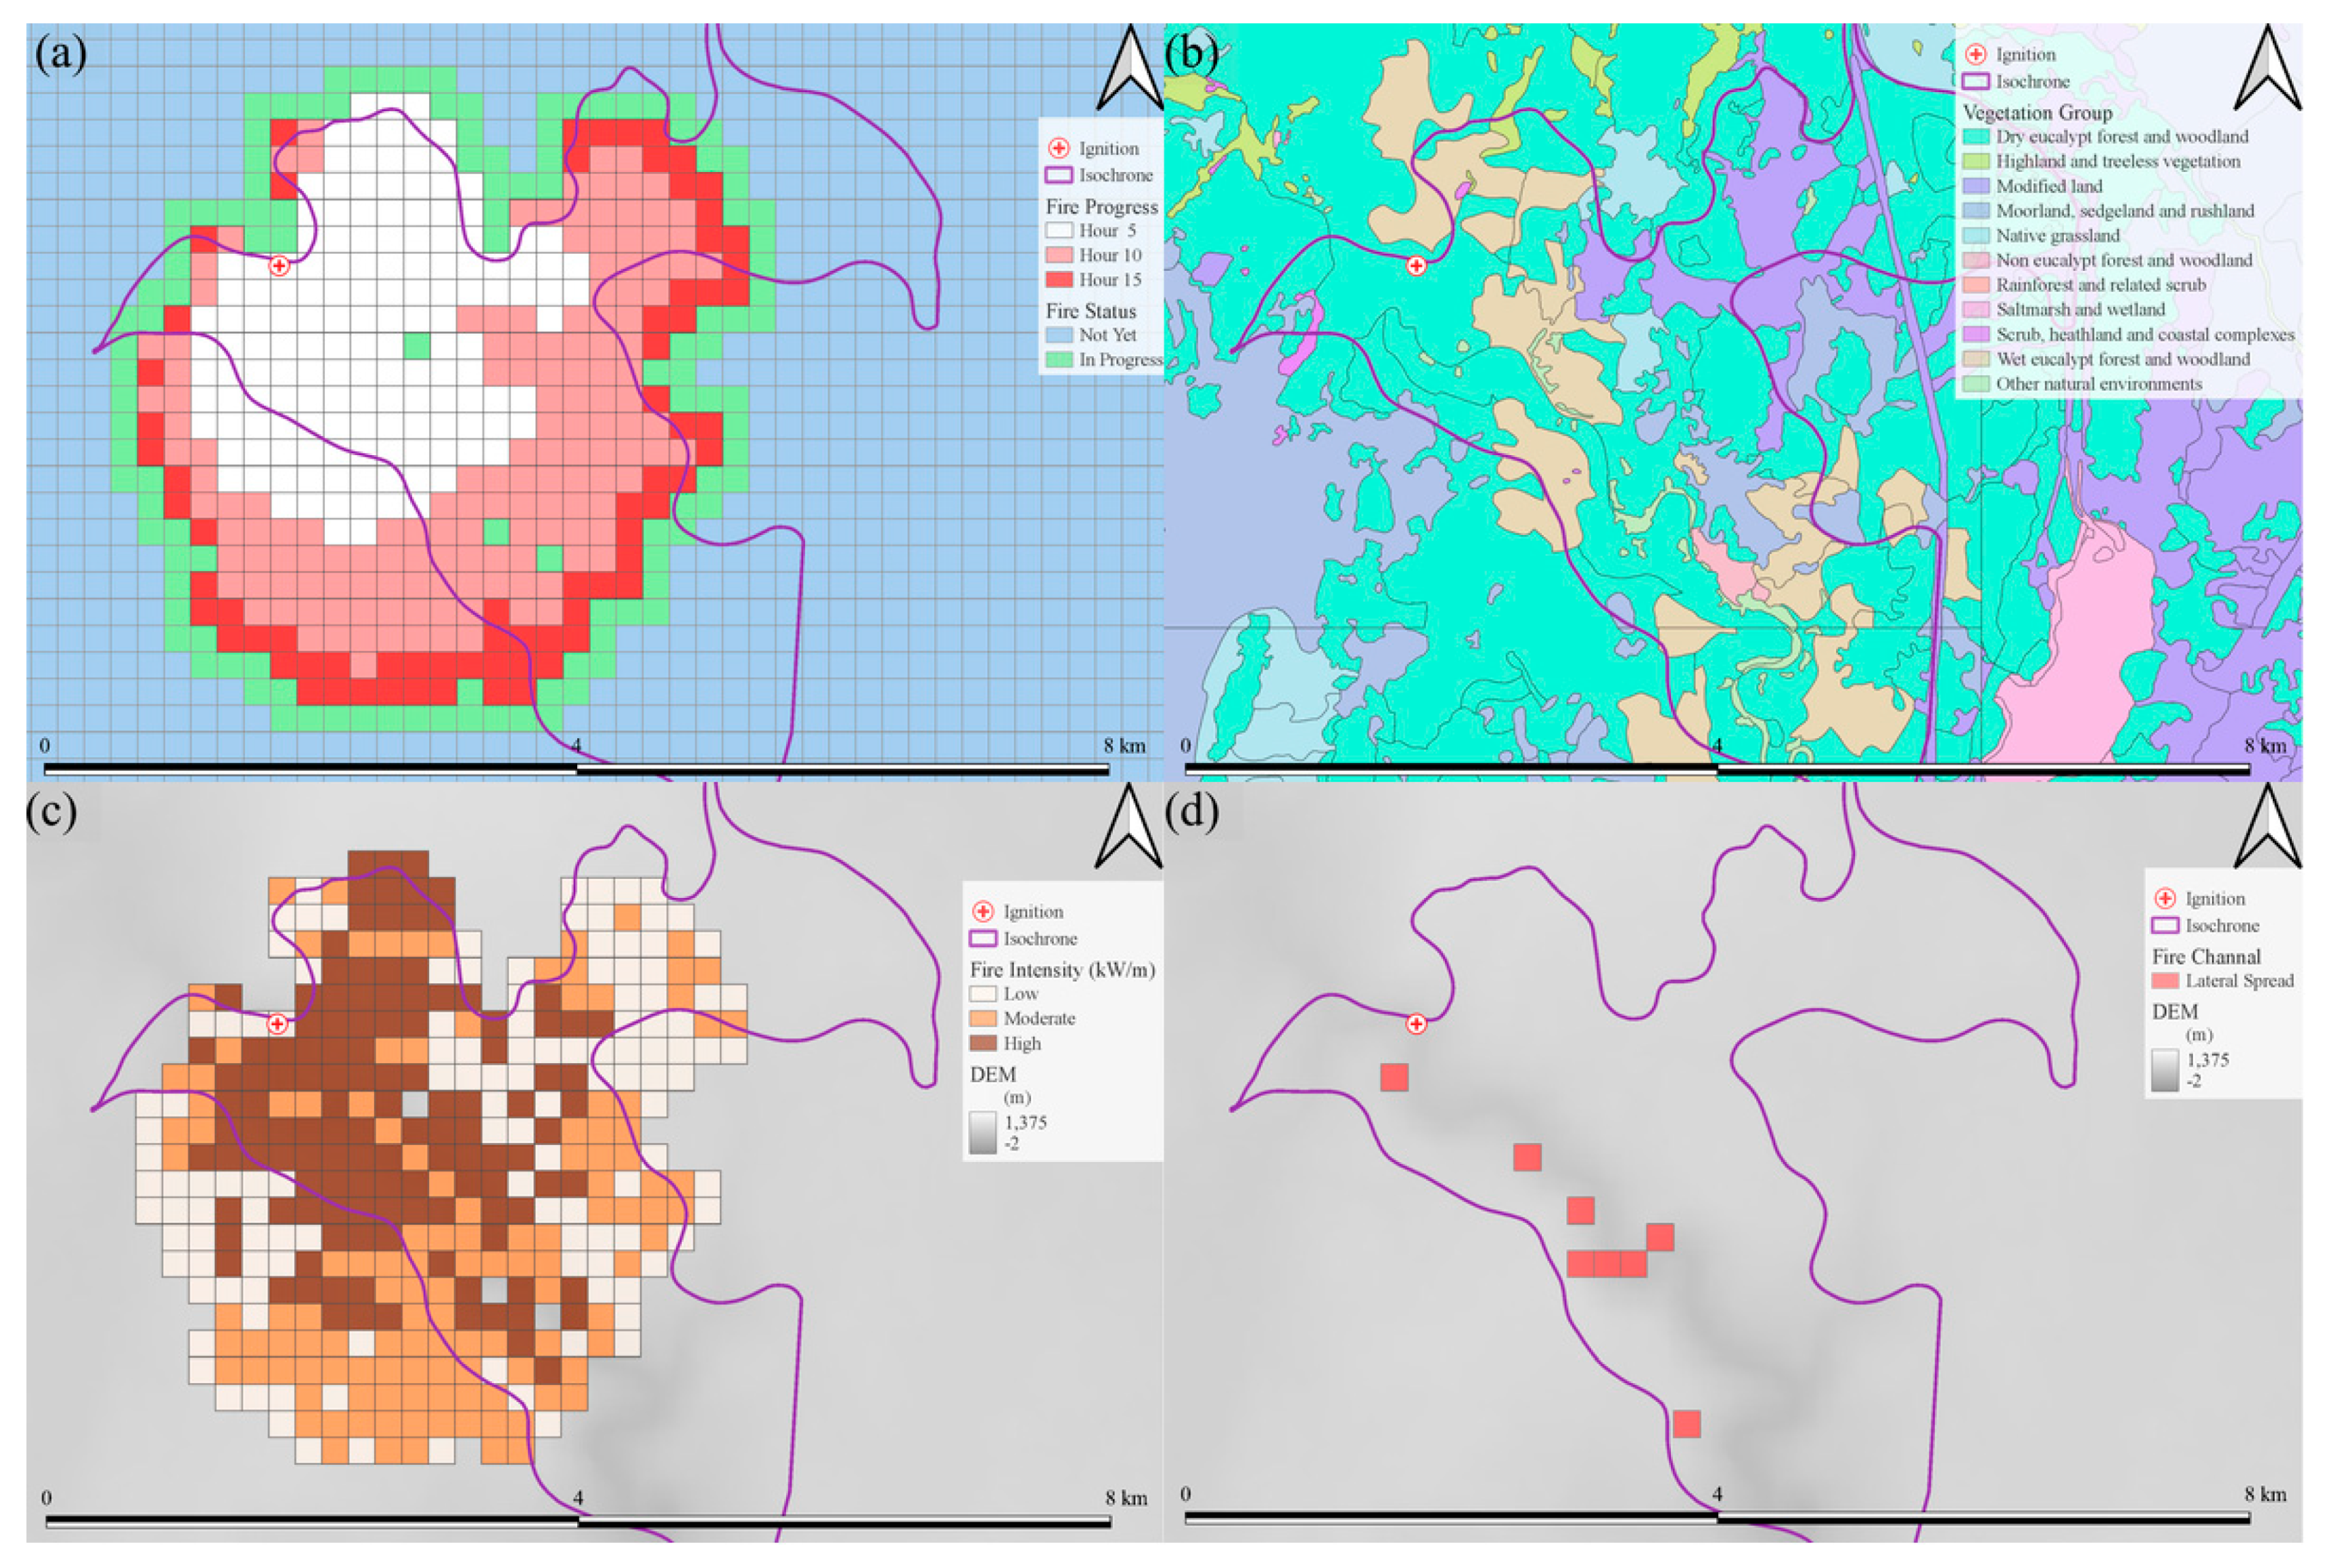
Figure 10 show fire propagation in (a), vegetation group in (b), fireline intensity in (c) and fire lateral channeling (d) for fire isochrone #1 with pseudo weather station 1, #2 with station 2 and #2 with station 3 respectively.
Firstly, the fire appeared to follow wind direction. The fire was initialized the at pseudo weather station represented by a cross circle icon along the valley axis in each simulation (
Figure 8,
Figure 9, and
Figure 10). The fire followed both wind direction and the valley axis in isochrone #1 because the wind direction was along the valley axis at the starting point of fire, visible at 11:30 on the 25
th of January. On the other hand, fire appeared to be guided by wind more than by topography after the ignition, visible at 18:16 on the 29
th of January in isochrone #2. Although the valley axis lies along a vector from northwest to southeast, the wind blew from west-northwest to east-southeast and the fire followed the wind direction in isochrone #2 (
Figure 5-1-a,
Figure 6-1-a,
Figure 9-a,
Figure 10-a).
Secondly, the modelled fireline intensity is the highest at the leading edge of the fire, as it moved in the direction of the wind. Darker grid colors indicate a higher fire intensity computed by the simulator (
Figure 8-c,
Figure 9-c, and
Figure 10-c). The highest intensities were simulated leeward of the ignition relative to wind direction. Because the intensity is recorded with fire propagation and counts in the rate of fire spread (ROS), it is dependent on the propagation. Therefore, the distribution of the simulated fireline intensity varied between two ignitions, even within the same isochrone (
Figure 9-c, and
Figure 10-c).
Thirdly, the potential for lateral fire channeling (LFC) was identified more frequently in isochrone #1 than in #2 even though the majority of vegetation was forest, which is one of its requirements (J. Sharples et al., 2017), in both isochrones (
Figure 8-b and -d,
Figure 9-b and -d, and
Figure 10-b and -d). The reason why LFC occurred more in #1 than #2 is the presence of greater wind speed. The magnitude of wind, which is also one of the requirements of LFC (J. Sharples et al., 2011, 2017; J. J. Sharples et al., 2012), was approximately 9
or 32
at the beginning of the fire, 11:30 on the 25
th January and increased gradually in #1 while it was around 5
or 18
when the fire started, 18:16 on the 29
th and decreased in #2 (1-b and -c in
Figure 4,
Figure 5 and
Figure 6).
4. Discussion and Conclusion: Relationship between Fireline Intensity and Dynamic winds
Synoptic wind had an impact on the fire propagation, fireline intensity and lateral fire channeling (LFC). Firstly, the fire propagated by following the wind rather than topography.
Figure 8 shows that the simulated fire propagated along the valley axis, although fire tends to climb faster than to descend in general (Sullivan et al., 2014). This is because the wind speed was approximately 9
or 32
at ignition, at 11:30 on the 25
th and increased in #1 (1-b and 2-b in
Figure 4). The wind direction was consistent with being synoptically forced, rather than forced solely by terrain and showed characteristics of forced channeling (FC) (
Figure 4-1-a). Some areas of potential lateral fire channeling (LFC) were identified in this isochrone (
Figure 8-d). On the other hand, the fire followed the wind direction in isochrone #2 even though the wind magnitude decreased from 5
or 18
at ignition, at 18:16 on the 29
th in #2. The wind type was identified as terrain forced flow (TFF); however, it was not strong enough to produce many LFCs (
Figure 9-d and
Figure 10-d). Secondly, the simulated fireline intensity, which indicates the difficulty to control the fire (Rossi et al., 2020), appeared to be dependent upon wind magnitude in a fire intensity plot in time series while it was dependent on wind directions the most in the simulation of fire propagation. Unfortunately, no hotspots were confirmed by satellite sensors at ignition, at 11:30 on the 25
th in isochrone #1, possibly due to the low resolution of satellite image (
Figure 7-a). On the other hand, all surface winds, fireline intensity and hotspots detected by the satellite showed a decline at 18:16 on the 29
th when the fire started in isochrone #2 (b and c in
Figure 7). Thirdly, the fireline intensity recorded with fire propagation depended on its wind direction (c in
Figure 8,
Figure 9 and
Figure 10). This is because fireline intensity is calculated with the rate of fire spread (ROS), which takes into account wind direction and magnitude along with other weather parameters. Lastly, the terrain effect is also important. For instance, the valley axis is aligned closer to east-west in the northern area of isochrone #2 and this orientation is similar to the direction of the wind guiding the fire in this isochrone (
Figure 3,
Figure 5,
Figure 6,
Figure 9 and
Figure 10). This wind type was found to be the terrain forced flow (TFF), which then determined the direction of fire propagation and intensity in the isochrone. Therefore, it is necessary to consider not only imminent but also broad interaction weather, topography and vegetation for fire propagation and intensity in such rugged terrain.
There are some limitations with our study. (1) Although, each cross section between preceding isochrone was linear, due to current constraints in the capabilities of Prototype 2, only a single ignition is allocated along the valley axis of each fire isochrone in order to reduce bias. (2) other limitations follows our previous study (Ozaki et al., 2022).
Although the fireline intensity was confirmed at some ignition points by comparison with satellite data, the quality of the calculation was constrained to the location of ignitions in our study. In future studies, the difficulty of the fire will be more accurately estimated when linear ignition is implemented.
References
- Australasian Fire and Emergency Service Authorities Council. (2019, July 1). AFAC Independent Operational Review: A review of the management of the Tasmanian fires of December 2018—March 2019. https://www.fire.tas.gov.au/userfiles/AFAC/AFAC_Review.pdf.
- Becker, A., & Bugmann, H. (2001). Global change and mountain regions (0284–8015). IGBP Stockholm, Sweden.
- Bowman, D. M. J. S., Kolden, C. A., & Williamson, G. J. (2022). Bushfires in Tasmania, Australia: An Introduction. Fire, 5(2). [CrossRef]
- Eizenberg, N., Jakob, D., Fox-Hughes, P., Steinle, P., White, C., & Franklin, C. (2021). BARRA v1.0: Kilometre-scale downscaling of an Australian regional atmospheric reanalysis over four midlatitude domains. Geoscientific Model Development, 14, 4357–4378. [CrossRef]
- Firelab. (n.d.). WindNinja. GitHub - Firelab/Windninja: A Diagnostic Wind Model Developed for Use in Wildland Fire Modeling. Retrieved 24 April 2022, from https://github.com/firelab/windninja.
- Firelab. (2020, May 13). WindNinja Tutorials version 3.6.0. WindNinja Tutorials Version 3.6.0. https://weather.firelab.org/windninja/tutorials/.
- Foulkes, J. A., Prior, L. D., Leonard, S. W. J., & Bowman, D. M. J. S. (2021). Demographic Effects of Severe Fire in Montane Shrubland on Tasmania’s Central Plateau. Fire, 4(3). [CrossRef]
- Geoscience Australia. (2020, May 23). Geoscience Australia. https://www.ga.gov.au/.
- Hague, B. S. Seasonal climate summary for Australia and the southern hemisphere (summer 2018–19): Extreme heat and flooding prominent. Journal of Southern Hemisphere Earth Systems Science 2021, 71, 147–158. [Google Scholar] [CrossRef]
- Handmer, J., & Keating, A. (2020). The Southwest Tasmania Fires of Summer 2018-2019: A Post Event Review Capability Study.
- Hofer, T. (2005). Introduction: The international year of mountains challenge and opportunity for mountain research. Global Change and Mountain Regions: An Overview of Current Knowledge, 1–8.
- Hydro Tasmania. (n.d.). Waddamana Power Station Heritage Site. Retrieved 18 January 2023, from https://www.hydro.com.au/things-to-do/waddamana-heritage-site.
- JAXA. (2022, September 13). Earth-graphy. https://earth.jaxa.jp/en/index.html.
- Keeley, J. E. Fire intensity, fire severity and burn severity: A brief review and suggested usage. International Journal of Wildland Fire 2009, 18, 116–126. [Google Scholar] [CrossRef]
- Land Information System Tasmania. (2020, May 18). LISTMap. http://maps.thelist.tas.gov.au/listmap/app/list/map.
- Lee, S.-C., KwofuAU-Xiong, XiaoxiongAU-Sun, ChengboAU-Anderson, SamuelTI-The S.-NPP VIIRS Day-Night Band On-Orbit Calibration/Characterization and Current State of SDR Products. (2014). The S-NPP VIIRS Day-Night Band On-Orbit Calibration/Characterization and Current State of SDR Products. Remote Sensing, 6(12), 12427–12446. [CrossRef]
- Listi, H., Sulma, S., Suwarsono, N., Zubaidah, A., & Prasasti, I. (2018). SPECTRAL ANALYSIS OF THE HIMAWARI-8 DATA FOR HOTSPOT DETECTION FROM LAND/FOREST FIRES IN SUMATRA. International Journal of Remote Sensing and Earth Sciences (IJReSES), 15, 15. [CrossRef]
- Mittermaier, M., & Roberts, N. Intercomparison of spatial forecast verification methods: Identifying skillful spatial scales using the fractions skill score. Weather and Forecasting 2010, 25, 343–354.
- ORNL DAAC. (2018). MODIS and VIIRS Land Products Global Subsetting and Visualization Tool. https://www.earthdata.nasa.gov/learn/find-data/near-real-time/viirs.
- Ozaki, M., Aryal, J., & Fox-Hughes, P. Dynamic wildfire navigation system. ISPRS International Journal of Geo-Information 2019, 8, 194.
- Ozaki, M., Harris, R. M. B., Love, P. T., Aryal, J., Fox-Hughes, P., & Williamson, G. J. (2022). Impact of Vertical Atmospheric Structure on an Atypical Fire in a Mountain Valley. Fire, 5(4). [CrossRef]
- Pain, C. F., Pillans, B. J., Roach, I. C., Worrall, L., & Wilford, J. R. (2012). Old, flat and red–Australia’s distinctive landscape. Shaping a Nation: A Geology of Australia, 227–275.
- Richards, K., & Spencer, C. P. Jewels on fire! The Miena Jewel Beetle, Castiarina insculpta (Carter, 1934)(Coleoptera: Buprestidae), and the 2019 Great Pine Tier fire. Tasmanian Naturalist 2020, 142, 35–40.
- Roberts, N. M., & Lean, H. W. (2008). Scale-Selective Verification of Rainfall Accumulations from High-Resolution Forecasts of Convective Events. Monthly Weather Review, 136(1), 78–97. [CrossRef]
- Rossi, J. L., Chatelon, F. J., & Marcelli, T. (2019). Fire Intensity. In S. L. Manzello (Ed.), Encyclopedia of Wildfires and Wildland-Urban Interface (WUI) Fires (pp. 1–6). Springer International Publishing.
- Rossi, J. L., Chatelon, F. J., & Marcelli, T. (2020). Fire Intensity. In S. L. Manzello (Ed.), Encyclopedia of Wildfires and Wildland-Urban Interface (WUI) Fires (pp. 391–397). Springer International Publishing. [CrossRef]
- Schroeder, W. (2017, December 1). Visible Infrared Imaging Radiometer Suite (VIIRS) 375 m & 750 m Active Fire Detection Data Sets Based on NASA VIIRS Land Science Investigator Processing System (SIPS) Reprocessed Data—Version 1 [Product User’s Guide]. Visible Infrared Imaging Radiometer Suite (VIIRS) 375 m & 750 m Active Fire Detection Data Sets Based on NASA VIIRS Land Science Investigator Processing System (SIPS) Reprocessed Data - Version 1. https://lpdaac.usgs.gov/documents/132/VNP14_User_Guide_v1.3.pdf.
- Sharples, J. J. Sharples, J. J. An overview of mountain meteorological effects relevant to fire behaviour and bushfire risk. International Journal of Wildland Fire 2009, 18, 737–754. [Google Scholar] [CrossRef]
- Sharples, J. J., McRae, R. H., & Wilkes, S. R. Wind-terrain effects on the propagation of wildfires in rugged terrain: Fire channelling. International Journal of Wildland Fire 2012, 21, 282–296.
- Sharples, J., Richards, R., Hilton, J., Ferguson, S., Cohen, R., & Thatcher, M. (2017). Dynamic simulation of the Cape Barren Island fire using the Spark framework. 1111–1117.
- Sharples, J., Viegas, D., McRae, R., Raposo, J., & Farinha, H. (2011). Lateral bushfire propagation driven by the interaction of wind, terrain and fire. 235–241.
- Skok, G., & Roberts, N. Analysis of fractions skill score properties for random precipitation fields and ECMWF forecasts. Quarterly Journal of the Royal Meteorological Society 2016, 142, 2599–2610.
- Su, C.-H., Eizenberg, N., Steinle, P., Jakob, D., Fox-Hughes, P., White, C. J., Rennie, S., Franklin, C., Dharssi, I., & Zhu, H. BARRA v1. 0: The bureau of meteorology atmospheric high-resolution regional reanalysis for Australia. Geoscientific Model Development 2019, 12, 2049–2068.
- Sullivan, A. L., Sharples, J. J., Matthews, S., & Plucinski, M. P. A downslope fire spread correction factor based on landscape-scale fire behaviour. Environmental Modelling and Software 2014, 62, 153–163.
- The Australasian Fire and Emergency Service Authorities Council (AFAC). (2022, June 21). Australian Fire Danger Rating System Technical Guide. https://www.afac.com.au/initiative/afdrs/technical-resources.
- Wang, W.-C., ChangyongTI-NOAA-20 and S.-NPP VIIRS Thermal Emissive Bands On-Orbit Calibration Algorithm Update and Long-Term Performance Inter-Comparison. (2021). NOAA-20 and S-NPP VIIRS Thermal Emissive Bands On-Orbit Calibration Algorithm Update and Long-Term Performance Inter-Comparison. Remote Sensing, 13(3). [CrossRef]
- Westerling, A. L., Cayan, D. R., Brown, T. J., Hall, B. L., & Riddle, L. G. (2004). Climate, Santa Ana Winds and autumn wildfires in southern California. Eos, Transactions American Geophysical Union, 85(31), 289–296. [CrossRef]
- Whiteman, C. D. Mountain meteorology: Fundamentals and applications; Oxford University Press: New York, USA, 2020. [Google Scholar]
- Yumimoto, K., Nagao, T. M., Kikuchi, M., Sekiyama, T. T., Murakami, H., Tanaka, T. Y., Ogi, A., Irie, H., Khatri, P., Okumura, H., Arai, K., Morino, I., Uchino, O., & Maki, T. (2016). Aerosol data assimilation using data from Himawari-8, a next-generation geostationary meteorological satellite. Geophysical Research Letters, 43(11), 5886–5894. [CrossRef]
|
Disclaimer/Publisher’s Note: The statements, opinions and data contained in all publications are solely those of the individual author(s) and contributor(s) and not of MDPI and/or the editor(s). MDPI and/or the editor(s) disclaim responsibility for any injury to people or property resulting from any ideas, methods, instructions or products referred to in the content. |
© 2023 by the authors. Licensee MDPI, Basel, Switzerland. This article is an open access article distributed under the terms and conditions of the Creative Commons Attribution (CC BY) license (http://creativecommons.org/licenses/by/4.0/).
