Submitted:
12 July 2023
Posted:
21 July 2023
You are already at the latest version
Abstract
Keywords:
1. Introduction
2. Experimental materials and procedures
3. Results and discussion
3.1. Weld appearance
3.2. Microstructure
3.3. Mechanical properties
4. Conclusions
Acknowledgements
References
- Hammarberg, S.; Kajberg, J.; Larsson, S. Ultra high strength steel sandwich for lightweight applications. SN Appl. Sci. 2020, 2, 1040. [Google Scholar] [CrossRef]
- Zhang, T.L.; Wang, W.G.; Ma, Y.M.; Fang, N.W.; Lin, S.B.; Li, Z.X.; Kou, S. In situ observation of microstructural and inclusions evolution in high-strength steel deposited metals with various rare earth Pr contents. J. Materials 2022, 15, 1257. [Google Scholar] [CrossRef]
- Schmitt, J.H.; Iung, T. New Developments of Advanced High-Strength Steels for Automotive Applications. C. R. Phys. 2018, 19, 641–656. [Google Scholar] [CrossRef]
- Karbasian, H.; Tekkaya, A.E. A Review on Hot Stamping. J. Mater. Process. Technol. 2010, 210, 2103–2118. [Google Scholar] [CrossRef]
- Mori, K.; Ito, D. Prevention of Oxidation in Hot Stamping of Quenchable Steel Sheet by Oxidation Preventive Oil. CIRP. Ann. Manuf. Technol. 2009, 58, 267–270. [Google Scholar] [CrossRef]
- Ighodaro, O.L.; Biro, E.; Zhou, Y.N. Comparative Effects of Al-Si and Galvannealed Coatings on the Properties of Resistance SpotWelded Hot Stamping Steel Joints. J. Mater. Process. Technol. 2016, 236, 64–72. [Google Scholar] [CrossRef]
- Jia, J.; Yang, S.L.; Ni, W.Y.; Bai, J.Y. Microstructure and Mechanical Properties of fiber Laser Welded Joints of Ultrahigh-Strength Steel 22MnB5 and Dual-Phase Steels. J. Mater. Res. 2014, 29, 2565–2575. [Google Scholar] [CrossRef]
- Li, Y.L.; Liu, Y.R.; Yang, J. First Principle Calculations and Mechanical Properties of the Intermetallic Compounds in a Laser Welded Steel/Aluminum Joint. Opt. Laser Technol. 2020, 122, 105875. [Google Scholar] [CrossRef]
- Zhou, D.W.; Xu, S.H.; Peng, L.; Liu, J.S. Laser lap Welding Quality of Steel/Aluminum Dissimilar Metal Joint and its Electronic Simulations. Int. J. Adv. Manuf. Technol. 2016, 86, 2231–2242. [Google Scholar] [CrossRef]
- Kim, C.; Kang, M.J.; Park, Y.D. Laser welding of Al-Si coated hot stamping steel. Pro. Eng. 2011, 10, 2226–2231. [Google Scholar] [CrossRef]
- Lin, W.H.; Li, F.; Wu, D.S.; Chen, X.G.; Hua, X.M.; Pan, H. Effect of Al-Si coating on weld microstructure and properties of 22MnB5 steel joints for hot stamping. J. Mater. Eng. Perform. 2017, 27, 1825–1836. [Google Scholar] [CrossRef]
- Saha, D.C.; Biro, E.; Gerlich, A.P.; Zhou, Y.N. Fusion zone microstructure evolution of fiber laser welded press hardened steels. Scr. Mater. 2016, 121, 18–22. [Google Scholar] [CrossRef]
- Lin, W.H.; Li, F.; Hua, X. Effect of filler wire on laser welded blanks of Al-Si-coated 22MnB5 steel. J. Mater. Process. Technol. 2018, 259, 195–205. [Google Scholar] [CrossRef]
- Völkers, S.; Somonov, V.; Böhm, H.C.S. Influence on the Microstructure of Laser Beam Welds of High-strength Steels. J. Lightweight des worldw. 2017, 10, 40–45. [Google Scholar] [CrossRef]
- Khan, M.S.; Razmpoosh, M.H.; Macwan, A. Optimizing weld morphology and mechanical properties of laser welded Al-Si coated 22MnB5 by surface application of colloidal graphite. J. Mater. Process. Technol. 2021, 293, 117093. [Google Scholar] [CrossRef]
- He, X.; Qin, Y.Q.; Jiang, W.X. Effect of Welding Parameters on Microstructure and Mechanical Properties of Laser Welded Al-Si Coated 22MnB5 hot Stamping Steel. J. Mater. Process. Technol. 2019, 270, 285–290. [Google Scholar] [CrossRef]
- Zhang, D.F.; Qin, Y.Q.; Zhao, F.; Liang, M. Microstructure and Mechanical Properties of Laser Welded Al-Si Coated 22MnB5 hot Stamping Steel and Galvanized Steel. J. Mater. Eng. Perform. 2021, 31, 1346. [Google Scholar] [CrossRef]
- Razmpoosh, M.H.; Macwan, A.; Biro, E.; Zhou, Y. Microstructure and dynamic tensile characteristics of dissimilar fiber laser welded advanced high strength steels. Mater. Sci. Eng. A-Struct. 2020, 773, 1–10. [Google Scholar] [CrossRef]
- Min, S.L.; Moon, J.H.; Kang, C.G. Investigation of formability and surface micro-crack in hot deep drawing by using laser-welded blank of Al–Si and Zn-coated boron steel. J. Eng. Manuf. 2014, 228, 540–552. [Google Scholar]
- Zhao, F.; Qin, Y.Q.; Zhang, D.F. Effect of Filler Wire on Laser Lap Welding of Al-Si Coated 22MnB5 Hot Stamping Steel. J. Mater. Eng. Perform. 2022, 31, 9670–9680. [Google Scholar] [CrossRef]
- Yao, Z.; Xu, G.; Jiang, Z. Effects of Ni and Cr on Cryogenic Impact Toughness of Bainite/Martensite Multiphase Steels. Met. Mater. Int. 2019, 25, 1151–1160. [Google Scholar] [CrossRef]
- Khan, M.S.; Razmpoosh, M.H.; Biro, E. α-Ferrite Suppression during Fiber Laser Welding of Al-Si Coated 22MnB5 Press-Hardened Steel. Weld. J. 2021, 100, 213–220. [Google Scholar] [CrossRef]

| Chemical compositions (w.%) | Tensile properties | ||||||||||
| BM | C | Mn | Si | Cr | B | Ti | Al | Fe | UTS (MPa) |
YS (MPa) |
Elongations (%) |
| 22MnB5 | 0.23 | 1.13 | 0.27 | 0.16 | 0.0025 | 0.038 | 0.037 | Bal | 1500 | 1200 | 4.1 |
| GA steel | 0.041 | 0.187 | 0.018 | 0.04 | - | 0.011 | 0.0032 | Bal | 350 | 300 | 11.5 |
| Component /wt.% | P1 | P2 | P3 | P4 | P5 | P6 | P7 | P8 |
| Al | 7.65 | 6.73 | 3.76 | 3.11 | 0.72 | 0.63 | 0.86 | 0.90 |
| Si | 0.98 | 0.75 | 0.89 | 0.54 | 0.46 | 0.23 | 0.31 | 0.02 |
| Ni | 0.12 | 0.18 | 2.72 | 1.40 | 1.35 | 4.81 | 1.42 | 3.27 |
| Fe | Bal. | Bal. | Bal. | Bal. | Bal. | Bal. | Bal. | Bal. |
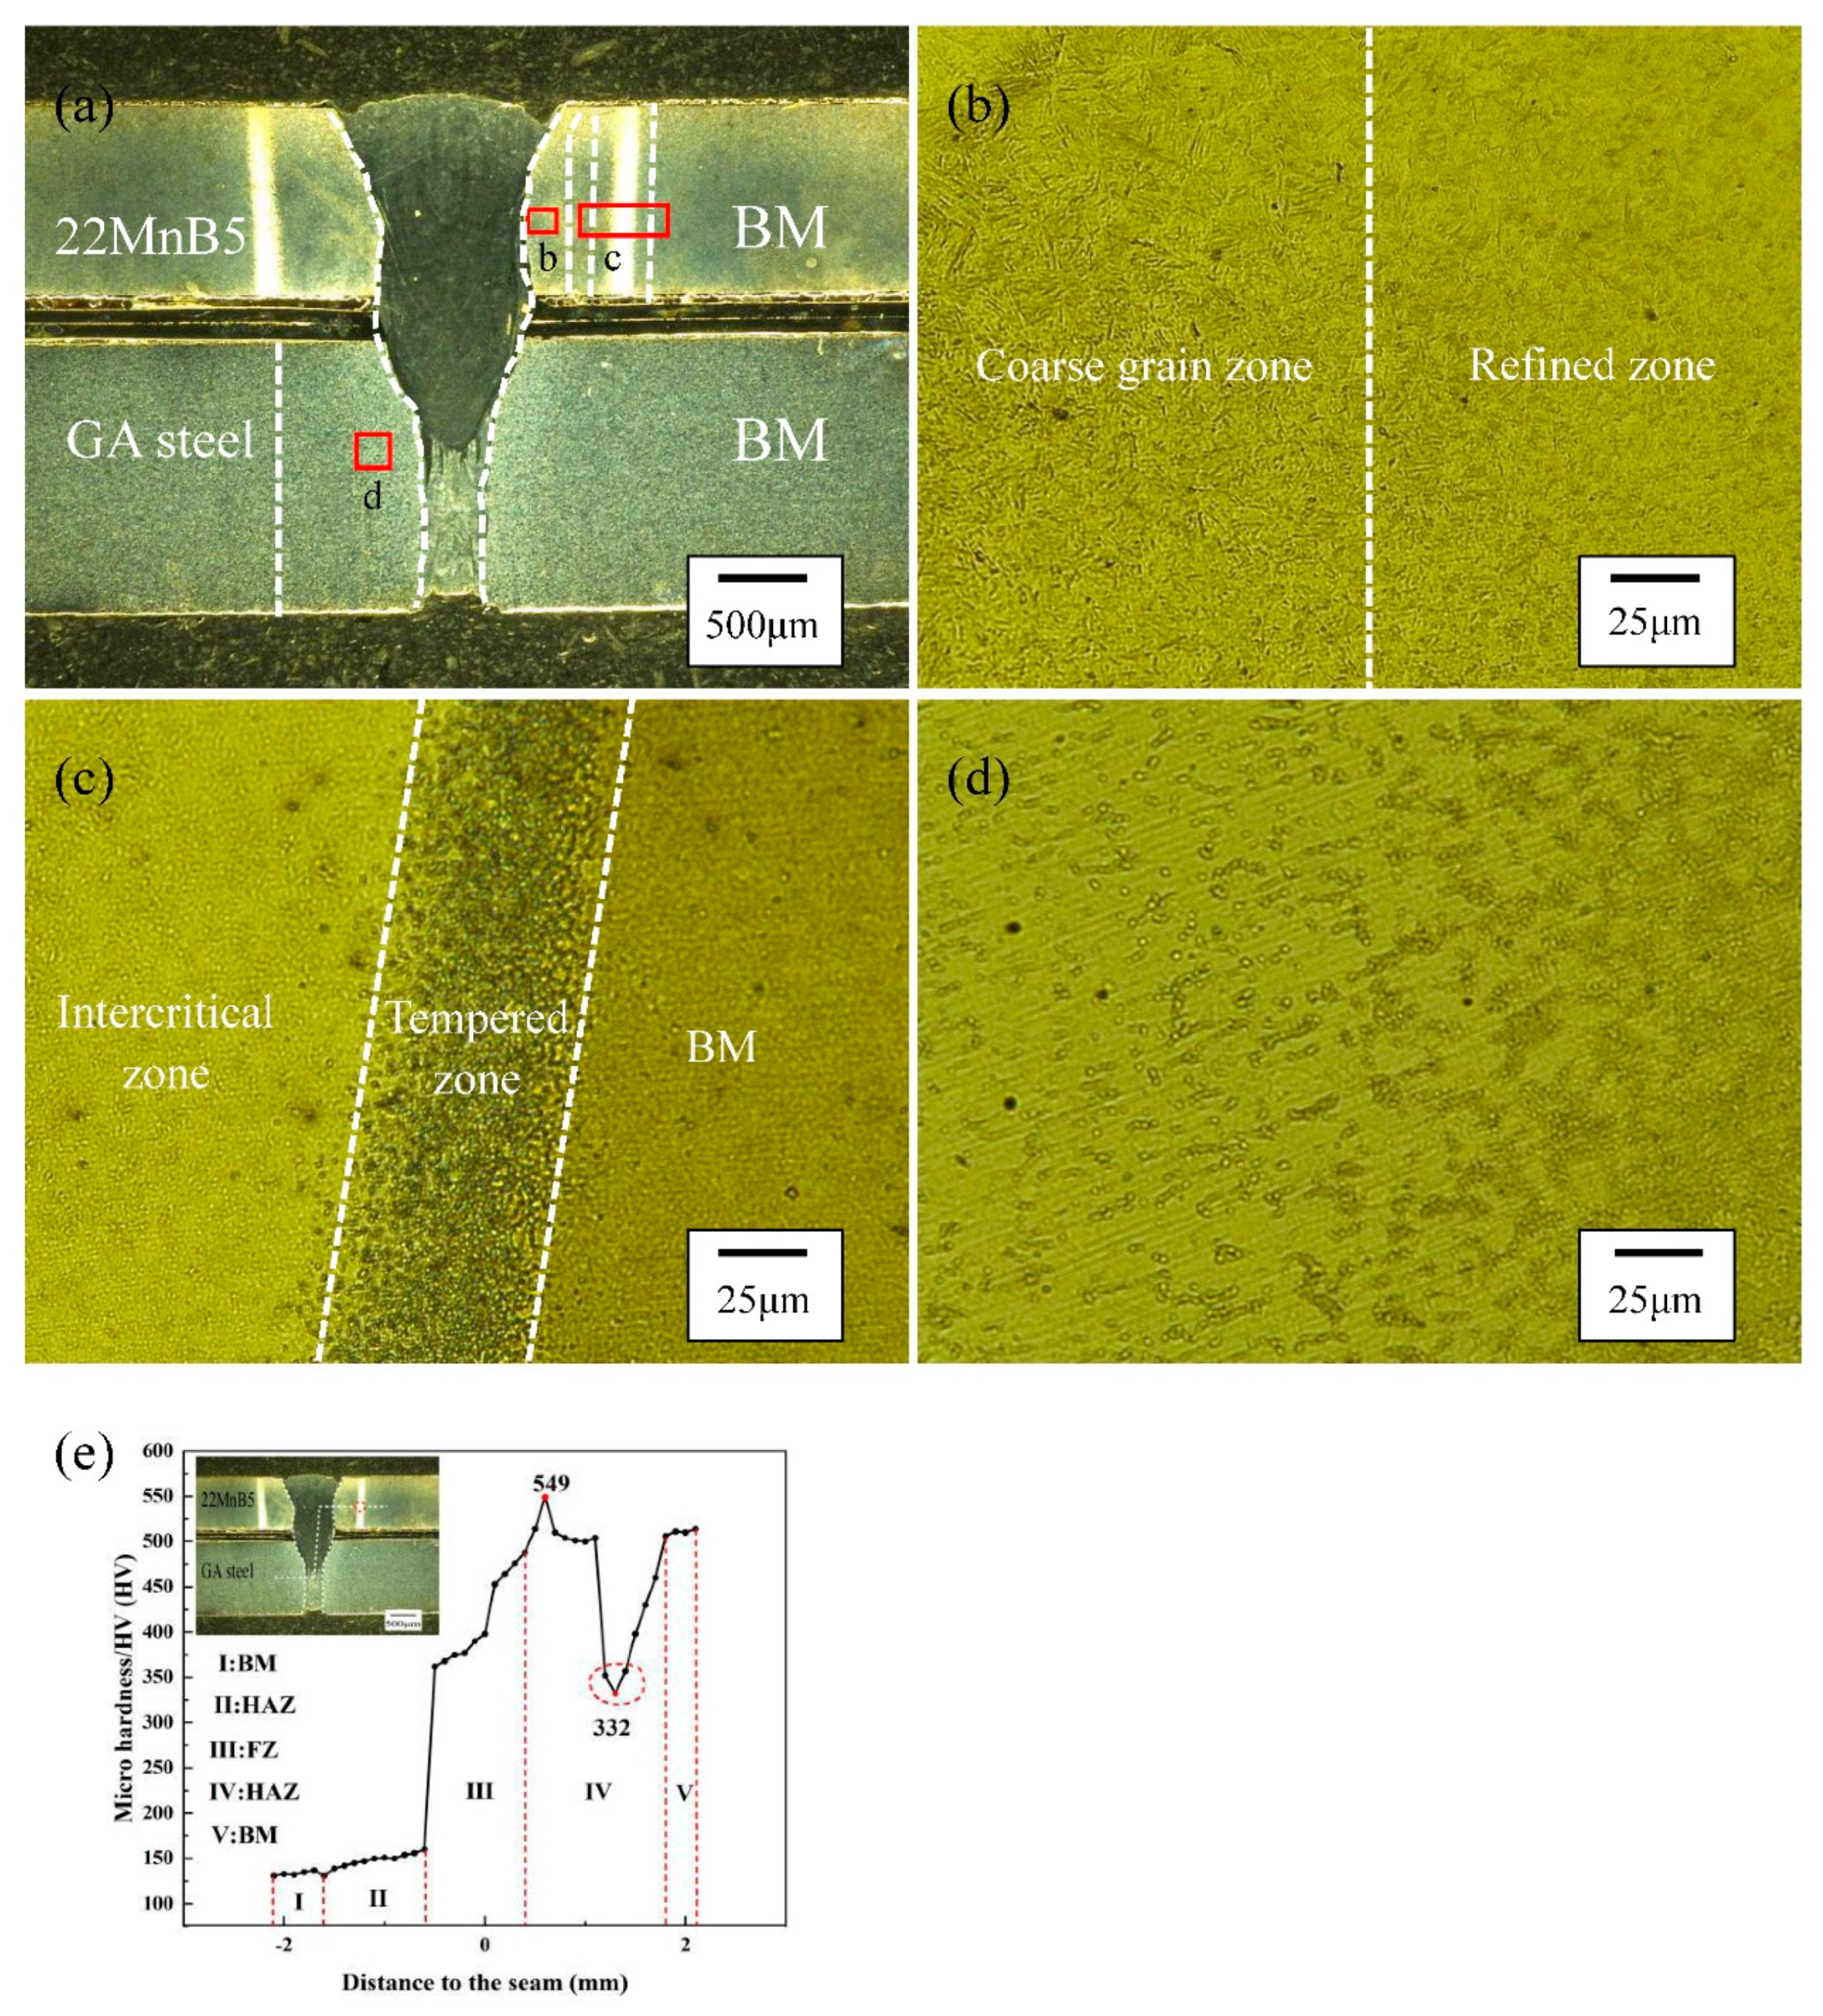
| zone | Critical temperature | phase transition process | |
| heat affected zone (22MnB5) |
Coarse grain zone | Ac3<T<1100℃ | M→γ→M |
| Refined zone | 1100℃<T<TL | ||
| Incompletely quenched zone | Ac1<T<Ac3 | M→γ+α-Fe→M+α-Fe | |
| Tempering zone | Ttemper<T<Ac1 | M→TM | |
| heat affected zone (GA) |
Incompletely recrystallized zone | Ac1<T | α-Fe+P→γ+α-Fe+P→F+P |
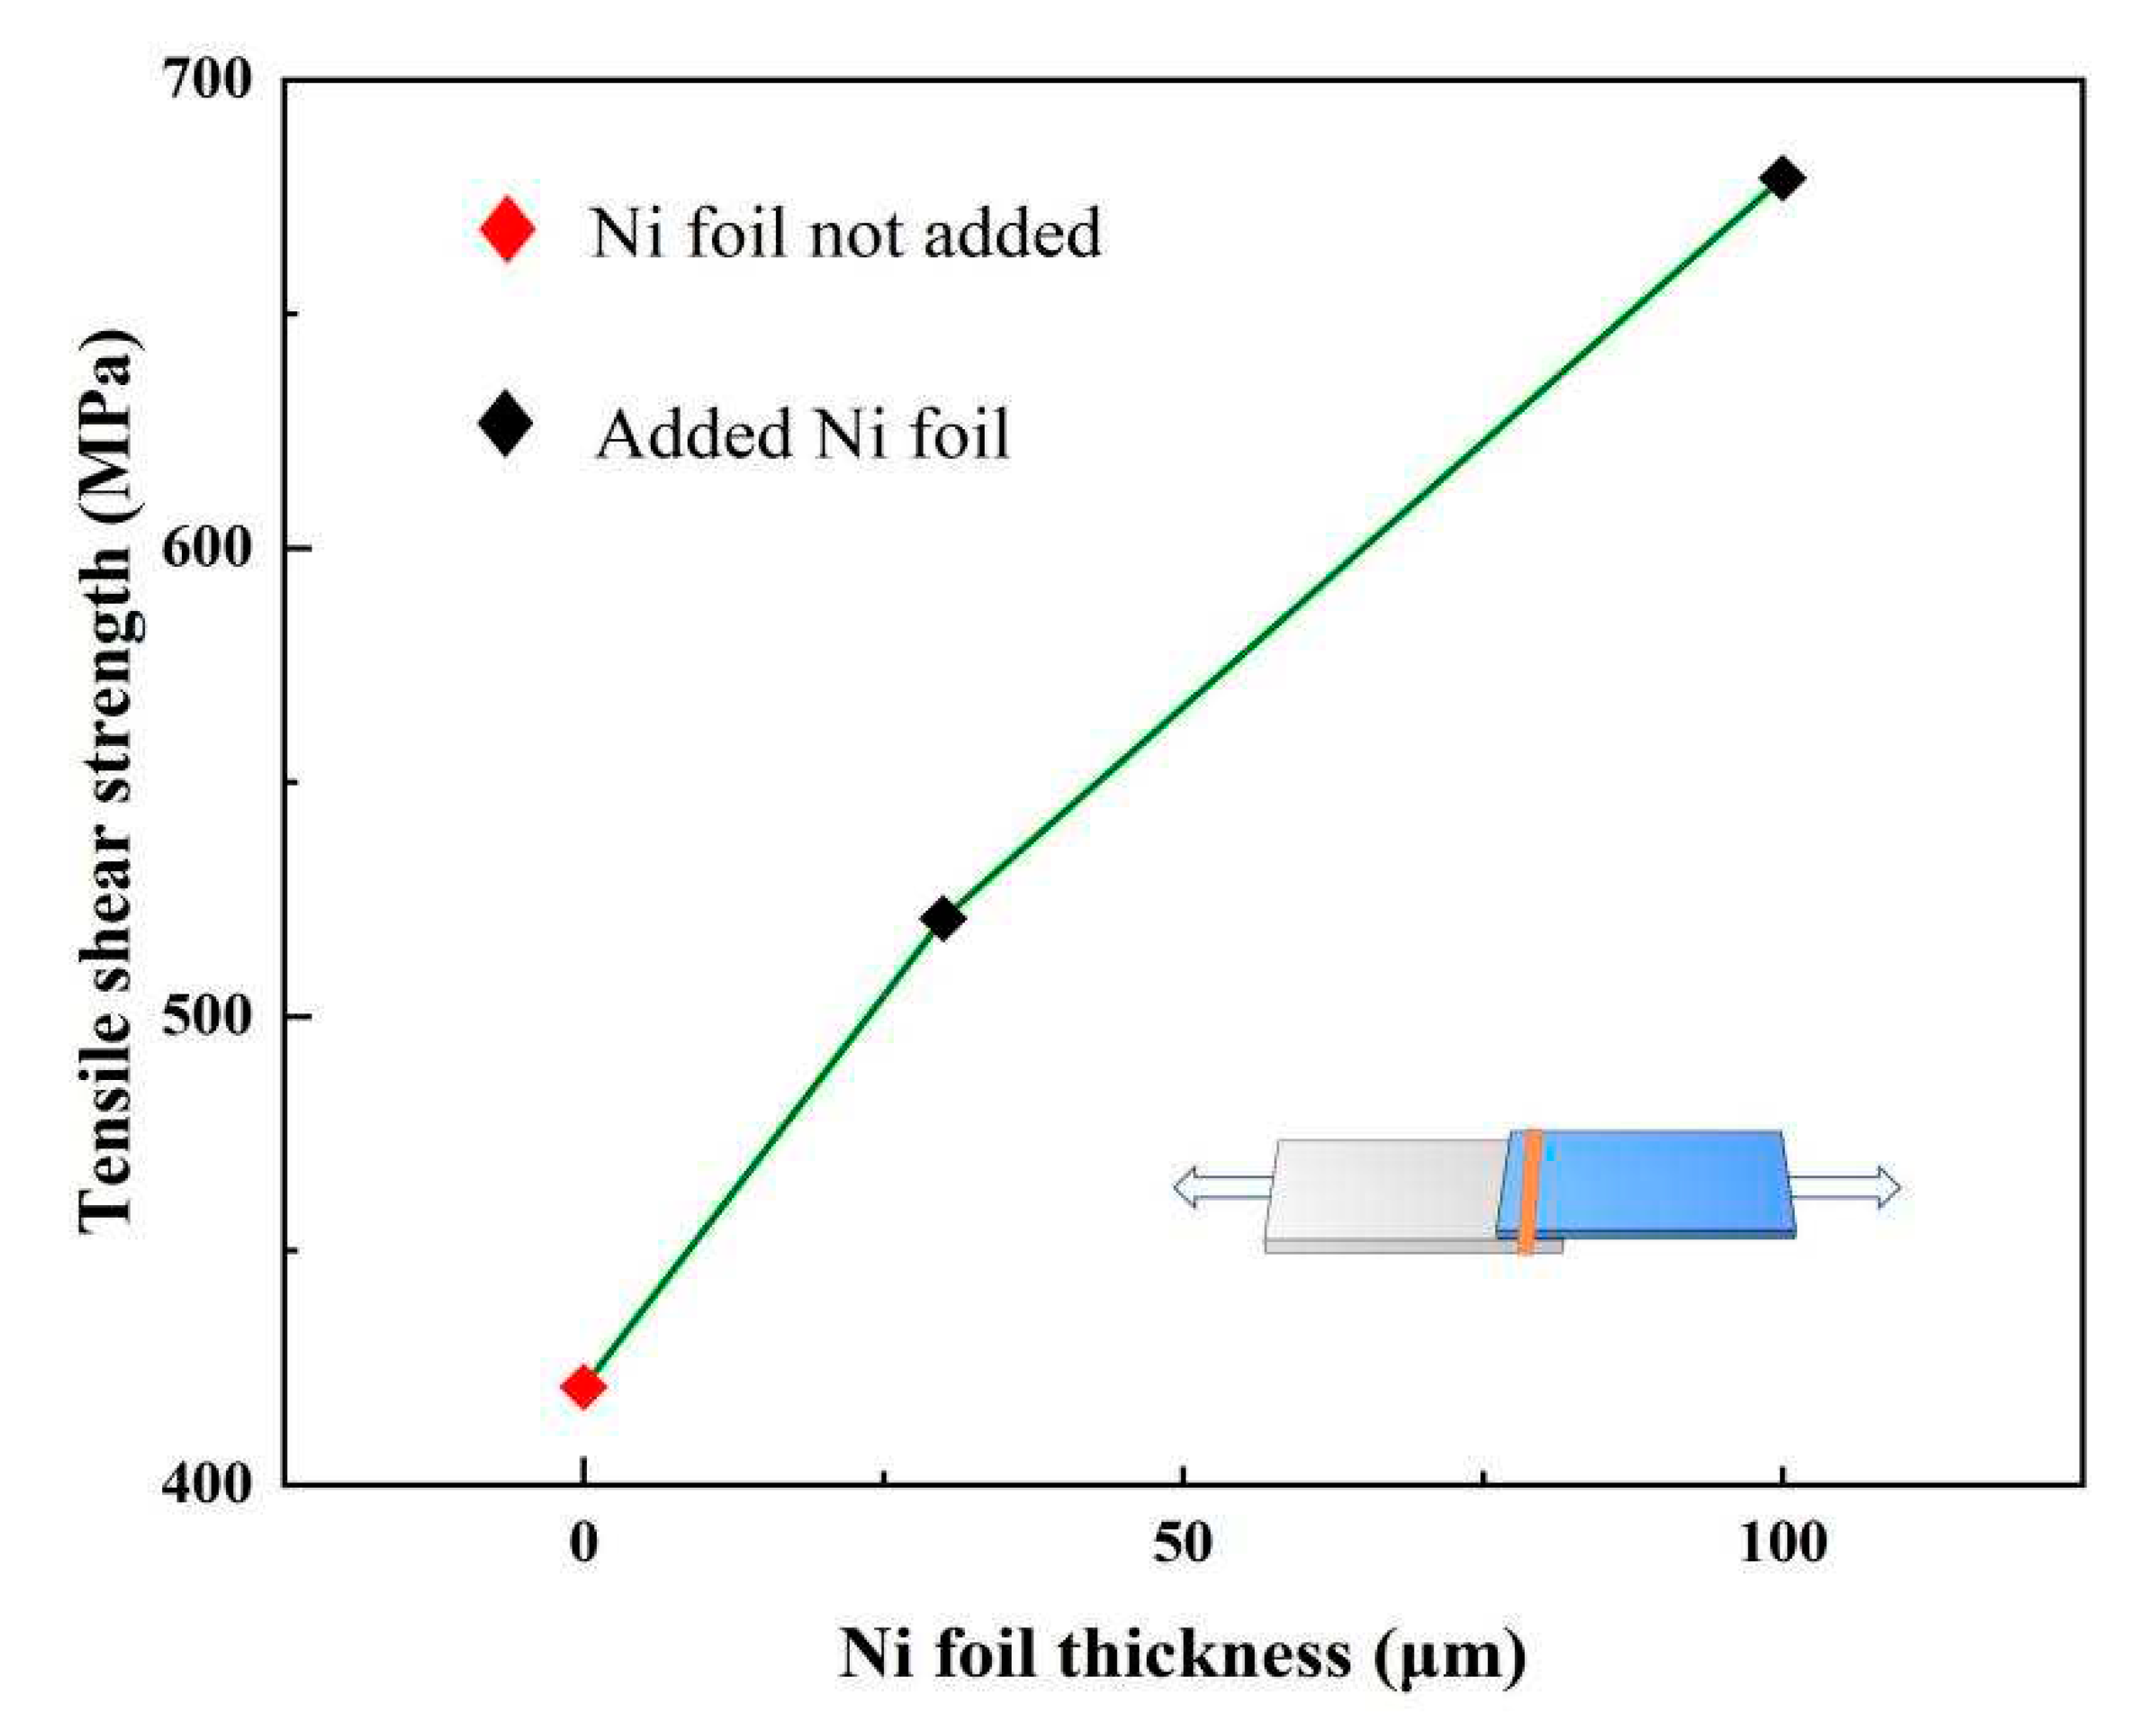
| NO | Ni foil thickness (μm) |
Tensile shear load (N) | Section size B×H(mm2) |
Tensile shear strength (MPa) |
Fracture location |
| 0 | _ | 4569 | 1.1×10 | 412 | FB |
| 1 | 30 | 6242 | 1.2×10 | 521 | FB |
| 2 | 100 | 6245 | 0.92×10 | 679 | Interface |
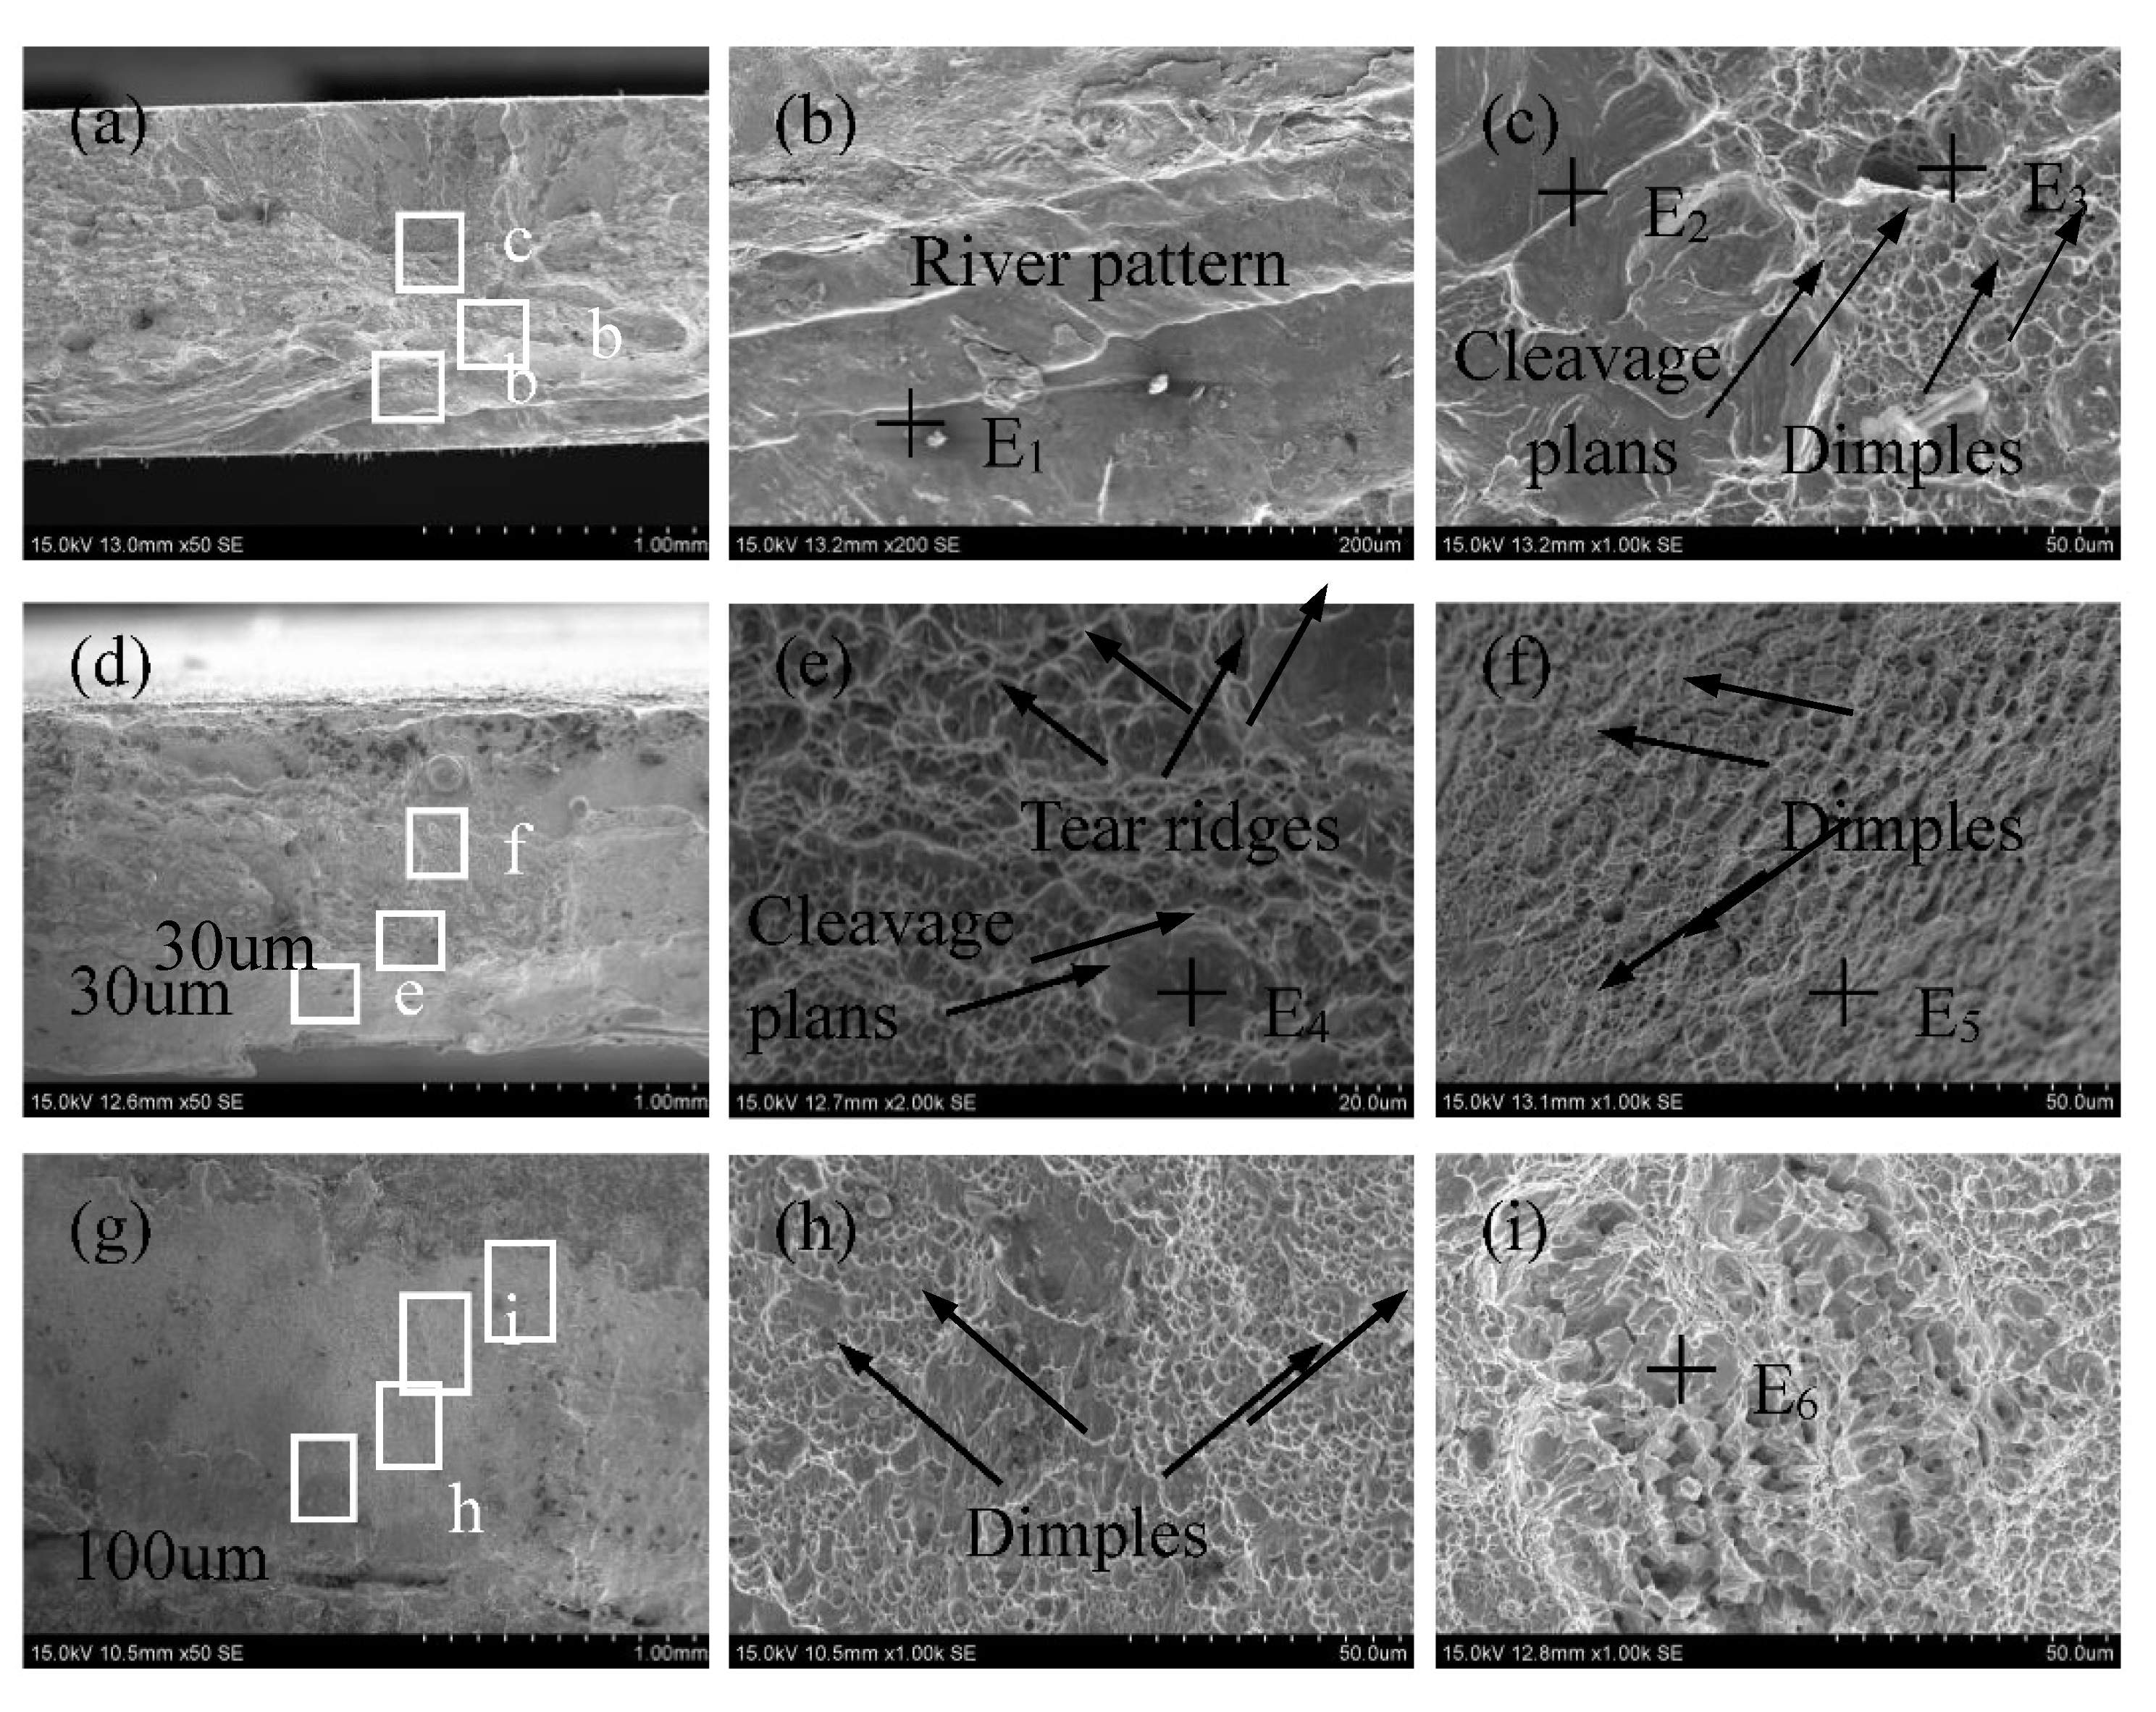
| Element /wt.% | E1 | E2 | E3 | E4 | E5 | E6 |
| Al | 8.07 | 3.05 | 1.12 | 2.04 | 1.08 | 0.30 |
| Si | 0.65 | 0.71 | 0.52 | 0.74 | 0.88 | 0.16 |
| Ni | — | — | — | 1.44 | 2.59 | 8.07 |
| Fe | Bal. | Bal. | Bal. | Bal. | Bal. | Bal. |
Disclaimer/Publisher’s Note: The statements, opinions and data contained in all publications are solely those of the individual author(s) and contributor(s) and not of MDPI and/or the editor(s). MDPI and/or the editor(s) disclaim responsibility for any injury to people or property resulting from any ideas, methods, instructions or products referred to in the content. |
© 2023 by the authors. Licensee MDPI, Basel, Switzerland. This article is an open access article distributed under the terms and conditions of the Creative Commons Attribution (CC BY) license (http://creativecommons.org/licenses/by/4.0/).


