1. Introduction
Multiple sclerosis (MS) is a chronic inflammatory disease of the central nervous system (CNS) [
1]. Although MS can take several different forms, the most common type is relapsing-remitting MS (RRMS), characterized by alternating periods of remission and intensification of symptoms [
2]. The etiology of MS can include several factors, such as genetic susceptibility, viral infections, and so on [
3,
4,
5], which activate the immune system, generating immune dysregulation, and producing an immune attack against the myelin covering of the CNS [
6].
Studies have shown that susceptibility to MS is genetically dependent [
7], but the specific gene factors remain largely unknown. It is known that peripheral self-antigen-specific immune cells are activated during the antigen presentation process and they enter the CNS through the disrupted blood–brain barrier (BBB) [
8]. The route of entry depends on the phenotype and activation state of T-cells. T-cells play important roles in cellular immunity [
9]. T- cells are divided into helper T-cells (Th) and regulatory T-cells (Treg). Nishihara et al. [
10] analysed the cellular mechanisms implicated in the migration of different CD4+ T helper cell subsets (Th1, Th2, Th17) through the BBB compared to the epithelial blood-cerebrospinal fluid barrier (BCSFB). After migration into the CNS, myelin-specific T-cells are re-activated by CNS-resident antigen-presenting cells (APCs), which leads to the growth or intensification of inflammatory response and demyelination [
11]. Ma et al. [
12] recapitulated the evolution of different T-cell subsets and their cytokines in the pathogenesis of MS.
The autoimmune etiology of MS has been the target of the therapeutic approach to patients. Treatment of MS can be divided into: treatment of MS symptoms, treatment of MS relapse, and treatment modifying disease progression. The main target of MS treatment is delaying the disease progression [
13]. Interferon-beta (IFN-
) is one of the most widely prescribed disease-modifying therapies for RRMS patients. IFN-
has multiple pathways of action on immune system. IFN-
can inhibit the activated proliferation of T- cells, prevent the migration of activated immune cells through the BBB, also it inhibits the production of pro-inflammatory cytokines (e.g., IL-2, IL-12, IFN-
), induces the increase in anti-inflammatory cytokines (e.g., IL-4, IL-5, IL-10 and TGF-
), and promotes re-myelination in the CNS [
14,
15]. IFN-
can also prevent the differentiation of inflammatory Th1/Th17 cells and change the phenotype of Th cells from inflammatory Th1 to anti-inflammatory Th2 cells. Studies have shown that IFN-
can significantly improve the clinical symptoms of patients, reduce the annual recurrence rate, and delay the progress of the disease [
16]. However, IFN-
is only partially efficient, and a significant proportion of patients with MS do not respond to this treatment, with the proportion of non-responders ranging from 20 to 50% [
17]. Hence, we propose a pipeline model based on potential biomarkers associated with response to IFN-
to predict whether MS patients are potential candidates to be treated with this drug. Studies have researched the effect of gene polymorphisms on therapeutic response to IFN-
, which can affect the efficacy of this drug. Bustamante et al. [
18] analysed the relationship between single nucleotide polymorphisms (SNPs) disposed in type I IFN-induced genes, genes becoming to the toll-like receptor (TLR) pathway, and genes encoding neurotransmitter receptors, and the response to IFN-
treatment in MS patients. From seven selected SNPs two polymorphisms were exposed to be related to IFN-
response: rs2277302 (PELI3) and rs832032 (GABRR3). Martinez et al. [
19] evaluated the effect of polymorphisms in some genes (CD46, CD58, FHIT, IRF5, GAPVD1, GPC5, GRBRB3, MxA, PELI3, and ZNF697) on response to IFN-
treatment between RRMS patients.
Genome-wide researches generate in large numbers of data and there is a need for soft computing methods (SCMs) such as artificial neural networks, fuzzy systems, evolutionary algorithms, or metaheuristic and swarm intelligence algorithms, that can deal with this amount of data [
20]. Studies only have focused on MS diagnosis applying fuzzy systems. Ayangbekun & Jimoh [
21] designed a fuzzy inference system for diagnosing five brain diseases: Alzheimer, Creutzfeldt-Jakob, Huntington, MS, and Parkinson. Hosseini et al. [
22] developed a clinical decision support system (CDSS) to help specialists diagnose MS with a relapsing-remitting phenotype. Matinfar et al. [
23] proposed an expert system for MS diagnosis based on clinical symptoms and demographic characteristics. Studies have applied machine and deep learning techniques to detect biomarkers, and to analyse MS progress. Ali et al. [
24] proposed two models to identify the biomarkers of two autoimmune diseases, MS and rheumatoid arthritis, through microRNA analysis. The proposed models include complete pipelines of text mining methods, composed by conventional machine learning (ML) methods, and LSTM deep learning (DL). Viatkin et al. [
25] revealed a system to measure finger joint angles based on camera image, for tracing the motion and limits of hand mobility in MS. Convolutional neural networks (CNN) based on different architectures were used to analyze the information from the camera.
Despite, the studies presented above have shown the efficiency of IFN-
to improve the clinical symptoms of MS patients, a proportion of patients do not respond to this treatment. Studies have analyzed the genome-wide in order to identify genetic factors associated to the response to IFN-
treatment. Gurevich et al. [
26] identified a subgroup of secondary progressive MS (SPMS) patients presenting a gene expression signature similar to that of RRMS patients who are clinical responders to IFN-
treatment. SPMS patients were classified using unsupervised hierarchical clustering according to IFN inducible gene expression profile identified in RRMS clinical responders to treatment. Although, the hierarchical clustering method is easy to implement, it rarely provides the best solution due to lots of arbitrary decisions. Clarelli et al. [
27] detected genetic factors that affect the long-term response to IFN-
. The found pathways associated to inflammatory processes and presynaptic membrane, i. e., the genes related to glutamatergic system (GRM3 and GRIK2), play a potential role in the response to IFN-
. Jin et al. [
28] implemented a feature selection method based on differentially correlated edges (DCE) to identify the most relevant genes associated to the response to IFN-
treatment in RRMS patients. Between 23 identified genes, seven had a confidence score >2: CXCL9, IL2RA, CXCR3, AKT1, CSF2, IL2RB, and GCA. Because the analyzed data were unlabeled, the responder category was restricted to patients whose first relapse time was more than five years (60 months), resulting in nine responders and nine non-responders. So, seven patients were excluded from analysis. Hence, we attempt to address some of the issues above. Our proposed solution consists of the following stages: 1) Collect gene expression profiles, demographic, and clinical characteristics, associated with the response to IFN-
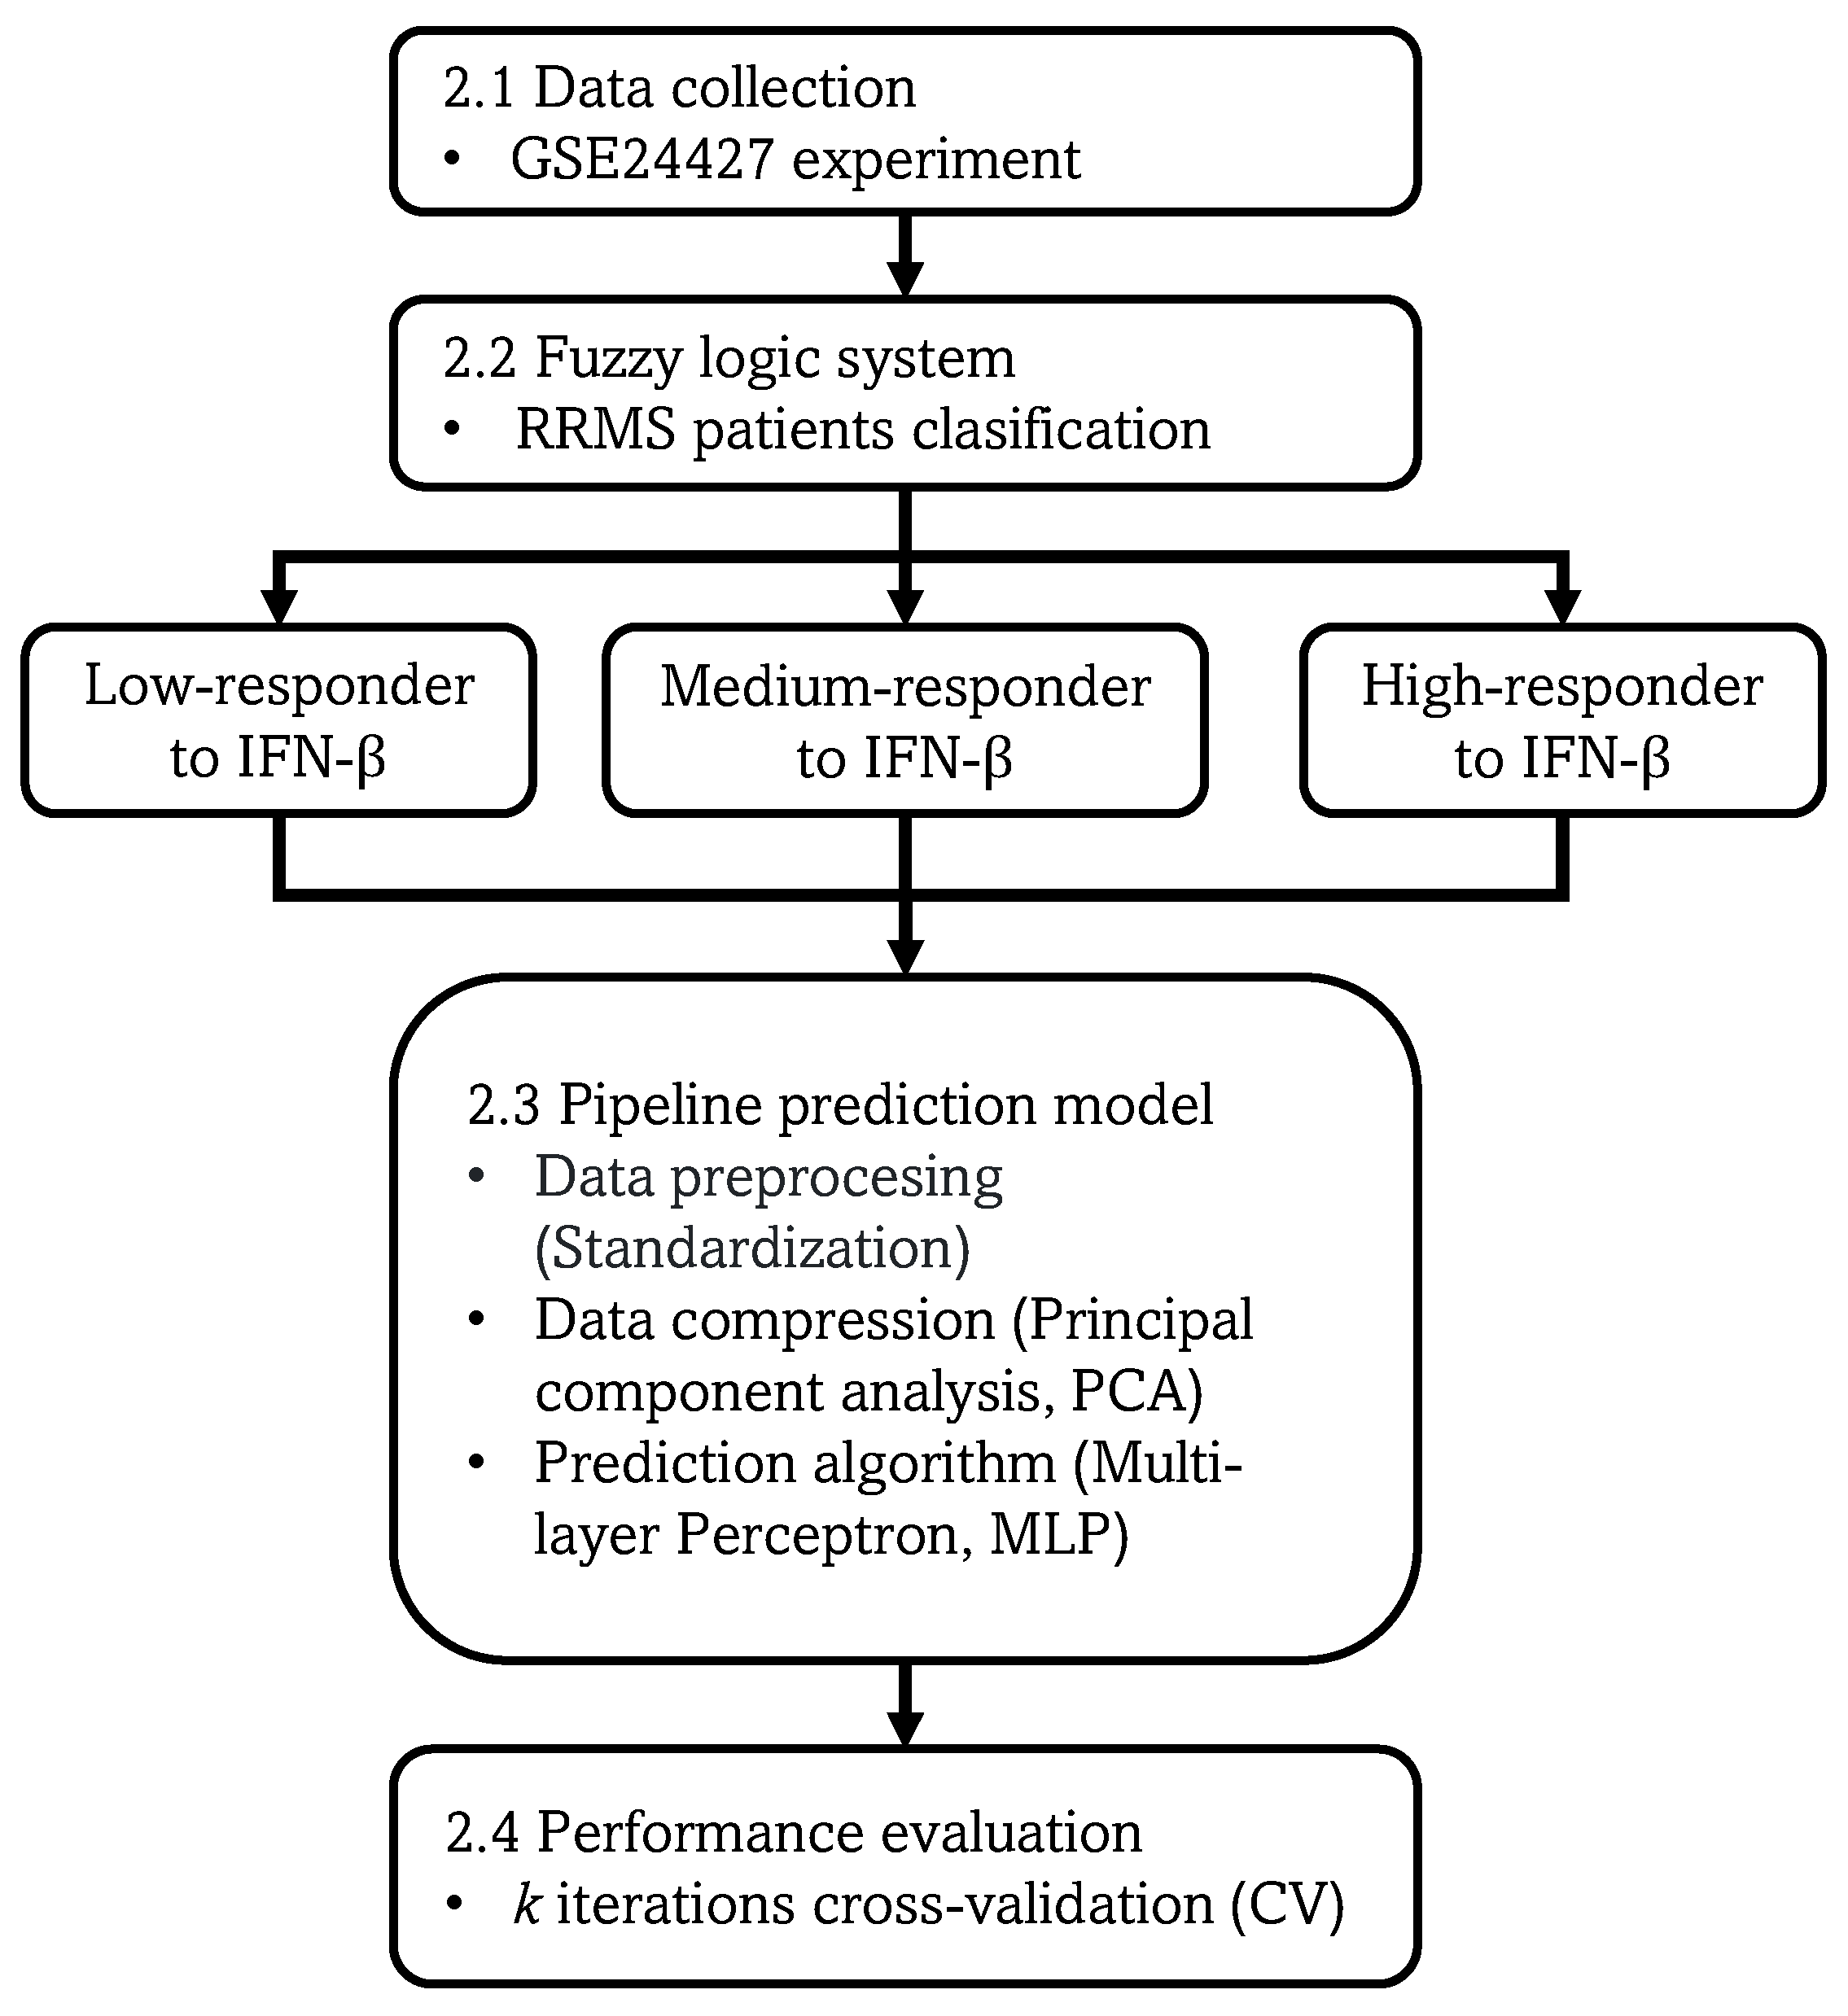
treatment, 2) Classify RRMS patients using a fuzzy logic system, 3) Implement a pipeline model including data preprocessing, data compression, and a learning algorithm to make predictions, and 4) Evaluate the prediction performance.
The main contributions of this paper are as follows:
An alternative fuzzy system based on expert knowledge with linguistic rules to classify RRMS patients: high, medium, or low responder to IFN- treatment.
A pipeline prediction model including a data preprocessing technique, a transformation technique for data compression, and a learning algorithm for making predictions on new data. The prediction model is trained with biomarkers associated to the IFN- response for predicting whether MS patients are potential candidates to be treated with this drug, in order to avoid ineffective therapies.
This paper is organized as follows.
Section 2 explains the proposed research strategy.
Section 3 provides the experimental results.
Section 4 discusses the proposed contributions.
Section 5 presents the conclusions.
4. Discussion
While binary logic generates only two output types: [0, 1], fuzzy inference engines use an approximate reasoning based on generalized rules of inference. Hence, fuzzy systems are convenient methods for decision support, due to their capability to process inaccurate information. In this paper, an alternative fuzzy system based on expert knowledge was implemented for decision support in classification of the response to IFN-
treatment of RRMS patients. Demographic, and clinical characteristics were used as input variables to fuzzy system. As shown in
Table 8, the classification of the proposed fuzzy system had better results than the agglomerative clustering, because the latter does not consider the intrinsic properties of the data, it just uses the distance between the data points to group them into clusters. A software issue in the fuzzy system design was to set small number of input variables. The greater number of variables, the greater data processing time.
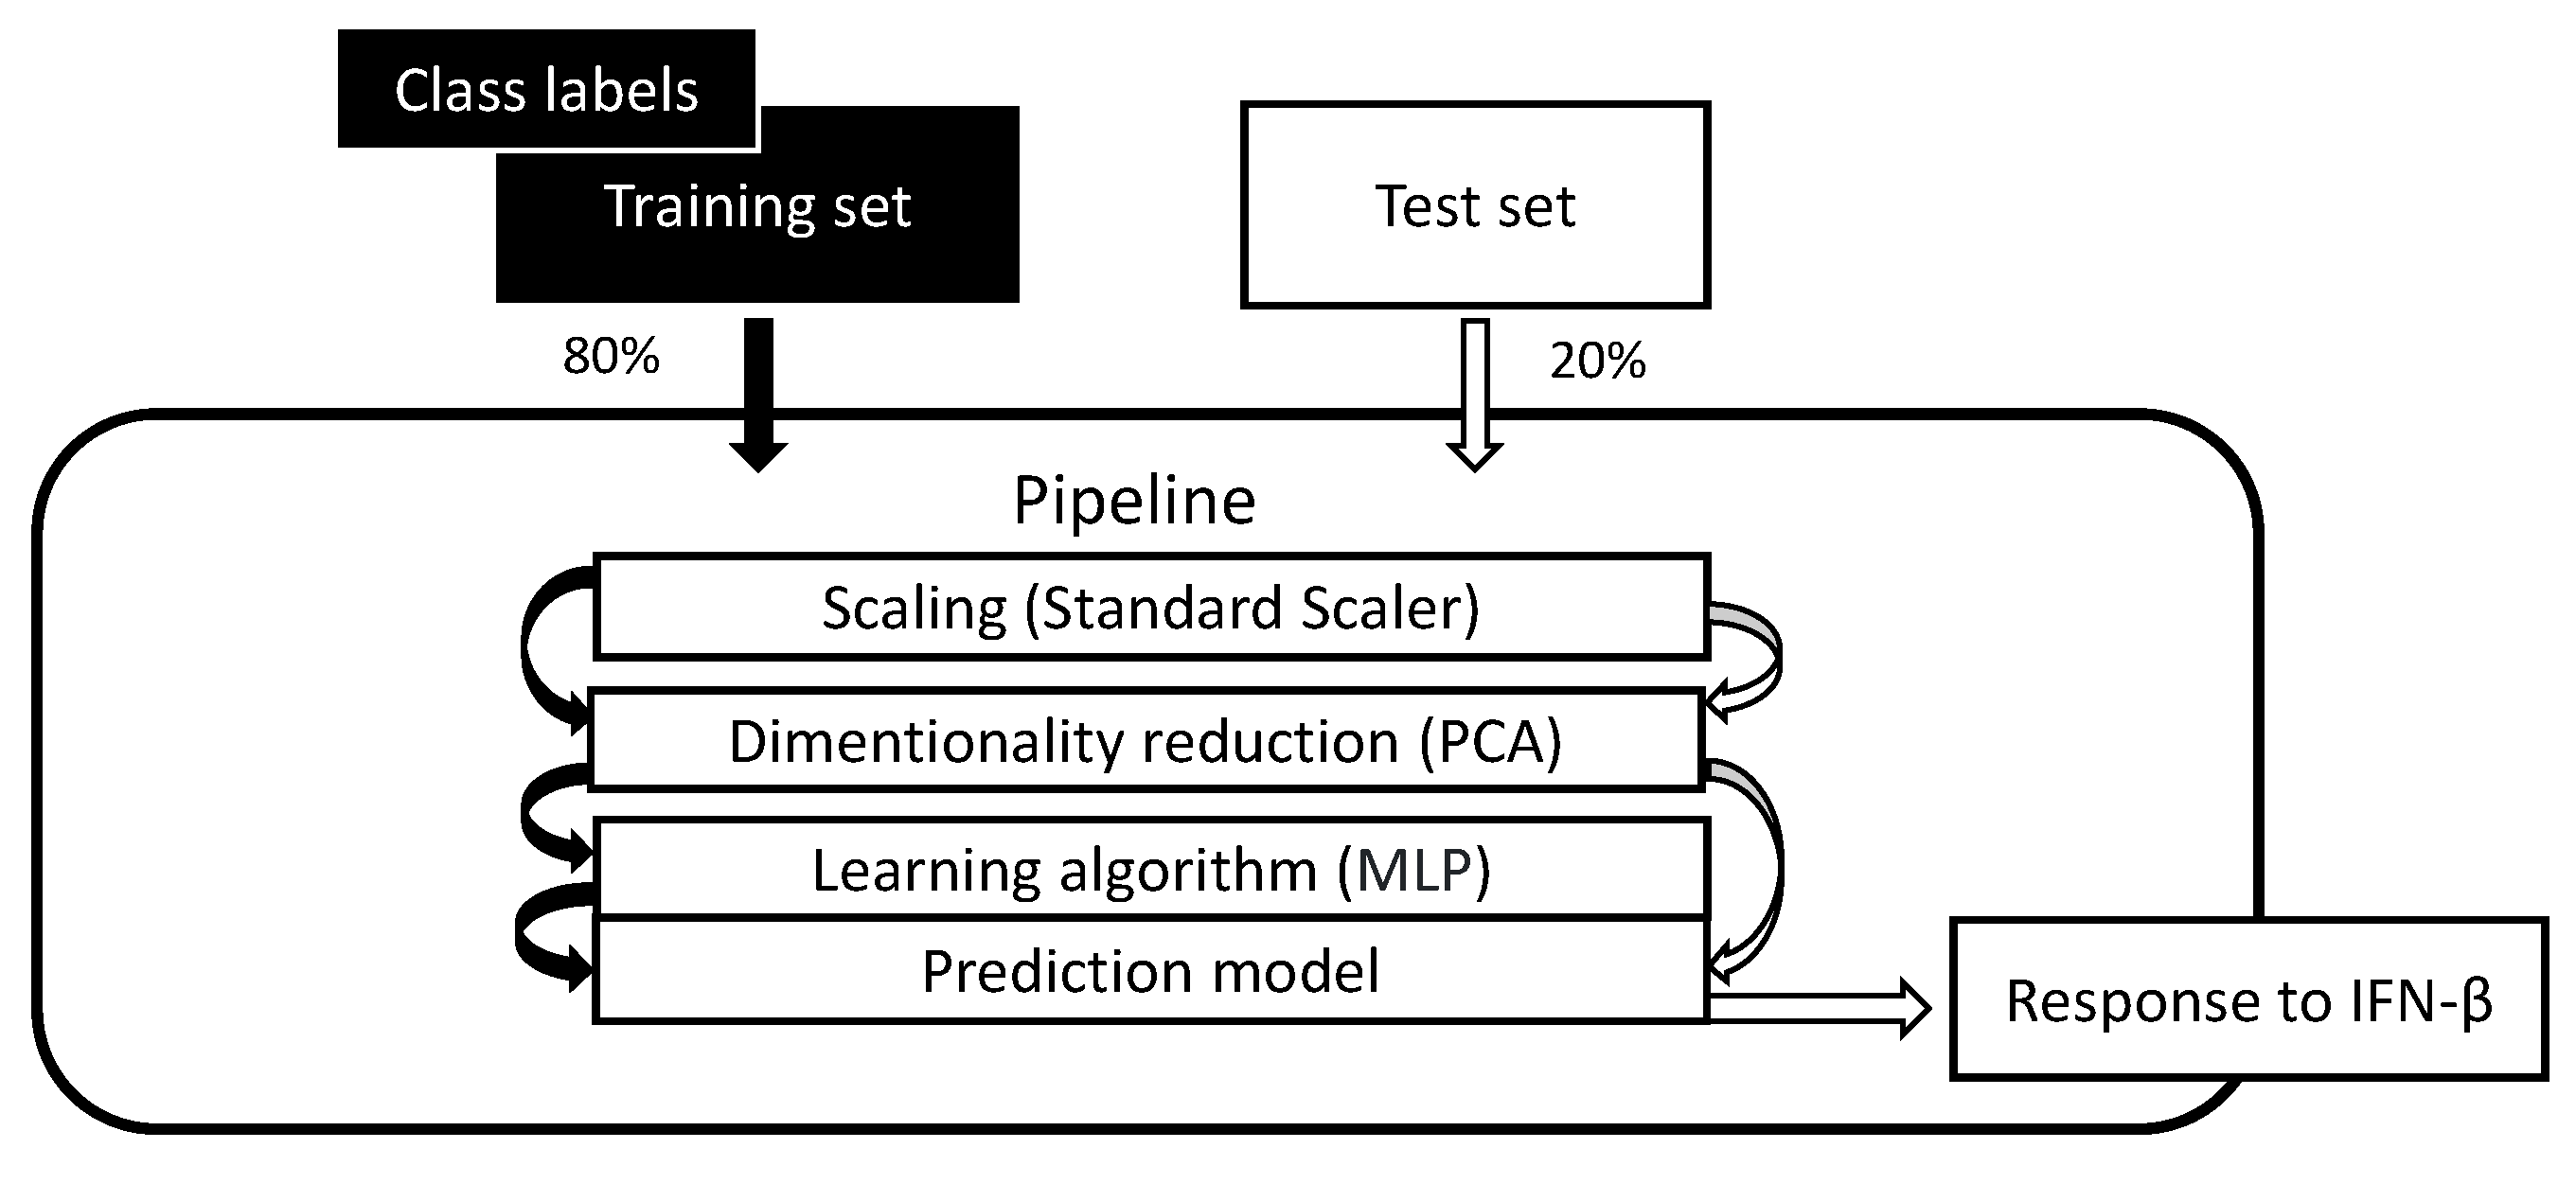
Once the dataset output labels were classified by the fuzzy system, a pipeline prediction model was implemented including data standardization, data compression through PCA technique, and a MLP learning algorithm. The pipeline model was trained with 15 biomarkers associated with the response to IFN-
for predicting whether RRMS patients are potential candidates to be treated with this drug. As shown in
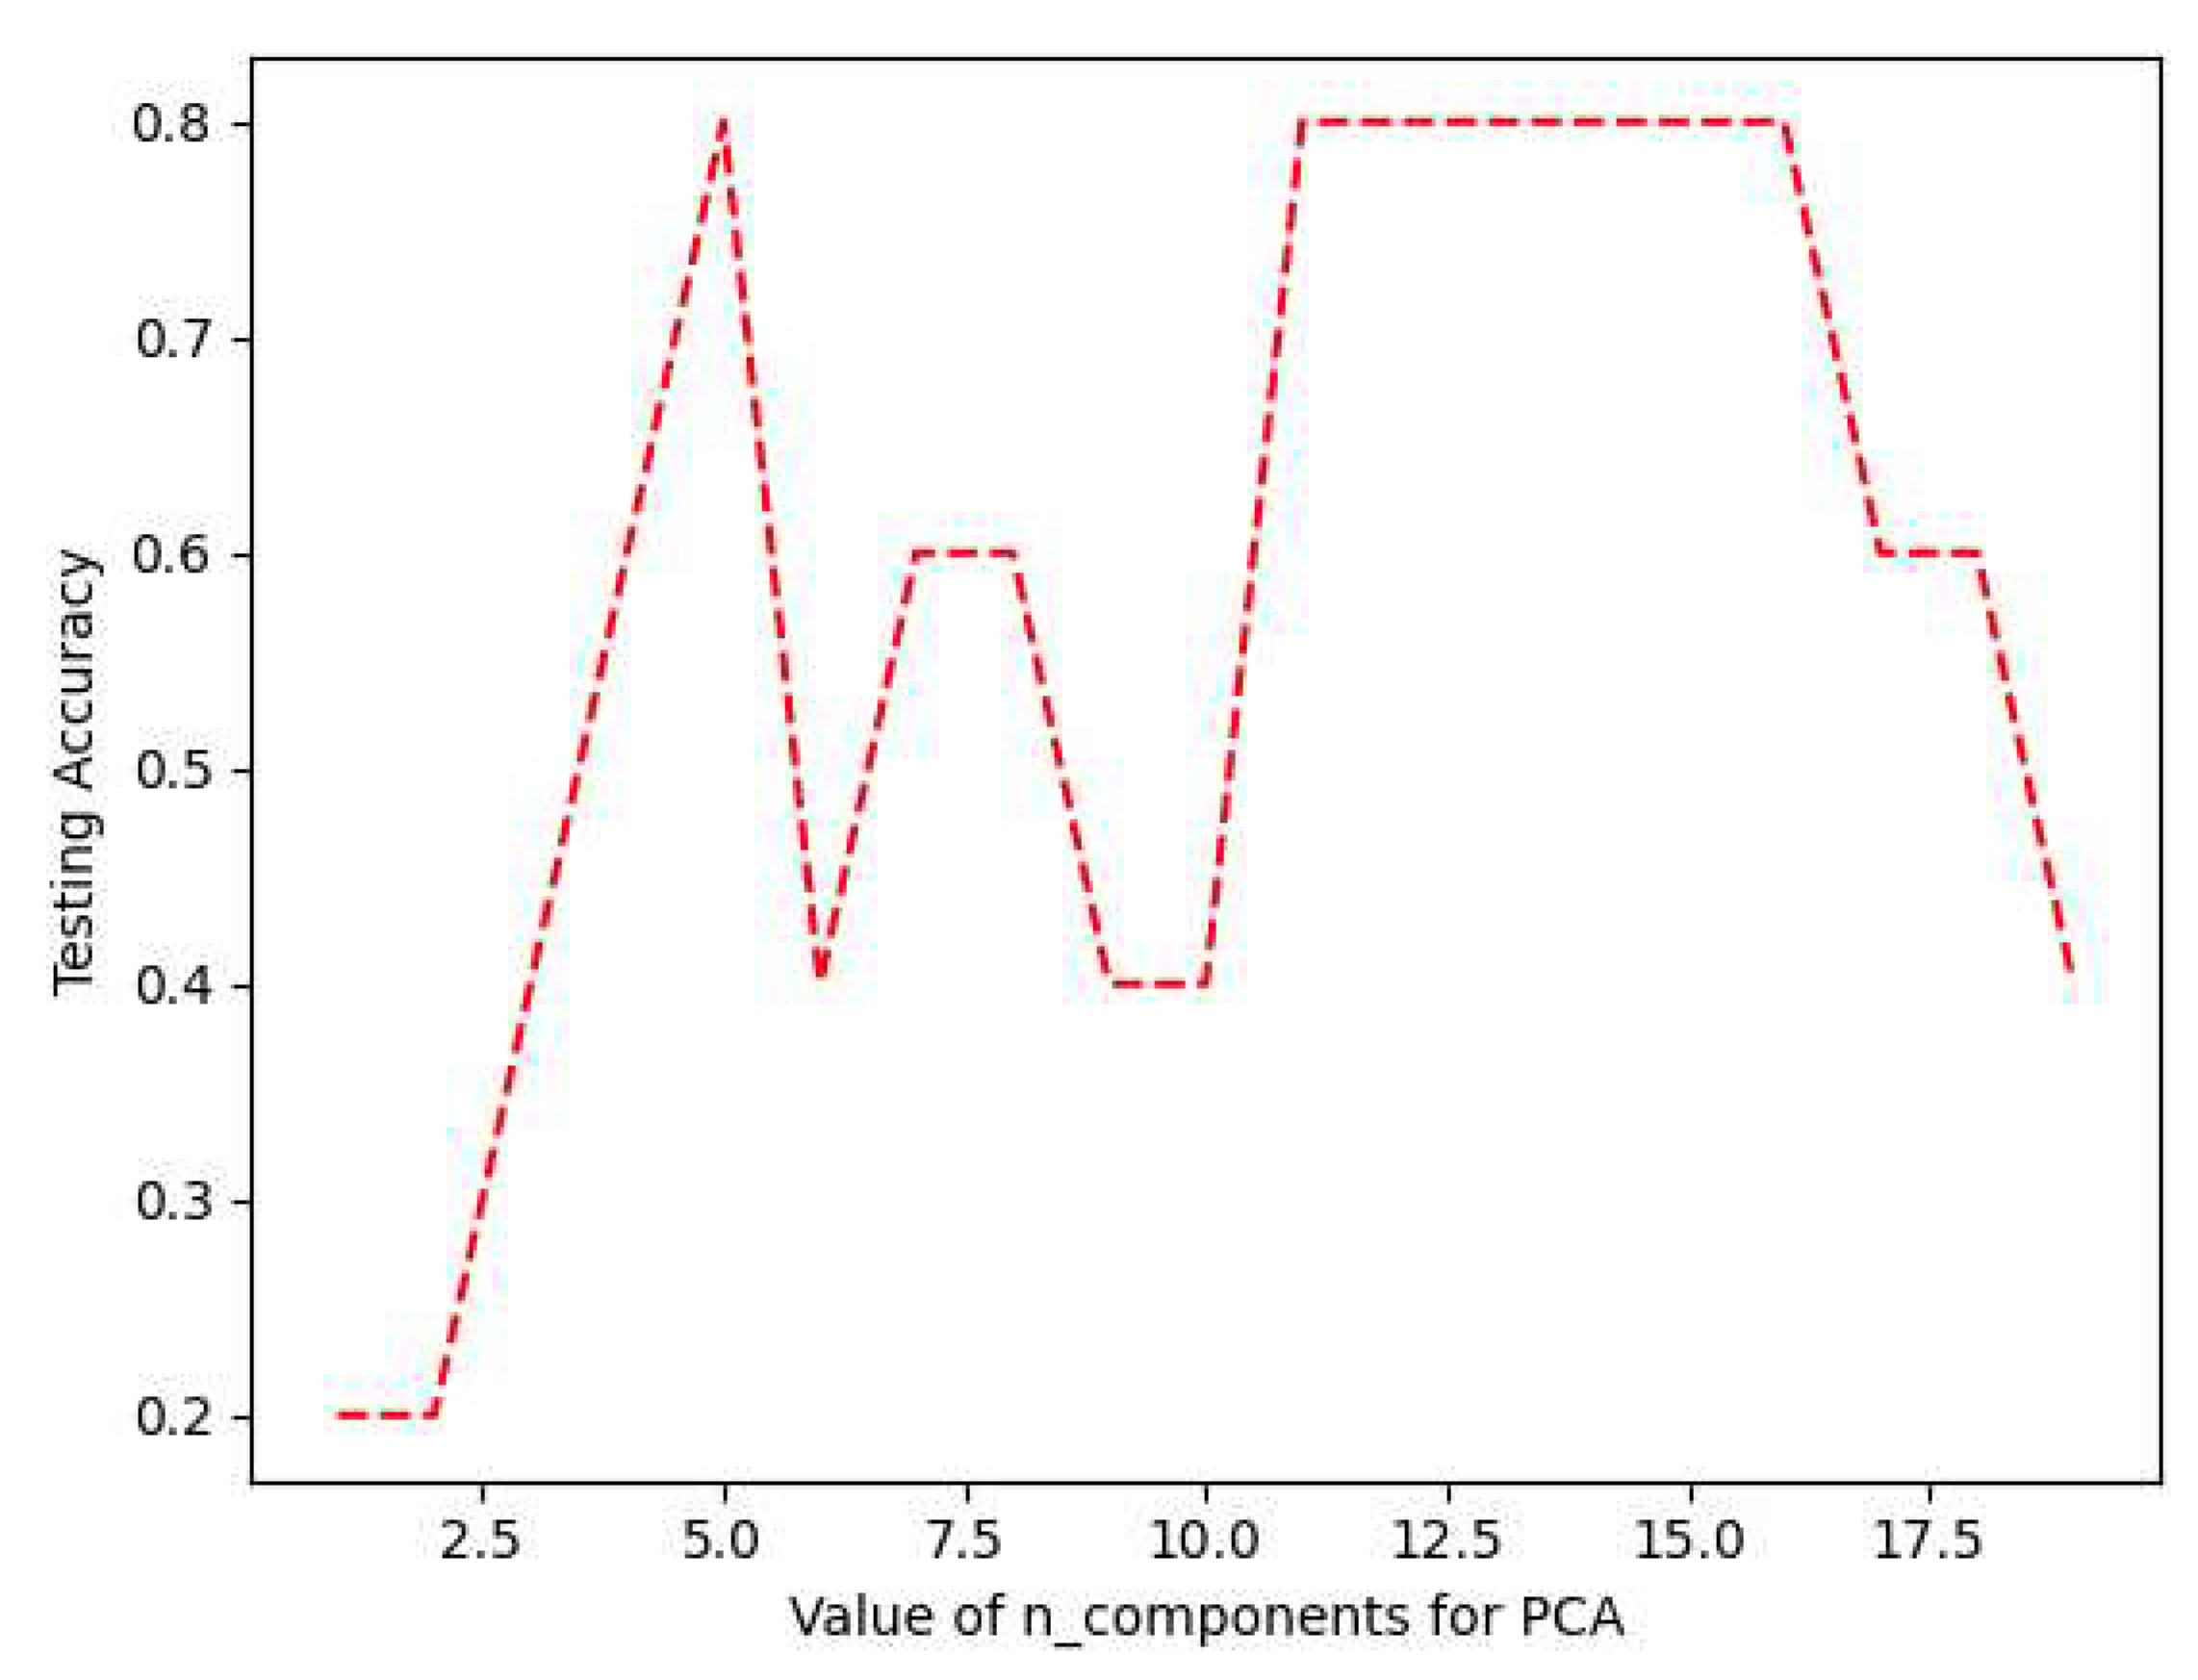
Figure 9, by setting thirteen principal components for PCA, a 0.8 testing accuracy was achieved. The use of PCA technique for data compression provides some advantages: 1) The reduced dimension has the property of keeping the most of the useful information while reducing noise and other undesirable data, 2) The time and memory that used in data processing are smaller, 3) It provides a way to understand and visualize the structure of complex datasets. The use of the
k iterations CV technique helps to get a good bias-variance rate. The highest CV accuracy was achieved at 7th, and 8th folds, as shown in
Table 9. One disadvantage in evaluating the prediction model performance was that the test samples size was too small. Therefore, the number of iterations for CV technique was limited to eight.
5. Conclusions
In general, IFN- treatment effectively reduce the rate of relapse and delay the progression of neurological disability in MS patients. However, a percentage of patients do not respond, or partially respond to this drug. In this paper, the proposed fuzzy system based on the opinion of an expert demonstrated high efficiency in decision support, and it can be a useful tool in labeling classes such as classification of the response to IFN- therapy.
Although genome research is complex, there are machine and deep learning methods for instance the proposed pipeline model that can effectively deal the gene data for getting reliable predictions to guide specialists in the selection of MS patients who may have the greatest benefit from IFN- treatment. Biomarkers in particular IL-2, IL-12, IFN-, TNF-, IL-4, IL-10, TGF-, CD46, CD58, FHIT, IRF5, GAPVD1, GPC5, GRM3, and GRIK2 can be convenient predictive variables for improving the comprehension of the influence of IFN- therapy in MS patients.
Author Contributions
Conceptualization, E.R.P.d.L.-S., and A.M.H.-N.; methodology, E.R.P.d.L.-S., and A.M.H.-N.; software, E.R.P.d.L.-S.; validation, H.S.-M.; formal analysis, J.D.M.-S., O.A.D.-R., A.V.-C., and H.J.-H.; investigation, E.R.P.d.L.-S.; resources, J.D.M.-S, O.A.D.-R., A.M.H.-N., A.V.-C., and H.J.-H.; writing—original draft preparation, E.R.P.d.L.-S.; writing—review and editing, E.R.P.d.L.-S., and J.D.M.-S.; supervision, J.D.M.-S., O.A.D.-R., A.V.-C., and H.J.-H.; project administration, E.R.P.d.L.-S., J.D.M.-S, and O.A.D.-R. All authors have read and agreed to the published version of the manuscript.
Figure 1.
Proposed methodology. The gene data, demographic, and clinical characteristics are collected. Then, the RRMS patients are classified by the fuzzy logic system. A pipeline prediction model is implemented including data standardization, PCA for data compression, and MLP algorithm for making predictions. Finally, the k iterations CV is implemented for evaluating the model prediction performance.
Figure 2.
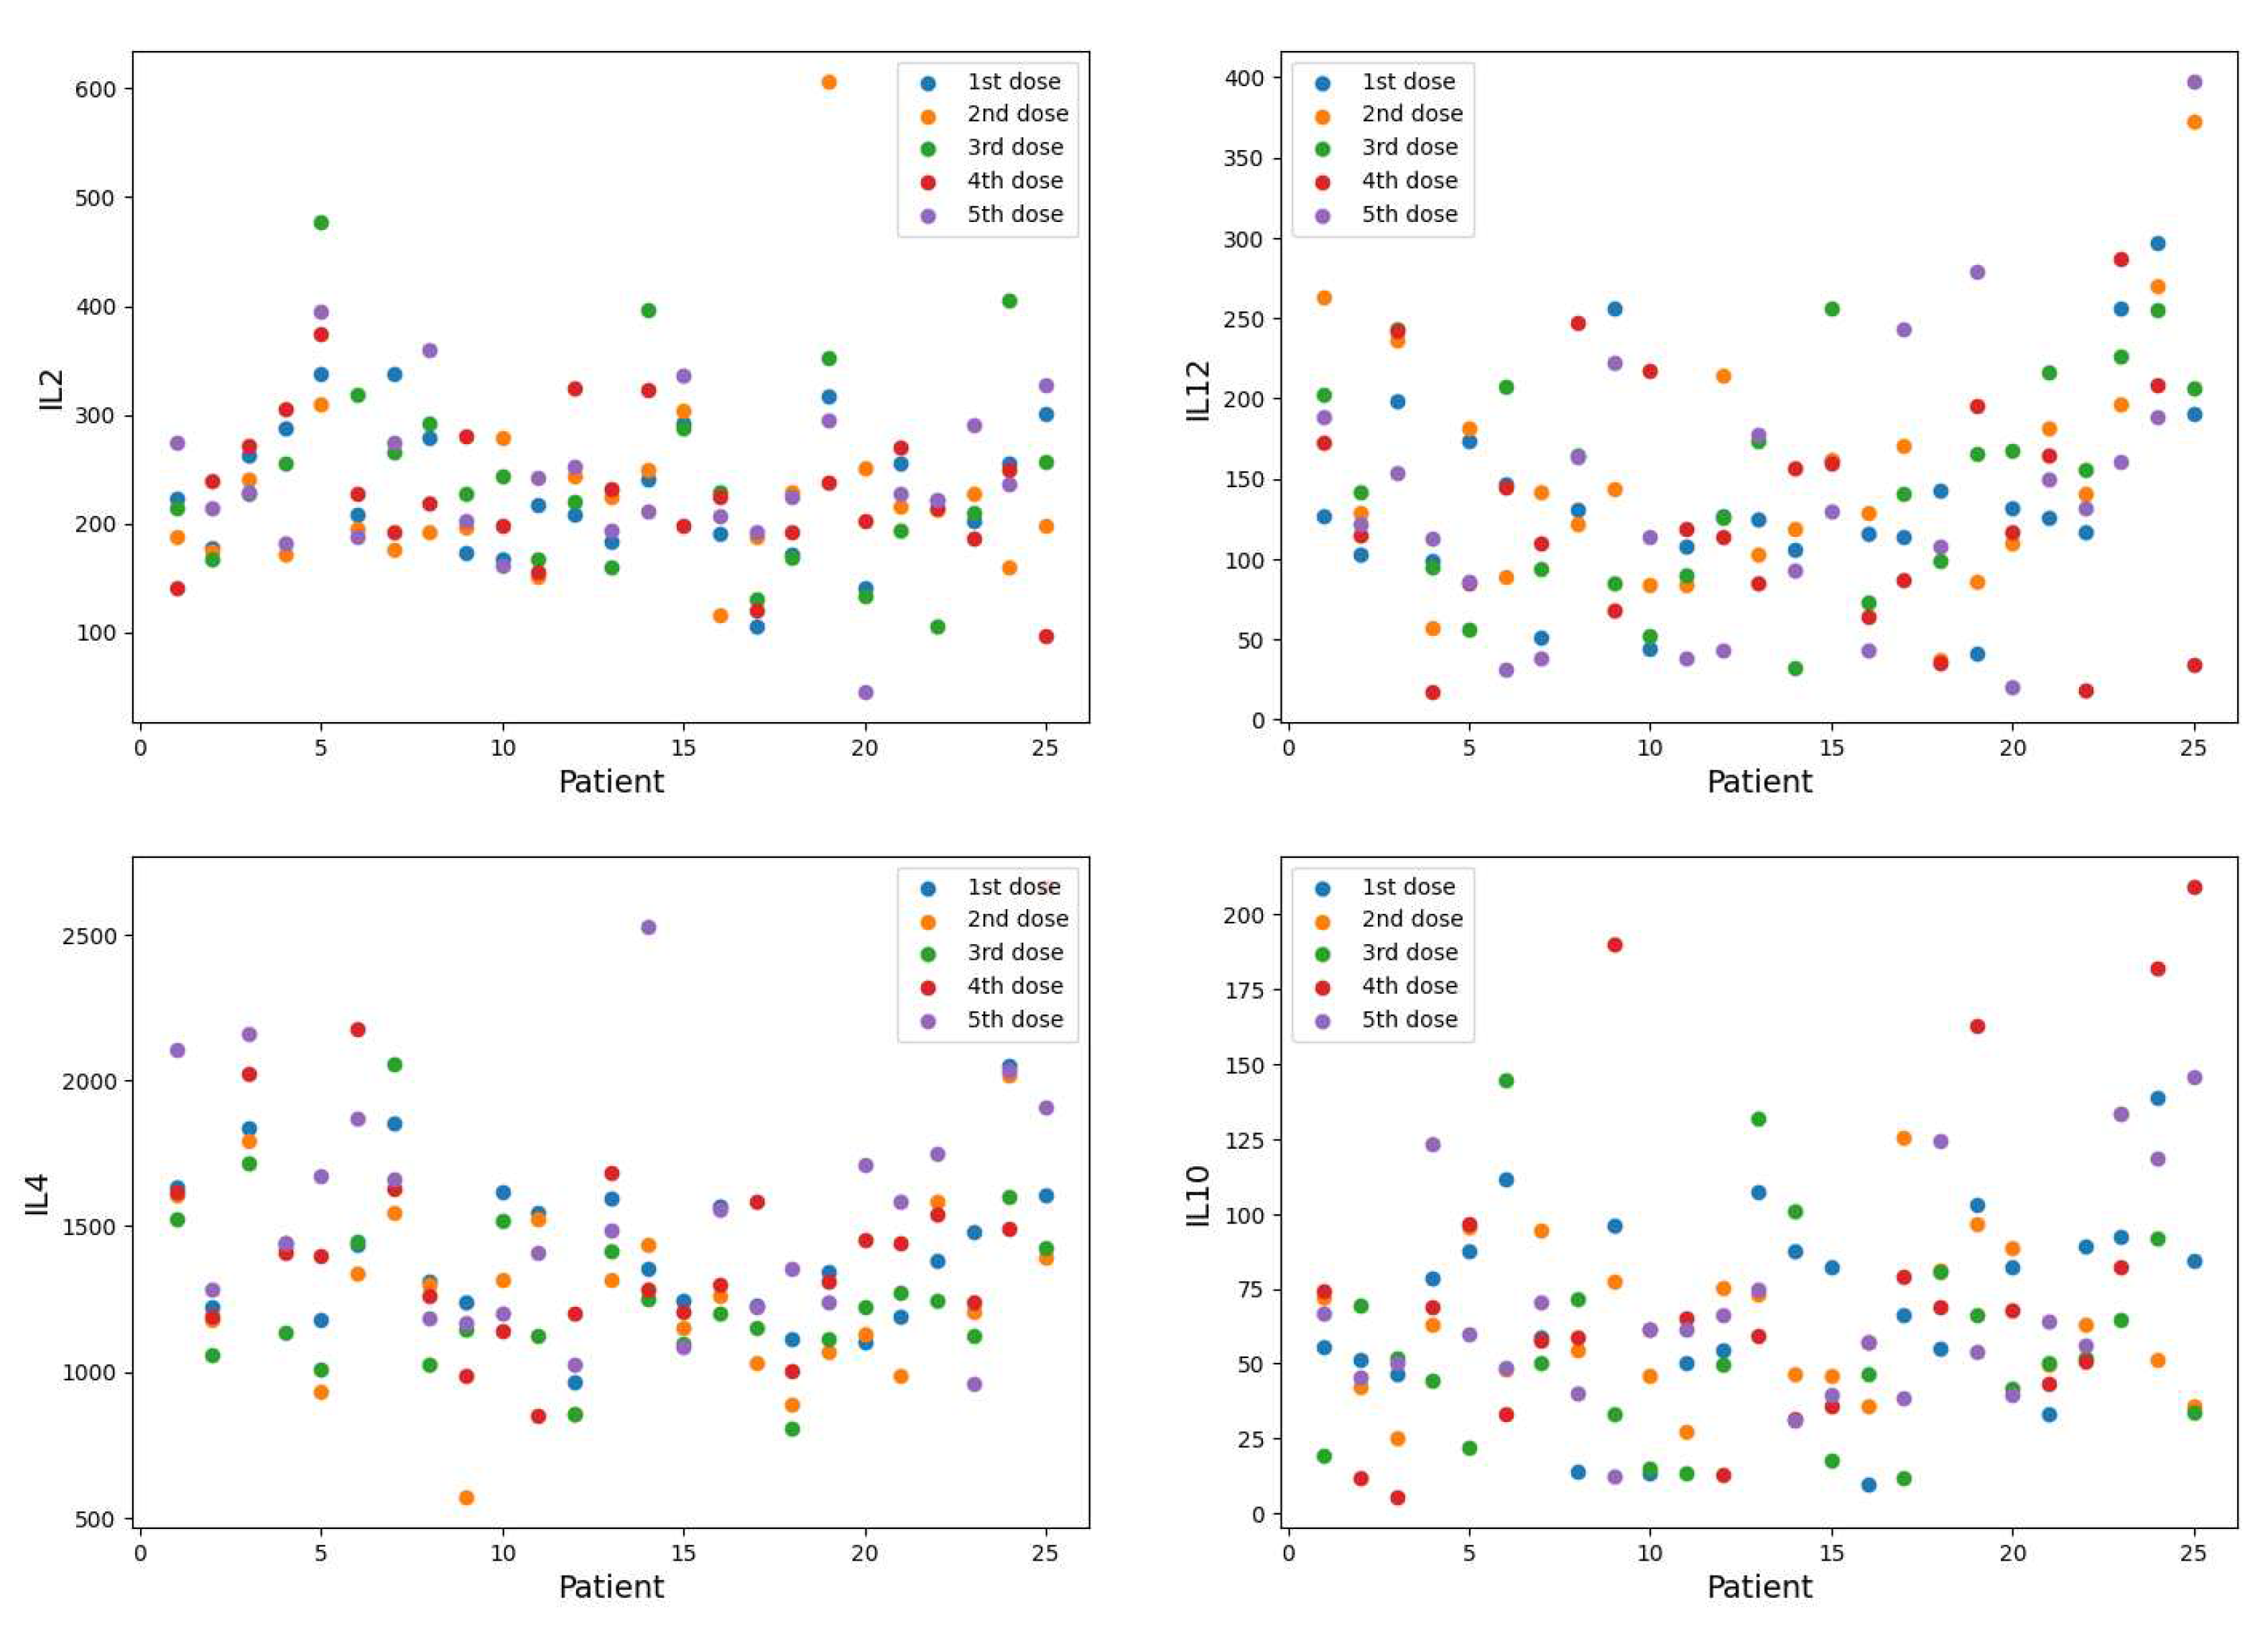
IL-2, IL-12, IL-4, and IL-10 cytokines. The expression values of 25 patients corresponding to five doses: before 1st, 2nd, 1st month, 12th month, and 24th month IFN- injection.
Figure 2.
IL-2, IL-12, IL-4, and IL-10 cytokines. The expression values of 25 patients corresponding to five doses: before 1st, 2nd, 1st month, 12th month, and 24th month IFN- injection.
Figure 3.
Fuzzy system structure.
Figure 3.
Fuzzy system structure.
Figure 4.
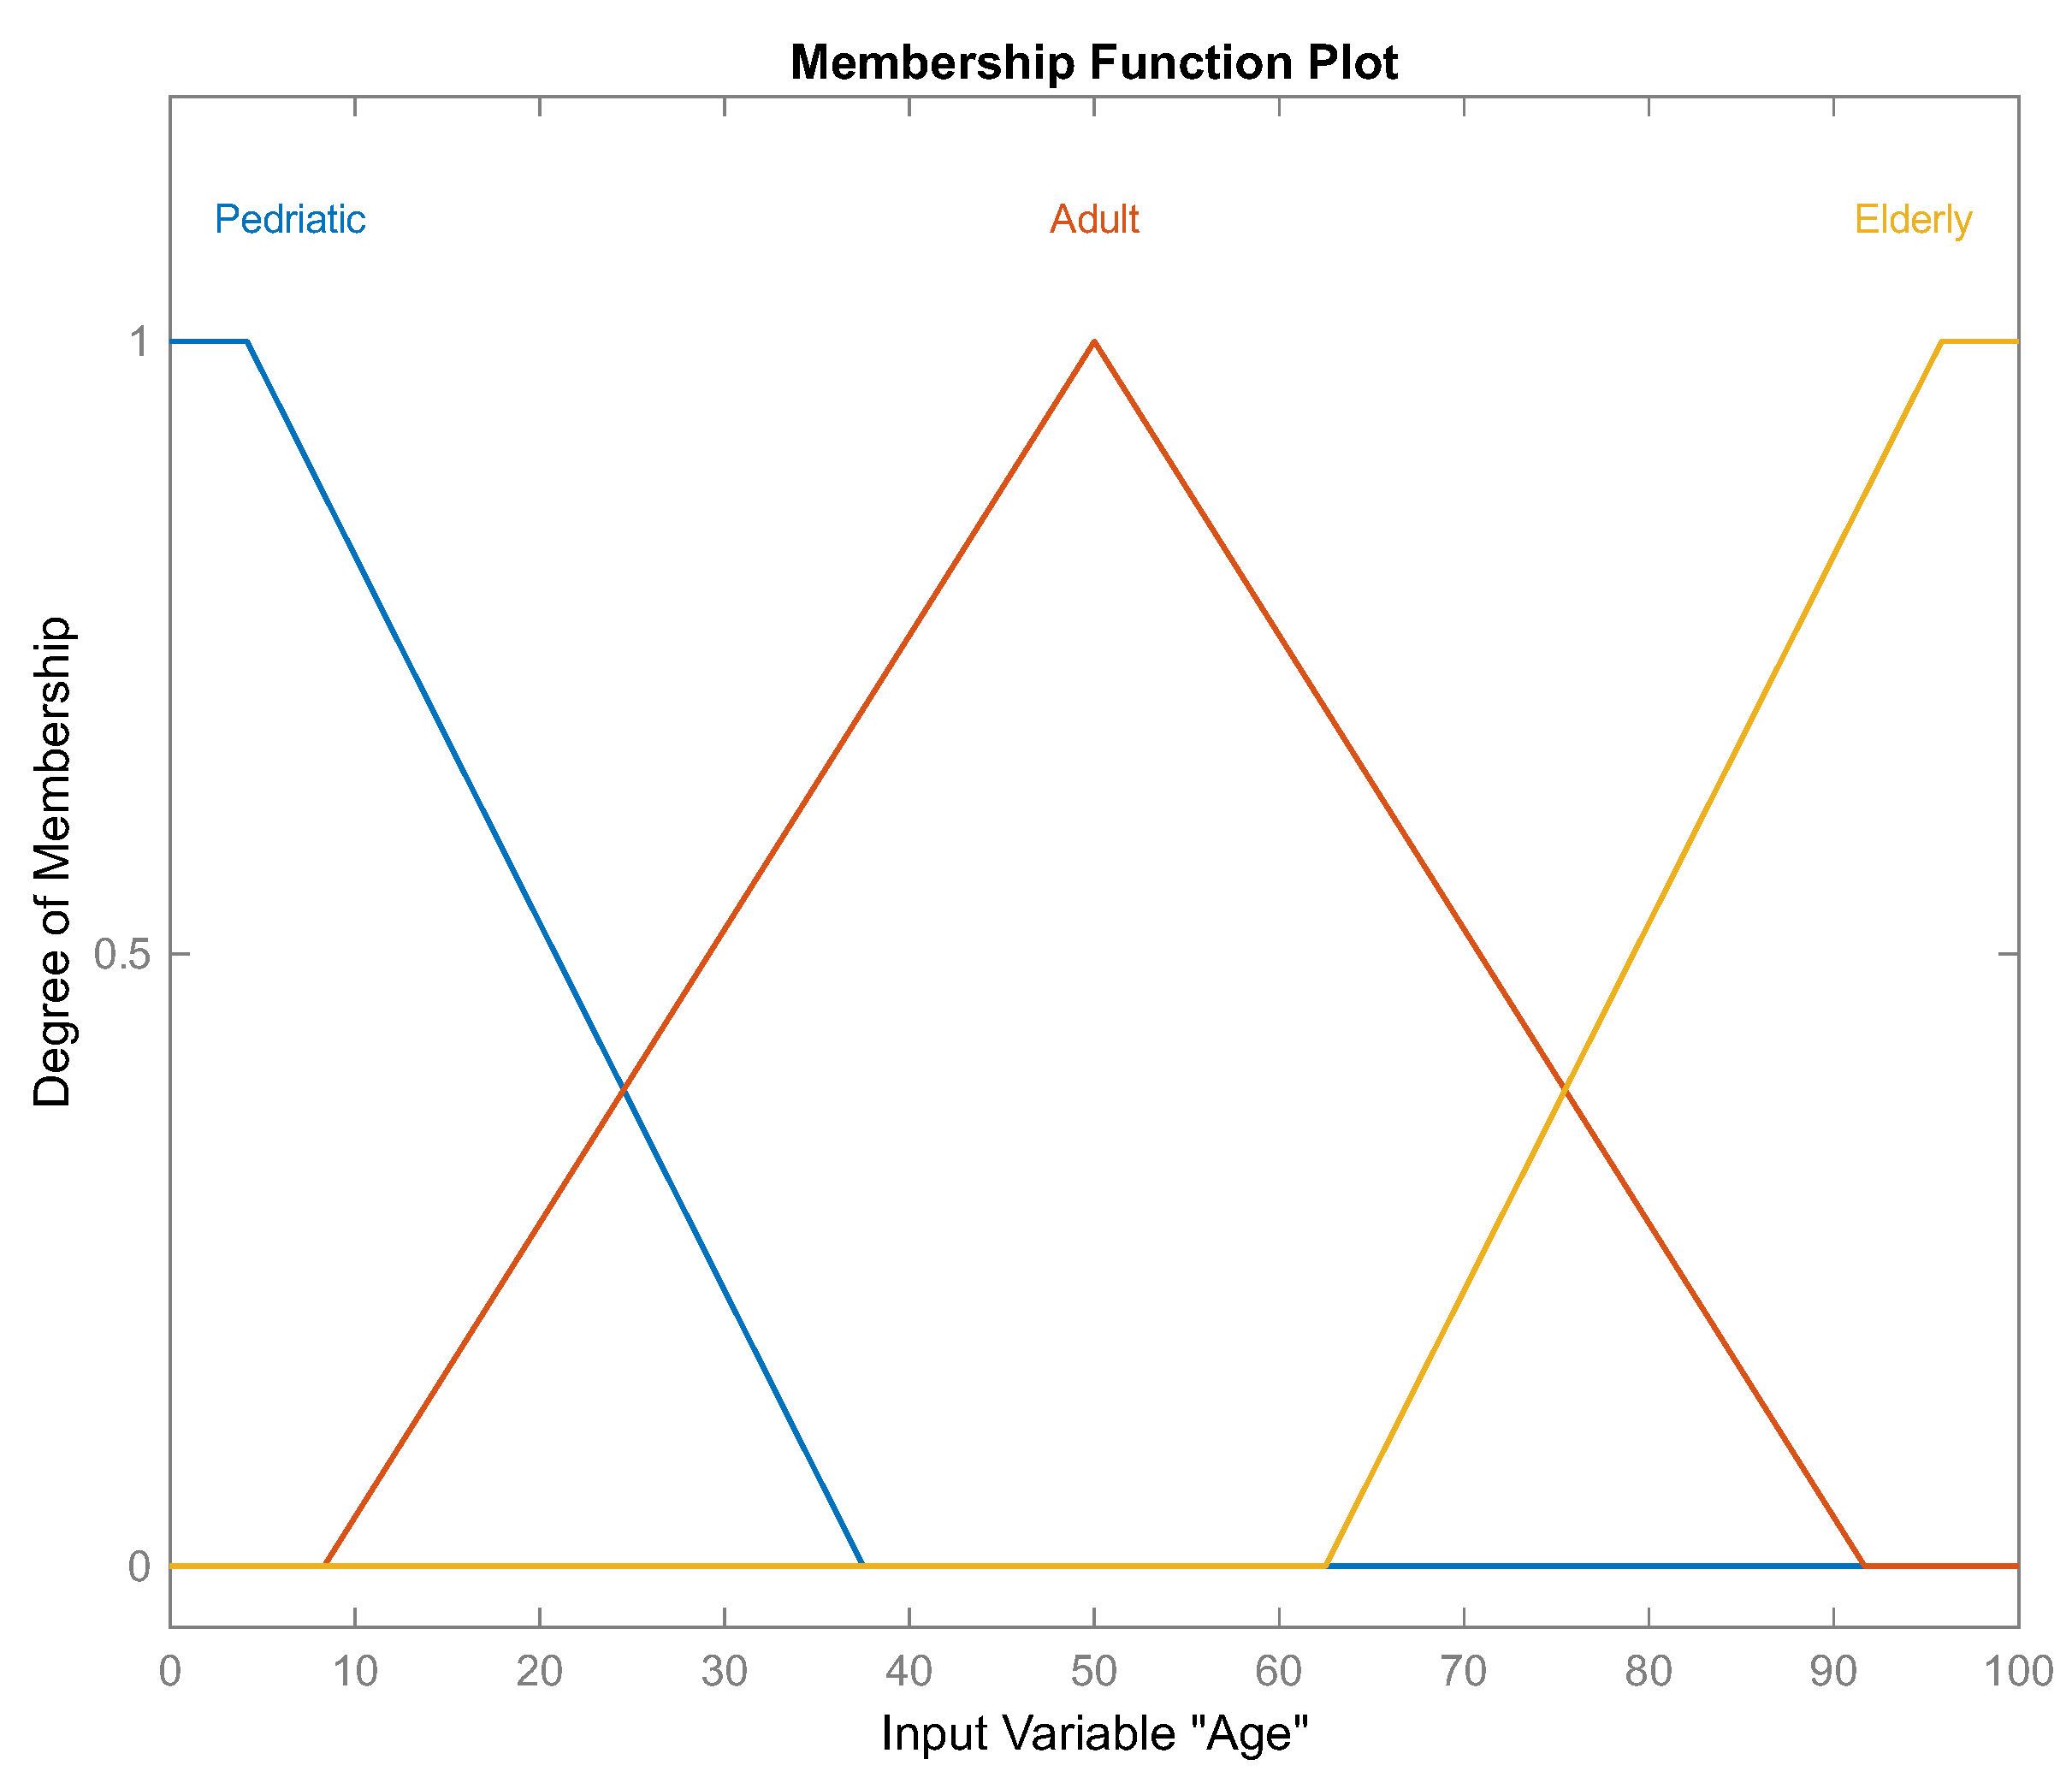
Set of linguistic values, which are three labels describing the "age" input variable, corresponding to fuzzy set .
Figure 4.
Set of linguistic values, which are three labels describing the "age" input variable, corresponding to fuzzy set .
Figure 5.
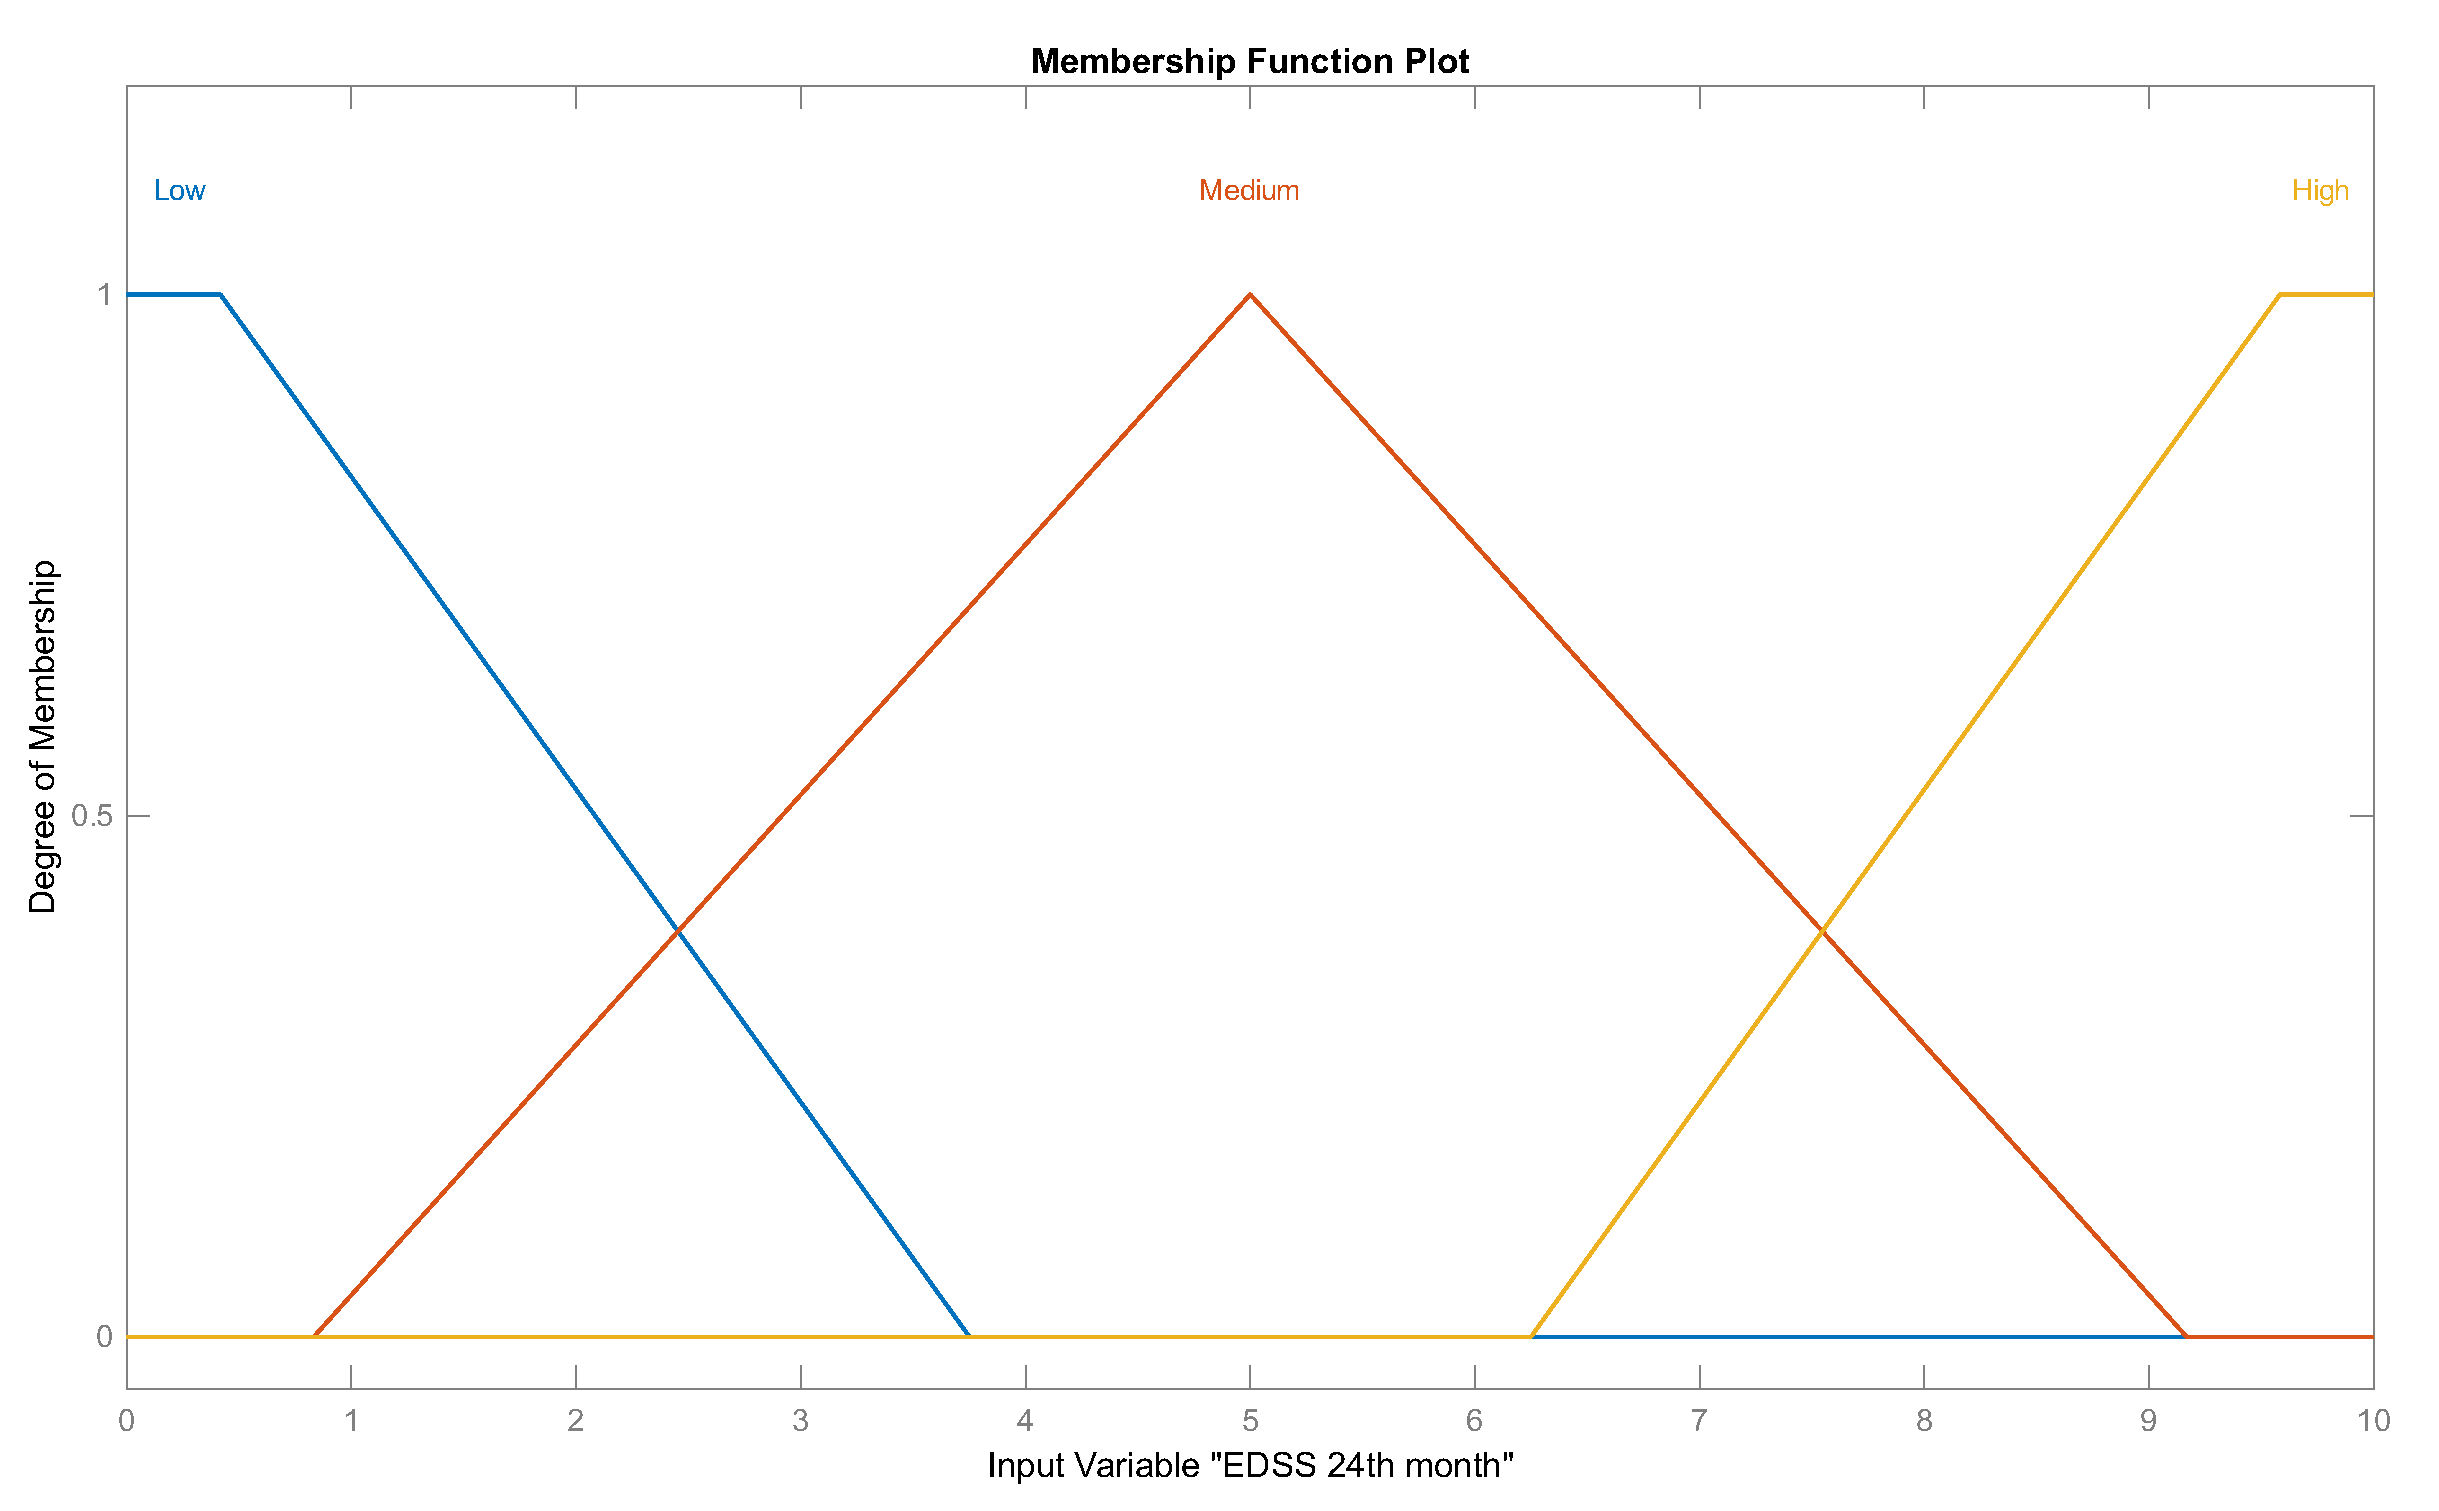
Set of linguistic values, which are three labels describing the "EDSS 24th month" input variable, corresponding to fuzzy set .
Figure 5.
Set of linguistic values, which are three labels describing the "EDSS 24th month" input variable, corresponding to fuzzy set .
Figure 6.
Structure of proposed pipeline model.
Figure 6.
Structure of proposed pipeline model.
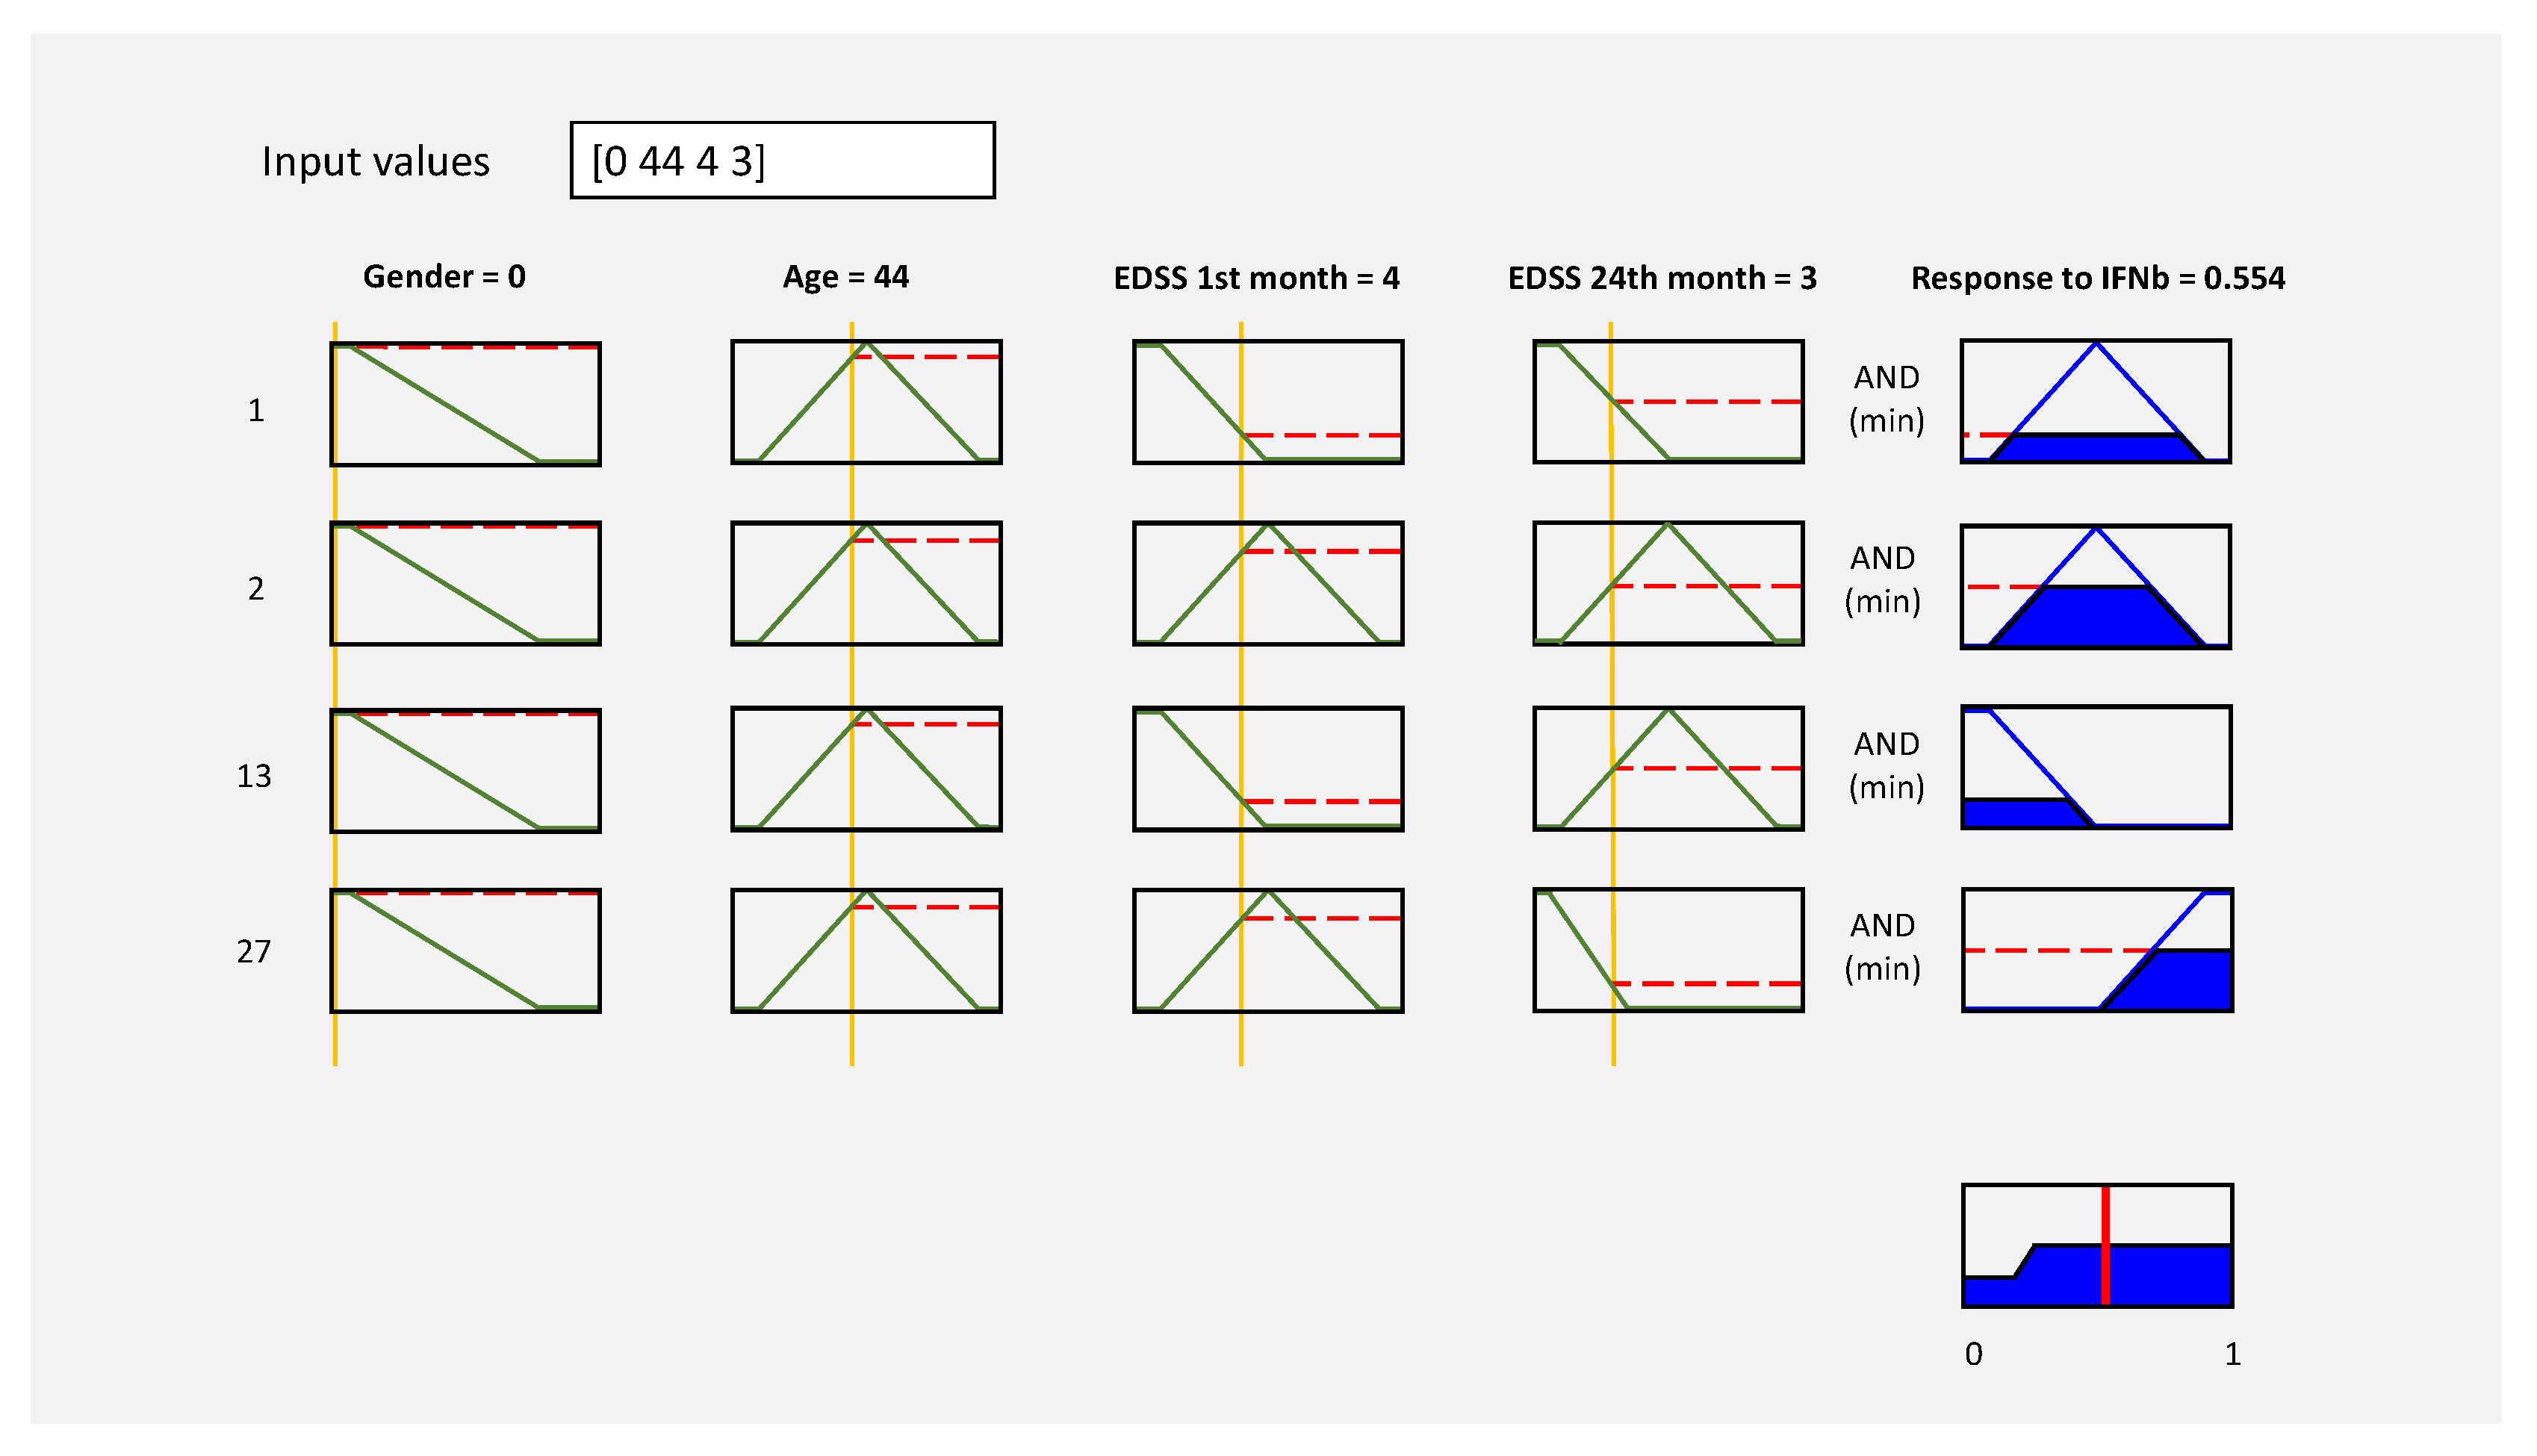
Figure 7.
Evaluation graph of 1, 2, 13, and 27 inference rules.
Figure 7.
Evaluation graph of 1, 2, 13, and 27 inference rules.
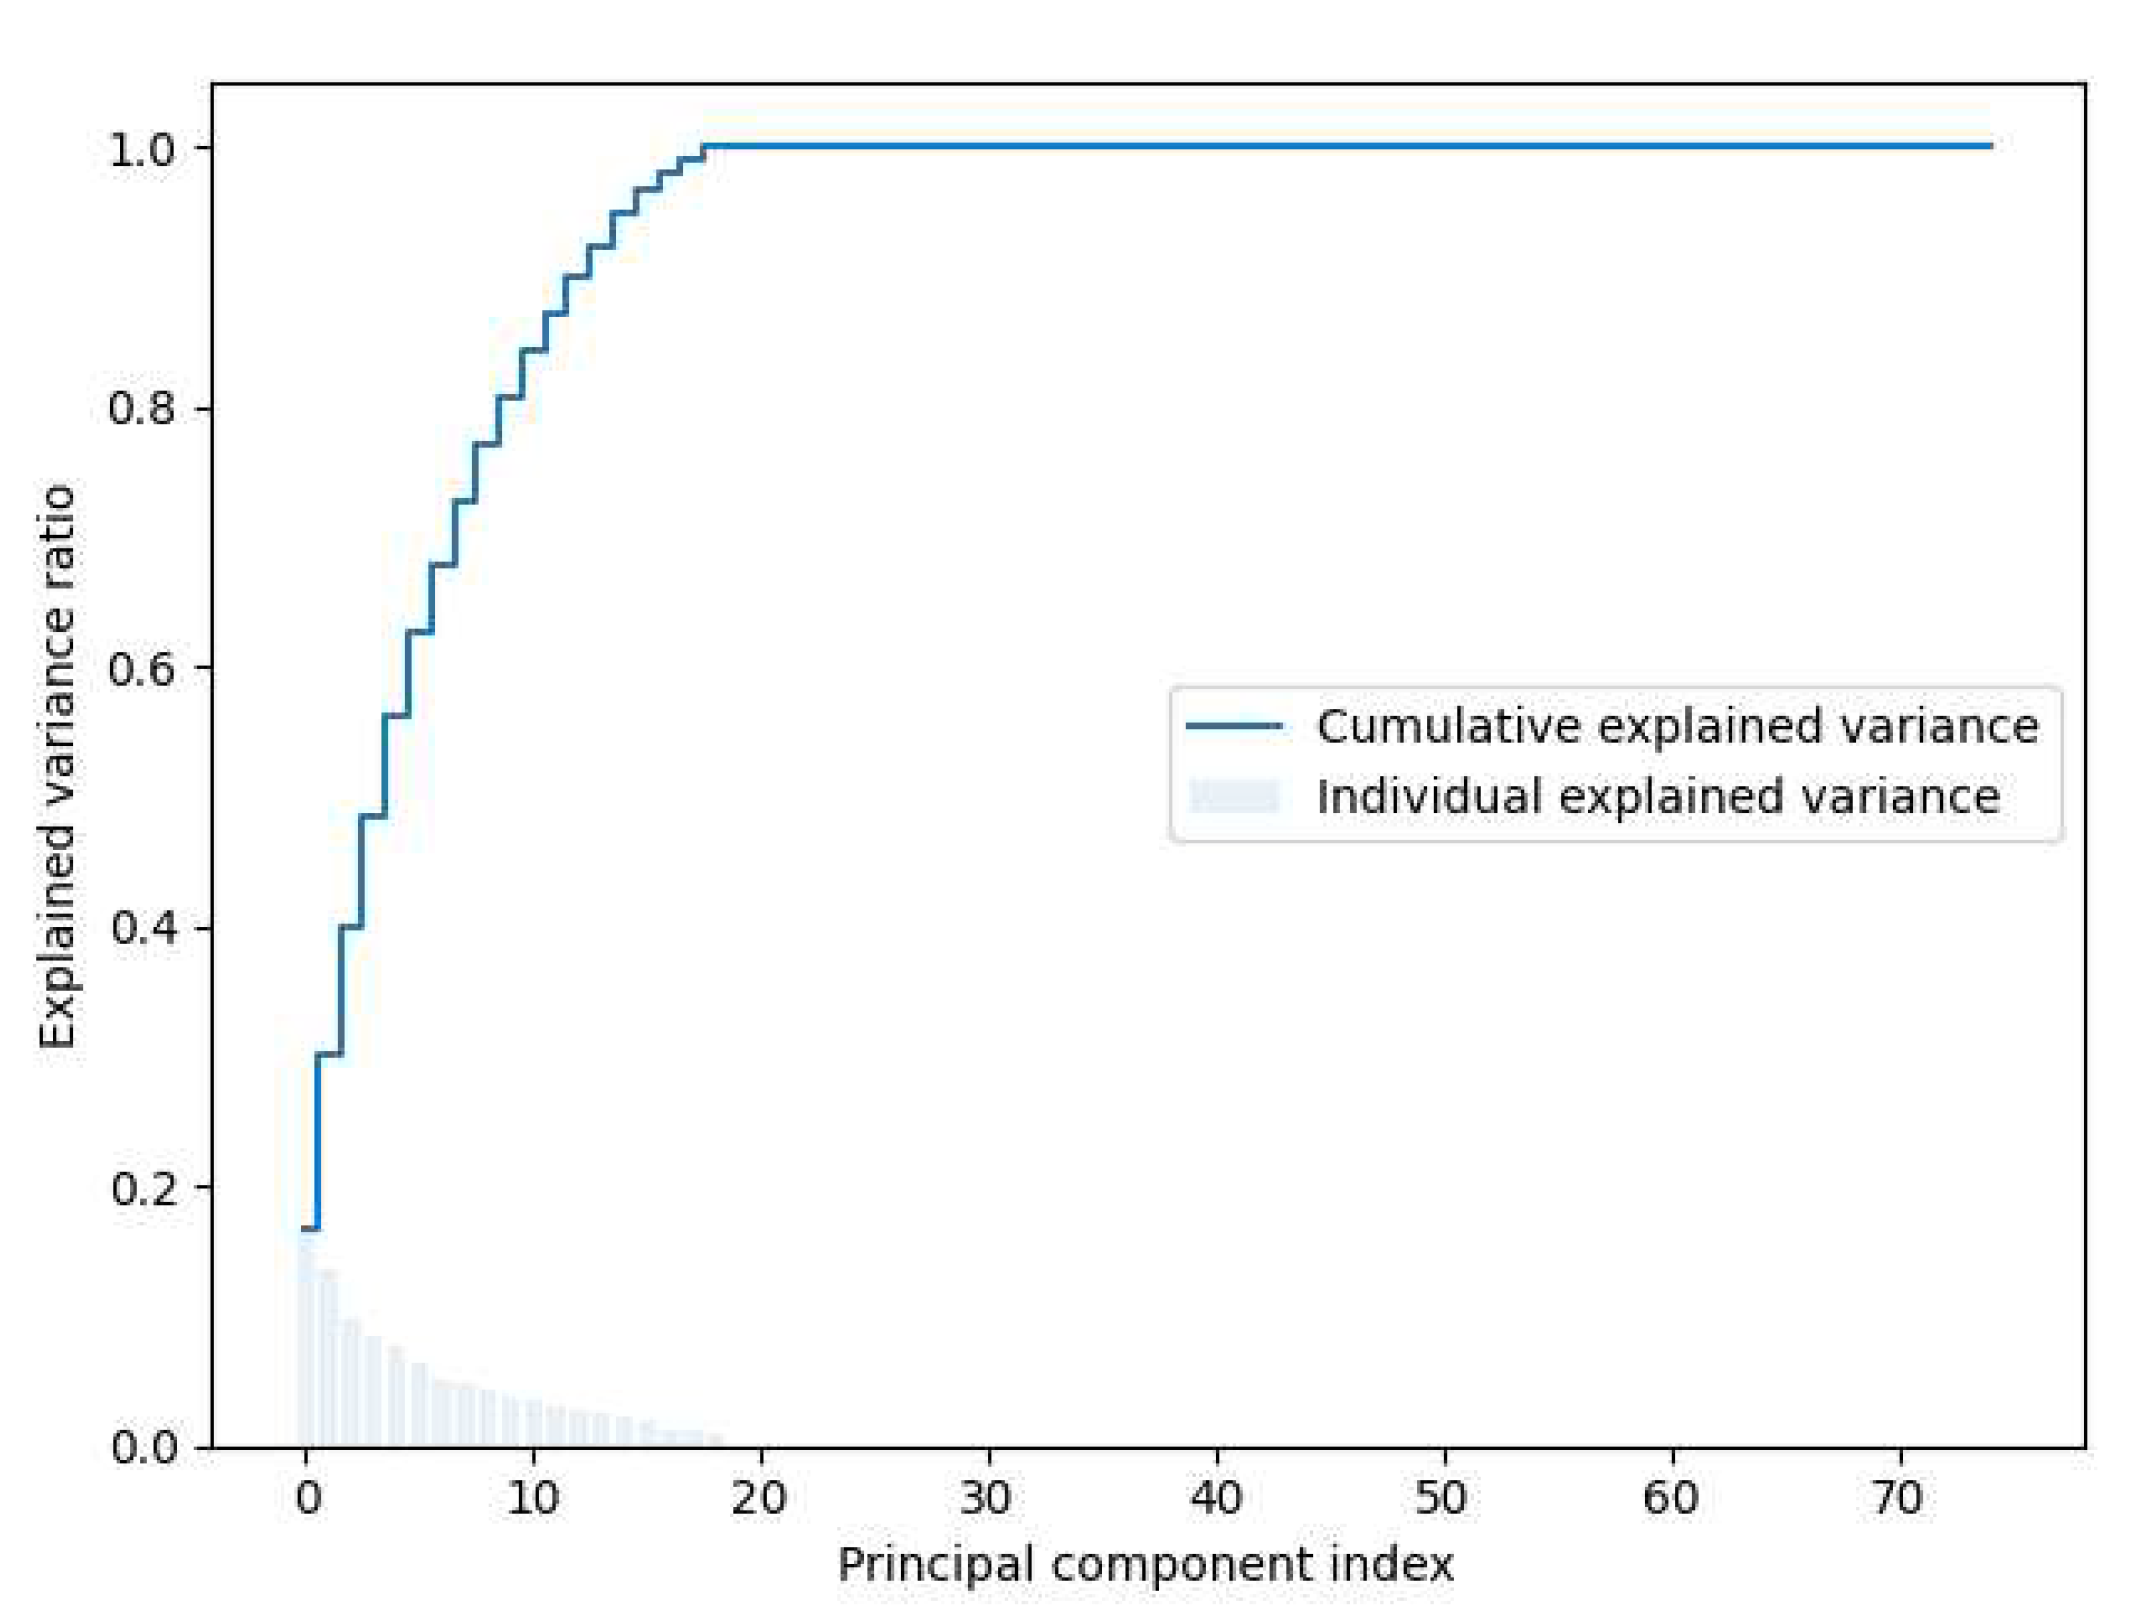
Figure 8.
Explained variance ratio.
Figure 8.
Explained variance ratio.
Figure 9.
Optimal value of n_components.
Figure 9.
Optimal value of n_components.
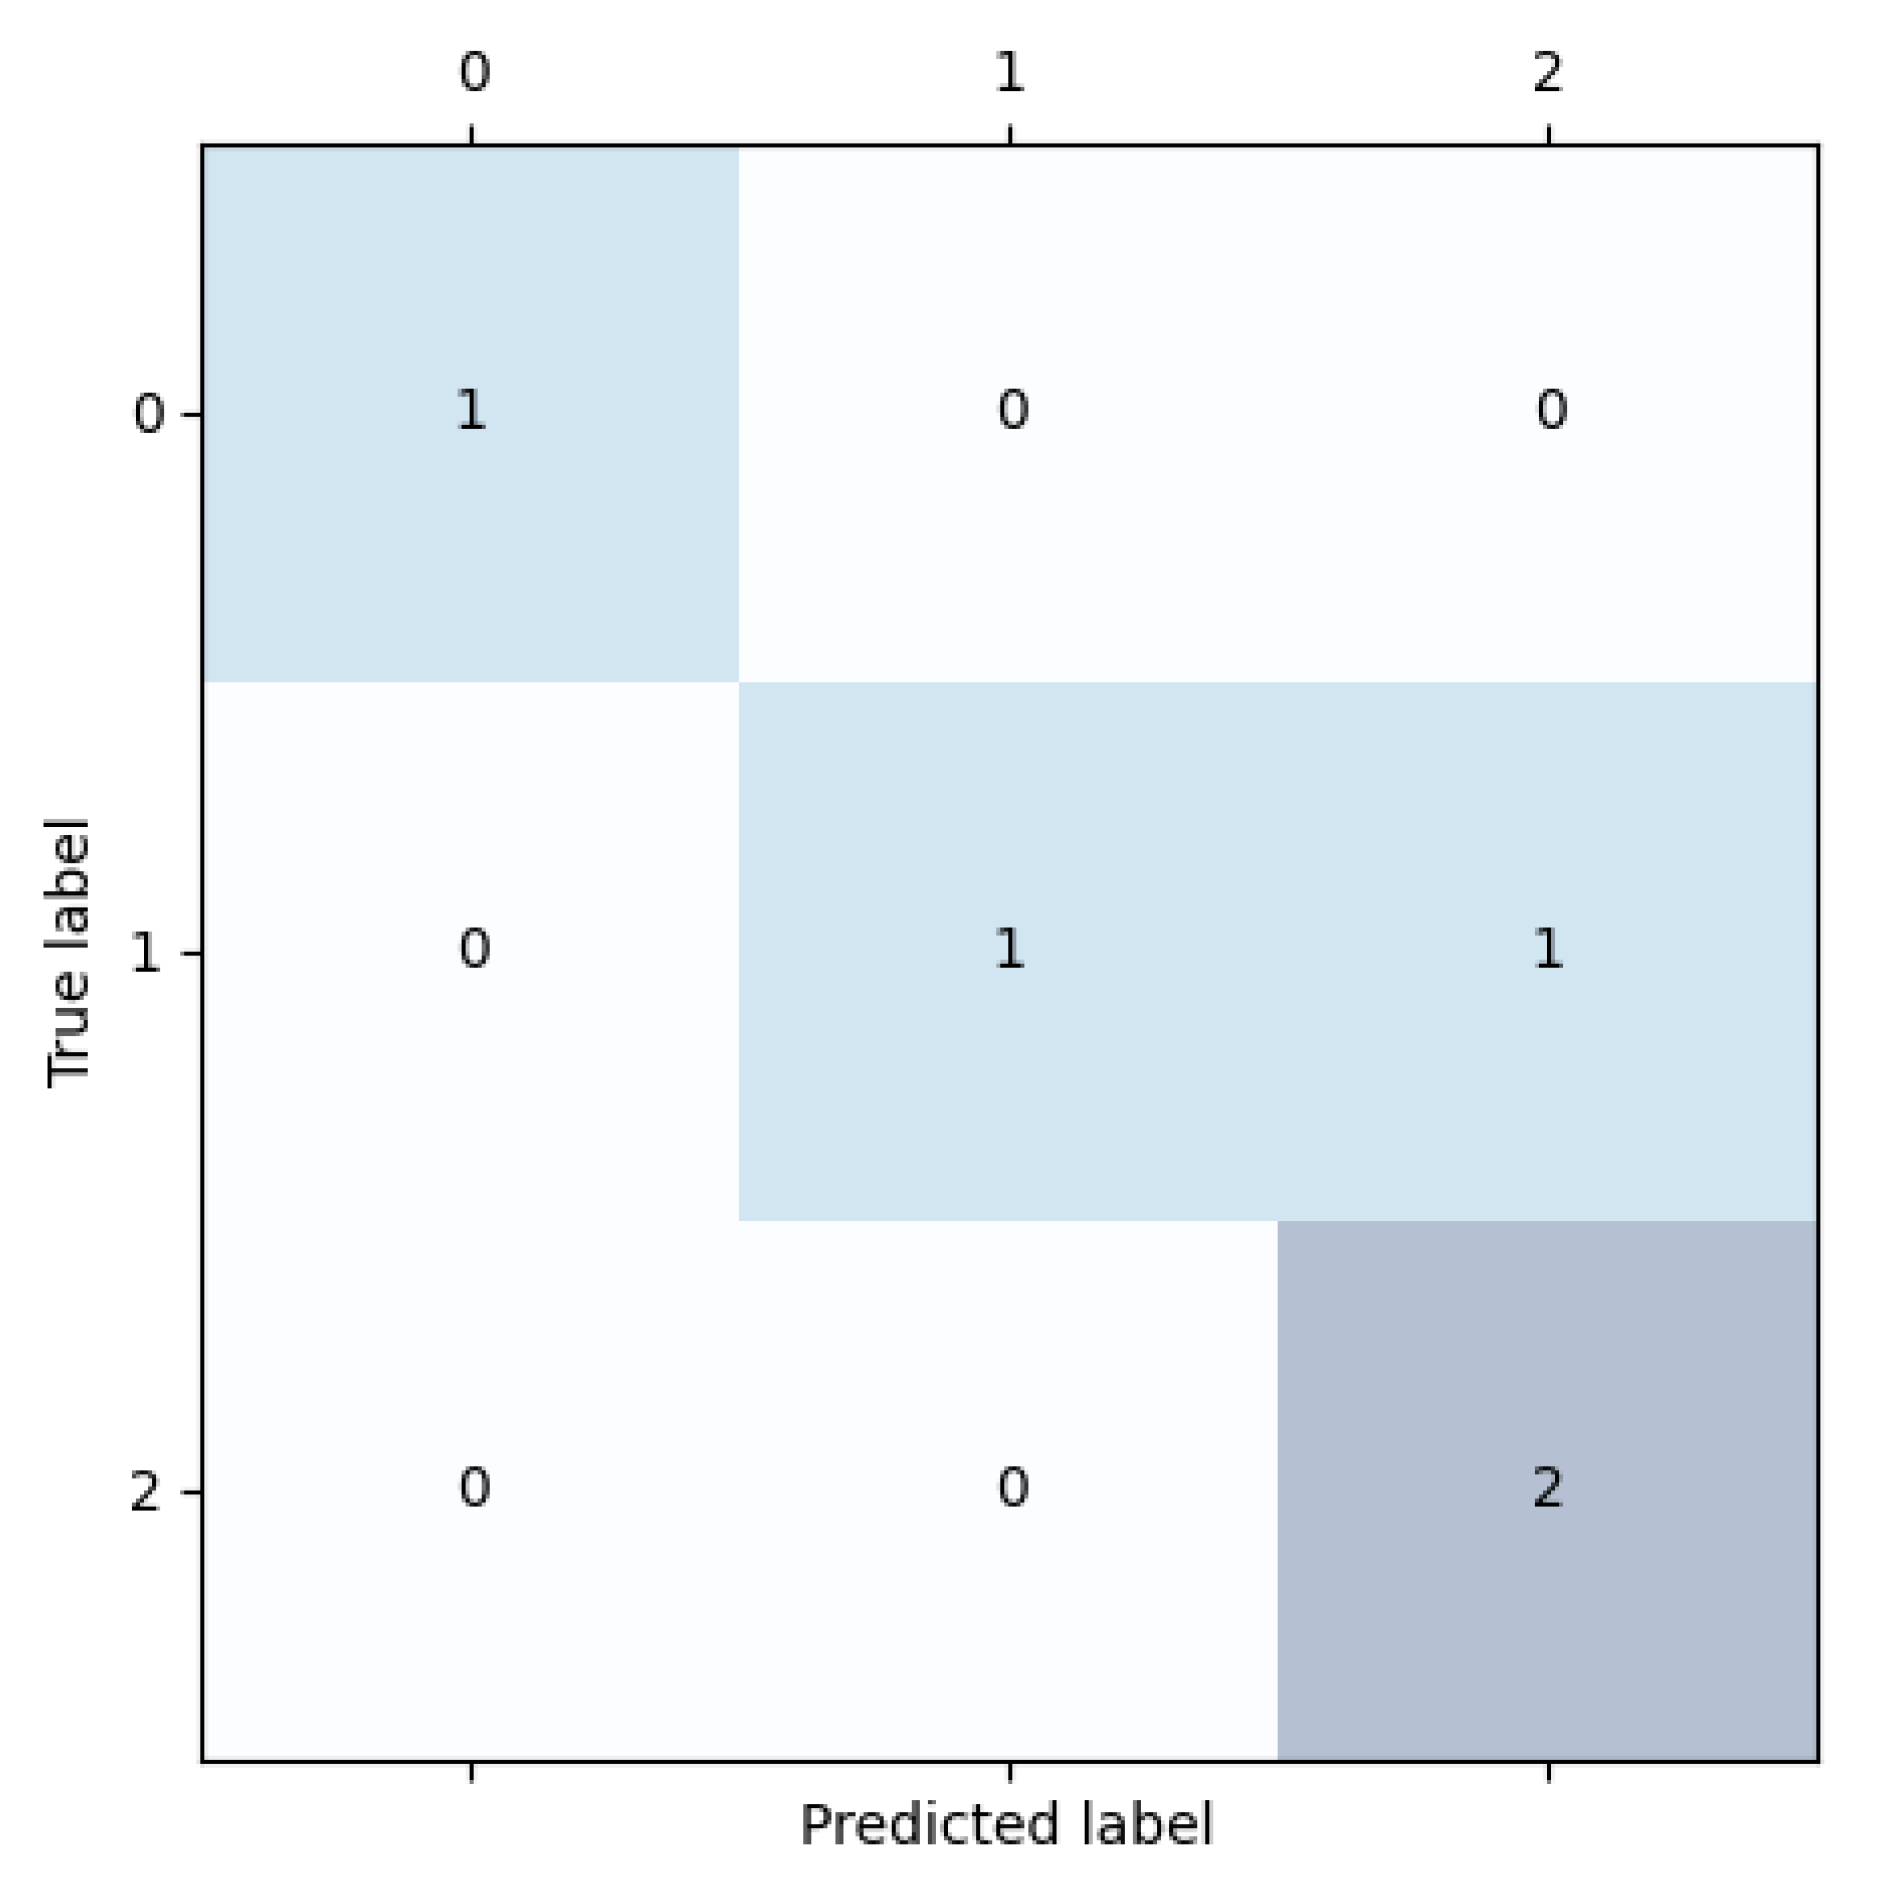
Figure 10.
Confusion matrix results. (0) High-responder to IFN-, (1) Low-responder to IFN-, and (2) Medium-responder to IFN-.
Figure 10.
Confusion matrix results. (0) High-responder to IFN-, (1) Low-responder to IFN-, and (2) Medium-responder to IFN-.
Table 1.
Demographic, and clinical characteristics.
Table 1.
Demographic, and clinical characteristics.
| Sample |
Gender |
Age |
EDSS1 1st month |
EDSS1 24th month |
| 1 |
Female |
63 |
4 |
5.5 |
| 2 |
Male |
45 |
1 |
1 |
| 3 |
Female |
25 |
1 |
1 |
| 4 |
Female |
27 |
4 |
3.5 |
| 5 |
Female |
51 |
3 |
2.5 |
| 6 |
Female |
41 |
2 |
4.5 |
| 7 |
Female |
44 |
4 |
3 |
| 8 |
Male |
30 |
1.5 |
2 |
| 9 |
Female |
26 |
4 |
3.5 |
| 10 |
Male |
42 |
1 |
1 |
| 11 |
Male |
29 |
2 |
2.5 |
| 12 |
Female |
28 |
1.5 |
2.5 |
| 13 |
Female |
48 |
1 |
1 |
| 14 |
Female |
47 |
3.5 |
3 |
| 15 |
Female |
42 |
2 |
3 |
| 16 |
Female |
50 |
3.5 |
3.5 |
| 17 |
Male |
37 |
1.5 |
4.5 |
| 18 |
Female |
43 |
2 |
2 |
| 19 |
Male |
54 |
3 |
2 |
| 20 |
Male |
40 |
1 |
1 |
| 21 |
Female |
48 |
2 |
2 |
| 22 |
Female |
38 |
2 |
3 |
| 23 |
Male |
18 |
1.5 |
2 |
| 24 |
Female |
24 |
1 |
1 |
| 25 |
Male |
38 |
1 |
1 |
Table 2.
Linguistic variables description.
Table 2.
Linguistic variables description.
| Membership |
Fuzzy |
Universe |
Parameters |
| Function |
Set |
of discourse |
and Type |
|
|
: [0 a 1] |
Female: [-0.75 ; -0.083 ; 0.083 ; 0.75] Trapezoidal |
| |
|
|
Male: [0.25 ; 0.916 ; 1.083 ; 1.75] Trapezoidal |
|
|
: [0 a 100] years |
Pediatric: [-37.5 ; -4.167 ; 4.167 ; 37.5] Trapezoidal |
| |
|
|
Adult: [8.333 ; 50 ; 91.666] Triangular |
| |
|
|
Elderly: [62.5 ; 95.83 ; 104.2 ; 137.5] Trapezoidal |
|
|
: [0 a 10] units |
Low: [-3.75 ; -0.416 ; 1.0 ; 5.0] Trapezoidal |
| |
|
|
Med: [1.0 ; 5.0 ; 9.0] Triangular |
| |
|
|
High: [5.0 ; 9.0 ; 10.42 ; 13.75] Trapezoidal |
|
|
: [0 a 10] units |
Low: [-3.75 ; -0.416 ; 1.0 ; 5.0] Trapezoidal |
| |
|
|
Med: [1.0 ; 5.0 ; 9.0] Triangular |
| |
|
|
High: [5.0 ; 9.0 ; 10.42 ; 13.75] Trapezoidal |
Table 3.
Fuzzy rules definition (first part).
Table 3.
Fuzzy rules definition (first part).
| # |
Rule |
| 1 |
If gender is female and age is adult and EDSS 1st month is low and EDSS 24th month is low then response to IFNb is medium |
| 2 |
If gender is female and age is adult and EDSS 1st month is medium and EDSS 24th month is medium then response to IFNb is medium |
| 3 |
If gender is female and age is adult and EDSS 1st month is high and EDSS 24th month is high then response to IFNb is medium |
| 4 |
If gender is female and age is elderly and EDSS 1st month is low and EDSS after 24th month is low then response to IFNb is medium |
| 5 |
If gender is female and age is elderly and EDSS 1st month is medium and EDSS 24th month is medium then response to IFNb is medium |
| 6 |
If gender is female and age is elderly and EDSS 1st month is high and EDSS 24th month is high then response to IFNb is medium |
| 7 |
If gender is male and age is adult and EDSS 1st month is low and EDSS 24th month is low then response to IFNb is medium |
| 8 |
If gender is male and age is adult and EDSS 1st month is medium and EDSS 24th month is medium then response to IFNb is medium |
| 9 |
If gender is male and age is adult and EDSS 1st month is high and EDSS 24th month is high then response to IFNb is medium |
| 10 |
If gender is male and age is elderly and EDSS 1st month is low and EDSS 24th month is low then response to IFNb is medium |
| 11 |
If gender is male and age is elderly and EDSS 1st month is medium and EDSS 24th month is medium then response to IFNb is medium |
| 12 |
If gender is male and age is elderly and EDSS 1st month is high and EDSS 24th month is high then response to IFNb is medium |
| 13 |
If gender is female and age is adult and EDSS 1st month is low and EDSS 24th month is medium then response to IFNb is low |
| 14 |
If gender is female and age is adult and EDSS 1st month is low and EDSS 24th month is high then response to IFNb is low |
| 15 |
If gender is female and age is adult and EDSS 1st month is medium and EDSS 24th month is high then response to IFNb is low |
| 16 |
If gender is female and age is elderly and EDSS 1st month is low and EDSS 24th month is medium then response to IFNb is low |
| 17 |
If gender is female and age is elderly and EDSS 1st month is low and EDSS 24th month is high then response to IFNb is low |
| 18 |
If gender is female and age is elderly and EDSS 1st month is medium and EDSS 24th month is high then response to IFNb is low |
Table 4.
Fuzzy rules definition (second part).
Table 4.
Fuzzy rules definition (second part).
| # |
Rule |
| 19 |
If gender is male and age is adult and EDSS 1st month is low and EDSS 24th month is medium then response to IFNb is low |
| 20 |
If gender is male and age is adult and EDSS 1st month is low and EDSS 24th month is high then response to IFNb is low |
| 21 |
If gender is male and age is adult and EDSS 1st month is medium and EDSS 24th month is high then response to IFNb is low |
| 22 |
If gender is male and age is elderly and EDSS 1st month is low and EDSS 24th month is medium then response to IFNb is low |
| 23 |
If gender is male and age is elderly and EDSS 1st month is low and EDSS 24th month is high then response to IFNb is low |
| 24 |
If gender is male and age is elderly and EDSS 1st month is medium and EDSS 24th month is high then response to IFNb is low |
| 25 |
If gender is female and age is adult and EDSS 1st month is high and EDSS 24th month is medium then response to IFNb is high |
| 26 |
If gender is female and age is adult and EDSS 1st month is high and EDSS 24th month is low then response to IFNb is high |
| 27 |
If gender is female and age is adult and EDSS 1st month is medium and EDSS 24th month is low then response to IFNb is high |
| 28 |
If gender is female and age is elderly and EDSS 1st month is high and EDSS 24th month is med then response to IFNb is high |
| 29 |
If gender is female and age is elderly and EDSS 1st month is high and EDSS 24th month is low then response to IFNb is high |
| 30 |
If gender is female and age is elderly and EDSS 1st month is medium and EDSS 24th month is low then response to IFNb is high |
| 31 |
If gender is male and age is adult and EDSS 1st month is high and EDSS 24th month is medium then response to IFNb is high |
| 32 |
If gender is male and age is adult and EDSS 1st month is high and EDSS 24th month is low then response to IFNb is high |
| 33 |
If gender is male and age is adult and EDSS 1st month is medium and EDSS 24th month is low then response to IFNb is high |
| 34 |
If gender is male and age is elderly and EDSS 1st month is high and EDSS 24th month is medium then response to IFNb is high |
| 35 |
If gender is male and age is elderly and EDSS 1st month is high and EDSS 24th month is low then response to IFNb is high |
| 36 |
If gender is male and age is elderly and EDSS 1st month is medium and EDSS 24th month is low then response to IFNb is high |
Table 5.
Fuzzification results (gender, and age).
Table 5.
Fuzzification results (gender, and age).
| Sample |
|
|
|
|
|
| 1 |
1 |
0 |
0 |
0.687 |
0.015 |
| 2 |
0 |
1 |
0 |
0.88 |
0 |
| 3 |
1 |
0 |
0.375 |
0.4 |
0 |
| 4 |
1 |
0 |
0.315 |
0.448 |
0 |
| 5 |
1 |
0 |
0 |
0.975 |
0 |
| 6 |
1 |
0 |
0 |
0.784 |
0 |
| 7 |
1 |
0 |
0 |
0.856 |
0 |
| 8 |
0 |
1 |
0.225 |
0.479 |
0 |
| 9 |
1 |
0 |
0.345 |
0.424 |
0 |
| 10 |
0 |
1 |
0 |
0.808 |
0 |
| 11 |
0 |
1 |
0.255 |
0.496 |
0 |
| 12 |
1 |
0 |
0.258 |
0.472 |
0 |
| 13 |
1 |
0 |
0 |
0.952 |
0 |
| 14 |
1 |
0 |
0 |
0.928 |
0 |
| 15 |
1 |
0 |
0 |
0.808 |
0 |
| 16 |
1 |
0 |
0 |
1 |
0 |
| 17 |
0 |
1 |
0.015 |
0.688 |
0 |
| 18 |
1 |
0 |
0 |
0.832 |
0 |
| 19 |
0 |
1 |
0 |
0.903 |
0 |
| 20 |
0 |
1 |
0 |
0.76 |
0 |
| 21 |
1 |
0 |
0 |
0.952 |
0 |
| 22 |
1 |
0 |
0 |
0.712 |
0 |
| 23 |
0 |
1 |
0.585 |
0.232 |
0 |
| 24 |
1 |
0 |
0.405 |
0.376 |
0 |
| 25 |
0 |
1 |
0 |
0.712 |
0 |
Table 6.
Fuzzification results (EDSS 1st month, and EDSS 24th month).
Table 6.
Fuzzification results (EDSS 1st month, and EDSS 24th month).
| Sample |
|
|
|
|
|
|
| 1 |
0.25 |
0.75 |
0.0 |
0.0 |
0.875 |
0.125 |
| 2 |
1.0 |
0.0 |
0.0 |
1.0 |
0.0 |
0.0 |
| 3 |
1.0 |
0.0 |
0.0 |
1.0 |
0.0 |
0.0 |
| 4 |
0.25 |
0.75 |
0.0 |
0.375 |
0.625 |
0.0 |
| 5 |
0.5 |
0.5 |
0.0 |
0.625 |
0.375 |
0.0 |
| 6 |
0.75 |
0.25 |
0.0 |
0.125 |
0.875 |
0.0 |
| 7 |
0.25 |
0.75 |
0.0 |
0.5 |
0.5 |
0.0 |
| 8 |
0.875 |
0.125 |
0.0 |
0.75 |
0.25 |
0.0 |
| 9 |
0.25 |
0.75 |
0.0 |
0.25 |
0.75 |
0.0 |
| 10 |
1.0 |
0.0 |
0.0 |
1.0 |
0.0 |
0.0 |
| 11 |
0.75 |
0.25 |
0.0 |
0.625 |
0.375 |
0.0 |
| 12 |
0.875 |
0.125 |
0.0 |
0.625 |
0.375 |
0 |
| 13 |
1.0 |
0.0 |
0.0 |
1.0 |
0.0 |
0.0 |
| 14 |
0.375 |
0.625 |
0.0 |
0.5 |
0.5 |
0.0 |
| 15 |
0.75 |
0.25 |
0.0 |
0.5 |
0.5 |
0.0 |
| 16 |
0.375 |
0.625 |
0.0 |
0.375 |
0.625 |
0.0 |
| 17 |
0.875 |
0.125 |
0.0 |
0.125 |
0.875 |
0.0 |
| 18 |
0.75 |
0.25 |
0.0 |
0.75 |
0.25 |
0.0 |
| 19 |
0.5 |
0.5 |
0.0 |
0.75 |
0.25 |
0.0 |
| 20 |
1.0 |
0.0 |
0.0 |
1.0 |
0.0 |
0.0 |
| 21 |
0.75 |
0.25 |
0.0 |
0.75 |
0.25 |
0.0 |
| 22 |
0.75 |
0.25 |
0.0 |
0.5 |
0.5 |
0.0 |
| 23 |
0.875 |
0.125 |
0 |
0.75 |
0.25 |
0.0 |
| 24 |
1.0 |
0.0 |
0.0 |
1.0 |
0.0 |
0.0 |
| 25 |
1.0 |
0.0 |
0.0 |
1.0 |
0.0 |
0.0 |
Table 7.
Inference results for the #7 sample.
Table 7.
Inference results for the #7 sample.
| # |
Rule |
Inference Engine |
| 1 |
If gender is "female" and age is "adult" and EDSS 1st month is "low" and EDSS 24th month is "low" then response to IFNb is "medium" |
min(1.0, 0.856, 0.25, 0.5) = 0.25 |
| 2 |
If gender is "female" and age is "adult" and EDSS 1st month is "medium" and EDSS 24th month is "medium" then response to IFNb is "medium" |
min(1.0, 0.856, 0.75, 0.5) = 0.5 |
| 13 |
If gender is "female" and age is "adult" and EDSS 1st month is "low" and EDSS 24th month is "medium" then response to IFNb is "low" |
min(1.0, 0.856, 0.25, 0.5) = 0.25 |
| 27 |
If gender is "female" and age is "adult" and EDSS 1st month is "medium" and EDSS 24th month is "low" then response to IFNb is "high" |
min(1.0, 0.856, 0.75, 0.5) = 0.5 |
Table 8.
Classification of response to IFN-
. The resulting numerical values of defuzzification less than 0.5 are considered as low-responder (LR), equal to 0.5 as medium-responder (MR), and greater than 0.5 as high-responder (HR). For comparison purposes, the input data of
Table 1 were preprocessed by Standard-Scaler technique, and they were used to train a prediction model of agglomerative clustering (n_clusters=3).
| Sample |
Expert |
Fuzzy System |
Agglomerative |
| |
opinion |
(Deffuzification) |
Clustering |
| 1 |
LR |
0.459 ⇒ LR |
HR |
| 2 |
MR |
0.5 ⇒ MR |
LR |
| 3 |
MR |
0.5 ⇒ MR |
MR |
| 4 |
HR |
0.529 ⇒ HR |
HR |
| 5 |
HR |
0.527 ⇒ HR |
HR |
| 6 |
LR |
0.337 ⇒ LR |
HR |
| 7 |
HR |
0.554 ⇒ HR |
HR |
| 8 |
LR |
0.474 ⇒ LR |
LR |
| 9 |
HR |
0.53 ⇒ HR |
HR |
| 10 |
MR |
0.5 ⇒ MR |
LR |
| 11 |
LR |
0.472 ⇒ LR |
LR |
| 12 |
LR |
0.445 ⇒ LR |
MR |
| 13 |
MR |
0.5 ⇒ MR |
MR |
| 14 |
HR |
0.527 ⇒ HR |
HR |
| 15 |
LR |
0.446 ⇒ LR |
MR |
| 16 |
MR |
0.5 ⇒ MR |
HR |
| 17 |
LR |
0.302 ⇒ LR |
HR |
| 18 |
MR |
0.5 ⇒ MR |
MR |
| 19 |
HR |
0.554 ⇒ HR |
LR |
| 20 |
MR |
0.5 ⇒ MR |
LR |
| 21 |
MR |
0.5 ⇒ MR |
MR |
| 22 |
LR |
0.446 ⇒ LR |
MR |
| 23 |
LR |
0.463 ⇒ LR |
LR |
| 24 |
MR |
0.5 ⇒ MR |
MR |
| 25 |
MR |
0.5 ⇒ MR |
LR |
Table 9.
K iterations cross-validation results.
Table 9.
K iterations cross-validation results.
| Fold |
CV Accuracy |
| 1 |
0.333 |
| 2 |
0.667 |
| 3 |
0.333 |
| 4 |
0.333 |
| 5 |
0.500 |
| 6 |
0.000 |
| 7 |
1.000 |
| 8 |
1.000 |
