1. Introduction
In today’s national and international socio-economic conditions, the issues related to engaging those who manage businesses, the public sector, and non-governmental organizations in social causes are becoming increasingly relevant. To support this claim, we can point out numerous managerial solutions and activities oriented towards the specific interests (including those related to the environment) of customers, suppliers, personnel, and the society as a whole within the scope of the economic and non-economic activity they realize. The outlined solutions and activities have acquired a public character via the collective notion “corporate social responsibility” (CSR), which, despite being identified as non-mandatory, has been the object of a number of theoretical and practical analyses and discussions (Krysovatyy et al. 2022; Lamptey, Park, and Bonaparte 2023; Shahadat et al. 2023; Singh and Hong 2023). From previous literature, it was found that popular digital tools are successfully used in finance, management, industry, education, etc. (Muchiri et al. 2022; Pangalos 2023; Paris et al. 2023; Richert and Dudek 2023; Sheel and Nath 2019). Furthermore, the expansion of their consistent and long-term implementation combined with their integration in CSR activities is an undisputed testimonial of the existence of foresight and visionary in management.
In the conditions of a permanently digitalizing environment, corporations increasingly use digital technologies. Their goal is to improve their CSR activities by constantly perfecting the measurement of their efficiency, communication with stakeholders and the competitiveness on the market. This research presents a theoretical and applied study, which combines the objective capacity of bibliometric analysis and the subjective views of the authors regarding the topic and the scope of the researched materials, integrated in scientific conclusions, trends, and perspectives of future research.
The main goal of the research is to identify the current state of scientific research in the field of integrating digital technologies in activities related to CSR in business, as well as to propose recommendations for further research and practices.
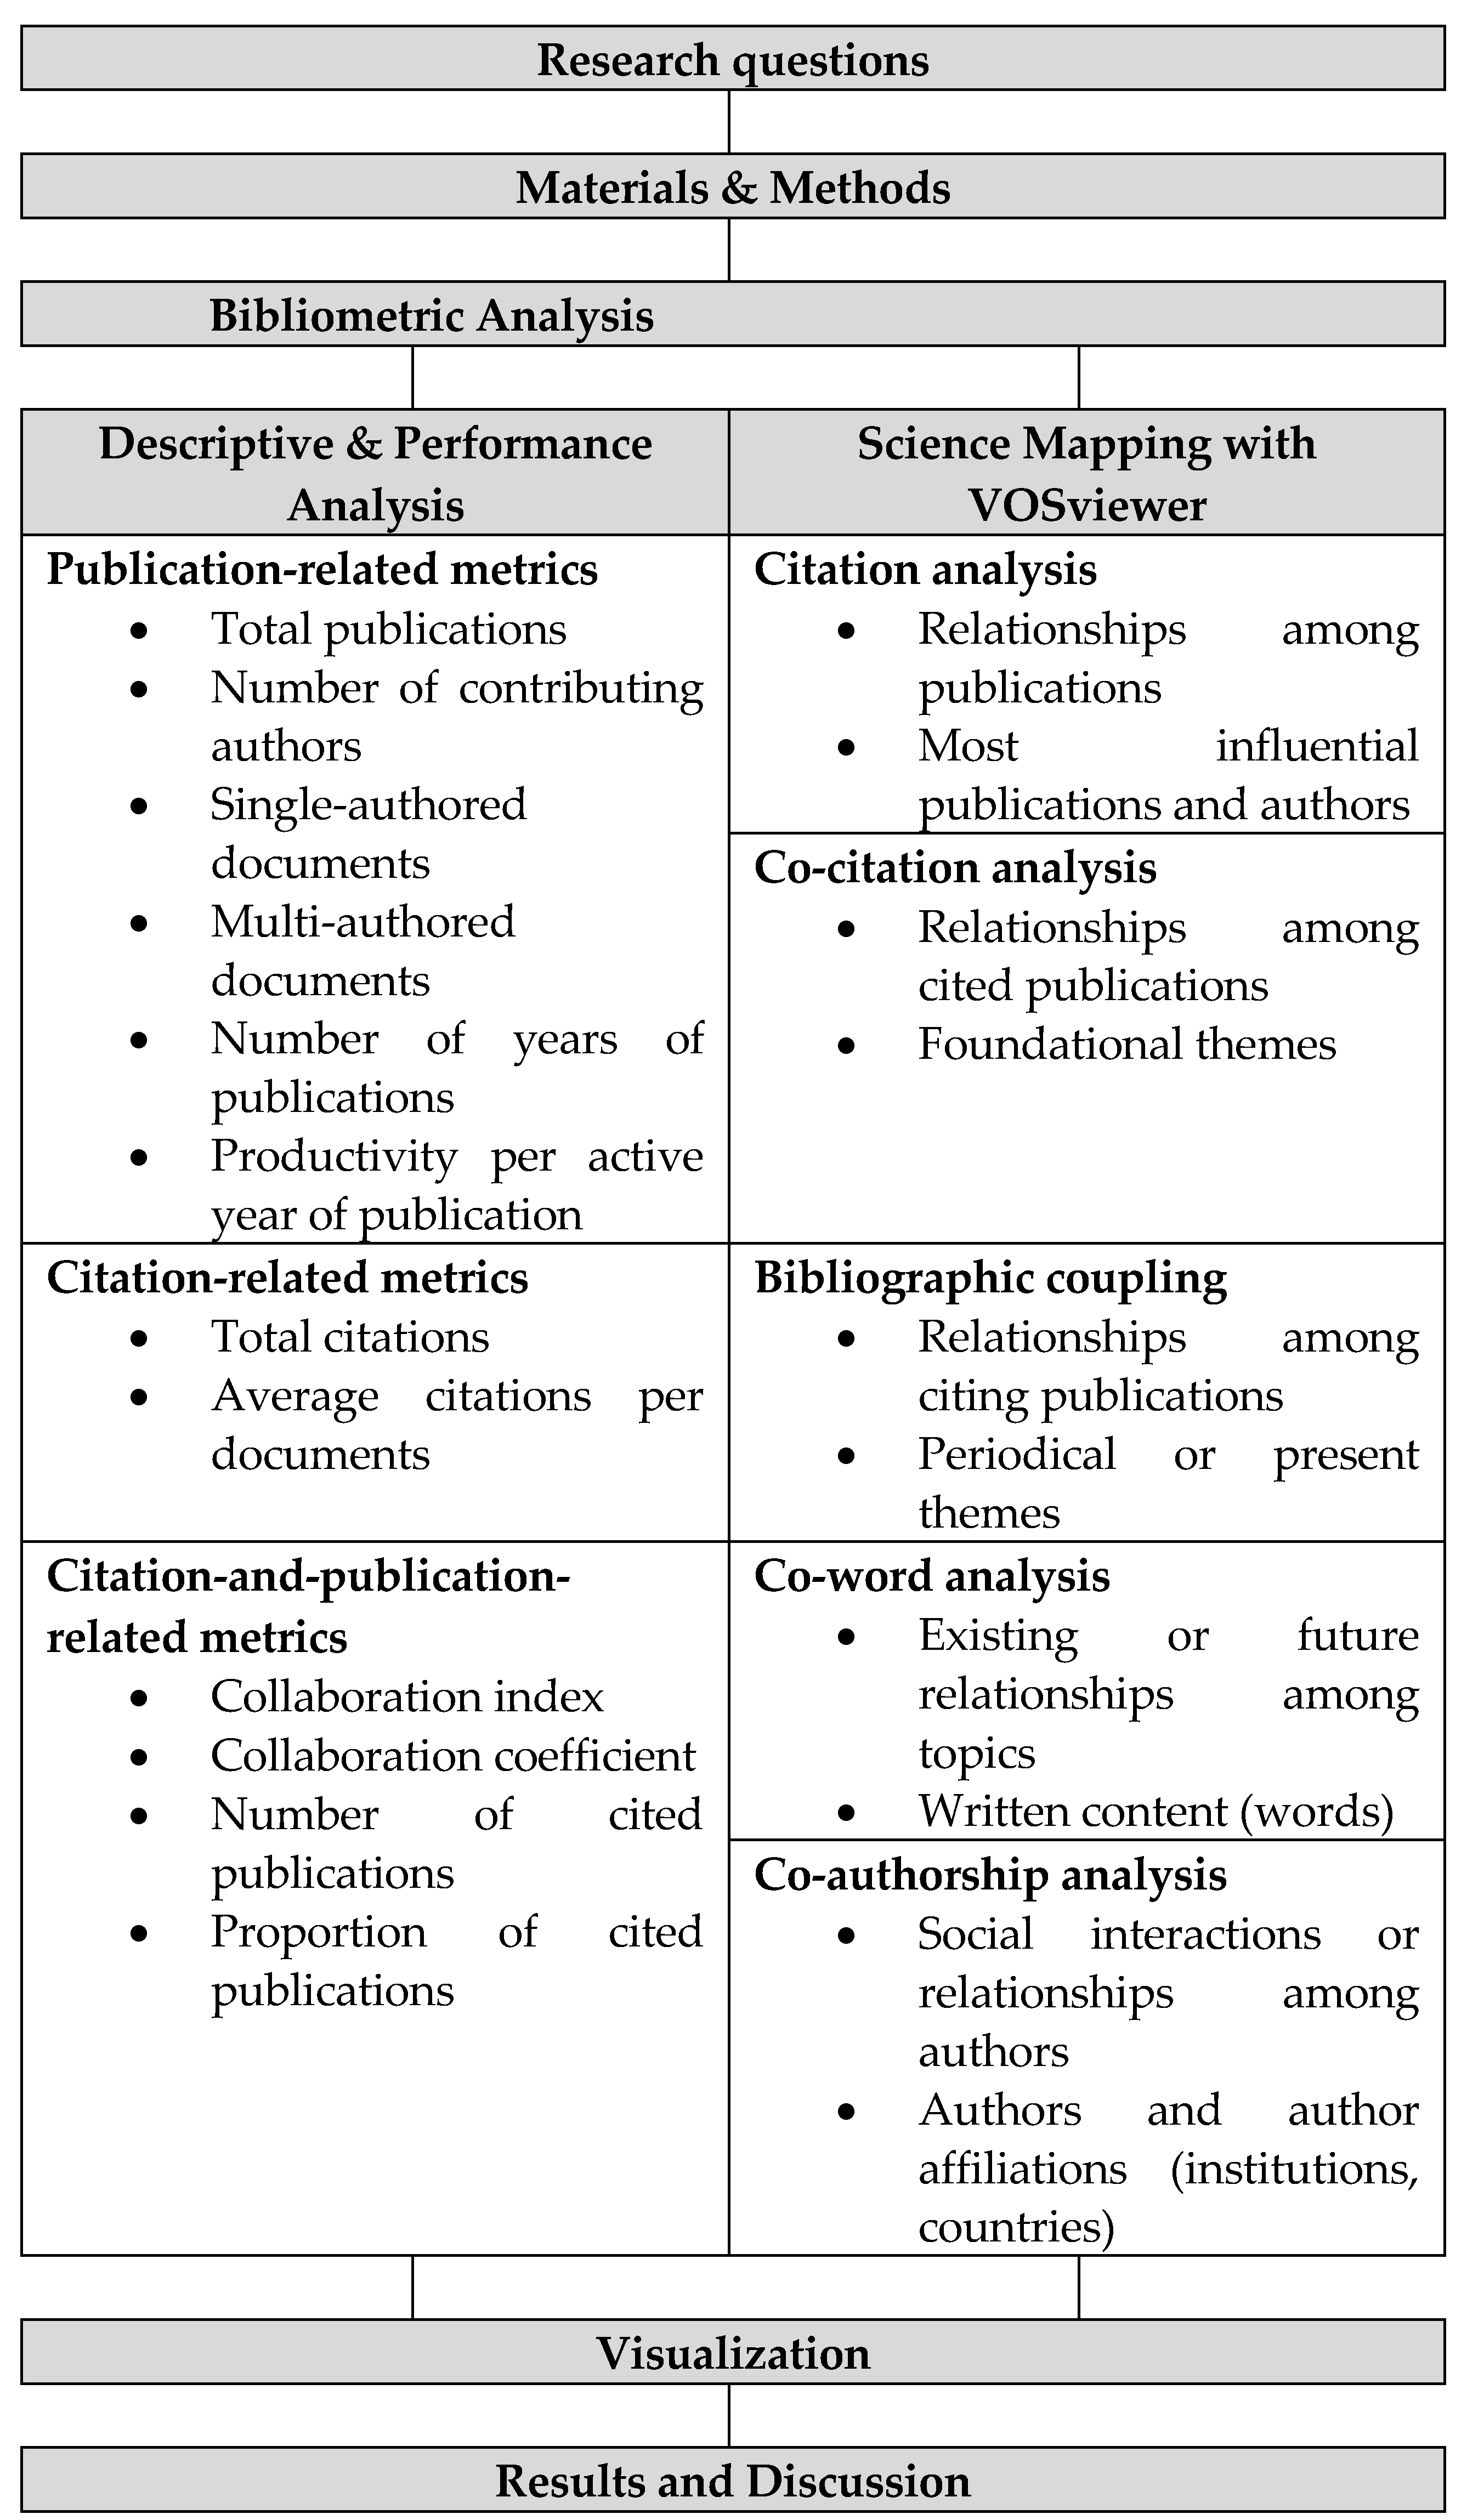
Achieving the research goal is related to the successive completion of several stages in which a specific methodology and technical set of tools are applied (
Figure 1).
The research design, to a large extent, is constructed in compliance with the set goals and objectives. A key stage in the research process is the definition of research questions, which shall facilitate the identification and analysis of the existing literature, the research on the interrelations among various topics, concepts, and authors, to outline the achievements, gaps, and future guidelines for scientific research in the field of integrating digital technologies in CSR activities.
To achieve the goal of the article, we have set the following research questions (objectives):
RQ1: What are the most influential publications, authors, and institutions that deal with the research on digital technologies in CSR activities?
RQ2: How has the literature in the field of integrating digital technologies in CSR developed historically and how has it spread geographically?
RQ3: What is the scope of research and what are the key trends for future scientific research in the field of integrating digital technologies in CSR activities?
We defend the thesis that CSR activities are thoroughly theoretical and scientifically grounded and have the capacity to grow and successfully implement digital technologies – a practice which, without doubt, contributes to their accelerated development and implementation, with a horizon towards corporate social responsibility.
2. Materials and Methods
The research materials have been generated by Scopus – the largest abstract and citation database, which as of this moment contains: over 87 million documents back to the year 1788, over 1.8 billion cited references back to the year 1970, over 17 million author profiles and over 7,000 publishers, including those in the field of social sciences. Despite the comprehensive coverage with open-access content, Scopus provides a wide range of metrics and tools to evaluate research impact and collaborate author profiles and create collaboration networks. At this stage of the scientific research, we have determined a series of key words and terms and a search field in the database, a selection of additional search criteria; we have also generated a sample containing data about the research. The protocol that we have applied is Preferred Reporting Items for Systematic Reviews and Meta-Analyses (PRISMA) (Page et al. 2021).
The applied research methods –Systematic Literature Review (SLR) and Bibliometric Analysis have been selected in compliance with the set goal. They are used to generate quantitative data regarding publications, sources, authors, organizations, countries, key words, topics, and trends. (Monteiro et al. 2021; Van Eck and Waltman 2010; Warren, Sauser, and Nowicki 2019; Yu et al. 2020). This methodology is considered appropriate for collecting complex academic data and proof for the state and trends of integrating digital technologies in corporate social responsibility activities in enterprises.
We, as authors, have selected some of the specialized literature and performed a Systematic Literature Review (SLR) because the process of its performance is “structured, reproducible, transparent, and iterative in nature” (Abdullah and Naved Khan 2021), and provides an objective basis for eliminating irrelevant research. We have performed a review of the abstracts and full texts of the materials – object of this scientific research. There are notions that traditional literature reviews suffer from the subjectivity of the authors (Tranfield, Denyer, and Smart 2003), which is an additional reason SLR should be used. As a result, the performed categorization and summary of information with a clearly defined goal, research questions, search methods, inclusion and exclusion criteria in the search allow giving the scientific articles a high grade.
The collected data about the published scientific research and citations is put under a Bibliometric Analysis to determine its impact. The aim of the bibliometric analysis is to “summarize large quantities of bibliometric data to present the state of the intellectual structure and emerging trends of a research topic or field” (Donthu et al. 2021). The objects of analysis can be scientific publications (articles, papers, books, etc.), sources (scientific journals, conference proceedings, etc.), characteristic of the researched area key words and terms, authors, institutions (universities, departments, scientific and research groups and teams, business organizations, NGOs, etc.), countries and regions, etc.
The bibliometric analysis is performed in two directions: Descriptive and Performance Analysis, through which we can study the contribution of the analyzed objects to the given scientific area, and Science mapping, which studies the relationships among them.
Science mapping is a set of methods and techniques through which we can develop science maps to reveal the structural and dynamic aspects of scientific knowledge (Börner, Chen, and Boyack 2005; Cobo et al. 2011; Morris and Van Der Veer Martens 2009; Noyons, Moed, and Luwel 1999; Petrovich 2021). They aim at showing how areas, disciplines, journals, scholars, publications, and key words are related among each other.
Bibliographic databases, incl. Scopus, are the main sources of data for science mapping. These enormous multidisciplinary databases collect metadata of academic publications (authors, title, abstract, keywords, affiliation of the authors, publication year, country, etc.) along with their citations.
The creation of science maps is based on networks via procedures called “network extraction”. Networks are structures compiled by nodes and links, which are generated by a set of bibliographic records. The same set of bibliographic records can generate various networks depending on the type of nodes and links on which we focus. The nodes are the units of analysis of the end map, whereas the links are the types of the shown link. The networks can capture the scientific structure at various levels and from different points of view (Petrovich 2021).
The main techniques of scientific mapping, the goals, the relationships (links) and the units of analysis (nodes), as well as the necessary metadata are shown in
Table 1.
The tool that we have selected for visualizing science maps in this research is VOSviewer (version 1.6.19). The mapping profiles comply to the above research questions, to the theoretical models (cf
Table 1) and the software capacity.
3. Results
3.1. Data Collection
Defining key words, terms, and field of search in the database. Defining key words and terms for search in the Scopus database is the result of a panel discussion among the research authors and specialists in the field of information technologies and the implementation of CSR in business. Searching and extracting during the data collection phase involves the use of different search techniques such as Booleans, use of quotation mark and parenthesis and truncations. The selected key words run in two directions: regarding the applicable digital technologies (“digit*” OR “digital technolog*”), and, regarding the field of CSR (“CSR” OR “corporate social responsib*”). Appropriate Boolean operators OR and AND have been used. The query in the database by these key words was conducted on 9 June 2023 in a specific field (Article title, Abstract, Keyword) and the generated result was 899 documents.
Selection of additional search criteria. The selected PRISMA protocol requires defining additional search criteria which limit the sample. Those criteria are selected by the authors who have used the search filters suggested in the Scopus database. The selected criteria options limit the sample in the following:
Open Access – All open access;
Year – we have selected a period of published articles between 2014 and 2023;
Subject area – we have selected the areas Business, Management and Accounting, Social Sciences; Environmental Science; Computer Science; Economics, Econometrics and Finance;
Document Type – we are only interested in articles/Article;
Publication Stage – only completed articles with option Final are selected;
Source Type – we have selected articles published in journals Journal; and
Language – the research encompasses articles in English only with option English.
The remaining filters Author name, Source title, Keyword, Affiliation, Funding Sponsor and Country/territory have not been used.
The query in the database after applying those additional criteria ranks the data and forms a sample of 129 documents.
Cleaning the data. A very important part of the process of data processing is its cleaning. It is related to eliminating some of the records. The PRISMA protocol requires that the research materials (in this case 129 scientific publications) be checked for duplicates to eliminate them. The check has shown that there are no duplicates. Another reason for cleaning the data is the review and assessment of the articles to determine their relevance and eligibility. The titles and abstracts of the selected documents in the sample have been reviewed by the authors. After an in-depth discussion, all articles in the sample have been accepted as relevant to the scientific research.
Data storage. The extracted data has been exported to a .csv file and stored for the purposes of their analysis. In addition, we have stored the full text copies of the articles in the sample. The query has been stored in the Scopus database.
3.2. Performing Descriptive and Performance Analysis
The materials, which are the object of this research, are a collection of 129 scientific articles written by a total of 443 authors. 14 out of 129 articles were written by one author. Among those 14 articles, however, two were written by the same author – M. A. Camilleri (in 2018 and in 2019). Another characteristic is that B. Lopez has two articles – one as the only author from 2022 and one as a co-author from 2023. We believe that these circumstances are insignificant regarding the results and are not taken into consideration further in the analysis. The time frame of the research is 10 consecutive years between 2014 and 2023. The average number of published articles per year is almost 13 (more precisely – 12.9 articles).
As regards citations, we have used ready information which has been generated as a result of the query in Scopus. Not all 129 in the sample are cited in other scientific publications. The number of the cited articles is 98, which is 75.97 % of the sample volume. The total number of citations of these 98 articles in other scientific publications is 1,995. The average number of citing these articles is 20.36 times.
The focus of this analysis also comprises Citation-and-publication-related metrics: collaboration index, collaboration coefficient, number of cited publications and proportion of cited publications.
The Collaboration Index (CI) of authors shows the average number of authors per one article. CI distinguishes the levels of authorship and is easy to calculate, but there are no boundaries (for instance between 0 and 1), which makes it difficult to interpret.
The data shows that CI is 3.73, or that the research teams have comprised 3 or 4 researchers on average. The collaboration index is calculated as the ratio of Total Authors of Multi-Authored Articles (TAMAA) and Total Multi-Authored Articles (TMAA) (1) (2) (Elango and Rajendran 2012):
Another thing to take into consideration is
the Collaborative Coefficient (CC), which is used to measure the degree of collaboration among the authors who have contributed to the literature regarding the integration of digital technologies in CSR activities. This index may vary in the interval between 0 and 1. The higher than 0.5 it is, the better the collaboration ratio among authors. When it is close to 0, this means that there is poor collaboration among authors. In this particular case, the СС has a value of 0.62. To calculate it, we have used the following formula (3) (4) (Ajiferuke, Burell, and Tague 1988):
In this formula,
j is the number of authors of one article,
Fj is the number of articles with j authors,
N is the total number of published scientific articles and
k is the largest number of authors of one article in the sample as shown in
Table 2. It should be noted that the collaboration coefficient can be calculated for a specific author, in which case the scientific publications to which he/she has contributed will be the volume of the researched sample of documents.
The results of the Descriptive and Performance Analysis of the data have been summarized in
Table 3.
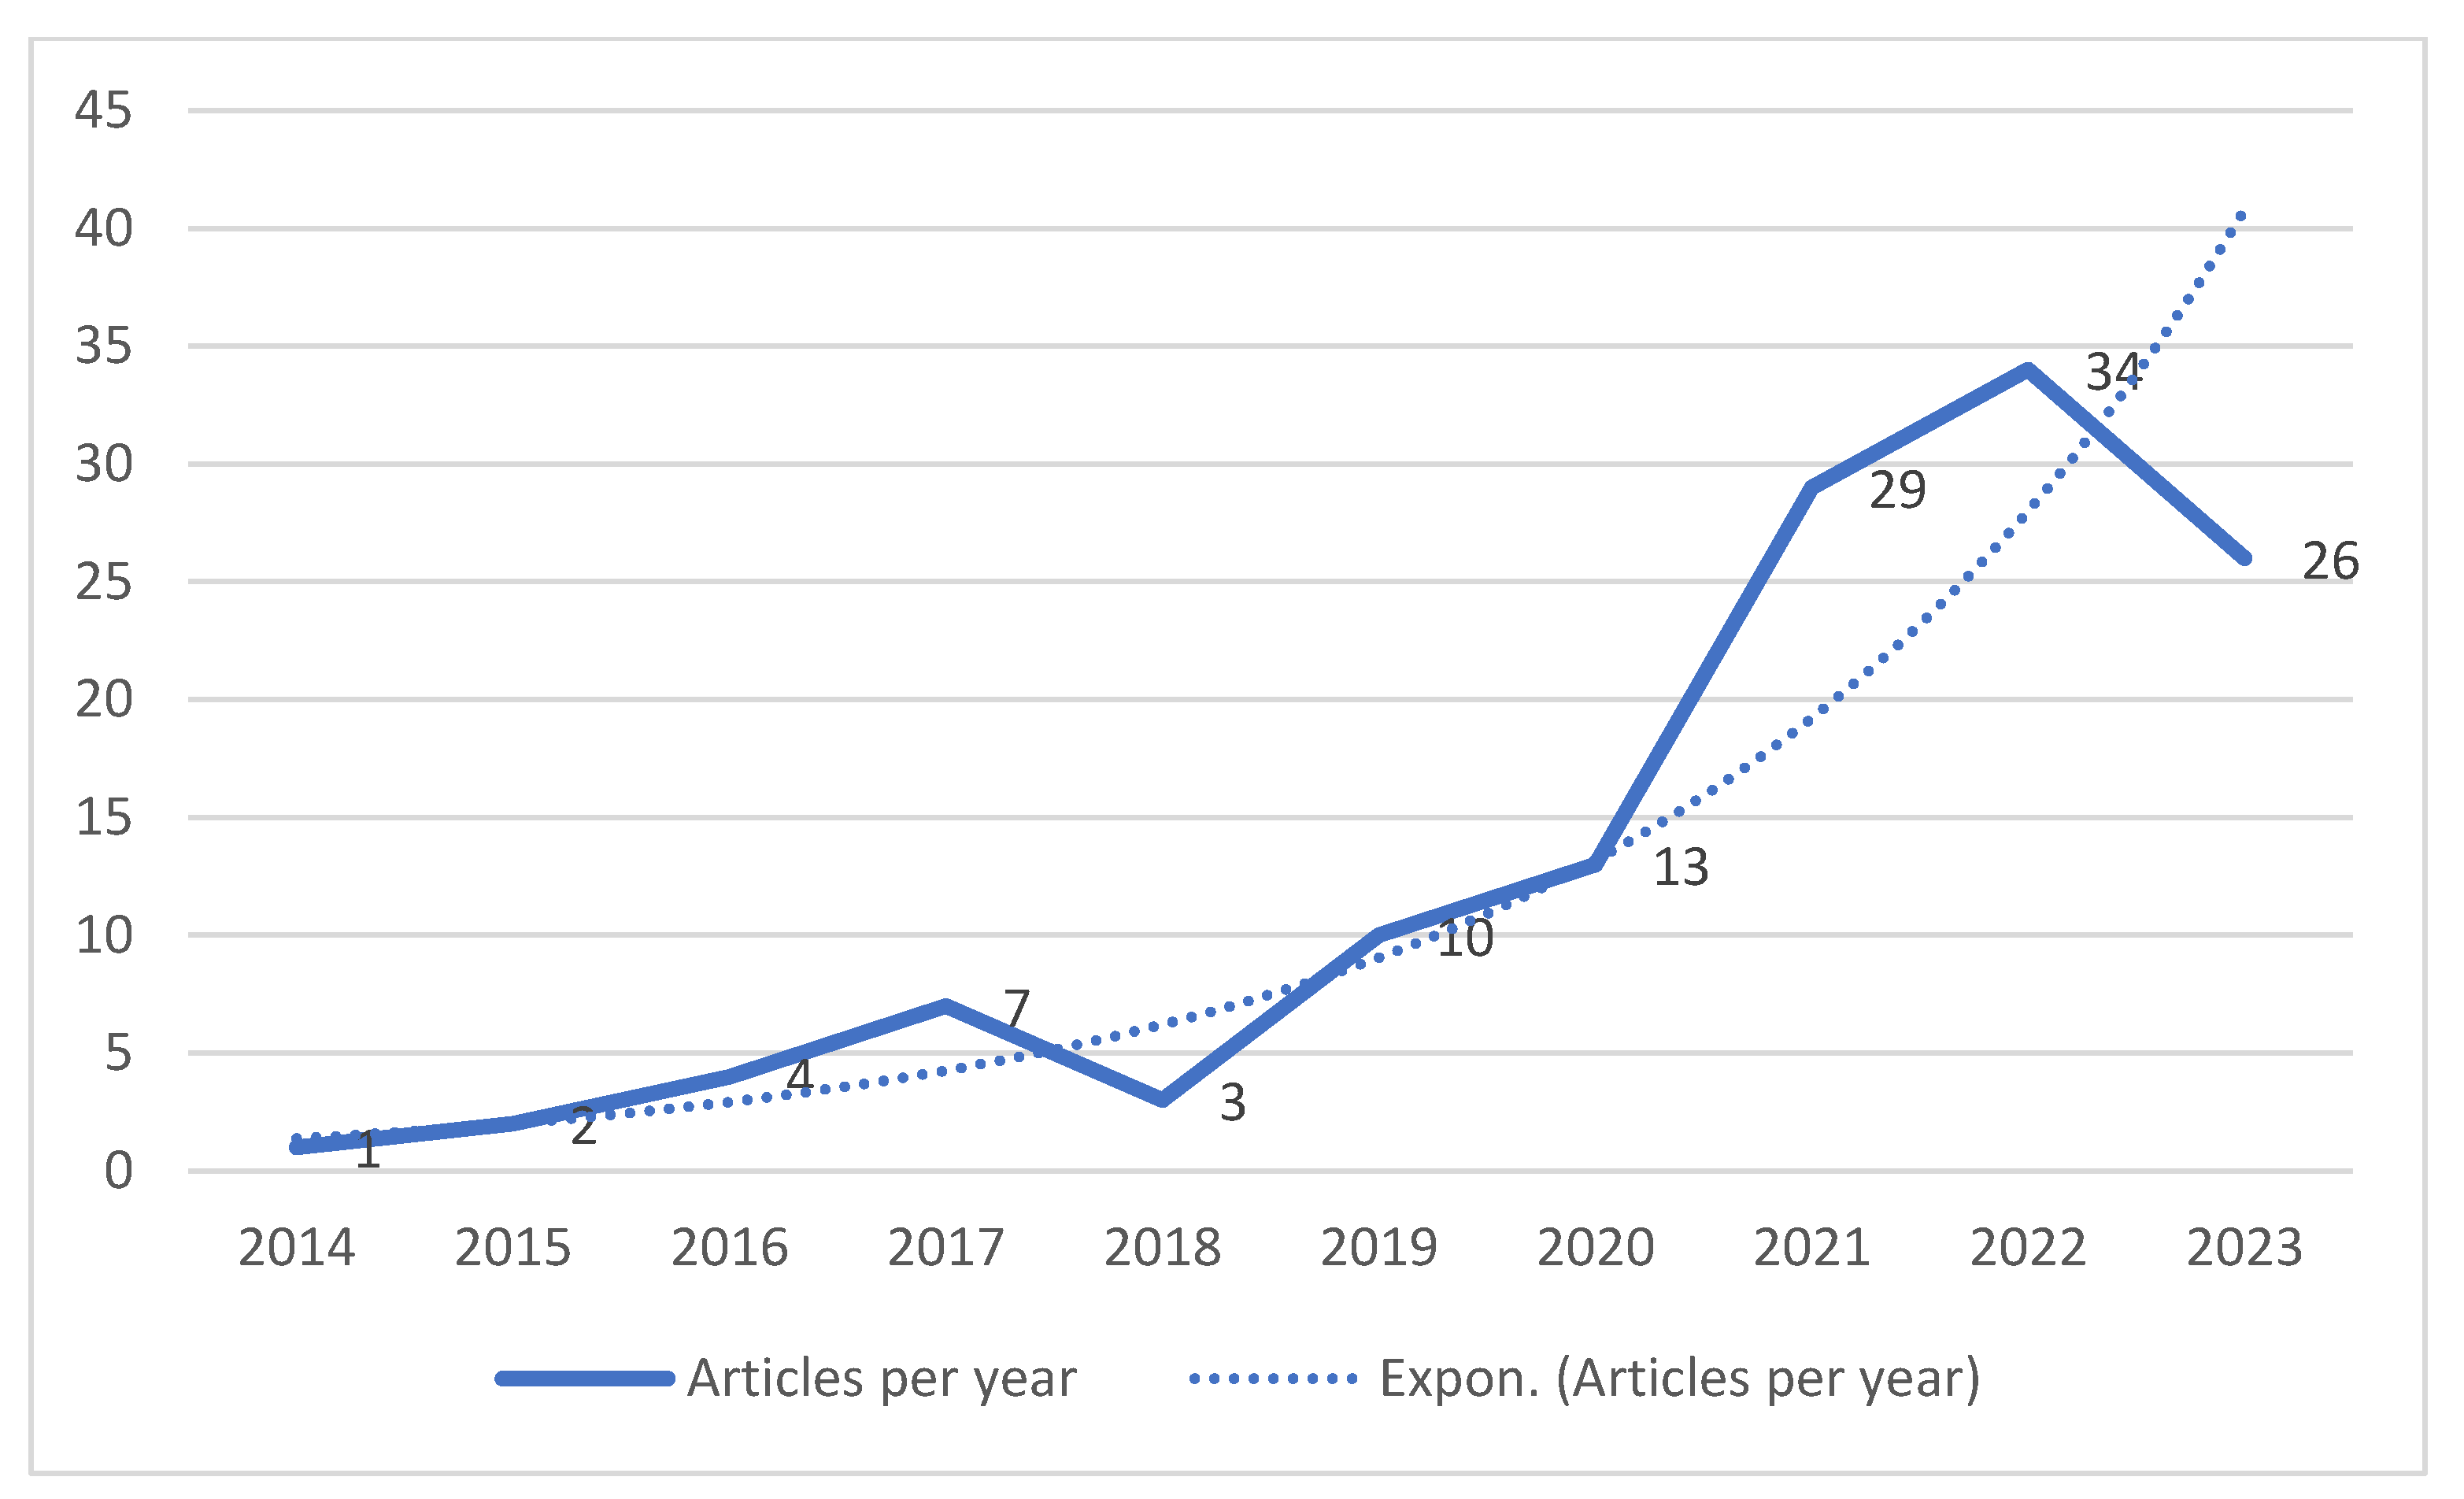
The data can also show the dynamics of publications in the researched area (
Figure 2). The visualization allows finding a clearly outlined exponential development of the researched period, which shows an increased interest in studying the problems in the field of implementing digital technologies in CSR activities by enterprises.
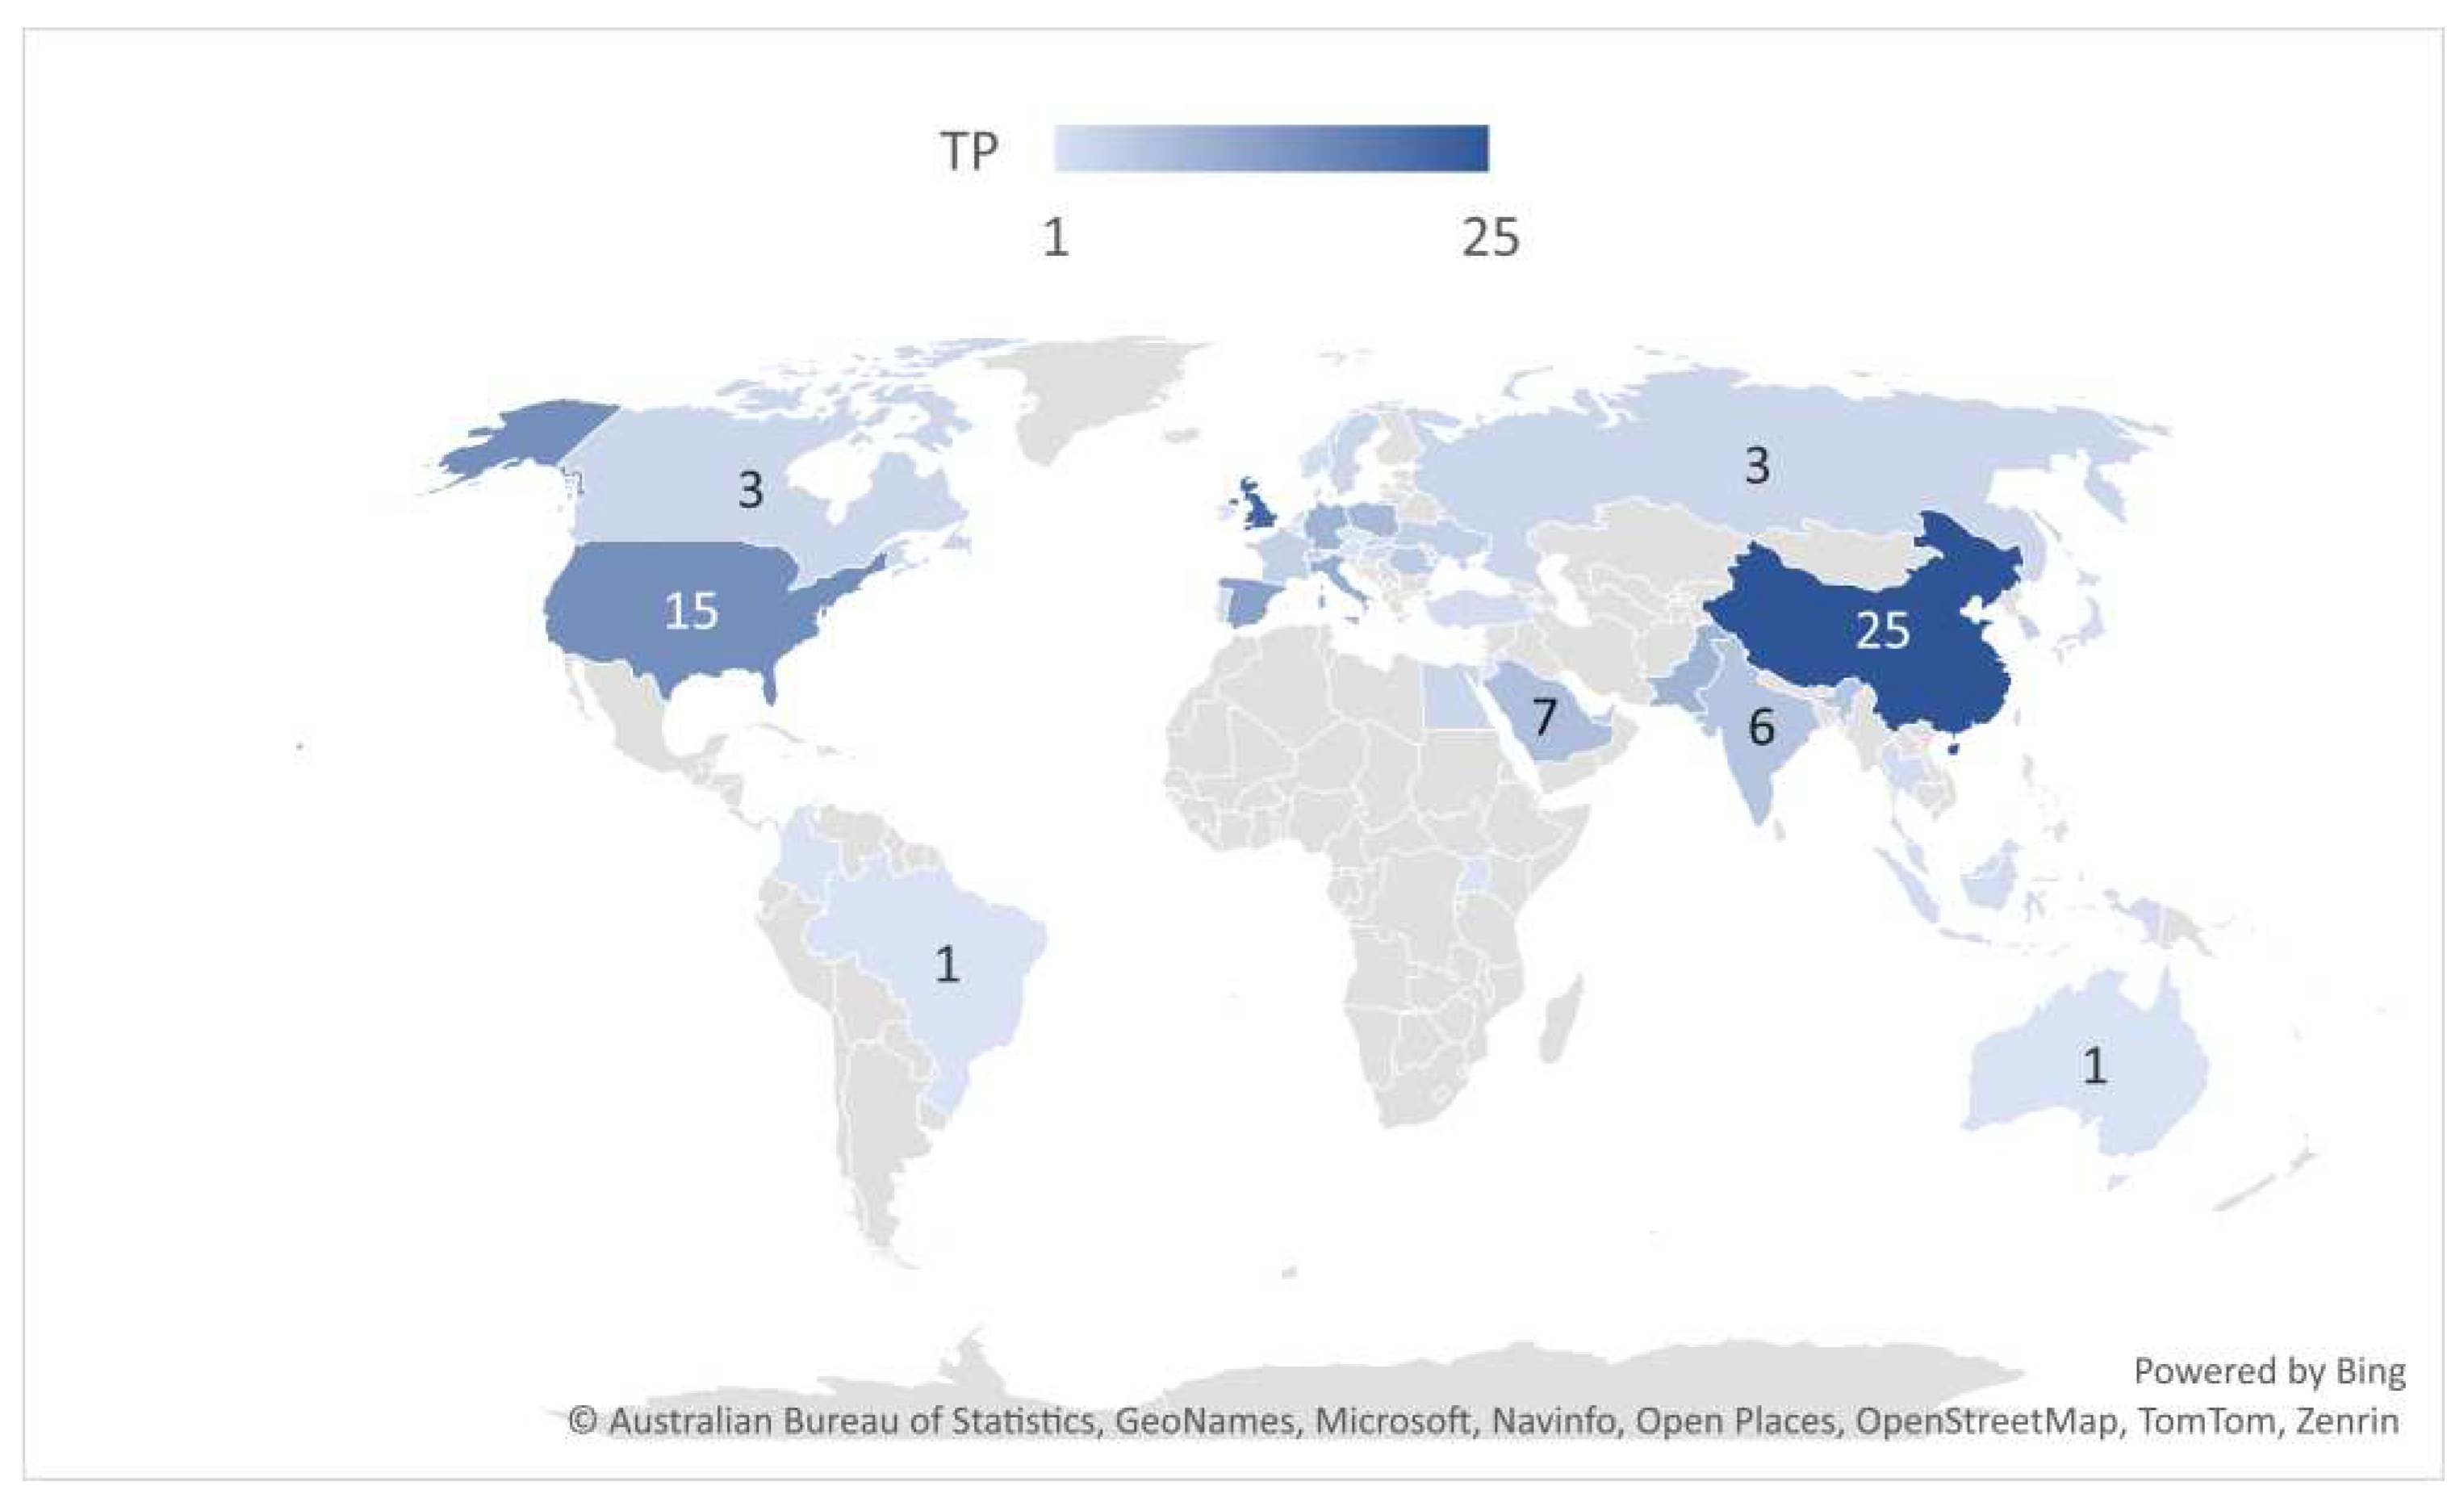
The sample comprises publications whose authors are affiliated to 160 scientific institutions and organizations, published by 51 countries in 87 respected peer-reviewed journals in the fields of business, management, economics, environment, computer sciences, etc. There is no information of origin about three of the researched articles; therefore, the analysis related to the geographic spread of the researched topic encompasses the remaining 126 articles.
The distribution of the number of published articles (Total Publications, TP) by countries/regions is illustrated in
Figure 3.
The quantitative information which also refers to the number of citations of documents in the sample in the countries/regions where they are published, provides an opportunity to rank them. The first 10 records by this criterion are shown in
Table 4.
3.3. Performing Science Mapping with VOSviewer
3.3.1. Citation Analysis
Citation analysis is a means of measuring the impact of a publication compared to the total number of its being cited in other scientific publications.
VOSviewer allows profiling Citation analysis in the following directions: Documents, Sources, Author, Organizations and Countries.
Citation analysis by Documents. The citation analysis when the analysis criterion Documents is selected presents the articles based on their being cited in other documents across the whole Scopus database. At this stage, VOSviewer allows selecting only those articles whose minimum number of citations of a document is selected by the user. The authors have selected 3 as the number of citations. This criterion is met by 72 documents in the sample, which is approximately 56 % of the total number of 129 articles. At the next stage, the software brings forward the list of documents identified with the names of authors and the year of their publishing which contains two types of information: 1) number of citations of those 72 documents in Scopus; and 2) number of mutual citations of those 72 documents in the remaining documents in the sample, which form links among them.
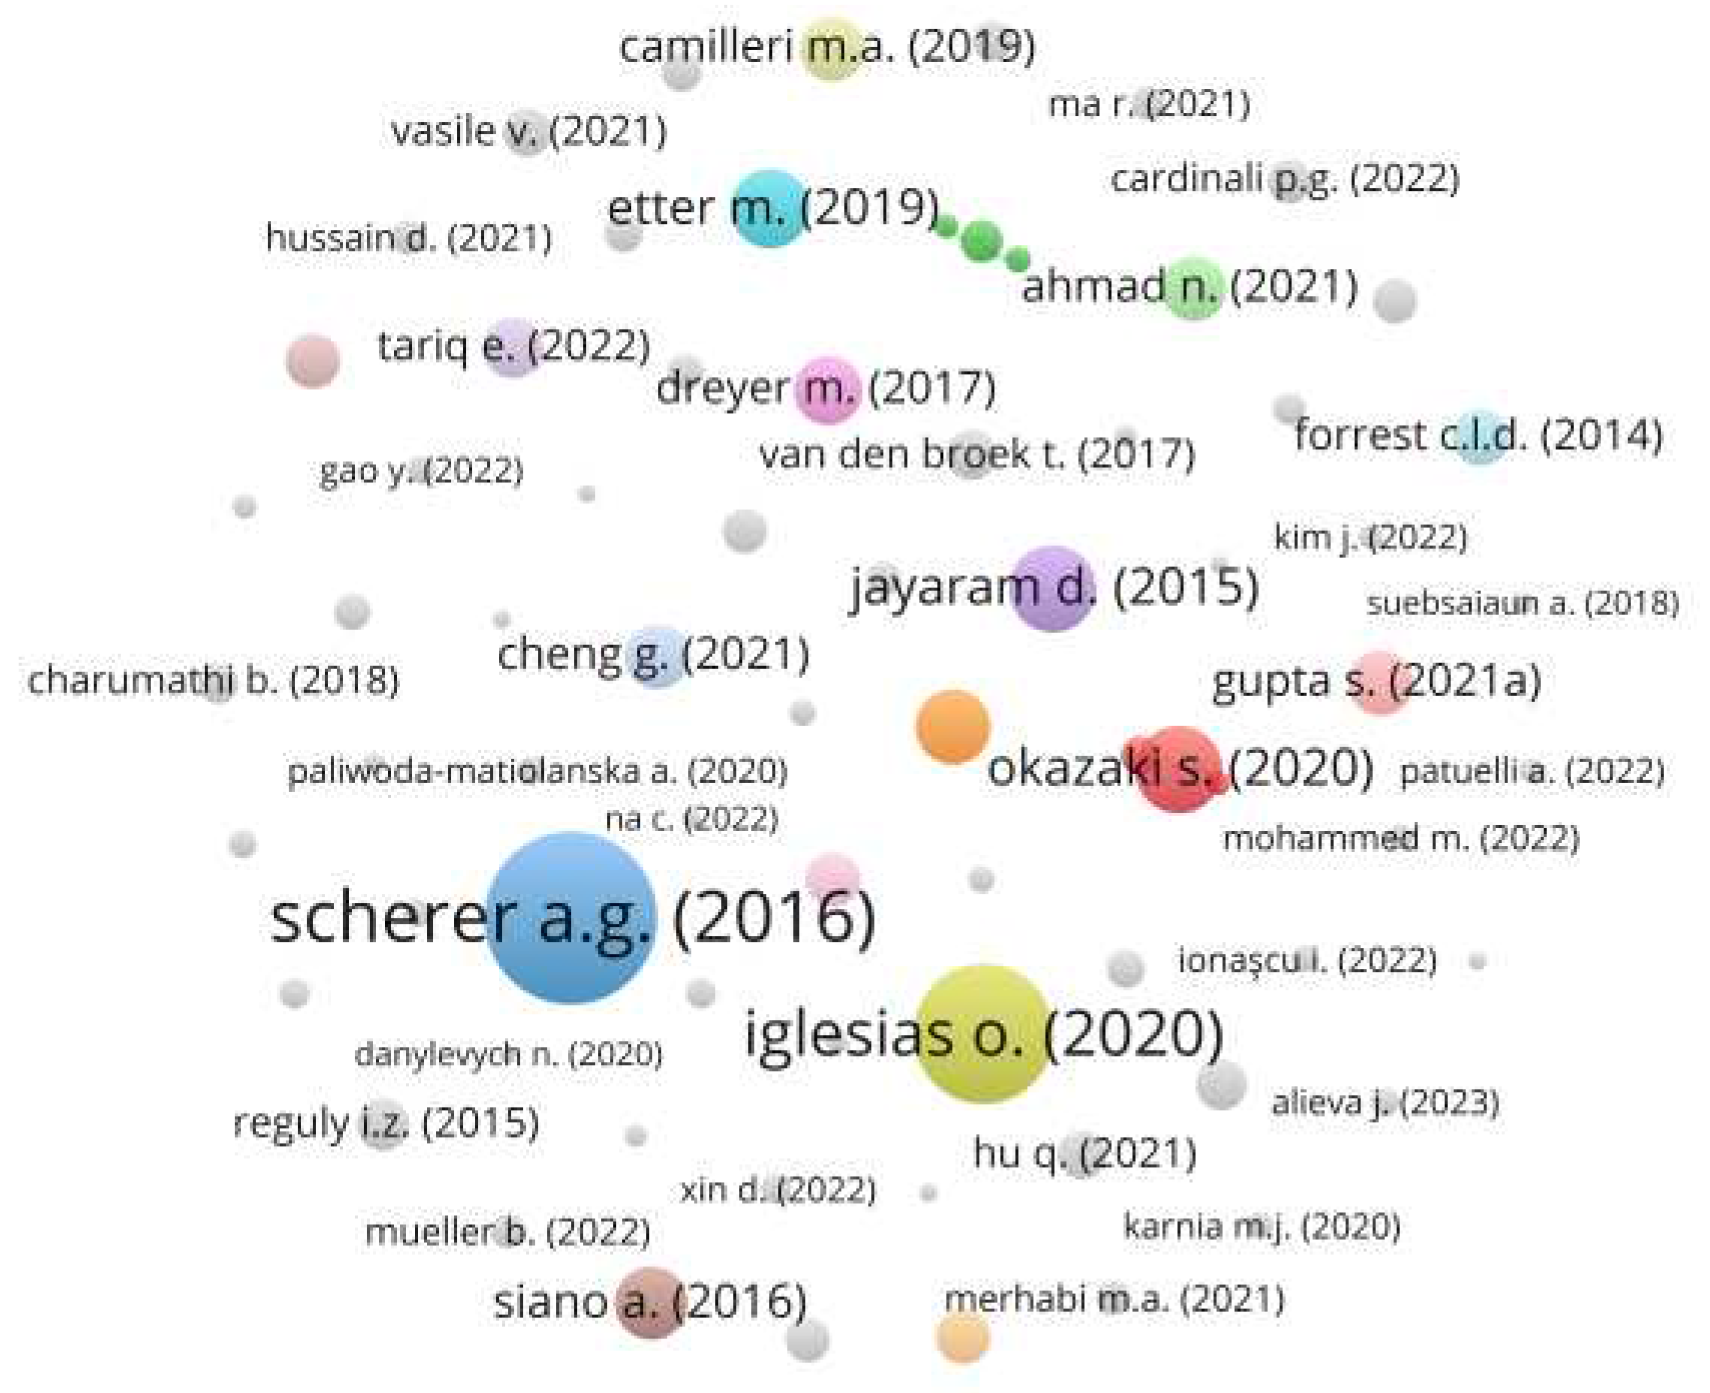
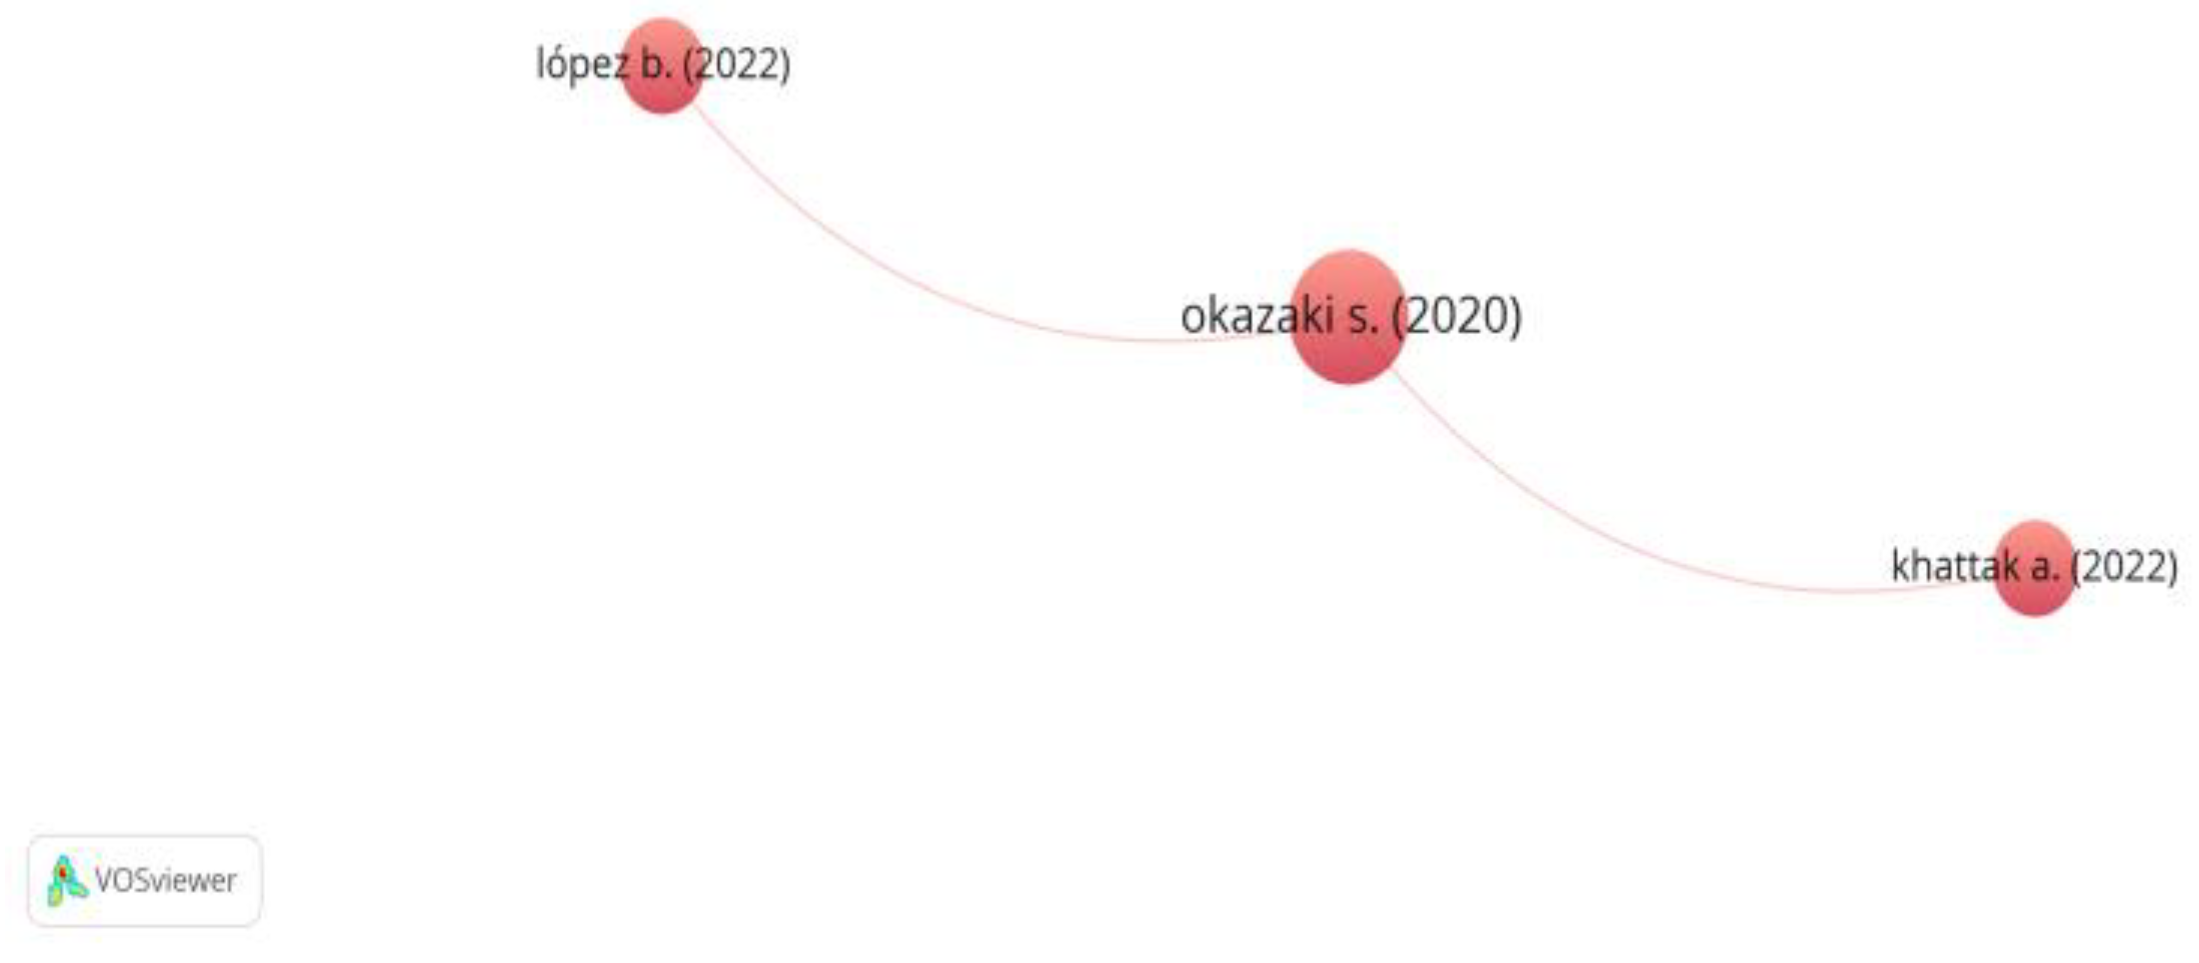
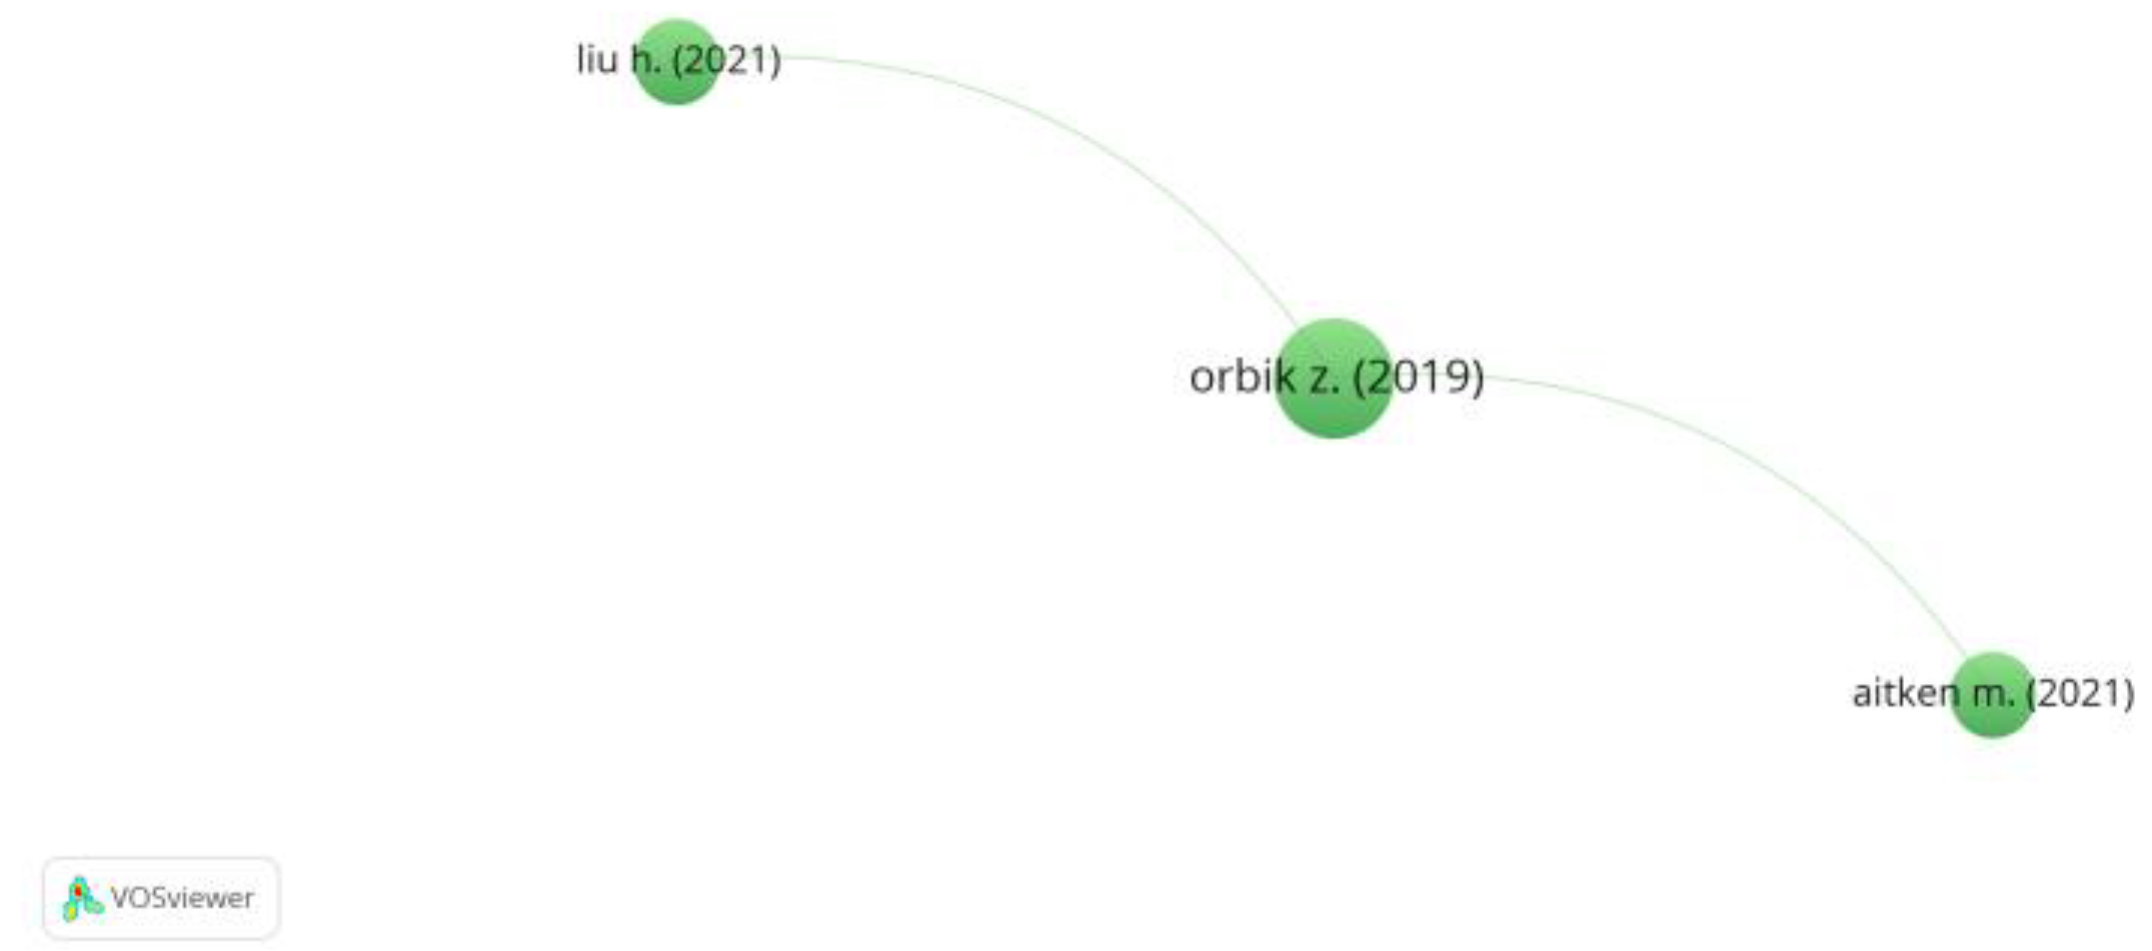
The science map shows the most influential publications and authors (the largest circles), but also that the sample indicates an extremely low level of citation links of the articles. Those that have cited each other are colored because they form clusters. The largest clusters are in red (3 items) and in green (3 items).
In search of the most influential publications and authors, we have performed a ranking of the articles in a sample based on the total number of citations in Scopus and the formed clusters compared to the number of articles in the sample linked by citing. We have performed normalization based on the number of citations, which is an option in VOSviewer. The results of this in-depth analysis are shown in
Table 5, whereas the science map – in
Figure 4. The science map shows that two clusters are positioned in it; this is illustrated in
Figure 5 and
Figure 6.
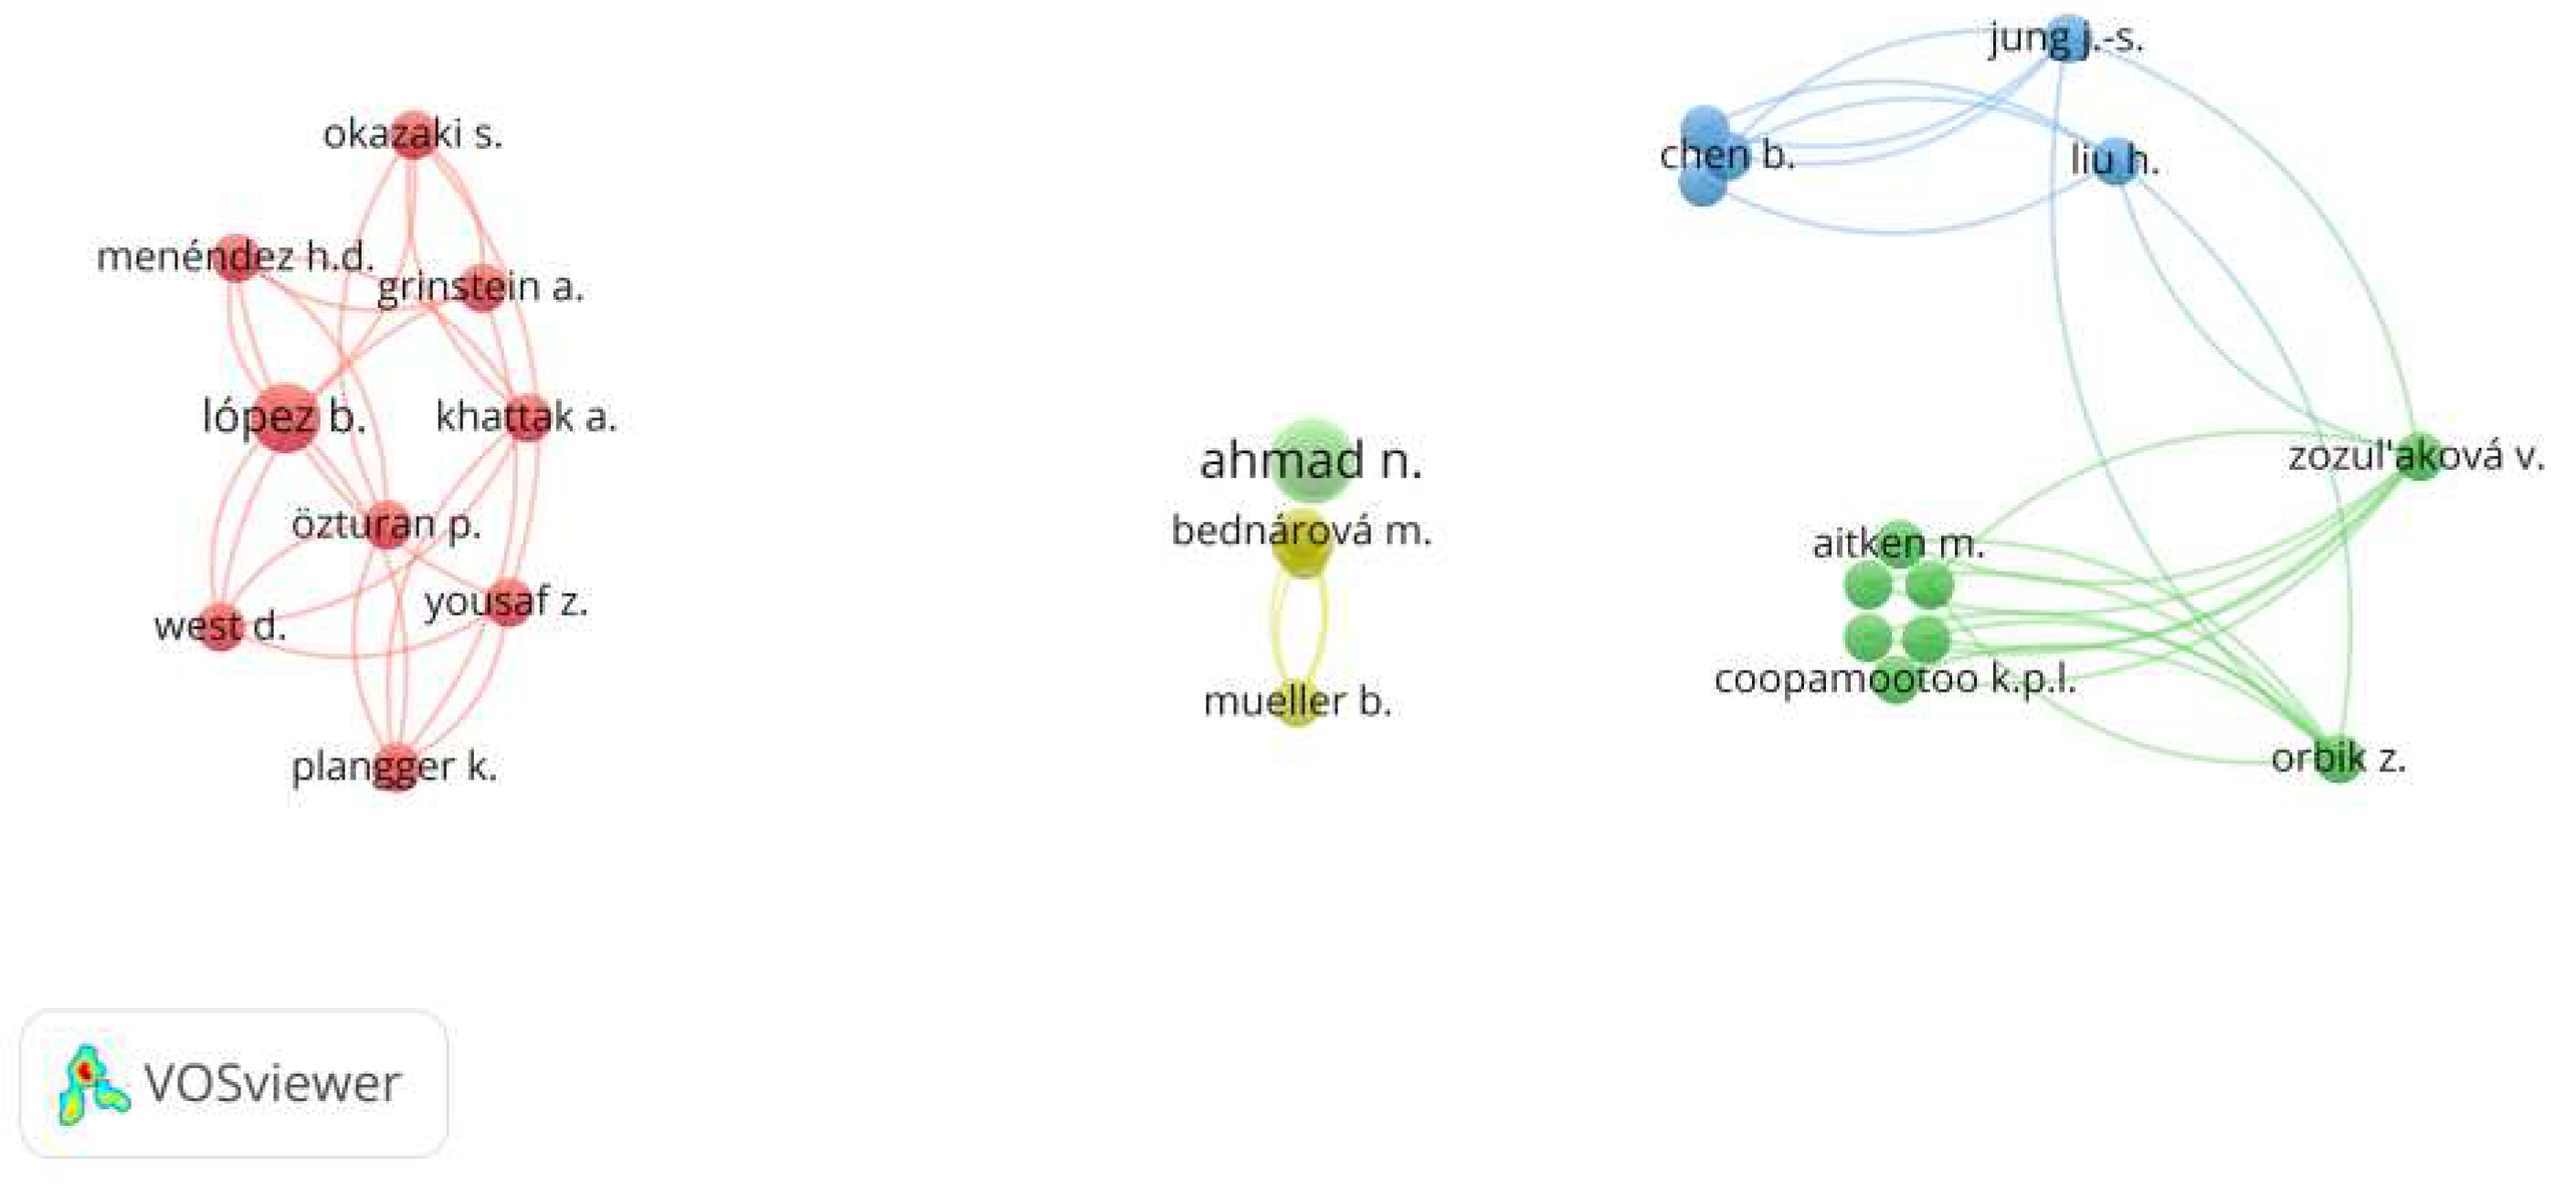
Citation analysis by Authors. The citation analysis by authors reveals information about the author with the most articles and the most citations. The object of analysis are the articles and citations of all 443 authors of the researched 129 articles. The authors have been selected on the basis of a minimum number of articles and minimum number of citations (subjectively chosen for the purposes of this scientific research) (in Scopus). In this particular case, for both criteria we have selected value 1. This restriction returns a list of
289 authors, who, against the total number of 443, are 65.2 %. In the list, the authors are ranked on the basis of the number of authored articles, the total number of citations of those articles in Scopus and the number of citations of one article in one journal in an article in another journal out of the totality of articles by 289 authors. By the last criterion, the values are between 8 and 0, which means that the authors of articles in the sample are cited between 8 and 0 times by other authors in the same sample. Some of the authors have a substantial number of citations in the Scopus database (for instance, Ahmad, N.); however, they have been cited by none of the authors in this sample. The science map shows several clusters, which show in reality several multi-authored publications. The science map is visualized with VOSviewer and is shown in
Figure 7.
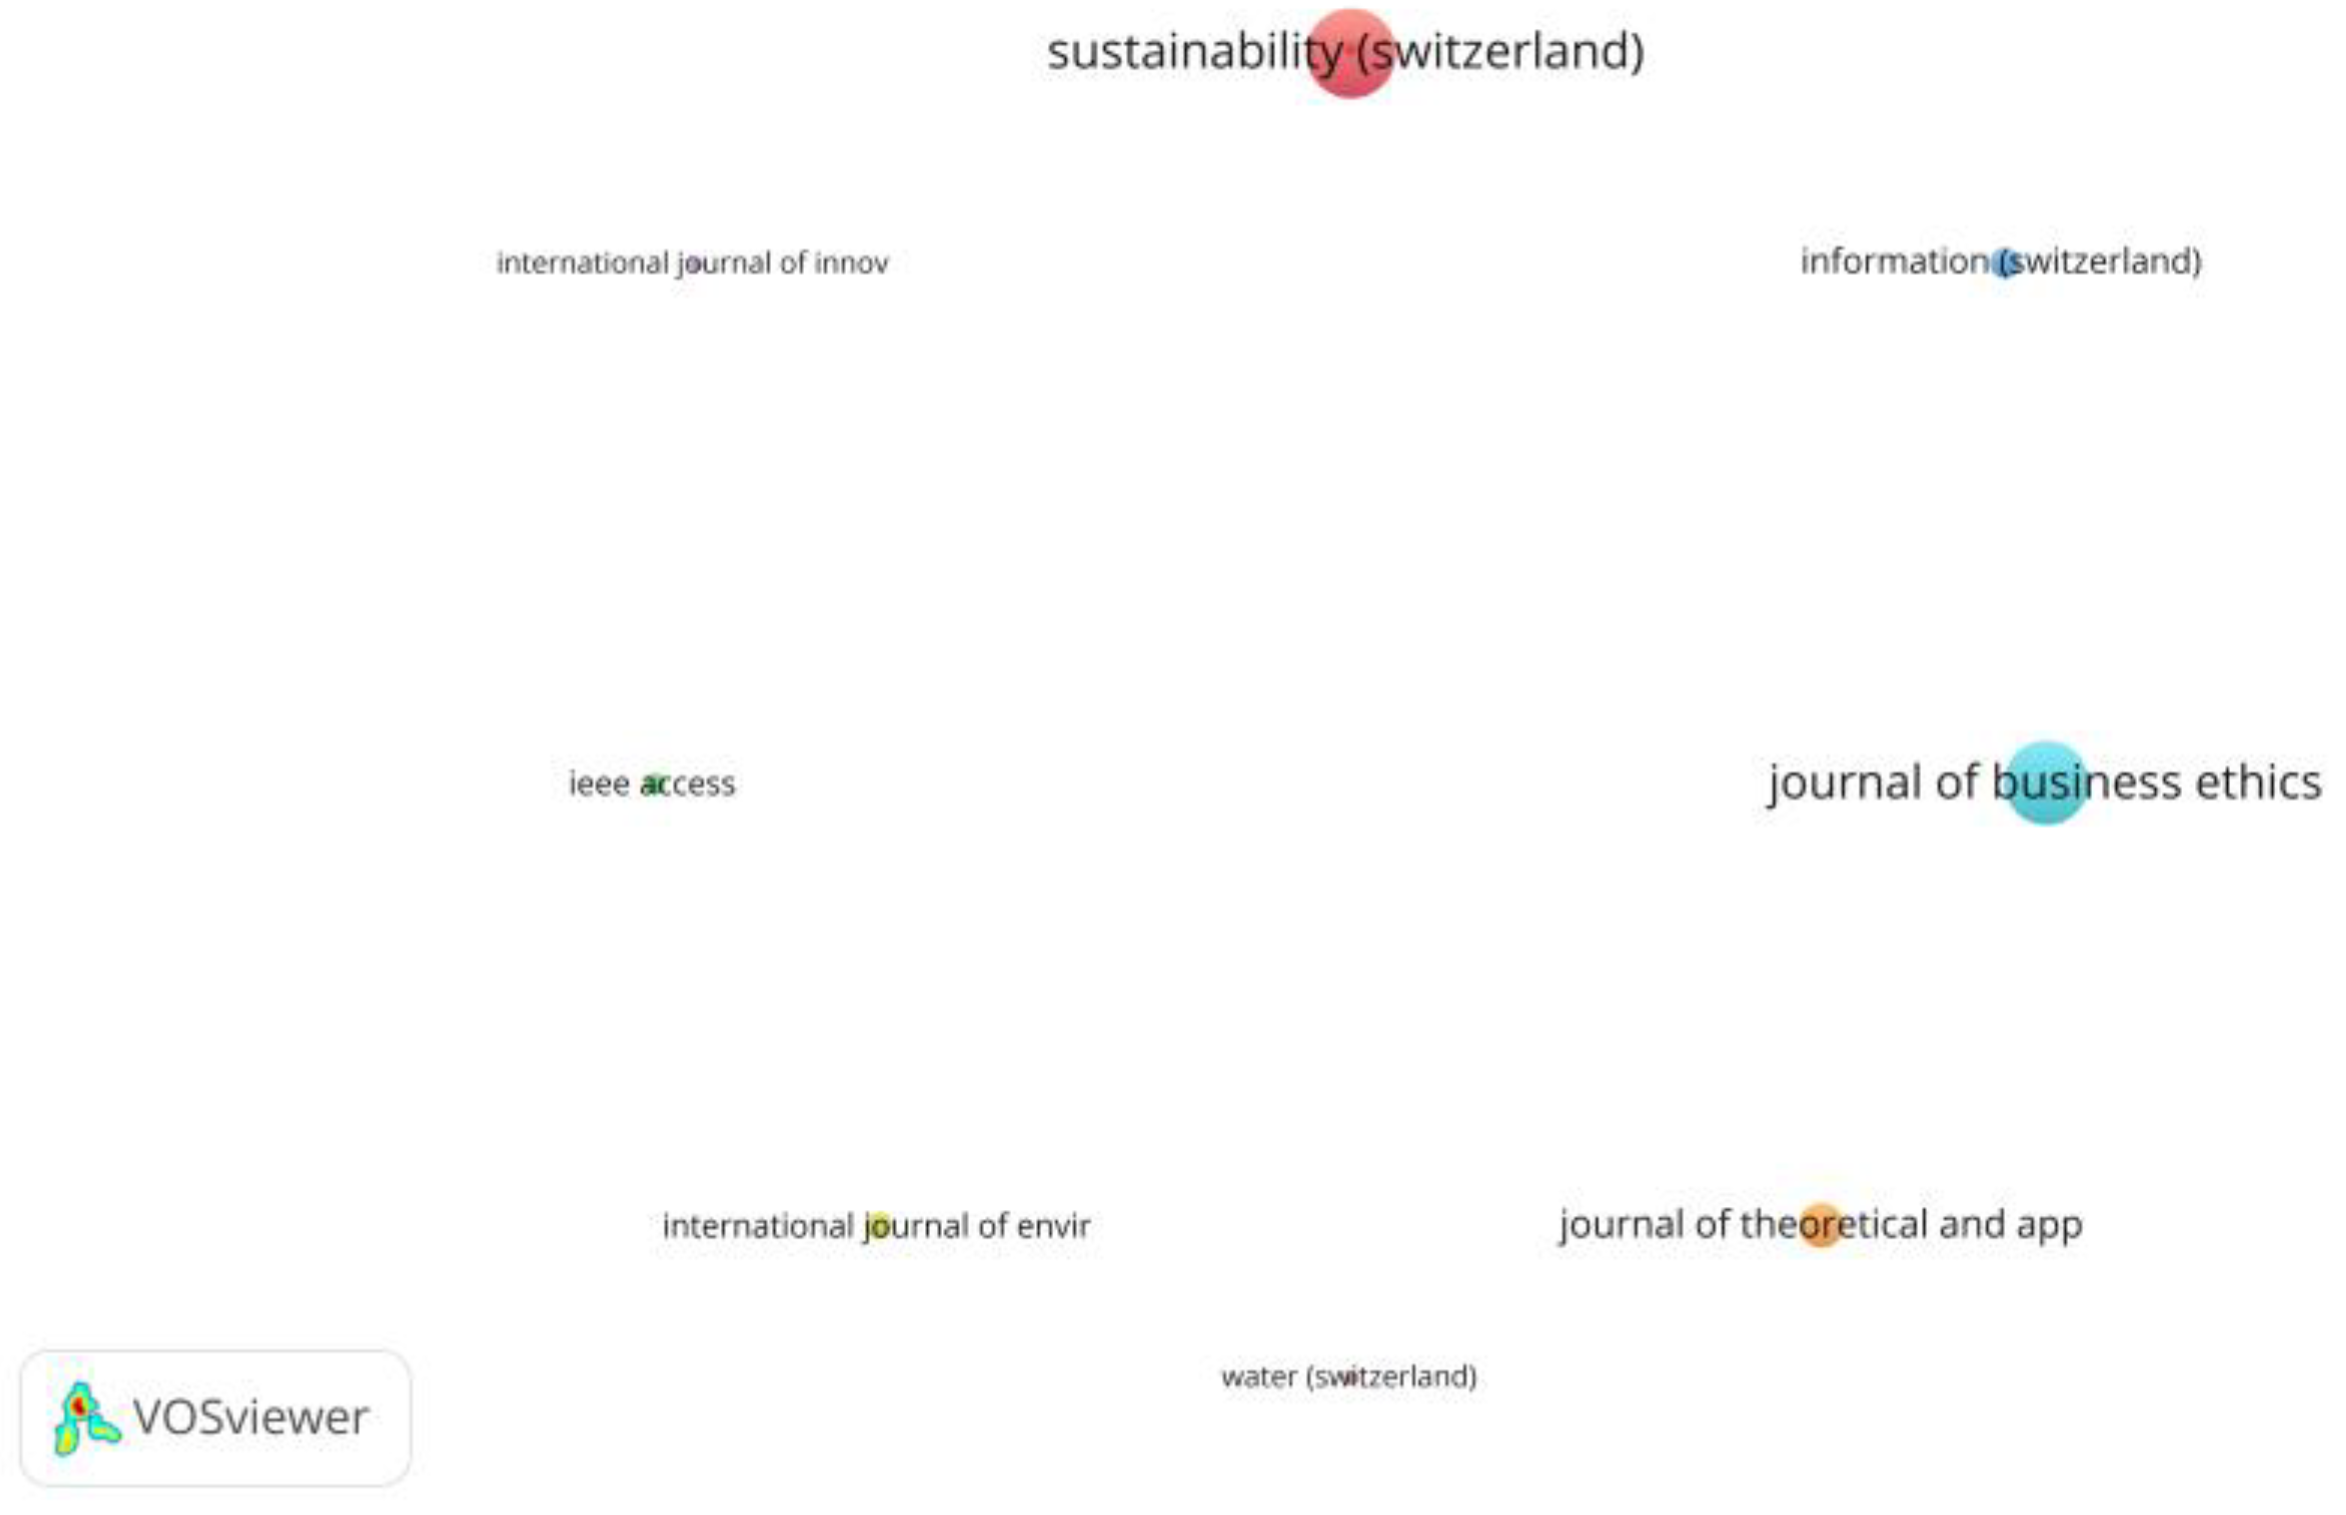
Citation analysis by Sources. The citation analysis can also generate data about the most influential scientific journals in which articles are published. The object of analysis is those 87 sources in which all 129 documents have been published. The ranking of the journals is done simultaneously based on the number of articles in the sample in a specific journal, the total number of citations of those articles in all remaining documents across the whole Scopus database and the number of citations of one article in one journal by another journal out of the totality of 87 items. At this stage, VOSviewer allows selecting only those articles whose minimum number of documents of a source and minimum number of citations of a source are selected by the user. In this research, the authors have selected for both options value 2. The restrictions are met by 9 sources out of 87, i.e., 10.3 % of the total sources. At the next stage, the software brings forward a list of the journals, which contains information in three directions: 1) number of articles in each of the nine journals; 2) number of citations in Scopus of those articles which have been published in the selected journals; and 3) the mutual citations of articles within those 9 journals in the sample which form among each other relationships of specific strength.
The science map shows what the most influential publications are (the largest circles). It is important to note that there are only two journals in the sample which have a relationship between them, but the visualization does not allow revealing this relationship. These are the journals Sustainability (Switzerland) and Frontiers in Environmental Science, which have mutually cited one article per journal. There is no level of connectivity via citing among the remaining journals in the sample.
To reveal the most influential journals in which the articles in the sample are published, we have performed a ranking of the nine journals based on the number of published articles in each of them, the total number of citations of the articles in Scopus and the formed clusters with the number of the linked by citing articles in the sample. The results of this in-depth analysis are shown in
Table 6, whereas the science map – in
Figure 8.
Figure 7.
Scientific map of citation analysis by Authors.
Figure 7.
Scientific map of citation analysis by Authors.
Figure 8.
Scientific map of citation analysis by Sources.
Figure 8.
Scientific map of citation analysis by Sources.
3.3.2. Co-authorship analysis
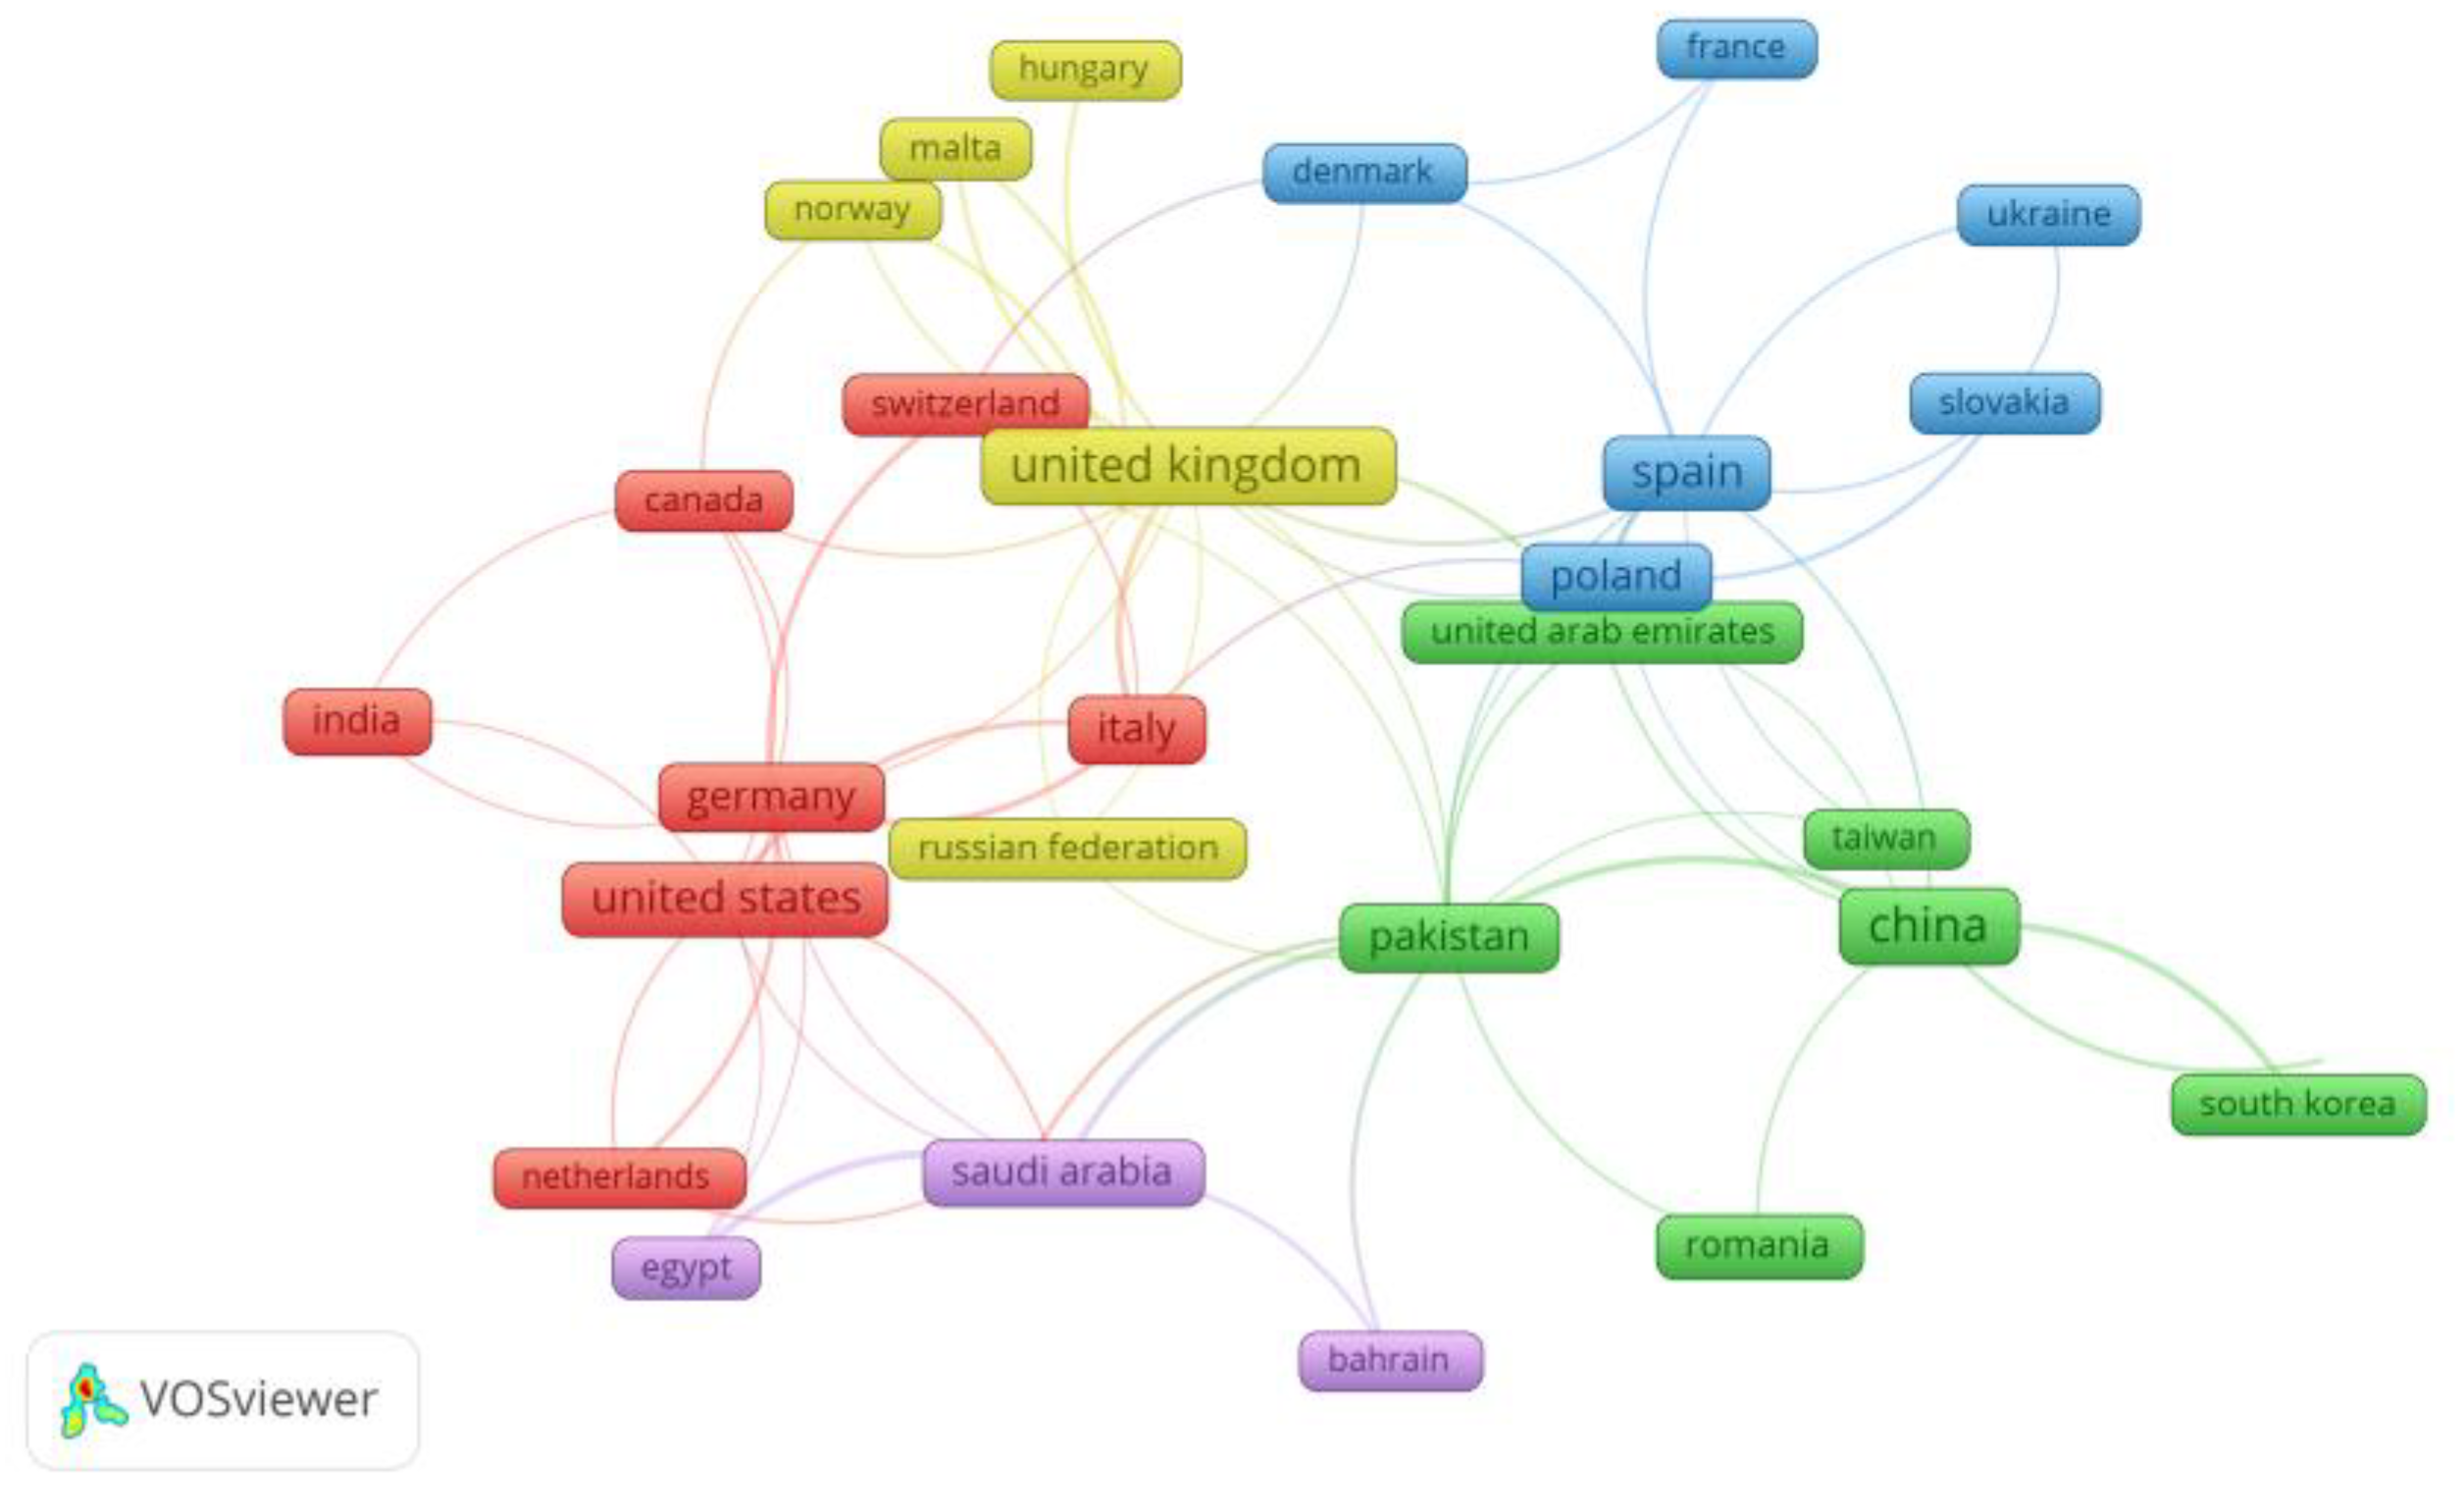
VOSviewer is a tool which can be used to analyze co-authorship in three directions – by authors, by institutions, and by countries. For the purposes of this publication, we have performed a co-authorship analysis only by countries. It refers to analyzing and visualizing collaboration models among authors from different countries on the basis of their co-authorship relationships.
The object of co-authorship analysis is in fact 51 countries in which the articles in the researched sample have been published. This type of analysis aims at outlining the international collaboration network within the researched topic and to understand the degree of collaboration among authors from different countries. At this stage, VOSviewer allows selecting only those articles whose minimum number of documents of a country and minimum number of citations (in Scopus) of a country are selected by the user and in this case their values are respectively 2 and 5. The restrictions are met by 30 countries. The ranking of countries is performed simultaneously based on the number of articles in the sample which have been published by a specific country, the total number of citations of those articles in Scopus and the number of citations of one article by one country in an article by another country out of the selected 30 countries.
The science map shows in which countries the authors collaborate as co-authors of publications and create a co-authorship network. Thus, we also learn about the geographic distribution of the publications in the field of digitalization and CSR.
VOSviewer identifies clusters or groups of authors from the same or different countries who frequently collaborate. The visualization can help identify the major centers of international collaboration and understand the whole network structure. The results of this in-depth analysis are shown in
Table 7, whereas of the science map – in
Figure 9.
3.3.3. Bibliographic Coupling
To determine the scope of scientific research dedicated to the integration of digital technologies in the activities related to CSR at enterprises, another bibliographic analysis tool will be applied – the so-called bibliographic coupling. When two articles cite a third article, then there is bibliographic coupling among them. In its essence, this type of analysis researches the shared references or citations among articles to identify the linked publications. By identifying publications which share common references, we can understand the degree of overlap of literature and the mutual coupling of the research within a single area.
The VOSviewer tool has the capacity to analyze the bibliographic coupling of Documents, Sources, Authors, Organizations and Countries. In the research, we have applied only bibliographic coupling by Documents.
The idea is to identify the current state of the researched problems in the 129 articles in the sample by reporting the use of identical scientific literature by their authors. In VOSviewer, we select only those 40 of them who are cited in Scopus at least 10 times. This will reveal links between every two articles which will reflect the number of the simultaneously cited in both articles, other articles, which are identical to both of them. 12 articles remain outside the selection because they do not have similar links to the other articles in the sample, which narrows the documents that are object of bibliographic coupling to 28 items. They are distributed in clusters of different colors – red (13 items), green (8 items) and blue (7 items). Among all of them, there are 87 bibliographic couplings which refer to citing a total of 198 literary sources.
The science map of the analysis is visualized with VOSviewer and is shown in
Figure 10.
3.3.4. Co-Citation Analysis
The co-citation analysis can identify clusters of frequently co-cited publications which can show newly emerged research fields or sub-fields. By studying the relationships among highly cited articles, we can understand the intellectual structure of the researched scientific area and potential directions for future research.
This type of analysis is based on a matrix of co-citation which captures the frequency of co-citation among couples of articles. Every row and column in the matrix are a unique article, whereas the values of the cells show how many times two articles have been cited together by other articles. As a result, a network of co-citation of articles is generated – a peculiar intellectual structure of the development of the studied scientific problems.
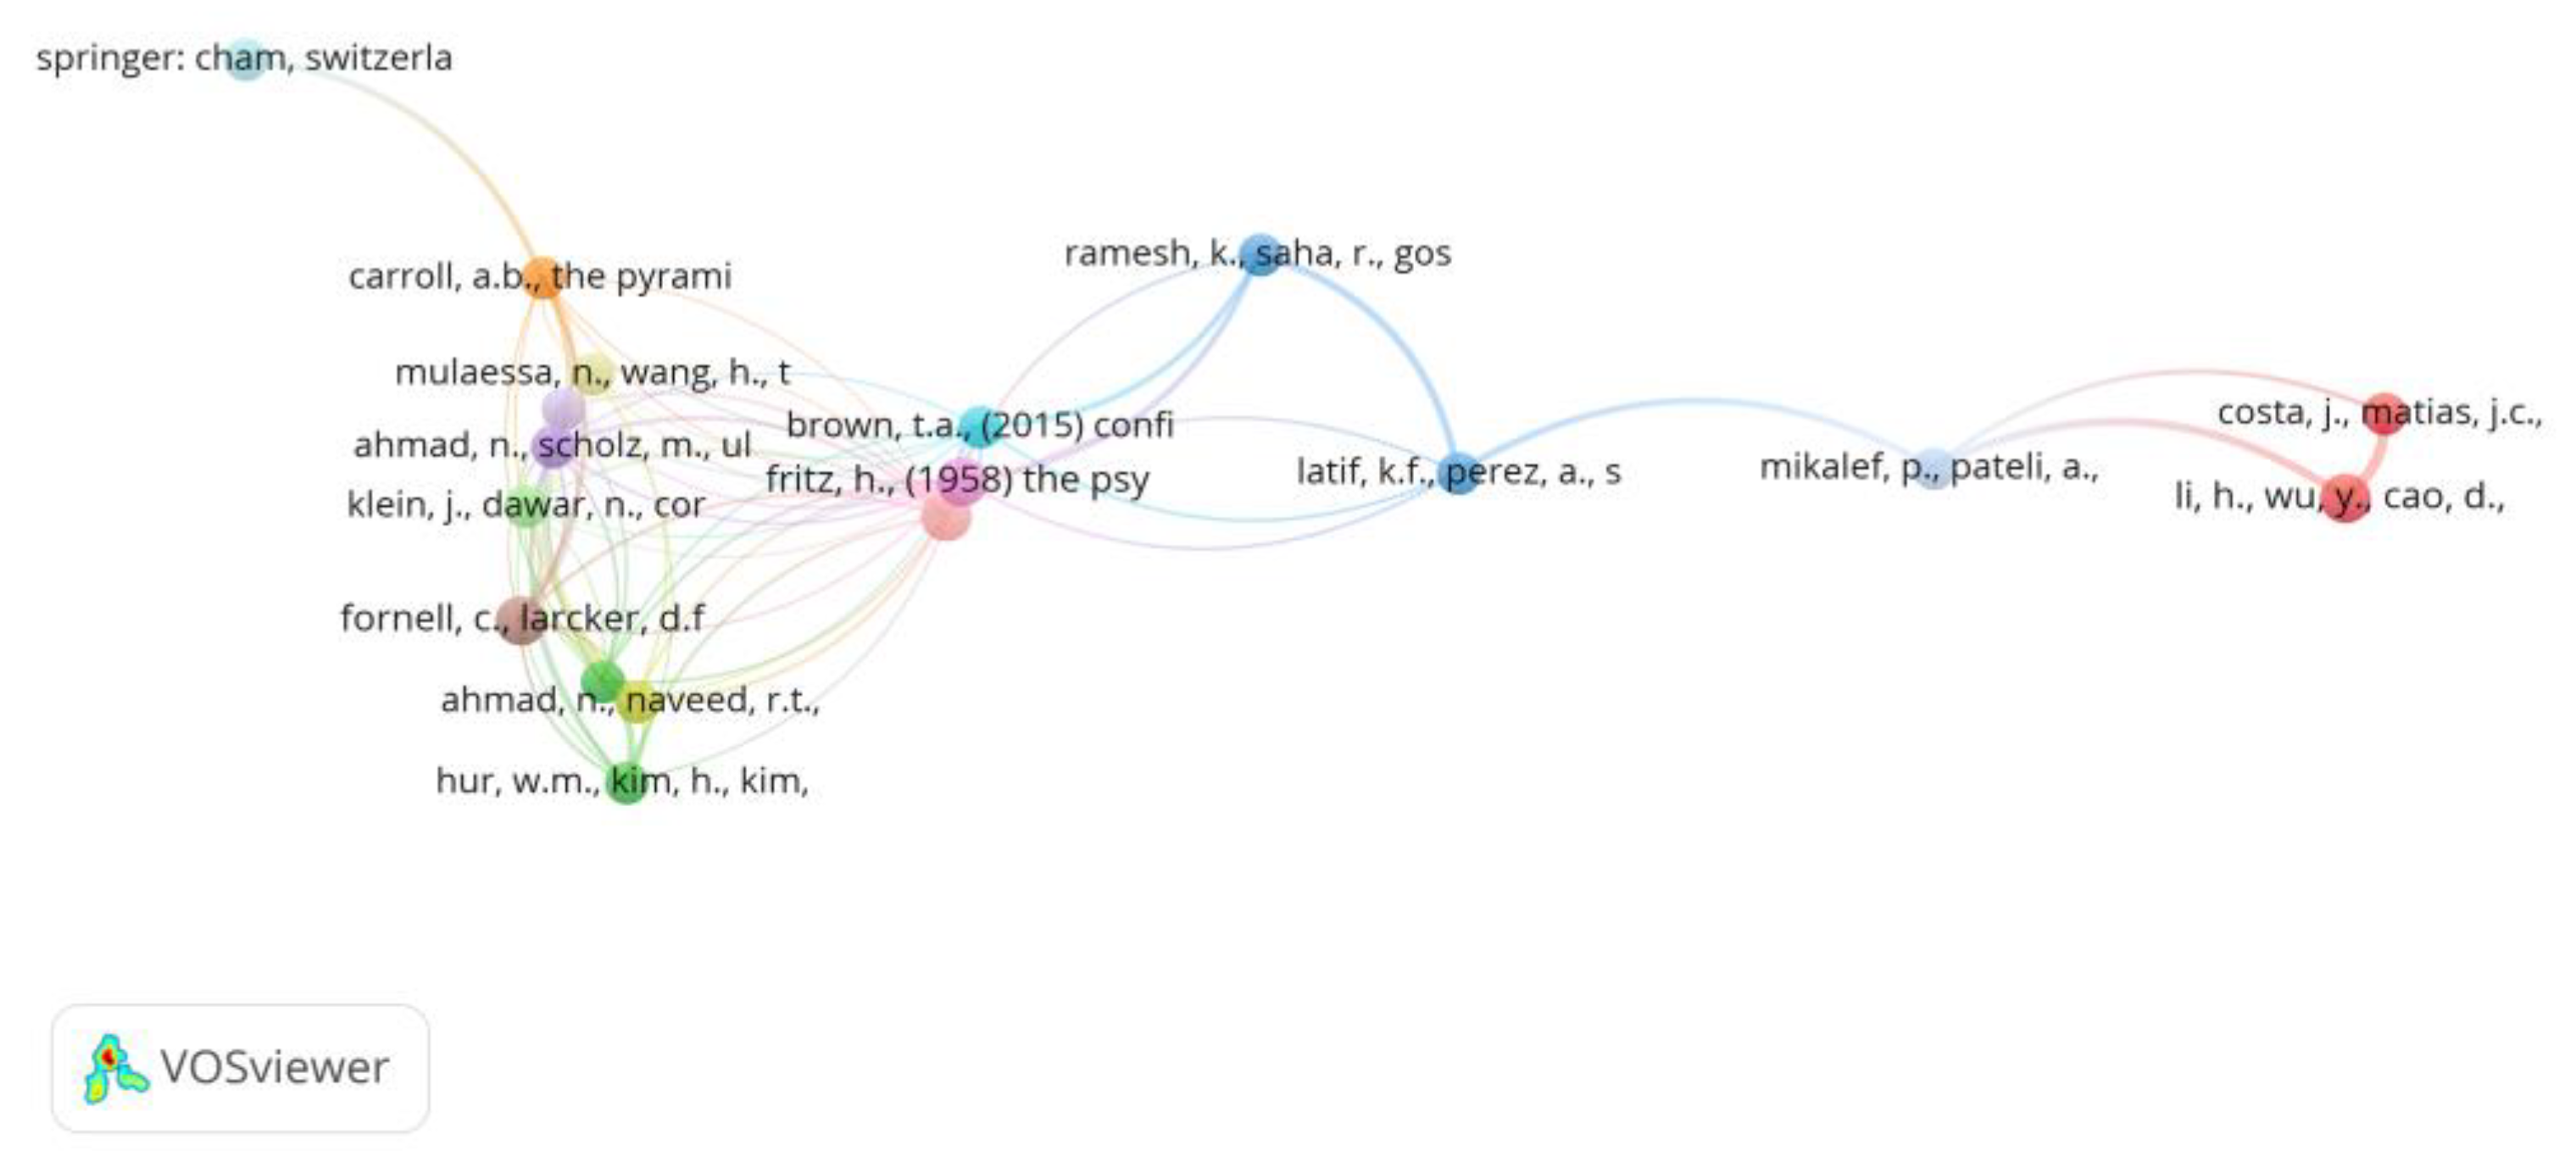
The VOSviewer tool has the capacity to analyze co-citation by Cited references, Cited sources and Cited authors. In this research, we have applied only co-citation analysis by cited references.
VOSviewer requires setting a threshold, i.e., the maximum number of identical references (cited sources) by at least two articles in the sample. In the researched sample of 129 articles, the total number of references is 7,830.
23 references correspond to three co-cited references, 4 of which are encountered 4 times in articles in the sample, whereas the remaining ones are cited 3 times. The co-cited sources were published between 1958 and 2021. The analysis of the co-citations outlines the relevant aspects of the problems of digitalization of socially responsible business. The science map of the analysis prepared with VOSviewer is shown in
Figure 11.
3.3.5. Co-Occurence Analysis
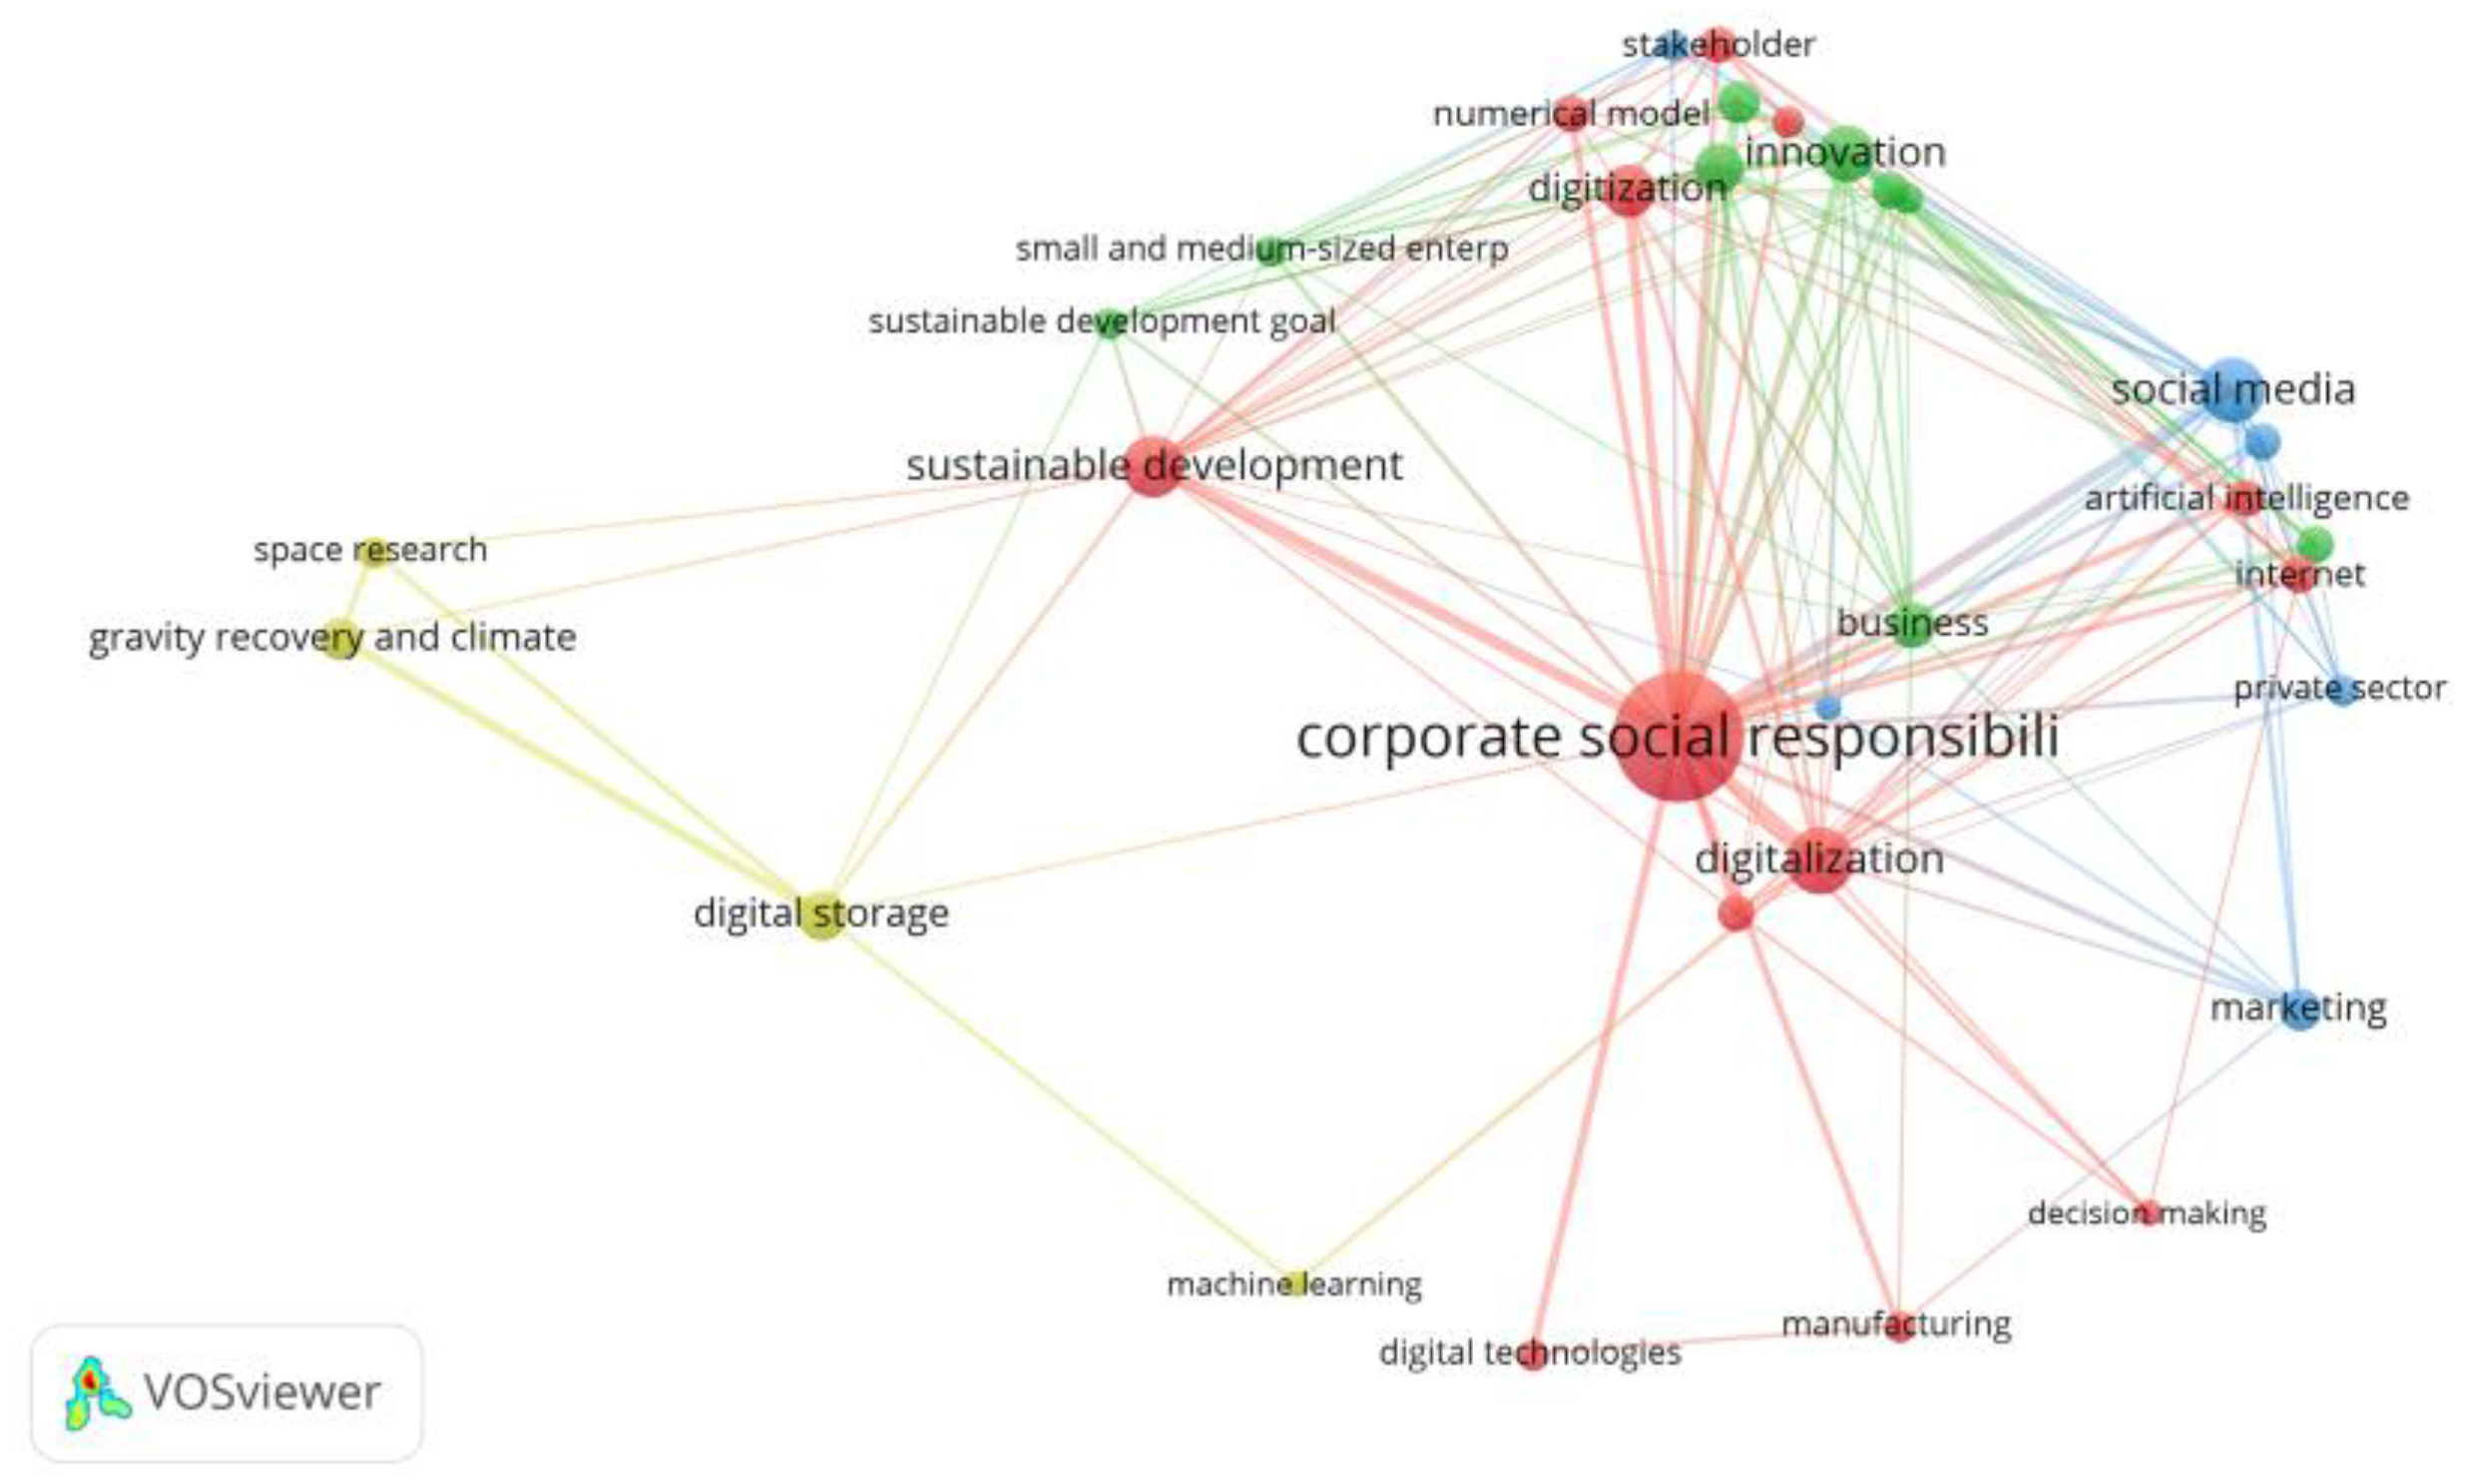
The co-occurrence analysis focuses on the frequency at which certain terms or key words appear together in scientific publications. By identifying terms that appear frequently we can outline the scope and links within the researched scientific problem.
Out of the total number of 1,127 key words in all articles of the researched material of this paper, we have initially selected only 51 words. The selection is a result of the VOSviewer option of selecting a minimum number of appearances of key words. We have set the software so that it selects a certain word or term at least three times as a key word in the articles in the sample. We have manually removed from the generated list of key words another 19 words because we have considered them irrelevant to the analysis (e.g., survey, article, human, male, female, etc.).
The remaining 32 words form 4 clusters with 160 links among them. The analysis continues by revealing the most frequently encountered key words. The product yields a list containing those words and the number of their appearances. The most frequently found words in publications are visualized by larger circles and are in the central part of the graphic.
The visualization shows the network which is built by the key words in the researched area. The science map of the analysis is prepared with VOSviewer and is shown in
Figure 12.
4. Discussion
This research, regarding the posed research questions, has yielded results which allow making the following assertions:
First, RQ1 refers to revealing the most influential publications, authors, and institutions, which research problems of integrating digital technologies in CSR activities. The analysis has shown that the article by A. G. Scherer, A. Rasche, G. Palazzo and А. Spicer “Managing for Political Corporate Social Responsibility: New Challenges and Directions for PCSR 2.0.” from 2016 happens to be the most influential publication with the most citations in Scopus – 241. Its co-authors are affiliated to various institutions, namely The University of Zurich and The University of Lausanne (Switzerland), Copenhagen Business School (Denmark) and City University London (United Kingdom). Within the sample, the most cited works are those by S. Okazaki, K. Plangger, D. West and H. D. Menéndez “Exploring digital corporate social responsibility communications on Twitter” from King's Business School, King's College London and University College London (United Kingdom) and by Z. Orbik and V. Zozul'aková, “Corporate Social and Digital Responsibility” from The Silesian University of Technology (Poland) and Constantine the Philosopher University in Nitra (Slovakia), both from 2019. These results indicate the findings about the scope and trends in the field of CSR activities in our digital age, namely – inclinations towards active involvement of politics and citizens in activities related to sustainability and social responsibility; imposing responsibility for the digital footprint on the stakeholders in CSR activities; active use of digital communication channels.
Second, RQ2 refers to the dynamics and the spread of research production in the researched area. The findings show that the research on CSR activities which rely on digital technologies develops exponentially. After 2020, we observe a sharp increase in the number of publications, which is explained by the occurrence of the global pandemic caused by the COVID-19 virus. The crisis has provoked the business to seek solutions in realizing CSR activities, which guarantees the health and life of those who participate in them. It is this circumstance that is the reason for the increased interest in integrating digital technologies.
This assertion also reflects the results of the analysis of the territorial spread of scientific works. The ranking of countries with the most publications in the researched area is topped by China with the highest number of cited documents, followed by the UK and the USA. These countries can be said to be generators of innovative practices in the field of sustainable and socially responsible business and digitalization because they possess the necessary capacity of intellectual, economic, and social resources, scale, and geopolitical positions.
Third, RQ3 refers to outlining the scope, key topics and trends for future research related to digital technologies and CSR. To outline the responses, we have used bibliographic coupling, co-citation analysis and analysis of key words and terms.
Bibliographic coupling generates three clusters – red, green, and blue. The problems researched in them also present interest. In the red cluster, the bibliographic links are by topics in the field of corporate social responsibility and ethics – communication with the stakeholders, sharing business and responsibility, loyalty, political aspects of CSR, and all this through the communication power of the media, the Internet of Things, green initiatives, etc. The green cluster contains bibliographically linked scientific publications on corporate social responsibility – on the role of digital media, corporate websites, etc., in sharing CSR initiatives. The outlined topics of the articles in the blue cluster are related to CSR in various in their essence sectors – banks, hi-tech companies, small and medium enterprises, developing countries and economies, in which digital solutions are successfully implemented.
The co-citation analysis outlines the relevant aspects of the problems of digitalization in socially responsible businesses. They can be grouped as follows: 1) relevant problems of CSR – trust, transparency, loyalty between business and society; effects on civil behavior and opportunities for institutionalizing CSR; emotional engagement with the problems of CSR; brand image and brand attitude; 2) digital solutions for CSR – integrating social media; digital information processing; digital communication channels in a networked socially responsible society; and 3) sector application of CSR – banking sector, environmental enterprises, hotel industry, Chinese economy.
The analysis of key words has revealed the most frequently used key words and terms in the articles in the sample in the outlined scientific area. These are CSR, sustainability, social media, innovations, etc. They outline the field, the “nucleus”, and the state of the problems in scientific literature regarding the integration of digital technologies in CSR activities. Contrary to them, the most remote from the remaining key words and terms notions show the boundary values of the analysis, i.e., they are the least researched in literature. These are, for instance, world wide web, machine learning, Artificial intelligence, COVID-19, private sector, space research, etc. These types of key words mark the possible trends for future research, especially if they are combined among each other.
As a result of the research, we can outline as relevant sectors of further scientific research: banks, SMEs, family firms, innovative channels for communication with stakeholders, respectively Twitter, social media, etc. At the same time, we can differentiate the following ethical aspects: Customer Trust, Customer Loyalty; regarding security – digital security, as well as some new skills and competences. Among the sectors that remain outside the scope of this research are Overlay Visualization and Density Visualization.
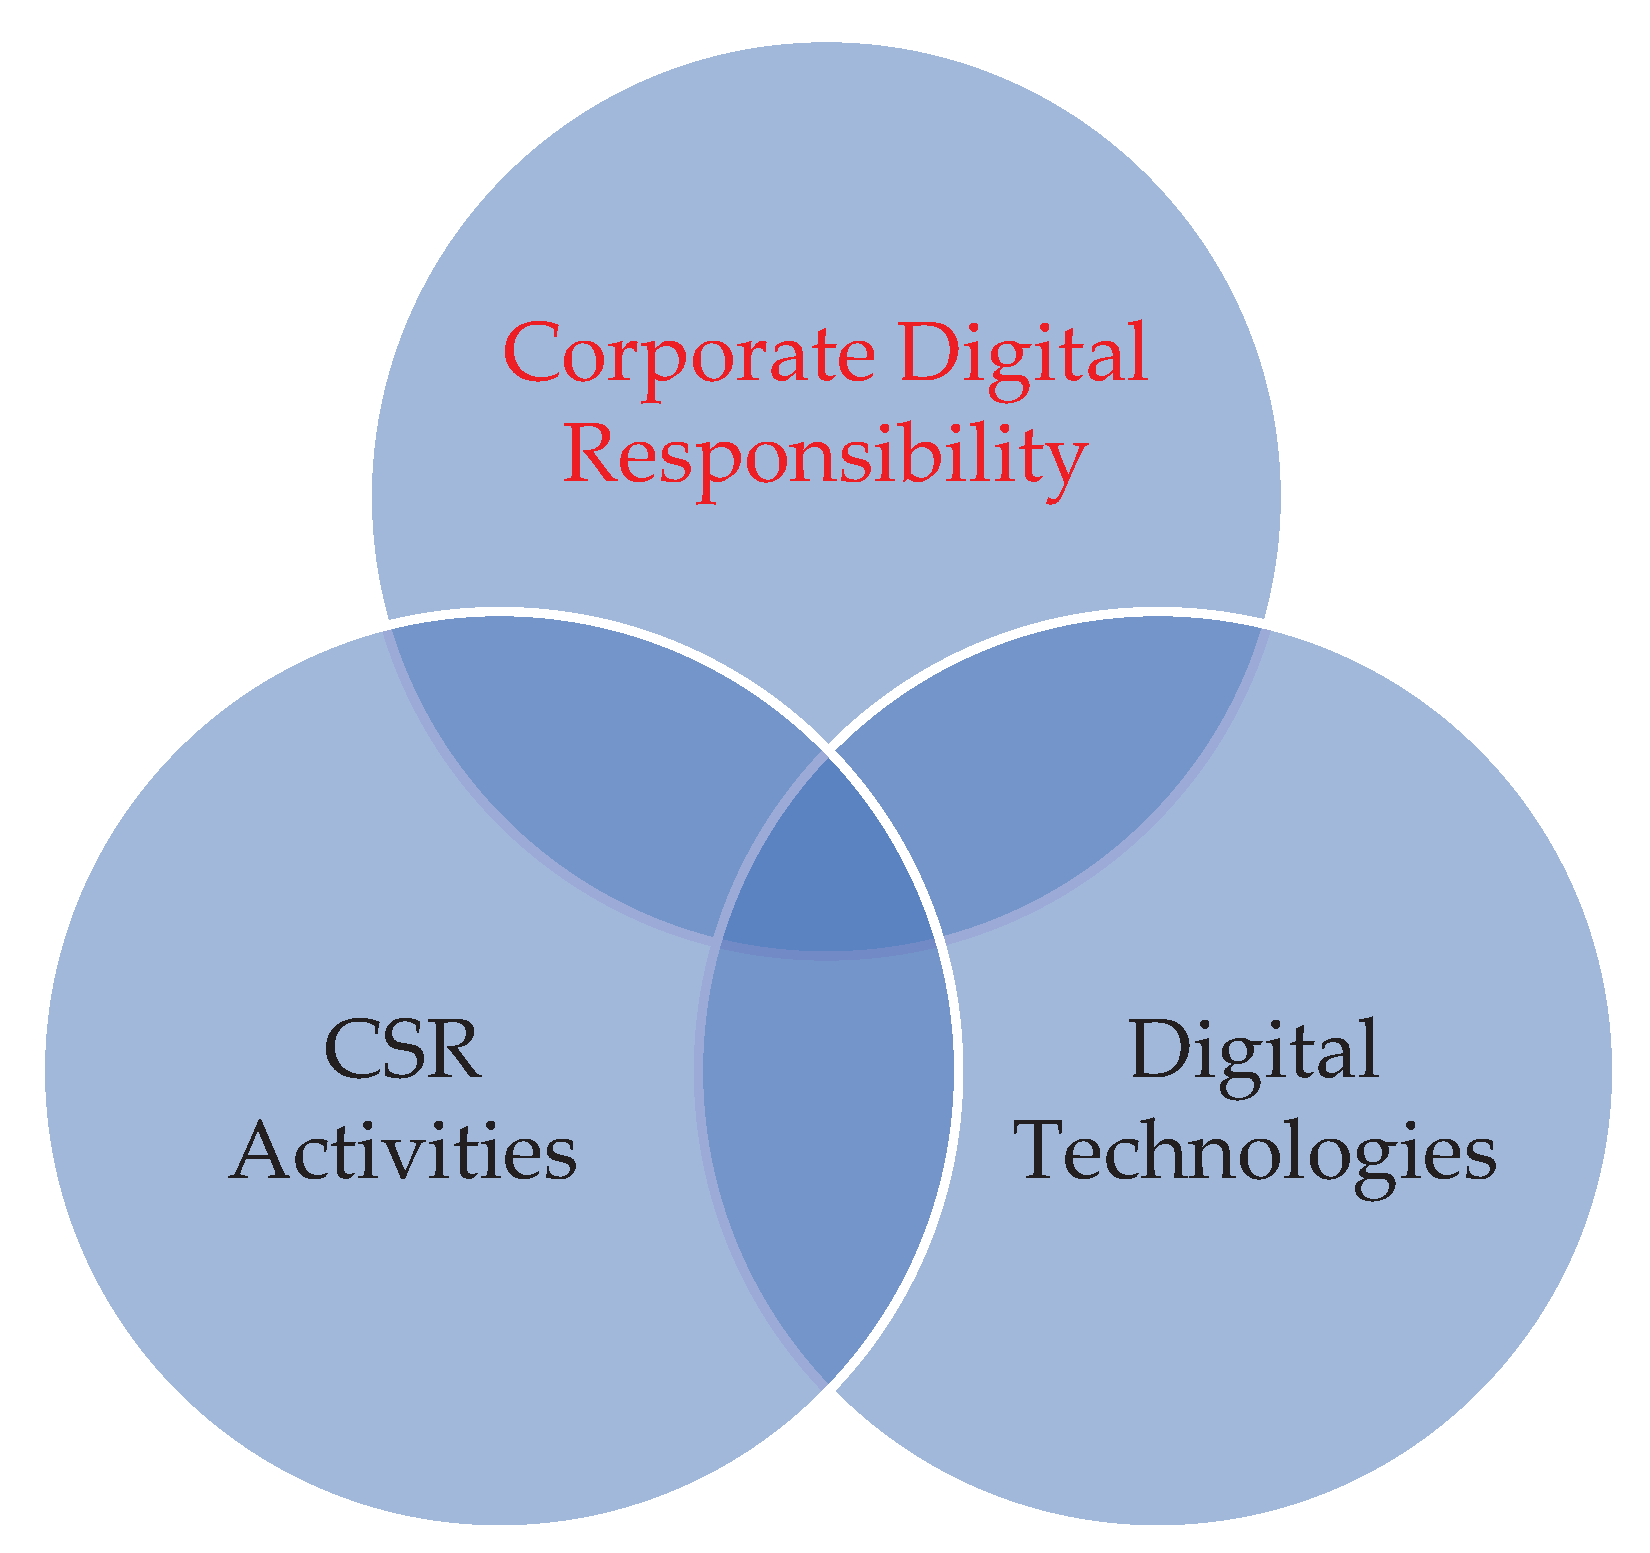
On the basis of the performed analysis, it can be concluded that the intersection between Digital Technologies & CSR is Corporate Digital Responsibility, which can be visualized as follows (cf
Figure 13):
5. Conclusions
As a result of this research, we can outline two significant areas of possible future scientific and practical research:
First, specifying the key research areas and trends in integrating digital technologies in CSR activities, incl.:
Digitalization of accounting and communication;
Innovations regarding digital solutions in the field of CSR (it is more frequently that companies use artificial intelligence, blockchain, the Internet of Things (IoT), virtual reality and other technologies to improve the efficiency and impact of CSR activities);
Knowledge sharing, collaboration, good practices (via online platforms, mobile applications, and networks among the stakeholders);
Enhancing the quality of managerial decisions by more efficient monitoring, data analysis and assessment of the efficiency and impact of CSR activities;
Ethical and legal aspects of integrating digital technologies in CSR (problems of personal data protection, cybersecurity, responsible use of artificial intelligence);
Strategies and management of digital technologies in CSR (development of strategies and managerial models for integrating digital technologies in CSR);
Social aspects of the process of integrating digital technologies in CSR (research on the social effects – the impact of competences, workplaces, education, access to technologies, digital inequality, vulnerable groups).
Second, analysis of the most frequently used digital technologies in CSR activities and respectively their impact on organizations and the society, incl.:
Social media and online communications (for popularizing CSR and communication with the stakeholders);
Internet platforms for donations and volunteering (for engaging more employees and outsiders and management of the collected donations);
Data analysis (for assessment of the impact of CSR activities – data collection and analysis about the environmental footprint, social indicators, ethical practices);
Interactive educational technologies and resources (for encouraging education and the engagement of employees and other stakeholders – courses, video conferences, online events, learning materials);
Technologies for accounting and analysis (blockchain, digital tracking systems, accounting which guarantees transparency and lowering the risk of misuse).
A Bibliometric Analysis and Systematic Literature Review outline the scope of the scientific and research interest, on the one hand, and the practical and applied interest, on the other hand, in the field of CSR. In addition, they form the basis of bringing forward the new trends for future publications, which shall upgrade and enrich the theory and practice.
Author Contributions
Conceptualization, Atanas Atanasov, Galina Chipriyanova and Radosveta Krasteva-Hristova; Data curation, Atanas Atanasov; Formal analysis, Atanas Atanasov and Galina Chipriyanova; Funding acquisition, Galina Chipriyanova; Investigation, Atanas Atanasov, Galina Chipriyanova and Radosveta Krasteva-Hristova; Methodology, Atanas Atanasov, Galina Chipriyanova and Radosveta Krasteva-Hristova; Project administration, Galina Chipriyanova; Resources, Atanas Atanasov and Radosveta Krasteva-Hristova; Software, Radosveta Krasteva-Hristova; Supervision, Radosveta Krasteva-Hristova; Validation, Atanas Atanasov, Galina Chipriyanova and Radosveta Krasteva-Hristova; Visualization, Radosveta Krasteva-Hristova; Writing – original draft, Radosveta Krasteva-Hristova; Writing – review & editing, Atanas Atanasov and Galina Chipriyanova. All authors have read and agreed to the published version of the manuscript.
Funding
This research was funded by the Institute for Scientific Research of “D. A. Tsenov” Academy of Economics, Svishtov, Bulgaria, grant number 2023-03.
Data Availability Statement
The data presented in this study are available on request from the corresponding author.
Conflicts of Interest
The authors declare no conflict of interest.
References
- Abdullah, and Mohammed Naved Khan. 2021. Determining Mobile Payment Adoption: A Systematic Literature Search and Bibliometric Analysis. Edited by Elena Kostadinova. Cogent Business & Management 8 (1): 1893245. [CrossRef]
- Ajiferuke, Isola, Q. Burell, and Jean Tague. 1988. Collaborative Coefficient: A Single Measure of the Degree of Collaboration in Research. Scientometrics 14 (5–6): 421–33. [CrossRef]
- Börner, Katy, Chaomei Chen, and Kevin W. Boyack. 2005. Visualizing Knowledge Domains. Annual Review of Information Science and Technology 37 (1): 179–255. [CrossRef]
- Cobo, M.J., A.G. López-Herrera, E. Herrera-Viedma, and F. Herrera. 2011. Science Mapping Software Tools: Review, Analysis, and Cooperative Study among Tools. Journal of the American Society for Information Science and Technology 62 (7): 1382–1402. [CrossRef]
- Donthu, Naveen, Satish Kumar, Debmalya Mukherjee, Nitesh Pandey, and Weng Marc Lim. 2021. How to Conduct a Bibliometric Analysis: An Overview and Guidelines. Journal of Business Research 133 (September): 285–96. [CrossRef]
- Elango, B., and P. Rajendran. 2012. Authorship Trends and Collaboration Pattern in the Marine Sciences Literature: A Scientometric Study. International Journal of Information Dissemination and Technology 2 (3): 166–69. https://www.semanticscholar.org/paper/Authorship-Trends-and-Collaboration-Pattern-in-the-Elango-Rajendran/deb3cfa9b5f435b949b029791a0279290da2c623.
- Krysovatyy, Andriy, Iryna Zvarych, Oksana Brodovska, and Roman Zvarych. 2022. Global Social Sustainability and Inclusion: The ‘Voice’ of Social and Environmental Imbalances. Journal of Risk and Financial Management 15 (12): 599. [CrossRef]
- Lamptey, Ebenezer K., Jin Dong Park, and Isaac Bonaparte. 2023. Does Corporate Social Responsibility Affect the Timeliness of Audited Financial Information? Evidence from ‘100 Best Corporate Citizens.’ Journal of Risk and Financial Management 16 (2): 60. [CrossRef]
- Monteiro, Albertina Paula, Beatriz Aibar-Guzmán, María Garrido-Ruso, and Cristina Aibar-Guzmán. 2021. Employee-Related Disclosure: A Bibliometric Review. Sustainability 13 (10): 5342. [CrossRef]
- Morris, Steven A., and Betsy Van Der Veer Martens. 2009. Mapping Research Specialties. Annual Review of Information Science and Technology 42 (1): 213–95. [CrossRef]
- Muchiri, Martin Kamau, Szilvia Erdei-Gally, Mária Fekete-Farkas, and Zoltán Lakner. 2022. Bibliometric Analysis of Green Finance and Climate Change in Post-Paris Agreement Era. Journal of Risk and Financial Management 15 (12): 561. [CrossRef]
- Noyons, E.C.M., H.F. Moed, and M. Luwel. 1999. Combining Mapping and Citation Analysis for Evaluative Bibliometric Purposes: A Bibliometric Study. Journal of the American Society for Information Science 50 (2): 115–31. [CrossRef]
- Page, Matthew J, Joanne E McKenzie, Patrick M Bossuyt, Isabelle Boutron, Tammy C Hoffmann, Cynthia D Mulrow, Larissa Shamseer, et al. 2021. The PRISMA 2020 Statement: An Updated Guideline for Reporting Systematic Reviews. BMJ, March, n71. [CrossRef]
- Pangalos, George. 2023. Financing for a Sustainable Dry Bulk Shipping Industry: What Are the Potential Routes for Financial Innovation in Sustainability and Alternative Energy in the Dry Bulk Shipping Industry? Journal of Risk and Financial Management 16 (2): 101. [CrossRef]
- Paris, Bas, Dimitris Michas, Athanasios T. Balafoutis, Leonardo Nibbi, Jan Skvaril, Hailong Li, Duarte Pimentel, et al. 2023. A Review of the Current Practices of Bioeconomy Education and Training in the EU. Sustainability 15 (2): 954. [CrossRef]
- Petrovich, Eugenio. 2021. Science Mapping and Science Maps. KNOWLEDGE ORGANIZATION 48 (7–8): 535–62. [CrossRef]
- Richert, Maria, and Marek Dudek. 2023. Risk Mapping: Ranking and Analysis of Selected, Key Risk in Supply Chains. Journal of Risk and Financial Management 16 (2): 71. [CrossRef]
- Shahadat, M M Hussain, Abu Hena Mohammed Yeaseen Chowdhury, Robert Jeyakumar Nathan, and Maria Fekete-Farkas. 2023. Digital Technologies for Firms’ Competitive Advantage and Improved Supply Chain Performance. Journal of Risk and Financial Management 16 (2): 94. [CrossRef]
- Sheel, Ashutosh, and Vishnu Nath. 2019. Effect of Blockchain Technology Adoption on Supply Chain Adaptability, Agility, Alignment and Performance. Management Research Review 42 (12): 1353–74. [CrossRef]
- Singh, Nitya, and Paul Hong. 2023. CSR, Risk Management Practices, and Performance Outcomes: An Empirical Investigation of Firms in Different Industries. Journal of Risk and Financial Management 16 (2): 69. [CrossRef]
- Tranfield, David, David Denyer, and Palminder Smart. 2003. Towards a Methodology for Developing Evidence-Informed Management Knowledge by Means of Systematic Review. British Journal of Management 14 (3): 207–22. [CrossRef]
- Van Eck, Nees Jan, and Ludo Waltman. 2010. Software Survey: VOSviewer, a Computer Program for Bibliometric Mapping. Scientometrics 84 (2): 523–38. [CrossRef]
- Warren, Scott, Brian Sauser, and David Nowicki. 2019. A Bibliographic and Visual Exploration of the Historic Impact of Soft Systems Methodology on Academic Research and Theory. Systems 7 (1): 10. [CrossRef]
- Yu, Yuetian, Yujie Li, Zhongheng Zhang, Zhichun Gu, Han Zhong, Qiongfang Zha, Luyu Yang, Cheng Zhu, and Erzhen Chen. 2020. A Bibliometric Analysis Using VOSviewer of Publications on COVID-19. Annals of Translational Medicine 8 (13): 816–816. [CrossRef] [PubMed]
|
Disclaimer/Publisher’s Note: The statements, opinions and data contained in all publications are solely those of the individual author(s) and contributor(s) and not of MDPI and/or the editor(s). MDPI and/or the editor(s) disclaim responsibility for any injury to people or property resulting from any ideas, methods, instructions or products referred to in the content. |
© 2023 by the authors. Licensee MDPI, Basel, Switzerland. This article is an open access article distributed under the terms and conditions of the Creative Commons Attribution (CC BY) license (http://creativecommons.org/licenses/by/4.0/).
