1. Introduction
With the advent of the knowledge economy and information society, the emerging design concept of BIM, which refers to the creation and use of digital technology to integrate and manage 3D models and engineering data during the whole life cycle of a project, can optimize traditional design, construction and operation. BIM can optimize the traditional design, construction and operation of technical methods, save project costs, and assist in decision-making to achieve high quality and high efficiency in the whole process of design, construction and operation of construction projects. It has been widely used in engineering construction fields such as water conservancy, rail and transportation, industrial and civil engineering and municipal construction [
1,
2,
3,
4,
5].
The underground powerhouse of a hydropower station is the core component of a hydropower station and is mainly used for the installation and maintenance of hydro generator units and the operation of control and scheduling systems [
6]. As an important component of the underground powerhouse design process, 3D modeling is established to provide a better understanding of the underground structure and space and modify and optimize the design according to the actual situation. Construction personnel can better understand the construction and structure of the project and improve the efficiency [
7]. For example, Zhong et al. used BIM to model an underground powerhouse and surrounding geological conditions, which aided the safe construction of an excavation process by providing an intuitive reference of the geological structure [
8]. Zheng et al. applied the integration of BIM and GIS to the construction management process of an underground powerhouse for a hydropower station, which improved project management efficiency [
5]. Facchini et al. combined BIM technology to analyze the spatial temperature of an underground powerhouse, which improved the visualization of the analysis results [
9]. Liu performs BIM-4D virtual construction for underground powerhouse renovation, improving construction efficiency [
10]. Jiang addressed the problems of many participating professions, low communication efficiency, consideration of conflicting problems, many design drawings, and poor information management of design results. Jiang carried out research on parametric and collaborative design, which improved the efficiency of underground powerhouse design [
11]. Recently, parametric BIM has received attention from industry, and commonly used parametric modeling tools include FreeCAD, Dynamo, Rhino, and SolidWorks. Parametric BIM improves efficiency [
12,
13,
14], and some scholars have combined BIM applications to the construction phase of underground powerhouses and designed a parametric model of underground powerhouses and support systems through CATIA [
15].
The parametric modeling studies have improved the modeling efficiency of underground powerhouse to a certain extent. However, there are still inefficiencies in the determination of geometric parameters in the modeling design process. Recently, many scholars have conducted research based on knowledge graphs to assist engineering construction, and knowledge graphs have played an important role in the construction and operation and maintenance periods of the hydropower industry. However, there is a lack of research work on modeling design based on knowledge mapping. To address such problems, converting the design information of spatial arrangement of underground powerhouse into knowledge will better improve the efficiency of geometric parameter acquisition. Knowledge of spatial arrangement of underground powerhouse is an important basis for guiding underground powerhouse BIM, which can improve BIM efficiency. However, in the spatial arrangement design phase of an underground powerhouse for the hydropower station, the guidance materials are recorded in the form of text to form the documentation materials of the hydropower station underground powerhouse design. Underground powerhouse design information is mostly presented in the form of unstructured data, which is contained in a large number of design specifications and related cases, making it difficult to directly extract relevant parameters of powerhouse design. In addition, for the specific problems in modeling, it is difficult to quickly obtain the targeted design knowledge from the underground powerhouse design standards to guide the solution of plant BIM. Therefore, how to intelligently extract the knowledge of spatial arrangement of underground powerhouse of hydropower station from the standard specification and relevant cases, determine the expression mode of spatial arrangement of underground powerhouse, and realize the efficient retrieval and application of spatial arrangement design is an important part of the current intelligent modeling of spatial arrangement of underground powerhouse.
A knowledge graph is a knowledge representation method based on semantic networks that can organize the knowledge of different fields into a structured graph for easy knowledge management, sharing and application [
16]. In recent years, with the development of knowledge graph technology, its application in various fields has become increasingly widespread [
17]. In the spatial arrangement of underground powerhouses for hydropower stations, constructing a knowledge can help engineers better understand the structure, design basis, parameter composition and other knowledge aspects of underground powerhouses, improve the efficiency and quality of design and contribute to the sustainable development of the hydraulic engineering. In the process of knowledge graph construction, there are two important steps: entity identification and relationship extraction. Entity recognition mainly extracts entity words intelligently from text data and obtains entity sets that can summarize the semantics of describing text [
18]. Initially, entity recognition methods were mostly rule-based and obtained entity words in text through the existing professional thesaurus with the rules of text content expression [
19]. The current rule-based entity recognition method is the commonly used entity recognition method, but it lacks text semantic analysis, and the entity recognition accuracy is directly affected by the richness of the specialized terminology base and text expressions [
20]. Dependent semantic learning methods can intelligently recognize entity words in text from text semantics and combine semantic information of words in text [
21], and domain adaptive methods can achieve deep analysis of text information based on the semantics of this paper, such as BiLSTM-CRF (bidirectional long short-term memory-conditional random field), GRU-CRF (gate recurrent unit-conditional random field), and lattice LSTM (lattice long short-term memory) [
22,
23,
24,
25], which are domain self-applicable methods that are fully supervised learning and improve the accuracy of entity recognition by labeling and training the target corpus. However, such methods require a large amount of training data to be prepared in advance, and making data labels is a large workload.
There is a lack of research on establishing knowledge mapping in the BIM modeling process, and this study initially explores the construction of knowledge mapping for BIM modeling of underground powerhouse of hydropower stations. In the process of constructing a knowledge graph for BIM of underground powerhouses for hydropower stations, the model layout and geometric design are mainly derived from standard specifications and historical design cases, and the existing methods mainly obtain the knowledge of BIM of underground powerhouses for hydropower stations expressed in the form of mapping by manually extracting entities and sorting out the relationships between entities. The form of manually constructing knowledge graphs not only causes an unnecessary waste of human and material resources but also requires the participation of designers with rich experience, making the construction of domain knowledge graphs a high-cost task. Although some domain adaptive models are currently proposed, the process of tagging the domain corpus is complex, and the tagging process is labor intensive. Therefore, this study assists knowledge extraction work based on a highly intelligent AI algorithm—ChatGPT. The method can improve the efficiency of knowledge extraction and reduce the labor cost of producing a large number of datasets with better answering capability.
Combined with the specifications related to the design of underground powerhouses for hydropower stations and relevant design cases, this paper proposes an efficient and intelligent knowledge graph construction method, establishes a professional thesaurus in the domain of underground powerhouses for hydropower stations, defines a relationship skeleton of the spatial arrangement of underground powerhouses for hydropower stations, realizes the intelligent retrieval and application of BIM based on domain knowledge graphs, and provides a new method for knowledge extraction and understanding of the spatial arrangement of underground powerhouses for hydropower stations. This significantly contributes to the facilitation of knowledge retrieval and the provision of important parameter recommendations, making it of paramount importance in the development of knowledge graph-driven intelligent modeling for underground powerhouses in hydropower stations. At the same time, knowledge graph is continuously updatable and has sustainable implications for improving the spatial arrangement of underground powerhouses in hydropower stations.
2. Methodology
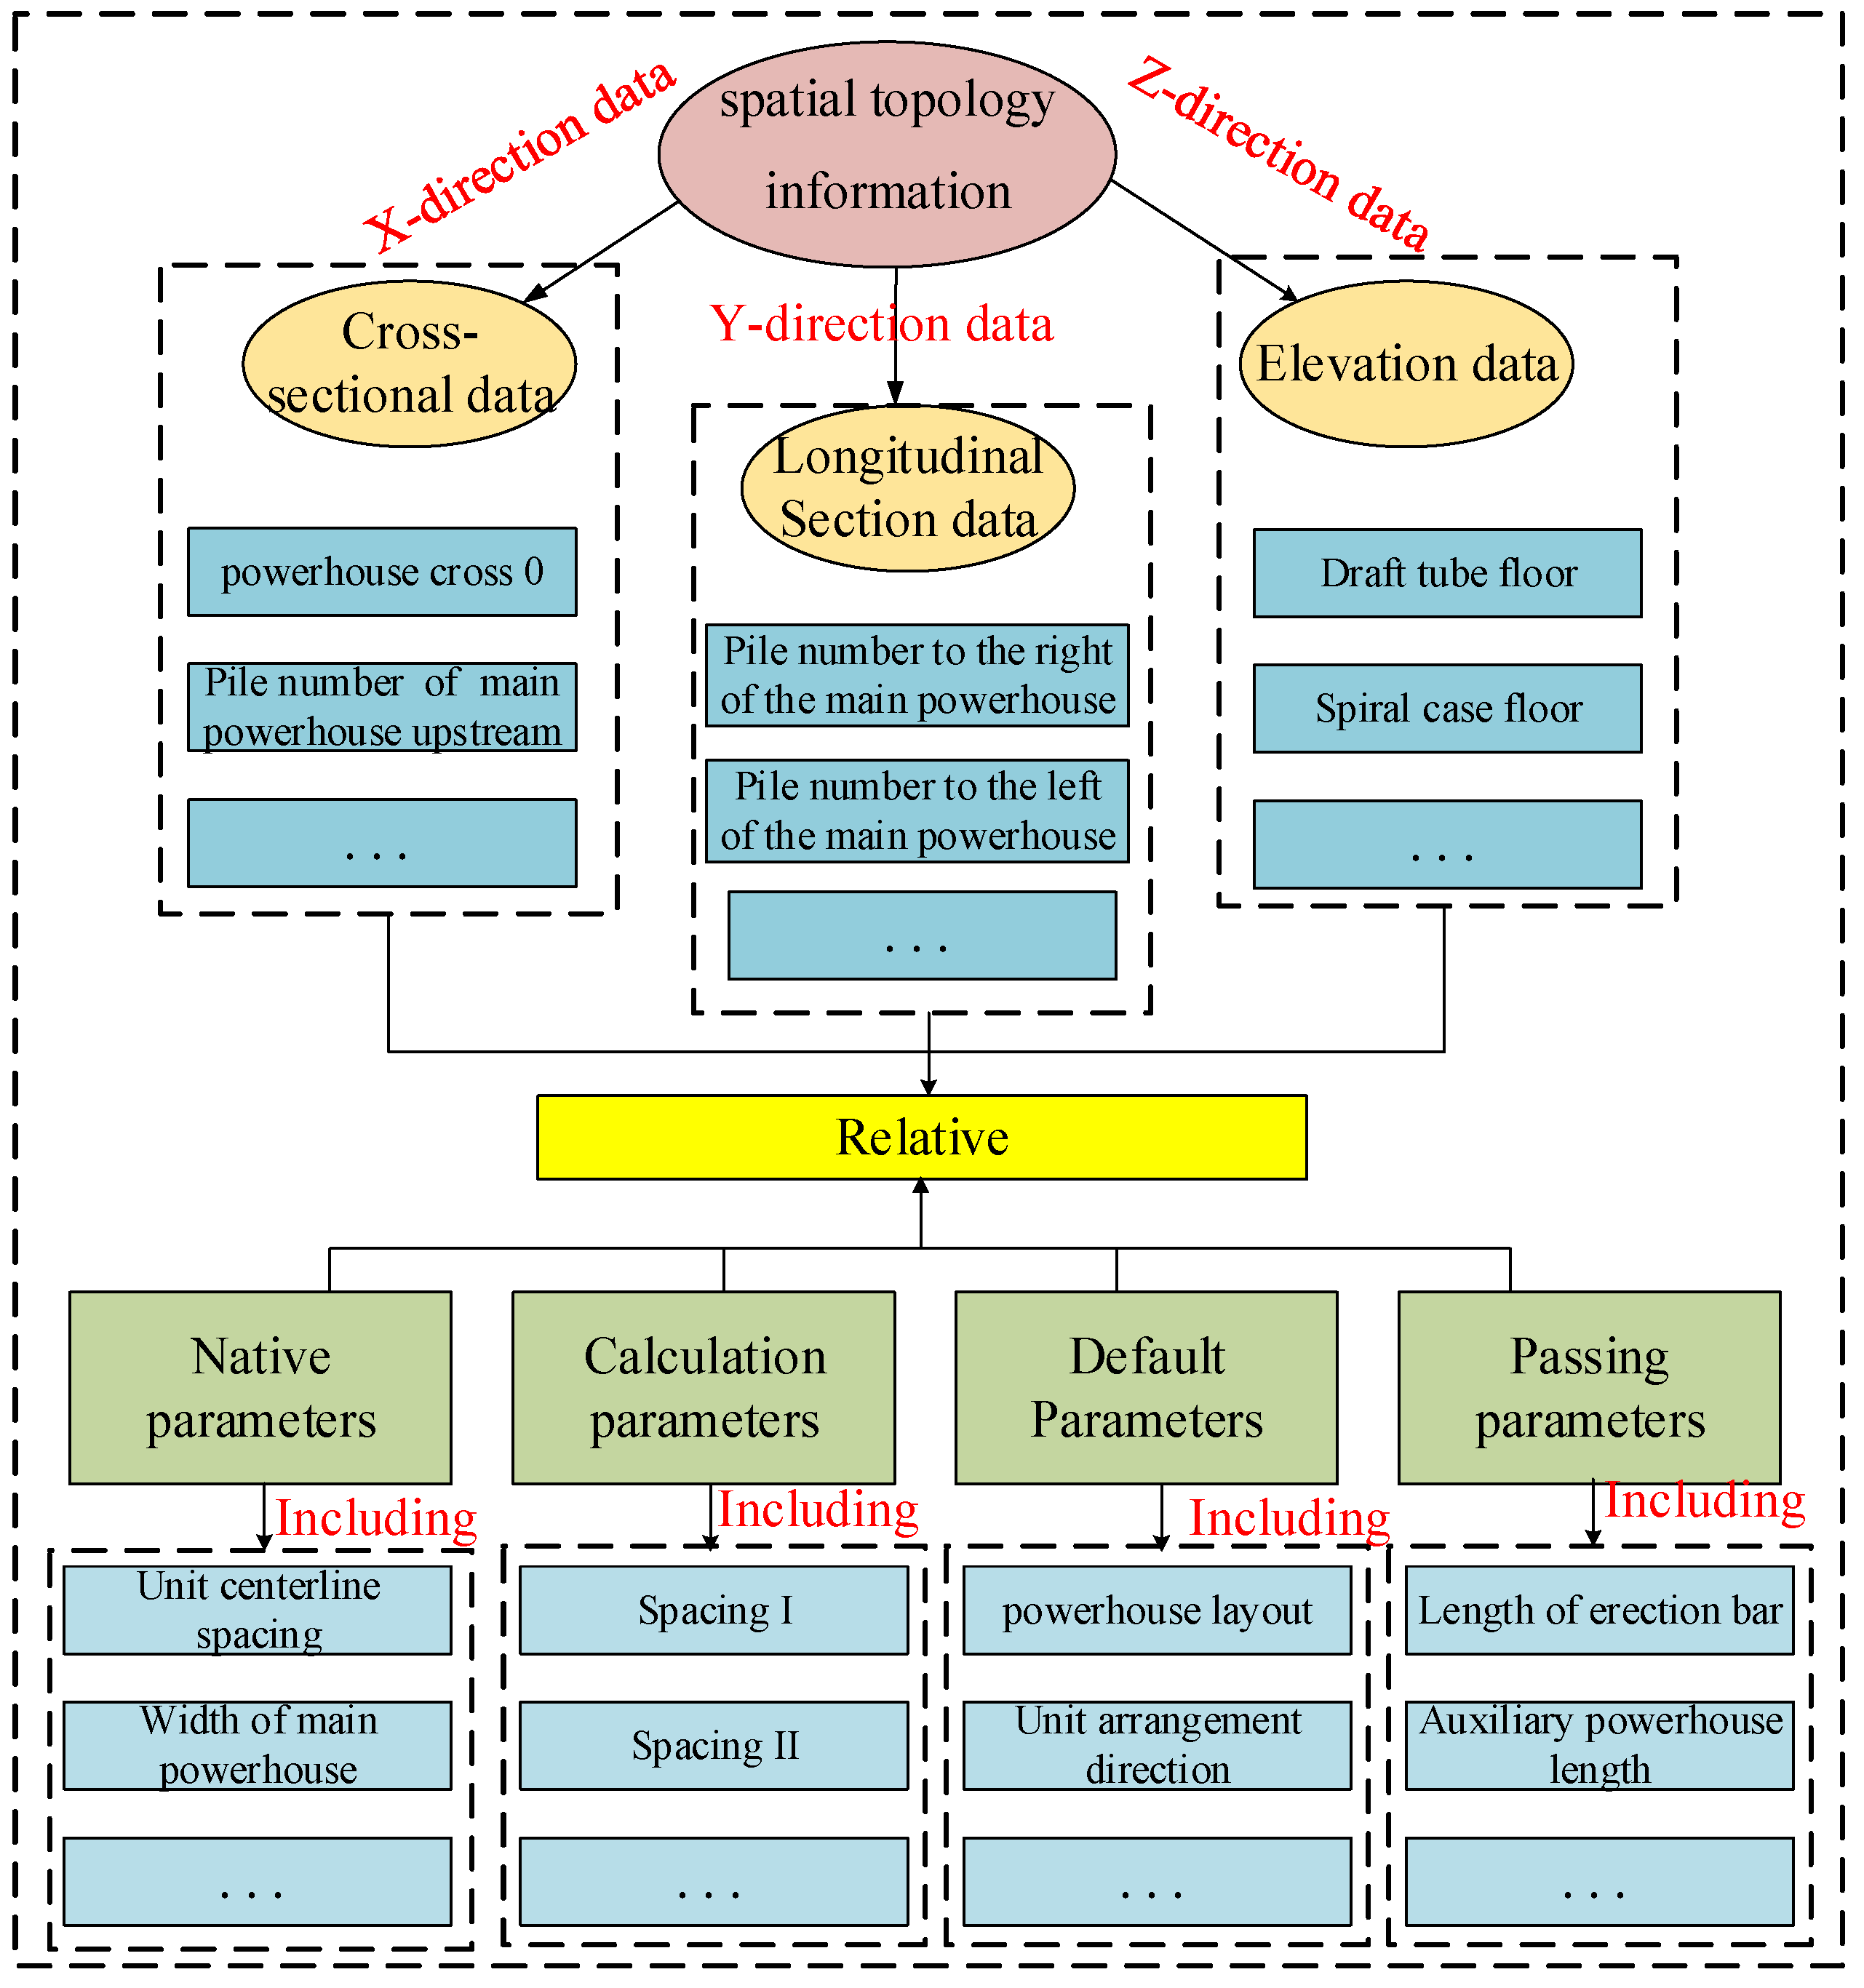
Underground powerhouse modeling involves spatial topology rules, numerous parameter types and complex parameter relationships, resulting in the process of modeling underground powerhouses requiring designers to assist in the construction of BIM through a large amount of professional knowledge and relevant specifications. On the other hand, after the BIM of the underground powerhouse is established, although it has strong intuitiveness, the logic between internal structures is poor. The diagram structure constructed based on the diagram database can reasonably express the logical relationship between the BIM models. After the construction of the underground powerhouse is completed, the relationship logic between each structure can still be obtained by viewing the knowledge graph of the underground powerhouse, which is not only intuitive to the model of the underground powerhouse but can also obtain the relationship between the spatial topological data of the underground powerhouse. Therefore, it is very meaningful to build a knowledge graph of the spatial arrangement of underground powerhouses.
2.1. Build Process
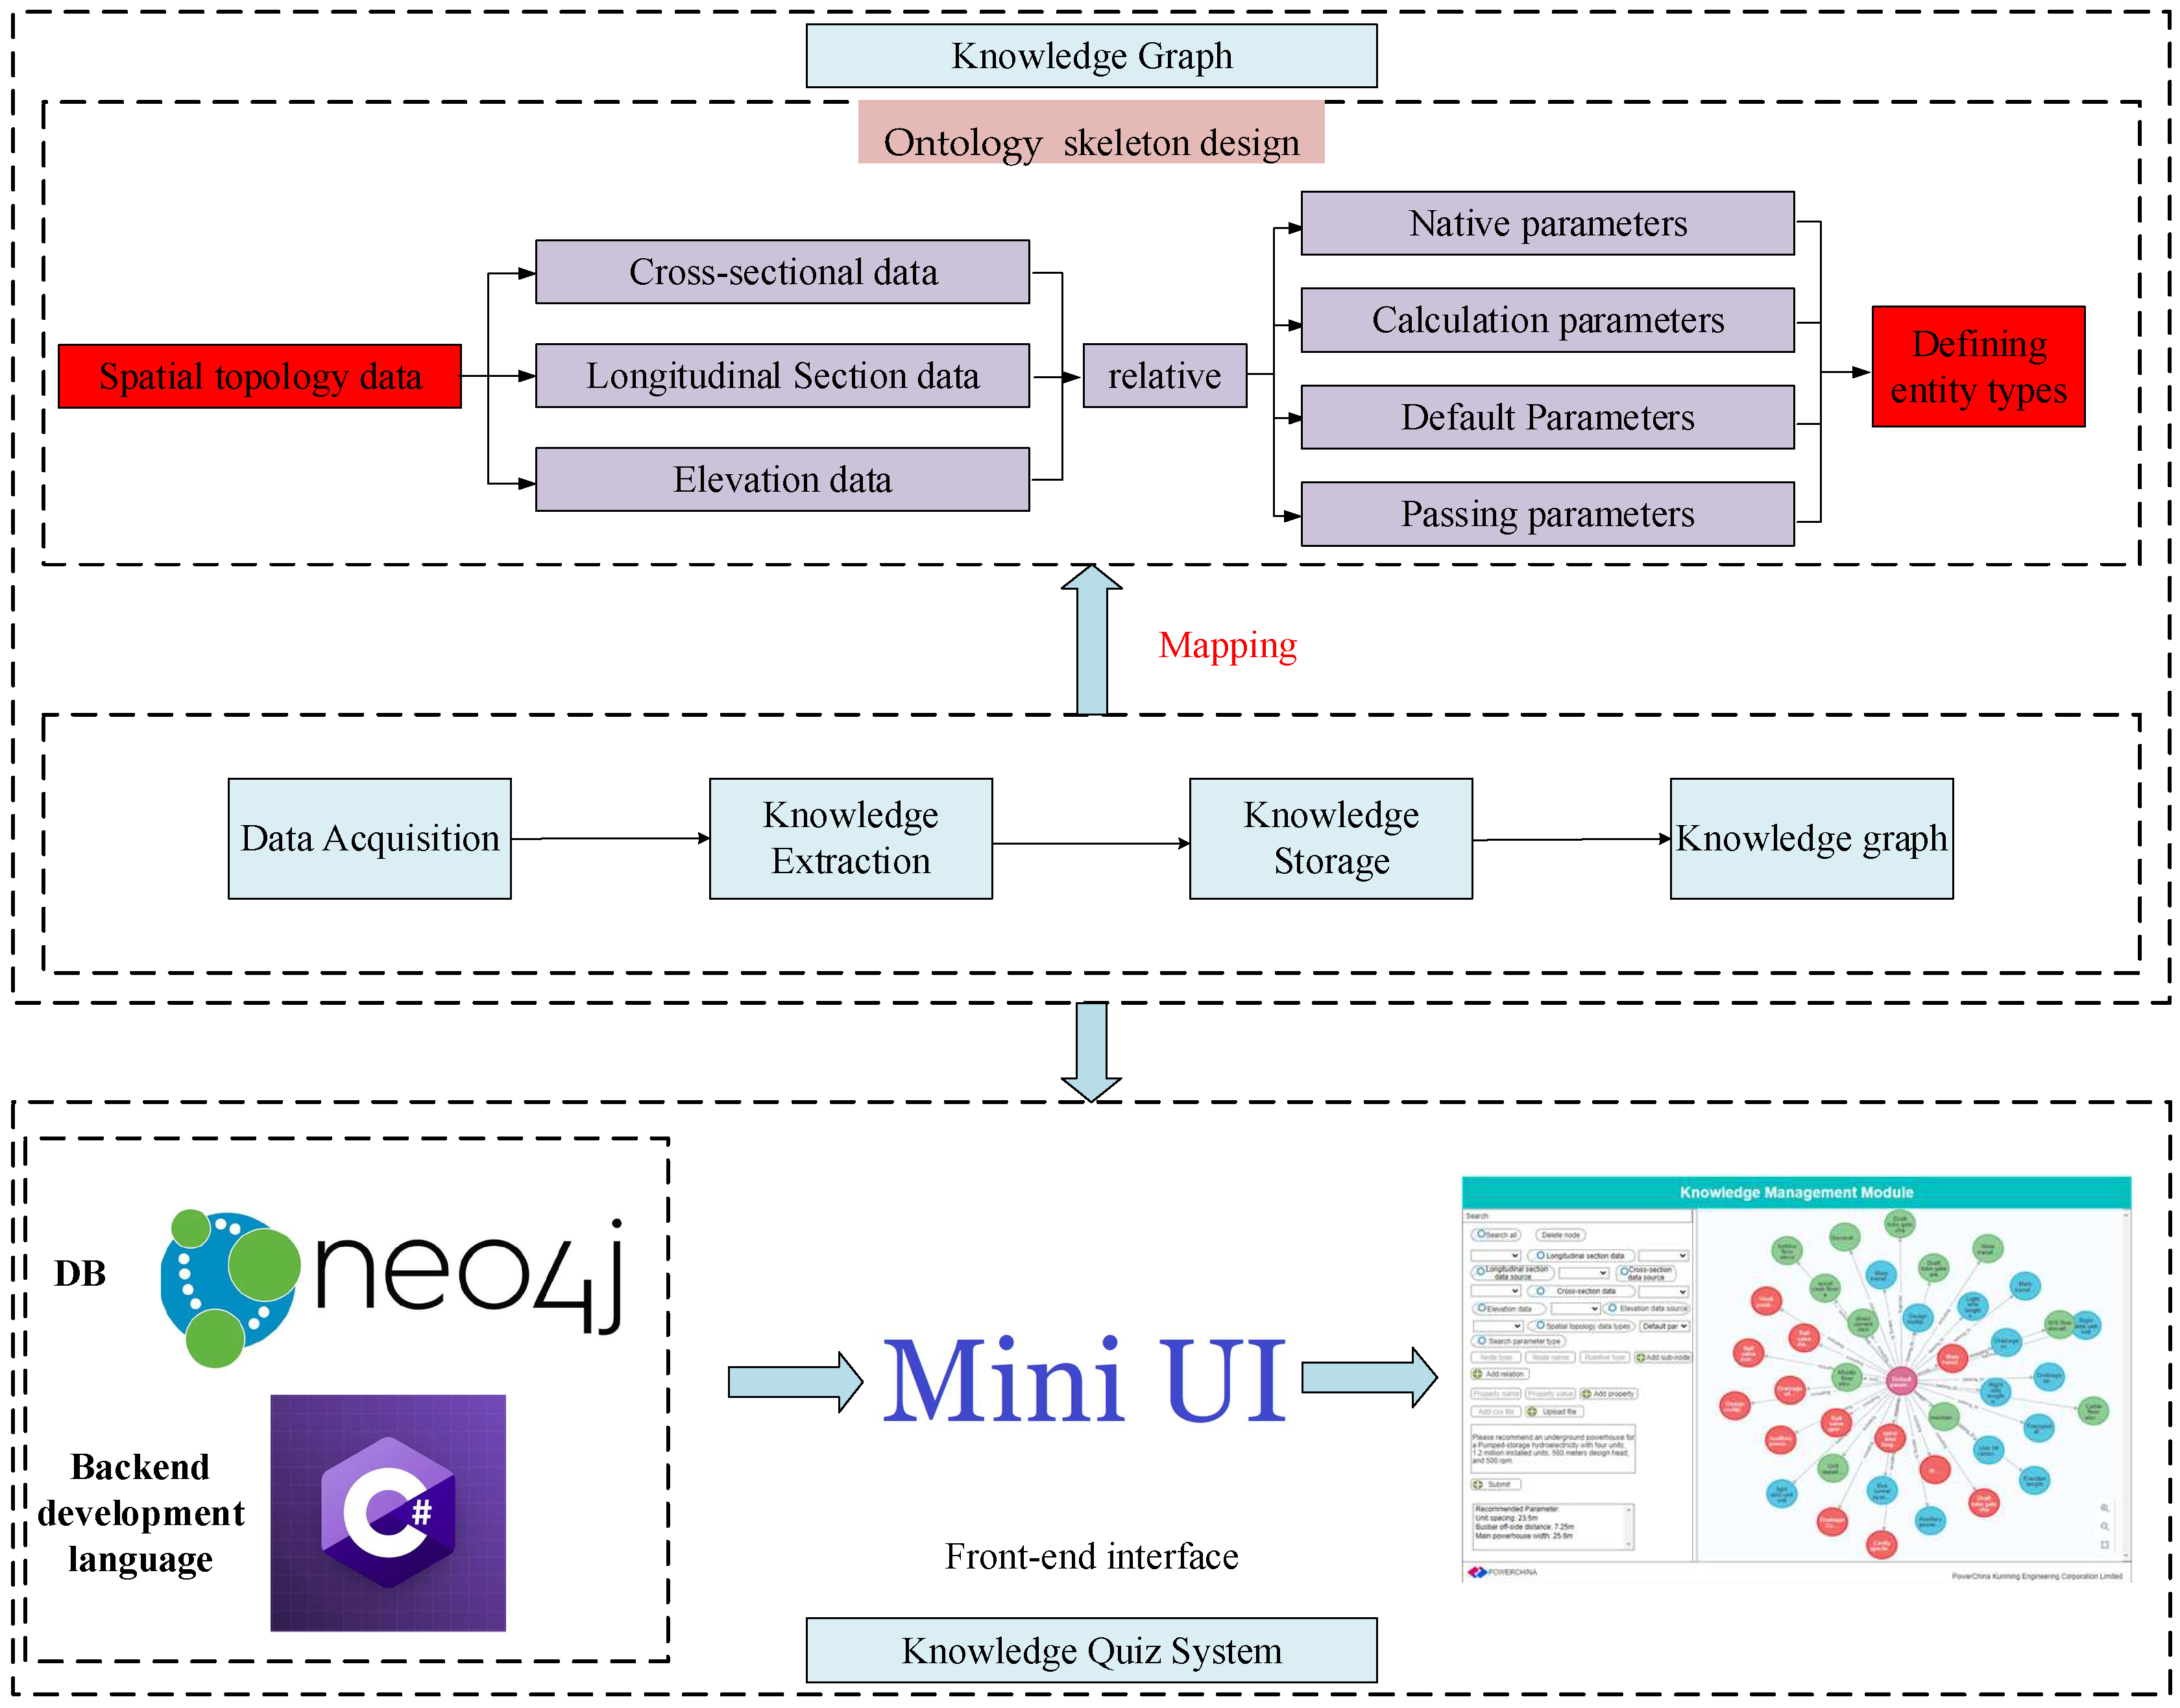
In this paper, a new concept of constructing a knowledge graph of the spatial arrangement of underground powerhouses is proposed to solve the problems of difficult knowledge acquisition and low information retrieval efficiency in the process of intelligent modeling for underground powerhouses. The process of constructing the knowledge graph of the spatial arrangement of underground powerhouses for hydropower stations is as follows, as shown in
Figure 1.
(1) Ontology skeleton design: Analyze the demand for intelligent modeling of underground powerhouses and clarify what knowledge of underground powerhouse design needs to be acquired. According to the demand, reverse design the ontology skeleton of underground powerhouse BIM and determine which attributes and relationships need to be extracted.
(2) Data collection: Data collection includes standard specifications, design manuals, design cases and other relevant textual information.
(3) Knowledge extraction: OCR technology is utilized to identify and preprocess a substantial volume of unstructured text data, ensuring its standardization. A thesaurus is constructed, and ChatGPT is employed for text data analysis and triad extraction. Through this process, knowledge related to the spatial arrangement of underground powerhouses is extracted.
(4) Knowledge storage: store the extracted underground powerhouse design knowledge into the Neo4j knowledge base and build a knowledge graph.
(5) Service-oriented application: The knowledge graph is serviced to form a set of intelligent modeling question and answer systems (QASs) for underground powerhouses, which provides designers with a convenient way to acquire and query knowledge.
Through the above steps, a set of comprehensive and accurate knowledge graphs of the spatial arrangement of underground powerhouses can be constructed and applied to the process of intelligent modeling for underground powerhouses to provide the spatial arrangement and geometric Information.
2.2. Constructing the Domain Ontology skeleton Layer
An important part of constructing the knowledge graph is construction of ontology skeleton. The ontology skeleton is the knowledge organization structure of the knowledge graph, which is the data model for describing entities, inter-entity relationships, and attributes in the domain. An ontology skeleton can provide a shared semantic model that enables different systems and applications to understand and interactively use the information in the knowledge graph.
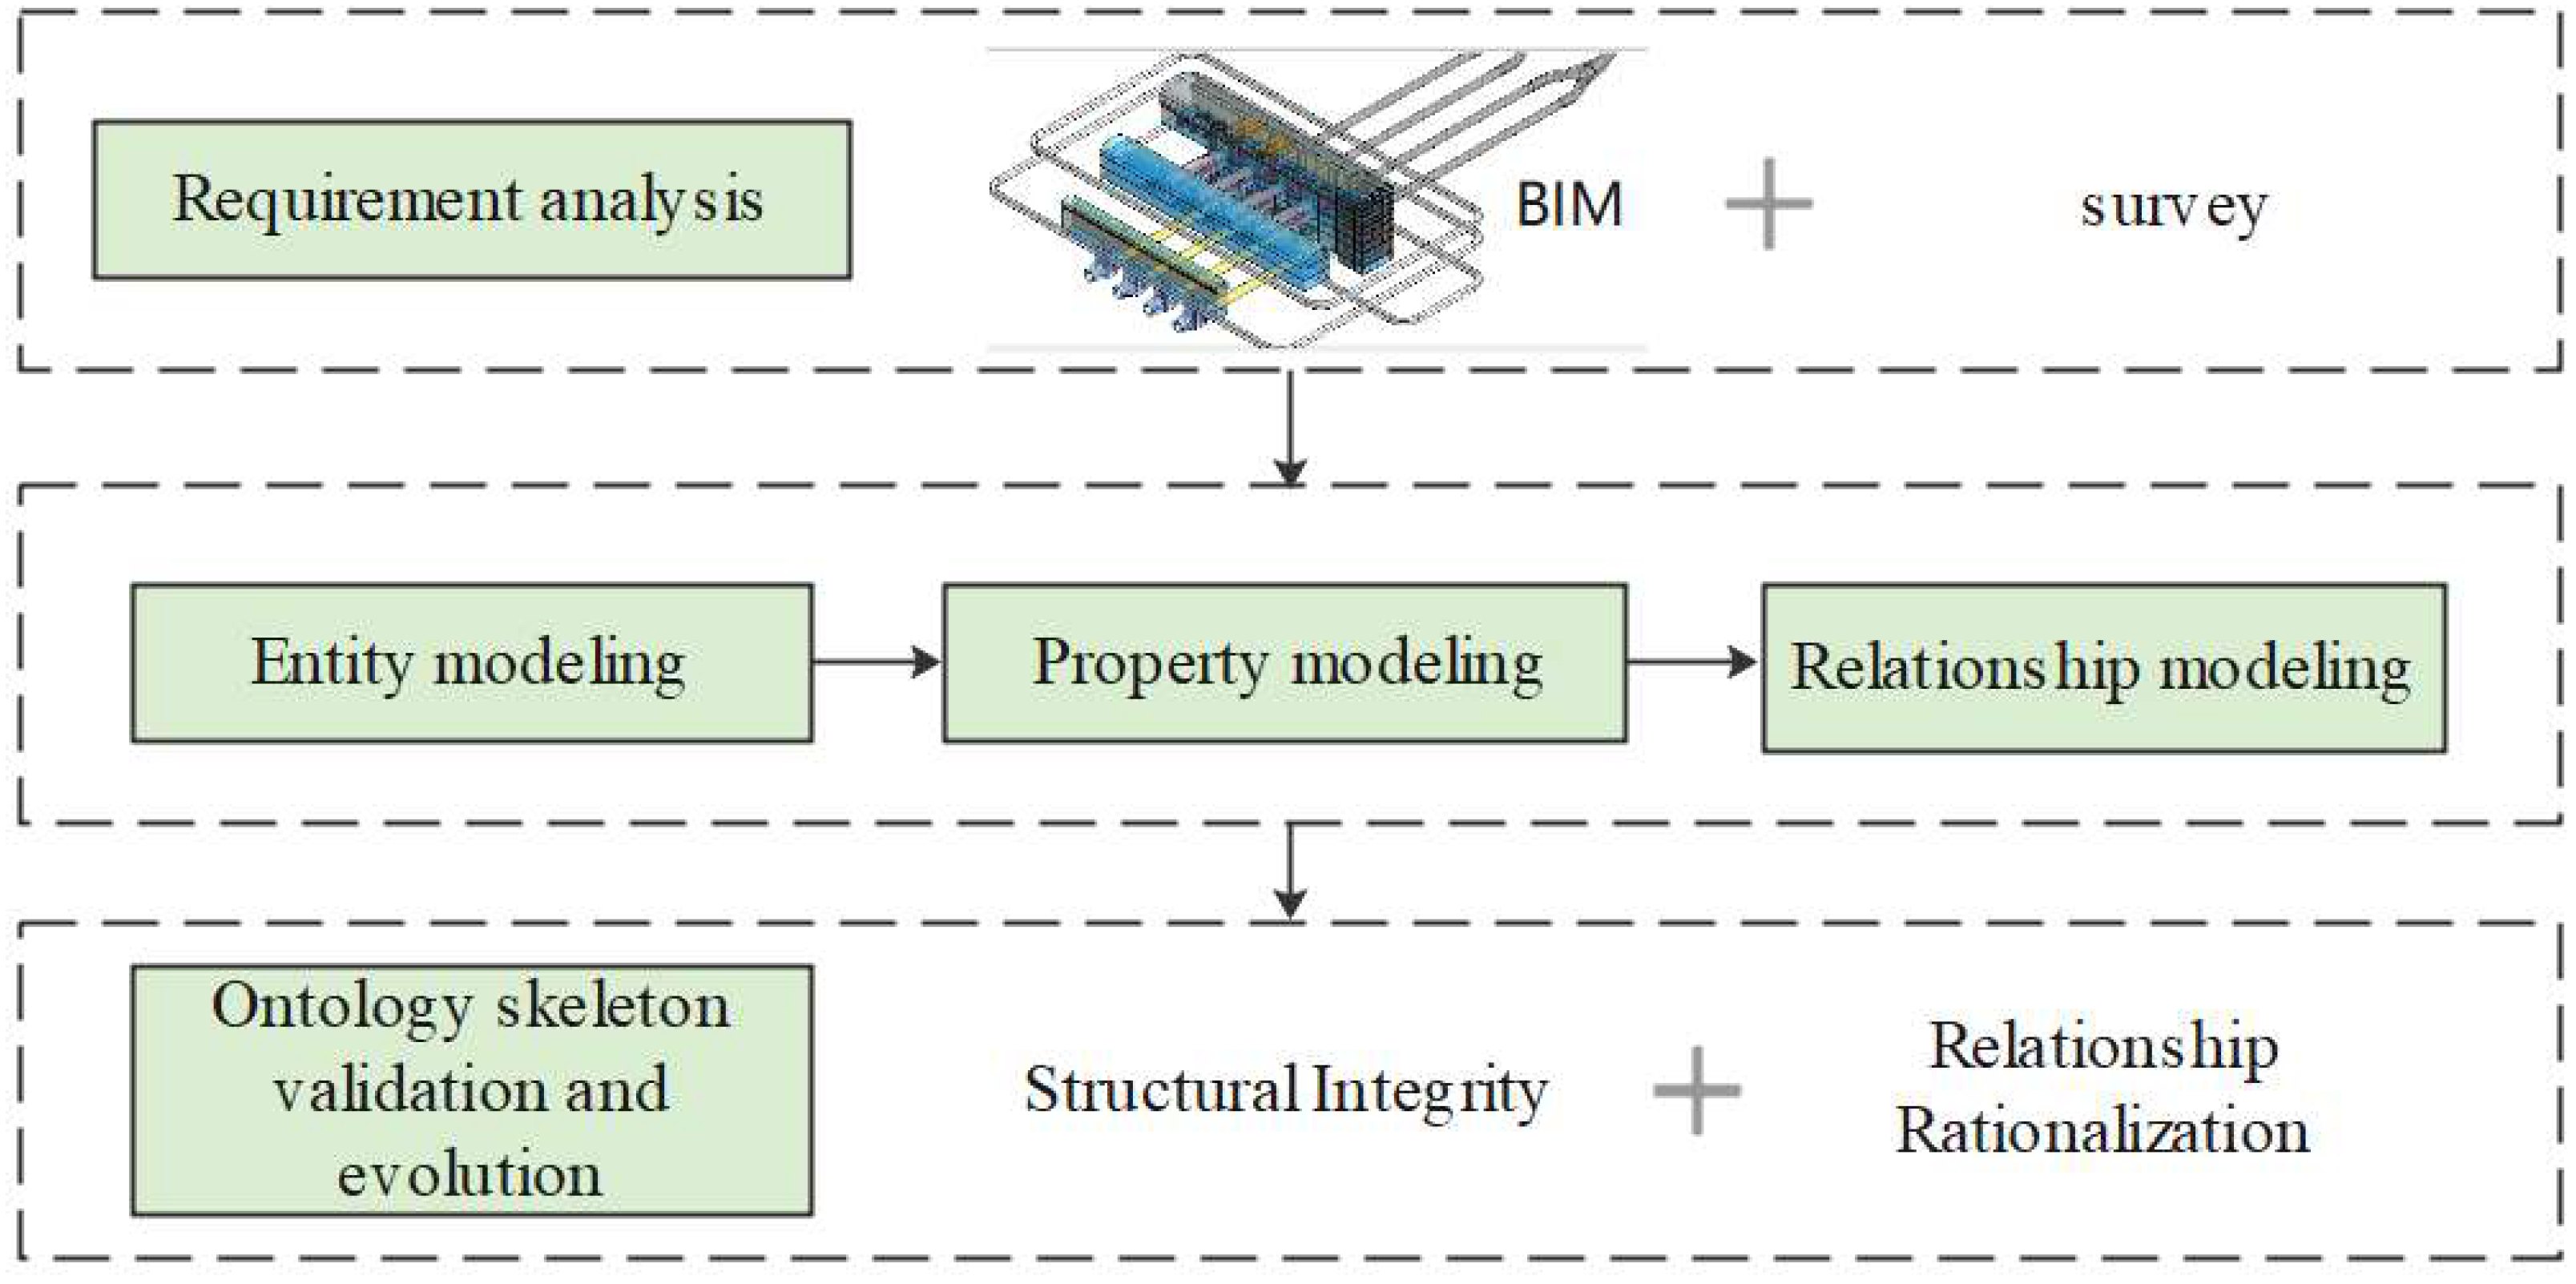
Figure 2 illustrates the process of constructing the ontology skeleton, which is a fundamental step in building a knowledge graph. This process generally encompasses the following steps:
(1) Requirement analysis: Determine the objectives and application scenarios of the knowledge graph. This includes identifying the entities, properties, and relationships that need to be modeled, as well as defining the purpose of the knowledge graph and the expected query requirements.
(2) Entity modeling: Based on the requirement analysis, define the entity categories and hierarchical structure within the knowledge graph. This can be achieved by identifying the properties and relationships of the entities, and assigning unique identifiers to entity categories.
(3) Property modeling: Define the properties of entity categories and determine the data types and constraints for each property. Properties can include various types of data such as text, numeric values, dates, etc.
(4) Relationship modeling: Define the relationships between entities and their characteristics. This involves determining the types, directions, and multiplicities of relationships (e.g., one-to-one, one-to-many, or many-to-many relationships).
(5) Ontology skeleton validation and evolution: Validate the constructed ontology skeleton to ensure that it meets the requirements and accurately describes the entities, properties, and relationships within the knowledge graph. As the knowledge graph evolves and requirements change, the ontology framework may need to be evolved and updated.
2.3. Constructing the Data Layer
The construction of the data layer is mainly divided into three steps: knowledge extraction, knowledge fusion, and knowledge updating. Among them, knowledge extraction obtains structured knowledge such as entities, inter-entity relationships, and attributes from nonstructured data through a series of knowledge extraction methods under the guidance of the knowledge skeleton of the domain ontology schema layer; knowledge fusion performs entity disambiguation and core-reference disambiguation processes on the entities obtained from knowledge extraction [
26,
27]; knowledge updating is mainly reflected in two aspects: one is the knowledge relationship in the knowledge graph in the process of continuous updating, and the second is the process of continuous revision by evaluating the quality of knowledge in practical applications [
28]. At present, there is a lack of research on knowledge graphs in the field of the spatial arrangement of underground powerhouses for hydropower plants, the relevant domain thesaurus is not sound, and the human and material costs of using algorithms to label data are high. In response to the above problems, this paper proposes a new concept of building a knowledge graph of the spatial arrangement of underground powerhouses specifically including professional thesaurus establishment, relevance extraction, and knowledge extraction.
2.3.1. Constructing Professional Thesaurus
The purpose of domain lexicon construction is to better extract the triadic information in the specification. Professional terms are subject to interpretations by different people, different backgrounds and different experiences. For example, for professional terms such as concrete gravity dam, compacted concrete gravity dam, pumped-storage hydropower plant, and dam site planning, the conventional knowledge extraction methods cannot extract the professional terms correctly, so the domain professional terms need to be constructed. The process of constructing domain terminology is divided into two parts: data acquisition and thesaurus construction.
(1) Data acquisition method
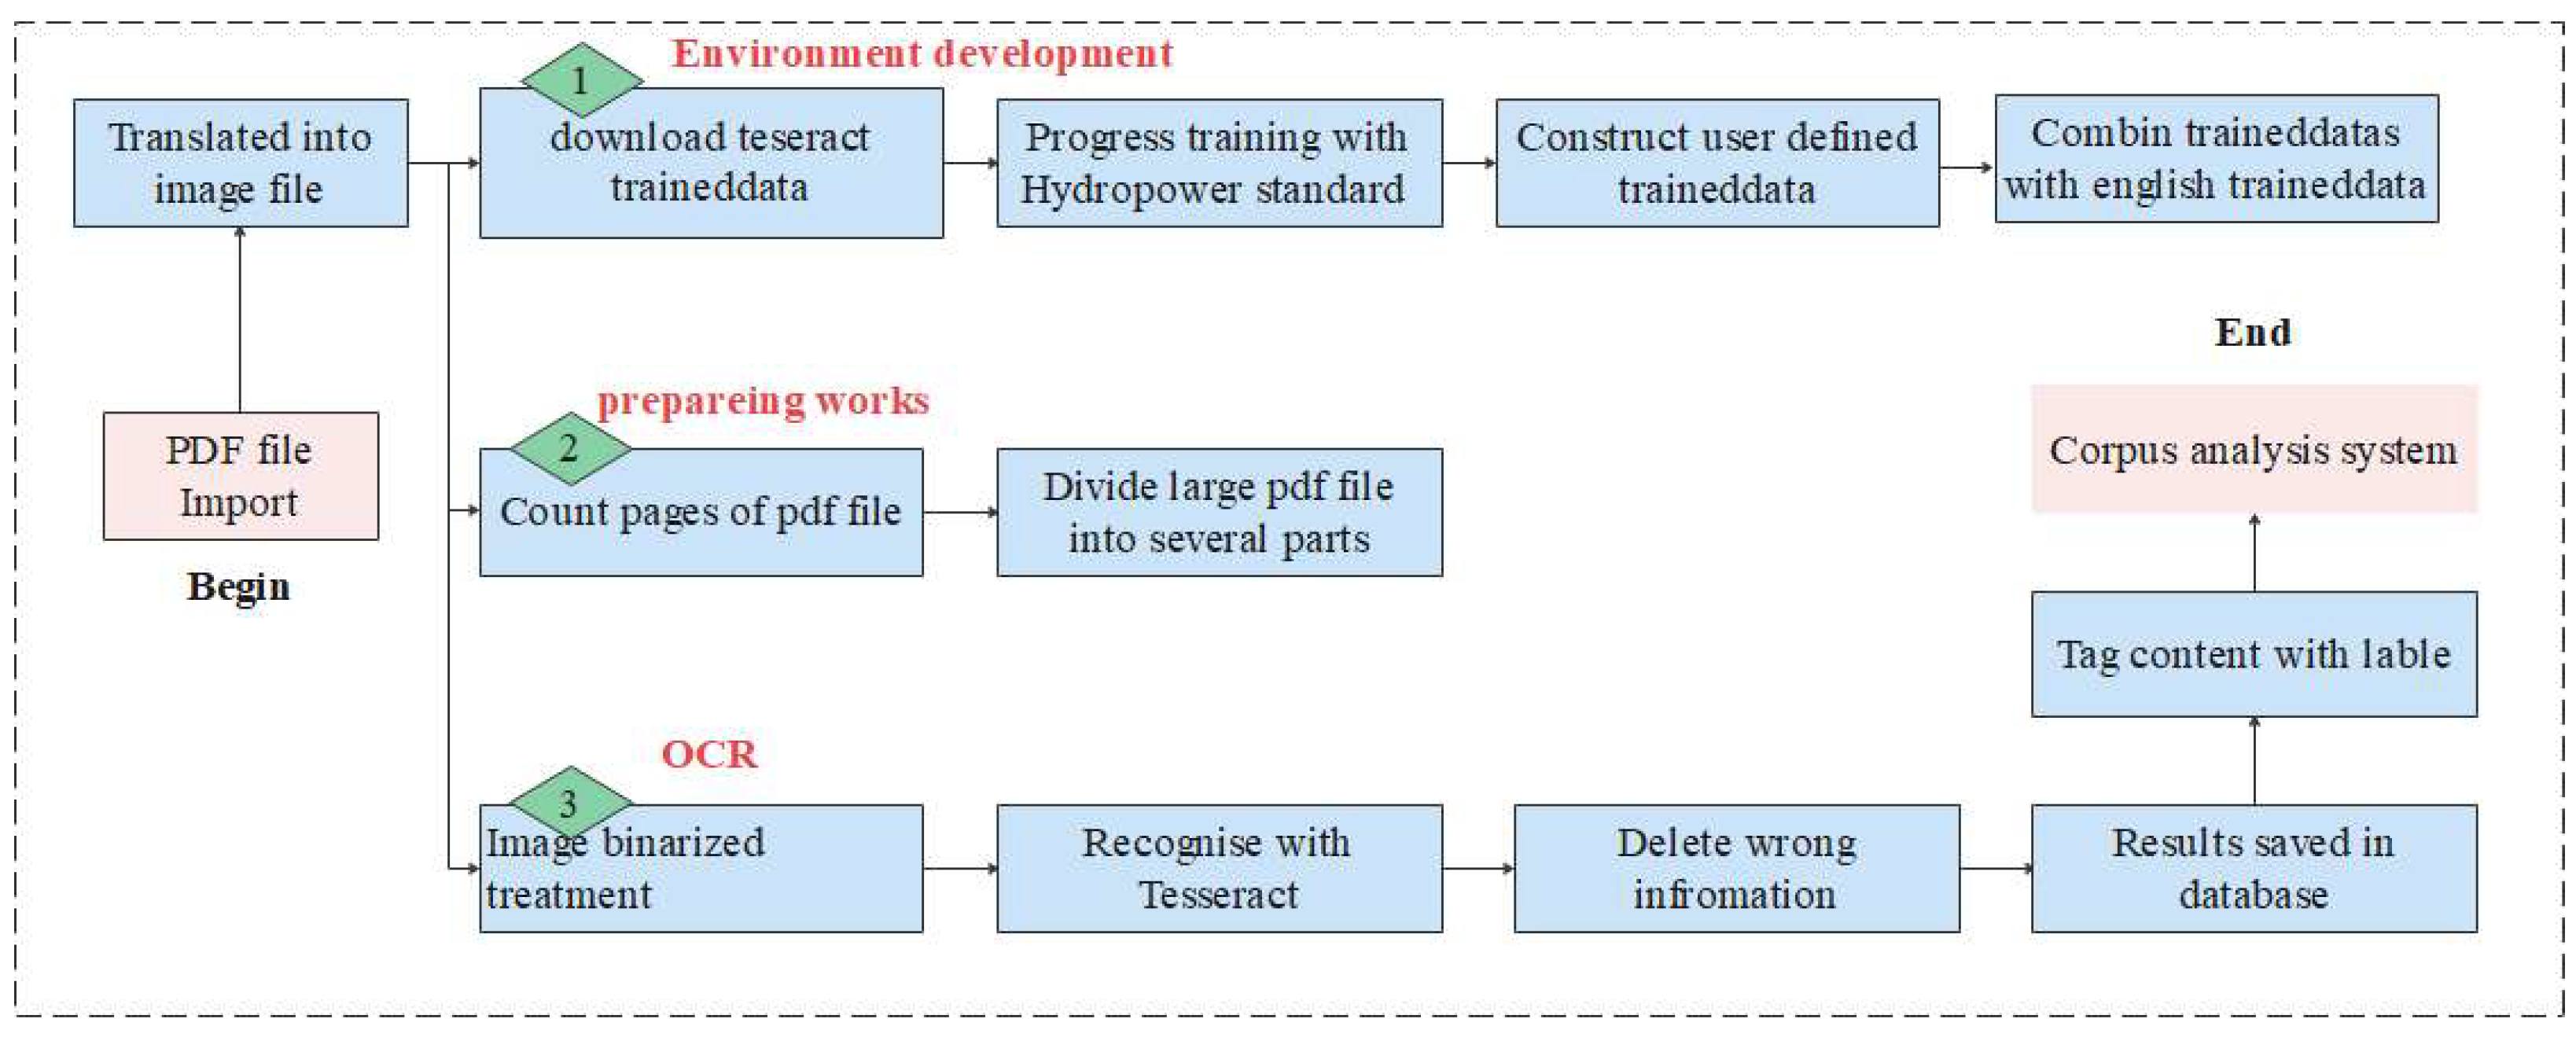
Underground powerhouse design specifications usually exist in the form of PDFs, and to obtain these text data, these documents need to be extracted from PDF files. OCR is a commonly used text extraction method [
29]. The whole text extraction process requires the generation of PDF files into image files, and in the OCR recognition technology, the images are recognized into text, and the whole process is identified in batches, which reduces the time of manual extraction and improves the extraction efficiency. The text can be processed during the extraction process using algorithms, and the text becomes more regular according to the formulated rules. The data acquisition process of the OCR is shown in
Figure 3.
(2) Building professional thesaurus
The commonly used process for a thesaurus building method has six parts: collecting corpus and literature, text preprocessing, extracting vocabulary, determining the authority and reliability of the vocabulary, organizing the vocabulary, and continuous updating and maintenance [
30]. In this study, starting from the demand for the construction of BIM models for hydropower plants, the ontological skeleton formed by the whole construction process will efficiently guide the construction of the professional thesaurus, and all the professional terms and terms involved in the construction process of BIM models for hydropower plants are incorporated into the professional thesaurus, which is continuously updated and maintained, and new terms are added and obsolete terms are deleted with the development and changes of the target field to ensure thesaurus accuracy and practicality.
2.3.2. Correlation Extraction
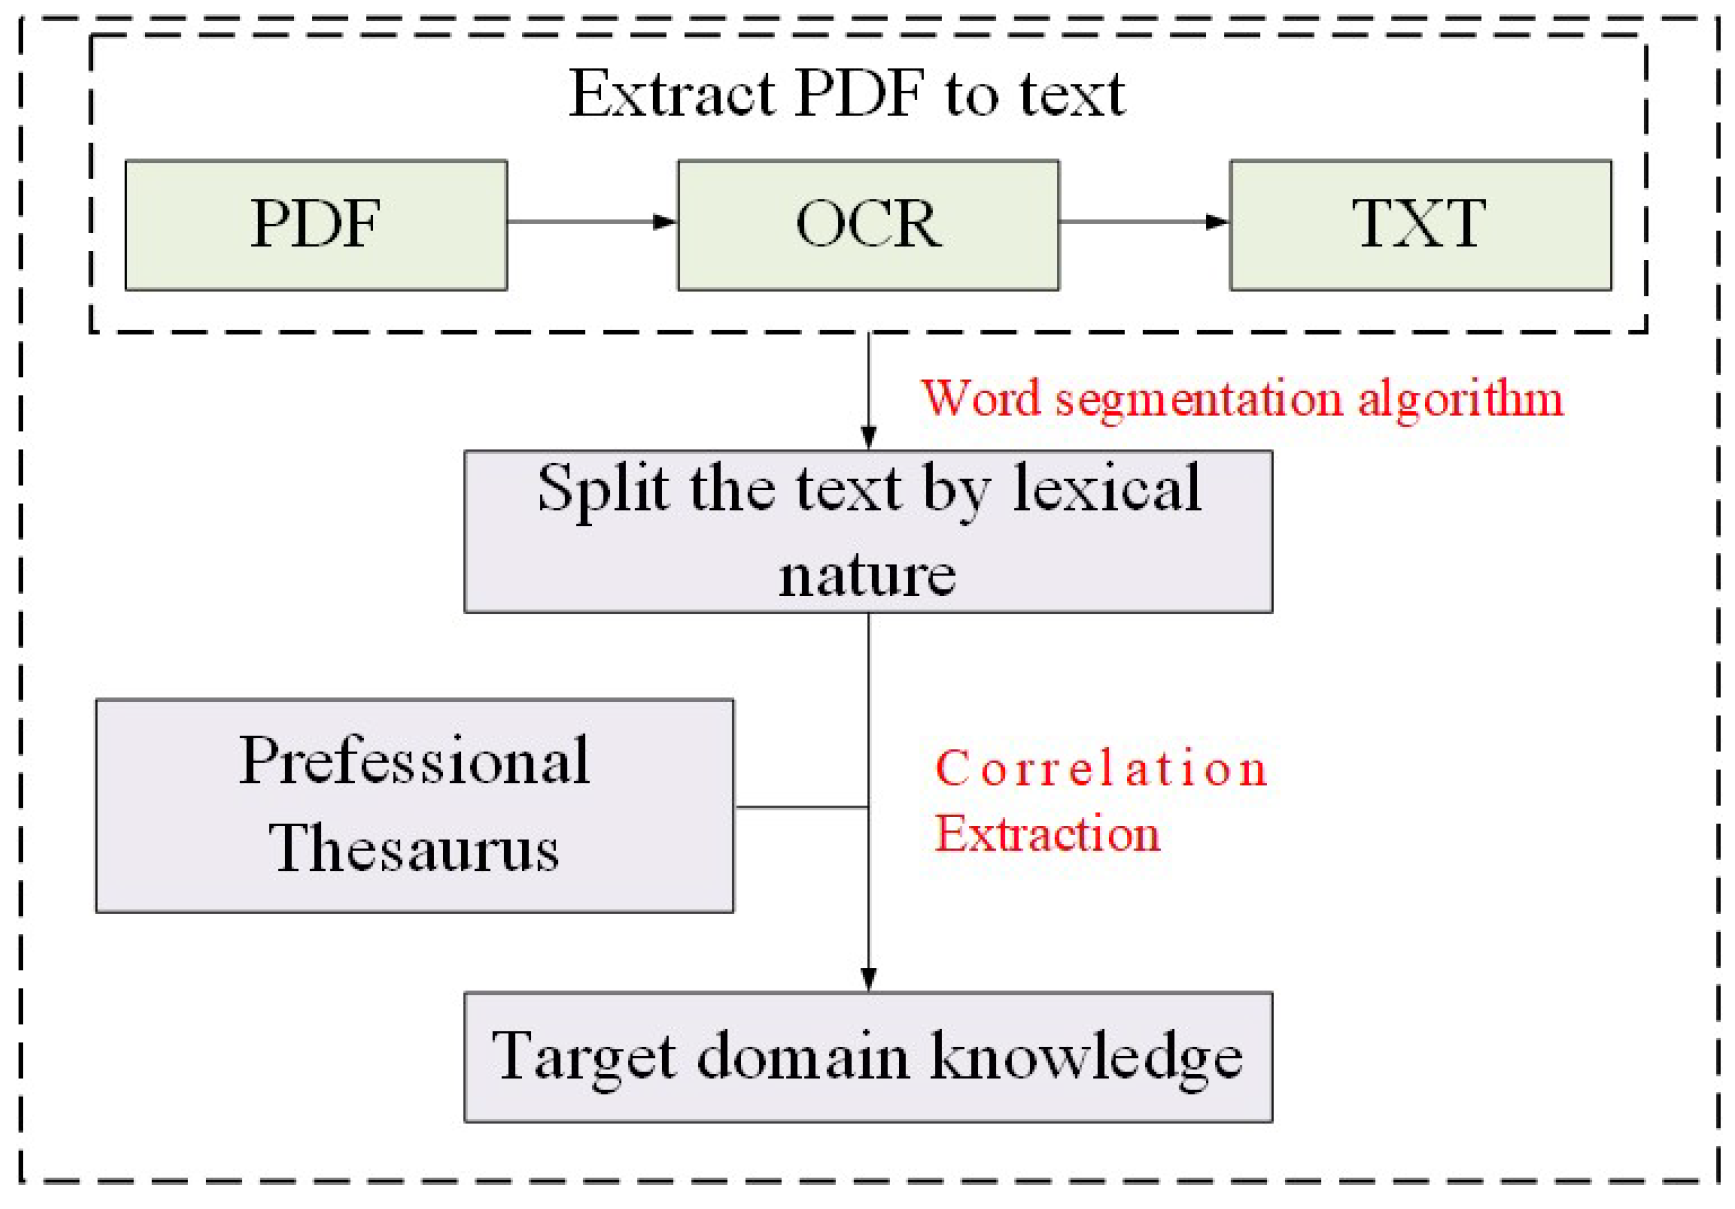
The purpose of relevance analysis is to extract the knowledge related to the target domain from the collected preponderance of information and to eliminate invalid content from the corpus information. The correlation extraction process is shown in
Figure 4. The common word segmentation algorithms include Jieba, SnowNLP, the THU Lexical Analyzer for Chinese (THULAC), language technology platform (LTP), and HanNLP.
(1) Jieba: Jieba is the best Python Chinese word splitting component that supports exact mode, full mode, and search engine mode and supports traditional word splitting and custom dictionaries. Jieba actually splits words by dictionary and then uses the HMM algorithm to identify new words that are not in the dictionary [
31].
(2) SnowNLP: SnowNLP is a class library written in Python that facilitates the processing of Chinese text content. In addition to word separation, SnowNLP can also perform tasks such as lexical annotation, sentiment analysis, and text classification [
32].
(3) THULAC: Highly capable, it is trained with the world's largest manual word separation and lexical annotation Chinese corpus (containing approximately 58 million words), and its model annotation capability is powerful. The accuracy rate is high [
33].
(4) LTP: LTP is a Chinese language processing system open-sourced by HIT, covering word separation, lexical annotation, and named entity recognition, based on a structured perceptron that models the score function of the annotated sequence Y in the case of the input sequence X with the maximum entropy criterion [
34].
(5) HanNLP: HanNLP is a multilingual word splitter that uses CRF model word splitting, indexed word splitting, and N-shortest path word splitting [
35].
Phrase splitting is the first step of natural language processing, which can divide a piece of text into semantically meaningful words or graphemes and provide a semantic basis for subsequent natural language processing tasks. At the same time, these words or graphemes can be searched to better enable text retrieval and matching and to quickly capture key textual knowledge. A good word separation method helps to extract valid information and improve efficiency and accuracy. An analysis of the effectiveness of the above five word separation methods is shown in 3.2.
2.3.3. Domain Knowledge Extraction
Knowledge extraction is a series of knowledge extraction methods used to obtain structured knowledge such as entities, inter-entity relationships and attributes from un(semi)structured data under the guidance of a schema-level knowledge organization architecture. The data obtained in this study are all textual data, i.e., unstructured data, and require knowledge extraction to convert them into structured data. Commonly used knowledge extraction methods are rule or domain dictionary methods [
36], which require constructing and maintaining a domain dictionary with the help of domain experts and then writing a large number of rule templates by hand for knowledge extraction. However, the applicability of rule templates is limited, and it is difficult to adapt to the complex language environment and the practical application needs of changing forms. Based on the deep learning approach [
37], the method has better adaptive ability and more efficient accuracy for knowledge extraction, but there is still a problem of difficulty in producing the dataset. To address the above problems, the characteristics of the current domain of the study are combined with the domain specialized lexicon and the deep learning algorithm, i.e., the combination of the specialized lexicon and ChatGPT is implemented to extract knowledge.
This study uses ChatGPT to extract knowledge, and ChatGPT extracts triads with the following advantages.
(1) Automation: ChatGPT is an automated model that can handle a large amount of text data and quickly extract the triad information from it and automatically transcribe it into Cypher statements to pass into Neo4j to create the model automatically, thus saving the time and cost of manual processing.
(2) High accuracy: ChatGPT has powerful natural language processing capability to accurately identify and extract entities, attributes and relationships in text, which improves the accuracy of triad extraction.
(3) Wide applicability: ChatGPT can handle text data from different domains and languages and can automatically adjust the extracted triad information according to the context, so it is widely applicable.
(4) Scalability: ChatGPT is a scalable model that can be trained with more data to improve the accuracy of extracted triples and can be extended by adding more rules and features.
As the extracted knowledge triples are more regular, but the triples provided by ChatGPT are not regular. In practice, we found that ChatGPT can output knowledge triples according to the given pattern. Based on its language understanding capabilities, ChatGPT is utilized to extract useful information from the given text. Before extracting knowledge triplets using ChatGPT, we need to instruct ChatGPT to output knowledge triplets according to certain rules. Therefore, we need to provide the rules to ChatGPT, and the process of ChatGPT learning these rules is referred to as the pre-training process. Firstly, the knowledge triads are manually extracted from the knowledge text and provided to ChatGPT for learning. This enables ChatGPT to generate triads according to the predefined rules. The pretraining process is illustrated in
Figure 5. During pretraining, the questions and answers are inputted together, and through iterative training with diverse datasets, ChatGPT acquires the ability to learn the underlying rules and achieve the intended objectives. For example, the knowledge triad for "The sub-powerhouse layout is arranged at one end of the main plant and the main transformer room" is "sub-powerhouse", "is arranged at", "one end of the main plant and the main transformer room ".
2.4. Design of QAS
The design of QAS includes front-end processing and recommendation methods. Front-end processing aims to realize front-end and back-end data interaction. The recommendation method aims to recommend an appropriate design scheme of spatial arrangement.
2.4.1. Knowledge Graph Front-end Processing
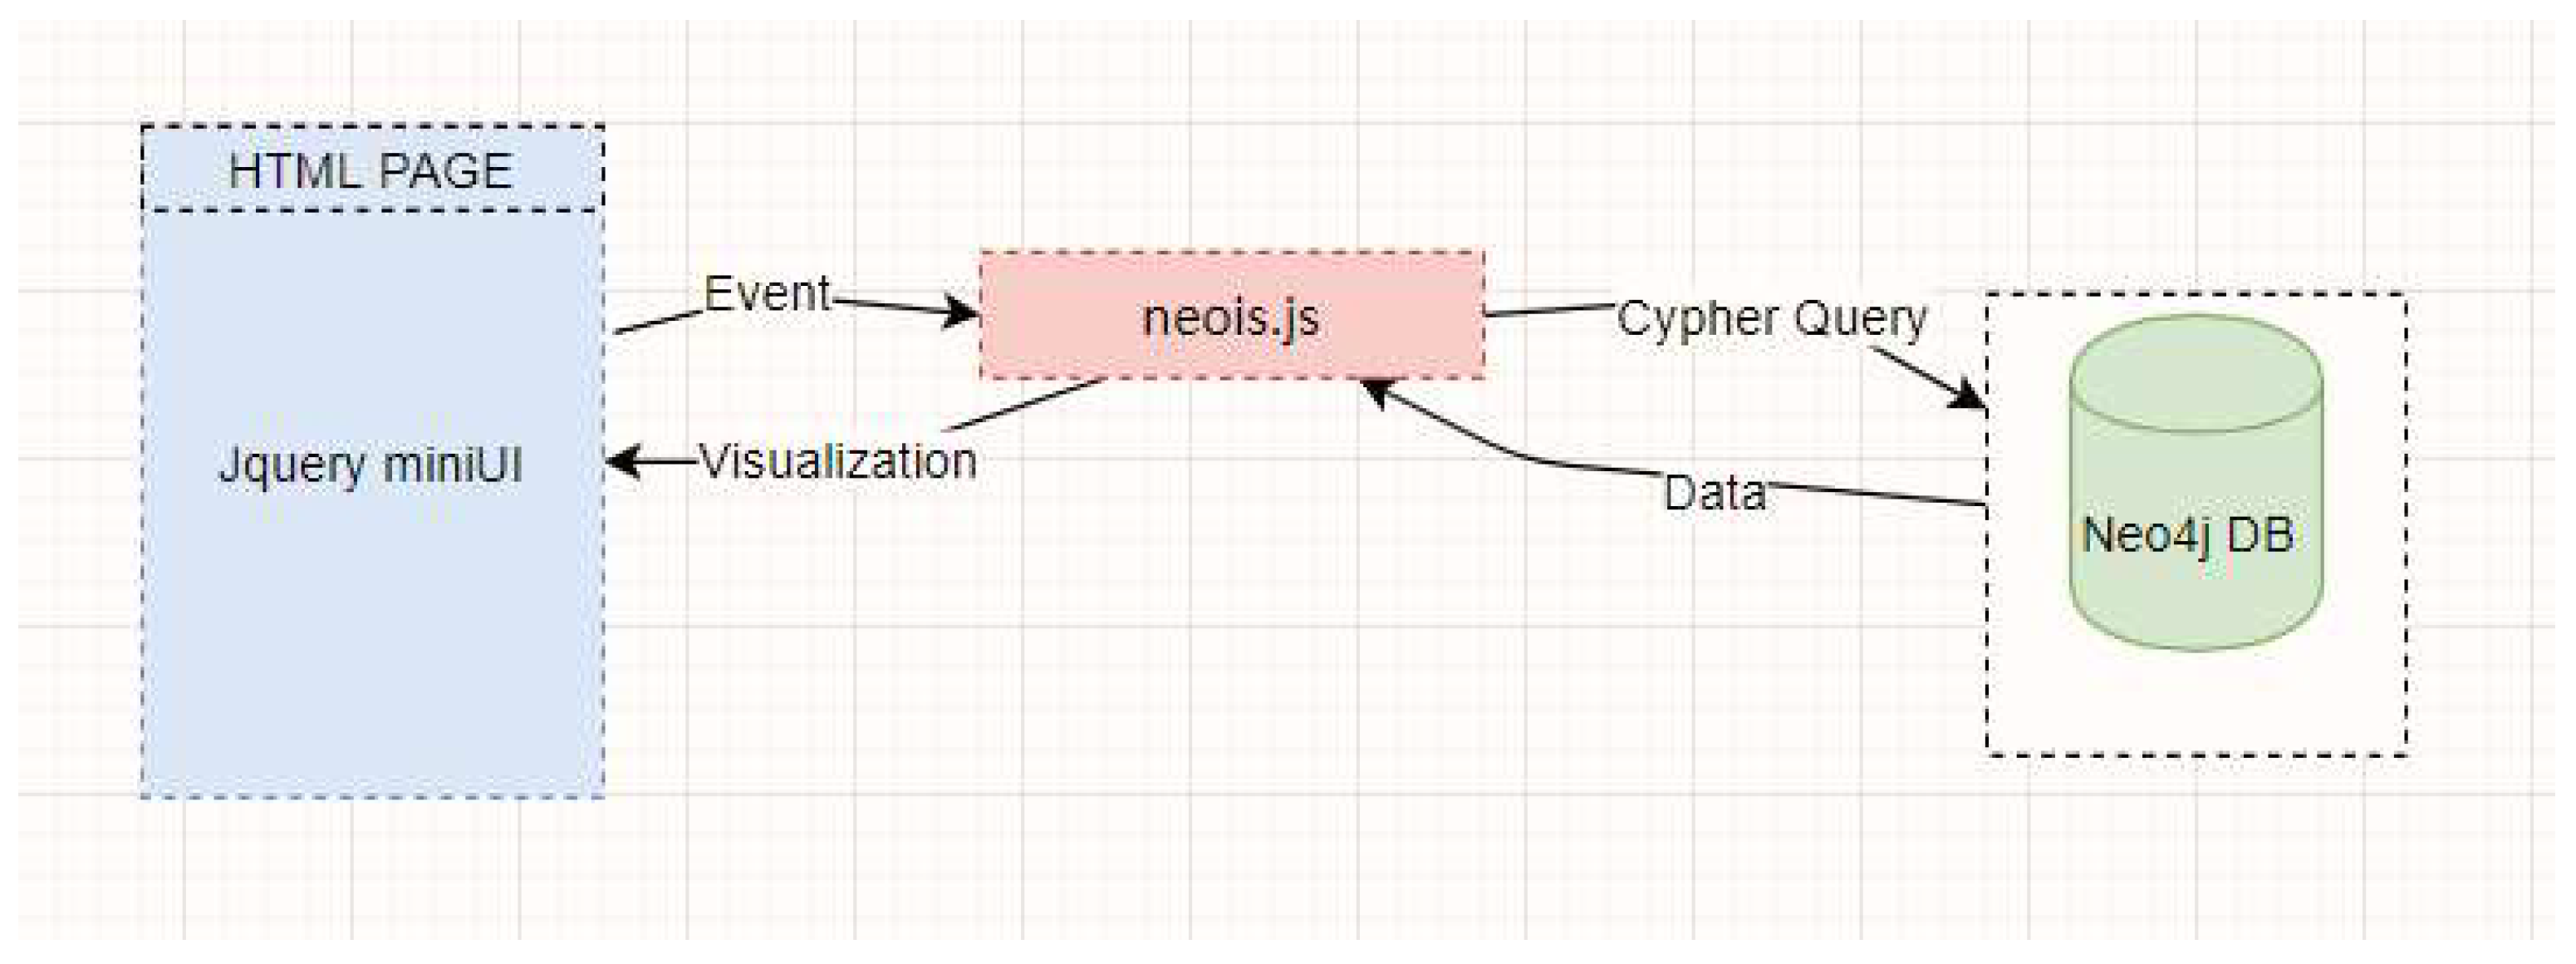
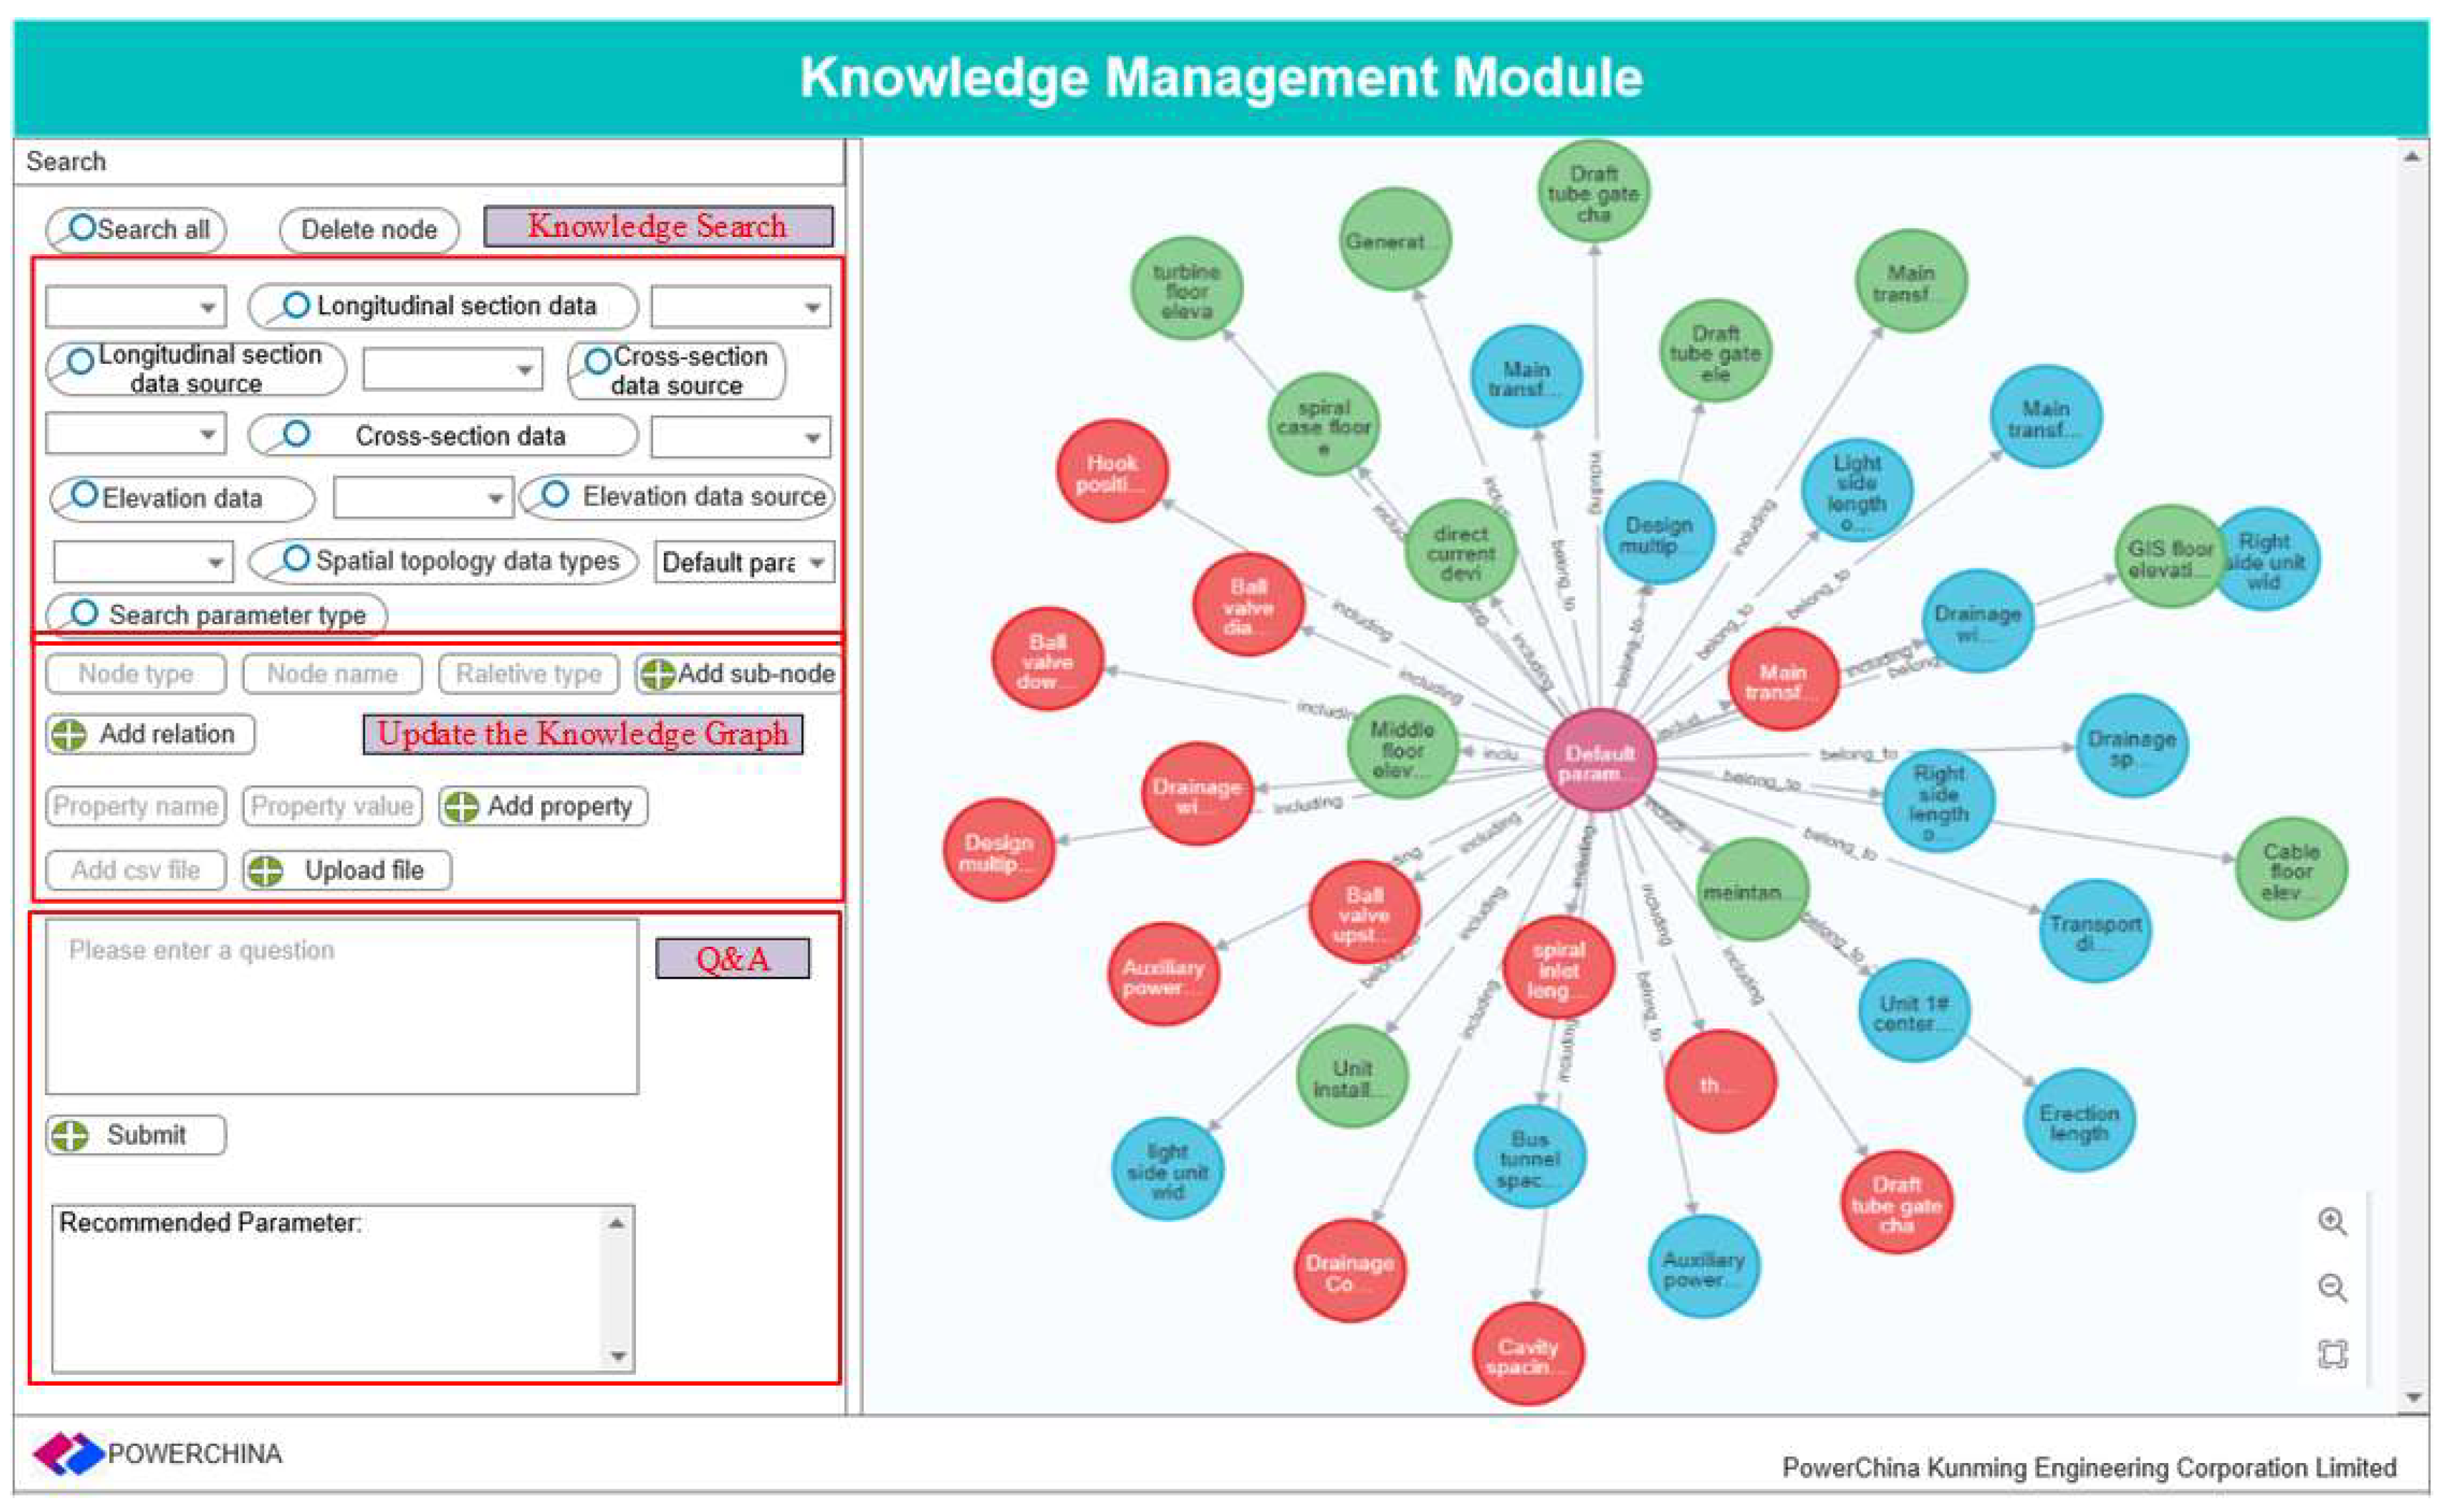
Neo4j, as a NOSQL graphical database, can support the use of query language. Cypher can be single or multiple node attributes and relationships for a retrieval and support clustering algorithm or centrality algorithm for data analysis. In data processing, Neo4j has the characteristics of high performance and stability to support enterprise-level data retrieval and can be used as a database (DB) for knowledge management. Following the principle of front- and back-end separation, from data applications in the front-end user interface (UI) to completion, Neo4j does not have an interface that can be called directly. In this paper, we use the open source Neois.js front-end visualization component to process Neo4J data and realize front-end and back-end data interaction.
The interaction process of data from the DB to the UI is shown in
Figure 6. The front-end display uses Jquery miniUI as the layout framework of the UI. It is used to process user input, respond to user requests, and initiate data queries. Its tabbed controls and uniform style can save considerable time for us to develop the front-end interface. Neois.js 1.5.0 is used to respond to user events and initiate Cypher queries based on demand organization. Neo4j data queries are performed to visualize the nodes, relations and attributes obtained from the queries.
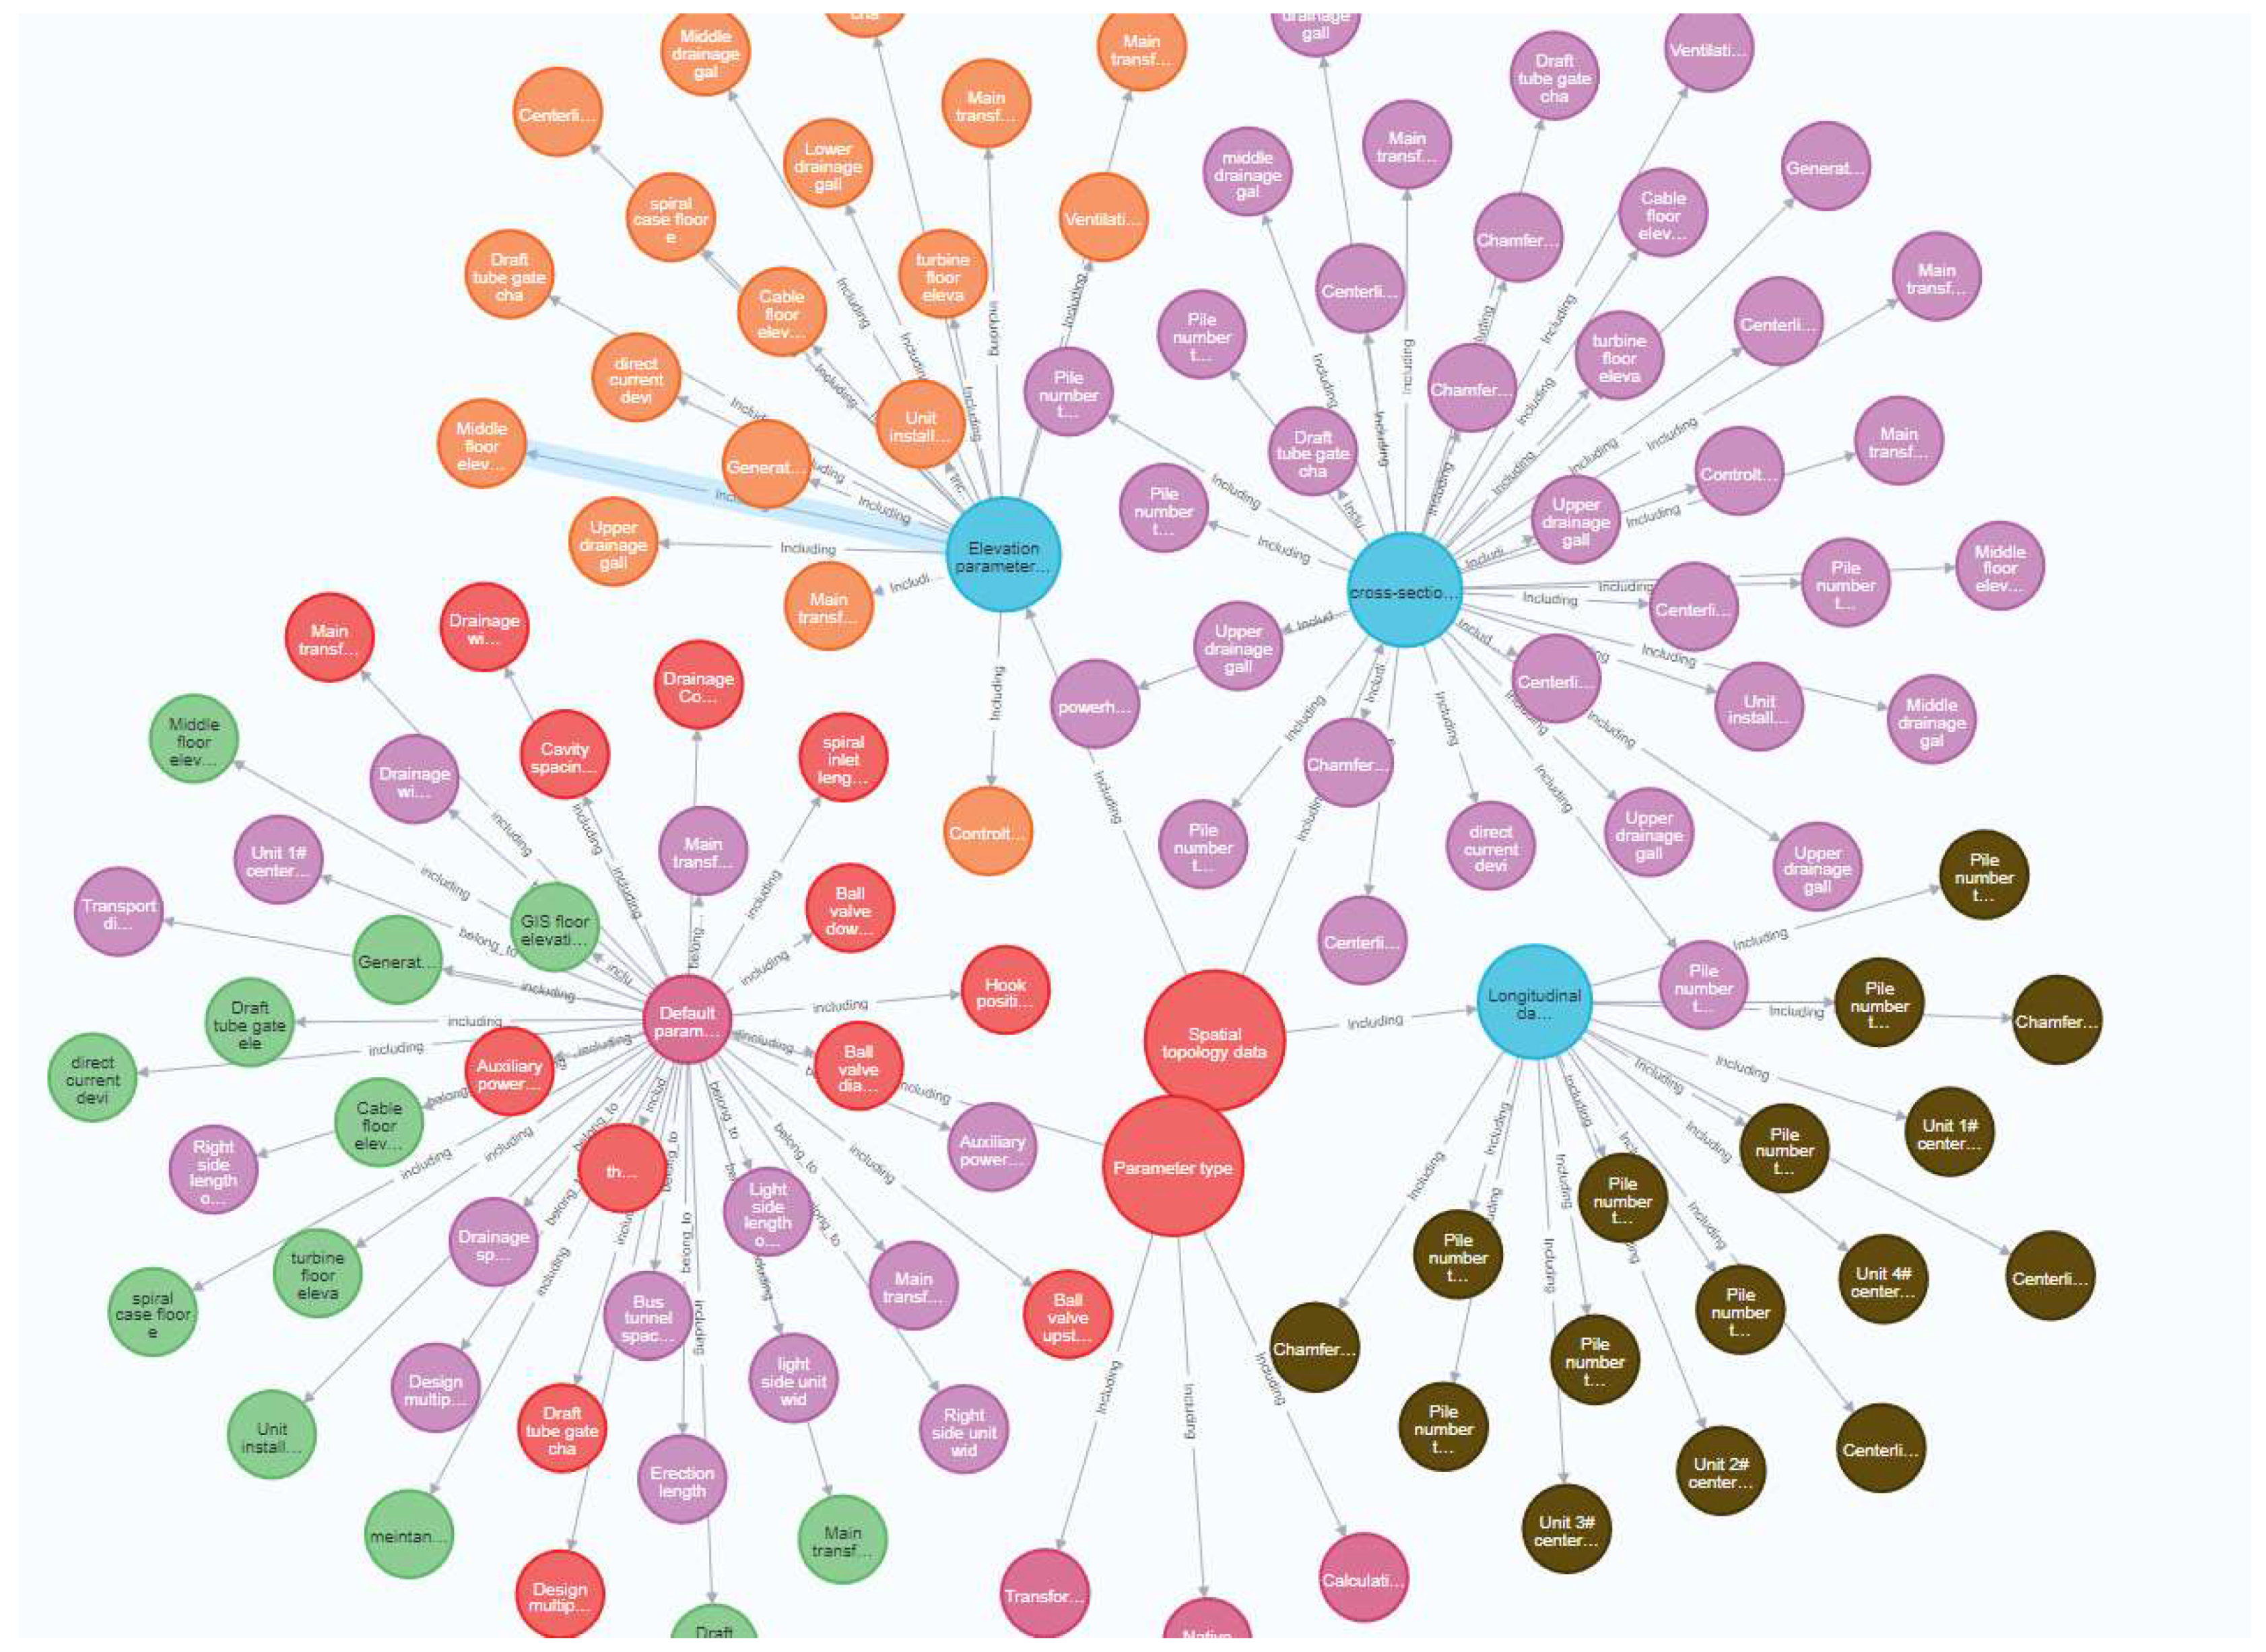
In terms of visualization, Neois.js has the advantages of being lightweight and supporting real-time scaling. In this paper, we use the UI interface design to extract all node names in the atlas in sections and use drop-down components to support user queries on the nodes. At the same time, Cypher statements are written into the control events in the query section to support users' senseless hierarchical queries. At the same time, it opens the function of adding nodes, relations and attributes and supports users to add knowledge graph contents directly at the front-end only by authorization.
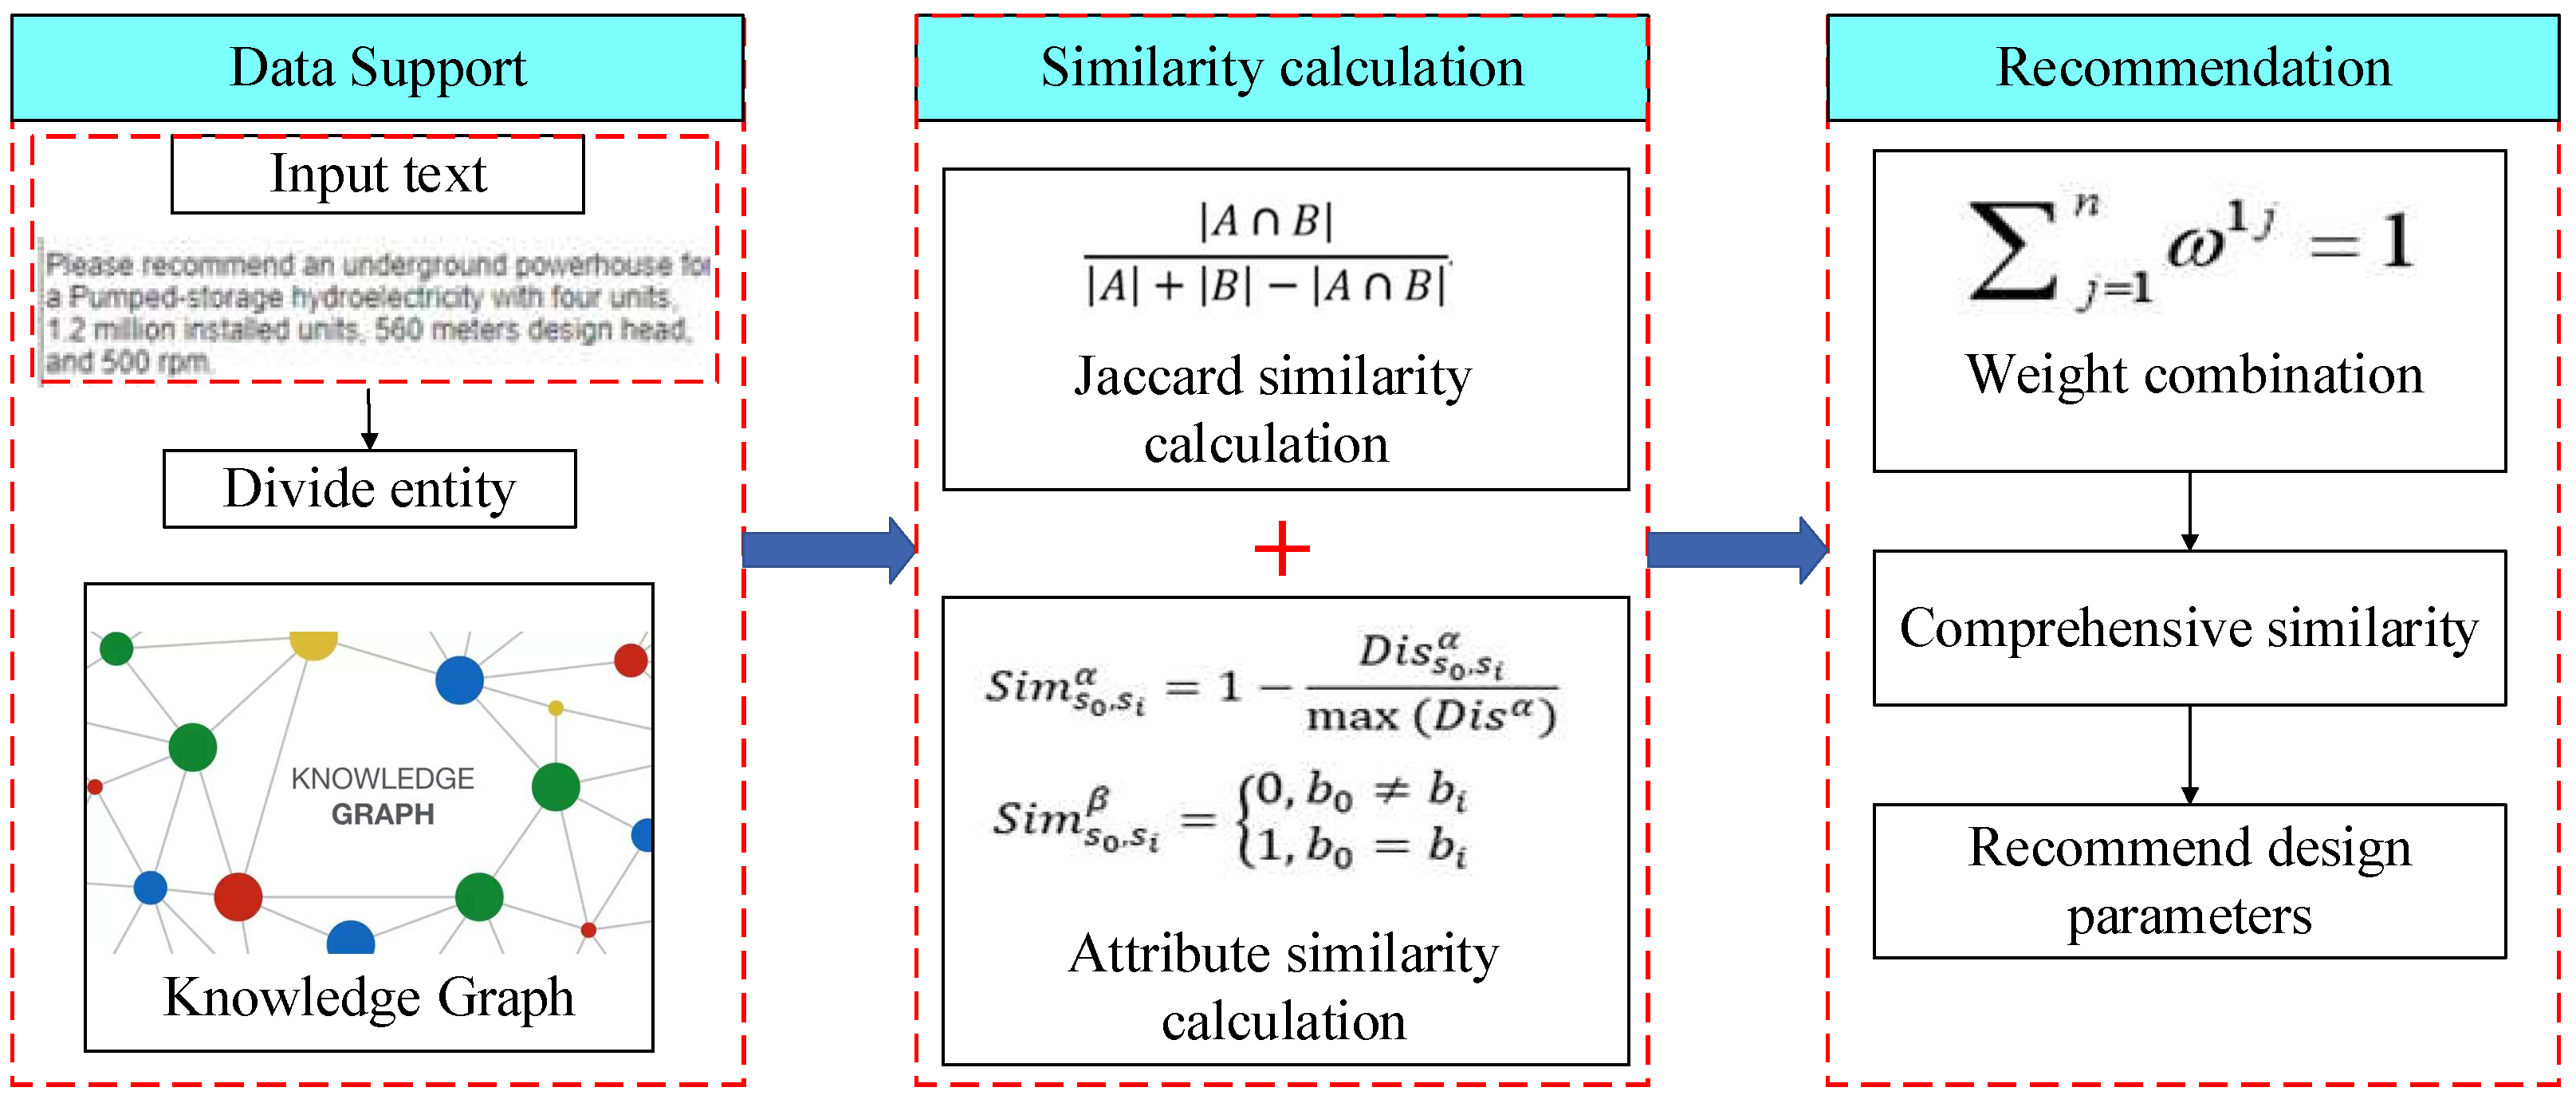
2.4.2. Recommendation Method Based on Similarity Calculation
Entity similarity calculation can be used to match the similarity of key features of the design scheme entities such as different conditions and parameters, which is the key to entity matching and parameter recommendation. The similarity calculation based on a knowledge graph calculates the similarity of entities and relationships of different design schemes from the knowledge graph. In this study, a similarity calculation method that combines attribute similarity and neighbor information similarity will be used. When a question corresponds to more than one entity in the same entity class, it is difficult for per-form attribute matching, so neighbor information matching is used. Other one-to-one entity class similarities are used for attribute matching. Therefore, the process of similarity calculation includes the Jaccard similarity calculation and attribute similarity calculation. The basic process is to obtain the key features of the design scheme, use the entity matching methods such as attribute matching and neighbor information (Jaccard) matching to calculate the entity similarity, then obtain the influence weight of each entity class by setting different weights combinations, and finally weight the calculation to obtain the comprehensive similarity of the design scheme by a search algorithm. The process of calculating the similarity of design schemes is shown in
Figure 7.
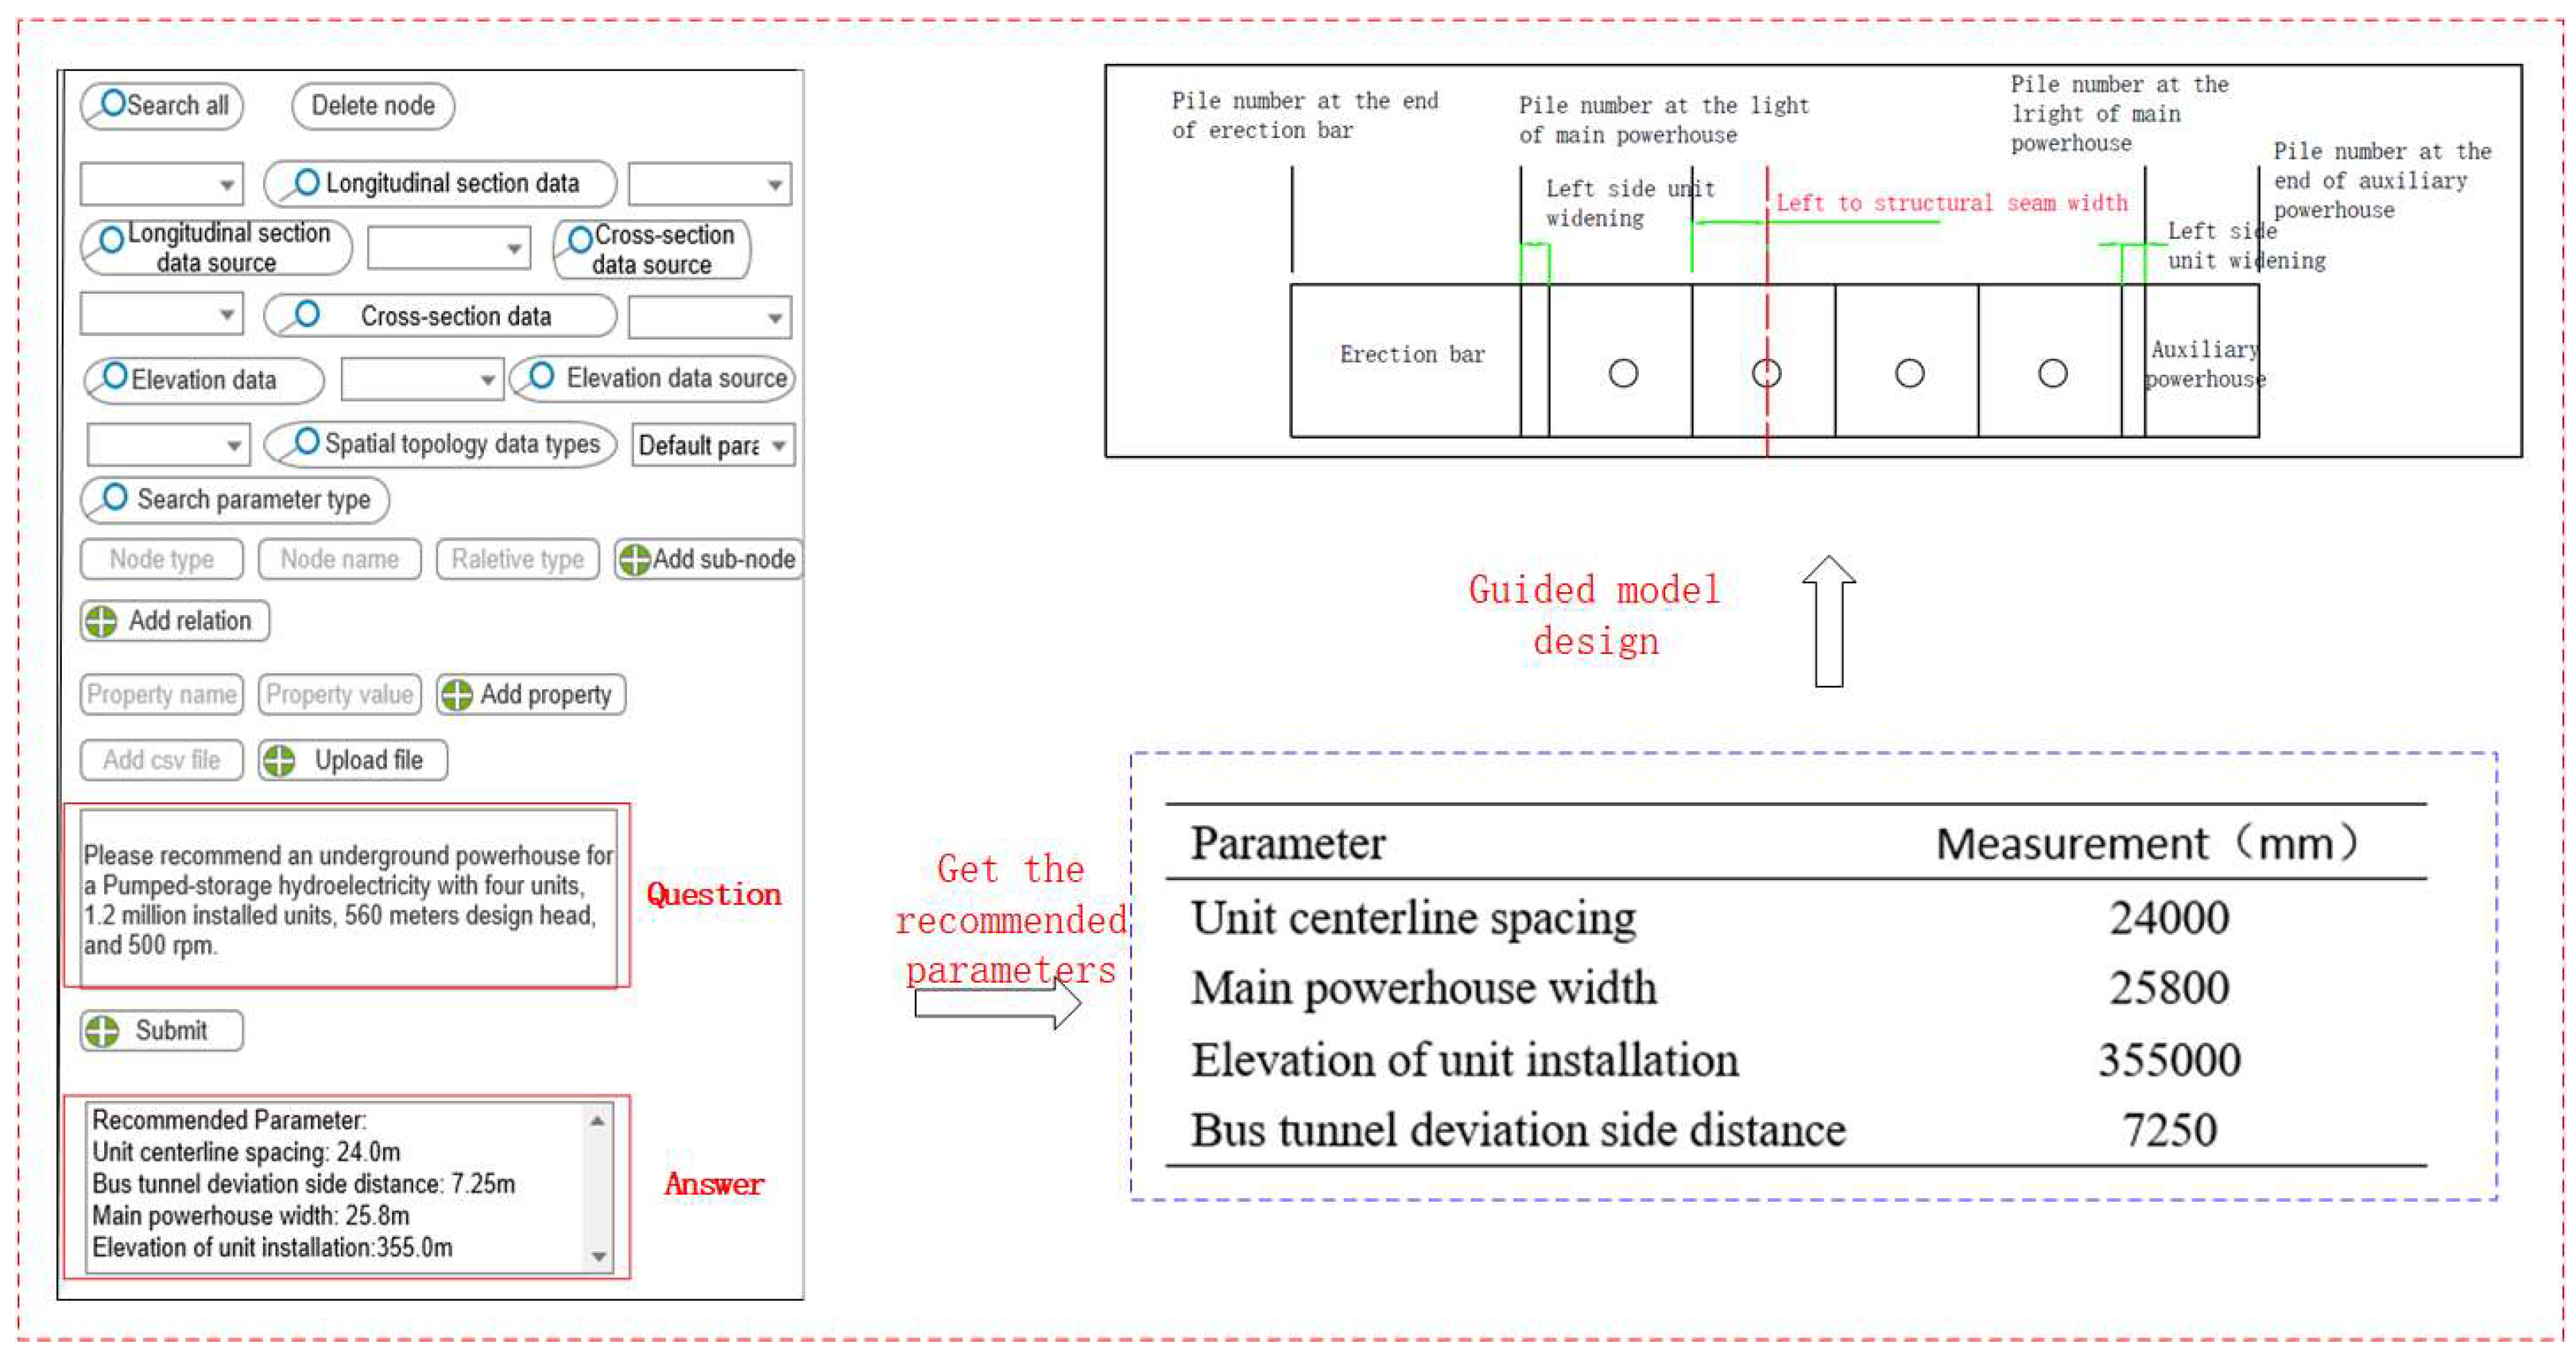
In the case description section, attributes can be divided into textual and numeric attributes based on the data type and numeric type attributes. Text-based attributes include the type of hydroelectric power plant, and numerical attributes include the number of installed units, installed power, design head, and speed. The similarity is calculated using the Jaccard correlation coefficient for text similarity and Manhattan distance for numerical attribute similarity.
(1) Jaccard similarity calculation
When there is more than one entity corresponding to the entity class of a design scheme, the neighborhood matching method is used for calculation. The Jaccard similarity coefficient is used to compare the similarity and difference between a finite set of samples. Given two sets A and B, the Jaccard coefficient is defined as the ratio of the size of the intersection of A and B to the size of the concurrent set of A and B, defined as follows:
J(A,B) is defined to be 1 when sets A and B are both empty.
(2) Numerical attribute similarity calculation
When the attributes are of numeric type, by considering the distances of the attribute values and normalizing them[
38], α is some numeric attribute,
and
are the α attribute values for the two schemes, and the numeric attribute distances are defined as:
The result after converting the distances into similarities and normalizing them is as follows.
is the numerical attribute similarity of scenarios and ; is the numerical attribute distance of scenarios s0 and ; is the set of values taken for the α numerical attribute distances.
When the attribute is of category type, the ratio of the size of the set defined as the intersection of A and B to the size of the union of A and B is measured by category matching, as defined below.
is the numerical attribute similarity between schemes; β is some numerical attribute, and and are the β attribute values of the two scenarios.
(3) Search algorithm
The comprehensive similarity of the two schemes is calculated using the following formula.
The comprehension similarity between the ith case and the recommended case, denotes text-based attribute weights, and denotes numeric attribute weights.
In this step, the weights of each attribute are set equal.
(4) Design parameter value acquisition algorithm
The retrieval yields k similar cases, and since the events to be recommended may not be identical to the cases in the case base, the retrieved solutions must be corrected to obtain the solution to the new problem. From the above, it can be seen that the combined similarity between the event to be recommended and the similar cases can characterize the degree of similarity of the main characteristic attributes between them, so this similarity can be applied to the solution prediction. Here, using the idea of combined prediction [
39], the adjusted prediction values of each similar case are summed and then divided by the sum of similarity to obtain the parameter values of the event to be recommended. The calculation formula is shown below:
where
is the comprehension similarity between the event to be recommended
and the similar case
is the number of similar cases retrieved,
is the value of similar case solution, and p is the prediction value. The above formula is used to sequentially predict all the target indicators, and then derive the values of various design parameters for the recommended event.
4. Conclusions
In this paper, an intelligent construction method of knowledge graphs is proposed for the intelligent design of spatial arrangement of underground powerhouses, and an intelligent question-and-answer system for underground powerhouses is developed and successfully applied to the recommendation for spatial topology data of pumped-storage power stations. Meanwhile, the methods mentioned in this study are generic, except that the skeleton of the knowledge graph is developed based on experience and practical needs, and other industries can also use the methods used in this study. The main conclusions are as follows.
(1) A knowledge graph ontology skeleton conforming to the spatial arrangement of underground powerhouses is constructed, and an entity extraction method based on ChatGPT is proposed, which is effective and reduces the workload of producing datasets.
(2) For entity word separation, this study analyzes and compares the commonly used Chinese word separation methods and verifies that the THULAC algorithm is more suitable for word separation in the fields of water conservancy and hydropower engineering.
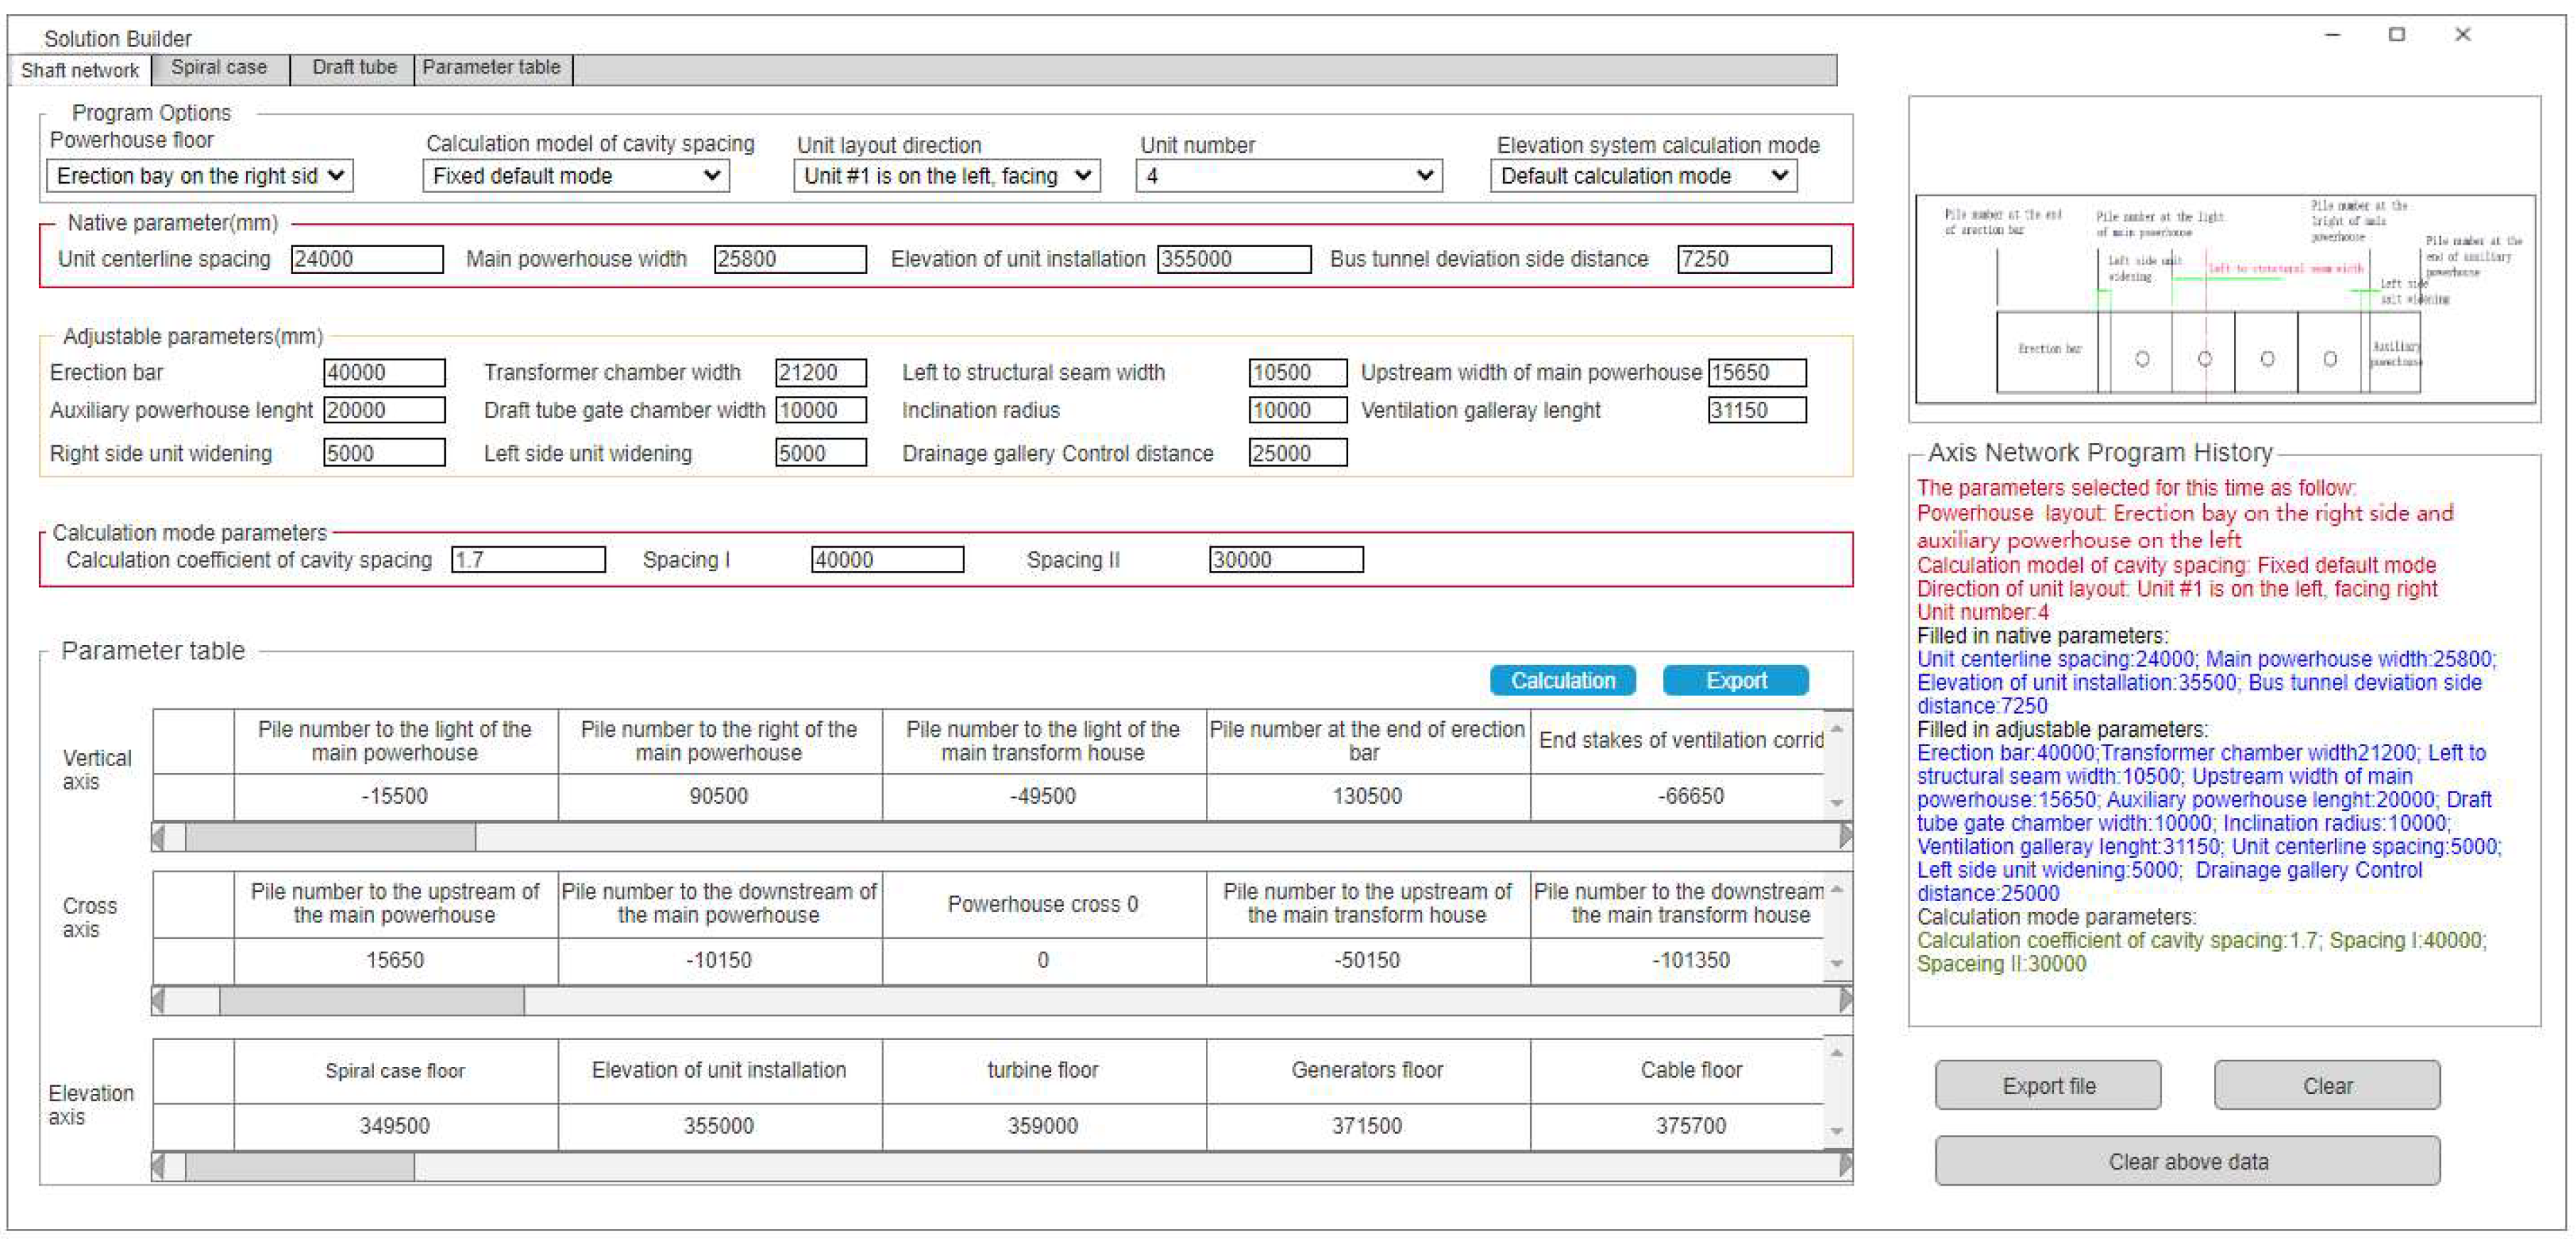
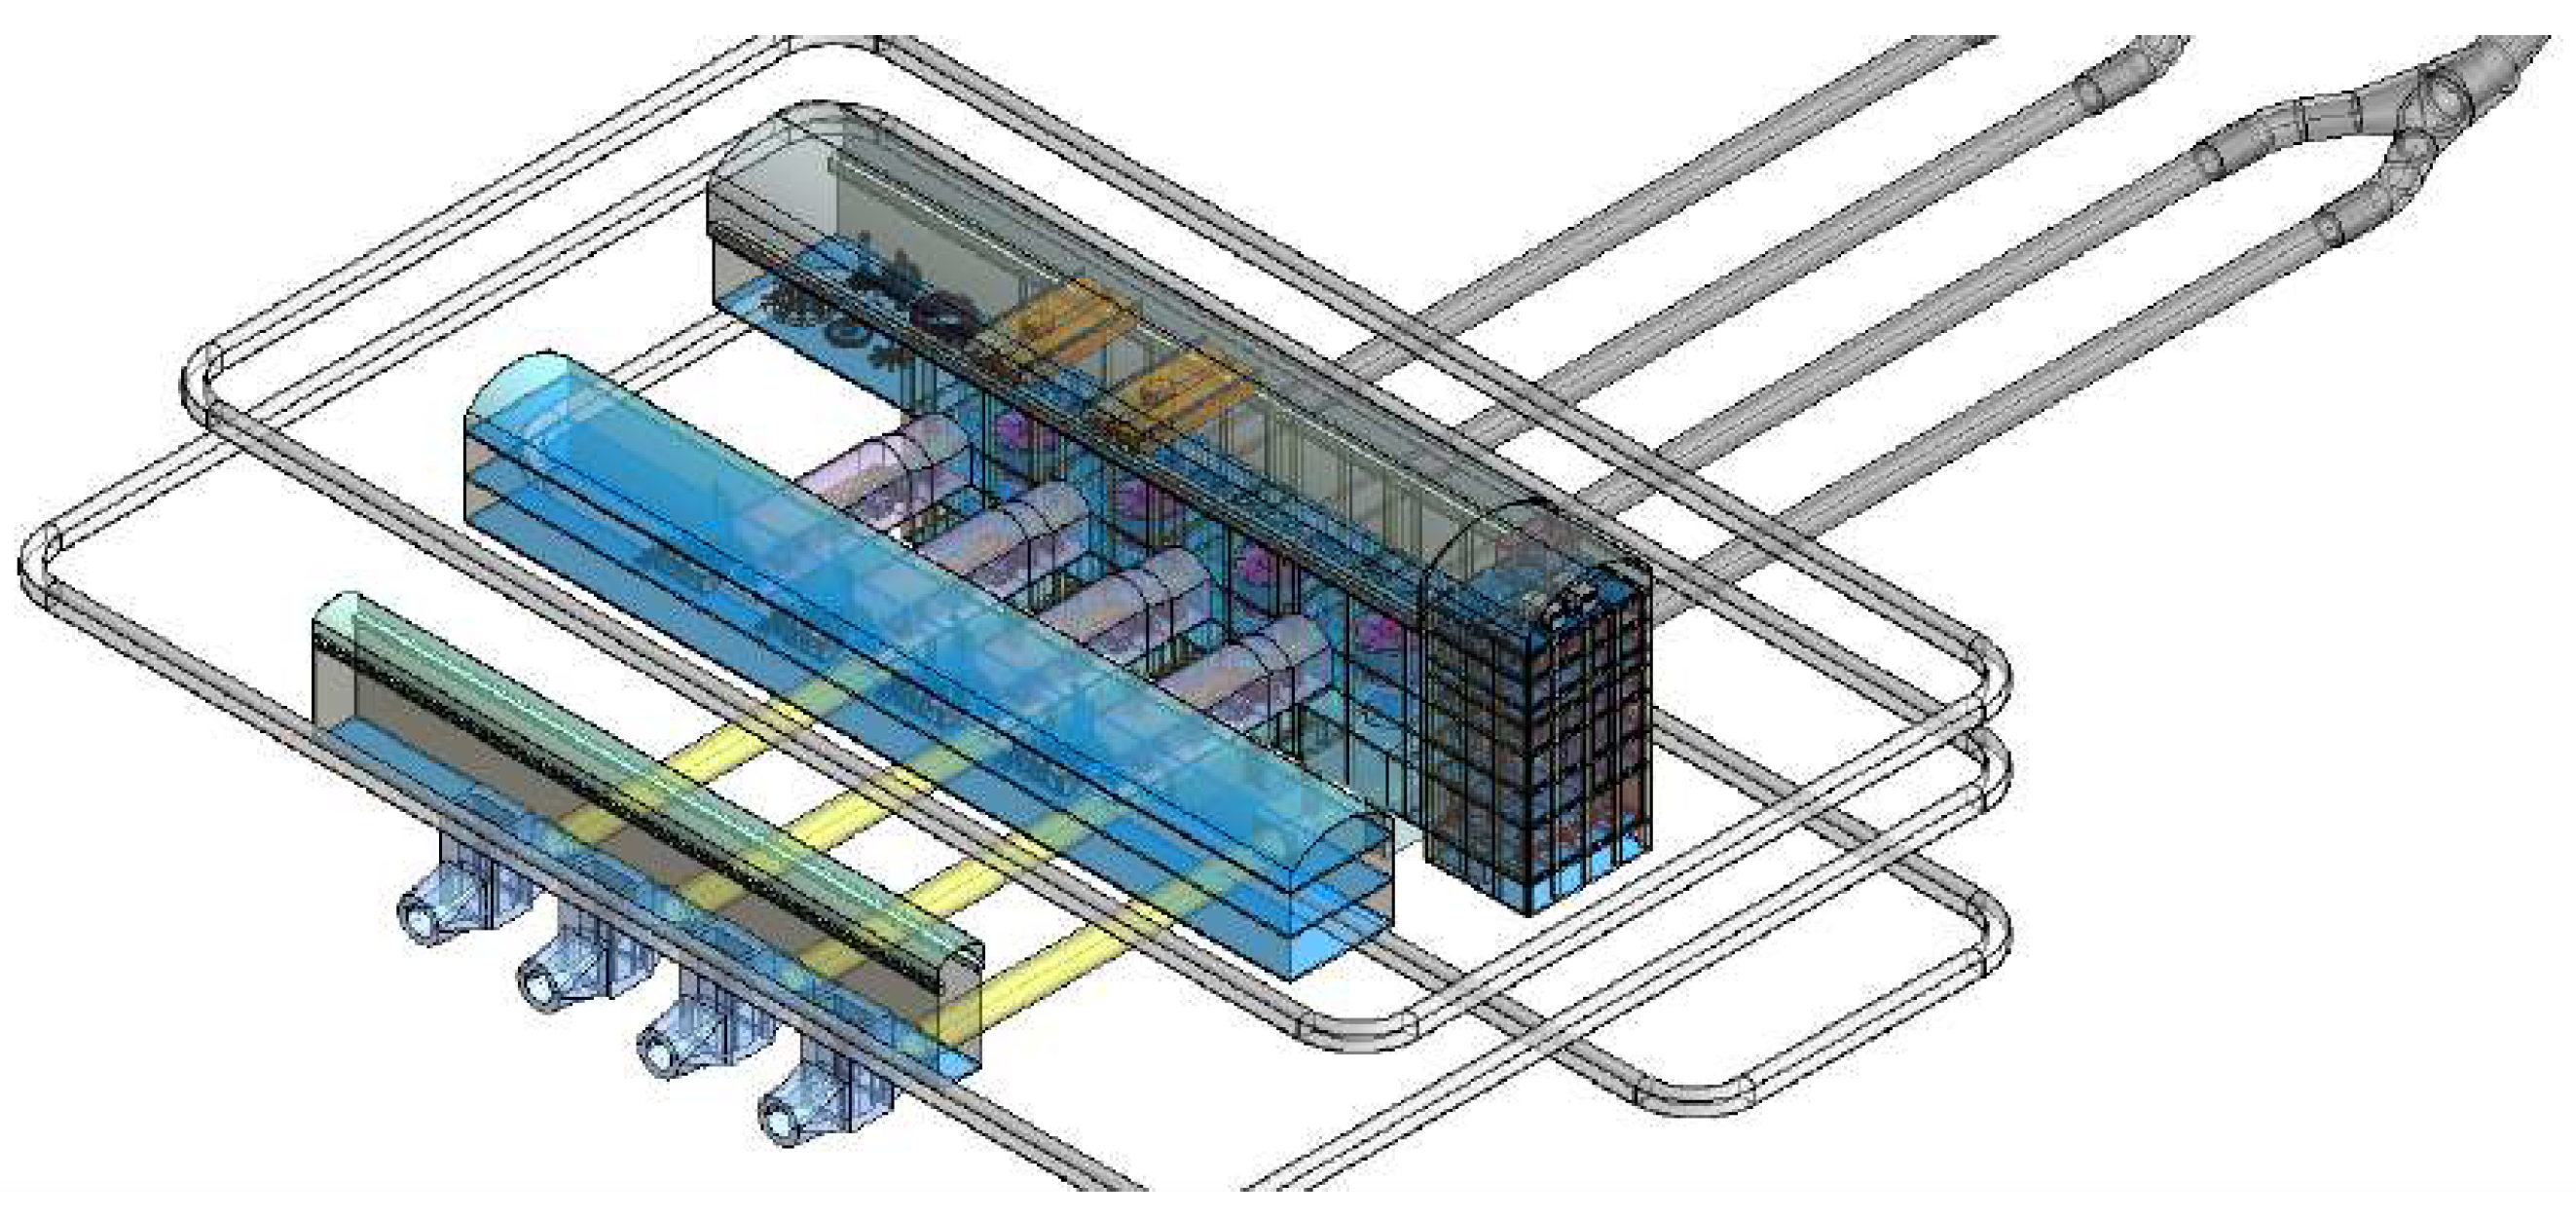
(3) The recommendation method used is valid and more accurate than reasoning method without modifications. An intelligent question-and-answer system for underground powerhouses is constructed and applied to the BIM model construction of pumped-storage hydropower stations. By mining relevant parameter cases from the knowledge graph, relevant design parameters are given to assist the BIM model design of underground powerhouses for pumped-storage power plants.
(4) Knowledge graph-based drawing reviews are a means study, and establishing appropriate review rules can greatly improve the efficiency of reviews and the accuracy of drawings.
(5) There are certain shortcomings in this study. OCR technology is a text extraction technology based on image recognition, and there is a possibility of recognition errors in the process of using it. If there is an error in OCR recognition, it will affect the subsequent work.
Figure 1.
BIM knowledge graph construction process for the spatial arrangement of underground powerhouses.
Figure 1.
BIM knowledge graph construction process for the spatial arrangement of underground powerhouses.
Figure 2.
Ontology skeleton construction process.
Figure 2.
Ontology skeleton construction process.
Figure 3.
Data acquisition process of the OCR.
Figure 3.
Data acquisition process of the OCR.
Figure 4.
Correlation extraction process.
Figure 4.
Correlation extraction process.
Figure 5.
Pretrained ChatGPT.
Figure 5.
Pretrained ChatGPT.
Figure 6.
Neo4j data visualization process.
Figure 6.
Neo4j data visualization process.
Figure 7.
Comprehensive similarity calculation process.
Figure 7.
Comprehensive similarity calculation process.
Figure 8.
Knowledge graph ontology skeleton for intelligent design of underground powerhouse of hydropower stations.
Figure 8.
Knowledge graph ontology skeleton for intelligent design of underground powerhouse of hydropower stations.
Figure 9.
Knowledge graph.
Figure 9.
Knowledge graph.
Figure 10.
Visualization of relevant parameter retrieval.
Figure 10.
Visualization of relevant parameter retrieval.
Figure 11.
Parameter recommendation.
Figure 11.
Parameter recommendation.
Figure 12.
Underground powerhouse intelligent modeling program generator.
Figure 12.
Underground powerhouse intelligent modeling program generator.
Figure 13.
BIM model of the underground powerhouse of the pumped-storage hydropower station.
Figure 13.
BIM model of the underground powerhouse of the pumped-storage hydropower station.
Table 1.
Main entity types and numbers of knowledge graphs for intelligent design of underground powerhouses for pumped-storage hydropower stations.
Table 1.
Main entity types and numbers of knowledge graphs for intelligent design of underground powerhouses for pumped-storage hydropower stations.
| No |
Entity type |
Entity number |
| 1 |
Parameter type |
4 |
| 2 |
Native parameter |
4 |
| 3 |
Calculation parameter |
3 |
| 4 |
Default parameter |
7 |
| 5 |
Transfer parameter |
11 |
| 6 |
Cross-sectional data source |
19 |
| 7 |
Cross-sectional data |
18 |
| 8 |
Longitudinal Section data |
17 |
| 9 |
Longitudinal Section data source |
19 |
| 10 |
Elevation data |
19 |
| 11 |
Elevation data source |
17 |
Table 2.
Specifications lists.
Table 2.
Specifications lists.
| No |
Specifications name |
| 1 |
NBT35011-2013 Hydroelectric Power Plant Building Design Code |
| 2 |
GB50016-2014 Fire Protection Design Code for Industrial Buildings |
| 3 |
NBT10072-2018 Pumped Storage Power Station Design Code |
| 4 |
SL266-2014 Hydroelectric Power Plant Building Design Code |
| 5 |
NBT35079 Underground Plant Rock Wall Crane Beam Design Code |
| 6 |
NB/T35056-2015 Design Code for Pressure Steel Pipes in Hydroelectric Power Plants |
| 7 |
SL/T281-2020 Design Code for Pressure Steel Pipes in Water Resources and Hydropower Engineering |
| 8 |
SL378-2007 Construction Specification for Underground Excavation of Hydraulic Structures |
Table 3.
Construction of partial keywords in the thesaurus.
Table 3.
Construction of partial keywords in the thesaurus.
| No |
Key word |
No |
Key word |
No |
Key word |
| 1 |
Unit spacing |
7 |
Turbine casing |
13 |
Aisle |
| 2 |
Length of unit section |
8 |
Draft tube |
14 |
Setting of turbine |
| 3 |
Generator floor |
9 |
Pelton turbine |
15 |
Pump-turbine |
| 4 |
Drainage gallery Control distance |
10 |
Cascade hydraulic station |
16 |
Design level year |
| 5 |
Spiral case floor |
11 |
Hydraulic turbine-generator unit |
17 |
Power system load |
| 6 |
Inclination radius |
12 |
Bulb hydro-generating set |
18 |
Subject to power delivery conditions |
Table 4.
Comparison table of word separation algorithm analysis.
Table 4.
Comparison table of word separation algorithm analysis.
| Algorithm |
P |
R |
F1 |
| Jieba |
0.94 |
0.92 |
0.90 |
| SnowNLP |
0.62 |
0.58 |
0.60 |
| THULAC |
0.97 |
0.89 |
0.95 |
| LTP |
0.84 |
0.89 |
0.87 |
| HanNLP |
0.89 |
0.92 |
0.87 |
Table 5.
ChatGPT Extraction Triad.
Table 5.
ChatGPT Extraction Triad.
| Station |
No |
Case text |
Triad |
| Head Entity |
Relative |
Tail Entity |
| Nontrained |
1 |
The installation room layout should meet the requirements of device installation, maintenance, loading and unloading of vehicles into the plant and lifting |
installation room layout |
should meet |
device installation |
| 2 |
The sub-powerhouse layout is arranged at one end of the main plant and the main transformer room. |
sub-powerhouse layout |
at one end of the main plant and the main transformer room |
- |
| 3 |
The unit spacing should also meet the layout of the concrete structure of the flood and sand discharge hole |
unit spacing |
also meet |
the concrete structure of the flood and sand discharge hole |
| |
1 |
The layout of the installation room should meet the requirements of device installation, maintenance, loading and unloading of vehicles into the plant and lifting |
installation room layout |
should meet |
the requirements of device installation, maintenance, loading and unloading of vehicles into the plant and lifting |
| 2 |
The sub-powerhouse layout is arranged at one end of the main plant and the main transformer room. |
sub-powerhouse layout |
is arranged at |
one end of the main plant and the main transformer room. |
| 3 |
The unit spacing should also meet the layout of the concrete structure of the flood and sand discharge hole |
unit spacing |
also meet |
the layout of the concrete structure of the flood and sand discharge hole |
Table 7.
Evaluation of inference parameters.
Table 7.
Evaluation of inference parameters.
| Prediction indicator |
Prediction accuracy/% |
RMSE |
| Unit centerline spacing |
92.85 |
0.1623 |
| Main powerhouse width |
89.61 |
0.1744 |
| Elevation of unit installation |
91.17 |
0.1634 |
| Bus tunnel deviation side distance |
90.92 |
0.1506 |
Table 8.
Evaluation of inference parameters.
Table 8.
Evaluation of inference parameters.
| Prediction indicator |
Prediction accuracy/% |
| Proposed method |
reasoning method without modifications |
| Unit centerline spacing |
92.85 |
63.95 |
| Main powerhouse width |
89.61 |
71.14 |
| Elevation of unit installation |
91.17 |
78.19 |
| Bus tunnel deviation side distance |
90.92 |
75.32 |
