Preprint
Article

Measurement of Mechanical Behavior of 11B Enriched MgB2 Wire Using Pulsed Neutron Source

Altmetrics

Downloads

107

Views

29

Comments

0

A peer-reviewed article of this preprint also exists.

Submitted:

24 July 2023

Posted:

25 July 2023

You are already at the latest version

Alerts
Abstract
MgB2 is a hexagonal superconducting material, and its simple composition has led to the development of low-cost practical wires. However, the problem is that the strain characteristics of filaments are inferior to those of other practical wires, but there have been no strain measurements using diffraction method. The reason for this is presumably that it is a little too thick for synchrotron radiation measurements, and the large absorption cross section of the included boron-10 makes it difficult to obtain elastic scattering for neutron measurements. We prepared a wire substituted with boron-11, an isotope with small neutron absorption cross section, and attempted to measure its strain under tensile loading using pulsed neutron.
Keywords: 
Subject: Engineering  -   Mechanical Engineering

1. Introduction

MgB2 superconducting compound was discovered in 2001 [1]. The features of the MgB2 compound are a higher critical temperature (Tc) of 39 K, simple binary chemical composition, lower specific gravity and relatively low-cost material. The advantage of MgB2 is that it can be used in liquid hydrogen (LH2) temperatures at 20 K. Cable applications, in particular, are ahead due to their low strain and ease of application [2]. Most current coil applications [3,4,5] are in the low stress-strain range, and if high current applications such as nuclear fusion are to be considered, improving the strain properties of the wire is an essential issue. A major user of superconducting wire is the fusion reactor project. ITER, which is currently under construction, is expected to operate in a 4 K environment using large amounts of liquid helium, known as LTS (low-temperature superconductor). However, the supply of liquid helium has been unstable for several years and the price of helium has skyrocketed. This fact means that the next generation of fusion reactors must be helium-free based for practicality. Most of the actual fusion plans are based on high temperature superconductor (HTS) [6,7]. MgB2 is a promising candidate for helium-free fusion because it can be used in liquid hydrogen. However, when used in coils such as nuclear fusion, tensile stress or strain is generated in the wire in response to the electromagnetic force generated. Superconducting wires generally have the problem that the critical current, which is the limit of the current that can flow, decreases when the filament is subjected to tensile or compressive strain. These effects have been proposed by Ekin as a Strain effect [8], the essence of which is due to crystal deformation, and it is known that in Nb3Sn, the strain free state is most conducive to current flow. Ekin was able to obtain large single crystals, which allowed this strain free experiment to be performed and clarified, but for practical wires, the only method for measuring the actual strain in filaments is to use quantum beams. This means that in composite superconducting wires, filament strain changes performance in tension or compression, supporting the importance of non-destructive measurement of filament strain. Measurements of the real strain of filaments have been revealed in practical superconducting wires such as REBCO[9,10], Nb3Sn[11] and BSCCO[12] in experiments using quantum beams, but this has not yet been reported for MgB2 wires. In the coils of high-field magnets, predicting or measuring the actual filament strain to estimate performance is a design element, and it is foreseen that filament strain measurement technology will be essential for MgB2 coil applications.
The natural boron has two kinds of isotopes which are existed 20 wt% boron-10 (10B) and 80 wt% boron-11 (11B). The stability of the material is important when considering its application to nuclear fusion [12]. Among these materials, B-10 has been pointed out to have a problem of decomposition into Li and He gases due to nuclear reaction with neutrons. To circumvent this problem, research is underway to create superconductors substituted for 11B [13,14,15]. 10B isotope has huge neutron absorption cross-section [16], so it was said that boron contains materials are difficult to measure using neutron scattering. So up to now, there was no measurement where the MgB2 wire was measured with neutron scattering. Although MgB2 is originally a brittle, it has the property of withstanding strain exceeding 0.2%. MgB2 filaments have many defects, so the reason why this strain region can be practically used is not known at all. Oxide-type high-temperature superconductors has characteristics that current transport is impossible when crystal grain boundaries are destroyed. Although it has been pointed out that MgB2 superconducting wire may not be affected by grain boundaries, it is still unknown what fraction of force the filament is responsible. We believe that this can be proved if the stress applied to the filament can be measured nondestructively. In order to this problem, there is no other than experiments using quantum beams. We conducted experiments with SPring-8 with high energy X-ray, but the MgB2 wire’s diameter was too large, so it was making measurement difficult. Experiments were impossible using high energy X-rays above 70 keV, and there is no other thing than neutron scattering that makes this possible. Neutron scattering experiment is impossible with original MgB2 wire because of huge neutron absorption cross-section of 10B. Therefore, we decided to prepare 11B enriched MgB2 wire to measure its filament mechanical behavior. This 11B enriched wire was developed for fusion reactors by Hishinuma et al. The purpose was to prevent heat generation during neutron irradiation, dependent on its neutron absorption cross section, due to the absence of 10B, and also to prevent decomposition into lithium and helium by nuclear reactions. We also performed neutron scattering experiments on commercially available practical MgB2 wires to see if diffraction of MgB2 could be obtained. In this time, the measurement was carried out by TAKUMI (MLF BL19) of J-PARC[17], a neutron research facility at Japan Atomic Energy Agency (JAEA). The measurement method of TAKUMI is the Time-of-Flight (ToF) method.

2. Materials and Methods

2.1. Preparation of MgB2 wires

Figure 1 shows 11B enriched multi filamentary MgB2 wire. This wire’s diameter is about 1.07 mm. The 11B-enriched sample was developed by National Institute for Fusion Science(NIFS) in Japan and is referred to as NIFS in this paper. The manufacturing method is outlined below.
Mg powder (purity: 99.9 %, -200 mesh) and 11B isotopic powders isotopically separated from natural boron were prepared. The 11B powder was sourced from Ceradyne and was 98% in purity. Mg2Cu intermetallic compound was prepared as the Cu additive source [14]. In order to uniformly disperse it in the precursor powder, microparticulation is effective, and in this study, Mg2Cu microparticles were obtained by mechanical milling using a ball mill. The amount added was equivalent to 3 at% Cu, which is considered optimal for the precursor powder. The powder in tube (PIT) method was used to fill a metallic tantalum tube with an outer diameter of 10 mm and an inner diameter of 6 mm. In the next step, 19 hexagonal single-core wires were cut and assembled into oxygen-free copper tubes (Outer D: 14 mm, Inner D: 10 mm). Finally, this composite billet was drawn using a cassette roller die to a final diameter of 1.07 mm to obtain multi-core wire. As a final step, the heat treatment temperature was set to 450 °C to 600 °C in an Ar atmosphere for low-temperature diffusion and a heat treatment time of 200 hours. A cross-sectional view of the resulting wire by SEM is shown in Figure 1(a). The color map of EPMA results for the main elements are also shown in Figure 1(b). Some oxygen is observed in the EPMA results, but this is common in practical wires and is probably due to residual oxides.
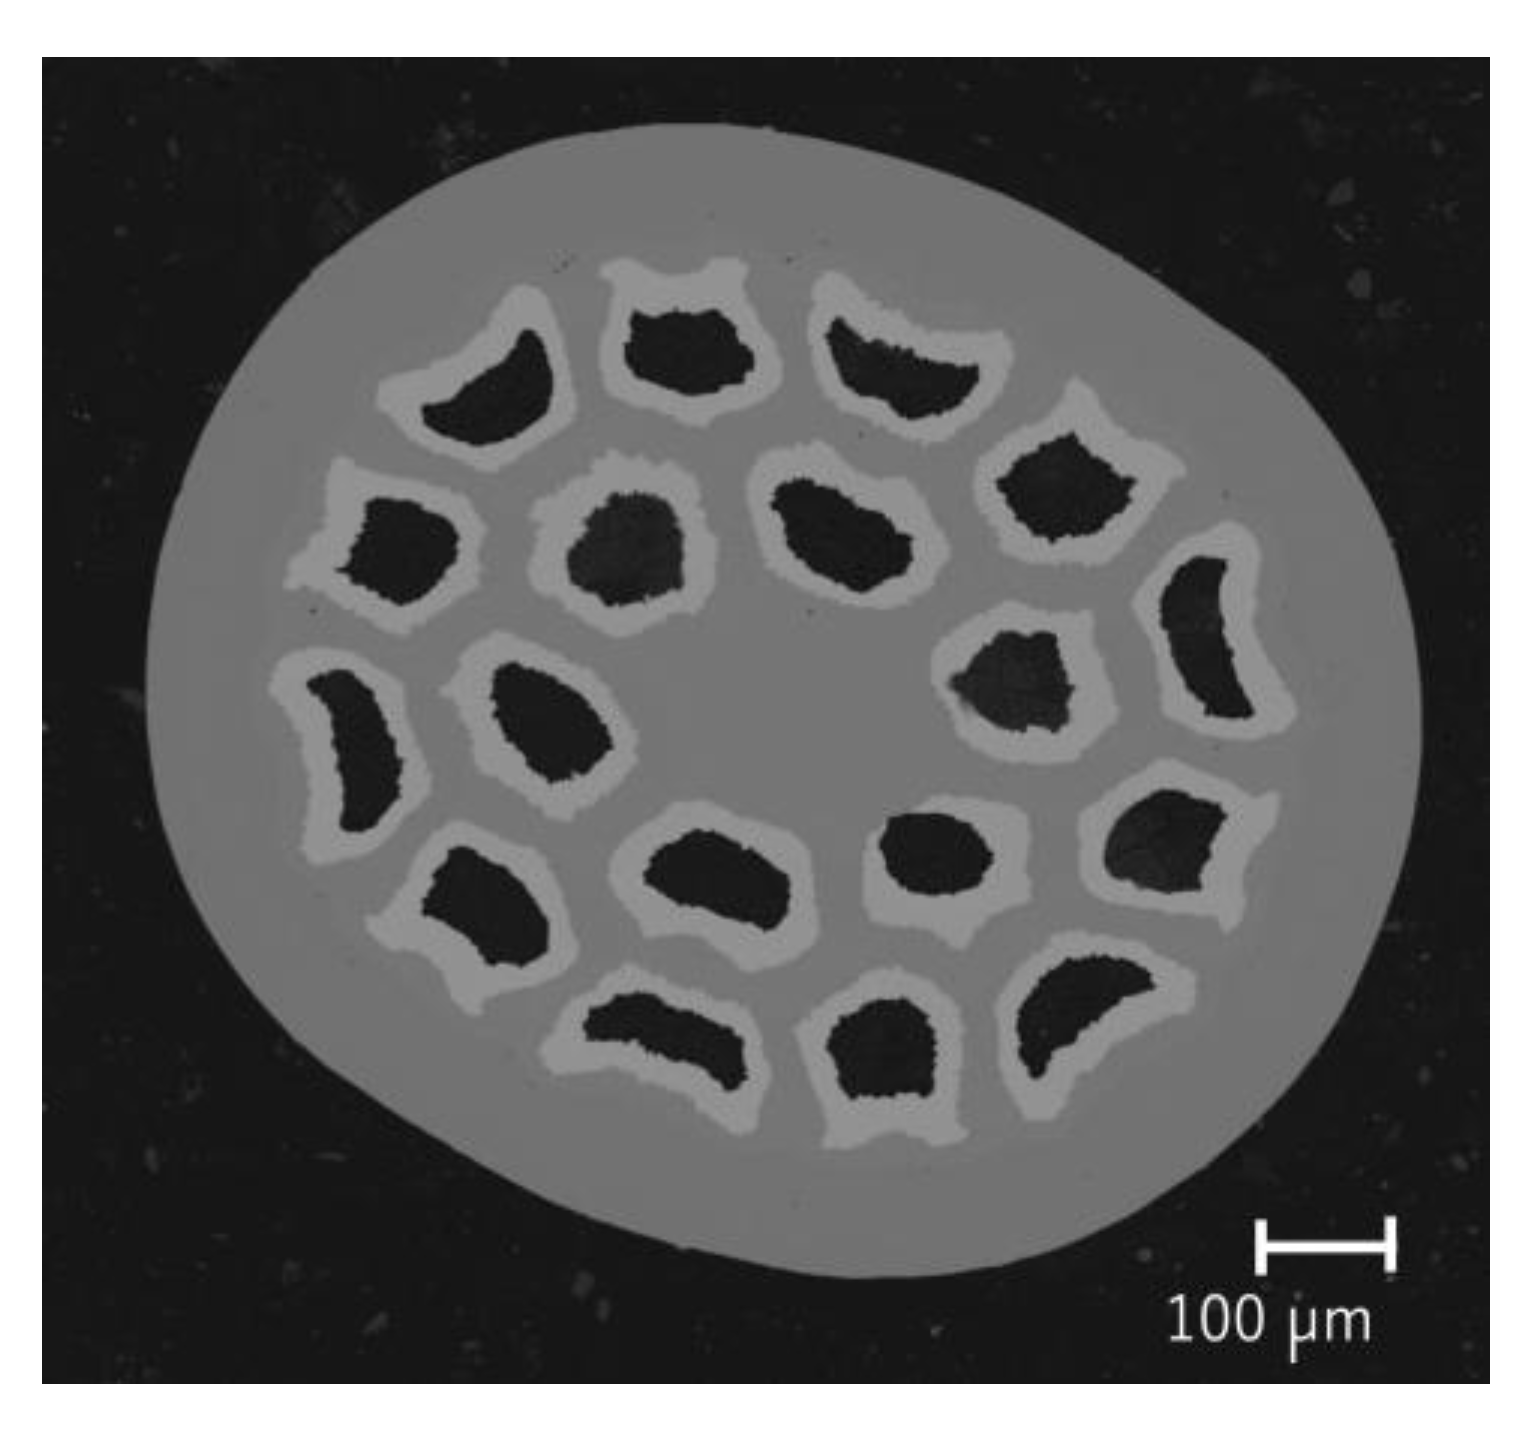
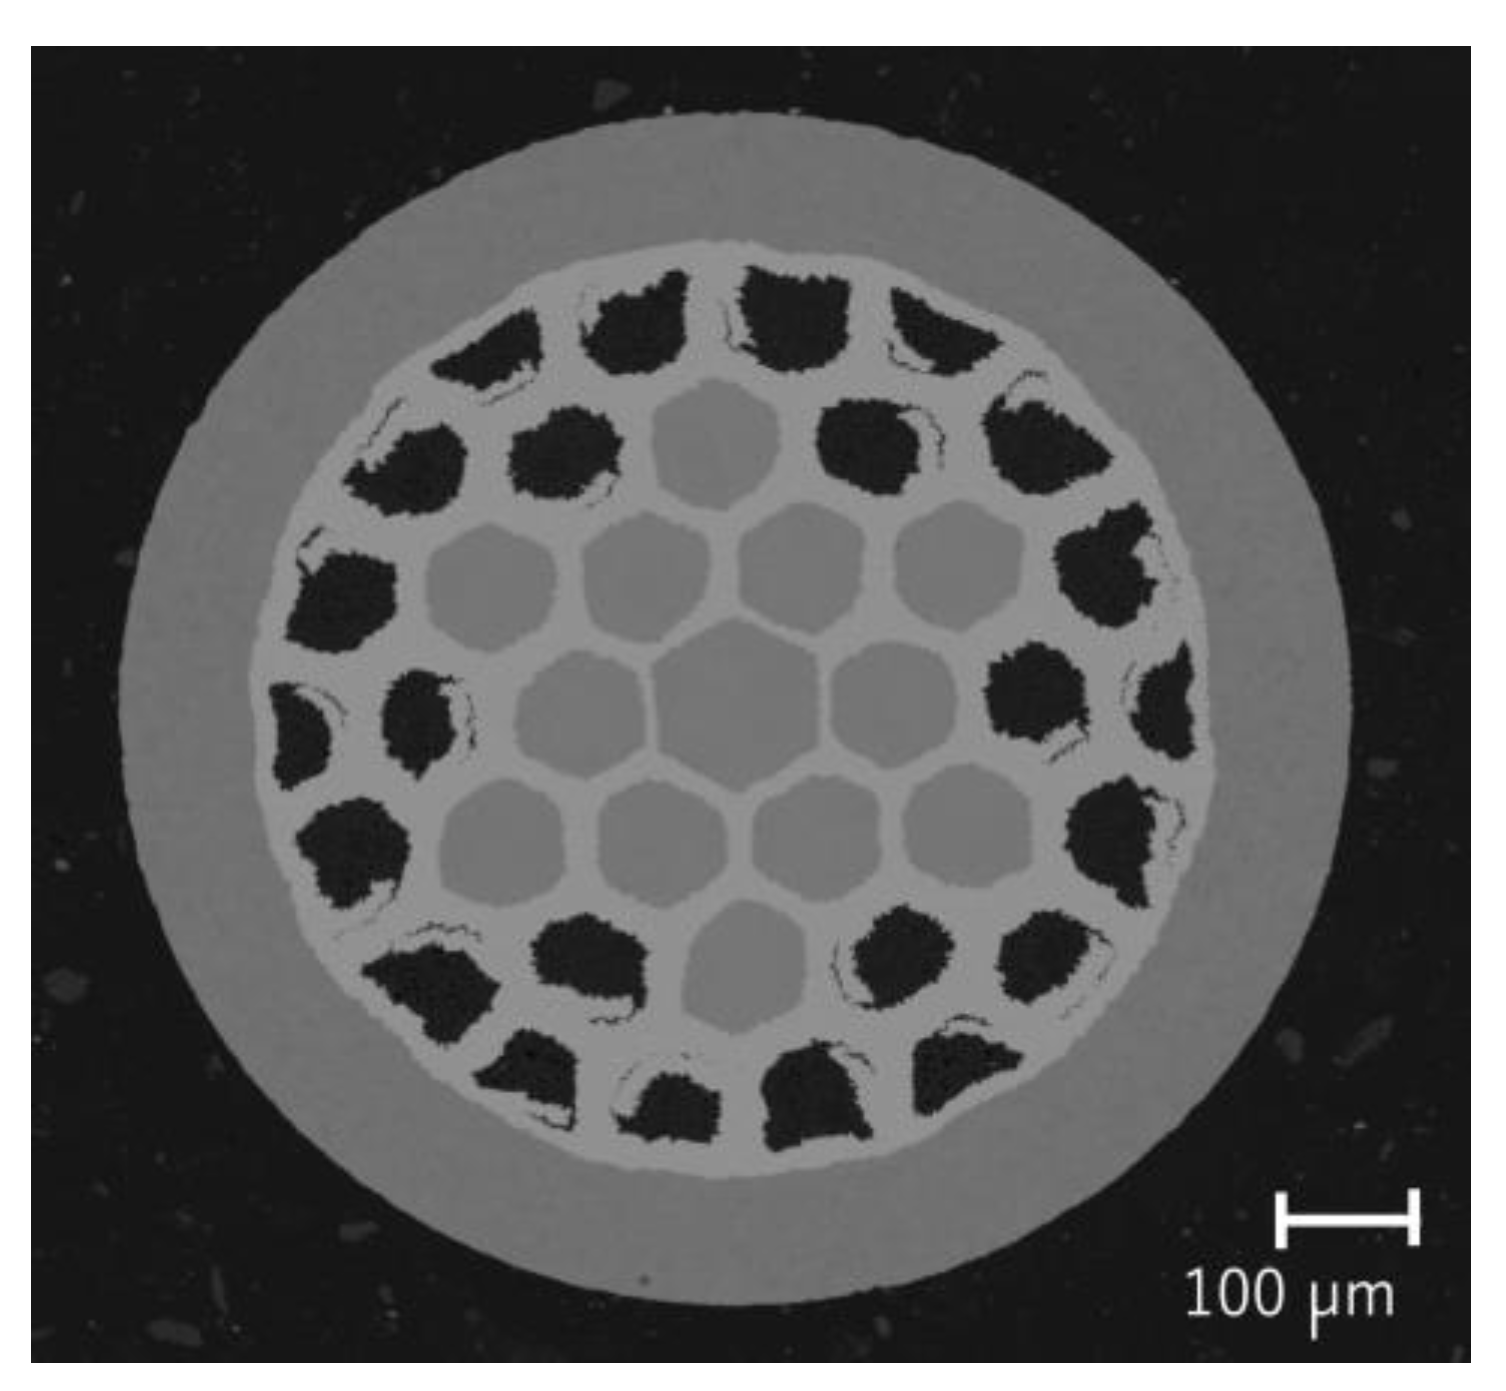
Practical MgB2 wire are commercialised by several manufacturers using ex-situ and in-situ methods. The filaments are made of sintered MgB2 components and are surrounded by an inner sheath to prevent chemical reactions with the matrix. The outer sheath is important to ensure uniform superconducting and mechanical properties of long scale wires. In this case we have prepared wires from Hypertech and Samdong in-situ methods. These boron isotopes are considered to be in natural ratio. The practical structures of two types of MgB2 wire in practical use are shown in Table 1. Next, Figure 2 and 3 show the respective SEM cross-sectional photographs. The outermost sheath is a Ni-Cu-Fe alloy called Monel, the darker area is the MgB2 filament, and each filament is surrounded by an Nb sheath both around the filaments. The diameter of each wire was 0.83 mm for both Samdong and Hypertech.

2.2. Strain Calculation using ToF Method

The strains were calculated from the measurement results of the ToF method of TAKUMI (BL19 of MLF) [17]. The pulsed neutron method, also called the ToF method, is a technique to measure lattice spacing d of crystals as a histogram like a spectrometer by using a single pulse of neutron with various speeds, with faster neutrons diffracting and being detected faster by the detector and slower neutrons being detected more slowly. In the case of Takumi, it is easy to understand from the general Bragg diffraction conditions to think of it as a diffractometer with 2θ -fixed at 90 degrees and -90 degrees. In reality, the fixed 90-degree angle is not efficient for detection, so the angle is extended to ±15 degrees. The relationship between lattice spacing d and flight time t in the Time-of-Flight method is explained by the following equation
d = λ 2 sin θ = 1 2 sin θ · h m L
h is Planck’s constant and m is the mass of a neutron. L is a flight distance of neutrons from chopper near by target. From above equation (1), it can be calculated lattice spacing d using flight times conversion parameter.
ε = d d 0 d 0
Finally, strain ε is given by equation (2). d and ToF have the same dimension and this strain relationship holds even if d and ToF are replaced. Where there is no d0. sample, the strain-free d spacing, e.g. in tensile tests, the point of zero load is often calculated as d0.

2.3. In situ strain measurement under tensile teset and equipment

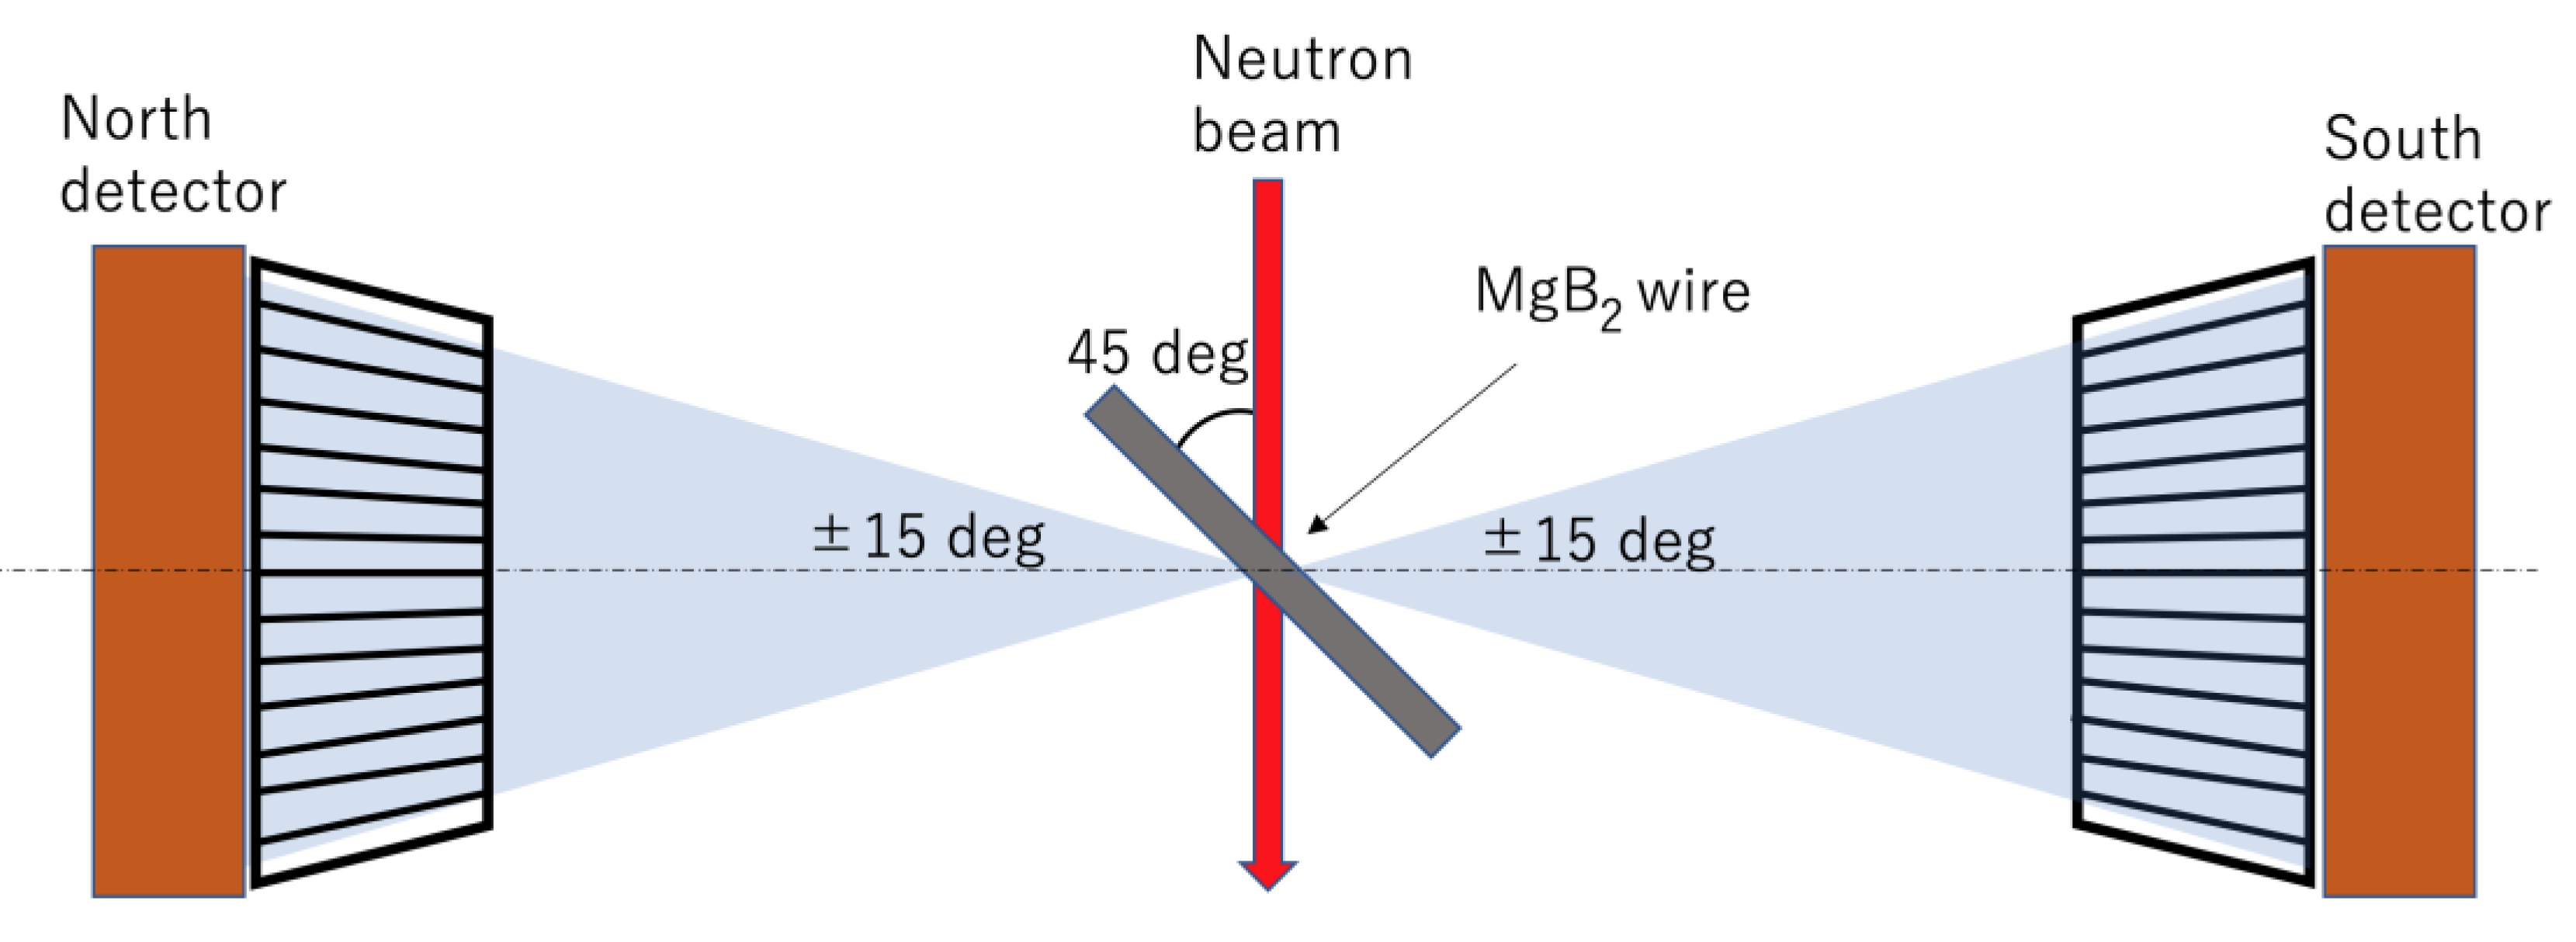
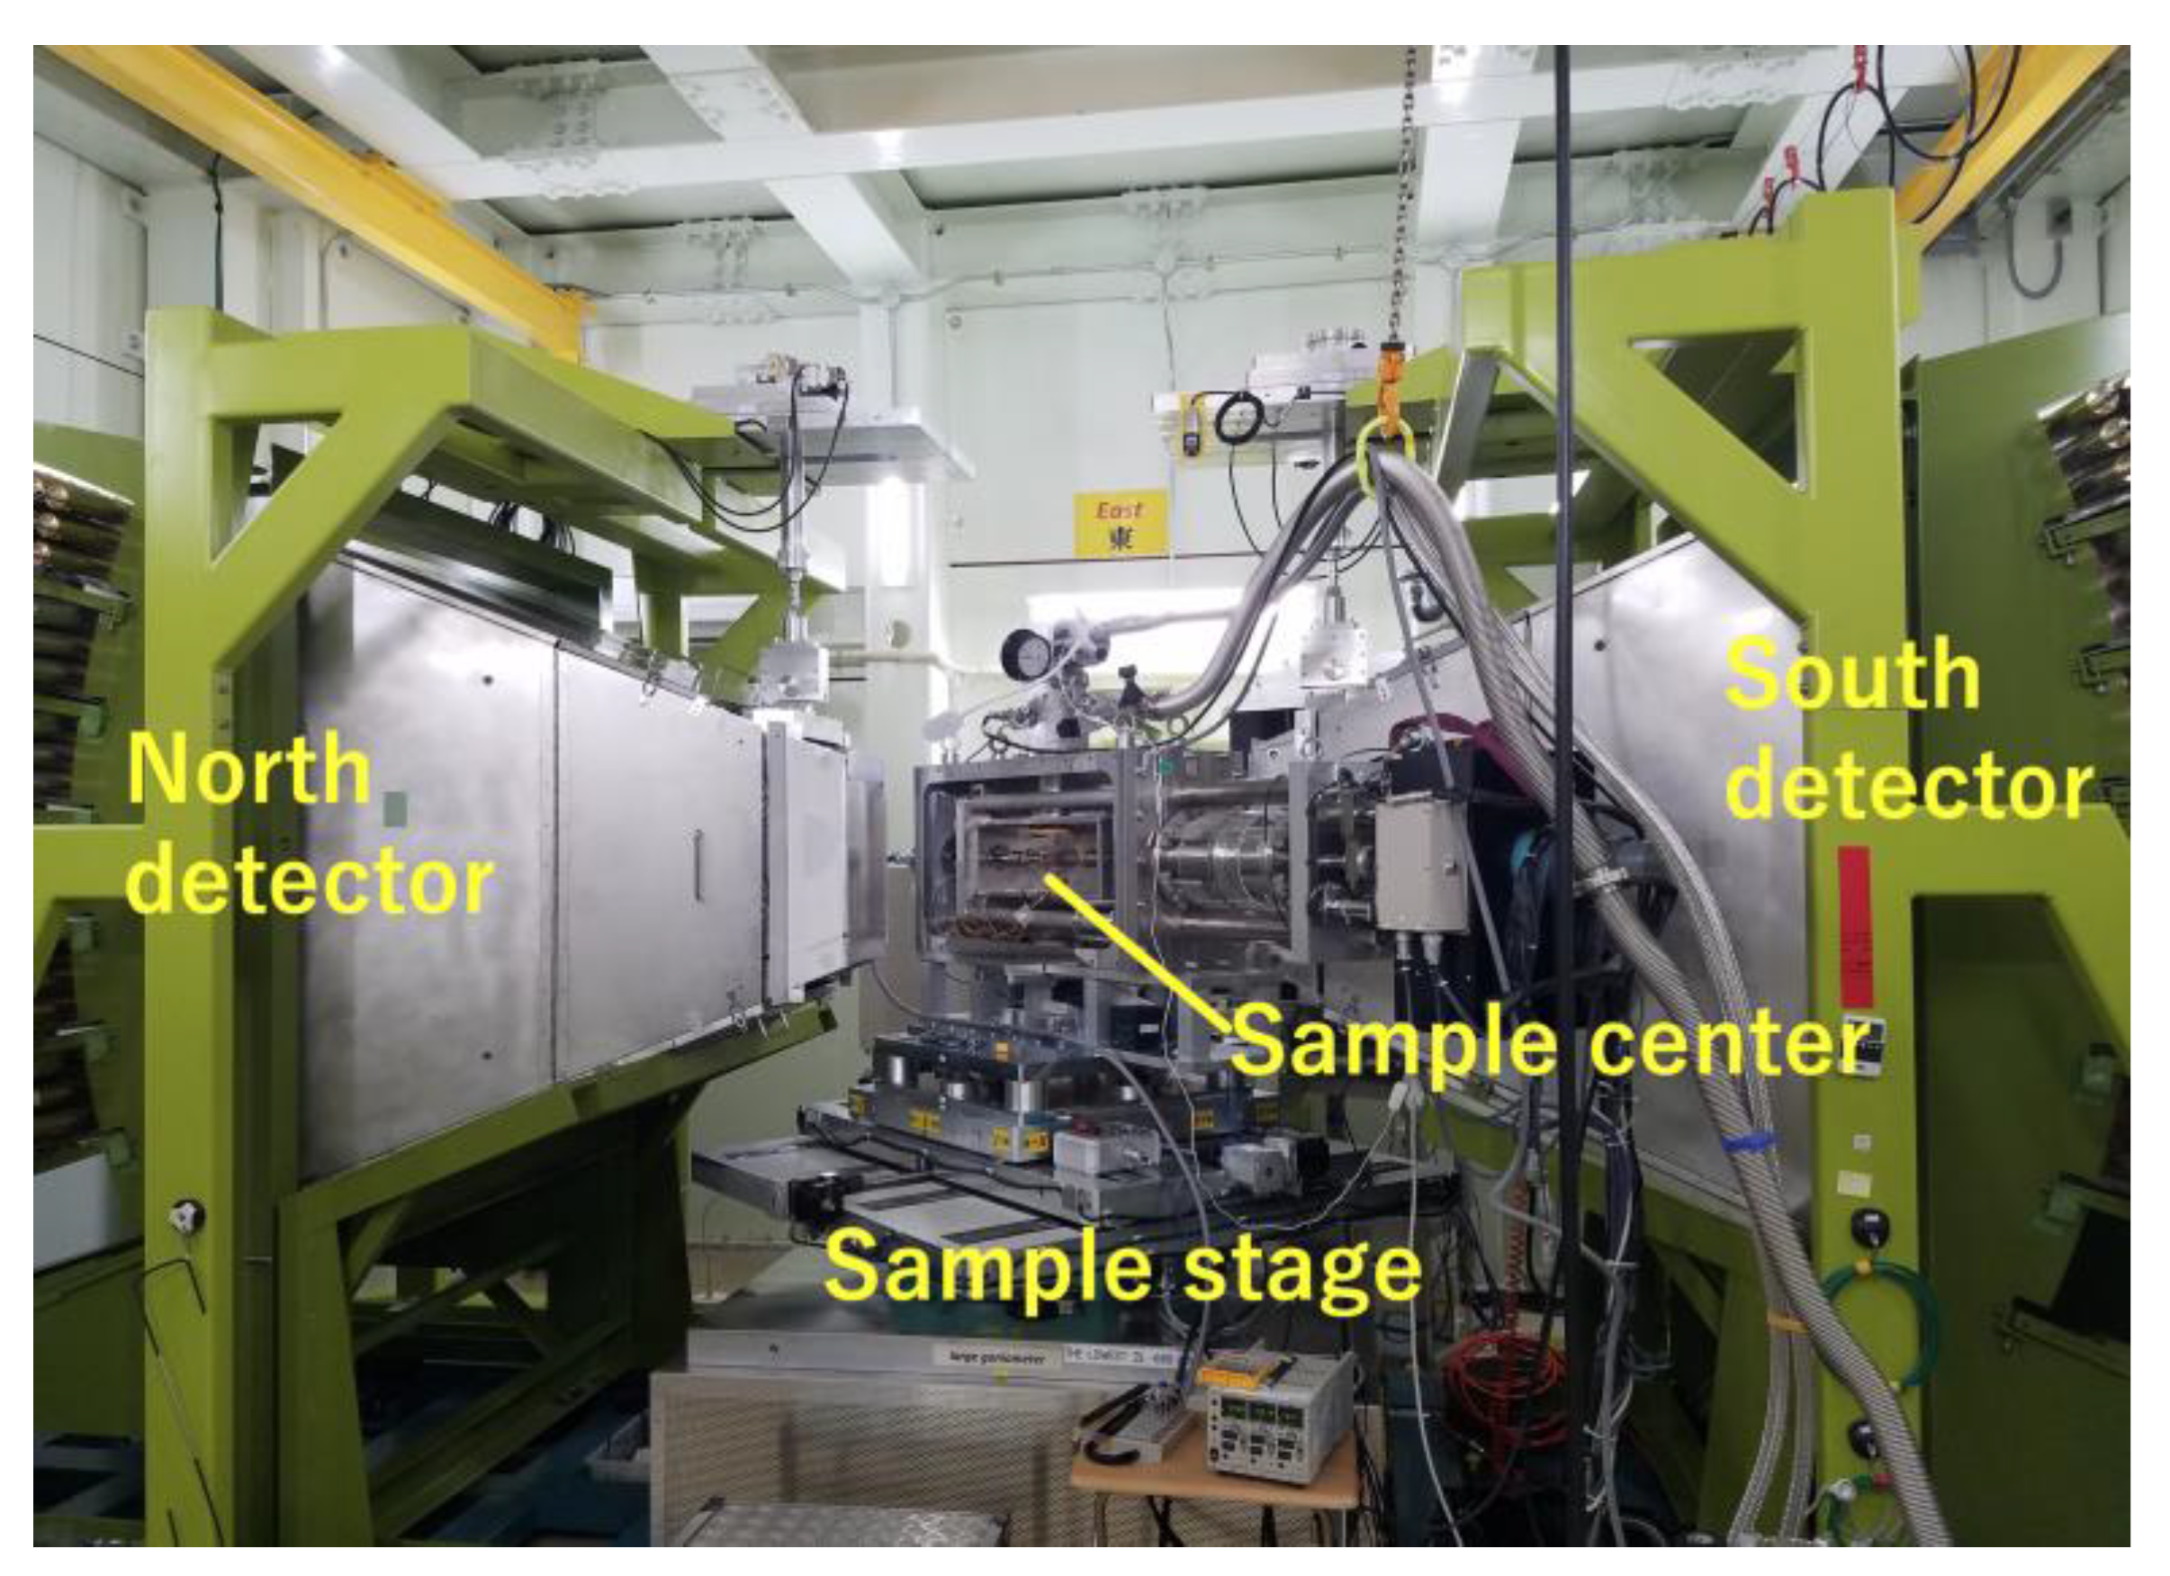
BL19 takumi is a ToF neutron powder diffractometer for engineering science, which means that it differs from other powder scattering systems in that it has the feature of being able to clearly define the principal strain direction same as scattering vector. As shown in Figure 4, the detector has two opposing banks, North and South, and the system can measure d in the direction of the sample axis on the North bank and d in the direction of the sample diameter on the South bank when the sample is placed at an angle of 45° as shown in this figure. This is the theory when the diffraction angle 2θ fixed at 90 degrees, but in practice 2θ is measured from 75 to 105 degrees. This would also measure the diffraction of crystals from orientations up to ±7.5° different from the nominal principal strain direction, but the effect is negligible given the nature of the sin function. The detector's detection field of view is restricted by a radial collimator, which blocks all but scattering from a central 5 mm area. A photograph of the actual diffractometer and sample mounted is shown in Figure 5. As shown in Figure 4, diffraction appears to be detected entirely in the flat in same beam plane, but the actual detector is three-dimensional and can measure diffraction at a solid angle of ±15 degrees in the out-of-plane of beam direction. The samples were mounted on a low-temperature tensile test frame, but the measurements themselves were made only at room temperature. The size of the irradiation neutron beam was limited by a slit and was 5 mm long and 10 mm wide. The beam power of the MLF target was nominally 500 kW.
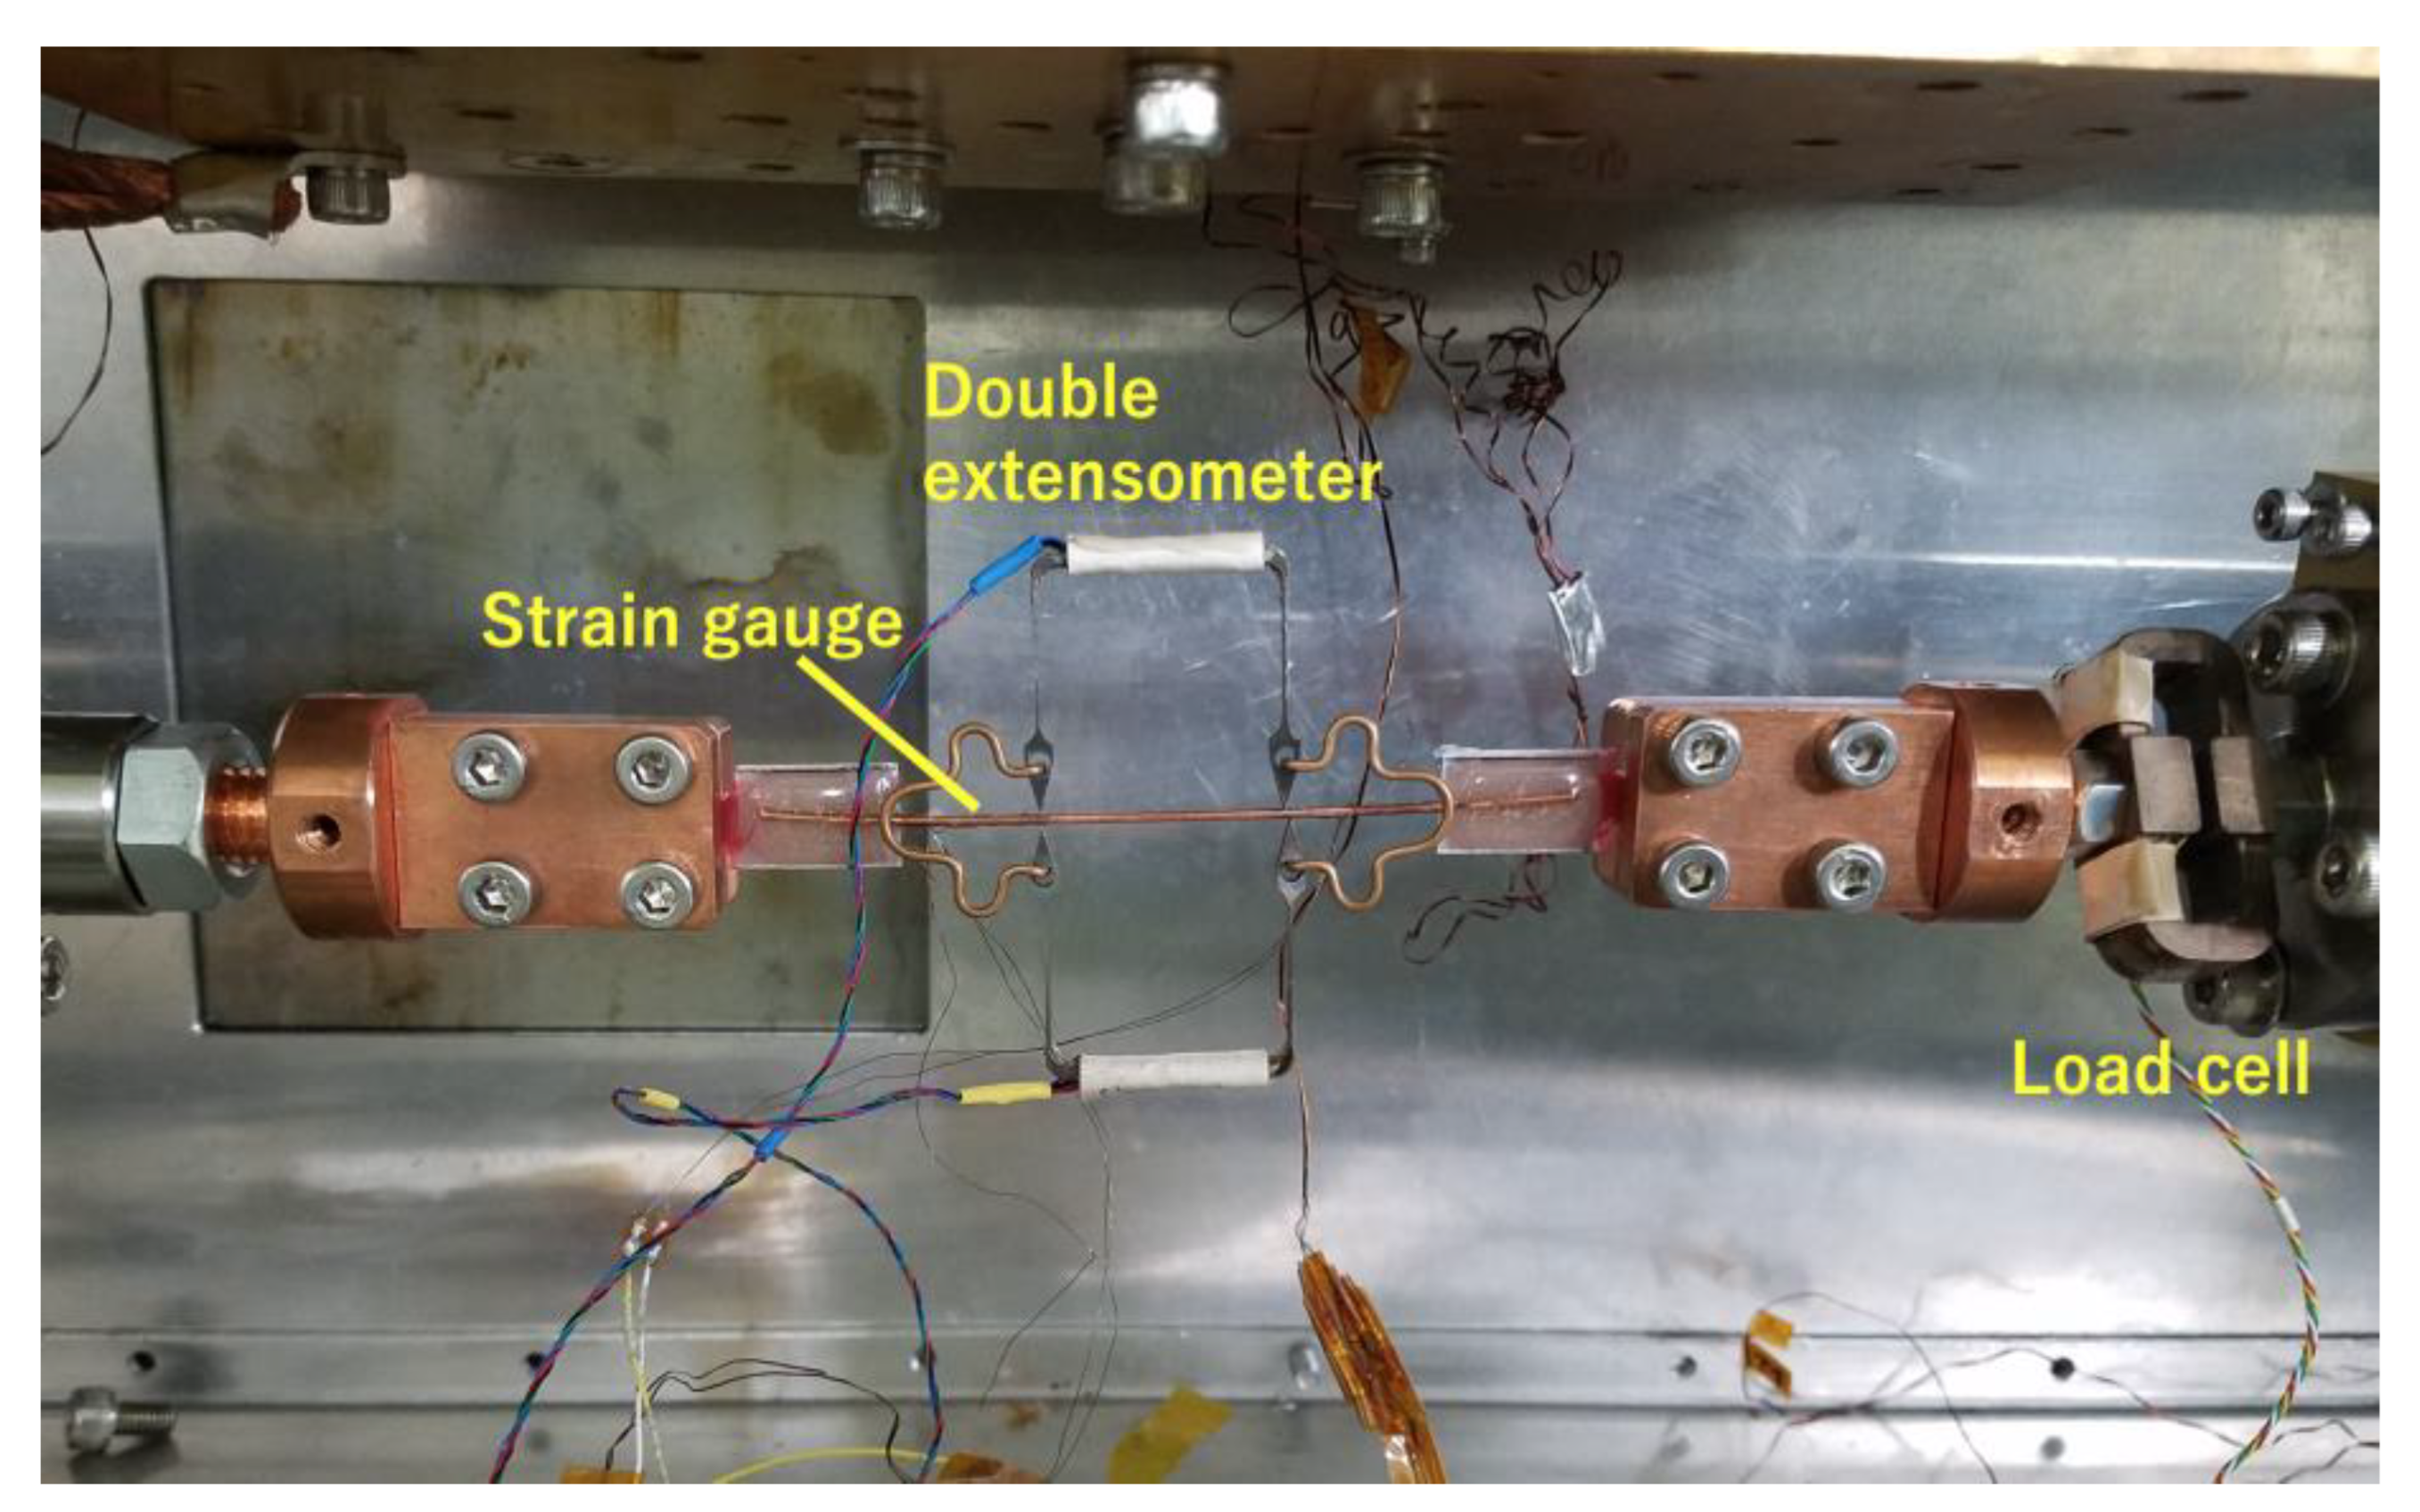
The lengths of the wires used for the tensile tests were all 100 mm. Figure 6 shows a photograph of the actual sample installation. This tensile test frame was developed as a refrigerated tensile frame and is capable of tensile testing at cryogenic temperatures of around 10 K[19], but the this measurement were conducted at room temperature. The existing load cell was originally designed for large loads of 50 KN and therefore has a large capacity and cannot be applied to the present sample. Therefore, a smaller capacity of 2 kN load cell was manufactured and set close to the sample side. Engineering strain measurements were carried out with a Niylas-type double extensometer [20]. This extensometer is compact, lightweight and accurate and is often used for tensile measurements on superconducting wires. It operates without problems at temperatures up to 4 K. The wire was fixed with epoxy adhesive on a GFRP plate on 1mm in thickness and the GFRP plate was fixed by clamping it between copper chucks. To prevent problems such as wire breakage of extensometer, strain measurements are also made using strain gauges. This is custom-made gauges, which are attached to wires of about 1 mm in diameter and can measure axial strain. As can be seen from the picture, even in neutron, single-wire measurements are possible. The ability to conduct experiments with good S/N in single wire is largely due to the powerful pulsed neutrons at the J-PARC MLF. We have performed similar experiments with reactor-based steady-state neutron sources, but that was multi-wire experiments [11]. In that case, this made experiments difficult because of variations in the load sharing of multiple wires. Considering that composite wires with a diameter of about 1 mm are used to measure the strain of the ceramics contained inside, it is assumed that experiments with a single wire would be difficult with a steady-state neutron source.
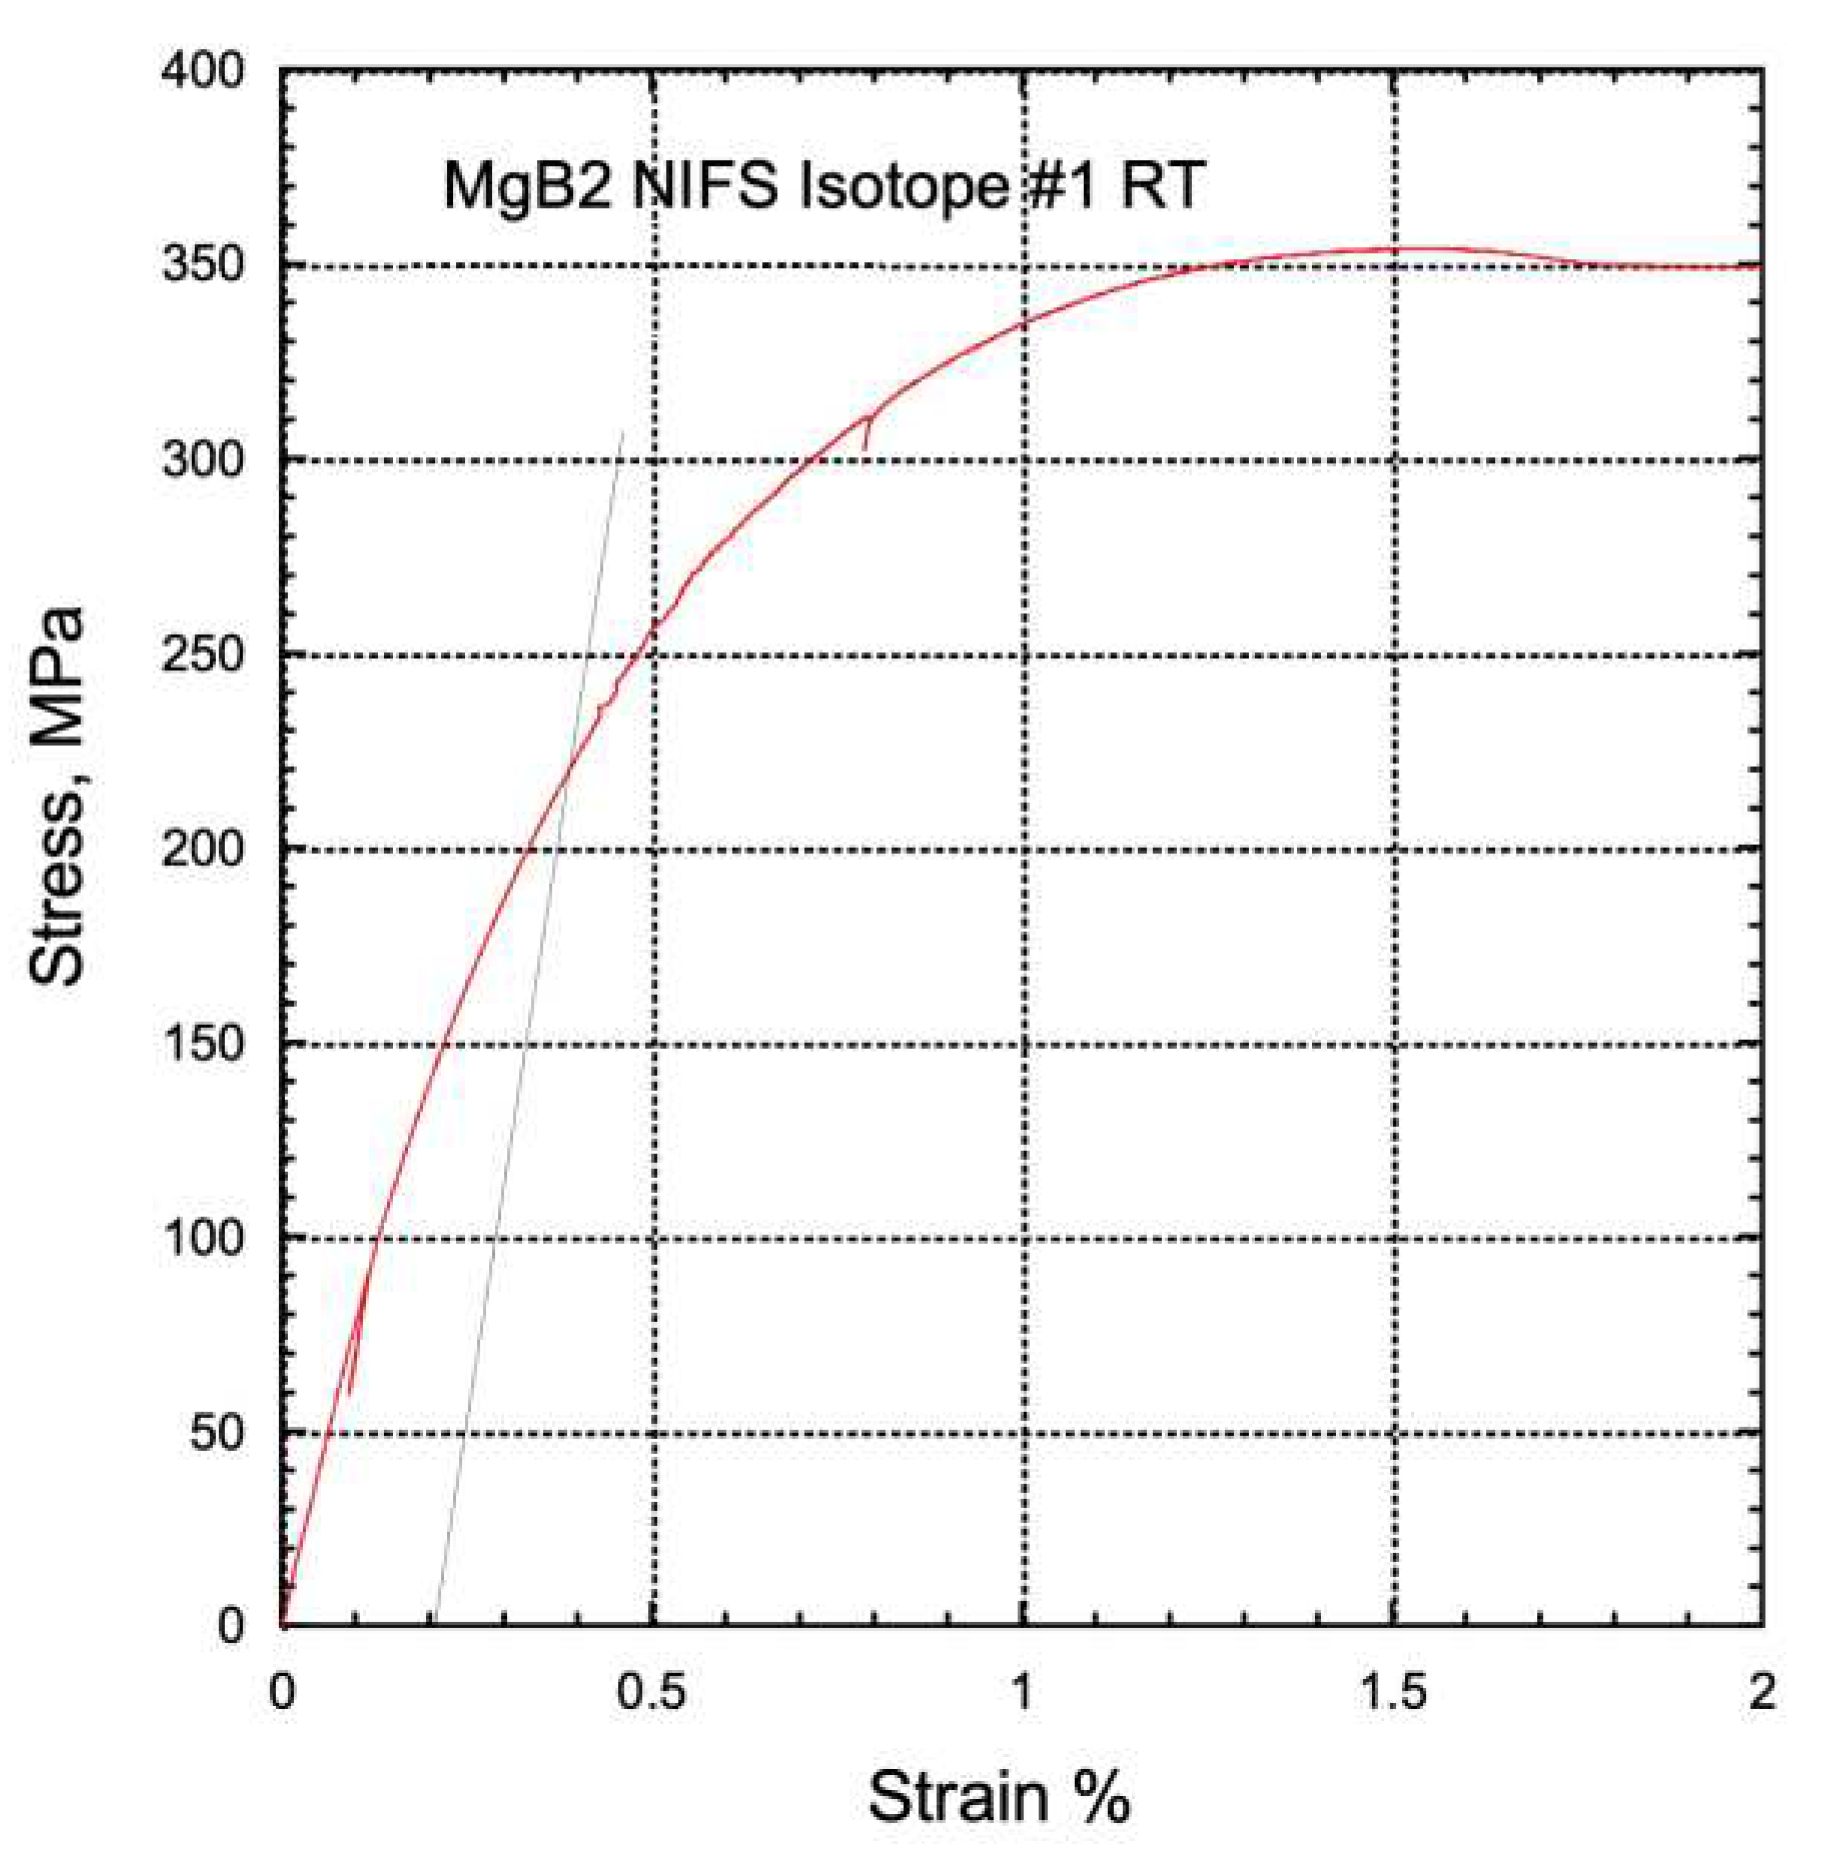
Preliminary tensile tests were carried out prior to the experiments in neutron facility. The stress-strain curve result of NIFS wire is shown in Figure 7. The load is lowered once at 0.15% strain, in order to improve the accuracy of the Young's modulus measurement in accordance with IEC standards(IEC 61788-19:2013) for the measurement of superconducting wire. Three tensile tests were carried out and the average Young's modulus and 0.2% proof stress obtained were 84 GPa and 213 MPa, respectively. The solid line in this figure is a straight line whose slope is the same as Young's modulus, starting at 0.2% strain, and the intersection of this line and the s-s curve is the 0.2% proof stress. Hypertech and Samdong have done the same, but are omitted here as there is no data to compare as results.
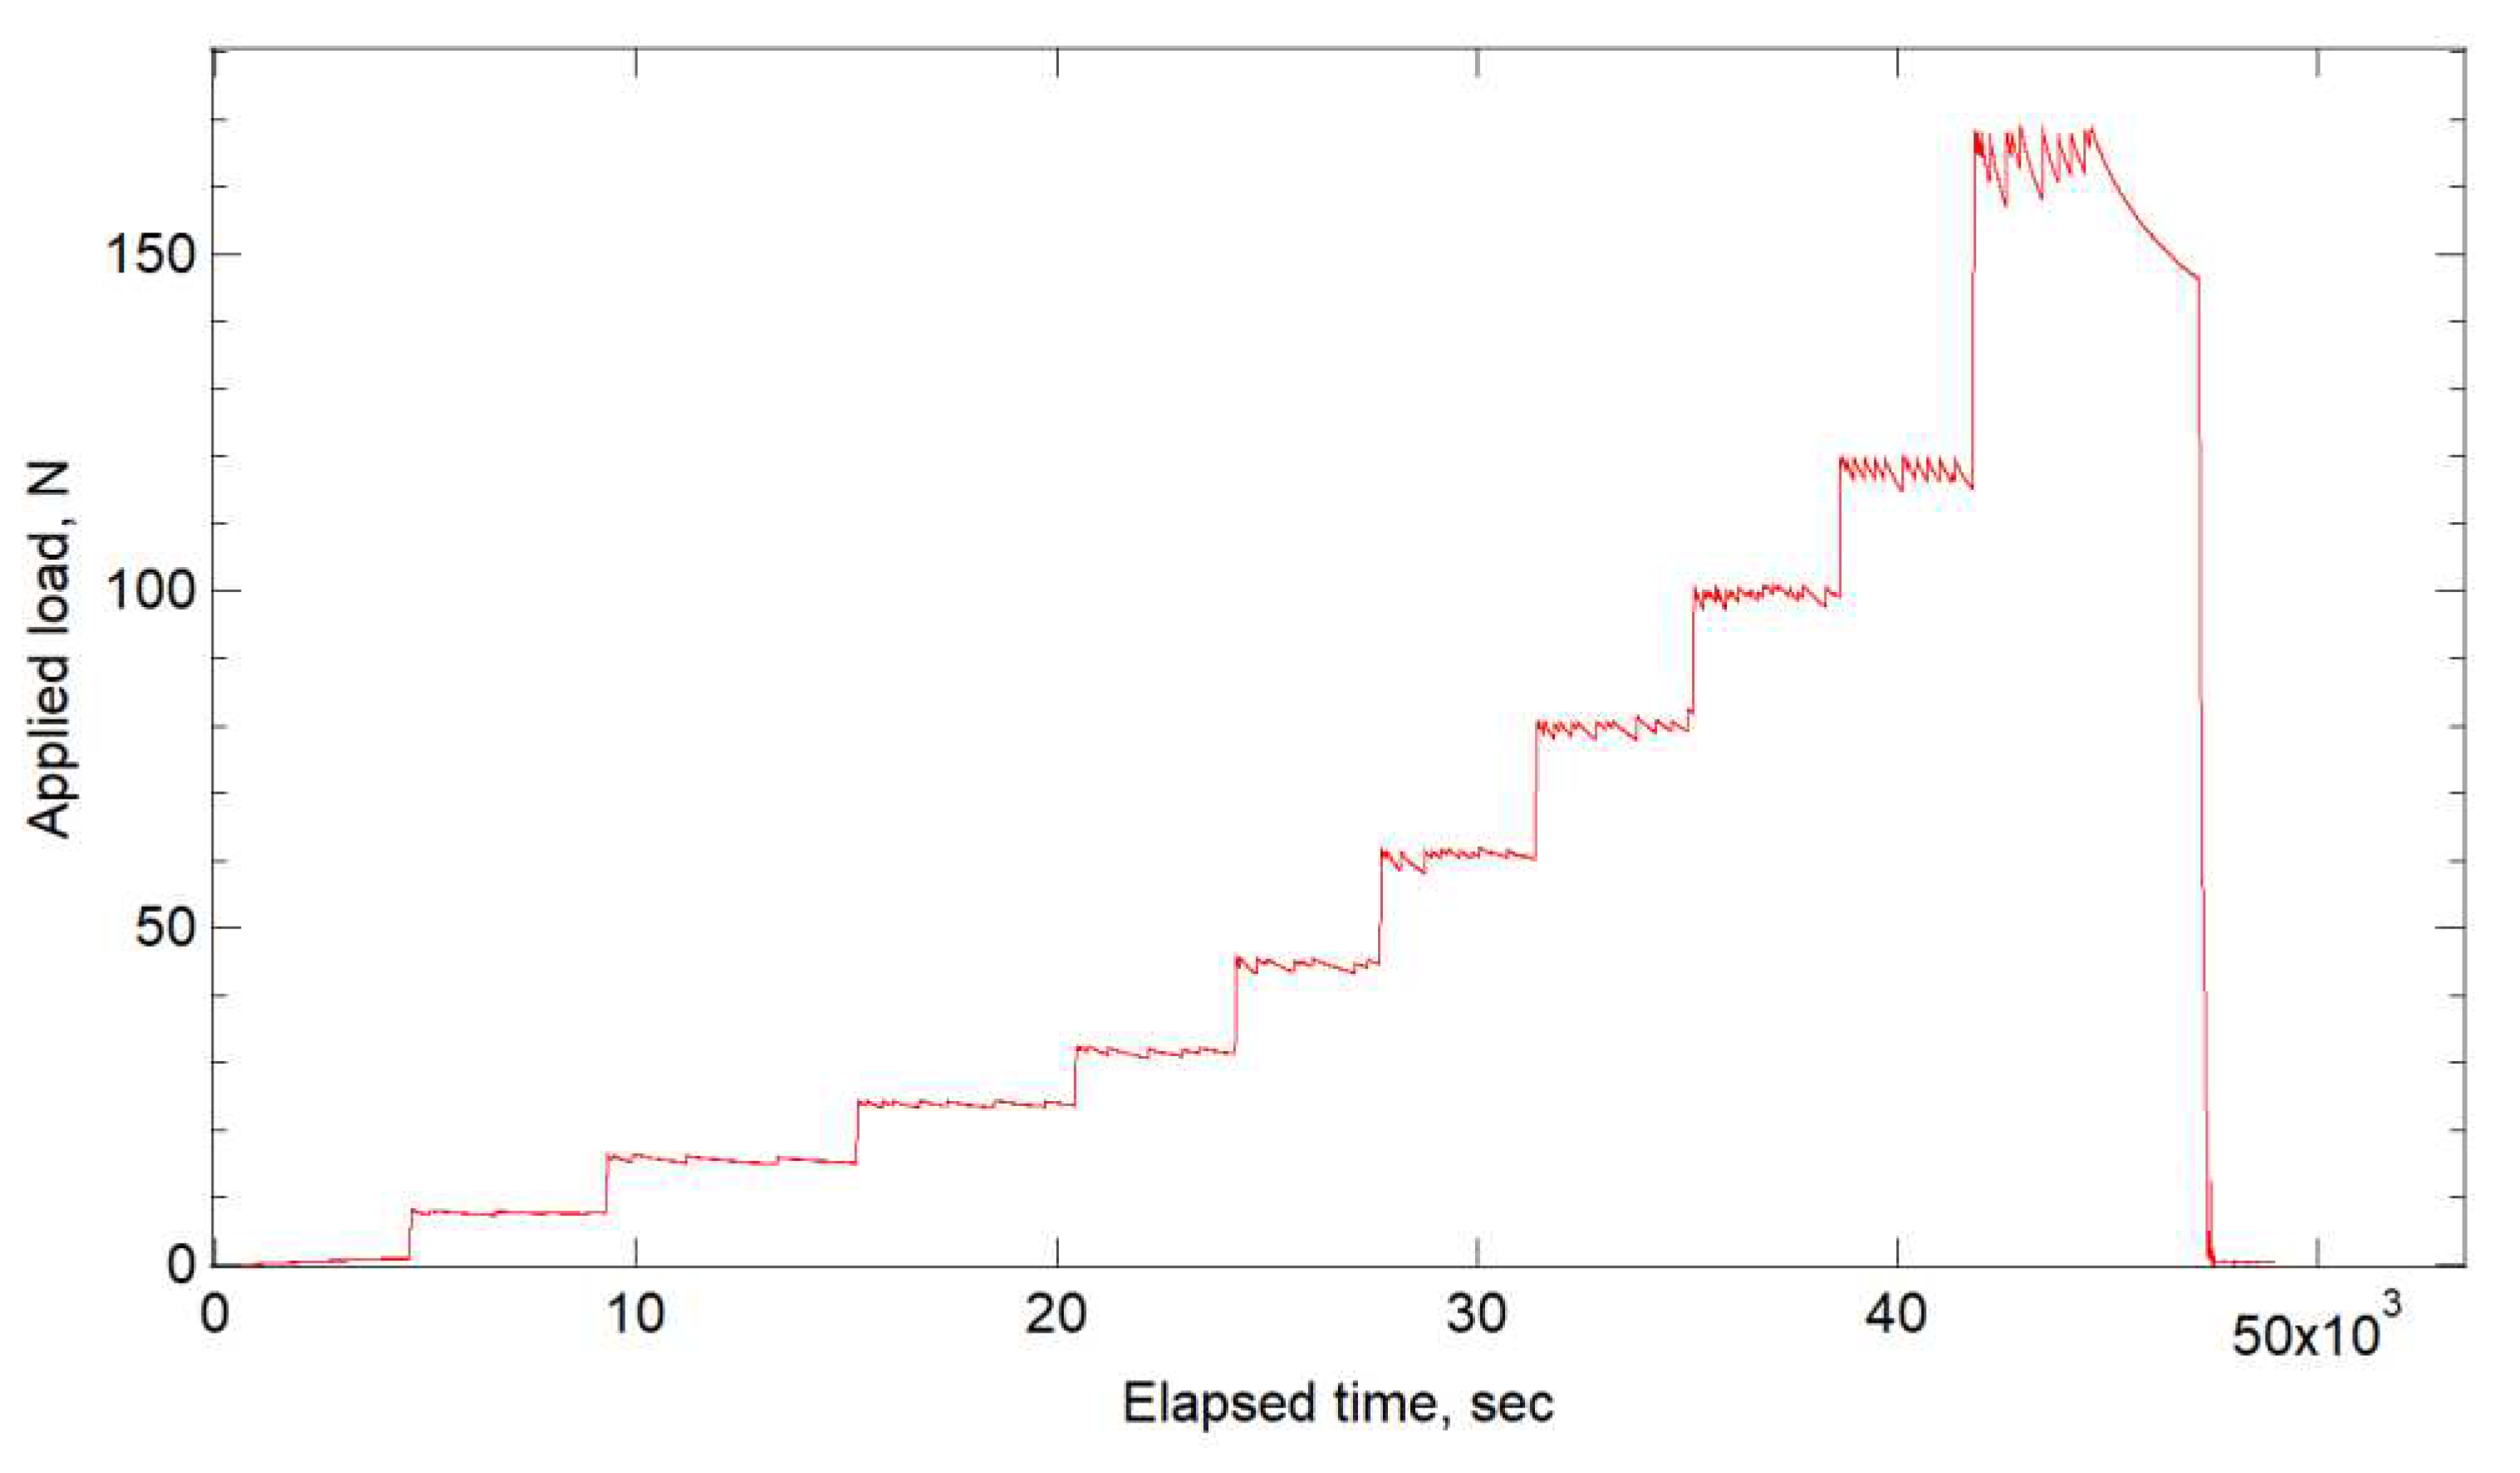
In the neutron measurements, the experiments were carried out under load control. The load steps were 0 N,8 N, 16 N, 24 N, 32 N, 45 N, 60 N, 80 N, 100 N, 120 N and 168 N at 11 points.

3. Results

3.1. Diffraction histogram by ToF method

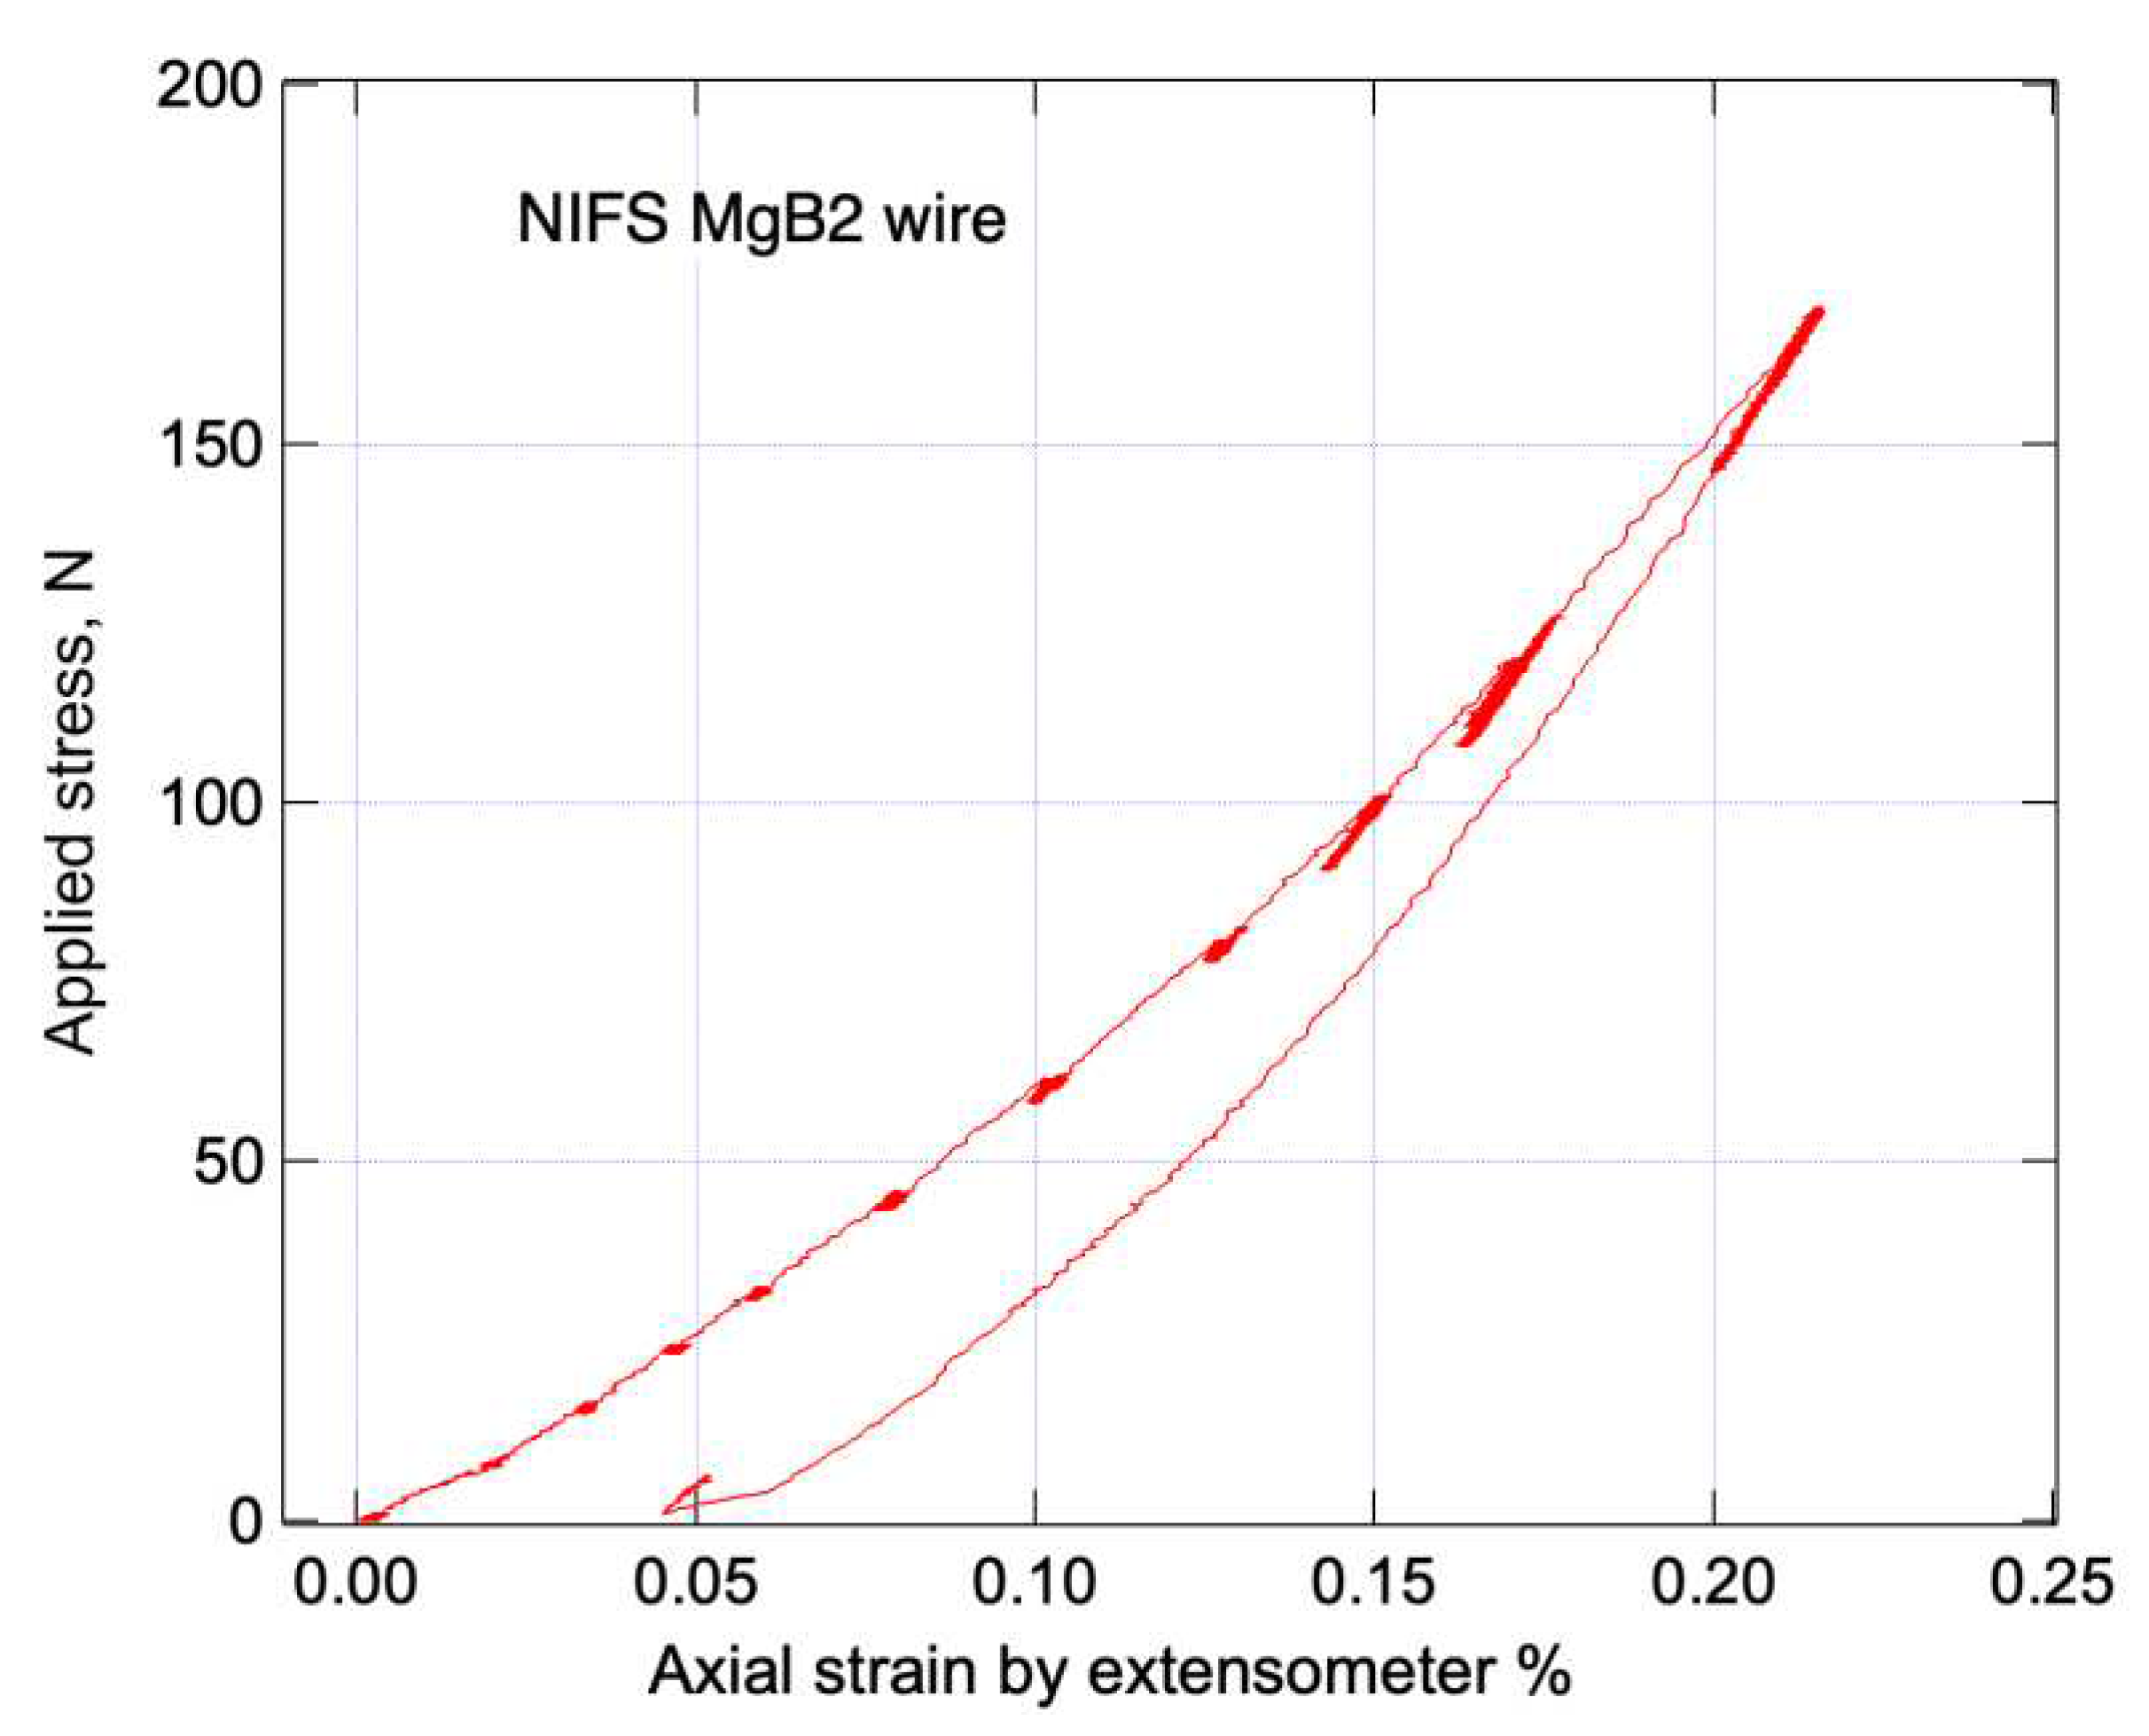
Figure 8 shows the load history of NIFS wire (0 N,8 N, 16 N, 24 N, 32 N, 45 N, 60 N, 80 N, 100 N, 120 N and 168 N), which was set to allow about 1 hour of irradiation time per step. As the load increases, stress relaxation occurs due to plasticity. Careful manual load control was used to prevent the load from decreasing too much. Some of the experiments are rather long because of the time when the beam was stopped. Stress-strain diagrams were obtained from strains and loads from double extensometer and load cell. As a horizontal type tensile frame we used, the data is slightly non-linear compared to the data from the vertical dedicated tensile frame, but generally the same gradients as in Figure 7 are obtained. The results are shown in Figure 9. In this stress-strain diagram, the data at unloading were also obtained, and the residual strain at unloading from the maximum strain of 0.216% was about 0.05%. Histogramming of ToF events was performed using all North detector events from 75° to 105°. When the load was 0, 120 minute test scan was conducted on any sample. The results are shown in Figure 8 for NIFS (11B enriched sample), Figure 10 for Samdong and Figure 11 for Hypertech. As shown in Figure 4, these wires are placed at an angle of 45° to the incident beam, so the North Bank data provides a histogram of the lattice spacing or ToF along the sample’s axis direction. The NIFS wire’s results show peaks for the included MgB2, pure copper and tantalum phases, with sufficient intensity for Rietveld analysis. For Rietveld analysis, we used Z-Rietveld[21] software, which is capable of powder diffraction data analysis and Rietveld analysis, which was developed in Japan and for which the instrument parameters of J-PARC are available. In Rietveld analysis, lattice constants can be obtained for both refined a and c values, as MgB2 is hexagonal. In general, crystals have elastic anisotropy, with some orientations being more easily deformable and others less easily deformable under the same stress, and different crystal planes have different elastic constants. Although the lattice spacing of crystals in the axial direction is elongated in tensile tests and the rate of change varies from lattice plane to lattice plane, an average lattice constant close to the mechanical properties can be obtained by refining using all peaks. Although similar calculations can be performed using single peaks, this method using Rietveld analysis is more common for ToF instruments, as it improves accuracy.
A few MgB2 peaks were observed for the Samdong and Hypertech commercial wires in Figure 9 and Figure 10. These wires are thought to contain a natural ratio of boron isotopes and about 20% 10B, which has a large neutron absorption cross section. As this experiment was carried out with a single wire, measures could be taken to increase the diffraction intensity by increasing the number of wires. However, assuming multi-twisted wires, such as superconducting wires, the diffraction intensity is likely to eventually decrease because of its own absorption problems. Materials with very large neutron absorption cross-sections, such as 10B, do not prevent per se diffraction , but absorb diffraction themselves, resulting in a significant reduction in diffraction intensity.

3.2. Strain measurement under tensile loadings

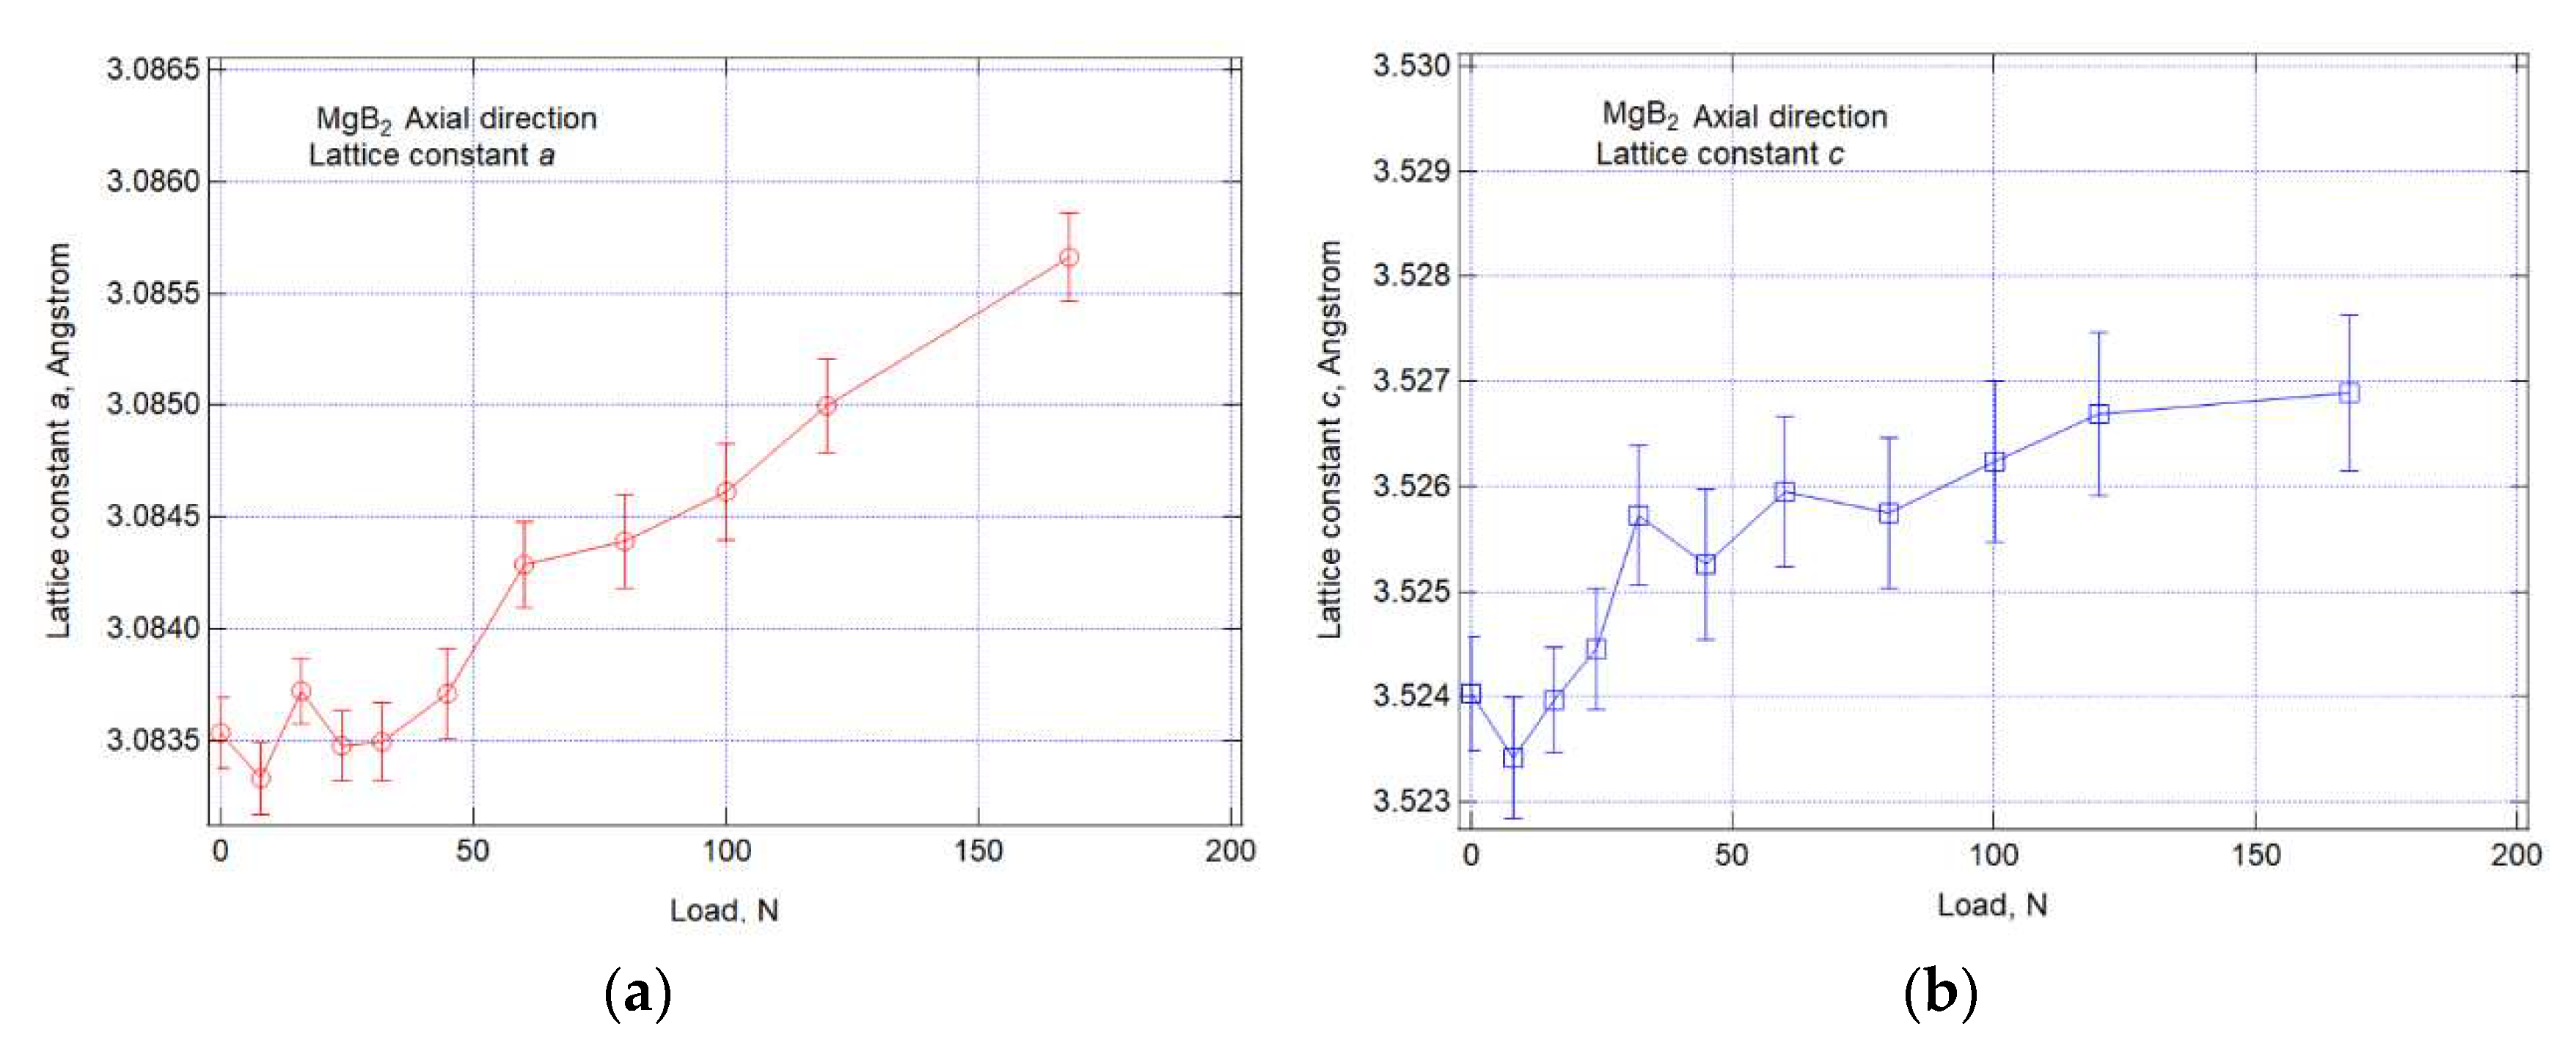
Since the crystal system of MgB2 is hexagonal, the lattice constant a and b is the same(a=c), but c, the c-axis length of the hexagonal cross section, is also an independent constant. Measurements were taken for each load and the data obtained were subjected to Rietveld analysis for each load to obtain a and c for MgB2 for each load(0 N,8 N, 16 N, 24 N, 32 N, 45 N, 60 N, 80 N, 100 N, 120 N and 168 N). The sheath materials, Ta and Cu, are cubic systems, and lattice constant a was also obtained for each load. The relationship between the axial lattice constant of the resulting hexagonal MgB2 and the loading load is shown in Figure 13. The vertical line for each marker in the diagram shows the error bars in the Rietveld analysis. The c-axis error bars are large because of the relatively low number of diffractions associated with l in the large number of diffraction planes h k l obtained. From Figure 13 (a), with regard to the a-axis, the range from 80 N to 168 N appears to vary linearly. On the other hand, from Figure 13(b), with regard to the c-axis, the change appears to be linear up to 32 N, after which the change is smaller. This problem needs to be considered in conjunction with the other phases of strain, after converting d to lattice strain, and will be discussed in the next section.
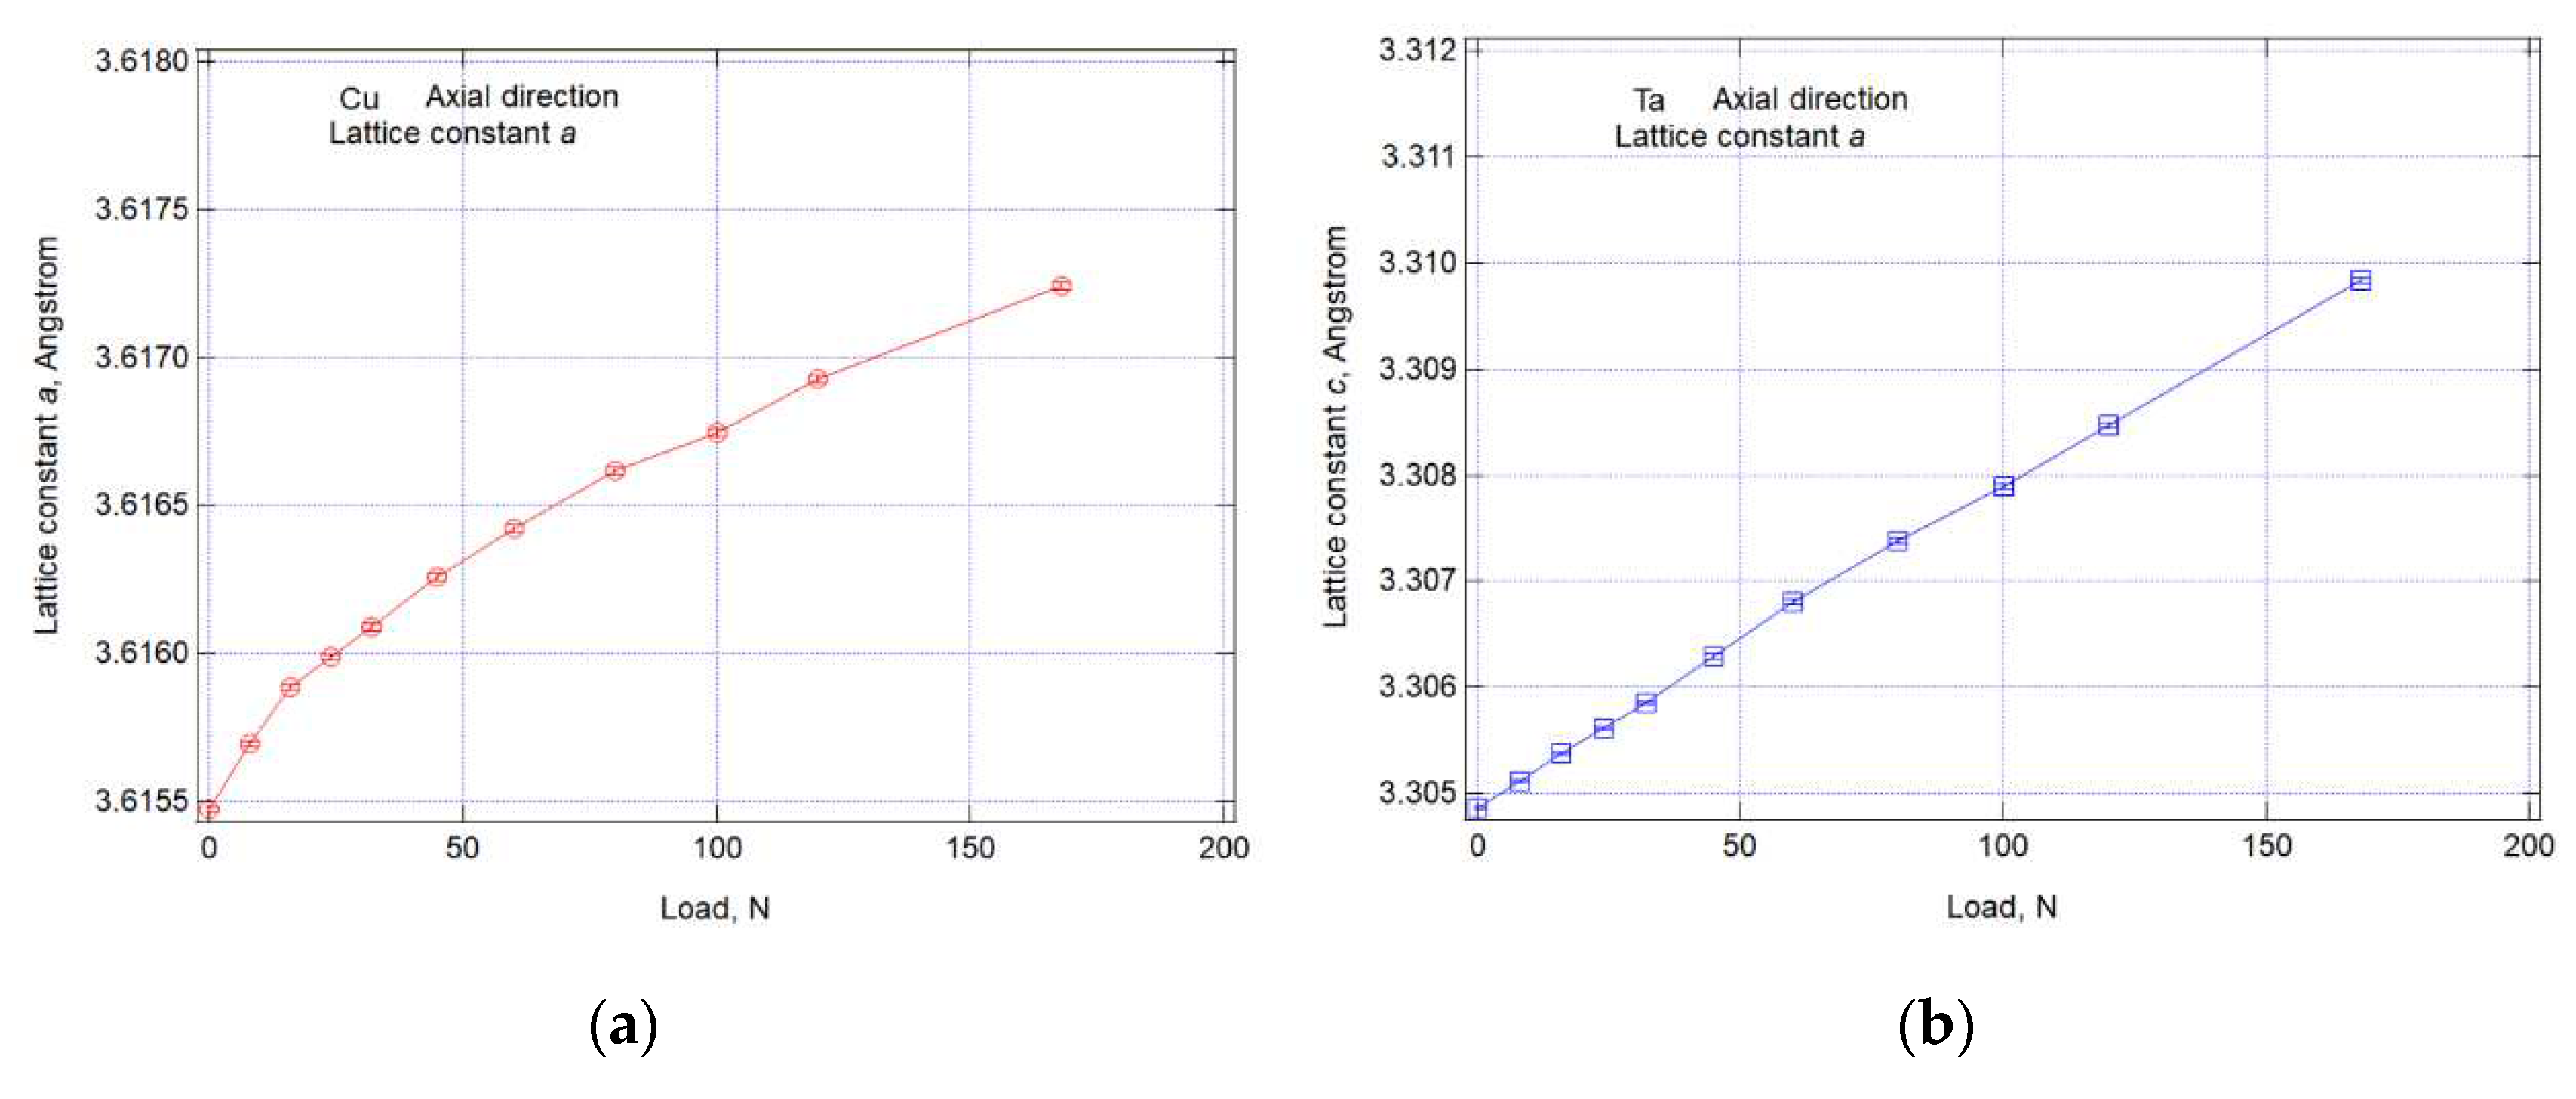
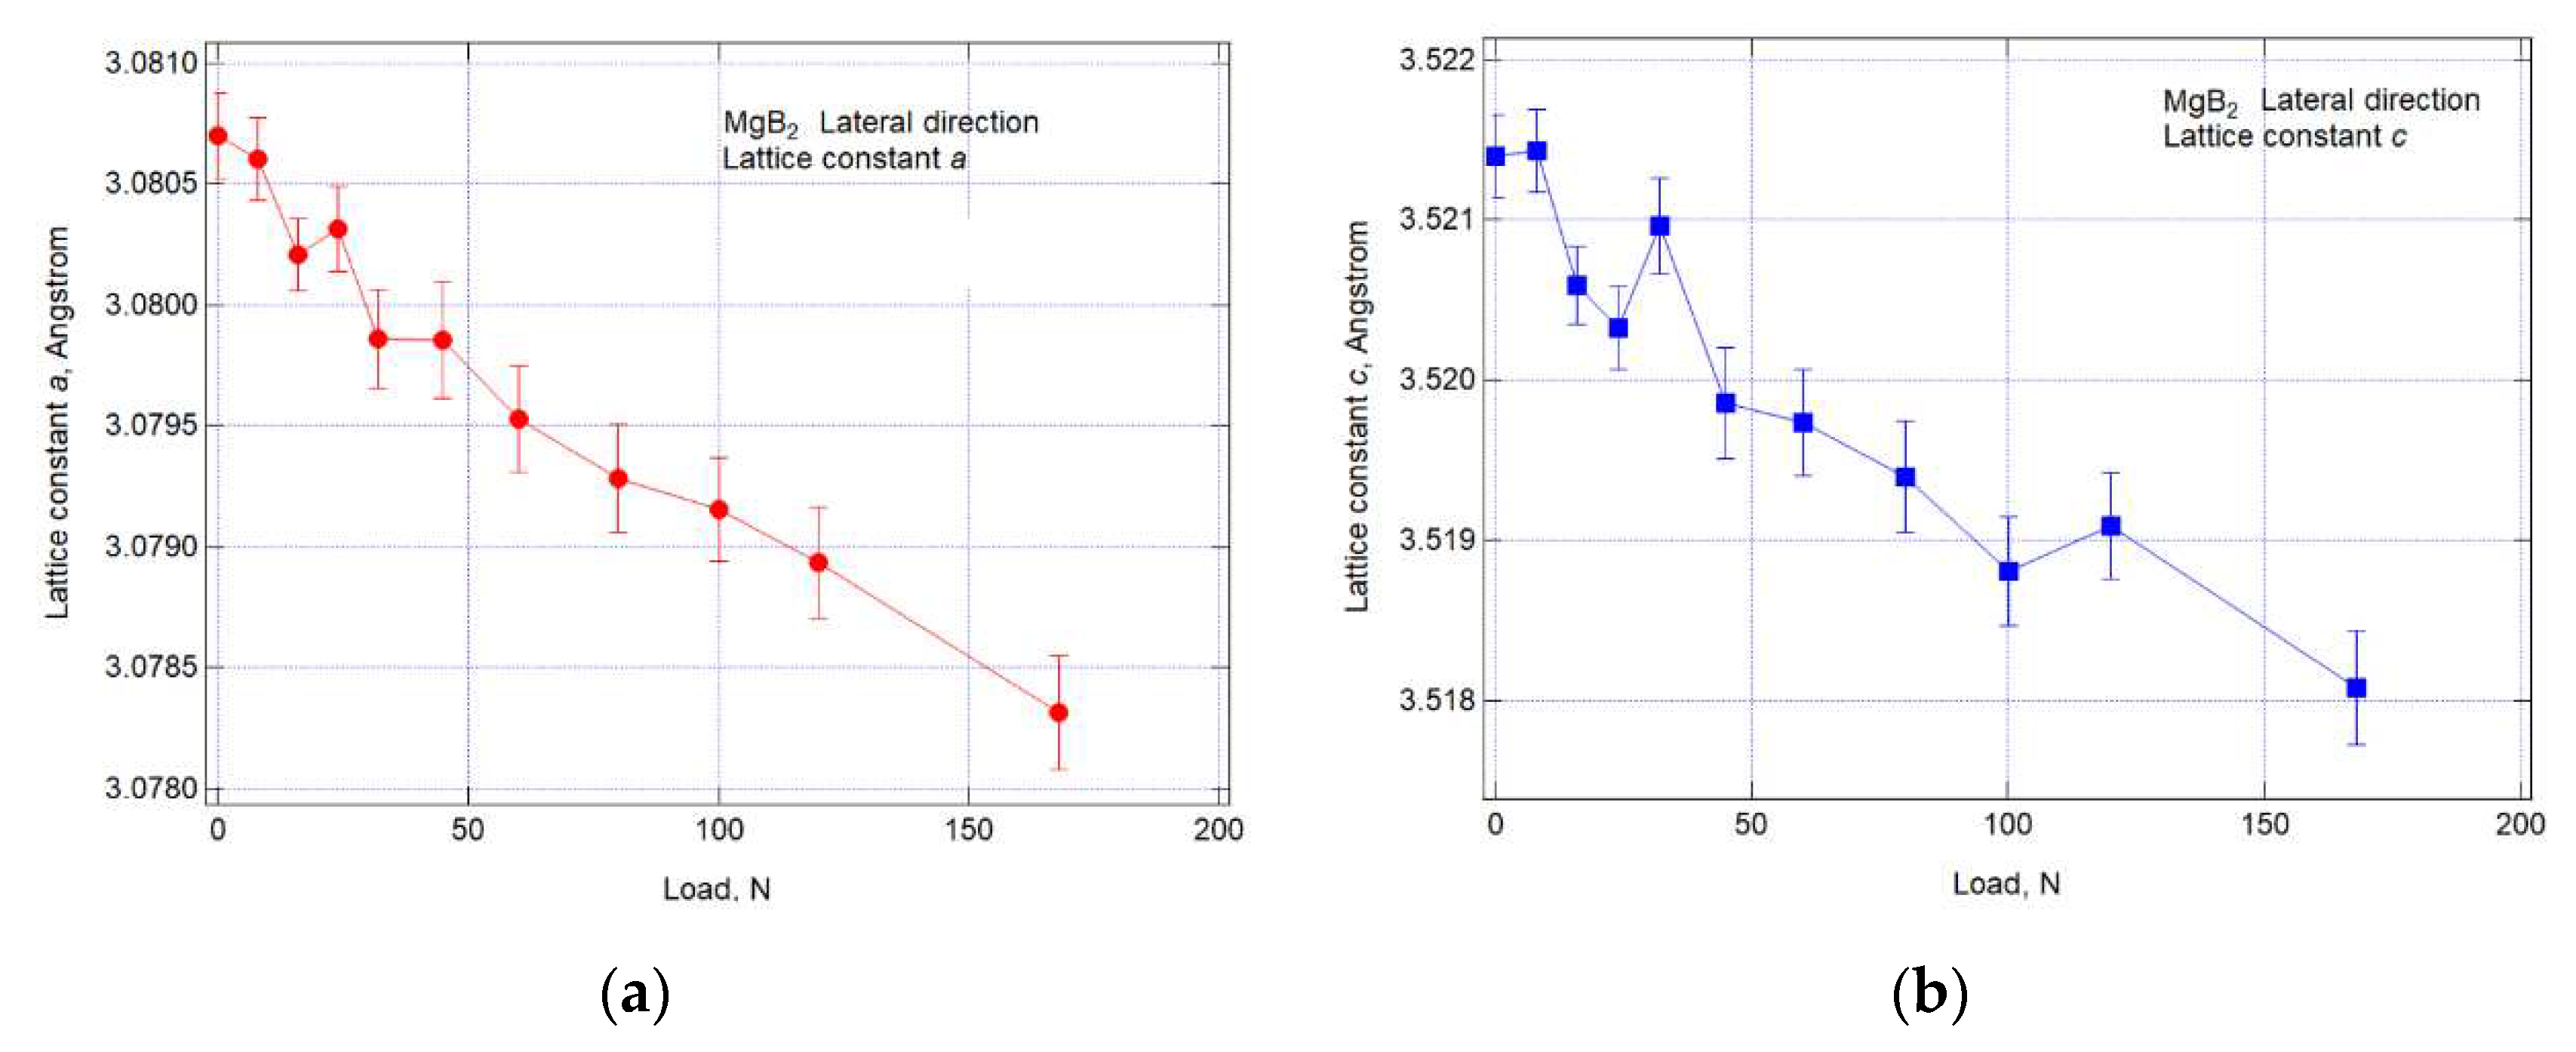
The changes of the axial lattice constants of the sheath materials, tantalum(Ta) and copper(Cu), is similarly shown in Figure 14. Figure 14(a) shows the results for Cu, where the curve is linear up to the second point, 16N, and thereafter the curve shows typical plastic deformation. Cu is likely to already have tensile residual stresses due to its low original strength and CTE mismatch, and yielding from low stresses is likely to have occurred. On the other hand, Ta shown in Figure 14(b) has the highest strength among the constituent compositions and remains linear from the beginning to the end. This linear behaviour of the tantalum proves that the loads and strains are acting on the wire as expected. Similar to previous figure, a summary of the changes in the lateral direction lattice spacing obtained from a South detector is shown in Figure 15. About this direction, Poisson's ratio here causes deformation of shrinkage, so the lattice spacing decreases as the load increases. This direction appears to change linearly from 0 to about 80N.
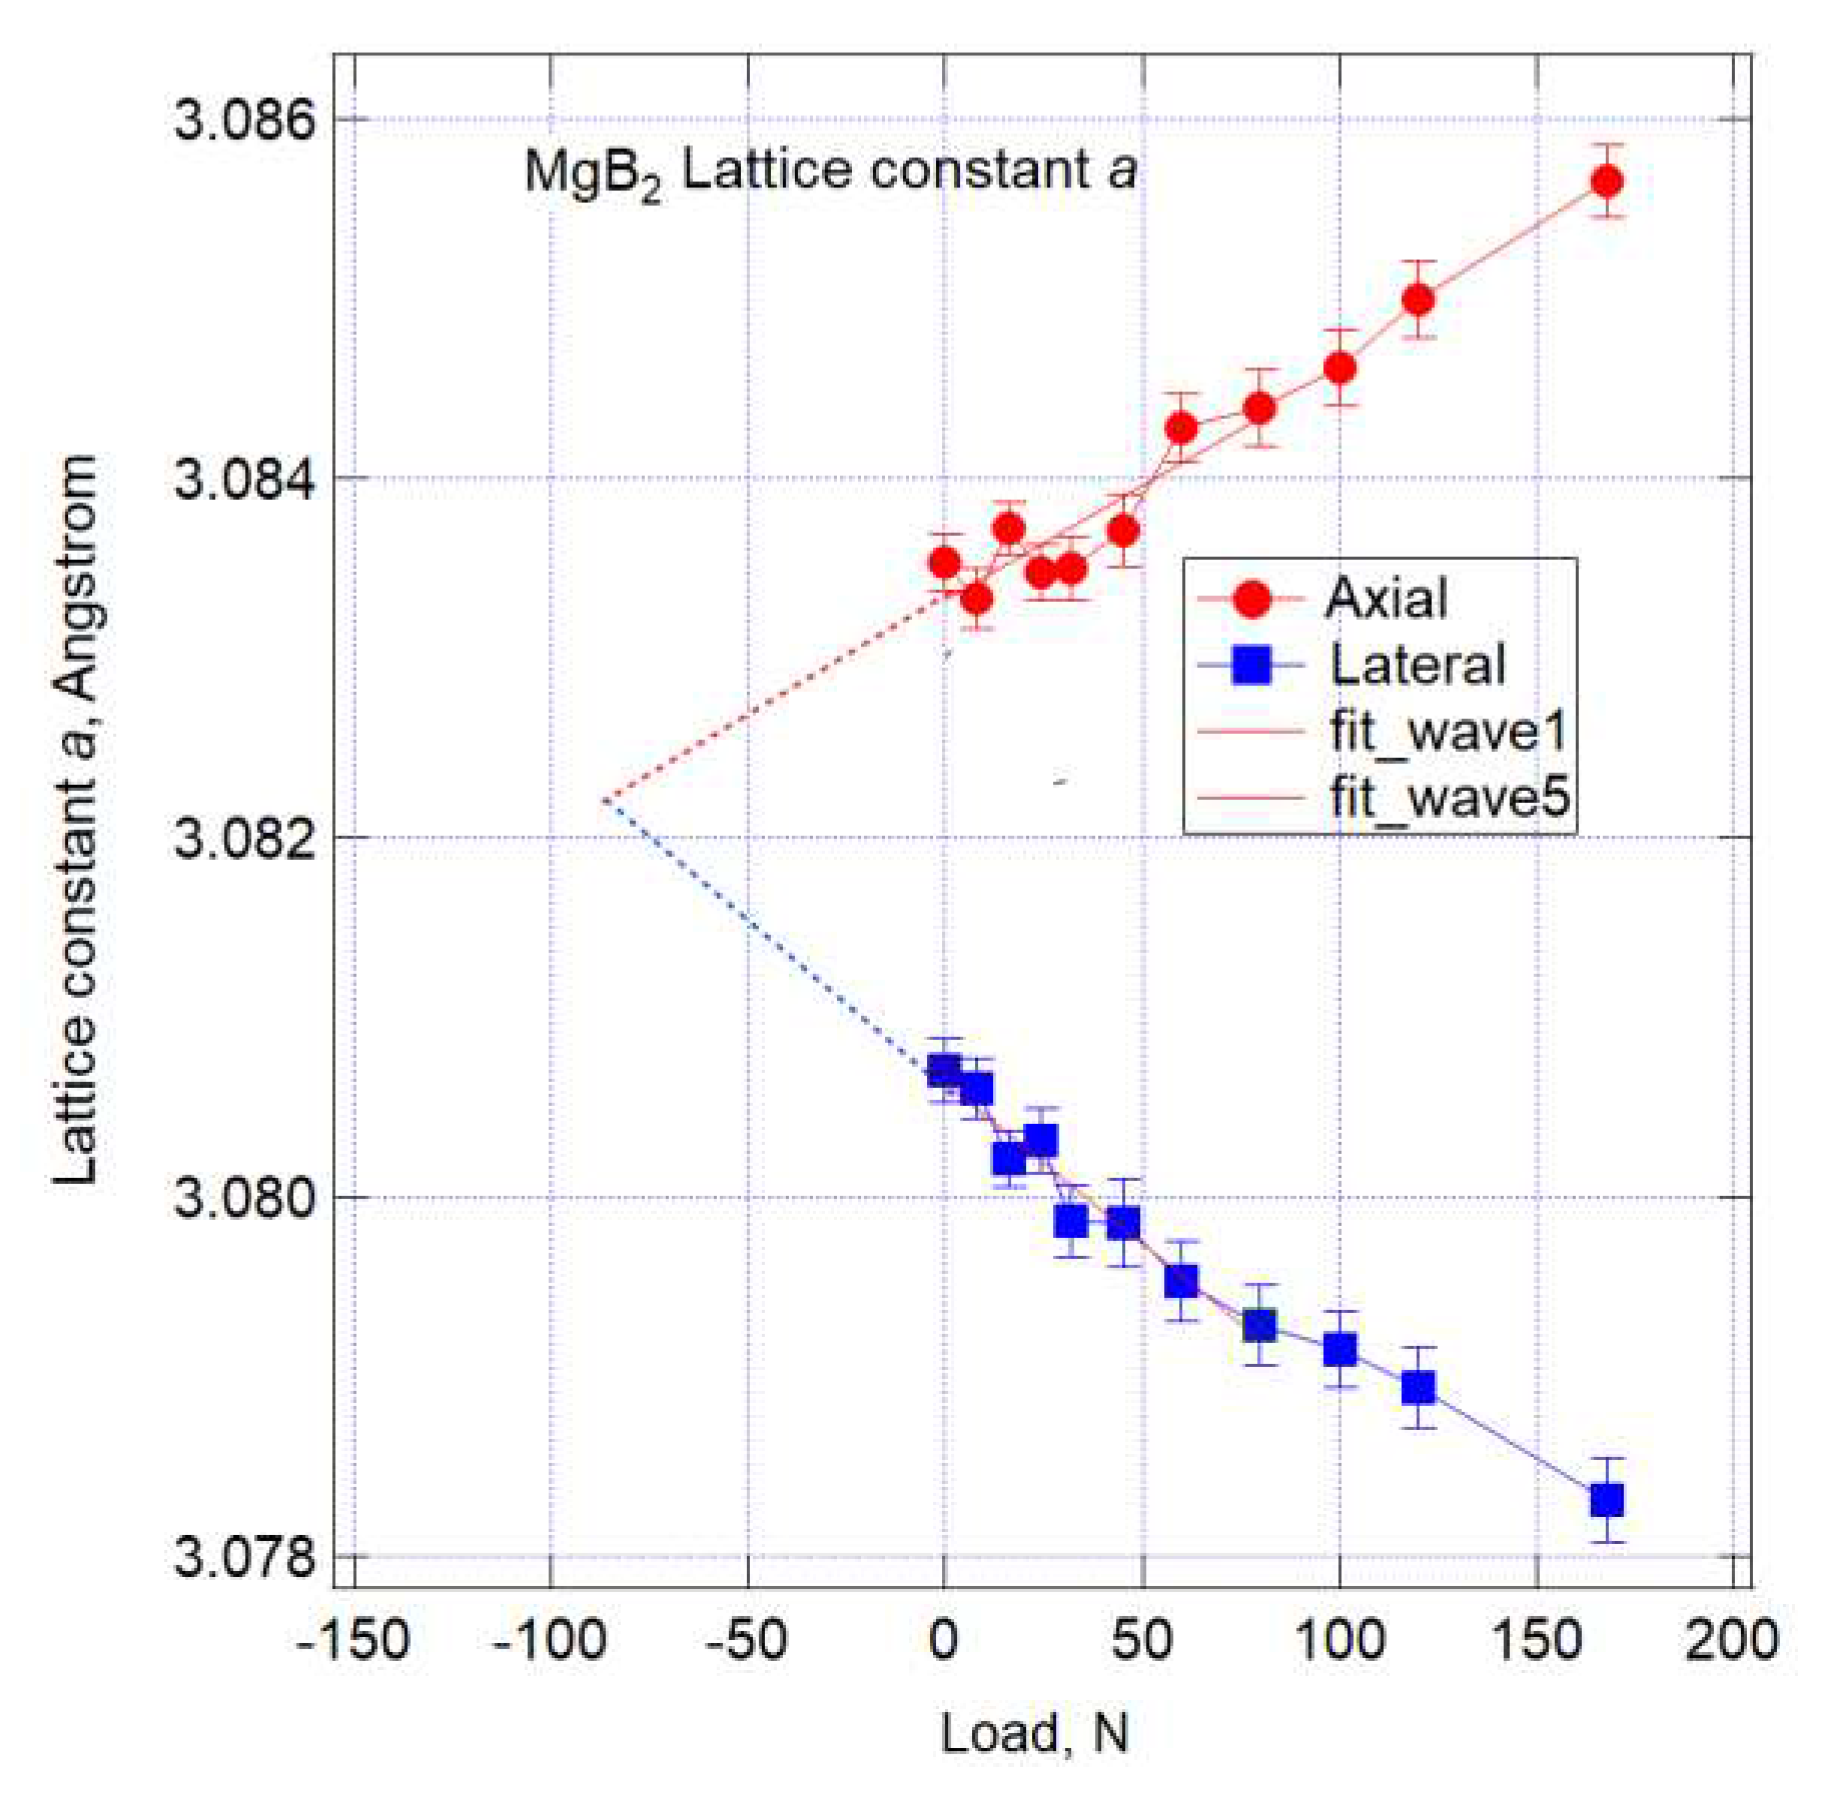
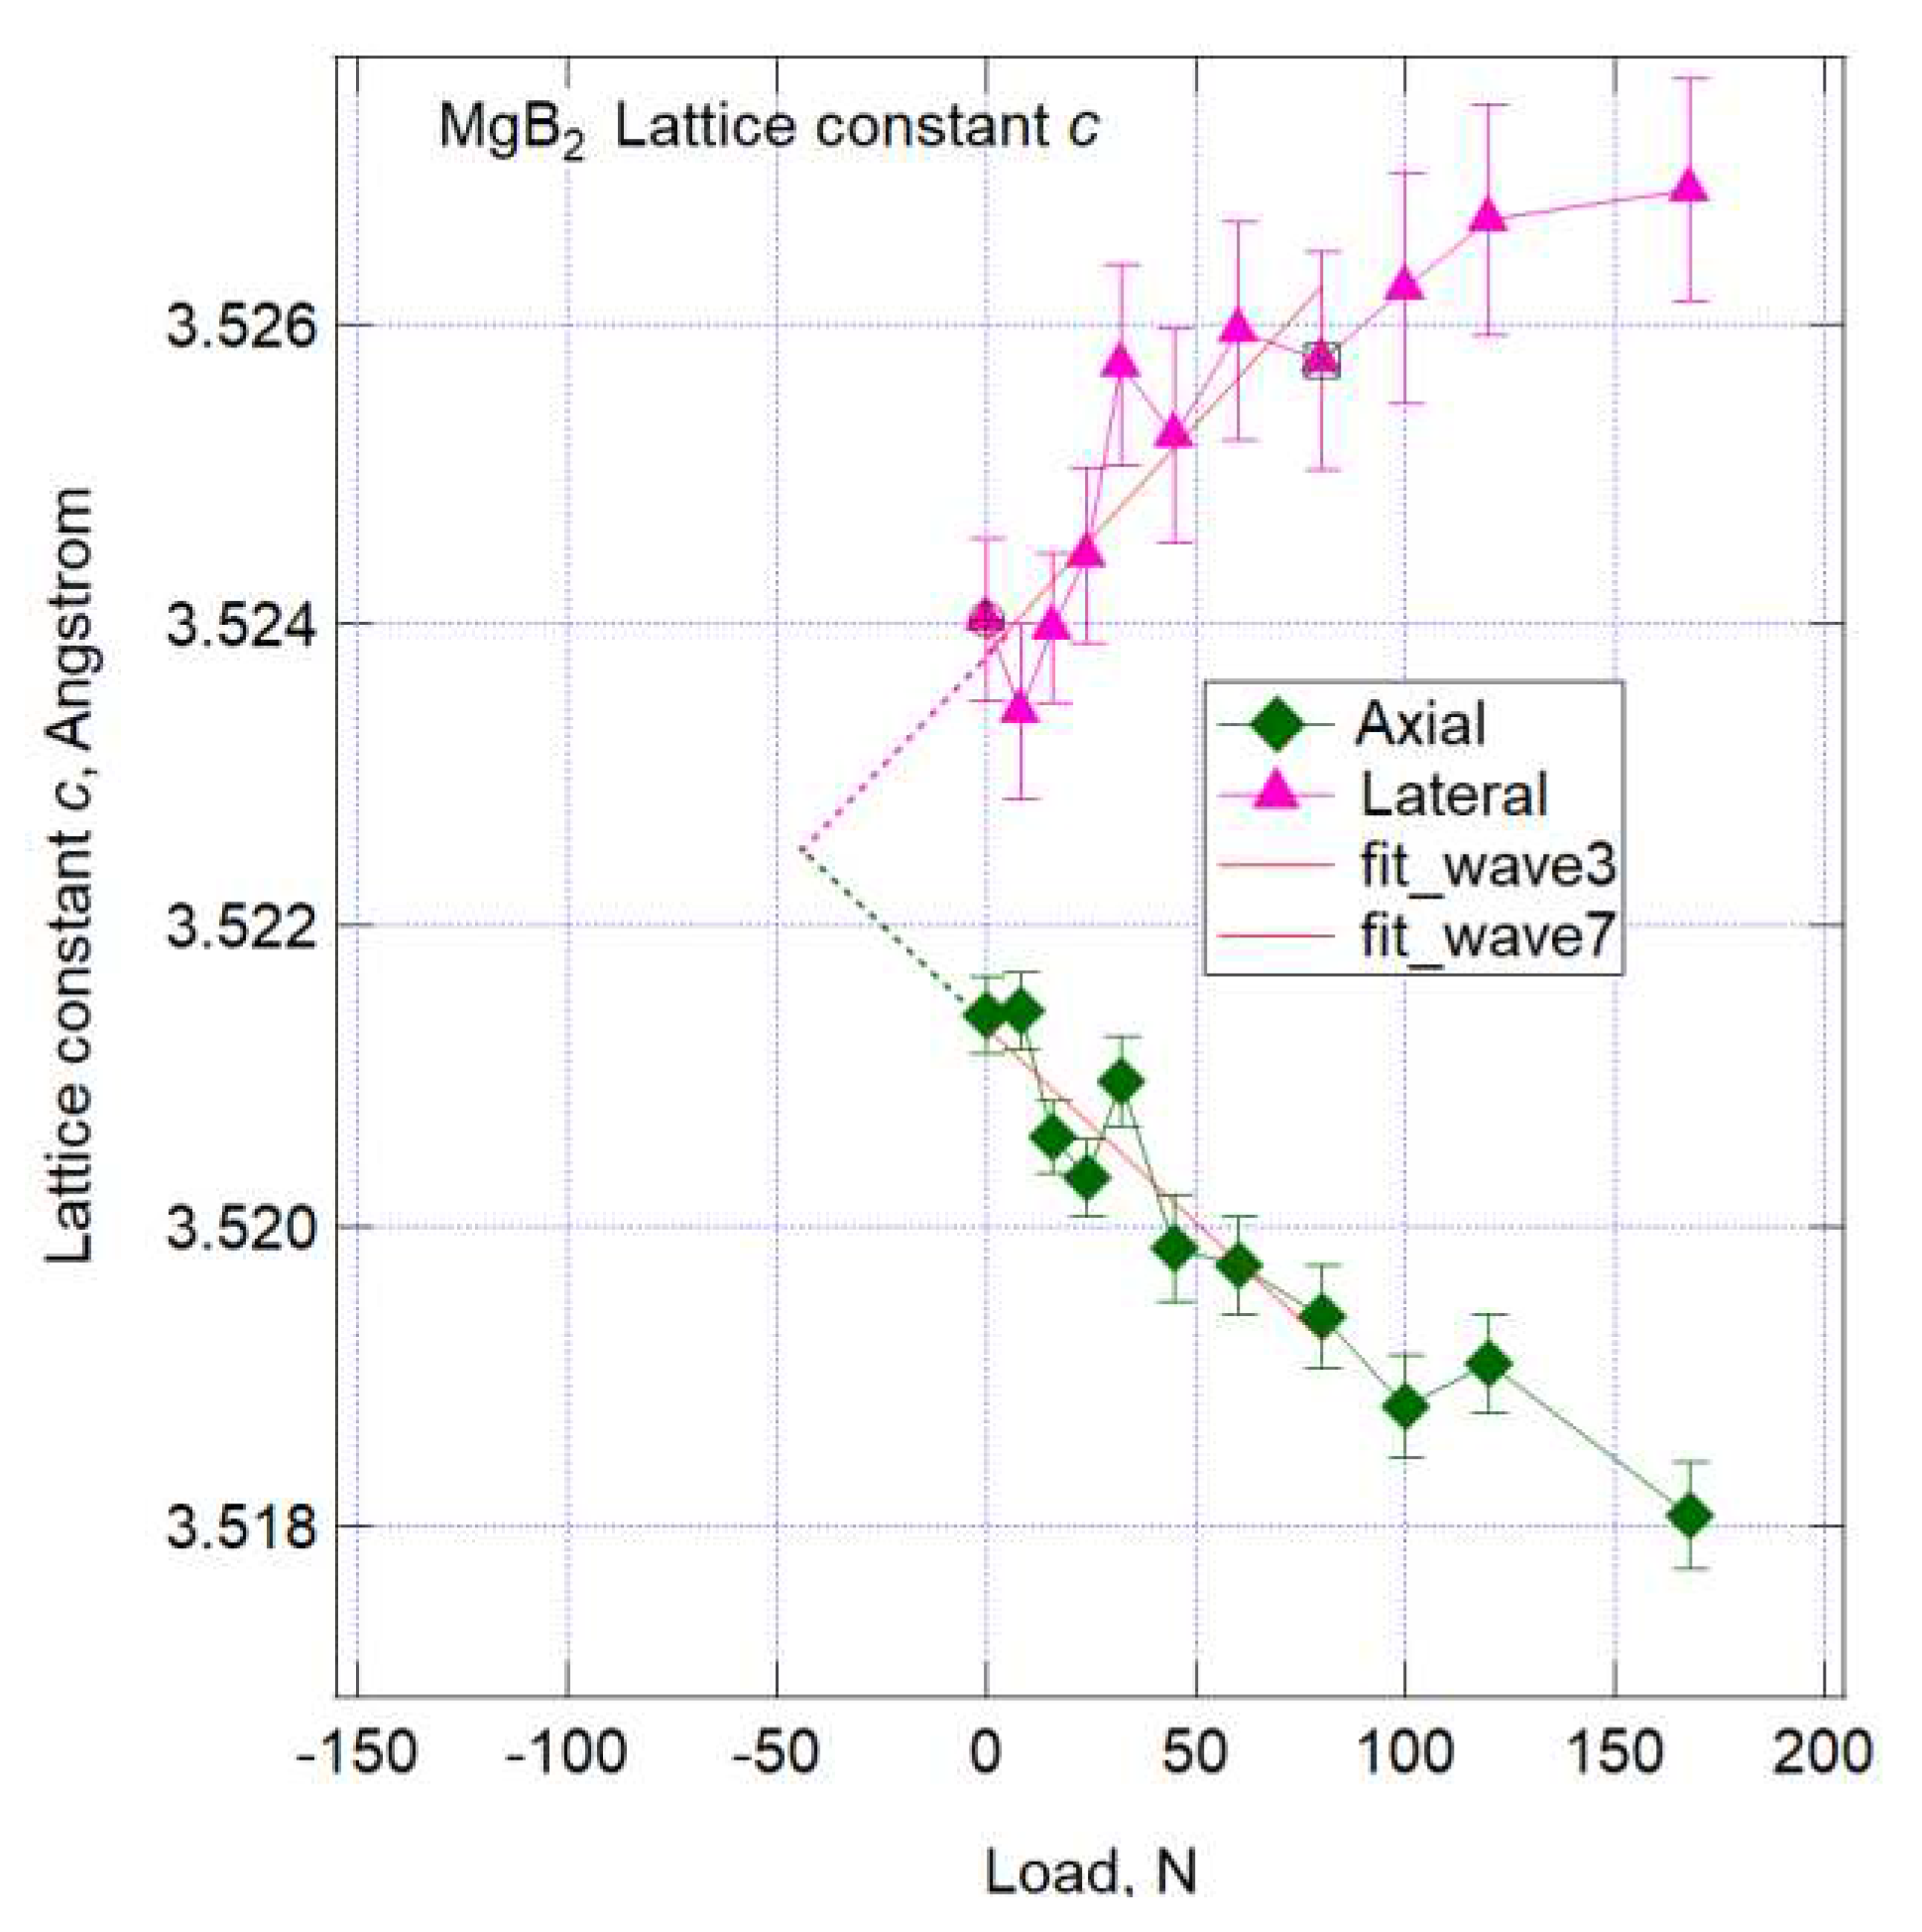
A summary plot of the changes in axial and lateral lattice constants is summarised for hexagonal a in Figure 16 and for c in Figure 17. In such tensile tests, the Poisson's ratio is generally around 0.3, which means that the lateral strain is about 1/3 of the axial strain. The slopes of the graphs in Figure 16, lattice constant a, and Figure 17, lattice constant c, showed no significant difference in slope, although there were positive and negative differences. This indicates that the strain in the lateral direction is transmitted because of compression, but the strain in the tensile direction may be relaxed by cracking, etc., from the initial tensile phase.
Residual stresses should also be considered. This time we have not prepared a filament d0 sample, which is the strain-free origin of the residual strain or stress. This wire has undergone heat treatment in the last stage of the process and is likely to have residual strain or stress from the effects of CTE mismatch. Although simplified, residual stresses can be estimated by comparing axial and lateral lattice constants. Without residual strain, both start from the same lattice constant, with axials going up and laterals going down and the difference between them increasing. In both diagrams, the lines of least-squares approximation obtained from the eight initial loading points are shown. This time, in both figures, the axial lattice plane spacing is larger and the lateral values are smaller when looking at the 0 N points. This fact means that the MgB2 filament is subjected to residual tensile strain or stress at room temperature, albeit qualitatively. By extending the straight line shown earlier to the compression side, the point where the lattice plane spacing coincides, i.e. the vicinity of no strain, can be simply estimated. The loads obtained were around -85 N for the a-axis and -45 N for the c-axis.

4. Discussion

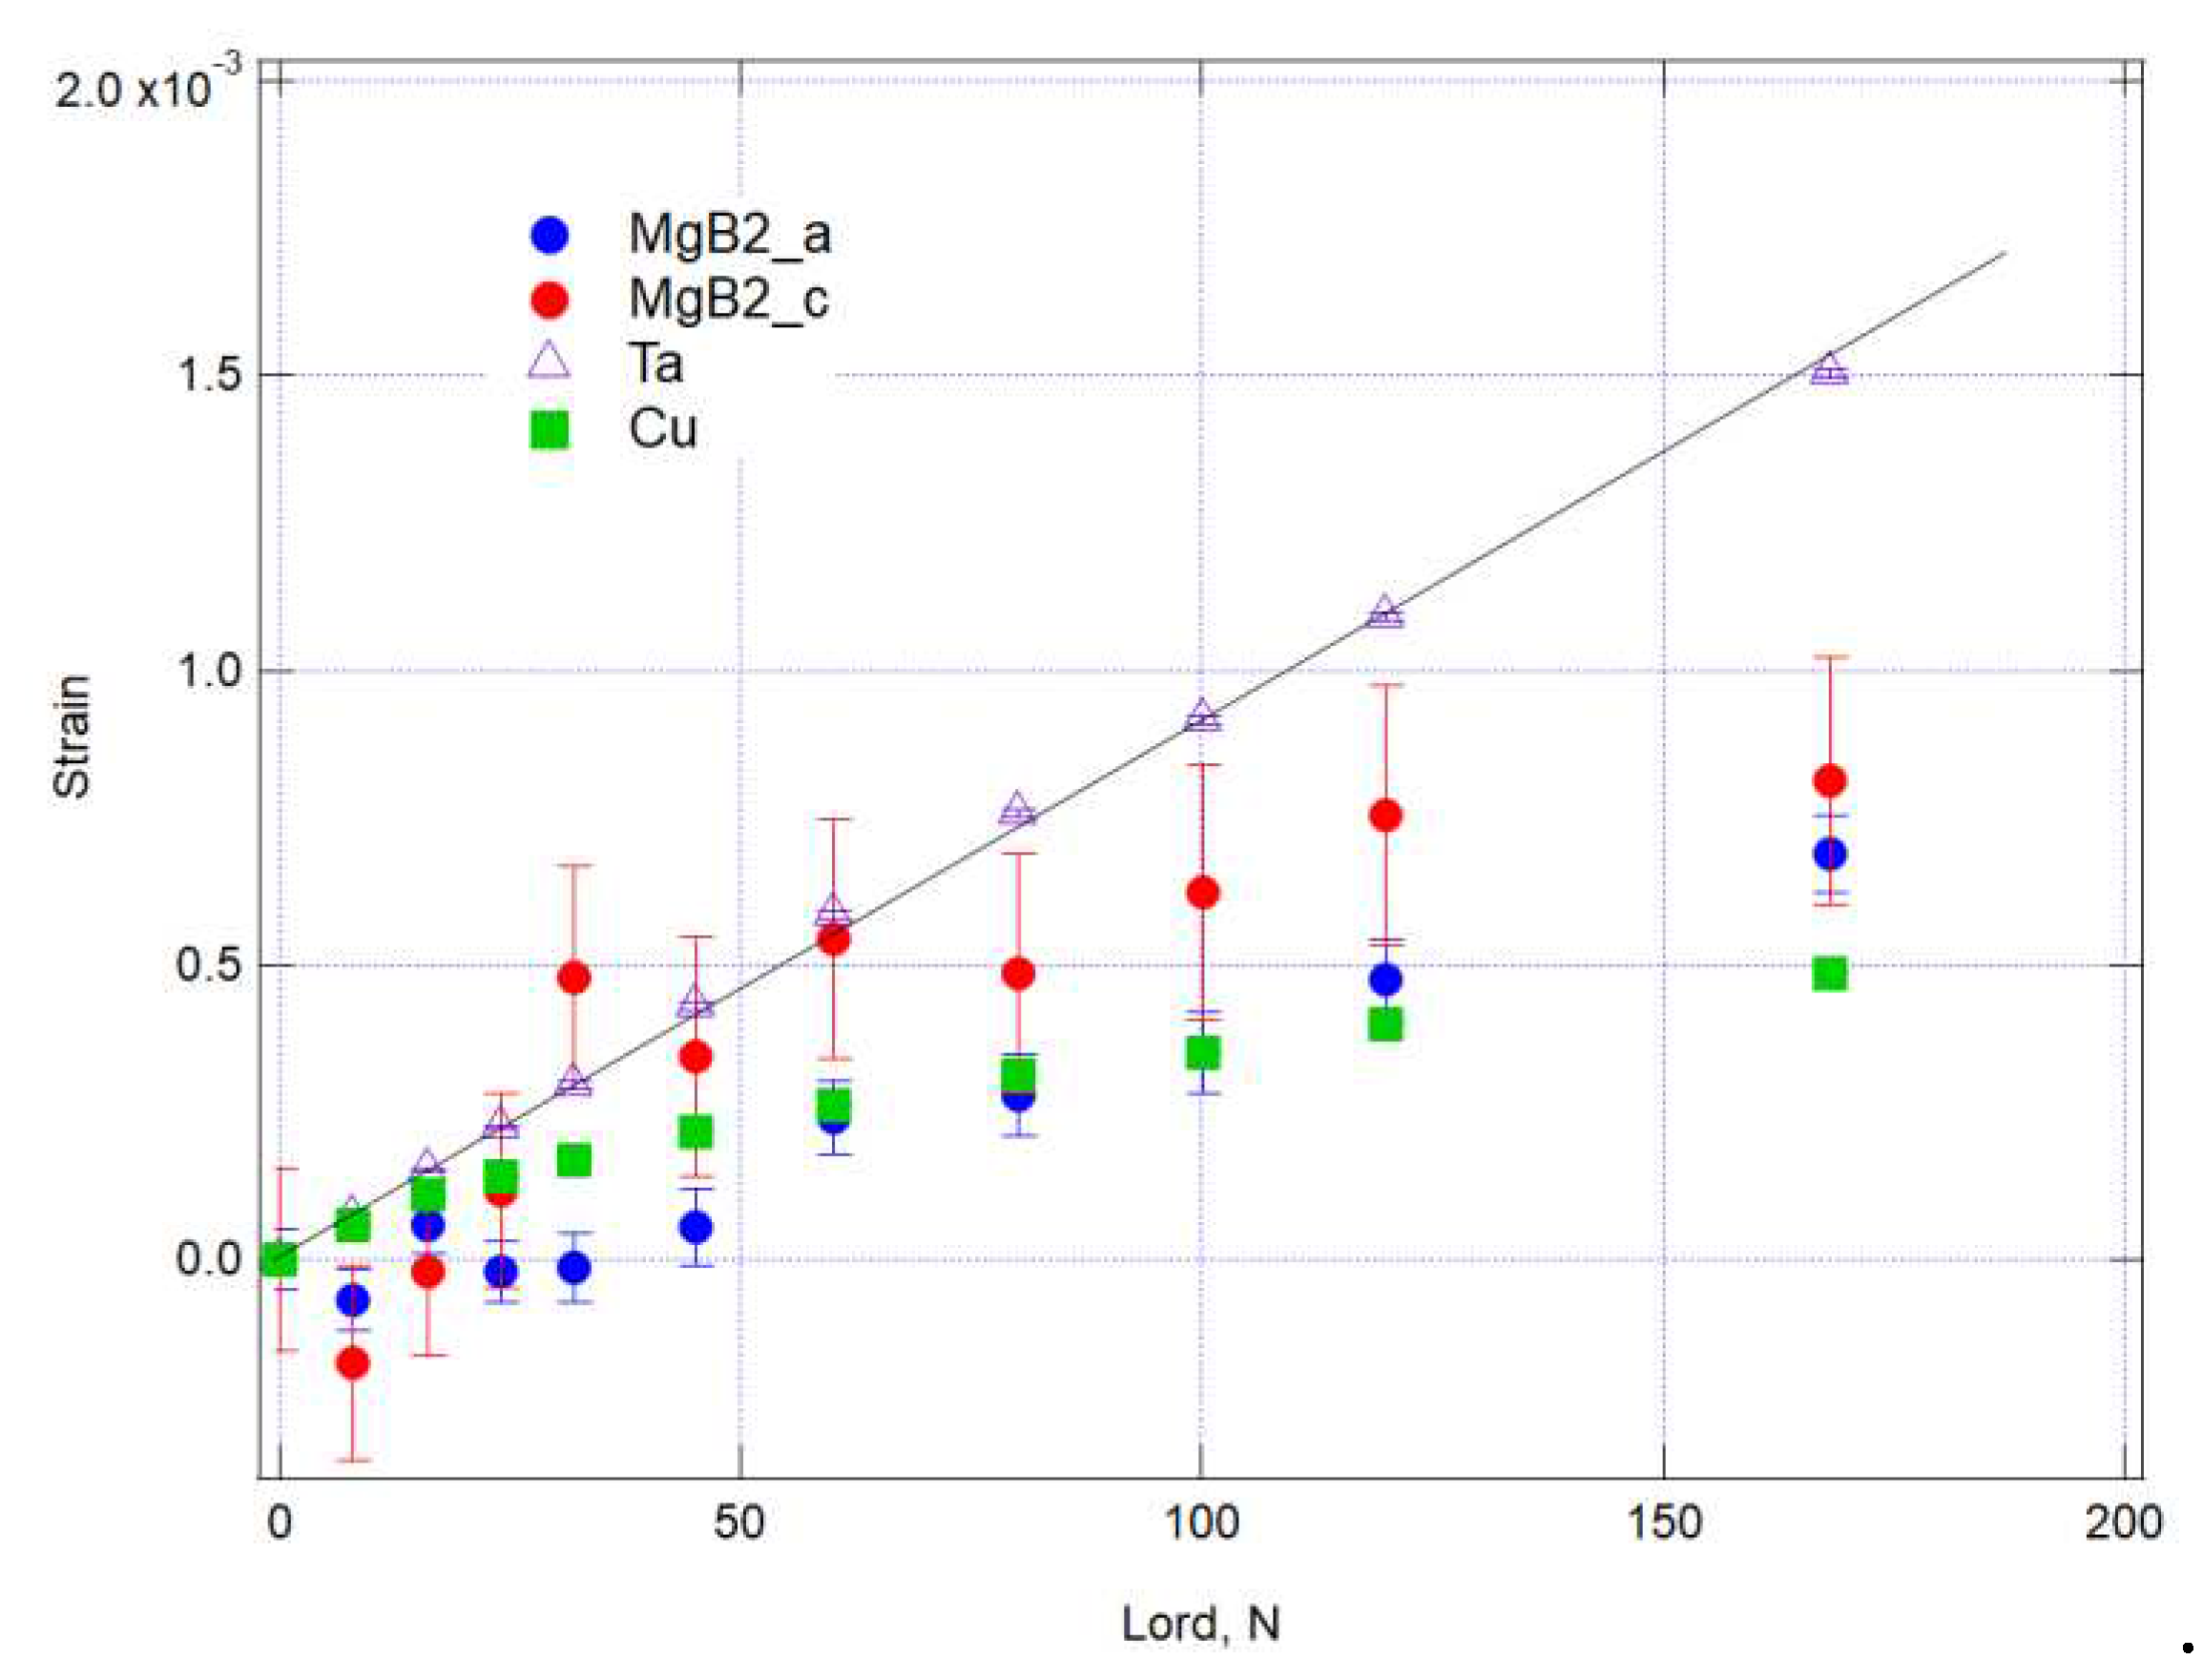
The resulting ToF was converted to d using conversion parameters and further converted to lattice strain for each crystal using equation (2). The strain was determined by taking d as d0 when the load was 0. Figure 18 show a relation between the results of lattice strain of each phase and applied load using the ToF method of TAKUMI. The vertical line at each marker in the diagram is an error bar, where the error in Rietveld analysis is converted into strain. Since Ta results had good linearity in all regions, an approximate straight line was drawn by the least-squares method only for the Ta results. For Ta in the diagram, there is a good linear relationship between strain and load from the beginning and few error bars. The fact that such a good linear relationship is obtained for a metallic element such as tantalum indicates that the wire is loaded correctly.
In strain measurements using diffraction, only elastic strain is determined, so plastic strain in the case of yielding is not observed. Therefore, it can be observed that Cu starts to yield from around 16 N and the strain sharing increases with work hardening. The slope of Ta is to be contrasted with the behavior of MgB2, assuming that the slope of Ta is equal to the slope of linear elastic engineering strain. Considering that the other phases should also vary with the slope of Ta, up to 60 N, all phases except Cu appear to change linearly. Although the a-axis of MgB2 generally appeared to change linearly in the data for lattice constant in Figure 13(a), it is reasonable to understand that by converting to strain, the lattice strain has a decreasing gradient from 60 N. A load of 60 N corresponds to 67 MPa in stress in the stress-strain diagram in Figure 7, where the strain is approximately 0.09%. The difference between the lattice parameters in Figure 16 and Figure 17 suggests that the filaments of this wire are likely to have already been subjected to tensile residual stress or strain, and failure may occur at relatively low stresses.
We have done similar experiments with Nb3Sn [11], BSCCO [12] and ReBCO [9, 10, 22] prior superconducting wires to determine filament breakage strain, but experiments with MgB2 have been difficult and this is the first measurement of such strain measurement experiment under loadings. Since it was found that strain measurement at room temperature was possible, future experiments at lower temperatures will be the subject of future work, since the low-temperature tensile testing frame used in this study can be cooled down to about 10 K. If d0 samples can be obtained, it is possible to measure axial residual strain at low temperatures, where actual results are not yet available. As a cryogenic tensile frame are already available, it is hoped that the findings of this study can be used to elucidate the residual strain in MgB2 wire, which is still unresolved.

5. Conclusions

(1)
Neutron scattering experiments on 11B enriched MgB2 wire have shown sufficient diffraction peaks of MgB2. Rietveld analysis of each phase allowed optimization of the lattice constants using approximately all peaks.
(2)
This allowed to obtain previously unreported changes in load and strain of MgB2 wires under tensile load at room temperature. The difference in lattice constants between axial and lateral directions strongly suggests that the residual stress or strain at room temperature is tensile.
(3)
The ratio of the change in lattice constant to load in the axial and lateral directions was close, indicating that the axial strain may be relaxing.
(4)
About 2 types of commercially conventional practical MgB2 wire, scattering experiments were performed for 7200 sec but no analyzable MgB2 peaks were obtained. This suggests that it is almost impossible to obtain diffraction of MgB2 in neutron scattering experiments for boron with natural ratio isotopes.

Acknowledgments

the neutron experiment at BL19 Takumi of the Materials and Life Science Experimental Facility of the J-PARC was performed under a user program 2019A0178.

References

  1. Nagamatsu, J.; Nakagawa, N.; Muranaka, T.; Zenitani, Y.; Akimitsu, J. Superconductivity at 39 K in magnesium diboride. Nature 2001, 410, 63–64. [Google Scholar] [CrossRef]
  2. Ballarino, A; Flükiger, R; Status of MgB2 wire and cable applications in Europe. J. Phys. Conf. Ser. 2017, 871, 012098.
  3. Marino, I,; Pujana, A.; Sarmiento, G.; Sanz, S.; Merino, J.M.; Tropeano, M.; Sun, J.; Canosa, T.; Lightweight MgB2 superconducting 10 MW wind generator. Supercond. Sci. Technol. 2016, 29, 024005.
  4. Tanaka, H.; Suzuki, T.; Kodama, M.; Koga, T.; Watanabe, H.; Yamamoto, A.; Michizono, S. Performance of MgB2 superconductor developed for high-efficiency klystron applications . IEEE Trans, Appl. Supercond. ,2020 30-4, 6200105. [CrossRef]
  5. Choi, Y.; Park, D.; Li, Y.; Tanaka, H.; Lee, E.; Bascuñán, J.; Iwasa, Y. Persistent-mode operation and magnetization behavior of a solid nitrogen-cooled MgB2 small-scale test coil towards a tabletop 1.5-T osteoporosis MRI. Supercond. Sci. Technol. 2020, 33, 1018.
  6. Sykes, A.; Costley, A.E.; Windsor, C.G.; Asunta, O.; Brittles ,G.; Buxton, P.; Chuyanov, V; Connor J.W.; Gryaznevich, M.P.; Huang, B.; Hugill, J.; Kukushkin, A.; Kingham, D.; Langtry, A.V.; McNamara, S.; Morgan, J.G.; Noonan, P.; Ross, J. S. H.; Shevchenko, V.; Slade, R.; Smith, G.; Compact fusion energy based on the spherical tokamak. Nucl. Fusion. 2018, 58 016039. [CrossRef]
  7. Leslie, M.; Ito, T.; Aizawa, K.; Arima, H. ; Start-Ups Seek to Accelerate Path to Nuclear Fusion. Engineering 2021, 8, 6–8. [Google Scholar]
  8. Ekin, W. J.; Chapter “Strain Effects in Superconducting Compounds”, Advances in Cryogenic Engineering Materials, 1984, Volume 30.
  9. Osamura, K.; Machiya, S.; Tsuchiya, Y.; Suzuki, H. Internal Strain and Mechanical Properties at Low Temperatures of Surround Cu Stabilized YBCO coated conductor, IEEE Transaction on Applied Superconductivity 2010 20 1532-1536. [CrossRef]
  10. Osamura, K.; Machiya, S.; Tsuchiya, Y.; Suzuki, H. ; Force free strain exerted on a YBCO layer at 77 K in surround Cu stabilized YBCO coated conductors, Supercond. Sci. Technol. 2010, 23, 045020–045026. [Google Scholar] [CrossRef]
  11. Oguro, H.; Awaji, S.; Nishijima, G.; Takahashi, K.; Watanabe, K.; Machiya, S.; Suzuki, H.; Tsuchiya, Y.; Osamura, K. Residual strain measurement using neutron diffraction for practical Nb3Sn wires under a tensile load. Supercond. Sci. Technol. 2010, 23-2, 025034. [CrossRef]
  12. Osamura, K.; Machiya, S.; Ochiai, S.; Osabe, G.; Yamazaki, K.; Fujikami. J.; High strength / high strain tolerance DI-BSCCO tapes by means of pre-tensioned lamination technique. IEEE Trans. on Appl. Superconductivity 2013, 6400504-7. [Google Scholar]
  13. Hishinuma, Y.; Kikuchi, A.; Shimada, Y.; Kashiwai, T, Hata, S.; Yamada, S.; Muroga, T.; Sagara, A.; Development of MgB2 superconducting wire for the low activation superconducting magnet system operated around core D-T plasma. Fusion Eng. Des. 2015, 98-99, 1076-1080. [CrossRef]
  14. HISHINUMA, Y.; SHIMADA, Y.; HATA, S.; TANAKA, T.; KIKUCHI, A. Superconducting Properties and Microstructure of In-situ Cu Addition Low Activation MgB2 Multifilamentary Wires Using Different Boron-11 Isotope Powders. Teion Kogaku. 2022, 57-1, 32-38 (in Japanese).
  15. Cheng, F.; Liu, Y.; Ma, Z.; Li, H.; Shahriar, M.; Hossain, A. ; Superior critical current density obtained in Mg11B2 low activation superconductor by using reactive amorphous 11B and optimizing sintering temperature. Journal of Alloys. Comp. 2015, 650, 508–513. [Google Scholar] [CrossRef]
  16. Mooring, F.P.; Monahan, J.E.; Huddleston, C.M. Neutron cross sections of the boron isotopes for energies between 10 and 500 keV. Nuclear Phys. 1966, 82-1, 16-32. [CrossRef]
  17. Harjo, S.; Ito, T.; Aizawa, K.; Arima, H. ; Current Status of Engineering Materials Diffractometer at J-PARC. Mater. Sci. Forum 2013, 681, 443–448. [Google Scholar] [CrossRef]
  18. Kikuchi, A; Yoshida, Y; Iijima, Y; Banno, N; Takeuchi, T.; Inoue, K; The synthesis of MgB2 superconductor using Mg2Cu as a starting material. Supercond. Sci. Technol. 2004, 17, 781-785.
  19. Jin. X.; Nakamoto, T.; Harjo, S; Hemmi, T; Umeno, T.; Ogitsu, T.; Yamamoto, A.; Sugano, M.; Aizawa, K.; Abe, J.; Gong, W.; Iwahashi, T; Development of a cryogenic load frame for the neutron diffractometer at Takumi in Japan Proton Accelerator Research Complex, Rev. Sci. Instrum. 2013 84-6, 063106.
  20. Nyilas, A.; Strain sensing systems tailored for tensile measurement of fragile wires. Supercond. Sci. Tech. 2005, 18-12 S409. [CrossRef]
  21. Oishi, R.; Yonemura, M.; Nishimaki, Y.; Torii, S.; Hoshikawa, A.; Ishigaki, T.; Morishima, T.; Mori, K.; Kamiyama, T. Rietveld analysis software for J-PARC. Nuclear Instruments and Methods in Physics Research Section A. 2009, 600-1, 94-96.
  22. Sugano, M.; Machiya, S.; Osamura, K.; Adachi, H.; Sato, M.; Semerad, R. Prussei, W. The direct evaluation of the internal strain of biaxially textured YBCO film in a coated conductor using synchrotron radiation. Supercond. Sci. Technol. 2009, 22-1, 015002. [CrossRef]
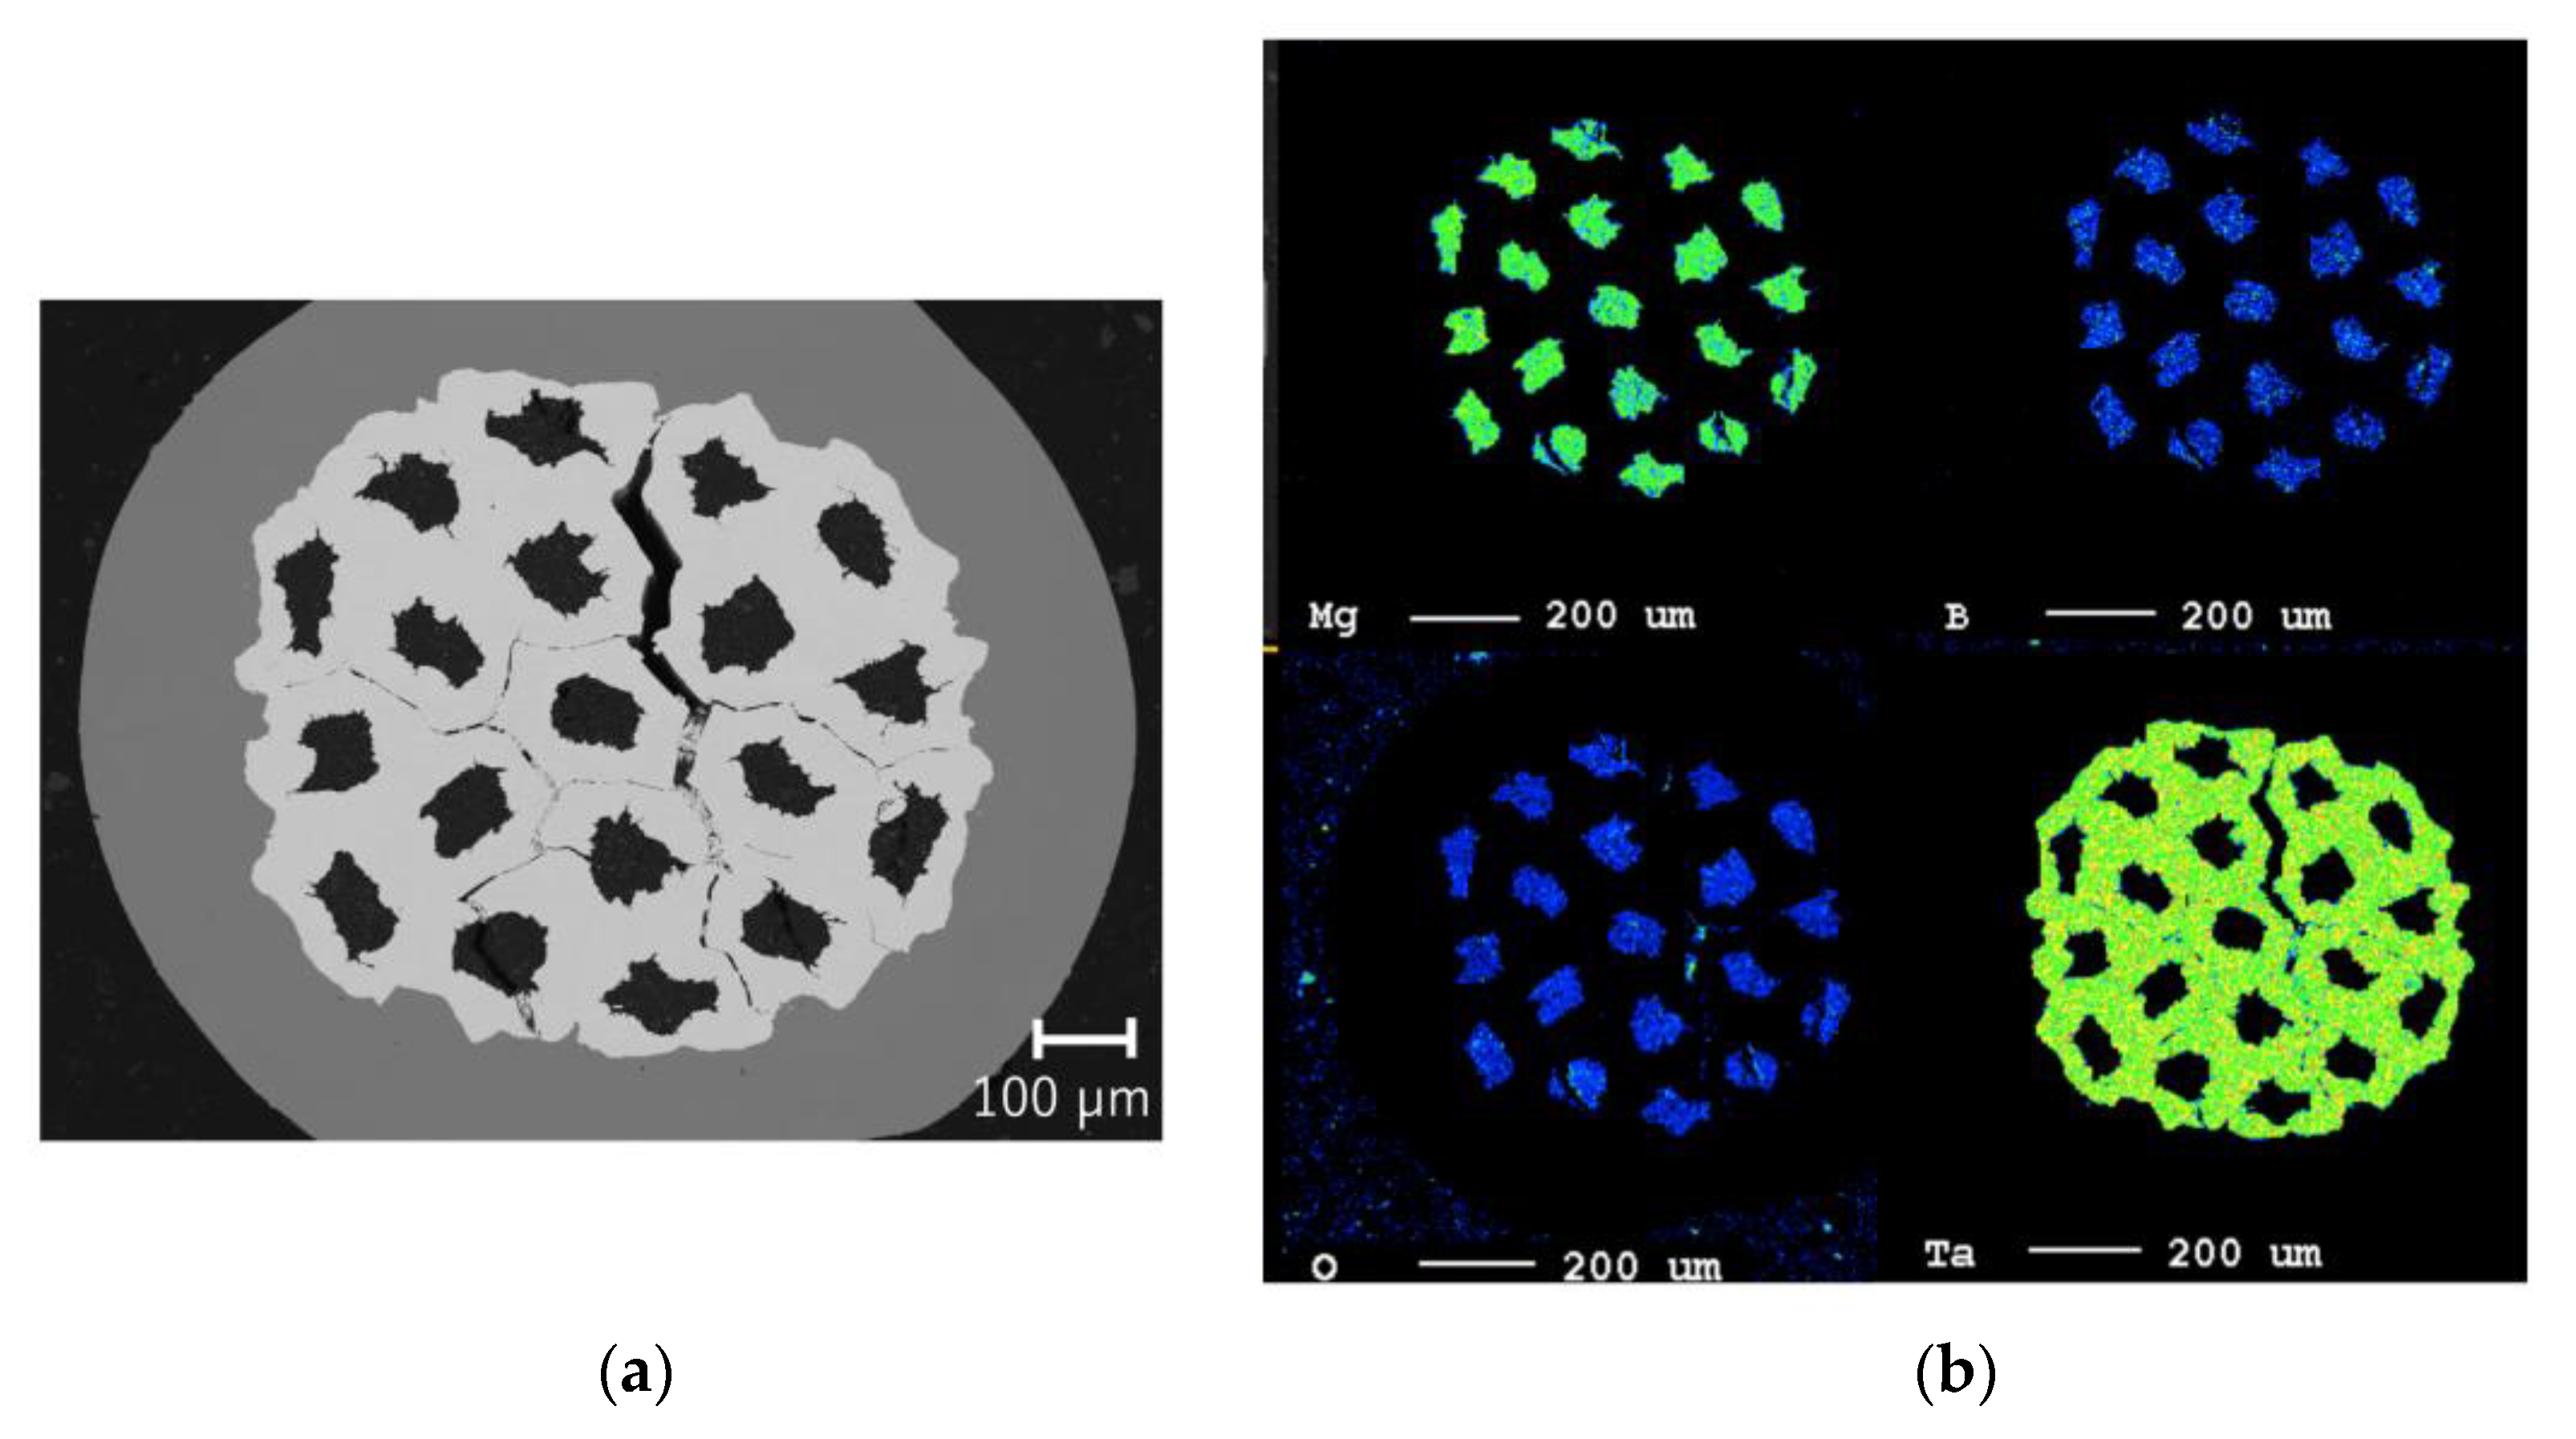
Figure 1. Cross sention SEM image of NIFS 11B enriched MgB2 wire: (a) secondary electron image ; (b) the color map of EPMA results (chemical symbol: Mg, B, O and Ta).
Preprints 80360 g001
Figure 2. Cross section SEM image of Samdong MgB2 wire.
Preprints 80360 g002
Figure 3. Cross sention SEM image of Hypertech MgB2 wire.
Preprints 80360 g003
Figure 4. Schematic of difftactometer takumi(MLF BL19).
Preprints 80360 g004
Figure 5. Diffractometer of BL19 takumi and sample.
Preprints 80360 g005
Figure 6. Sample with extensometer and load frame.
Preprints 80360 g006
Figure 7. Stress-Strain curve of NIFS 11B enriched MgB2 wire.
Preprints 80360 g007
Figure 8. Loading history of NIFS.
Preprints 80360 g008
Figure 9. Stress-strain diagram of NIFS during measurement.
Preprints 80360 g009
Figure 10. ToF histogram of NIFS 11B enriched MgB2 wire.
Preprints 80360 g010
Figure 11. ToF histogram of Samdong MgB2 wire.
Preprints 80360 g011
Figure 12. ToF histogram of Hypertech MgB2 wire.
Preprints 80360 g012
Figure 13. Relation between the results of axial lattice constants changes of hexagonal MgB2 and applied load calculated by Rietveld analysis: (a)lattice constants a; (b)lattice constants c.
Preprints 80360 g013
Figure 14. Relation between the results of the axial lattice constants changes of sheath and applied load calculated by Rietveld analysis: (a)Cu phase a; (b)Ta phase a.
Preprints 80360 g014
Figure 15. Relation between the results of the lateral lattice constants changes of hexagonal MgB2 and applied load calculated by Rietveld analysis: (a)lattice constants a; (b)lattice constants c.
Preprints 80360 g015
Figure 16. Relation between the results of lattice constants changes of hexagonal MgB2 a and applied load(axial and lateral).
Preprints 80360 g016
Figure 17. Relation between the results of lattice constants changes of hexagonal MgB2 c and applied load(axial and lateral).
Preprints 80360 g017
Figure 18. Relation between the results of lattice strain of each phase and applied load.
Preprints 80360 g018
Table 1. Components and their volume fraction of the commercial wires.
Manufacturer Filament Filament2 Inner-sheath Matrix Outer-sheath
Samdong MgB2(0.132) Nb(0.165) Cu(0.320) Ni-Cu-Fe alloy(0.382)
Hypertech MgB2(0.099) Cu(0.149) Nb(0.369) Ni-Cu-Fe alloy(0.382)
Disclaimer/Publisher’s Note: The statements, opinions and data contained in all publications are solely those of the individual author(s) and contributor(s) and not of MDPI and/or the editor(s). MDPI and/or the editor(s) disclaim responsibility for any injury to people or property resulting from any ideas, methods, instructions or products referred to in the content.
Copyright: This open access article is published under a Creative Commons CC BY 4.0 license, which permit the free download, distribution, and reuse, provided that the author and preprint are cited in any reuse.
Prerpints.org logo

Preprints.org is a free preprint server supported by MDPI in Basel, Switzerland.

Subscribe

© 2024 MDPI (Basel, Switzerland) unless otherwise stated