Preprint
Article

Characterization of Obtained extracts and Bark Residues from Black Alder (Alnus glutinosa) and Pine (Pinus sylvestris) after Microwave-Assisted Water Extraction under Different Conditions

Altmetrics

Downloads

127

Views

47

Comments

0

Submitted:

25 July 2023

Posted:

26 July 2023

You are already at the latest version

Alerts
Abstract
This publication investigates the potential application of bark extractives as a biopolyol and extracted bark residues as a filler for producing polyurethane materials. The aim is to enhance the properties of polymeric composites while reducing the environmental impact associated with the complex utilization of bark.The comprehensive study of compositions of extractives isolated from black alder (Alnus glutinosa) and Baltic pine (Pinus silvestris) barks was performed using microwave-assisted water extraction. The yield of the extracts obtained under different extraction conditions, as well as the total phenolic and monomeric carbohydrate content in the extractives, were studied. Furthermore, UHPLC-HRMS analysis was conducted to study the detailed composition of the bark extracts.The total content of hydroxyl groups and the relative portion of aliphatic and phenolic groups in the isolated extracts were determined depending on the extraction regimes and bark origination. The dominant compounds in black alder bark extracts isolated at 70-90⁰C were identified as diarylheptanoids and their derivatives bearing sugar units, with oregonin being the main compound. Pine bark extracts isolated at the same temperature were found to be rich in oligomeric proanthocyanidins. Extracts from both black alder and pine barks obtained at different times of isothermal heating between 130-150°C were rich in carbohydrates and showed an increased proportion of aliphatic OH groups.The study also focused on the composition of residual biomass. It was indicated by Py-GC/MS/FID and wet chemistry methods that residues of both black alder and pine bark are enriched with lignin in comparison with initial barks. Therefore, it can be proposed that extracted bark residues introduced into polyurethane compositions will act as a charcoal formation promoter, thus increasing the flame resistance of materials.Overall, the study provides valuable insights into the chemical composition of bark extractives and extracted bark residues for their potential application as biopolyol and fillers of polyurethane materials, contributing to a more sustainable approach in polymer composite production.
Keywords: 
Subject: Chemistry and Materials Science  -   Analytical Chemistry

Introduction

In order to evaluate the potential application of extracted bark residues as fillers for polymer materials, with the ability to enhance the properties of polymer composites while reducing the environmental impact associated with their disposal, their composition was analyzed using analytical pyrolysis (Py-GC-MS/FID). This technique facilitates a comprehensive analysis of the bark by subjecting the sample to thermal degradation, resulting in the generation of a complex mixture of volatile products. It enables the simultaneous analysis of various components, including lignin, cellulose, hemicellulose, lipids, tannins, and other organic compounds present in the bark. Through characterization of the pyrolysis products, valuable information pertaining to the chemical structure and functional groups of the components can be acquired.

Experimental

Py-GC/MS/FID analysis was conducted at a pyrolysis temperature of 500°C with a heating rate of 600°C·s⁻¹. The analysis was performed using a Micro Double-shot Pyrolyzer Py-3030D (Frontier Laboratories. Ltd., Fukushima, Japan) directly coupled with the Shimadzu GC/MS/FID-QP ULTRA 2010 apparatus (Japan). The apparatus was equipped with a capillary column RTX-1701 (Restec, Metairie, Louisiana, USA) 60 m × 0.25 mm × 0.25 μm. The injector temperature was set at 250°C, and the ion source had an electron impact (EI) of 70 eV. The mass scan range of the MS was from m/z 15 to 350. The carrier gas used was helium at a flow rate of 1 mL min⁻¹ with a split ratio of 1:30. For the analysis, the mass of the sample probe was in the range of 1.00-2.00 mg, with a residual moisture content of less than 1%. The oven program consisted of an initial isothermal hold at 60°C for 1 minute, followed by a temperature ramp of 6°C min⁻¹ up to 270°C. The final temperature was held at 270°C for 10 minutes. Identification of individual compounds was performed based on GC/MS chromatography using the Library MS NIST 11 and NIST 11s. The relative area of each compound's peak (% from chromatogram) was calculated using Shimadzu software, which utilized GC/FID data. The reported data represents the average of four repetitive pyrolysis experiments. The measurement's coefficient of variation was equal to or less than 10%

Results and Discussion

The raw material, black alder (Alnus glutinosa) bark, was harvested in June 2022 from 70-year-old trees grown in the Limbazi municipality in Latvia. It had the following elemental composition: 51.6% C, 42.1% O, 5.3% H, and 1.0% N. The bark contained 38.1% carbohydrates, 36.7% Klason lignin, and 4.5% ash content. Similarly, the raw material, pine bark, was harvested in October 2022 from 23-year-old trees grown in the Gulbene municipality in Latvia. It had the following elemental composition: 50.6% C, 43.7% O, 5.5% H, and 0.2% N. The pine bark contained 42.3% carbohydrates, 41.8% Klason lignin, and 2.2% ash content. The FTIR spectra of alder and pine barks exhibit peaks at around 1500-1600 cm-1 and 1260-1320 cm-1, which are attributed to aromatic skeletal vibrations and aromatic ring breathing modes. Additionally, absorption bands in the range of 800-1200 cm-1 are observed, indicating glycosidic linkages and other vibrations associated with cellulose and hemicellulose. The lower Klason lignin content in alder bark, combined with the higher proportion of peaks attributed to aromatic compounds in the FTIR spectra of alder bark compared to those attributed to carbohydrates, suggests a higher content of secondary metabolites with a phenolic nature. The presence of absorption maxima at 3400 cm-1 indicates the presence of hydroxyl groups (alcohols, phenols, and carboxylic acids) in the barks (Figure 1). This feature highlights their potential as a source for obtaining biopolyols. The polar solvent water was used for the isolation of these compounds.
The microwave-assisted extraction of black alder (Alnus glutinosa) and Baltic pine (Pinus silvestris) bark with water was performed using an original construction extraction device, as described in the reference (Arshanitsa et al., 2020). Briefly, the extraction process involved several steps: suspension loading (15% of bark content), bark soaking at elevated pressure (~50 mbar), dynamic dielectric heating of the suspension up to 70-150°C, isothermal heating for 0-30 minutes at the selected temperature, pressure release inside the extraction chamber, separation of solid and liquid fractions in a screw press, solution filtration, and subsequent lyophilization. Before extraction, the bark was dried at room temperature until the moisture content was approximately 10%, and then was milled using a Retch AS100 mill (Retch GmbH, Haan, Germany) at 1500 rpms with a 2 mm sieve.
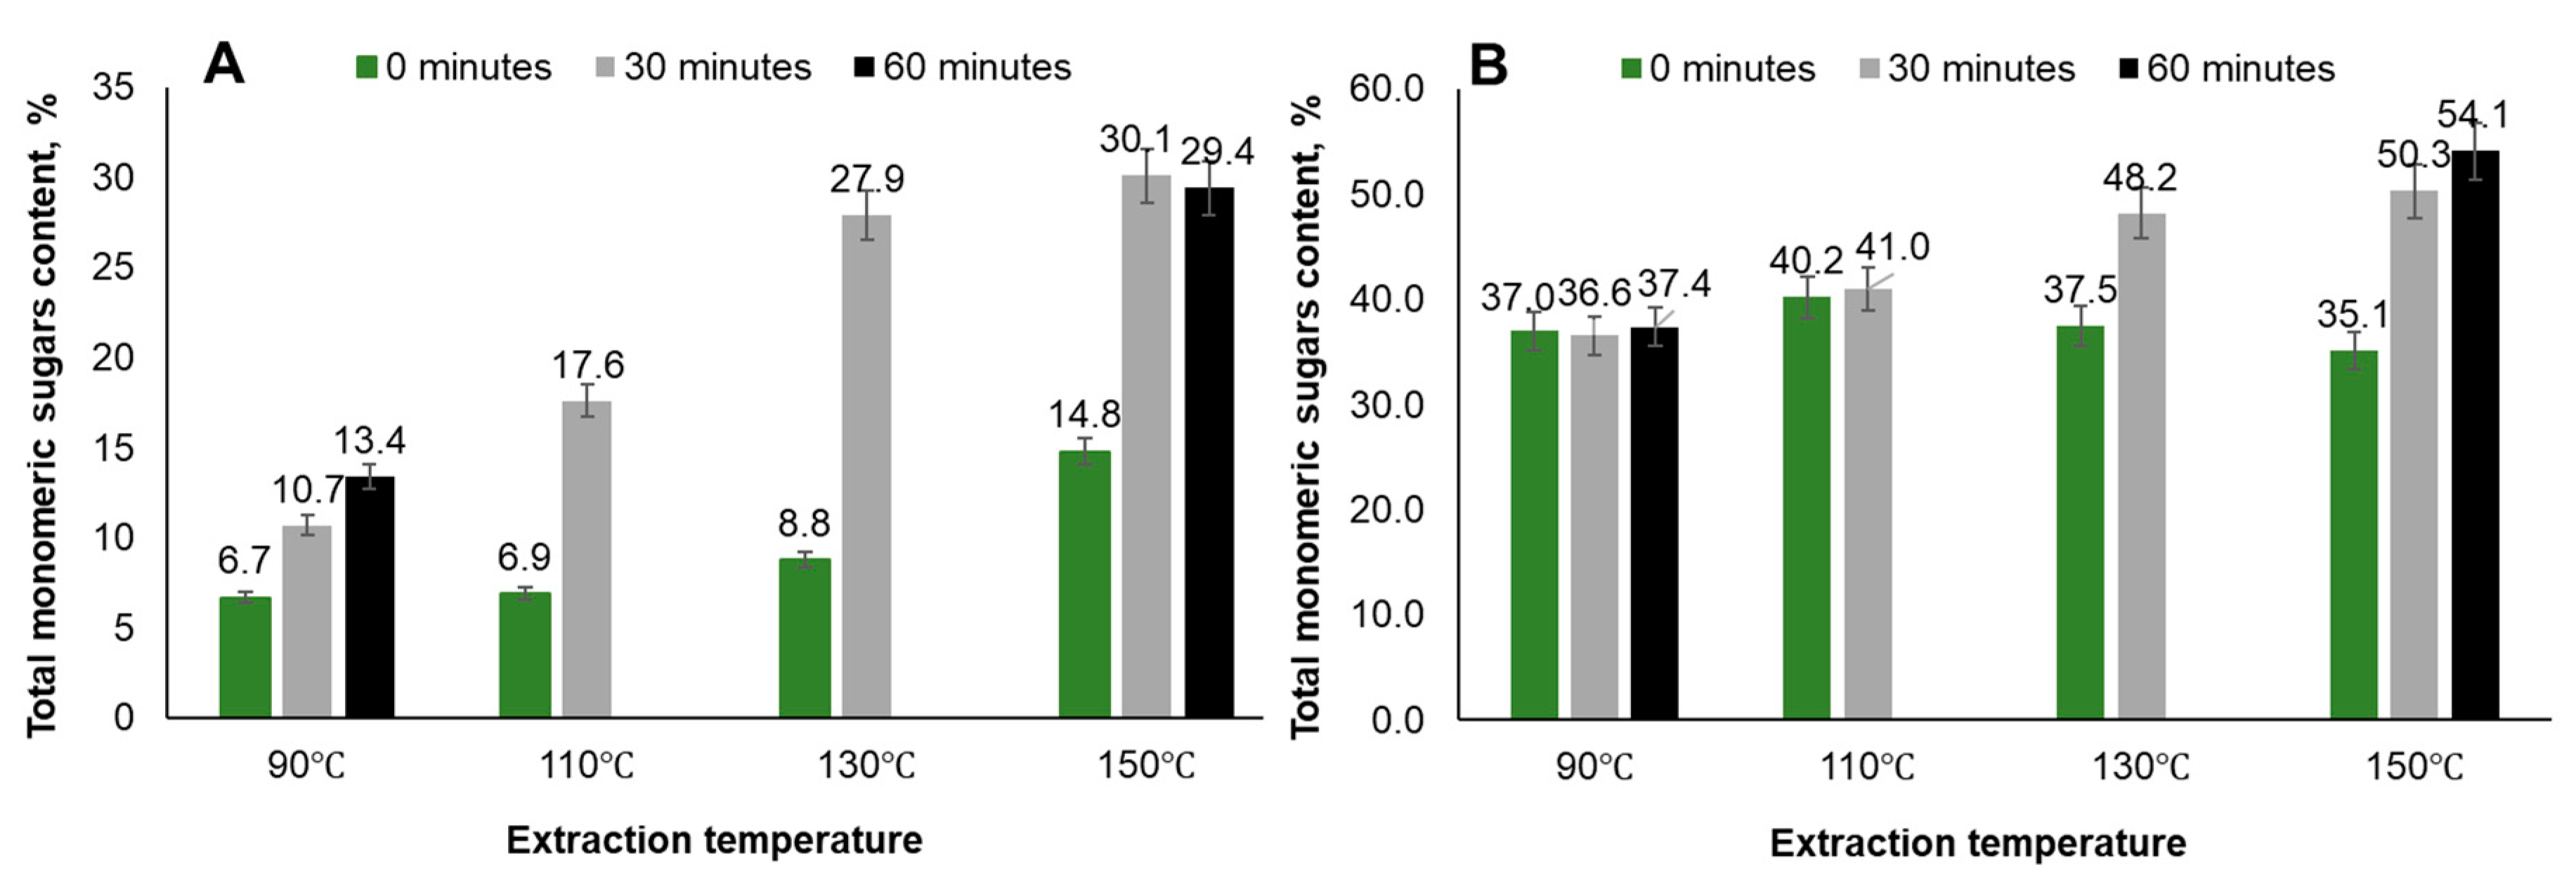
The yield of the obtained black alder bark water extracts varied in the range of 18-30%, increasing with higher extraction temperature. This increase can be attributed to the higher carbohydrate content determined as the total monomeric carbohydrate content in the extracts (see Figure 2). The determination was performed using the gas chromatography with flame ionization detection (GC-FID) method, following the procedures described elsewhere (Blakeney et al., 1983).
The significant increase in the total monomeric carbohydrate content observed after hydrolysis of biomass, compared to non-hydrolyzed extracts, indicates the presence of chemical bonds between carbohydrate components and other constituents of the extracts. However, higher extraction temperatures and longer extraction times result in the isolation of free carbohydrates, particularly at 150°C.
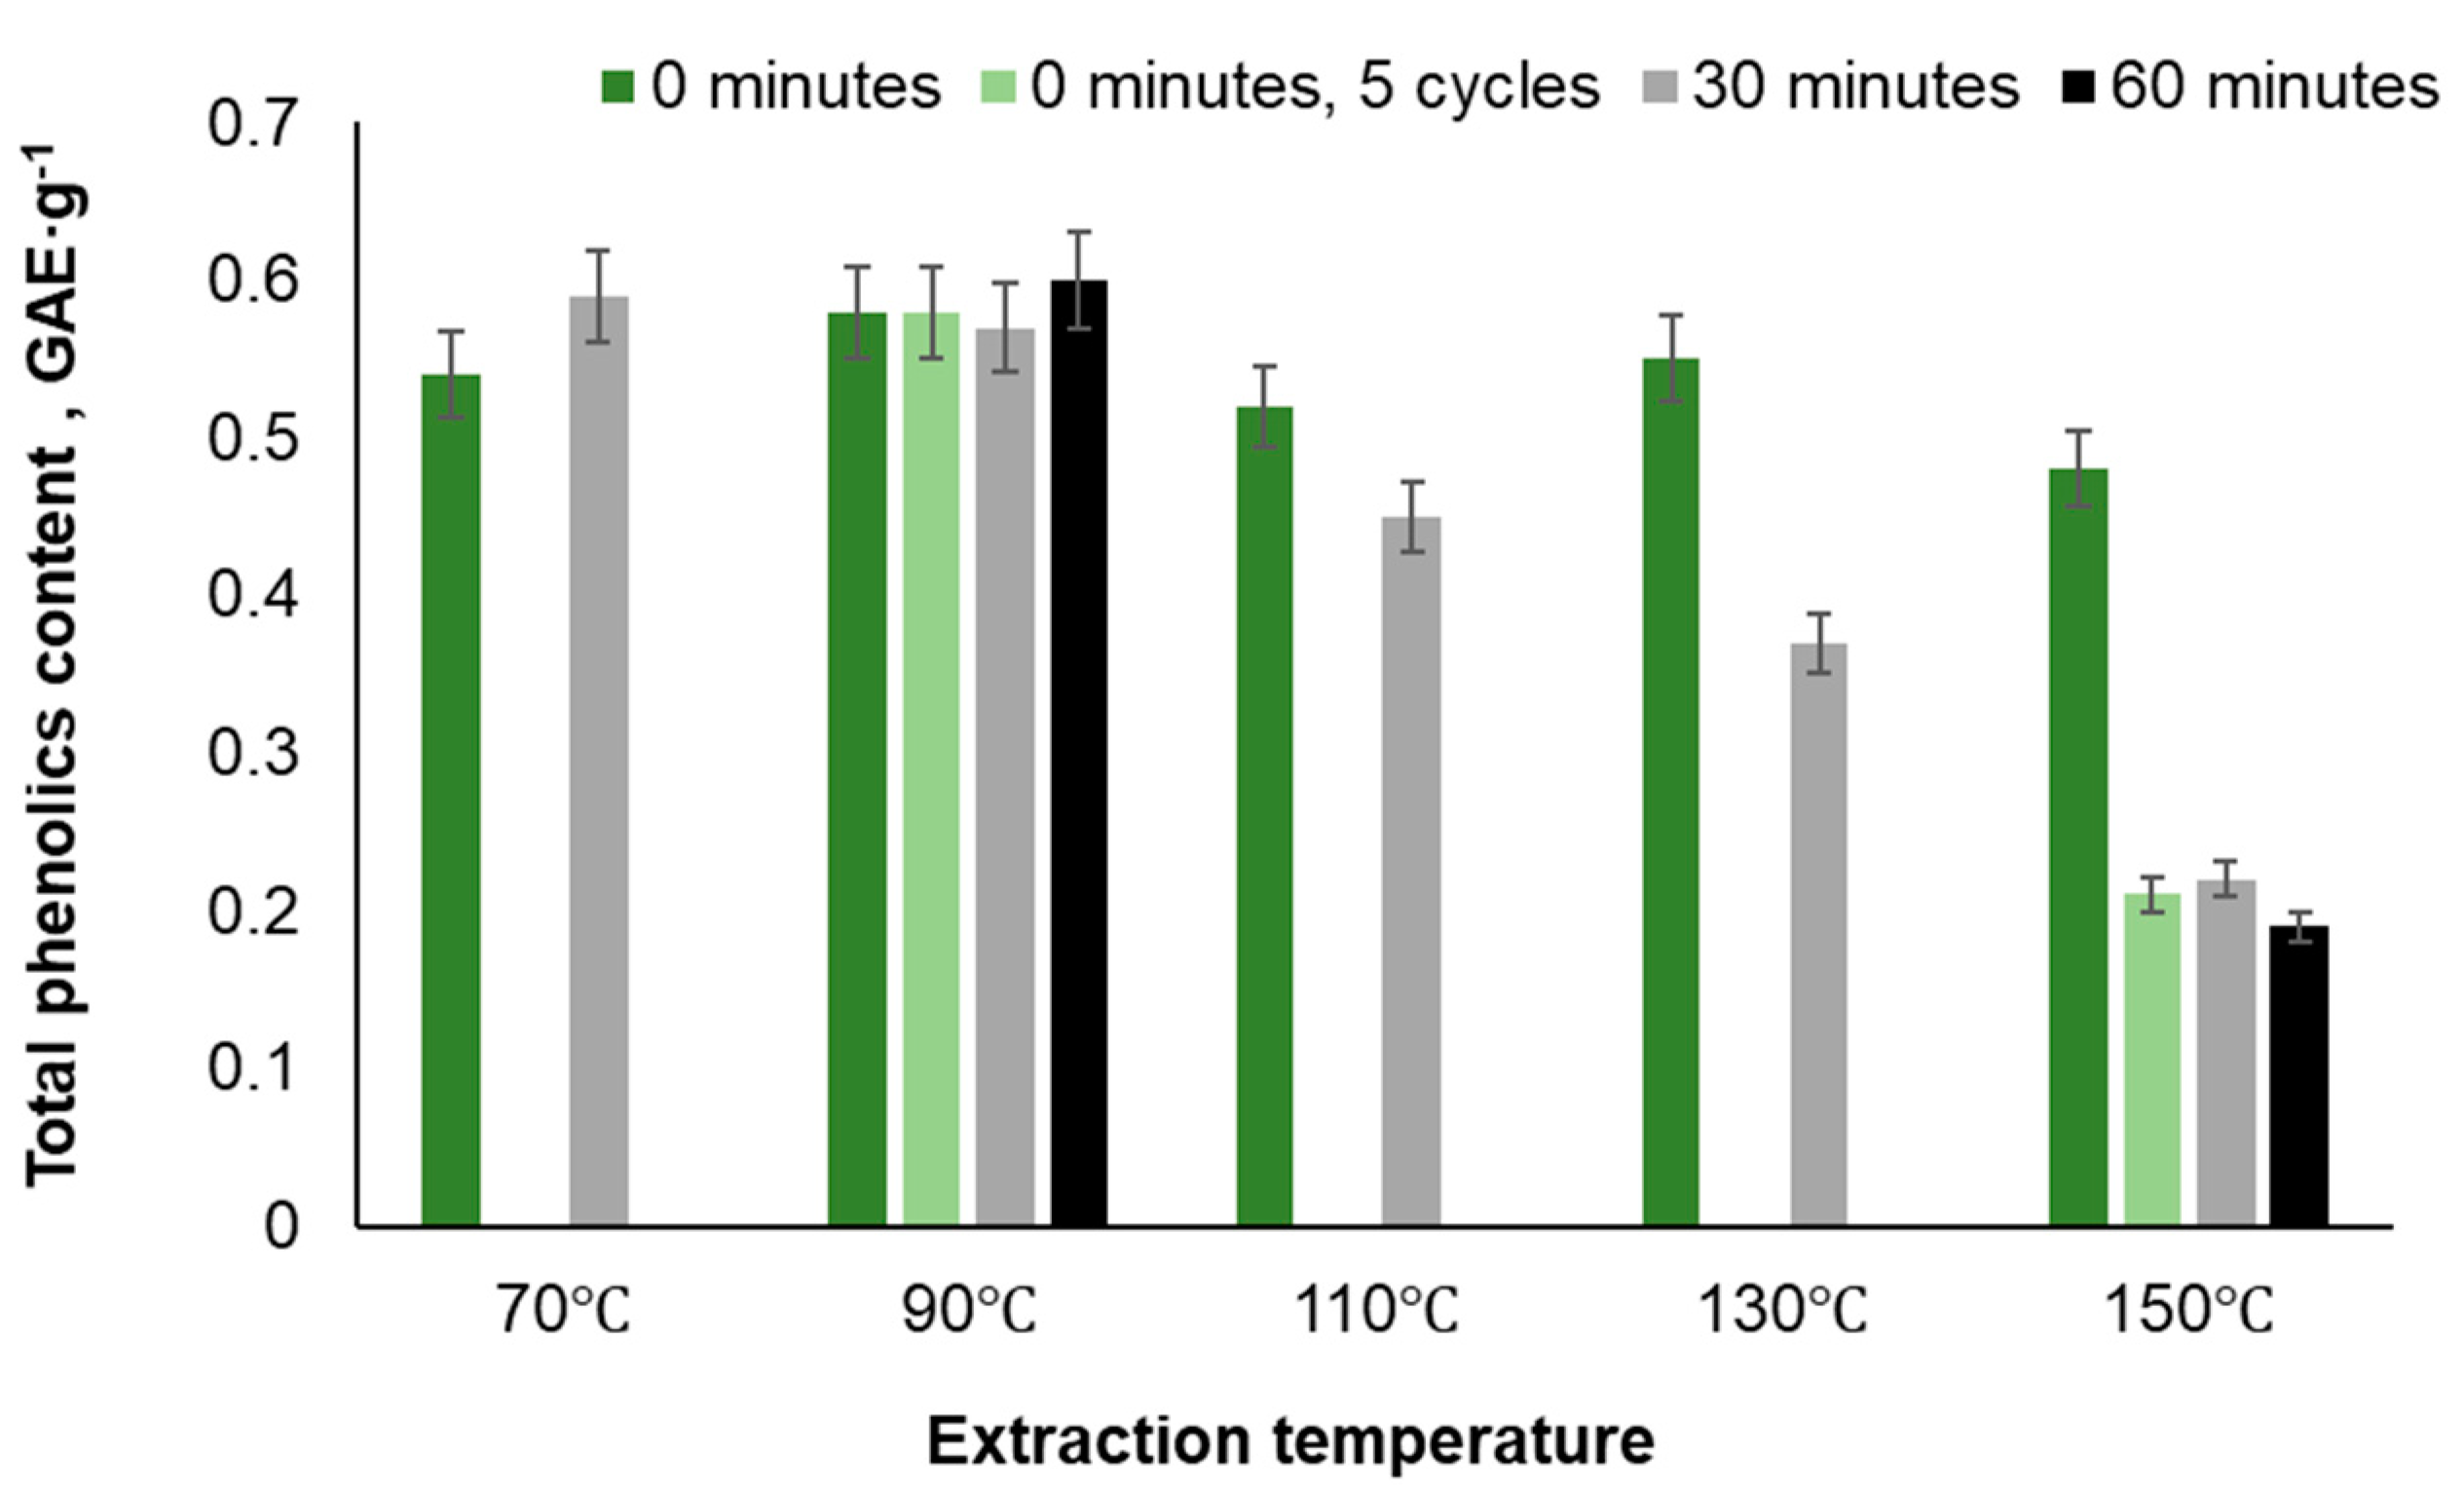
The total phenolic content (TPC), determined photometrically using the Folin-Ciocalteu method (Singleton et al., 1999) and expressed as grams of gallic acid equivalent (GAE) per unit weight of extract, reaches its highest level at 70-90°C. At these temperatures, TPC remains relatively stable regardless of the extraction time and the number of extraction cycles (Figure 3).
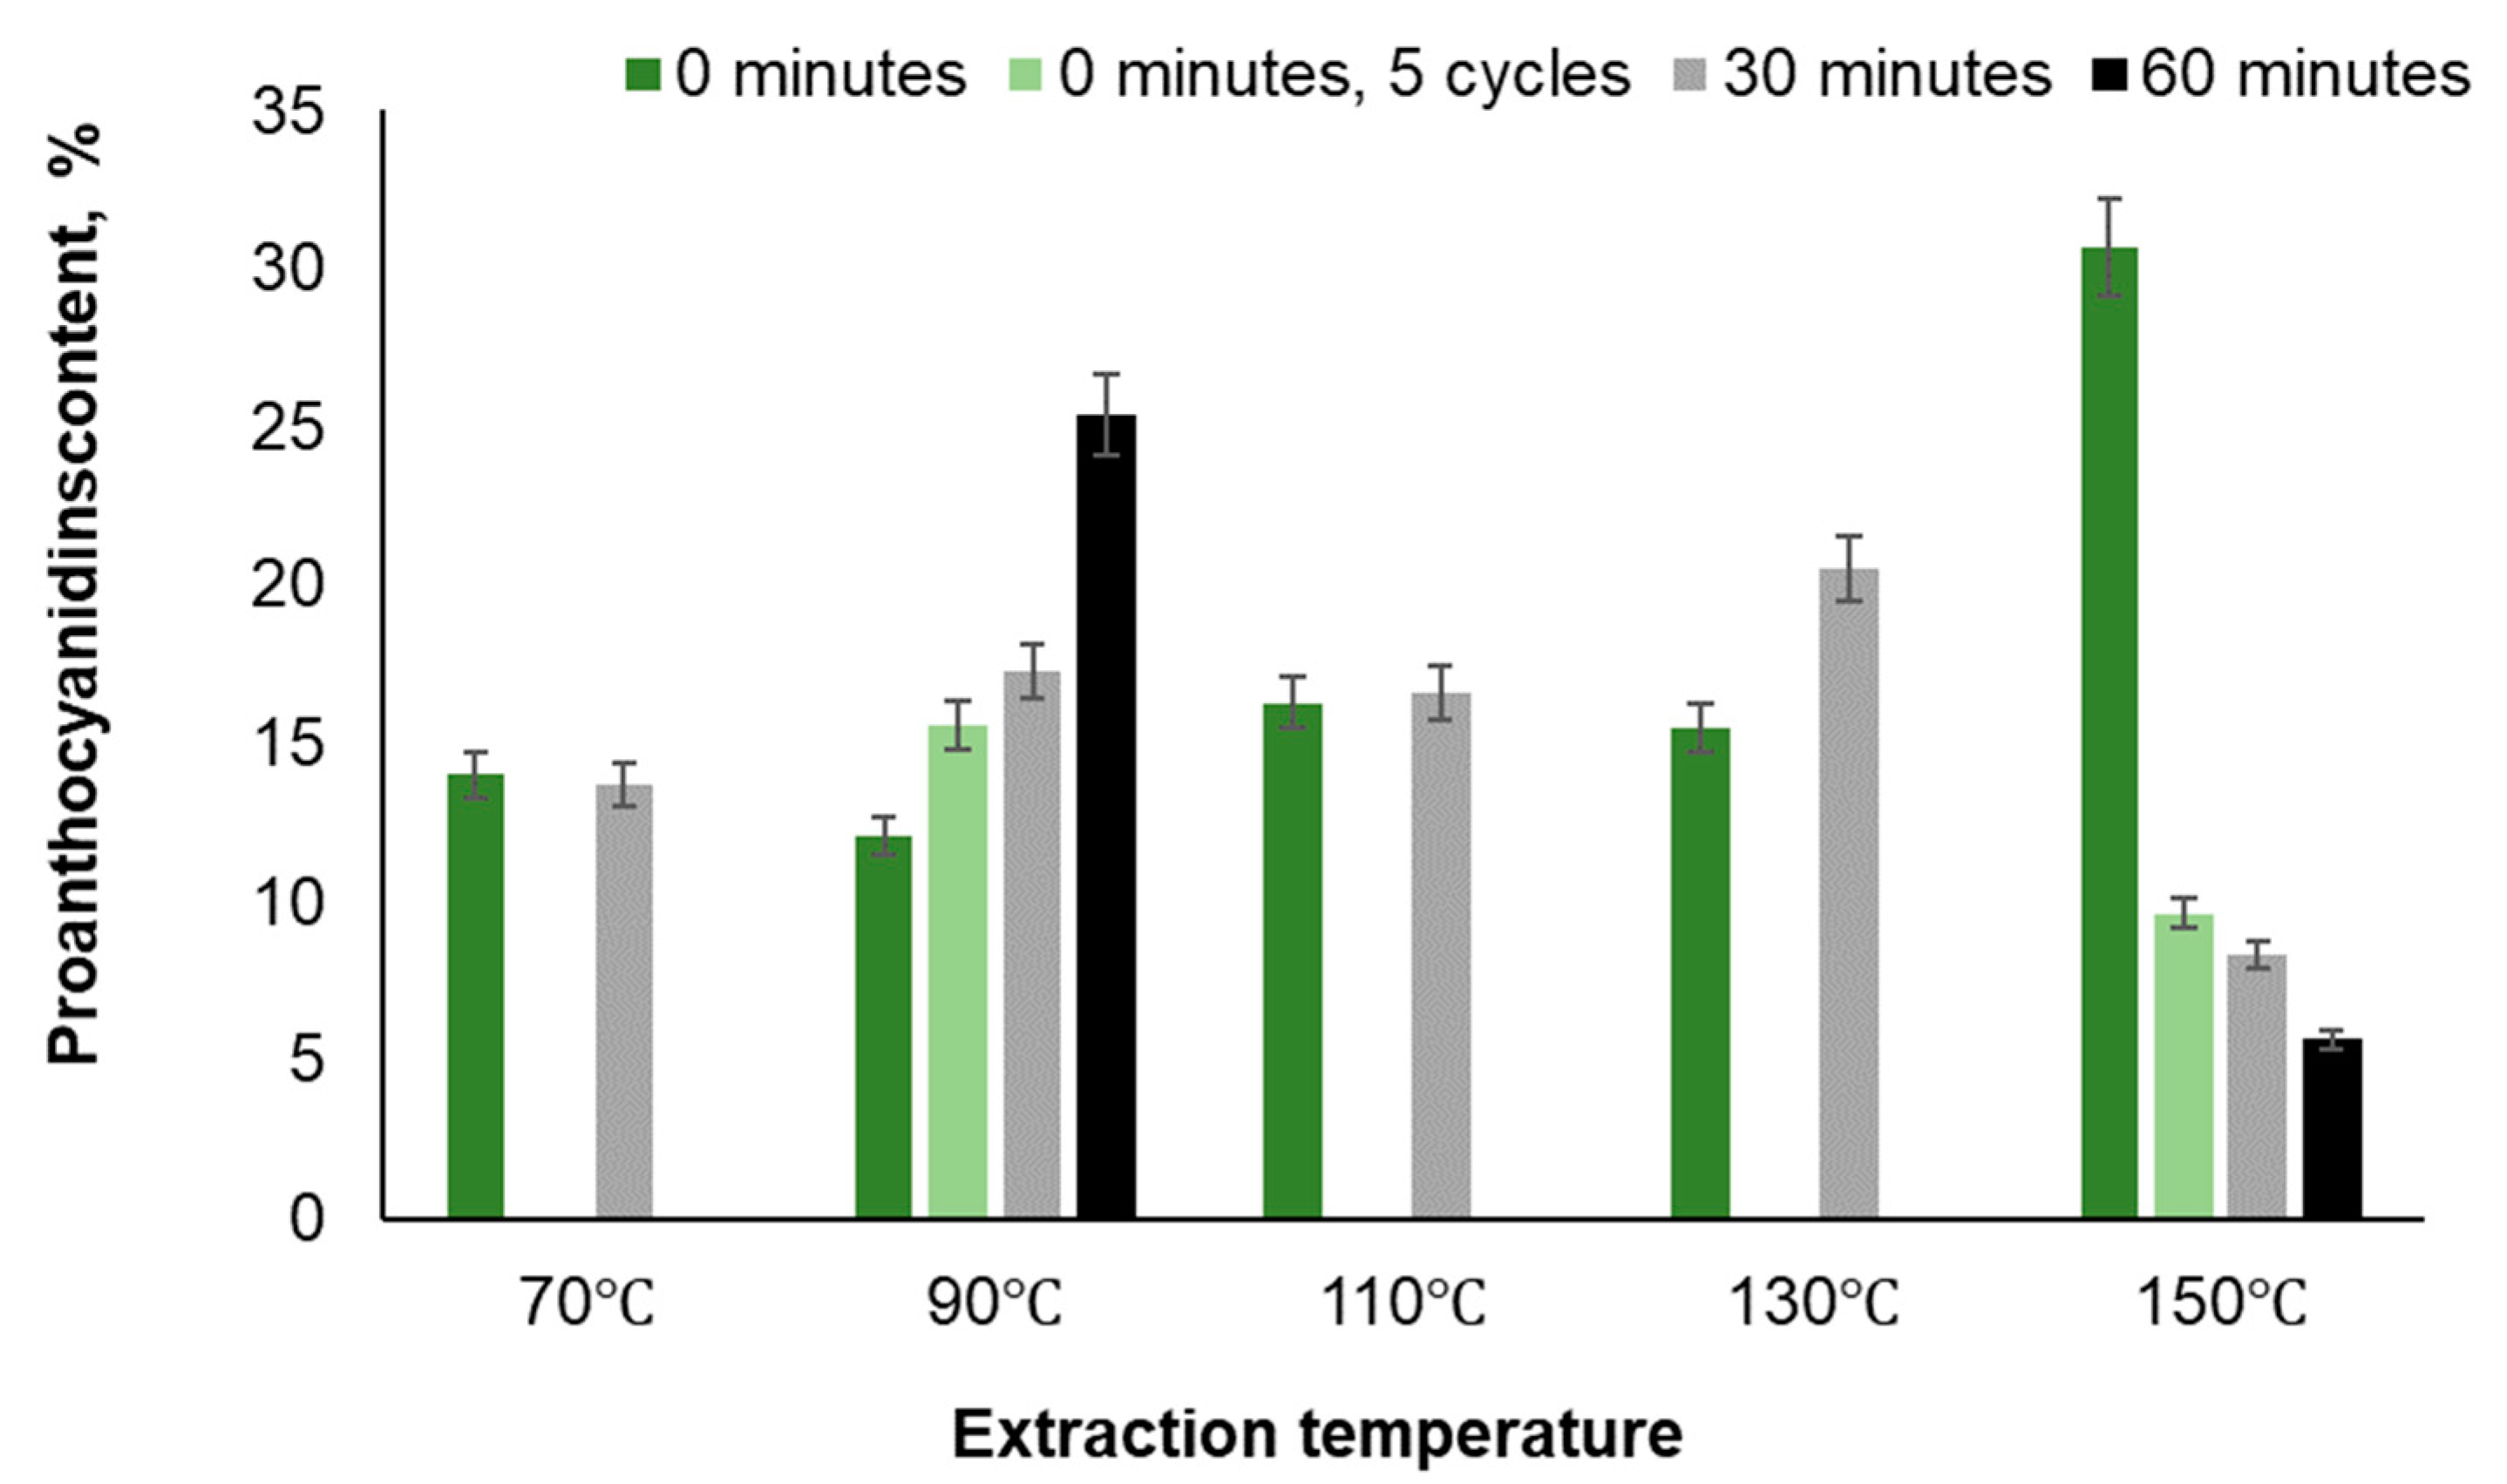
The total content of proanthocyanidins (PAC) in the extracts of alder bark, determined photometrically using the acid-butanol method described by Hagerman (Hagerman, 1995), increases with longer extraction times in extracts obtained at 90-130°C. In extracts obtained at 150°C without isothermal heating (0 minutes), the PAC content is highest, but it significantly decreases with increased isothermal heating at this temperature (Figure 4). This decrease is attributed to the isolation of carbohydrates, such as hemicelluloses, which is promoted by higher extraction temperatures and longer extraction times.
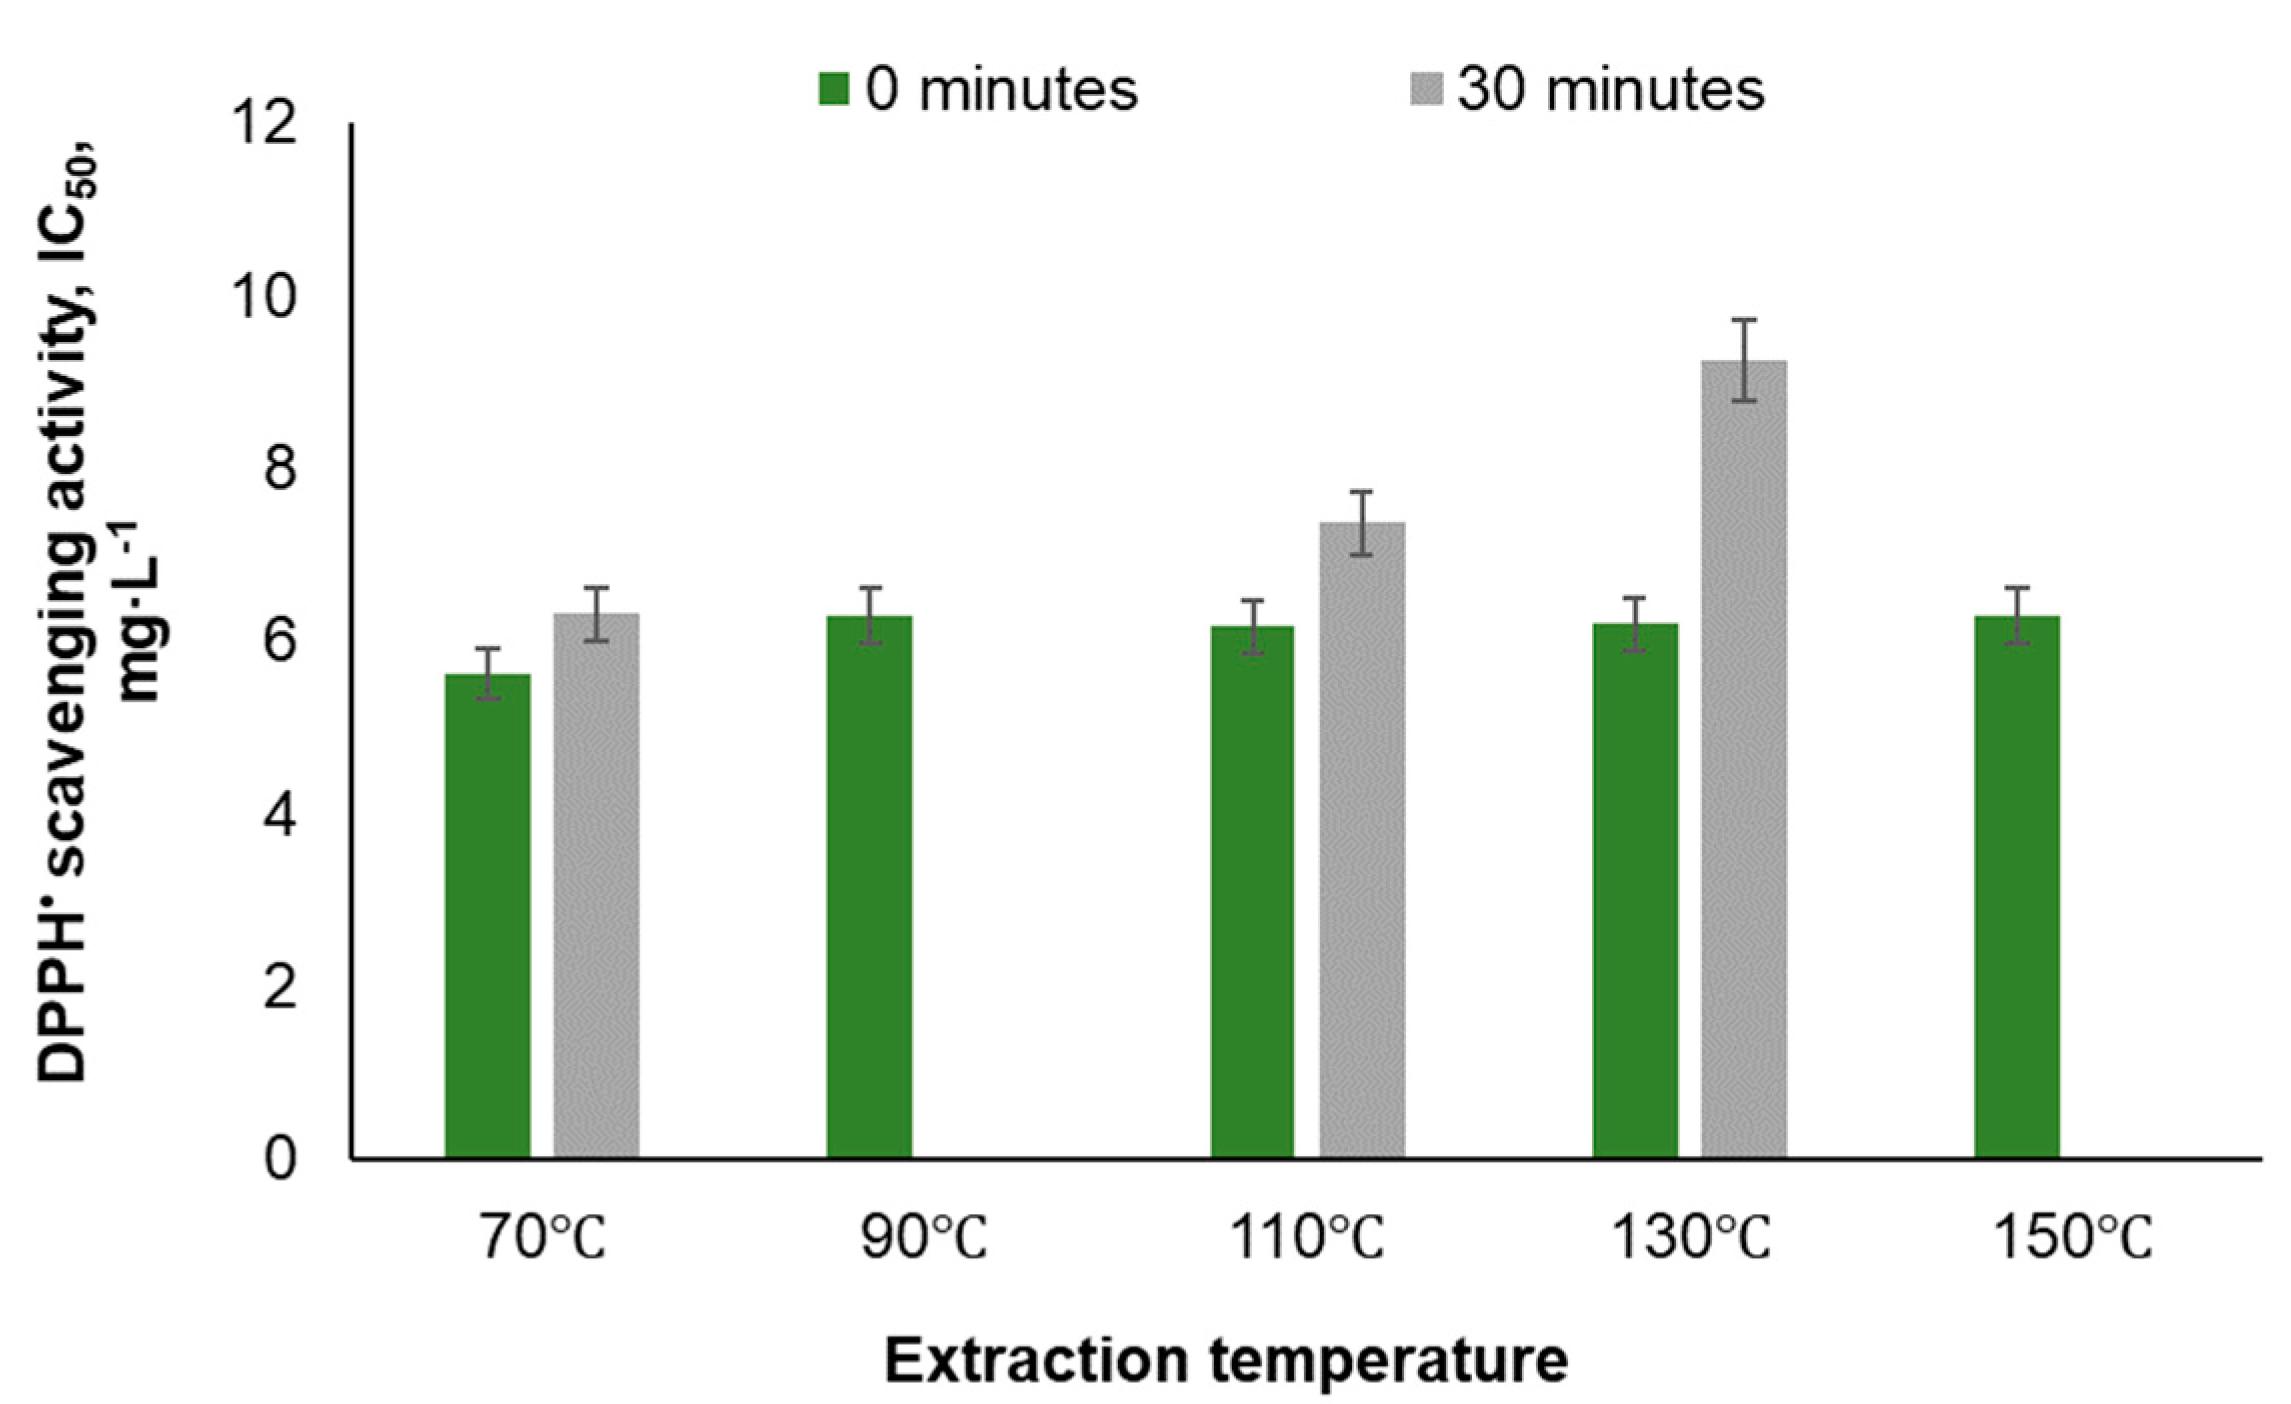
The antioxidant activity of the black alder bark extracts was assessed using a DPPH free radical scavenging test and measured photometrically. The free radical scavenging activity was expressed as the IC50, which represents the concentration required for 50% inhibition of the free radical. A lower IC50 value indicates higher antioxidant activity (Figure 5). The DPPH radical scavenging assay utilized the method described above with minor modifications, as detailed by Dizhbite et al. (2004).
A significant correlation (p=0.95) was observed between the total phenolic content and radical scavenging activity, indicating a strong relationship between these two variables. However, the content of proanthocyanidins did not show a correlation with the radical scavenging activity. This suggests that other phenolic compounds present in the extracts contribute to their activity.
To study the composition of the bark extract in more detail, UHPLC-HRMS analysis was conducted. The analysis was performed using an Acquity UPLC system (Waters Corp., Singapore) coupled with a photodiode array (PDA) and a high-resolution mass spectrometer (Synapt G2-Si) from Waters Corp., Singapore. Separation was carried out on a Waters Acquity UPLC column (2.1 × 100 mm i.d., 1.7 μm, CSH C18) with a flow rate of 0.5 mL·min-1. The eluent consisted of water with 0.1% formic acid (A) and acetonitrile (B), and a gradient solvent system was utilized (refer to Table 1). The injection volume for each sample was 10 μL.
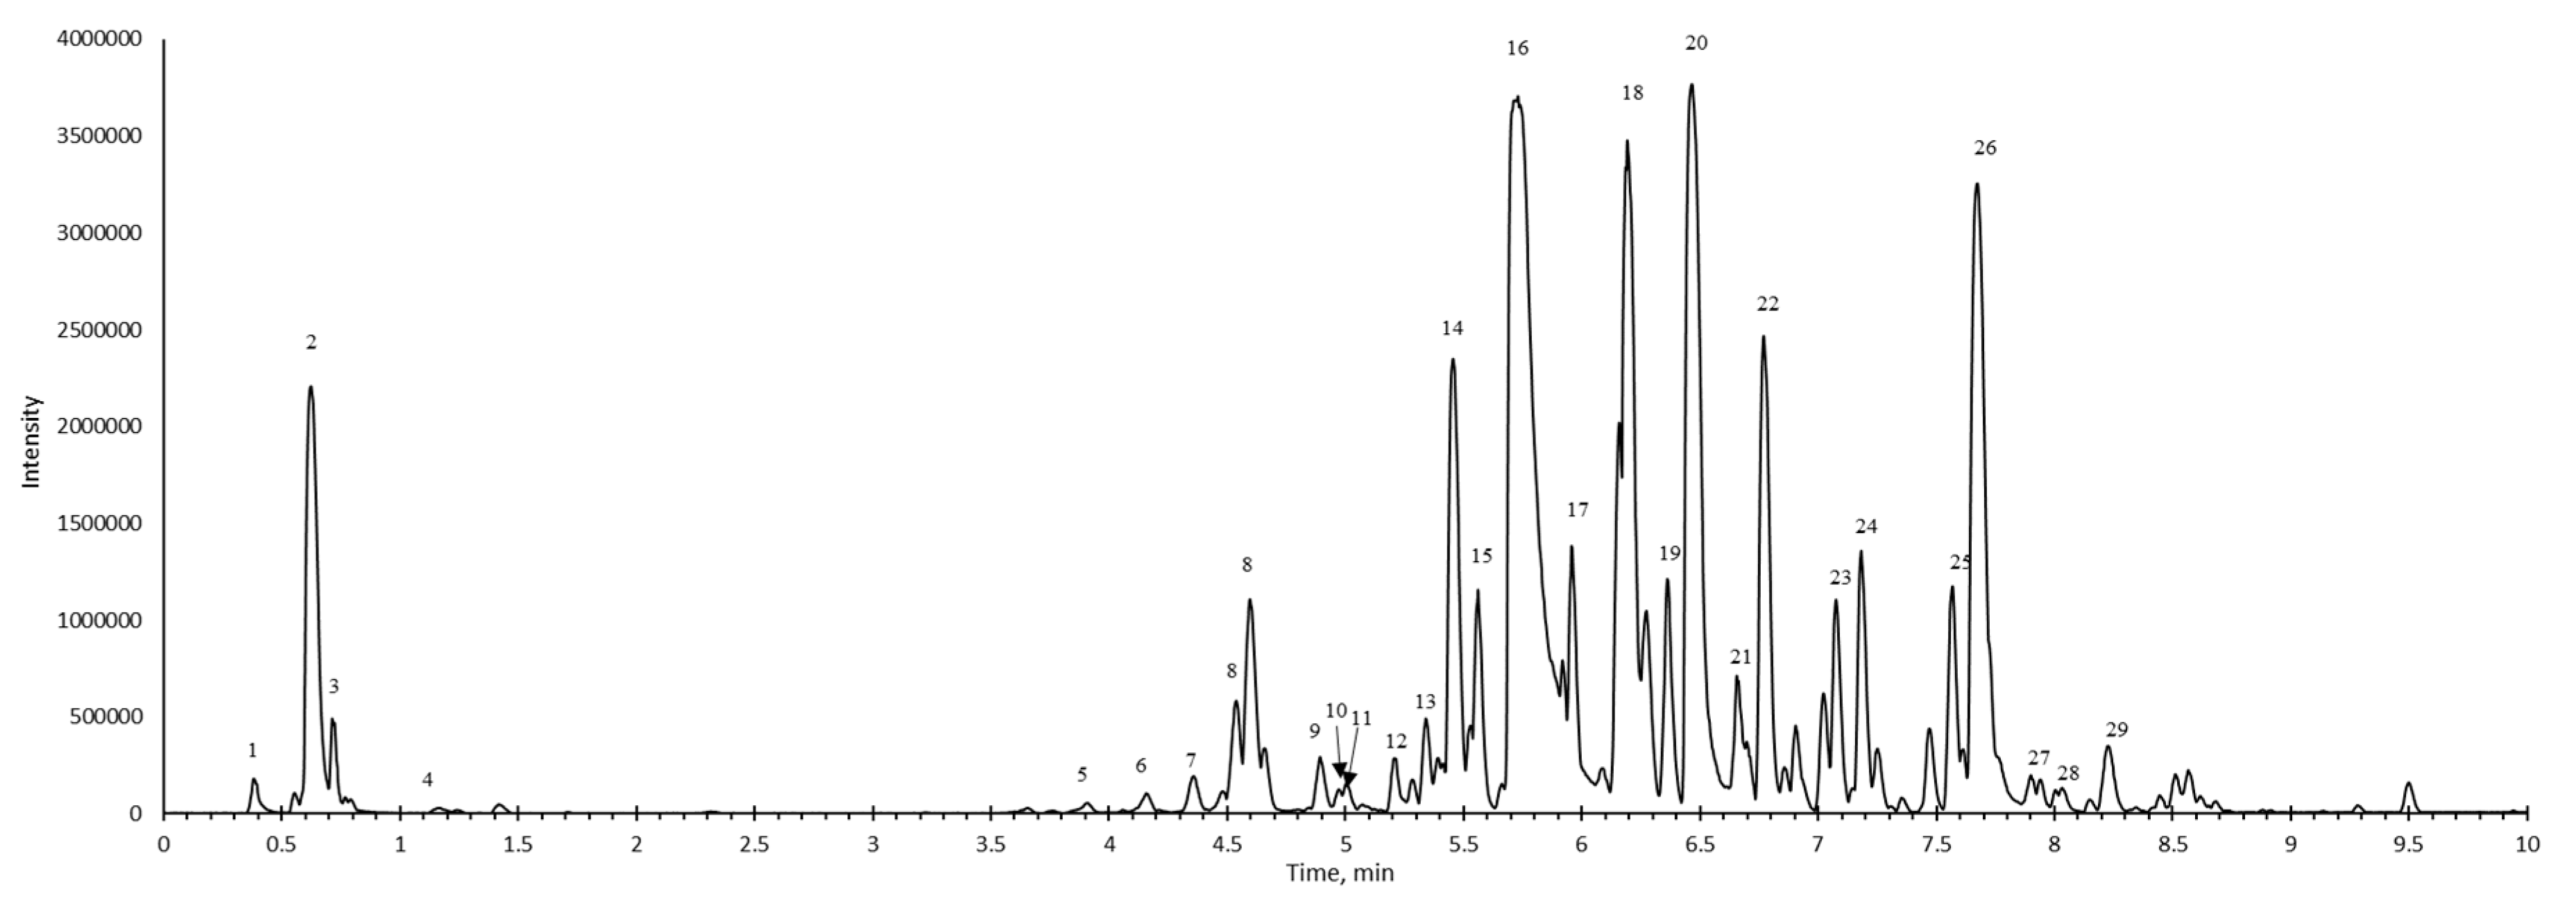
The optimal MS parameters were as follows: negative electrospray ionization (ESI-), capillary voltage: 3.0 kV (-); cone voltage: 80 V; cone gas flow: 50 L/h; collision energy: 6 eV; source temperature: 120 °C; desolvation temperature: 350 °C; collision gas: argon; desolvation gas: nitrogen; flow rate: 500 L/h; data acquisition range: m/z 50–1,200 Da. The results were processed using Masslynx 4.2 software. The obtained UHPLC chromatogram is shown in Figure 6.
Water extracts of black alder bark predominantly contain diarylheptanoids and their derivatives bearing sugar units, with the main compound identified as oregonin (refer to Figure 6, Peak 16). The extract also contains flavonoids and proanthocyanidin oligomers with varying degrees of polymerization. All of the identified compounds are shown in Table 2.
A new method was developed to quantify oregonin, the dominant compound in black alder bark extracts, using the UHPLC-ELSD system. The quantification was performed using an Acquity UPLC system (Waters Corp., Singapore) coupled with photodiode array (PDA) and evaporative light scattering (ELS) detectors, also from Waters Corp., Singapore. The UHPLC parameters remained consistent with those used in UHPLC-HRMS analysis. Optimal ELSD parameters were set as follows: the detector drift tube temperature at 50°C, nebulizing gas as nitrogen with a pressure of 45 psi, and the gain at 50. The results were processed using Waters Empower 3 software.
In the obtained black alder bark extracts, the concentration of oregonin varied from 8.5% to 67.7%. The lowest concentration was observed in extracts obtained at 150°C, while the highest concentration was found in extracts obtained at 90°C. An increase in extraction temperature >90°C leads to a decrease in oregonin concentration in the extracts. This is due to the increased dissolution and transition of carbohydrates into the extracts, resulting from the autohydrolysis of long-chain carbohydrates present in the bark.
Pine bark extraction by water exhibits similar trends to black alder bark. As the temperature and extraction time increase, the content of phenolic-type compounds decreases, while the carbohydrate content increases. Pine bark extracts are rich in oligomeric proanthocyanidins, which decrease at higher extraction temperatures (Table 3). A drastic decrease in the content of PAC in extracts obtained at 150⁰C compared to 90⁰C was observed. We can propose that in this case, unwanted oxidation side reactions promoted by high temperature take place (https://doi.org/10.1021/bm100515e). Oxidation creates new bonds that cause the average degree of polymerization to increase, creating larger macromolecules that cannot be detected by the acid butanol assay.
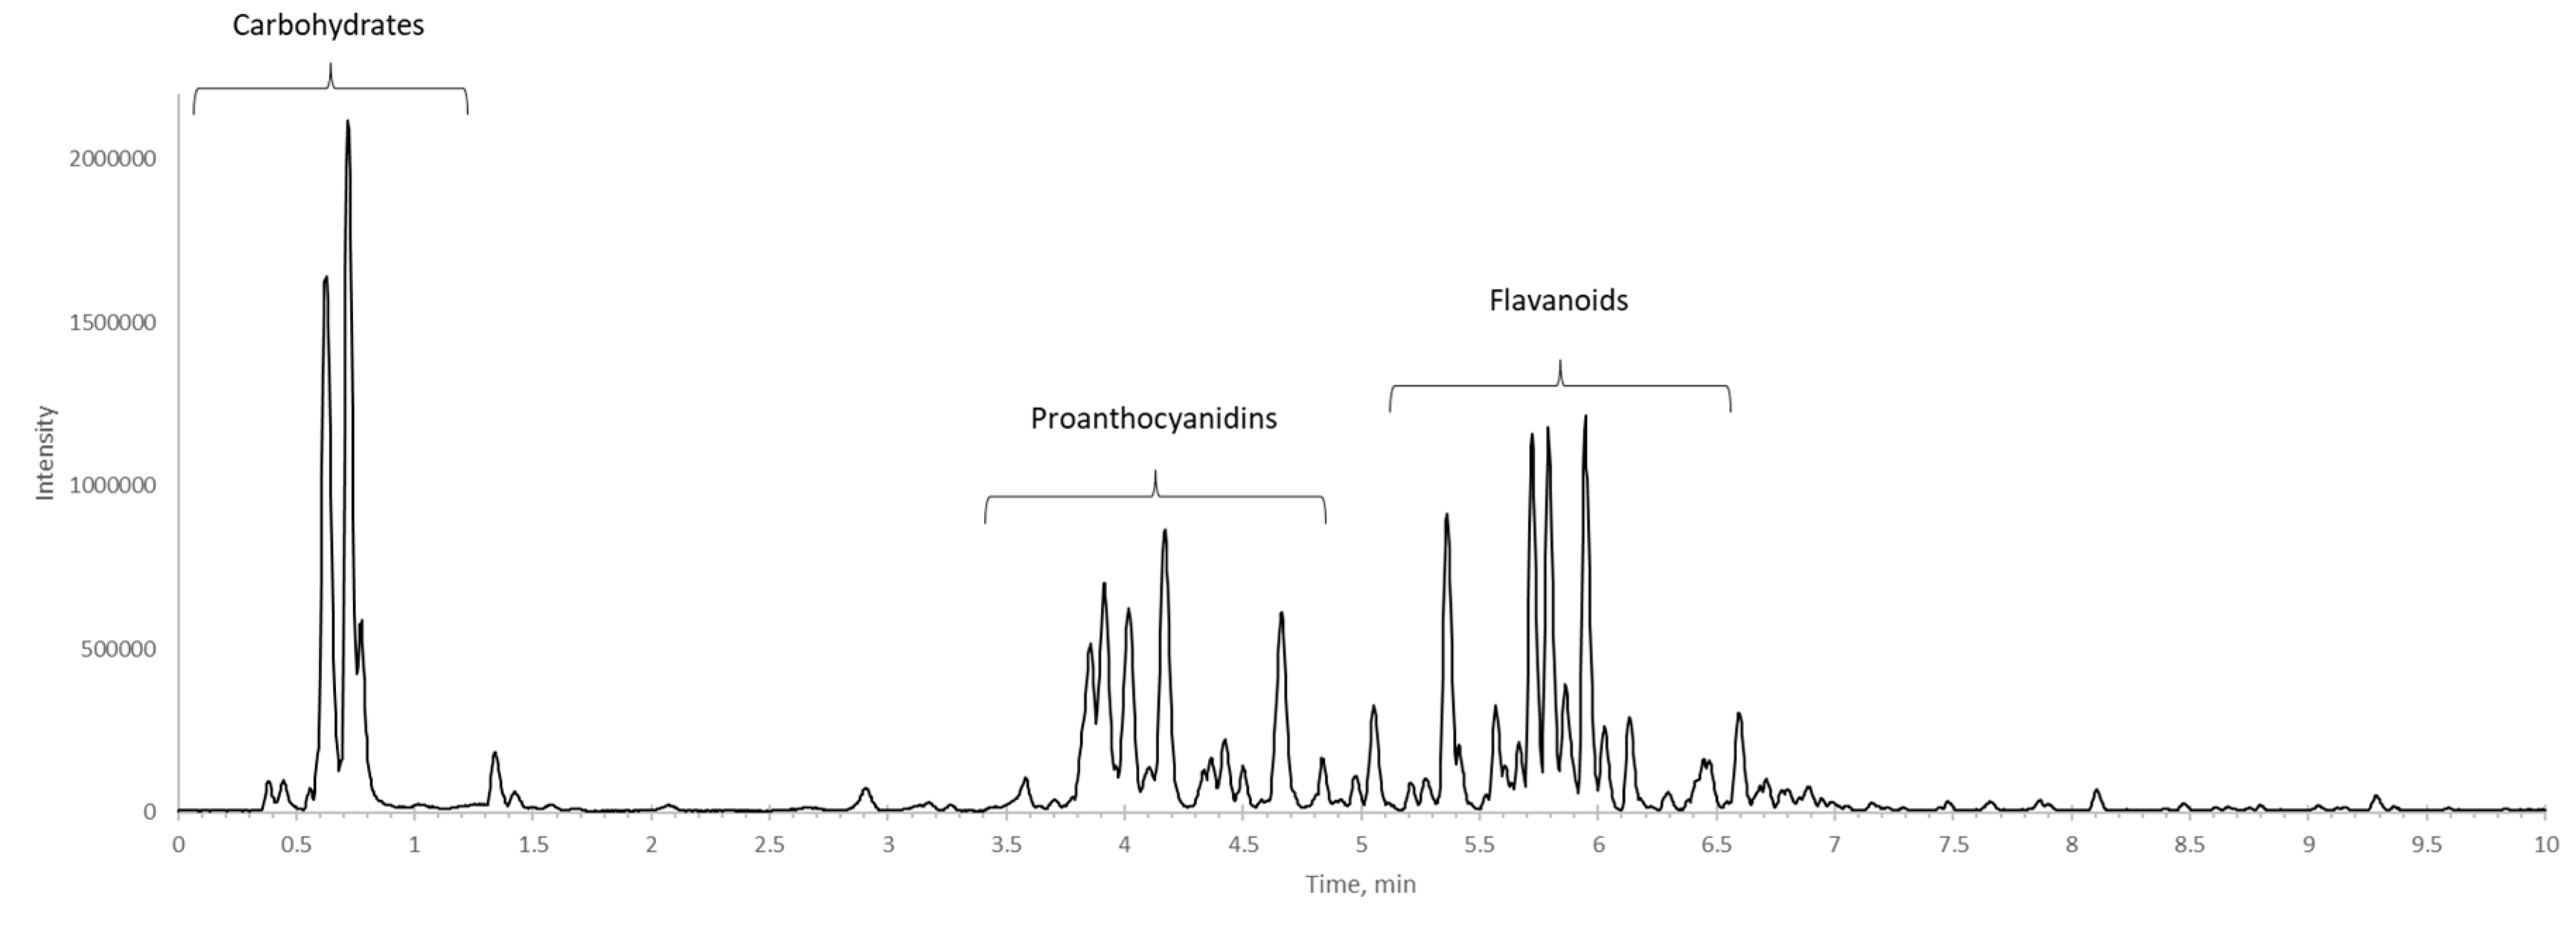
The composition of the obtained pine bark extracts was analyzed using the UHPLC-HRMS system. An example of the chromatogram obtained is shown in Figure 7.
From the obtained results, it can be observed that pine bark extracts predominantly contain proanthocyanidins with varying degrees of polymerization. The degree of polymerization for proanthocyanidins determined by UHPLC-MS analysis ranges from 2 to 5. Additionally, the pine bark extracts also contain a certain amount of flavonoids, as depicted in Figure 7.
To consider alder and pine bark extracts as biopolyols, vital information is the content and distribution of hydroxyl groups in these extracts. The total content of aliphatic and phenolic groups in black alder and pine extracts was determined by acetylating biomass samples with acetic anhydride, using pyridine as a catalyst. The excess acetic anhydride was decomposed by water into acetic acid, which was titrated with 0.1N NaOH (Zakis, 1994). The total content of phenolic and carboxylic groups was measured by conductometric titration using an automatic titration device (ABU 910) coupled with a Conductometer (CDM 210) and Titration Manager (TIM900). Carboxyl groups were determined separately using the calcium-acetate chemisorption method (Zakis, 1994). The phenolic group content was calculated as the difference between the values obtained by conductometric titration and the chemisorption method. The content of aliphatic groups in the biomass was calculated using the following equation: OH aliphatic = OH acetylated + OH COOH – OH Phenolic (Zakis, 1994).
Depending on the extraction conditions, the total content of hydroxy groups varies in the range of 24-30% for black alder bark extracts and in the range of 21-26% for pine bark extracts. The aliphatic groups dominate in all extracts, with the proportion of aliphatic to phenolic OH groups varying from 1.3 to 10.2 for black alder bark extracts obtained at dynamic heating to 90℃ and at 30 minutes of isothermal heating at 150℃, respectively. This proportion ranges from 3.1 to 5.3 for pine bark extracts obtained by dynamic heating up to 150℃ and by 30 minutes of isothermal heating up to 110℃, respectively. These data are consistent with previously described information regarding the content of carbohydrates and phenolic compounds in the extracts.
The information regarding the changes in bark after extraction was obtained by analyzing the volatile degradation products formed from biomass components during thermal decomposition using analytical pyrolysis. The pyrogram of the initial black alder bark and the identified compounds are presented in Table 4.
The diagnostic volatile pyrolysis products were classified as follows:
  • Carbohydrate-derived compounds, primarily represented by aliphatic acids and esters, aliphatic alcohols, aliphatic aldehydes and ketones, furan and pyran derivatives, cyclopentane derivatives, and anhydro sugars.
  • Non-methoxylated aromatic compounds such as phenol, 2-methyl-phenol, 3-and 4-methyl-phenol, 4-methoxy-3-methyl-phenol, 3,4-dimethyl- phenol, 3',5'-dihydroxyacetophenone, 1,2-benzenediol, 4-(4-hydroxyphenyl)-2-butanone etc. derived mainly from phenolic extractives.
  • Methoxylated phenols, guaiacyl (G-) and syringyl (S-) derivatives such as guaiacol, p-methylguaiacol, p-ethylguaiacol, p-vinylguaiacol, eugenol, p-propylguaiacol, isoeugenol, vanillin, acetoguaiacon, guaiacylacetone, propioguaiacone, dihydroconiferyl alcohol, syringol 4-methyl- syringol, 4-ethyl-syringol, 4-vinyl-syringol, 4-allyl- and 4-propyl- syringol, 4-propenyl-syringol, syringaldehyde, acetosyringone, syringylacetone derived from lignin.
  • Lipophilic extractive-derived compounds such as 1,4-dioxin, 2,3-dihydro- 1-dodecene, 1,3-dioxol-2-one,4,5-dimethyl-tetradecane, 3-tetradecene, cycloundecane, 1,1,2-trimethyl-1-octadecene etc.
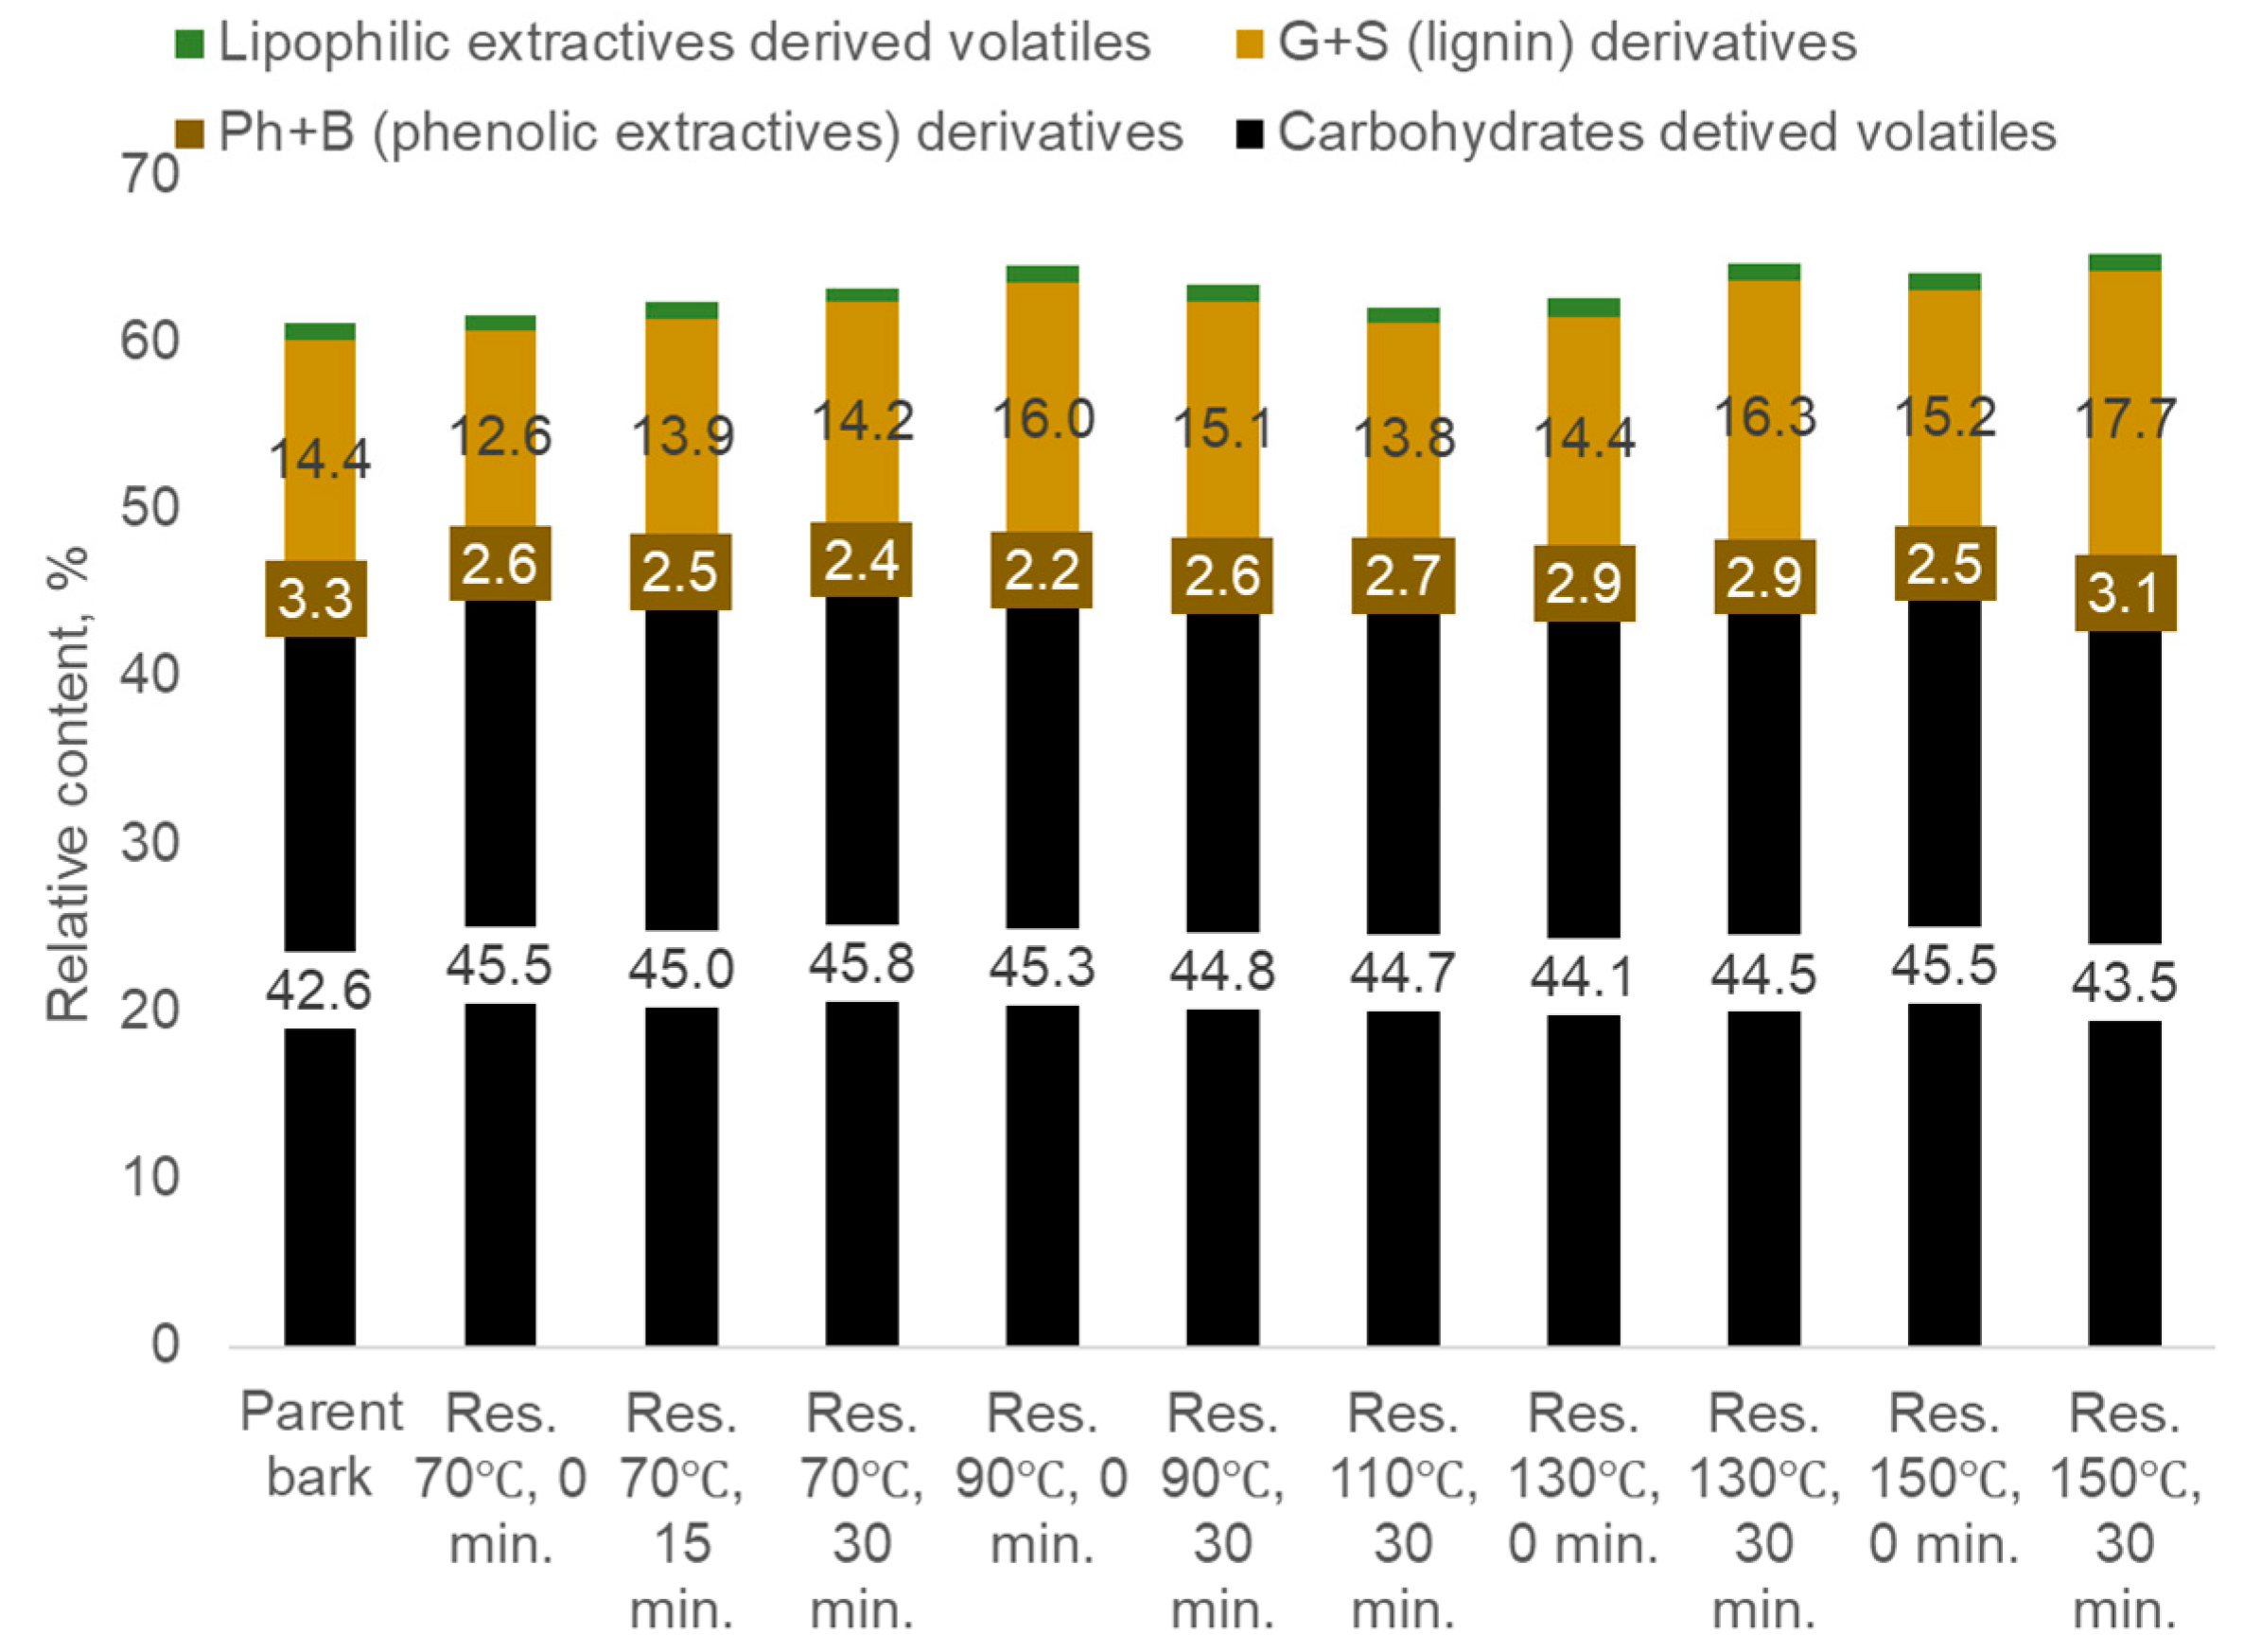
The pyrolysis products of black alder bark residues after extraction exhibit a lower content of non-methoxylated phenolic compounds, indicating the isolation of phenolic extractives. Additionally, there is a higher content of methoxylated aromatic compounds, indicating an increase in lignin concentration after extraction at 90, 130, and 150°C (Figure 8).
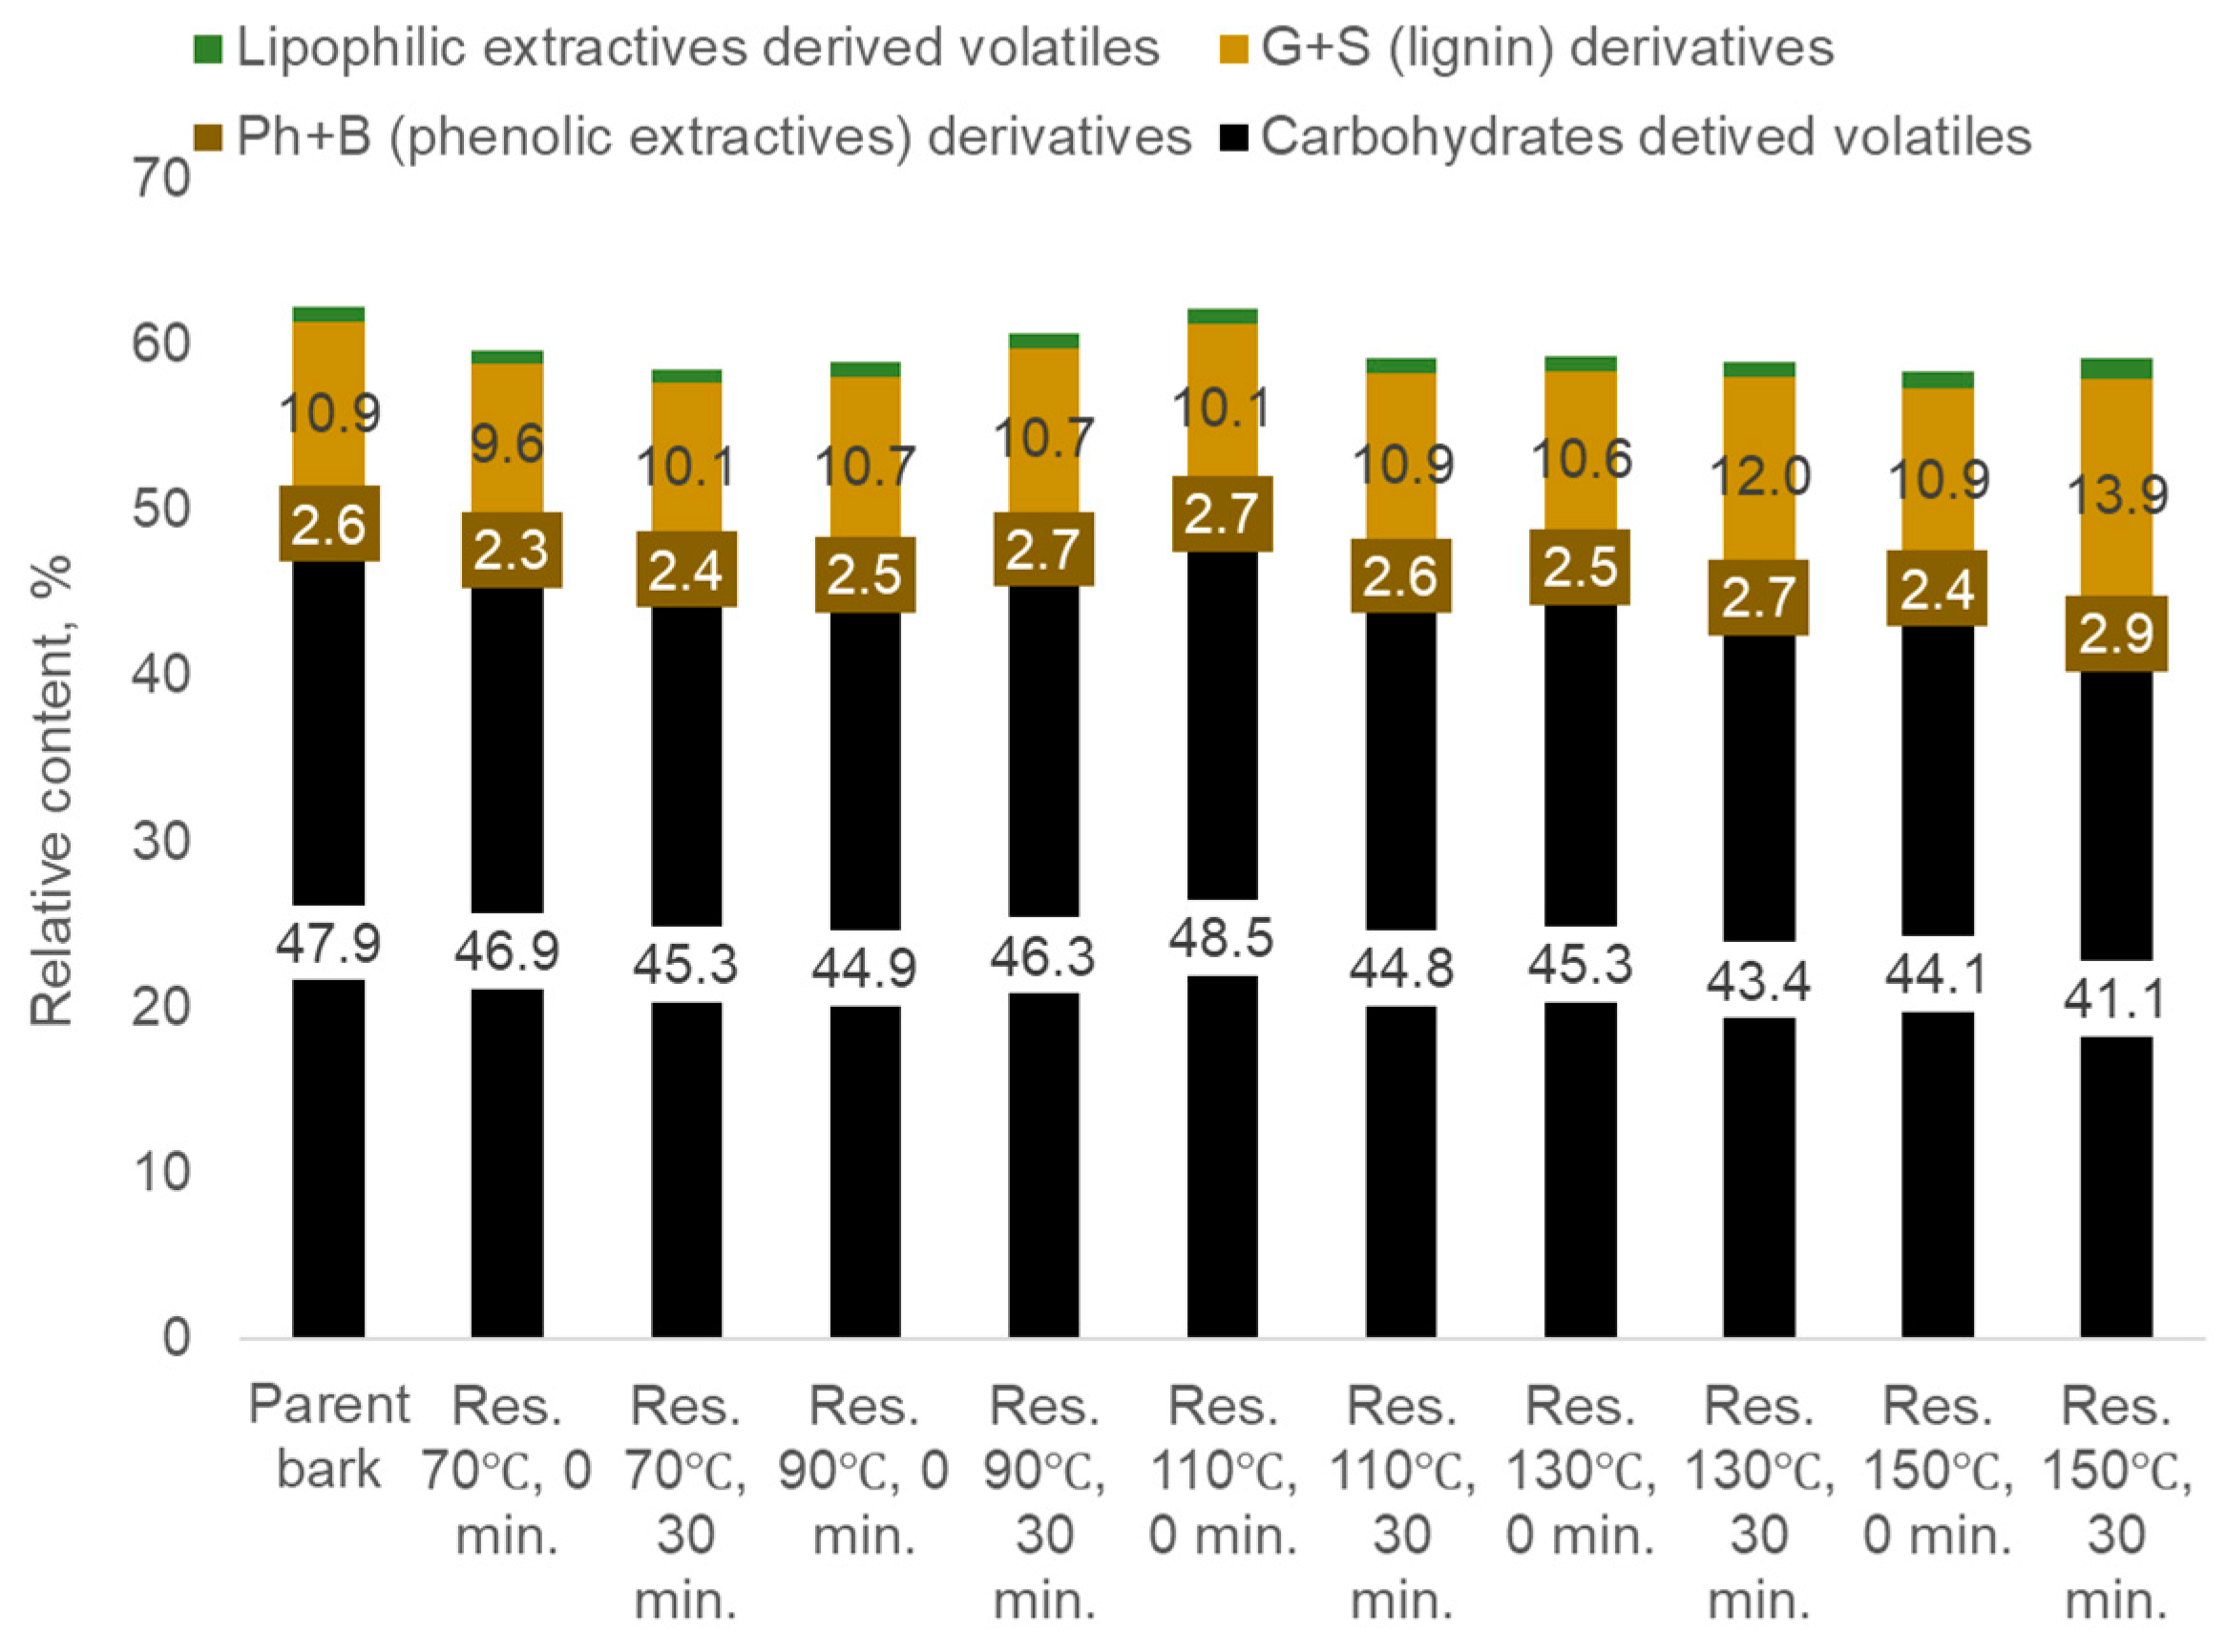
The concentration of lignin in the bark residues obtained after microwave-assisted water extraction at 130-150°C was also determined for the pine bark (Figure 9).
The content of lignin derivatives in both alder and pine bark residues increases with the extraction temperature, as confirmed by Py-GC/MS/FID analysis and Klason lignin determination. The Klason lignin content in the alder bark residues after extraction ranges from 39% to 51%, steadily increasing with higher extraction temperatures, compared to the 37% content in the non-extracted bark. A similar trend is observed for pine bark, and there is a significant positive correlation (p=0.05) between the data obtained from analytical pyrolysis and Klason lignin analyses.
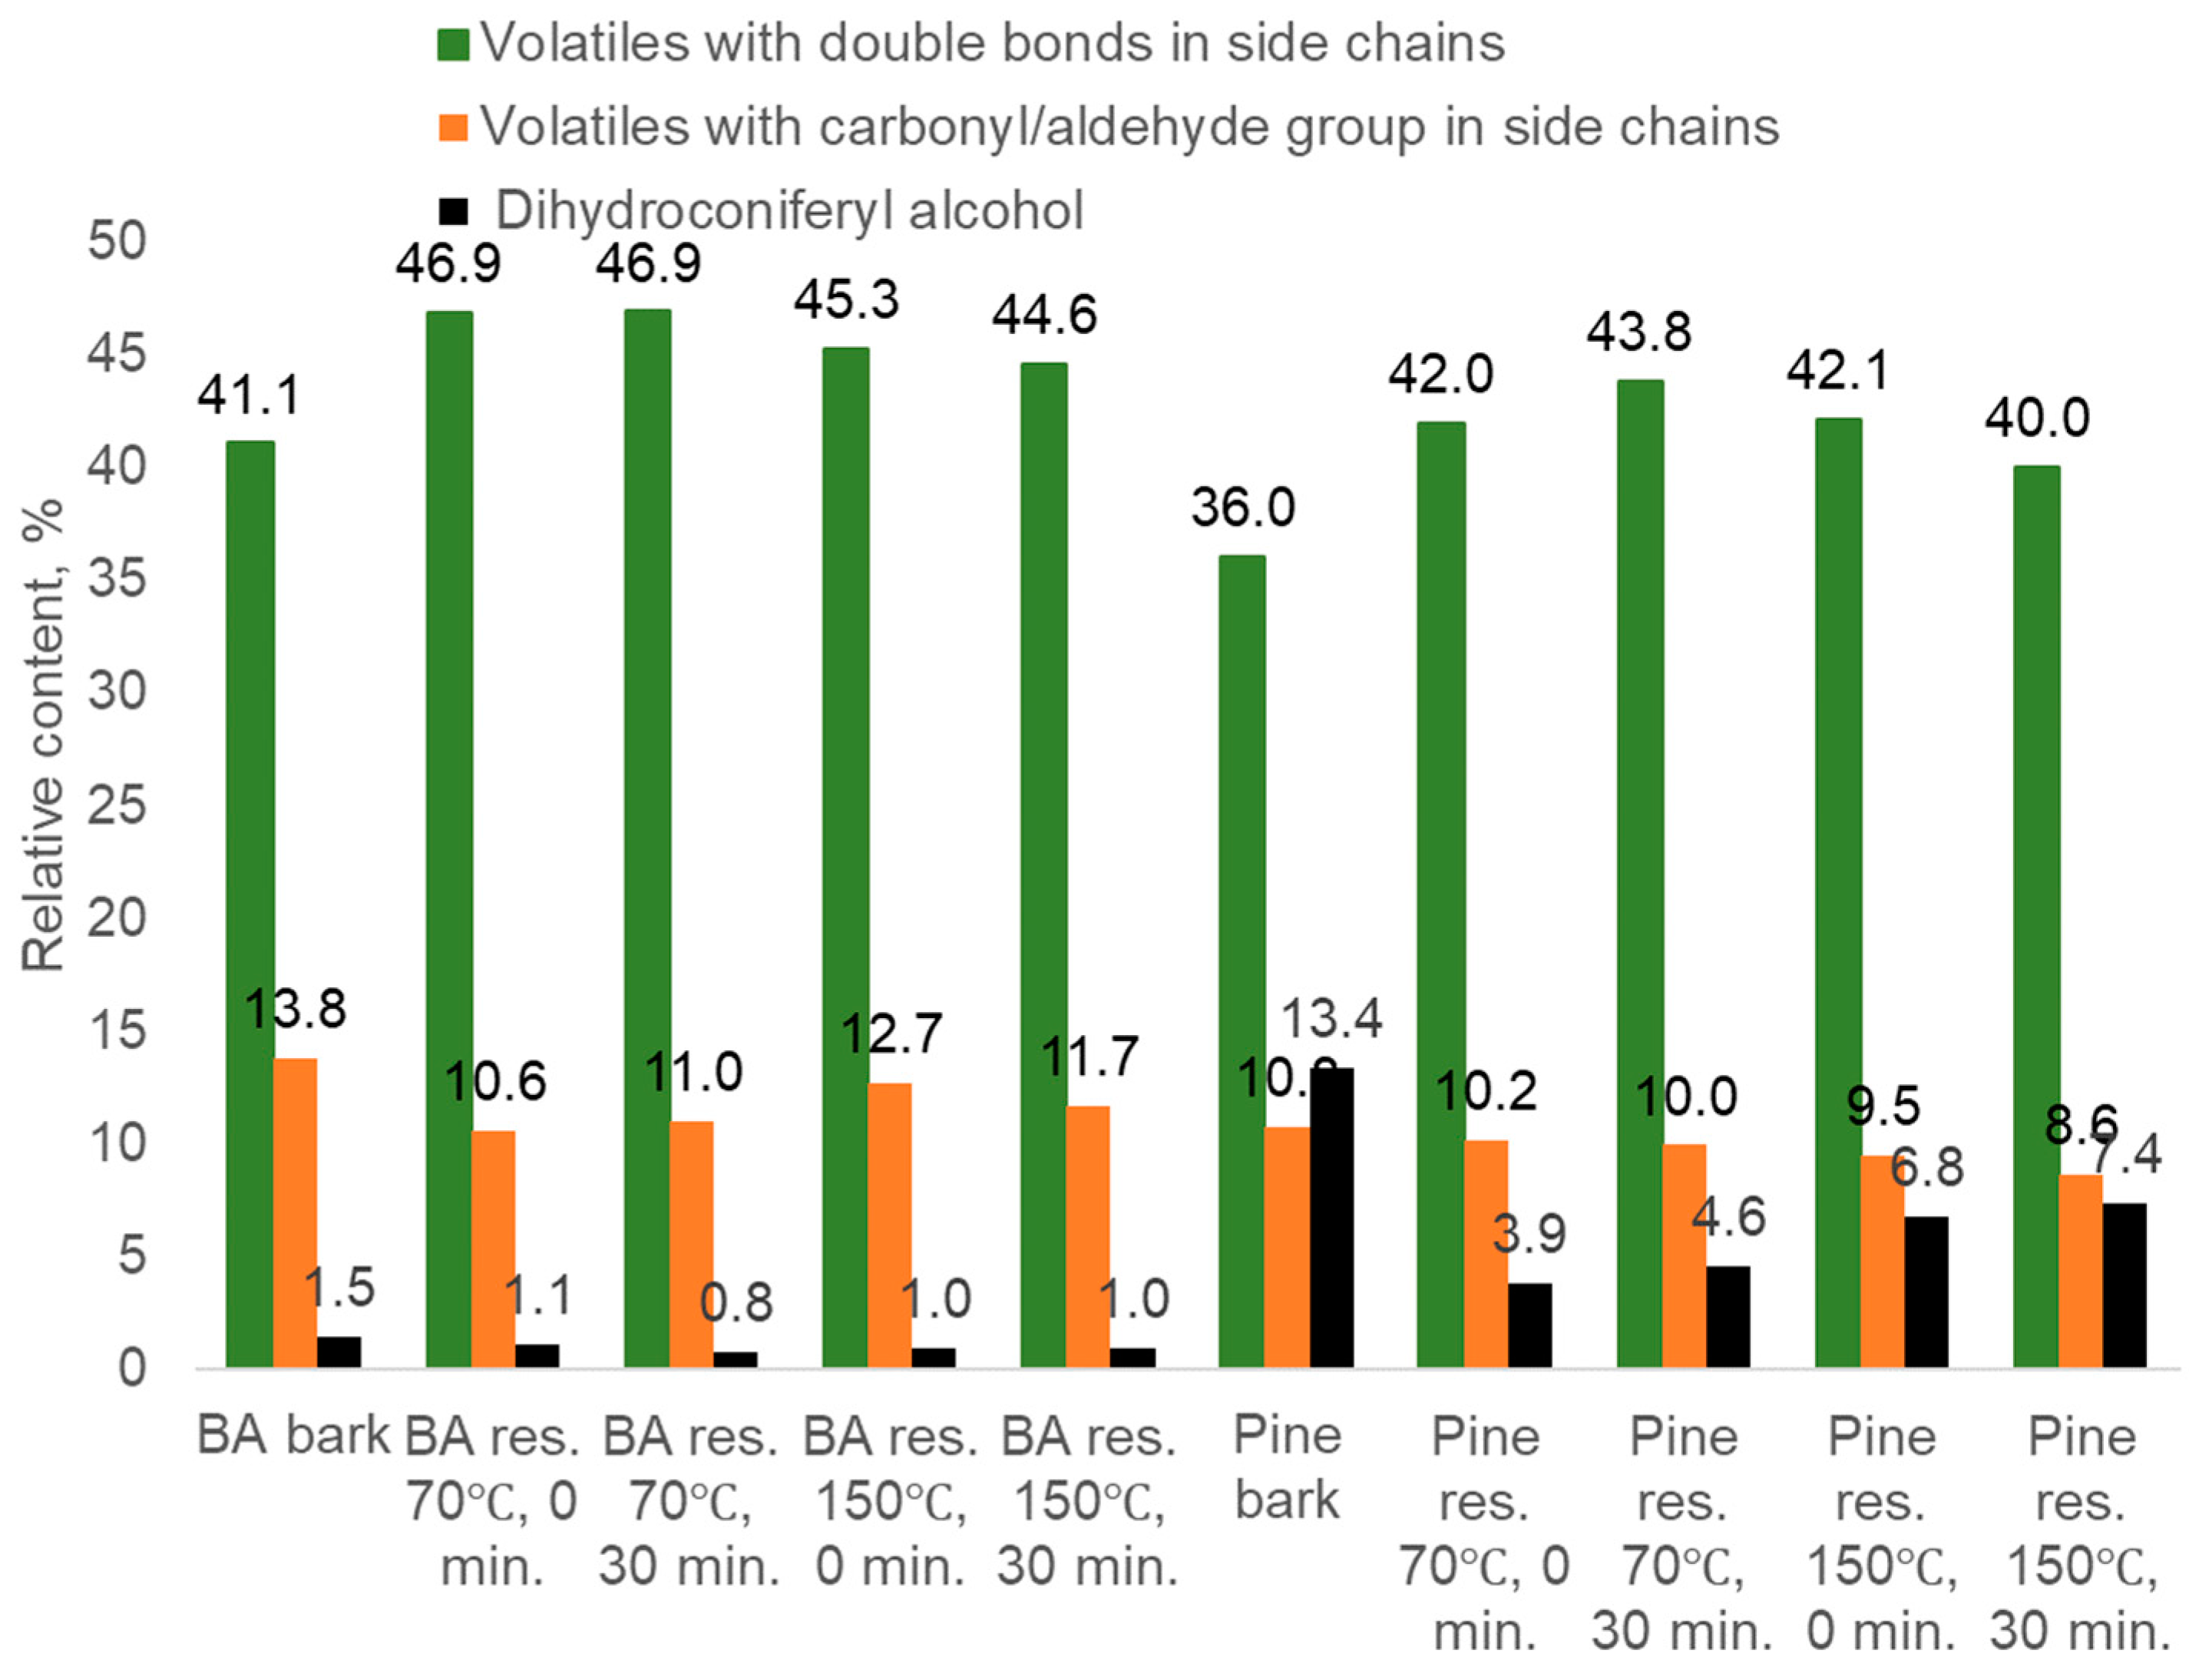
The study of the lignin-derived volatiles, specifically methoxylated phenols, reveals the changes in lignin composition/structure during extraction. The pyrolysis products of bark residues show lower contents of dihydroconiferyl alcohol compared to the parent bark, as well as a higher content of compounds with double bonds in the side chains (Figure 10). While the low-molecular lignin fractions are removed during extraction, the residues contain the most recalcitrant lignin, which is beneficial for using biomass as a filler to enhance the thermal stability of the composite material.

Conclusions

the extracts from black alder bark, particularly those obtained at 90°C with varying times of isothermal heating, primarily consist of derivatives of diarylheptanoids, which are complex compounds containing both phenolic and sugar units. Among these compounds, oregonin is the dominant compound, constituting approximately 60% of the extract's weight. The extracts contain approximately 26% hydroxyl groups by weight, with a balanced distribution between aliphatic hydroxyl (OH) and phenolic groups. In contrast, water extracts of pine bark obtained at temperatures ranging from 70-90°C with varying times of isothermal heating mainly consist of proanthocyanidins. Extracts from both black alder and pine barks obtained at different times of isothermal heating between 130-150°C are rich in carbohydrates and have an increased proportion of aliphatic OH groups. Diarylheptanoids, characterized by a linear C7 aliphatic chain rather than the aromatic and aliphatic cyclic structure found in commonly used tannins from bark extracts, possess flexible molecules that make them suitable candidates as natural soft segments within the polyurethane (PU) network. Their structural properties, such as high functionality and a long aliphatic side chain, contribute to achieving a favorable balance between rigidity and flexibility in PUs. Therefore, the extract derived from black alder bark obtained through water extraction using only dynamic heating up to 90°C, without further isothermal heating, and enriched with the diarylheptanoid oregonin, shows great potential as a building block for incorporation into PU matrices.
The solid residues obtained after bark extraction exhibit an enrichment of lignin compared to the initial bark. This enrichment occurs due to the removal of low molecular components and, under specific conditions, hemicelluloses during the extraction process. Unlike the extractives and hemicelluloses, which mainly generate volatiles during the thermal conversion of lignocellulosic biomass, lignin significantly contributes to the formation of charcoal. Consequently, we propose that incorporating bark extraction residues as fillers in polyurethane foam formulations will offer natural fire retardancy by forming a protective charcoal layer on the material surface during high-temperature oxidation.

References

  1. Argyropoulos, D. S., Pajer, N., & Crestini, C. (2021). Quantitative 31P NMR Analysis of Lignins and Tannins. Journal of Visualized Experiments, 174. https://doi.org/10.3791/62696. [CrossRef]
  2. Arshanitsa, A., Ponomarenko, J., Lauberts, M., Jurkjane, V., Jashina, L., Semenischev, A., Akishin, J., & Telysheva, G. (2020). Composition of extracts isolated from black alder bark by microwave assisted water extraction. 87–94. [CrossRef]
  3. Blakeney, A. B., Harris, P. J., Henry, R. J., & Stone, B. A. (1983). A simple and rapid preparation of alditol acetates for monosaccharide analysis. Carbohydrate Research, 113(2), 291–299. [CrossRef]
  4. Dizhbite, T., Telysheva, G., Jurkjane, V., & Viesturs, U. (2004). Characterization of the radical scavenging activity of lignins--natural antioxidants. Bioresource Technology, 95(3), 309–317. [CrossRef]
  5. Hagerman, A. E. (1995). Acid butanol assay for proanthocyanidins. Tannin Analysis, 45(1983), 24–25.
  6. Singleton, V. L., Orthofer, R., & Lamuela-Raventós, R. M. (1999). Analysis of total phenols and other oxidation substrates and antioxidants by means of folin-ciocalteu reagent (pp. 152–178). [CrossRef]
  7. Zakis, G. F. (viaf)276849665. (1994). Functional analysis of lignins and their derivatives. Atlanta (Ga.) : TAPPI press. http://lib.ugent.be/catalog/rug01:001647975.
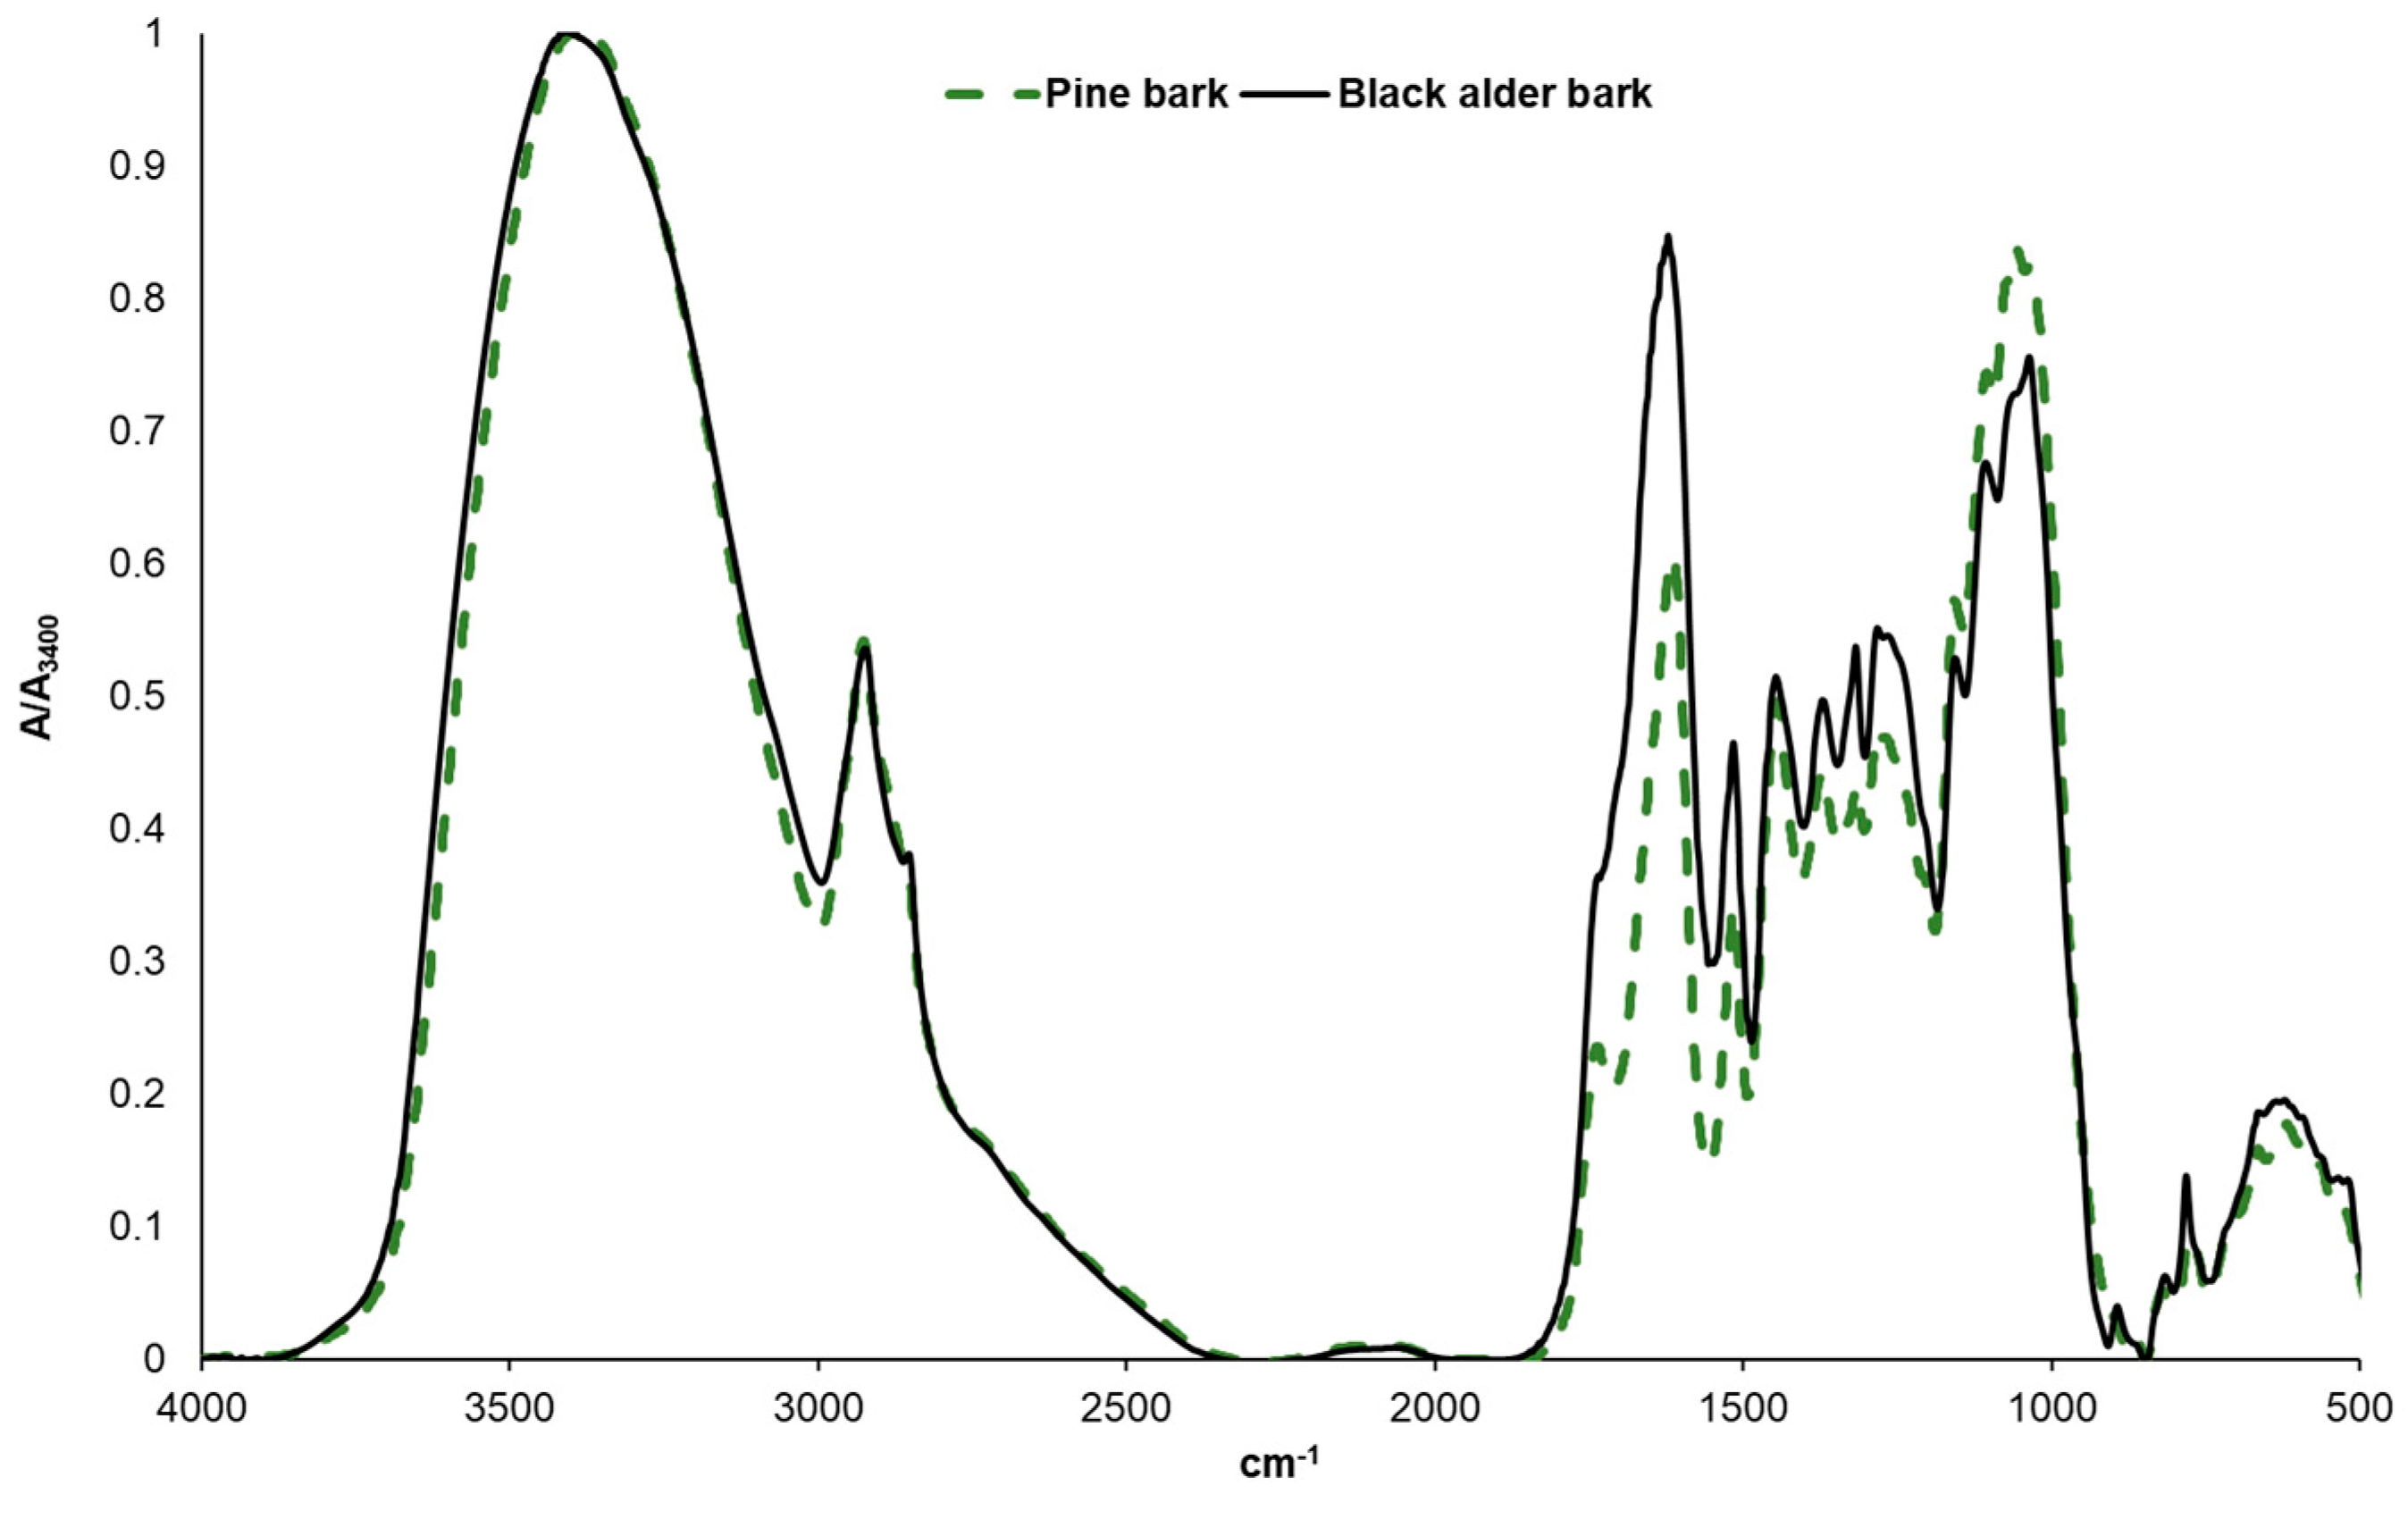
Figure 1. FTIR spectra of black alder and pine bark.
Preprints 80484 g001
Figure 2. Total monomeric carbohydrate content in extracts without (A) and with (B) prior H2SO4 hydrolysis depending on extraction time and temperature.
Preprints 80484 g002
Figure 3. Total phenolic content in extracts of black alder bark as a function of extraction temperature, time, and number of extraction cycles.
Preprints 80484 g003
Figure 4. Total content of proanthocyanidins in extracts of black alder bark as a function of extraction temperature, time, and number of extraction cycles.
Preprints 80484 g004
Figure 5. Radical scavenging activity of black alder bark extracts as a function of extraction temperature and time.
Preprints 80484 g005
Figure 6. UHPLC Chromatogram of Black Alder Bark Extract Obtained with Water and Dynamic Heating to 90°C. (Identified peaks are shown in Table 2.).
Preprints 80484 g006
Figure 7. UHPLC chromatogram of pine bark extract obtained with water and dynamic heating to 90°C.
Preprints 80484 g007
Figure 8. Composition of pyrolysis products from black alder bark and its residues after microwave-assisted water extraction depending on extraction conditions.
Preprints 80484 g008
Figure 9. Composition of pyrolysis products from pine bark and its residues after microwave-assisted water extraction depending on extraction conditions.
Preprints 80484 g009
Figure 10. Relative content of compounds with different structural features in lignin-derived volatiles.
Preprints 80484 g010
Table 1. Gradient solvent system.
T, min A, % B, %
0 95 5
0.5 95 5
17 5 95
18 5 95
18.5 95 5
20 95 5
Table 2. Identified Compounds in Black Alder Bark Extracts.
No Rt. min [M-H]- M2 Identification
1 0.38 288.94 174.96 158.96 Carbohydrates
2 0.62 341.11 179.06 89.02 Myzodendrone
3 0.71 191.06 473.15 113.02 Quinic acid
4 1.16 191.02 111.01 Quinic acid
5 3.90 577.14 407.08 289.07 (Epi)catechin- (epi)catechin
6 4.16 289.07 245.08 Catechin
7 4.36 337.09 163.04 Coumaroylquinic acid
8 4.60 577.14 409.11 289.07 Epi)catechin- (epi)catechin
9 4.89 866.00 407.08 289.06 Epi)catechin- (epi)catechin- (epi)catechin
10 4.98 337.09 173.05 Coumaroylquinic acid
11 5.00 761.14 615.19 3-O-galloyl- (epi)gallocatechin- (epi)gallocatechin
12 5.21 881.19 509.2 289.07 Epi)catechin- (epi)catechin- (epi)gallocatechin
13 5.34 441.18 359 289.07 catechin-3-O-gallate
14 5.45 507.19 327.12 205.09 Hirsutenone hexoside
15 5.56 479.19 347.15 Hydroxyoregonin
16 5.73 477.18 327.12 205.09 Oregonin
17 5.96 477.18 327.12 205.09 Oregonin
18 6.19 625.25 493.25 311.13 Rubranol C
19 6.37 461.18 493.25 311.13 Aceroside VII
20 6.46 493.21 331.16 311.13 Rubranoside A
21 6.65 609.25 493.21 327.12 Hirsutenone derivative
22 6.77 463.20 331.15 Rubranol xyloside
23 7.07 652.22 331.15 Blank
24 7.18 593.26 461.22 299.16 Blank
25 7.47 461.22 299.16 1- (4-hydroxyphenyl)-7- (3.4-dihydroxyphenyl) heptan-3-one-5-O-pentoside
26 7.67 327.13 205.9 Hirsutenone
27 7.90 327.13 205.9 Hirsutenone
28 8.03 327.13 205.9 Hirsutenone
29 8.22 293.17 193.11 Gingerol
Table 3. Characteristics of Obtained Pine Bark Extracts.
Temperature, ℃ Time, min Yield, % TPC, GAE·g-1 PAC, % Total sugar content, % IC 50, mg·L-1
-Hydrol +Hydrol
70 0 0.34 77.3
70 30 0.36 87.9 13 21.8 39.92
90 0 10.5 0.36 82.9 11.8 23.6
90 0 (5 cycles) 11.94 0.27 75.19 9.1 38.7
90 30 11.9 0.35 81.8 10.6 39.5
90 60 12.01 0.27 83.69 9.6 34.7
110 0 0.36 53.8 11.6 33.98
110 30 0.28 37.6 11.2 44.2
130 0 0.31 52.1 9.11 34.5
130 30 0.24 24.5 12.6 48.9
150 0 0.16 8.0 12.5 49.82 63.1
150 0 (5 cycles) 21.59 0.21 15.52 9.0 48.2
150 30 22.40 0.15 14.63 15.2 52.5
150 60 22.39 0.11 12.87 18.6 61.1
Table 4. Pyrolysis products of black alder bark.
Preprints 80484 i001Retention time, min.
Identified compound MW Retention time, min. Normalized peak area, % from chromatogram
Carbon dioxide 44 5.265 16.89
Water 18 5.445 20.5
Methylglyoxal 72 5.918 2.6
Furan, 2-methyl- 82 6.253 0.15
2,3-Butanedione 86 6.525 0.87
2-Butanone, 1-hydroxy- 88 6.675 0.31
Acetaldehyde, hydroxy- 60 7.148 4.17
Acetic acid 60 7.404 7.78
(S)-2-Hydroxypropanoic acid 90 7.555 0.07
2,3-Pentanedione 100 7.706 0.07
1,4-Dioxin, 2,3-dihydro- 86 8.095 0.35
2-Propanone, 1-hydroxy- 74 8.265 4.51
Formic acid, methyl ester 60 8.52 0.25
1H-Pyrrole, 1-methyl- 81 8.525 0.19
Furan, 2,5-dihydro-3-methyl- 84 8.796 0.13
Propanoic acid, 2-oxo- 88 8.886 0.18
Propanoic acid 74 9.023 0.29
Furan, 3-methyl- 82 9.249 0.03
Hexanal 100 9.41 0.07
2-Propenoic acid, methyl ester 86 9.721 0.19
Acetic acid, methyl ester 74 10.001 1.76
2-Butanone, 1-hydroxy-, isomer 88 10.116 0.67
Pyrrole 67 10.116 0.56
2(3H)-Furanone 84 10.486 0.09
3(2H)-Furanone 98 10.806 0.24
Propanoic acid, 2-oxo-, methyl ester 102 10.981 1.44
Propanal and Butanedial 58/86 11.18 1.12
Furfural 96 11.53 1.41
2-Cyclopenten-1-one 82 11.575 0.29
3-Hexanone, 2,2-dimethyl- 128 12.054 0.16
Butanoic acid, 2-methyl- 102 12.275 0.06
2-Furanmethanol 98 12.401 0.25
2-Propanone, 1-(acetyloxy)- 116 12.529 1.03
2-Cyclopenten-1-one, 2-methyl- 96 12.892 0.1
2-Heptanone, 3-methyl- 128 12.934 0.46
Furan, 2,3-dihydro-2,5-dimethyl- 98 13.111 0.03
Acetylfuran 110 13.225 0.17
Crotonic acid vinyl ester 112 13.542 0.13
4-Cyclopentene-1,3-dione 96 13.74 0.13
1,2-Cyclopentanedione 98 14.275 1.4
2,5-Hexanedione 114 14.467 0.04
Propanoic acid, 2-methylpropyl ester 130 14.716 0.09
2-Butanone, 1-(acetyloxy)- 130 14.785 0.06
2-Furancarboxaldehyde, 5-methyl- 110 14.905 0.15
2-Cyclopenten-1-one, 3-methyl- 96 15.415 0.2
2(3H)-Furanone, dihydro- 86 15.567 0.15
Hexanoic acid 116 15.686
2(5H)-Furanone 84 15.915 0.63
4-Hydroxy-,5,6-dihydro-(2H)-pyran-2-one 114 16.217 0.41
2,5-Furandione, 3-methyl- 112 16.408 0.1
1-Dodecene 168 16.561 0.05
1,2-Cyclopentanedione, 3-methyl- 112 16.769 1.04
2(5H)-Furanone, 3-methyl- 98 16.933 0.04
Phenol 94 17.313 0.92
Guaiacol 124 17.921 2.14
1,3-Dioxol-2-one,4,5-dimethyl- 114 18.11 0.07
Phenol, 2-methyl- 108 18.485 0.27
2-Cyclopenten-1-one, 3-ethyl-2-hydroxy- 126 18.906 0.12
Methyl 2-furoate 126 18.883 0.11
4H-Pyran-4-one, 3-hydroxy-2-methyl- 126 19.242 0.05
Phenol, 3-and 4-methyl- 108 19.359 0.77
Phenol, 4-methoxy-3-methyl- 138 19.578 0.04
4-Methyl-5H-2-one 98 19.842 0.13
2,5-Furandione, dihydro-3-methyl- 114 20.068
Phenol, 3,4-dimethyl- 122 20.409 0.21
p-Methylguaiacol 138 20.372 1.4
Pentanal and Pentanadial 86/100 20.783 1.12
Tetradecane 198 21.096 0.04
3-Tetradecene, (Z)- 196 21.195 0.08
Phenol, 4-ethyl- 122 21.418 0.28
3',5'-Dihydroxyacetophenone 152 21.827 0.05
Phenol, 2,5-dimethyl- 122 22.078 0.13
p-Ethylguaiacol 152 22.287 0.59
1-Heptanol, 2-propyl- 158 22.617 0.16
2,4(3H,5H)-Furandione, 3-methyl- 114 22.661 0.61
2H-Pyran-3(4H)-one, dihydro- 100 22.845 0.08
1,4;3,6-Dianhydro-.alpha.-d-glucopyranose 144 23.262 0.24
Benzofuran, 2,3-dihydro- 120 23.46 0.87
p-Vinylguaiacol 150 23.644 1.5
1,2-Benzenediol 110 23.938 0.17
Eugenol and p-Propylguaiacol 164/166 24.131 0.54
-D-Ribopyranoside, methyl, 3-acetate 206 24.407 0.09
Syringol 154 24.773 1.24
1,3-Di-O-acetyl---D-ribopyranose 234 25.082 0.31
cis-isoeugenol 164 25.334 0.26
Phenol, 3-methoxy-5-methyl- 138 25.537 0.09
Phenol, 4-(2-propenyl)- 134 25.891 0.08
trans-isoeugenol 164 26.474 1.65
-D-Glucopyranoside, methyl 3,6-anhydro 176 26.67 0.59
Syringol, 4-methyl- 168 26.67 0.6
Vanillin 152 27.169 0.33
Cycloundecane, 1,1,2-trimethyl- 196 27.937 0.3
Syringol, 4-ethyl- 182 28.135 0.3
1,2-Benzenediol, 3-methoxy- 140 28.538 0.09
Acetoguaiacon 166 28.776 0.29
Syringol, 4-vinyl- 180 29.336 0.92
Guaiacylacetone 180 29.723 0.28
Syringol, 4-allyl- and 4-propyl- 194/196 29.637 0.28
Propioguaiacone 180 30.334 0.09
Syringol, 4-propenyl-(cis) 194 30.626 0.2
Propioguaiacone, alfa-oxy- 194 30.751 0.07
1,6-Anhydro--D-glucopyranose 162 31.771 1
2-Butanone, 4-(4-hydroxyphenyl)- 164 31.481 0.15
Syringol, 4-propenyl-(trans) 194 31.771 0.55
Dihydroconiferyl alcohol 182 32.101 0.21
Syringaldehyde 182 32.532 0.15
4-sec-Butoxy-2-butanone 144 32.99 0.11
Acetosyringone 196 33.705 0.16
1-Octadecene 252 34.102 0.11
Syringylacetone 210 34.393 0.61
Disclaimer/Publisher’s Note: The statements, opinions and data contained in all publications are solely those of the individual author(s) and contributor(s) and not of MDPI and/or the editor(s). MDPI and/or the editor(s) disclaim responsibility for any injury to people or property resulting from any ideas, methods, instructions or products referred to in the content.
Copyright: This open access article is published under a Creative Commons CC BY 4.0 license, which permit the free download, distribution, and reuse, provided that the author and preprint are cited in any reuse.
Prerpints.org logo

Preprints.org is a free preprint server supported by MDPI in Basel, Switzerland.

Subscribe

© 2024 MDPI (Basel, Switzerland) unless otherwise stated