
Submitted:
25 July 2023
Posted:
26 July 2023
You are already at the latest version
Abstract
Silicon has been proved to be one of the most promising anode materials for the next generation of lithium-ion battery. For the application in batteries, Si anode should have high capacity and must be industrially scalable. In this study, we have designed and synthesised a hollow structure to meet these requirements. All the processes are carried out without special equipment. The Si nanoparticles that are commercially available are used as the core sealed inside TiO2 shell, with rationally designed void space between the particles and shell. The Si@TiO2 are characterised using X-ray diffraction (XRD), X-ray photoelectron spectroscopy (XPS), and scanning electron microscope (SEM). The optimised hollow structured silicon nanoparticles, when used as anode in lithium-ion battery, exhibit a high reversible specific capacity over 600 mAhg-1. This excellent electrochemical property of the nanoparticles can be attributed to their optimised phase and unique hollow nanostructure.
Keywords:
Silicon nanoparticles
; Li-ion battery
; anode
; TiO2
; capacity
Introduction
The increasing demand for renewable energy, which stems from the harmful impact of global warming and the depletion of fossil fuels, has created a pressing need for reliable and efficient electric vehicles and energy storage systems.[1,2,3,4] Due to their high energy density, low self-discharge rate, and long cycle life, lithium-ion batteries (LIBs), in particular, have emerged as a leading technology for electrical/electronic facilities, information technology, aerospace and electric vehicles (EVs). [5,6,7]
Nevertheless, further advancements in battery technology are necessary to meet the growing demand for energy storage. Using silicon as anode material in LIBs provides ultra-high theoretical specific capacity up to , which is over 10 times higher than that of conventional graphite anodes (). Anode materials such as Li, Sn, and Al have also been extensively studied in this field.[8,9,10] Moreover, the availability of abundant Si resources, coupled with its low working potential and environmental friendliness, makes Si an ideal material for anodes. [11]
Despite their high energy density, Si-based anodes have a well-documented tendency to expand during lithiation/delithiation process, which can greatly influence the electrochemical performance of the battery. Furthermore, low electrical conductivity and slow ion diffusion kinetics are other reasons why Si anodes have not been widely commercialized.[12,13,14] This expansion has posed a significant challenge, as it has the highest volume change of all anode materials. This expansion leads to the mechanical stress and strain on the surface of silicon materials, leading to the cracking. Silicon nanoparticles with size of ca 150 nm play a vital role, because cracking can be avoided when the size is less than that.[15]
Nano-Si with high surface areas is widely investigated due to the shortened pathways for lithium ion diffusion and electron transport.[16,17] However, high specific surface area of nanoscale Si also causes the formation of more SEI layers which could lead to the lower initial columbic efficiency. Combining Si with high conductivity materials can help avoiding the direct contact between nanoscale Si and electrolyte and release the volume change of Si during charging and discharging.[18,19,20] Thus, one potential solution to enhance the performance of Si is to design hollow structured silicon nanoparticles, which could mitigate the expansion and cracking problems. [1,21]
Here we present a hollow structure with silicon nanoparticles to mitigate the volume expansion of silicon during cycling, where a titanium dioxide shell is designed to wrap the silicon nanoparticles. In this study, Ti4+ in ethanol is chosen to react with oxygen to form a TiO2 shell outside the silicon nanoparticles. The procedure shown in Figure 1 is a simple one-pot process and can be easily scale up to industry scale.
Experimental Details
Material fabrication
There were two samples consisting of silicon nanoparticles with different thickness of the TiO2 shell prepared with the following procedure.
70 g glucose (>99.5%, Sigma-Aldrich) and 0.7 g silicon nanoparticles (60 nm, Thermo Fisher) were mixed and sonicated in 70 ml DI water to get a dark brown suspension because silicon nanoparticles were not dissolved in DI water. The dark brown suspension was transferred into a Teflon reactor and fixed into a stainless-steel autoclave, then put the autoclave into the oven and kept at 180 oC for 8 hours. After heating, the product was centrifuged three times at 10000 rpm for 10 min to wash away the extra glucose. The obtained dark brown slurry after centrifuging was dried under vacuum for 4 hours to get dry powder. After that, 20 ml of titanium isoproproxide (97%, Sigma-Aldrich) containing Ti4+ and 30 ml of ethanol were mixed and sonicated to make sure that Si@C was spread properly and then the mixture was aged for 12 hours. The aged suspension was washed three times with centrifuge to remove the extra Ti4+. After centrifuge washing, it was dried in the oven at 40 oC for 4 hours to get the Si@C@TiO2. The resulted white powder was heated in the furnace with 5 oC min-1 heating rate and kept at 550 oC for 2 hours to get final Si@TiO2.
Based on the battery performance achieved from the above recipe, the specific capacity was lower than expected and similar to TiO2.
This implies the TiO2 shell outside the silicon core was too thick. The amount of Ti4+ should be reduced to obtain a thinner shell. Then the procedure was adjusted to 5 ml of titanium isoproproxide for ageing the Si@C.
Material characterisation
The morphologies of the samples were investigated by scanning electron microscopy (SEM, Zeiss Gemini 300). The structure of the materials was characterised by an x-ray diffractometer (XRD, XtaLAB Synergy-S) operated with a scanning speed of 5o min-1 from 20o to 90o. Element compostion of the materials was measured by x-ray photoelectron spectroscopy (XPS, Harwell XPS). Dynamic light scattering (DLS) was employed to analyse the size of Si@TiO2 particles in dispersion and that was studies after dissolved in Ethonal.
Electrochemical measurements
Half cells were employed to test the electrochemical performance of Si@TiO2 electrodes. The working electrode was composed of active material, conductive addition and binder with a mass ratio of 8:1:1. As prepared Si@TiO2 was mixed with 10 wt.% carbon black and 10 wt.% PVDF in N-methyl pyrrolidone solution and the obtained slurry was coated on a copper foil. After drying in the vacuum oven, the electrodes (d=16mm) were prepared by punching machine.
The electrodes were assembled into half cells and full cells separately. 1M LiPF6 dissolved in ethylene carbonate (EC) and dimethyl carbonate (DMC) (1:1 in volume) with 2% vinylene carbonate (VC) was chosen as the electrolyte. The coin type half cell (CR2016) composed an anode and pure lithium chip with a porous polypropylene separator between them. In full cell the lithium chip was replaced by LiCoO2 as the cathode following the same procedure as in half cell. Both half cells and full cells were aged for 4 hours before testing. Cyclic voltammetry (CV) measurement was carried out by using ChenHua CHI-660E electrochemical workstation under a scan rate of 0.1 mVs-1 with a voltage window from 3 to 0.01 V (vs Li+/Li). Cycling performance of half cell and full cell were tested in constant current (CC) mode by Land CT3001 from 3 to 0.01V (vs Li+/Li) and from 4.2 to 3V (vs Li+/Li) respectively.
Results and discussion
X-ray Photoelectron Spectroscopy and
XPS is a surface sensitive technique, measured to determine the elemental composition and chemical states. XPS survey spectrum obtained from raw silicon nanoparticles (SiNPs) is shown in Figure 2, where only Si2s, Si2p and O1s peaks are visible. After heating silicon nanoparticles and glucose with initial recipe in oven at 180°C, a thick carbon shell is formed outside the silicon nanoparticles. The survey spectrum from this stage shows the element of O, C and Si in Figure 3: a very strong C1s peak and weak signal from Si. The analysis shows 77.46% C1s and 21.55% O1s, while the percentage of silicon is 0.98%. The Si2p can be deconvoluted into three peaks corresponding to Si-C (101.2eV), Si-O (102.1eV), Si-Si (97.6eV), respectively. The data confirms there should be a thick shell outside the silicon nanoparticle, when we compare Si@C with data from raw SiNPs. The signal from silicon is weak, because the X-ray is not possible to penetrate more than 5-10 nm below the sample surface.
After Si@C aged with titanium isoproproxide and heated to 550°C in a furnace without air protection, a hollow structured Si@TiO2 should be formed. The XPS spectra obtained from Si@TiO2 are shown in Figure 4, where the Ti peak is much stronger than the C1s peak because of the thick TiO2 shell wrapped outside the silicon nanoparticles. This is consistent with the observation by SEM image from Si@TiO2 shown in Figure 7(d). For the Ti2p spectrum shown in Figure 4(c), the peaks centered at 458 eV and 463.7 eV belong to Ti2p3/2 and Ti2p1/2 orbitals of TiO2 respectively. In addition, the binding energy spacing between the two spin split orbits is 5.7 eV, indicating the state of Ti4+ in the anatase TiO2.[24] However, the thick titanium shell is not doing good to expected improved battery performance. The electrochemical measurement on thick shell samples shows similar specific capacity to TiO2 only anode, which is 200 mAhg-1, see Figure 8(a). The high percentage of silicon within the sample may increase the specific capacity of the battery. The amount of titanium is therefore reduced to obtain a thinner shell outside the silicon nanoparticles. Figure 5 shows the XPS spectra after reducing the amount of titanium isoproproxide when ageing Si@C. The atomic percentage of silicon is 23.58%, which is over two times more than the atomic percentage of Ti 10.88%. This is evidence that the shell is thinner than in the previous sample. The high resolution XPS spectrum of Si2p is shown in Figure 5(b) and the peaks located at 102 eV and 102.7 eV belong to Si-O and Si=O, respectively, which is attributed to oxidation of SiNPs.
X-ray Powder Diffraction
The observations made using XPS are also visible in the XRD spectrum, the XRD spectrum obtained from Si@TiO2 with lower amount of Ti is shown in Figure 6. Si 111, Si 220, Si 400, and TiO2 all are visible in the XRD pattern, which could prove that the silicon nanoparticles are wrapped by TiO2 with the data observed from XPS spectra.
Scanning Electron Microscope
SEM is utilised to determine the size and shape of Si@TiO2. The SEM image of raw silicon nanoparticles is shown in Figure 7(a). After the 60 nm silicon nanoparticles mixed with DI water and glucose, and the mixture heated to 180oC for 12 hours, there is a thick carbon shell outside the silicon nanoparticles. This is also proved by the XPS spectra of Si@C in Figure 3, where the percentage of C is 77.46%. The shell is so thick that the XPS can only detect a very weak signal from the silicon nanoparticles inside. The SEM image, Figure 7(b) shows the size ca 500 nm, which is much larger than the raw material.
Figure 7.
SEM image of (a)raw 60 nm Si nanoparticles used for the synthesis, (b) Si@C after burning glucose and Si nanoparticles in the oven at 180oC, (c) Si@C@TiO2 after ageing the Si@C with titanium isoproproxide, (d) Si@TiO2 after removing C in furnace.
Figure 7.
SEM image of (a)raw 60 nm Si nanoparticles used for the synthesis, (b) Si@C after burning glucose and Si nanoparticles in the oven at 180oC, (c) Si@C@TiO2 after ageing the Si@C with titanium isoproproxide, (d) Si@TiO2 after removing C in furnace.
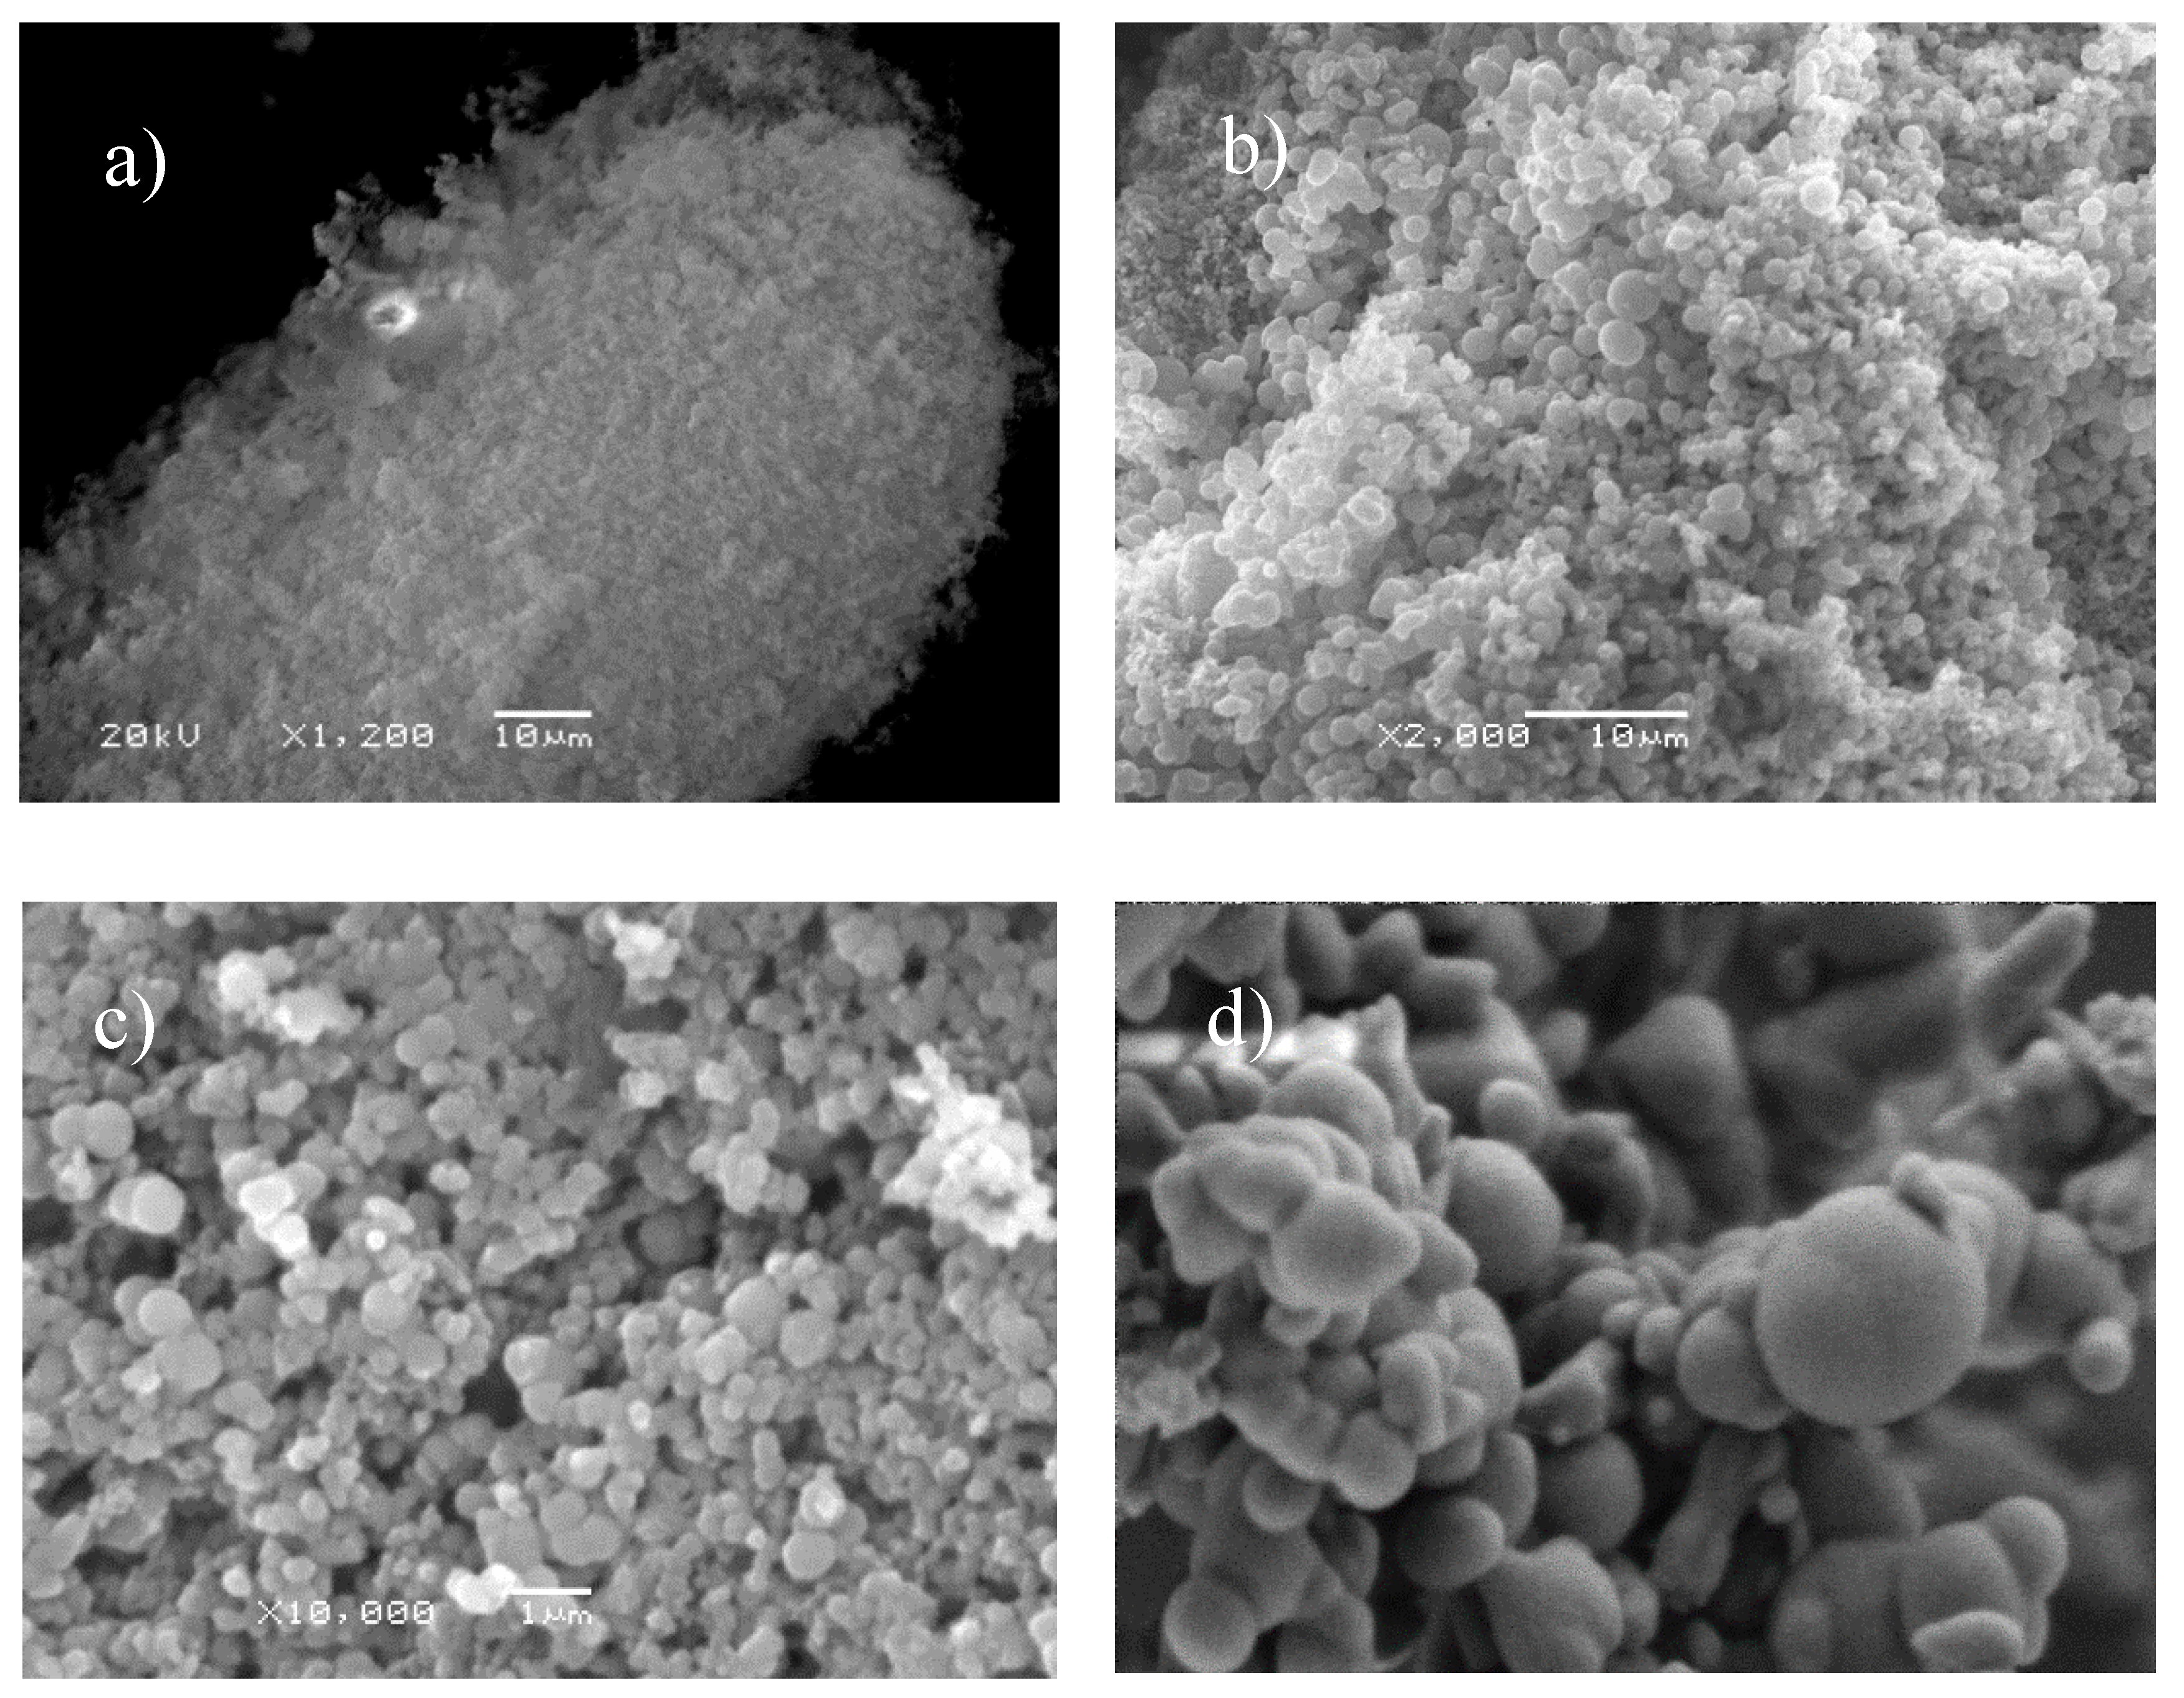
Si@C@TiO2 is formed after ageing Si@C with titanium isoproproxide. From the SEM image, shown in Figure 7(c), one can observe that the size is similar to that of Si@C. Finally, the Si@C@TiO2 was heated to 550oC under the ambient atomsphere without any protection. The solution of titanium isoprorpoxide contains Ti4+, which reacts with oxygen to form a TiO2 shell. After burning away the carbon between silicon nanoparticles and TiO2, the size is similar to the previous Si@C or Si@C@TiO2, but many anatase shells also merged with each other, thus forming connected yolk-shell Si@TiO2 clusters, like biological tissue that contains many adjacent cells,[25] see Figure 7(d).
SEM images can demonstrate whether TiO2 shell has wrapped multiple silicon nanoparticles together. If more than one nanoparticle is wrapped by the TiO2 shell, the size and shape would be changed. From the images for the Si@TiO2, multiple sizes of nanoparticles are obtained because not only one silicon nanoparticle is wrapped by the TiO2 shell, since the size of the raw silicon nanoparticles used for the synthesis is only 60 nm.
Dynamic Light Scattering
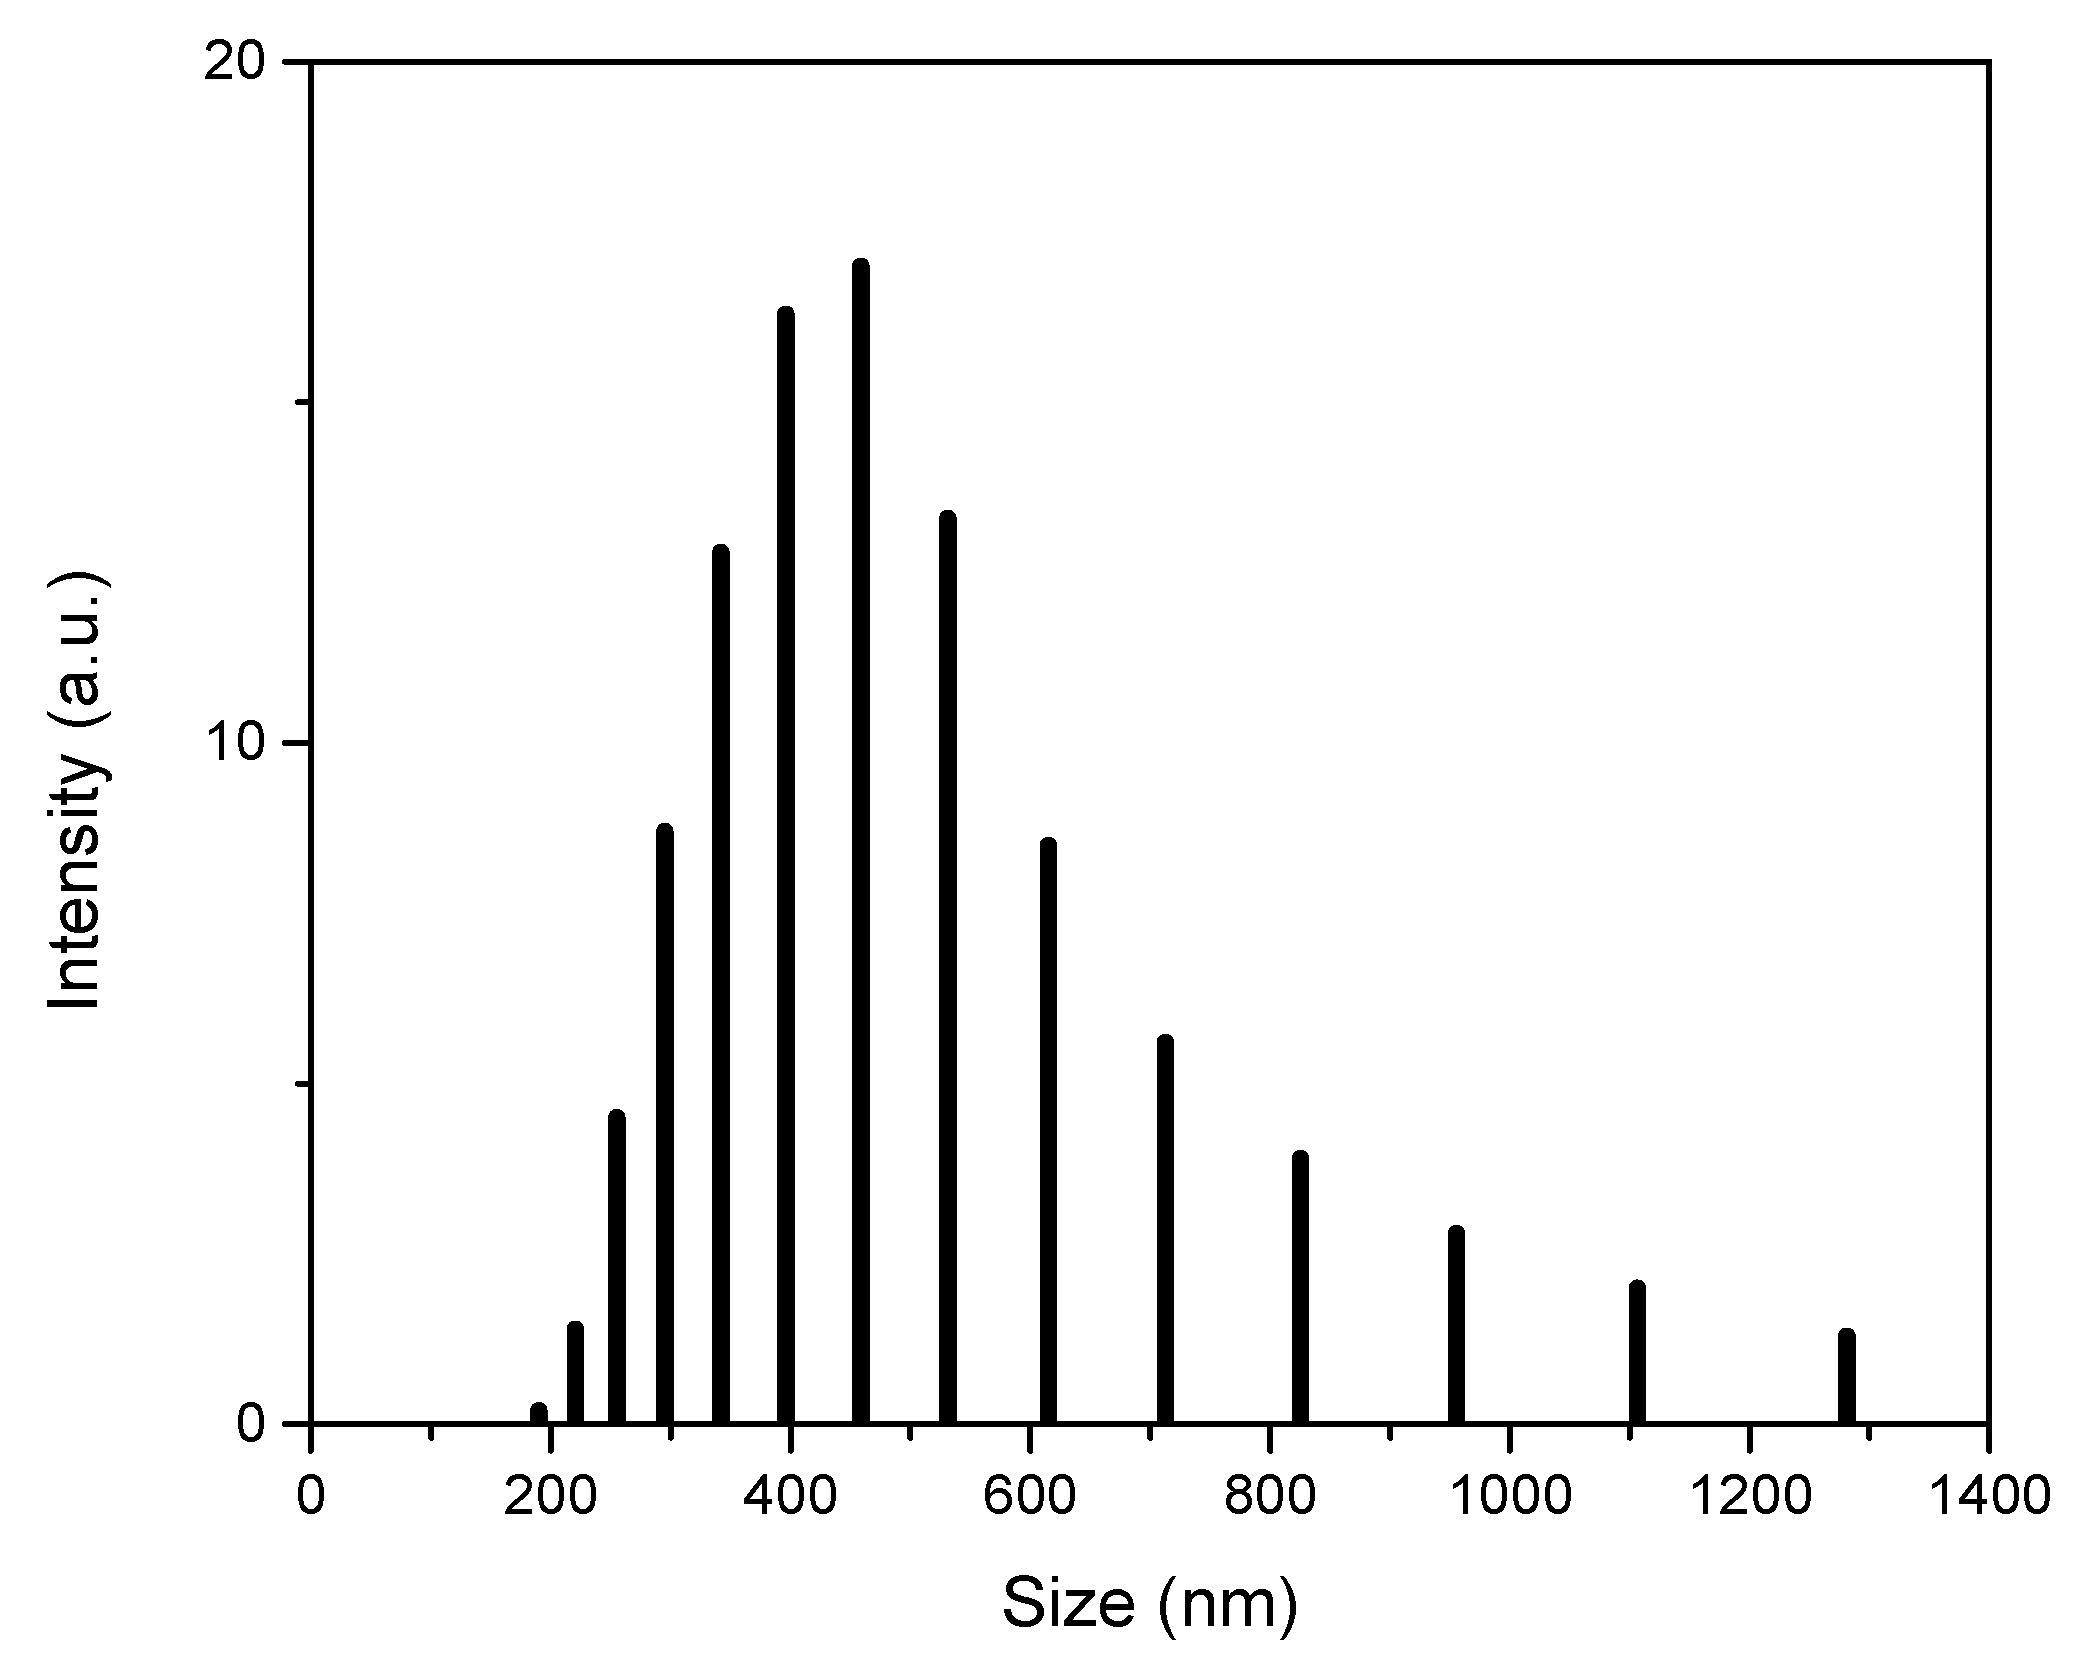
DLS measurement is a powerful technique used to study the size distribution of inorganic particles. Si@TiO2 with lower amount of Ti was dispersed in ethanol and sonicated before measurement. Figure 8 shows that most of the Si@TiO2 particles under investigation fall within the size range of 200 to 800 nm, shown in Figure 8. There are some large size particle over 800 nm, that should be anatase shells merged with each other, forming connected yolk-shell Si@TiO2.
DLS measurement can provide the key information of the particle size distribution. Combining with the SEM image, DLS data confirms the major size of Si@TiO2 is around 500 nm, and the size can be over 1 µm if more than one silicon nanoparticle is wrapped by the TiO2 shell.
Figure 8.
DLS measuement of Si@TiO2.
Half-cell and full-cell cycling test
Before the adjustment of the amount of titanium isoprorpoxide, the battery performance is shown in Figure 9(a), when assembling the battery with the thicker titanium dioxide shell encapsulated silicon nanoparticles. 1 mg Si@TiO2 was loaded to the electrode and was assemble with pure lithium chip in CR2016, tested at 50 mAg-1 in the voltage range 0-3.0 V. The discharge capacities of the initial three cycles are 341, 235 and 233 mAhg-1, respectively. The discharge capacity quickly drops to 119 mAhg-1 after 15 cycles. The CV curve is shown in Figure 9(b), which displays the reduction-oxidation reaction of the silicon-based anode during the first charging and discharging cycle within the voltage range 0-3.0 V at scan rate 0.1 mV s-1. There is a primary reduction peak at about 0.6 V, which is mainly corresponding to the silicon and a sharp peak around 1.5 V belongs to the TiO2. The observed oxidation peaks at 0.7 V and 1.4 V should be attributed to the lithium insertion into the silicon and TiO2. The TiO2 shell is too thick for the second charge-discharge cycles. The thick TiO2 shell makes main contribution to the redox reaction, while the characteristic peaks of deep silicon core are not so obvious.
The specific capacity of the higher amount of titanium is around 200 mAhg-1; even in the first cycle it is 340 mAhg-1, which is far away from the theoretical specific capacity of silicon but similar to the performance of titanium. The working voltage is around 1.8 V which is quite high when compared with silicon. Combining this data with the CV, previous XPS and XRD data, the titanium dioxide shell is too thick, so the silicon core does not contribute to the reaction during the charging and discharging cycles.
The Si@TiO2 with low amount of Ti electrode was assembled in half cell with pure lithium chip same as high amount Ti. After reducing the amount of titanium, the capacity of Si@TiO2 has been improved significantly, as the 1st, 5th, 10th, 20th, 30th and 50th cycle shown in Figure 10. In the first and fifth cycle discharge voltage curve, a small plateau around 0.4V may be due to the formation of solid electrolyte interface (SEI) layers, and the long flat plateau around 0.15V corresponds to the Li+ insertion into Si. The specific capacity of the first cycle is up to 630 mAhg-1, which is almost double the value from the current commercial materials used in batteries. In addition, the stability is much better than the heavy titanium sample. After 50 cycles, the specific capacity is still maintained at 440 mAhg-1, which is around 70% of the value in the initial cycle.
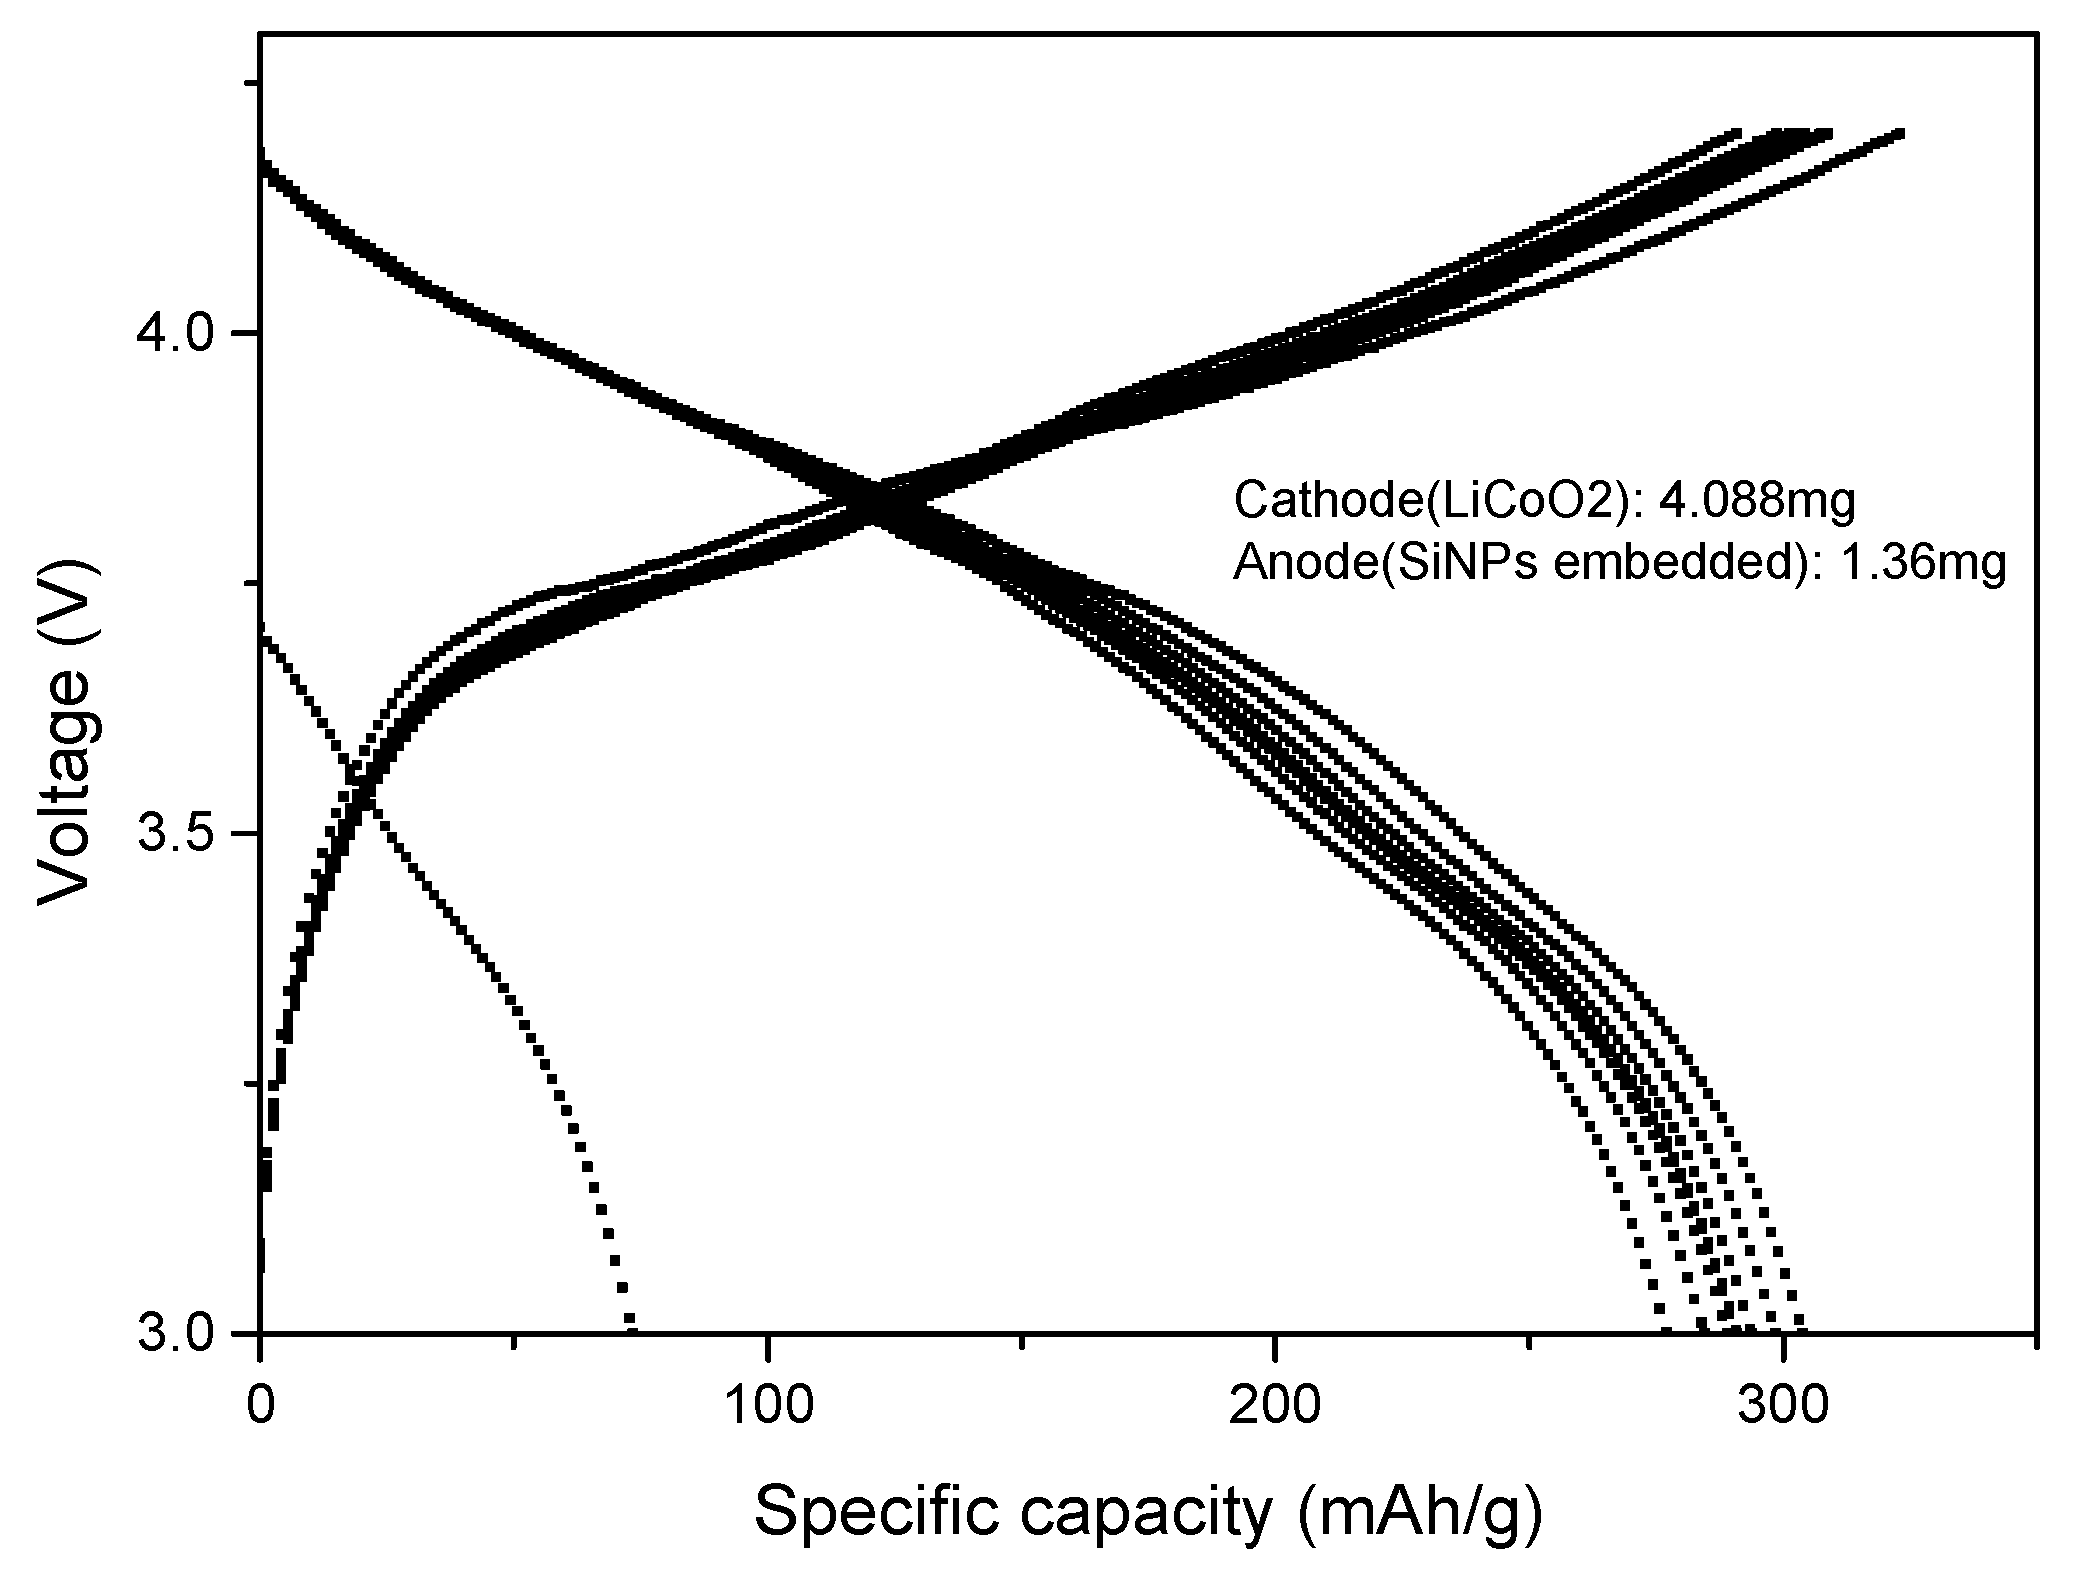
A half-cell battery is not suitable to be used in real daily life; it is just for research purpose to obtain data from the targeted materials. It is therefore necessary to assemble and test a full-cell battery to further investigate the feasibility of the Si@TiO2 electrode for the practical application. A Li-ion full cell was assembled with Si@TiO2 as anode and the LiCoO2 is selected as the cathode materials. The theoretical capacity of LiCoO2 is up to 274 mAh/g.[26] Figure 11 shows the charge/discharge voltage profile of the Si@TiO2/LiCoO2 full cell tested at 0.1 C (27.4 mAg-1, theory specific capacity of LiCoO2 is 274 mAhg-1) in the voltage range of 3-4.2 V. The discharge capacities (calculated based on the mass of the anode material) at the initial three cycles are 304, 299 and 294 mAhg-1, respectively. The charge/discharge capacity decreased from 304 to 277 mAhg-1 at the initial 10 cycles. The high discharge capacity indicate the Si@TiO2 has great potential for commercial application.
Conclusion
In conclusion, our study has focused on designing a hollow structured silicon nanoparticle anode for lithium ion batteries. The results indicate that this approach can significantly improve the performance of the battery. The hollow structure of the silicon nanoparticles provides ample space for the volume expansion that occurs during cycling, thereby reducing the risk of particle fracture and increasing the overall stability of the battery. Adjusting the amount of Ti can improve the performance of Si@TiO2 electrode. Furthermore, the high specific capacity of silicon, combined with the hollow structure, leads to enhanced energy storage and improved battery performance.
References
- Franco, A.A., et al., Boosting Rechargeable Batteries R&D by Multiscale Modeling: Myth or Reality? Chemical Reviews, 2019. 119(7): p. 4569-4627. [CrossRef]
- Kalair, A., et al., Role of energy storage systems in energy transition from fossil fuels to renewables. Energy Storage, 2020. 3(1): p. e135. [CrossRef]
- Ma, D., et al., Robust SnO2−x Nanoparticle-Impregnated Carbon Nanofibers with Outstanding Electrochemical Performance for Advanced Sodium-Ion Batteries. Angewandte Chemie International Edition, 2018. 57(29): p. 8901-8905. [CrossRef]
- Ward, J.D. and W.P. Nel, Comment on Fossil-fuel constraints on global warming by A. Zecca and L. Chiari [Energy Policy 38 (2010) 1–3]. Energy Policy, 2011. 39(11): p. 7464-7466. [CrossRef]
- Knobloch, F., et al., Net emission reductions from electric cars and heat pumps in 59 world regions over time. Nat Sustain, 2020. 3(6): p. 437-447. [CrossRef]
- Heydarian, A., et al., Application of a mixed culture of adapted acidophilic bacteria in two-step bioleaching of spent lithium-ion laptop batteries. Journal of Power Sources, 2018. 378: p. 19-30. [CrossRef]
- Xiao, F., et al., Large-scale production of holey graphite as high-rate anode for lithium ion batteries. Journal of Energy Chemistry, 2020. 48: p. 122-127. [CrossRef]
- Zhang, F., et al., Interfacial electrostatic self-assembly in water-in-oil microemulsion assisted synthesis of Li4Ti5O12/Graphene for lithium-ion-batteries. Journal of Alloys and Compounds, 2020. 819: p. 153018. [CrossRef]
- Tian, Q., et al., Reducing the excessive interior space of SnO2@C nanotubes by encapsulating SnO2 nanowires for high lithium storage. Journal of Alloys and Compounds, 2020. 820: p. 153404. [CrossRef]
- Tan, J., X. Qi, and J. Mao, A novel Al@TiO2-MCMB dual-ion battery with excellent cycling performance at high current rate. Journal of Alloys and Compounds, 2020. 818: p. 152853. [CrossRef]
- Xu, C., et al., Embedding Silicon in Pinecone-Derived Porous Carbon as a High-Performance Anode for Lithium-Ion Batteries. ChemElectroChem, 2020. 7: p. 152853. [CrossRef]
- Sun, F., et al., A rationally designed composite of alternating strata of Si nanoparticles and graphene: a high-performance lithium-ion battery anode. Nanoscale, 2013. 5(18). [CrossRef]
- Sun, F., et al., A rationally designed composite of alternating strata of Si nanoparticles and graphene: a high-performance lithium-ion battery anode. Nanoscale, 2013. 5(18): p. 8586-8592. [CrossRef]
- Han, L., et al., Toward Superb Perovskite Oxide Electrocatalysts: Engineering of Coupled Nanocomposites. Small, 2022. 18(50): p. 2204784. [CrossRef]
- Liu, X.H., et al., Size-Dependent Fracture of Silicon Nanoparticles During Lithiation. ACS Nano, 2012. 6(2): p. 1522-1531. [CrossRef]
- Chen, J., et al., Facile fabrication of Si mesoporous nanowires for high-capacity and long-life lithium storage. Nanoscale, 2013. 5(21): p. 10623-10628. [CrossRef]
- Wu, H., et al., Stable cycling of double-walled silicon nanotube battery anodes through solid–electrolyte interphase control. Nature Nanotechnology, 2012. 7(5): p. 310-315. [CrossRef]
- Liu, N., et al., A pomegranate-inspired nanoscale design for large-volume-change lithium battery anodes. Nature Nanotechnology, 2014. 9(3): p. 187-192. [CrossRef]
- Luo, W., et al., Critical thickness of phenolic resin-based carbon interfacial layer for improving long cycling stability of silicon nanoparticle anodes. Nano Energy, 2016. 27: p. 255-264. [CrossRef]
- Yang, J., et al., Yolk-shell silicon-mesoporous carbon anode with compact solid electrolyte interphase film for superior lithium-ion batteries. Nano Energy, 2015. 18: p. 133-142. [CrossRef]
- Wu, Y.-J., et al., Small highly mesoporous silicon nanoparticles for high performance lithium ion based energy storage. Chemical Engineering Journal, 2020. 400: p. 125958. [CrossRef]
- Liu, H., et al., Mesoporous TiO2-B Microspheres with Superior Rate Performance for Lithium Ion Batteries. Advanced Materials, 2011. 23(30): p. 3450-3454. [CrossRef]
- Li, J., et al., Synthesis of Si/TiO2core–shell nanoparticles as anode material for high performance lithium ion batteries. Journal of Materials Science: Materials in Electronics, 2016. 27(12): p. 12813-12819. [CrossRef]
- Jiang, J., et al., Auto-adjustment of structure and SnO2 content of SnO2/TiO2 microspheres for lithium-ion batteries. Chemical Engineering Journal, 2019. 359: p. 746-754. [CrossRef]
- Jin, Y., et al., Self-healing SEI enables full-cell cycling of a silicon-majority anode with a coulombic efficiency exceeding 99.9%. Energy and Environmental Science, 2017. 10(2): p. 580-592. [CrossRef]
- Deng, D., Li-ion batteries: basics, progress, and challenges. Energy Science & Engineering, 2015. 3(5): p. 385-418. [CrossRef]
Figure 1.
Synthesis procedure of hollow structured Si@TiO2 Owing to its low structural strain and non-toxicity, TiO2 has gained immense attention as a safe electrode material for lithium-ion batteries (LIBs). It has been reported to be a superb anode material because of its great chemical stability.[22,23] Titanium is used as part of anode materials with high specific capacity materials, such as Li and Al, to improve the stability of this kind of anode material. [8,10].
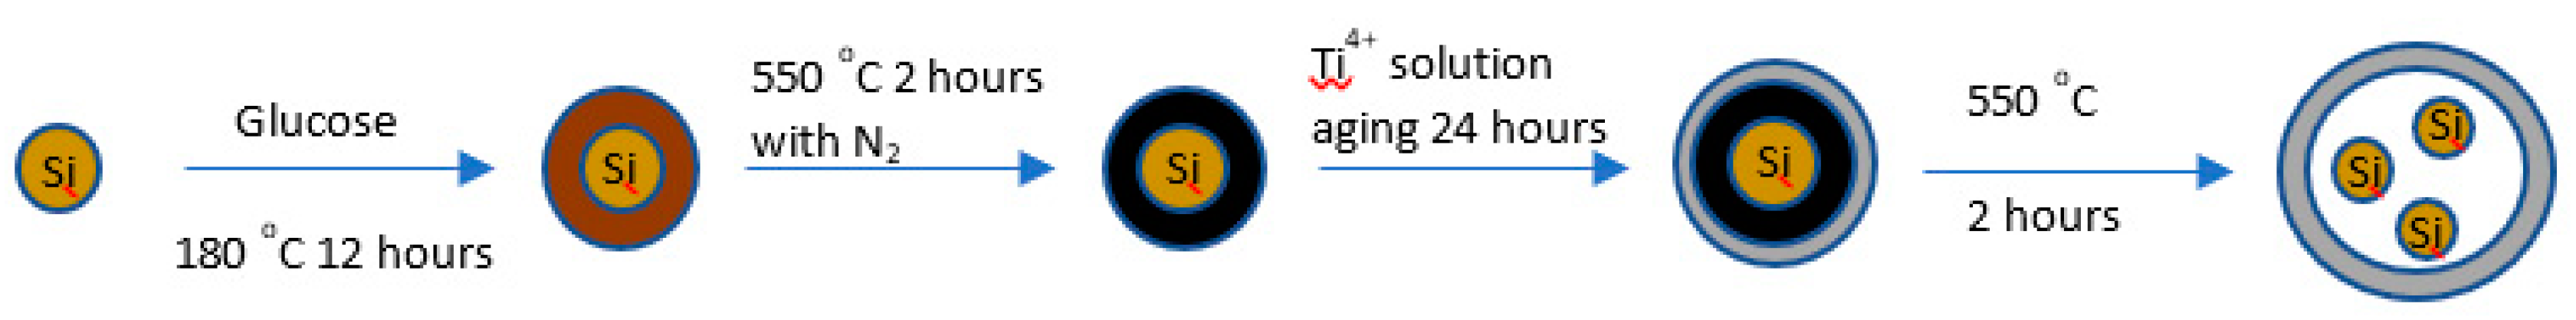
Figure 2.
XPS survey spectrum obtained from Si powder (Step: 1 eV).
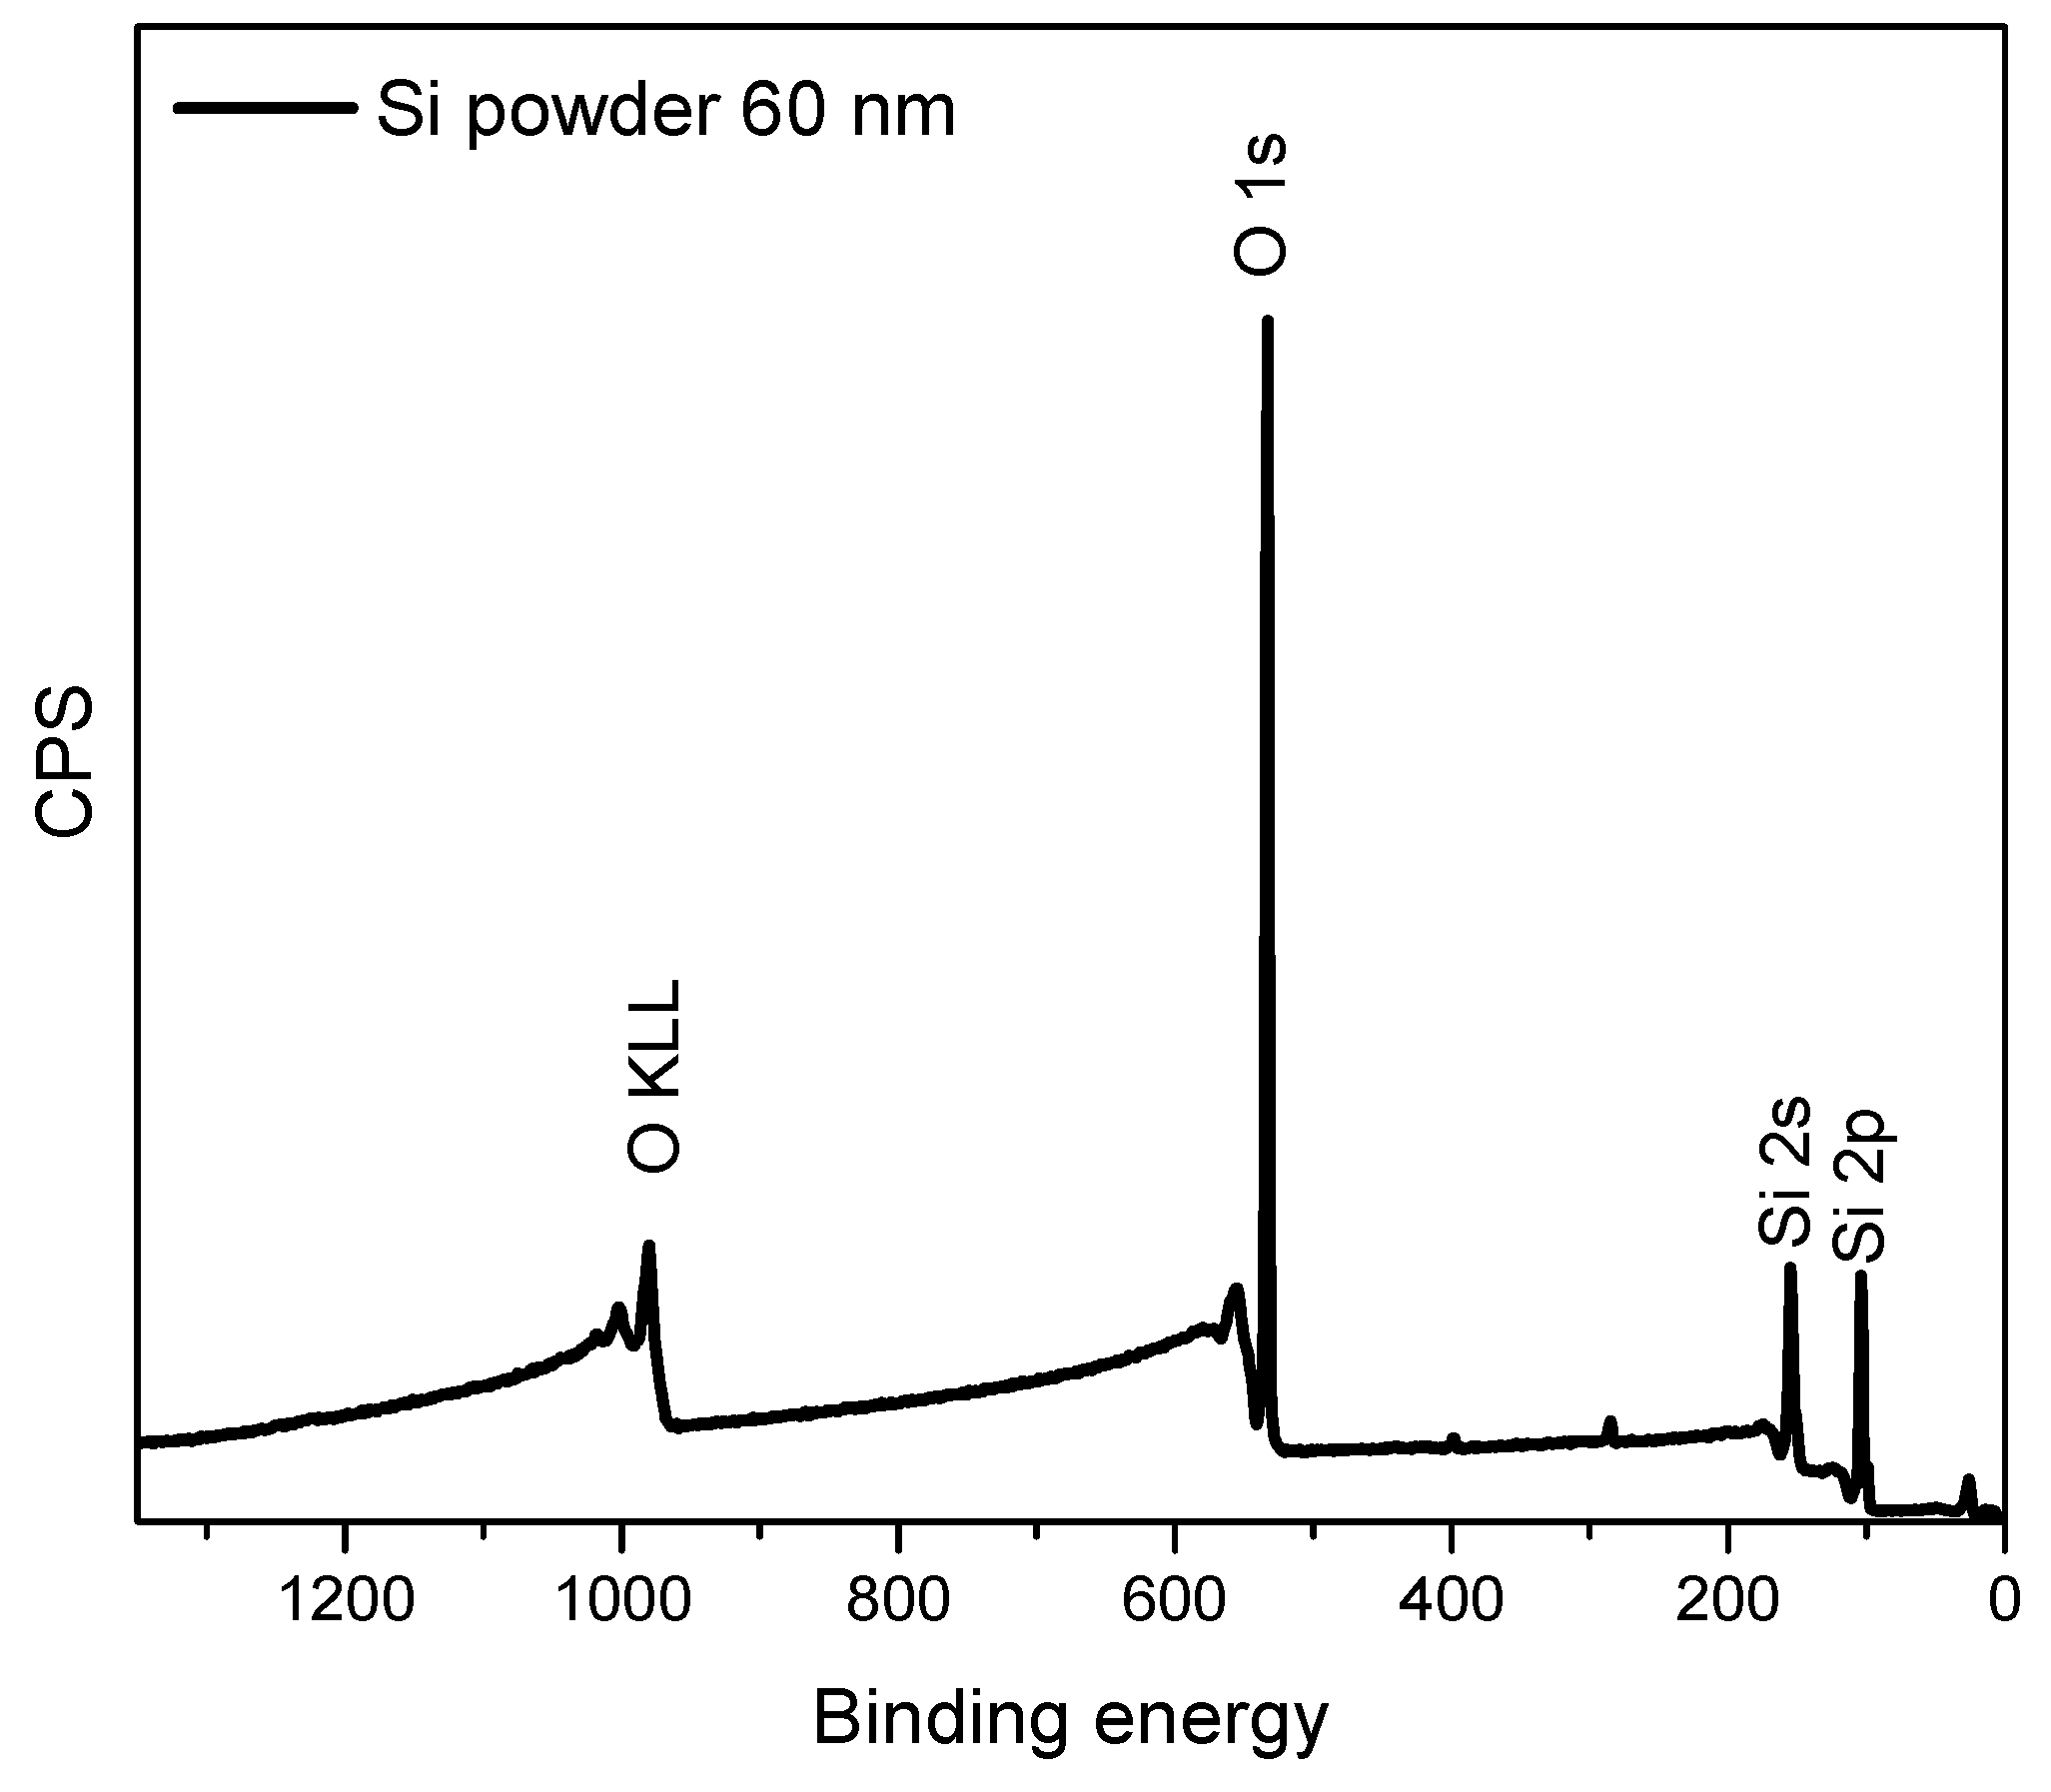
Figure 3.
XPS spectra obtained from Si@C (a) XPS survey spectrum from Si@C with 1 eV step (b) high resolution spectrum showing Si2p region with 0.1 eV step (c) high resolution spectrum showing of O1s with 0.1 eV step (d) high resolution spectrum showing C1s region with 0.1 eV step.
Figure 3.
XPS spectra obtained from Si@C (a) XPS survey spectrum from Si@C with 1 eV step (b) high resolution spectrum showing Si2p region with 0.1 eV step (c) high resolution spectrum showing of O1s with 0.1 eV step (d) high resolution spectrum showing C1s region with 0.1 eV step.
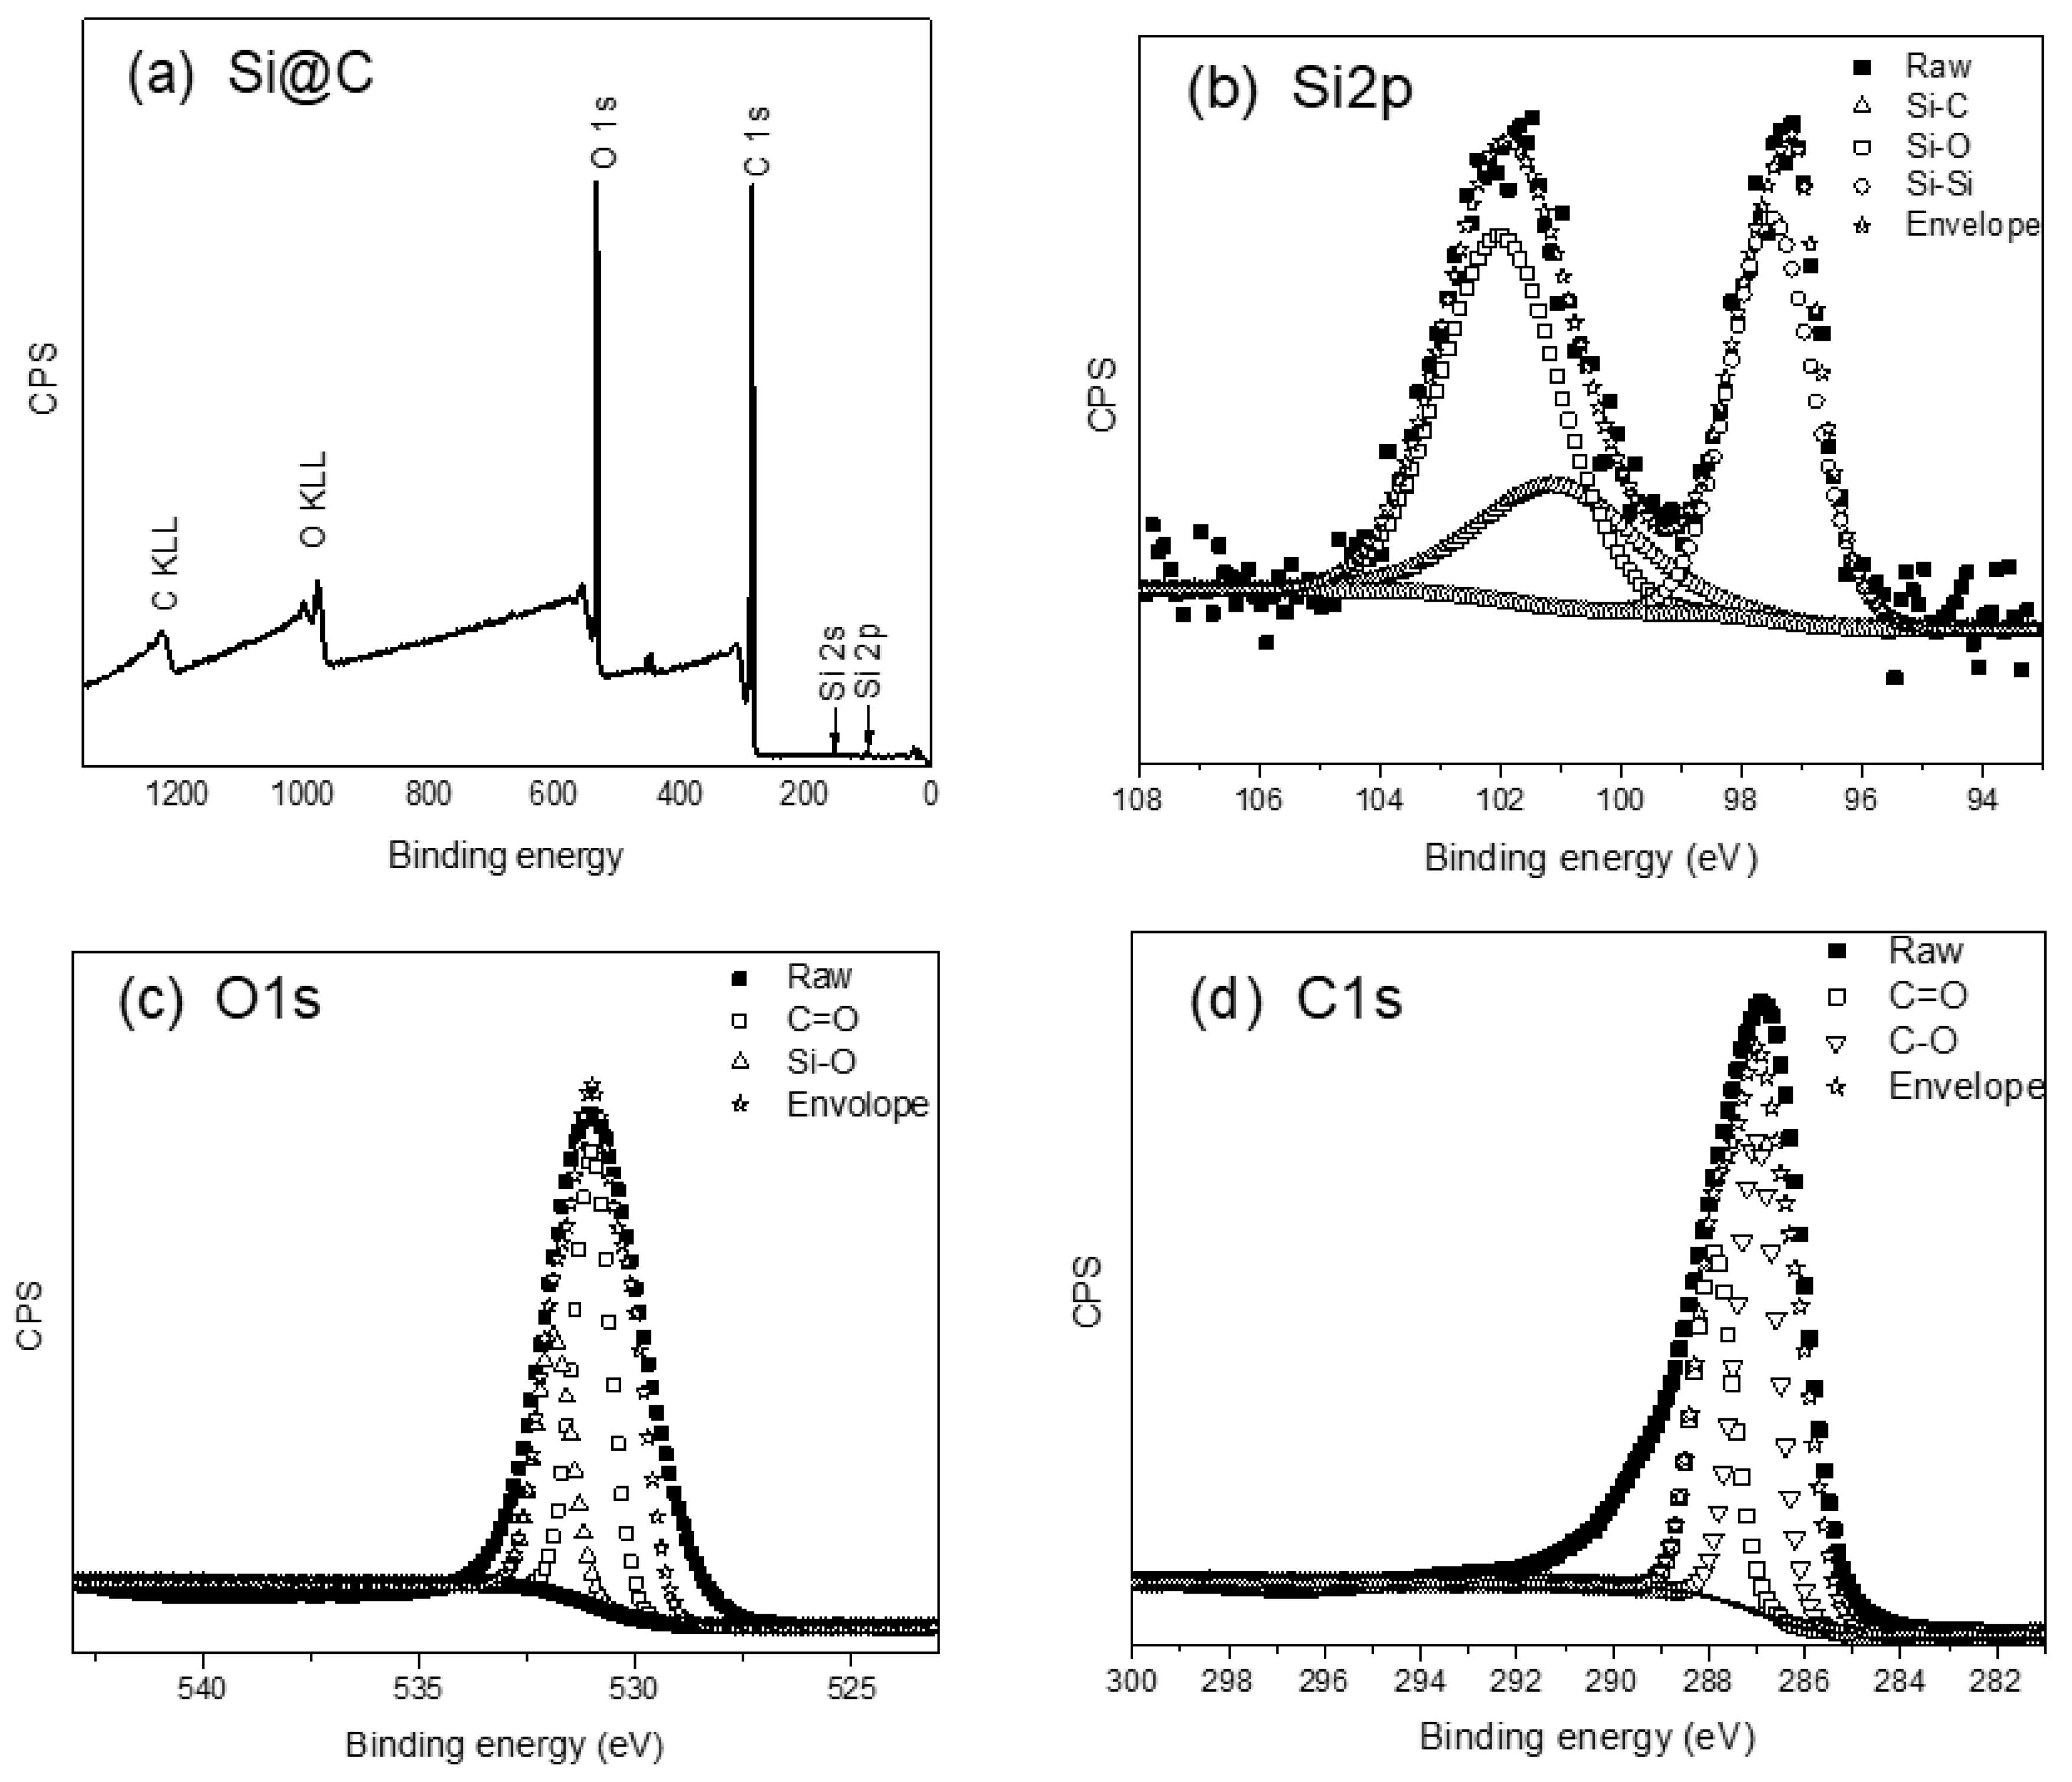
Figure 4.
XPS spectrum obtained from Si@TiO2 (a) XPS survey spectrum with 1 eV step (b) High resolution spectrum showing Si2p region with 0.1 eV step (c) High resolution spectrum showing Ti2p3/2 and Ti2p1/2 region with 0.1 eV step.
Figure 4.
XPS spectrum obtained from Si@TiO2 (a) XPS survey spectrum with 1 eV step (b) High resolution spectrum showing Si2p region with 0.1 eV step (c) High resolution spectrum showing Ti2p3/2 and Ti2p1/2 region with 0.1 eV step.
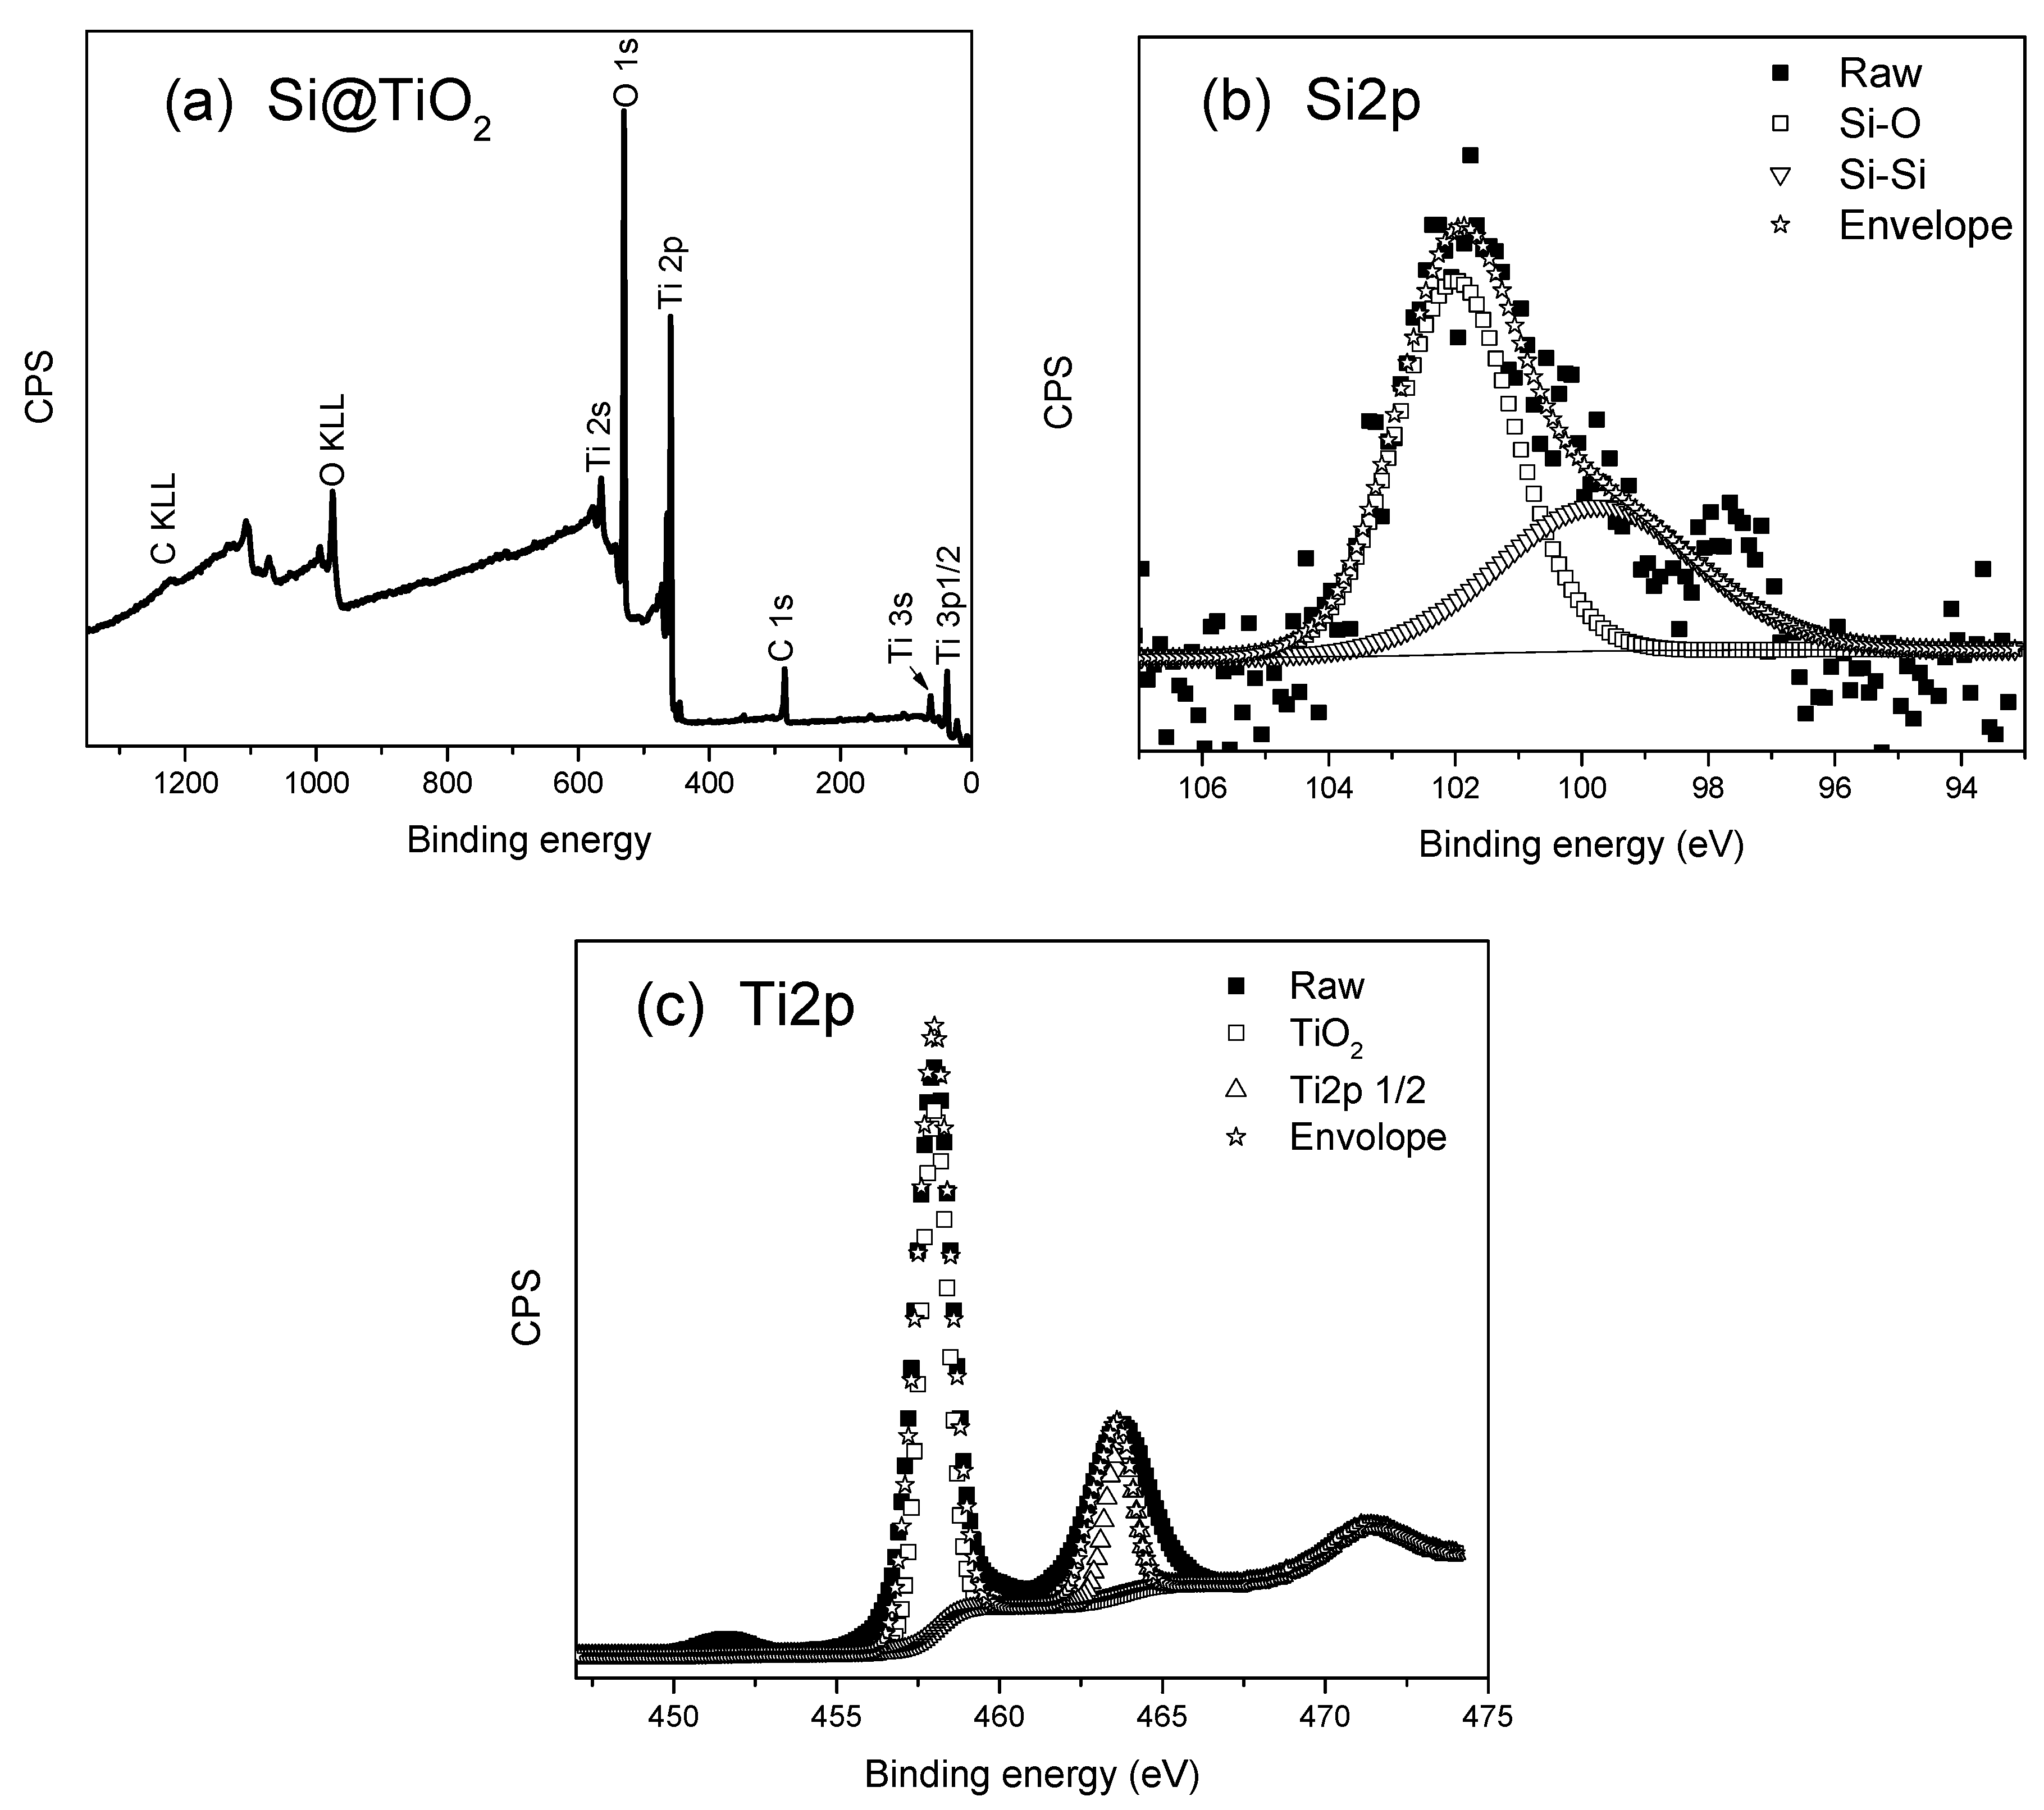
Figure 5.
XPS spectrum obtained from Si@TiO2 with less amount of titanium (a) XPS survey spectrum with less amount of titanium (a) High resolution spectrum showing Si2p region with 0.1 eV step (b) High resolution spectrum showing Ti2p3/2 region with 0.1 eV step.
Figure 5.
XPS spectrum obtained from Si@TiO2 with less amount of titanium (a) XPS survey spectrum with less amount of titanium (a) High resolution spectrum showing Si2p region with 0.1 eV step (b) High resolution spectrum showing Ti2p3/2 region with 0.1 eV step.
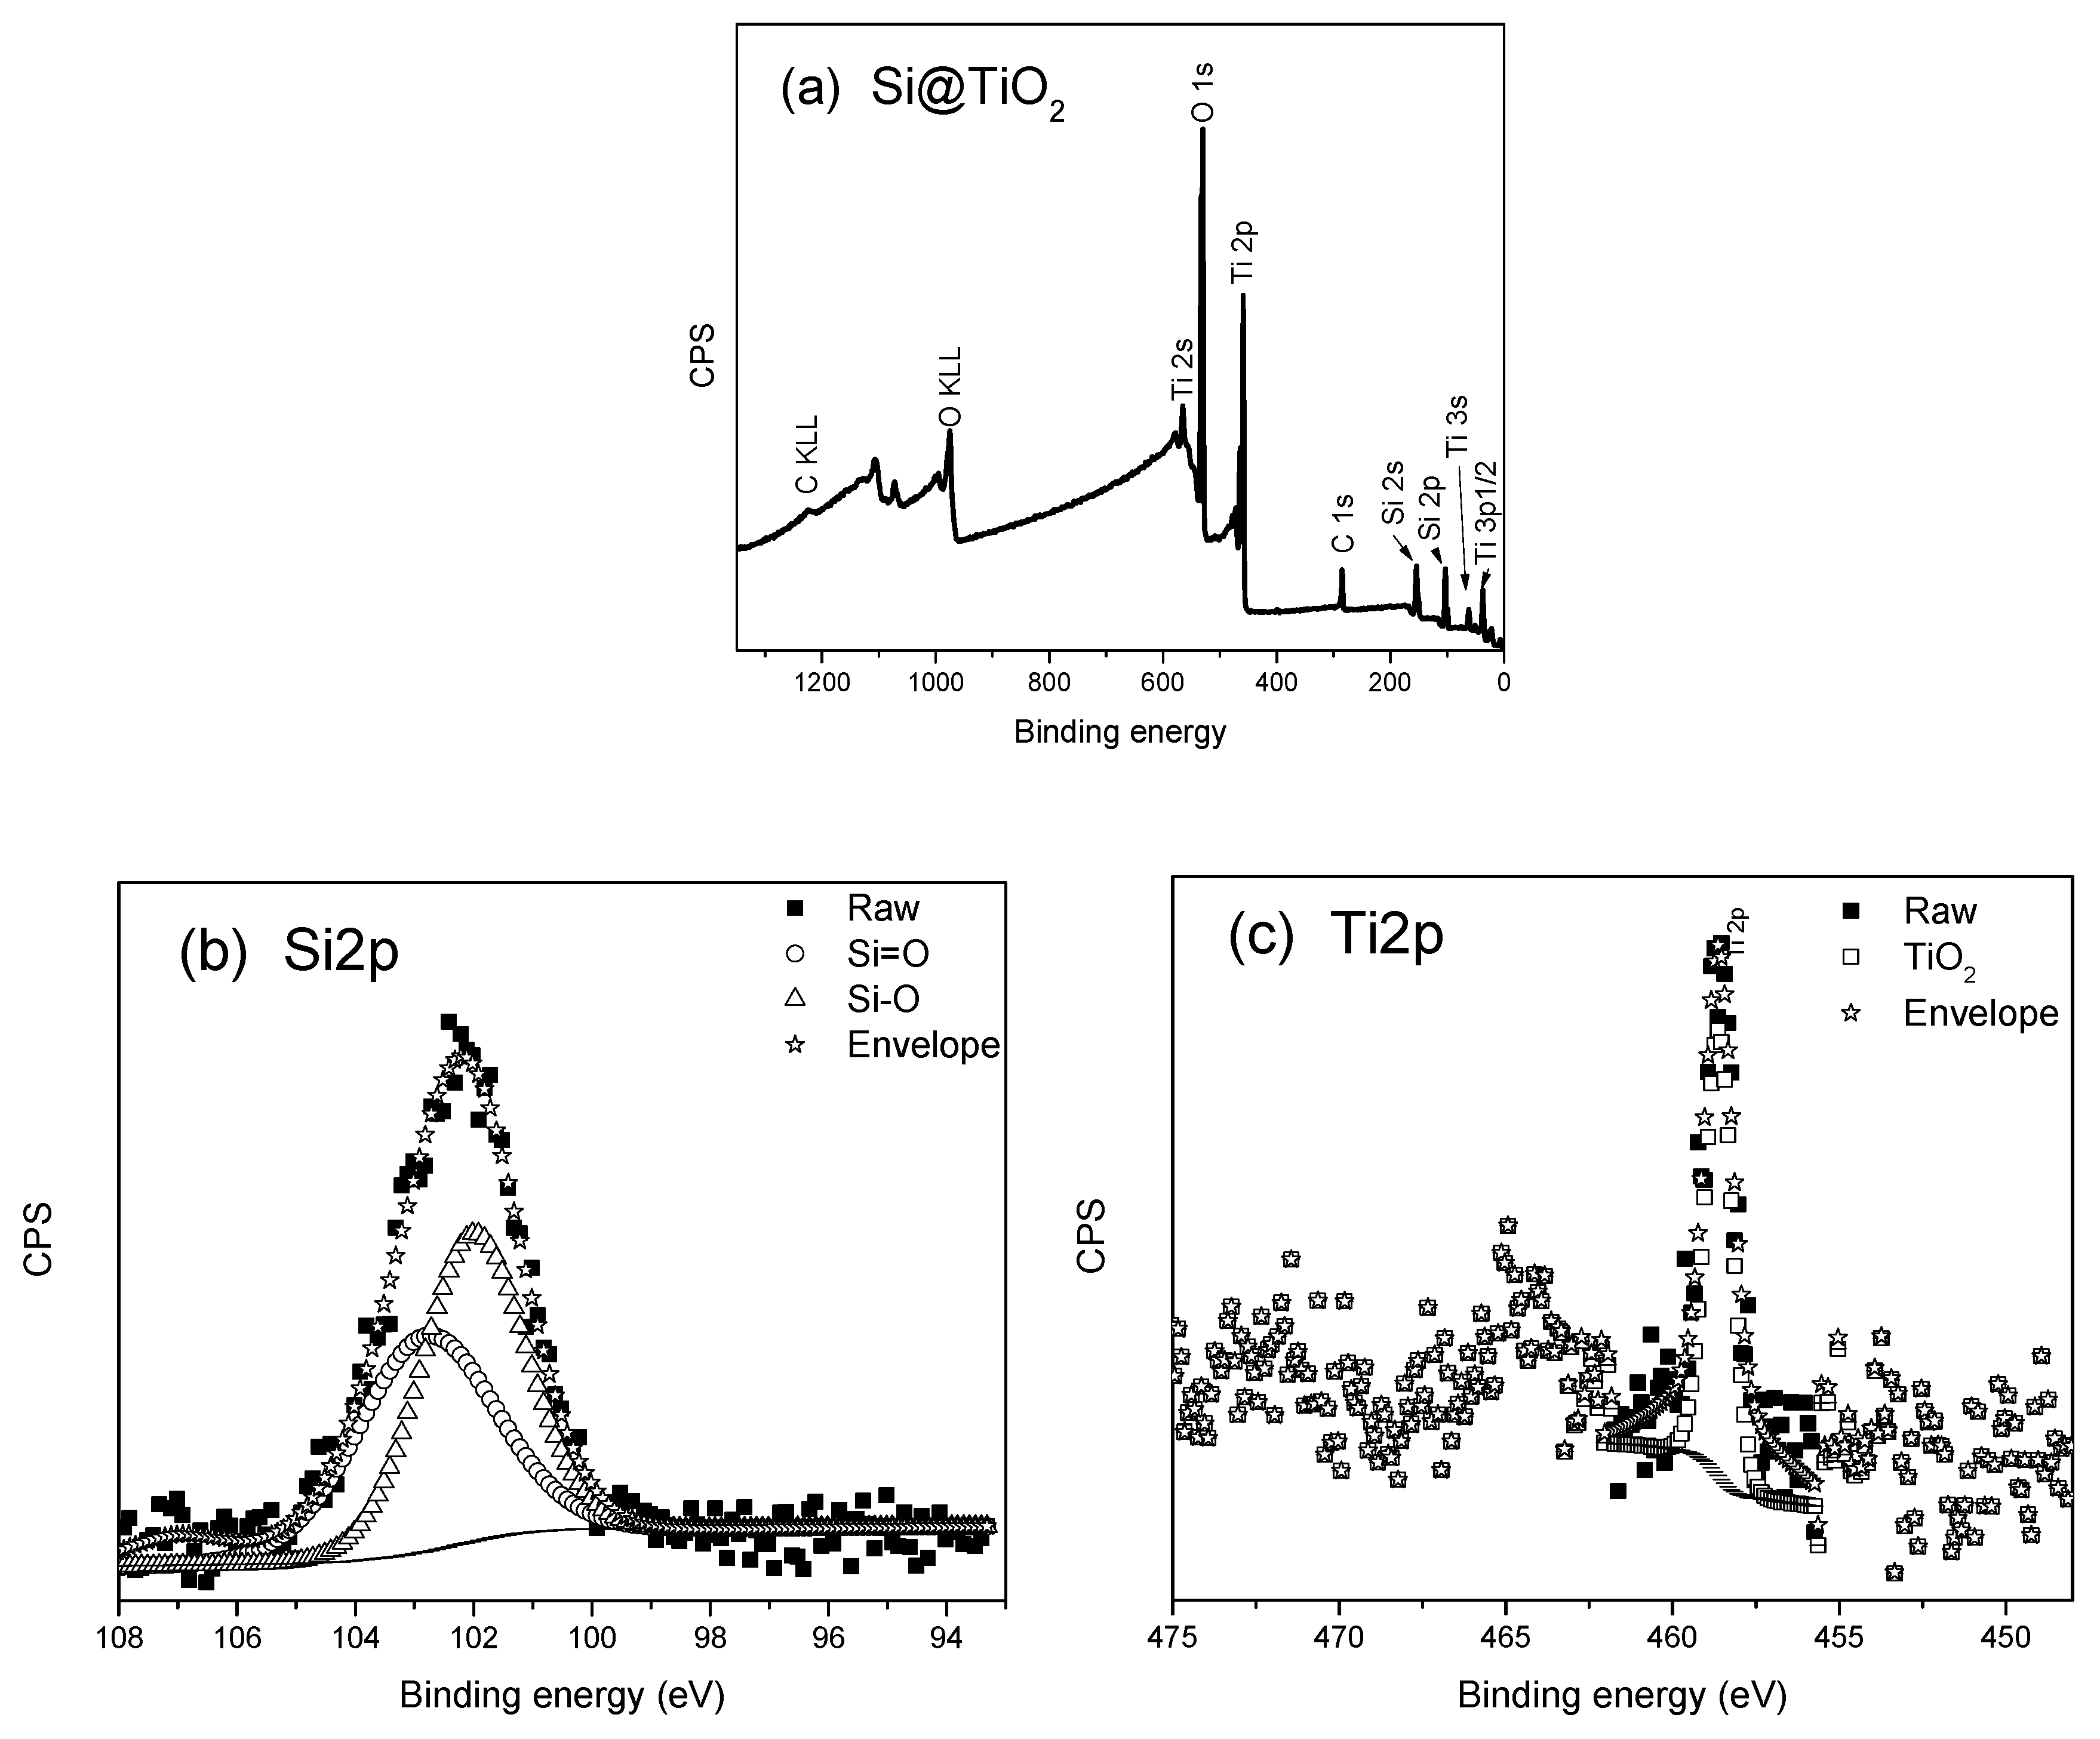
Figure 6.
XRD spectrum obtained from Si@TiO2.
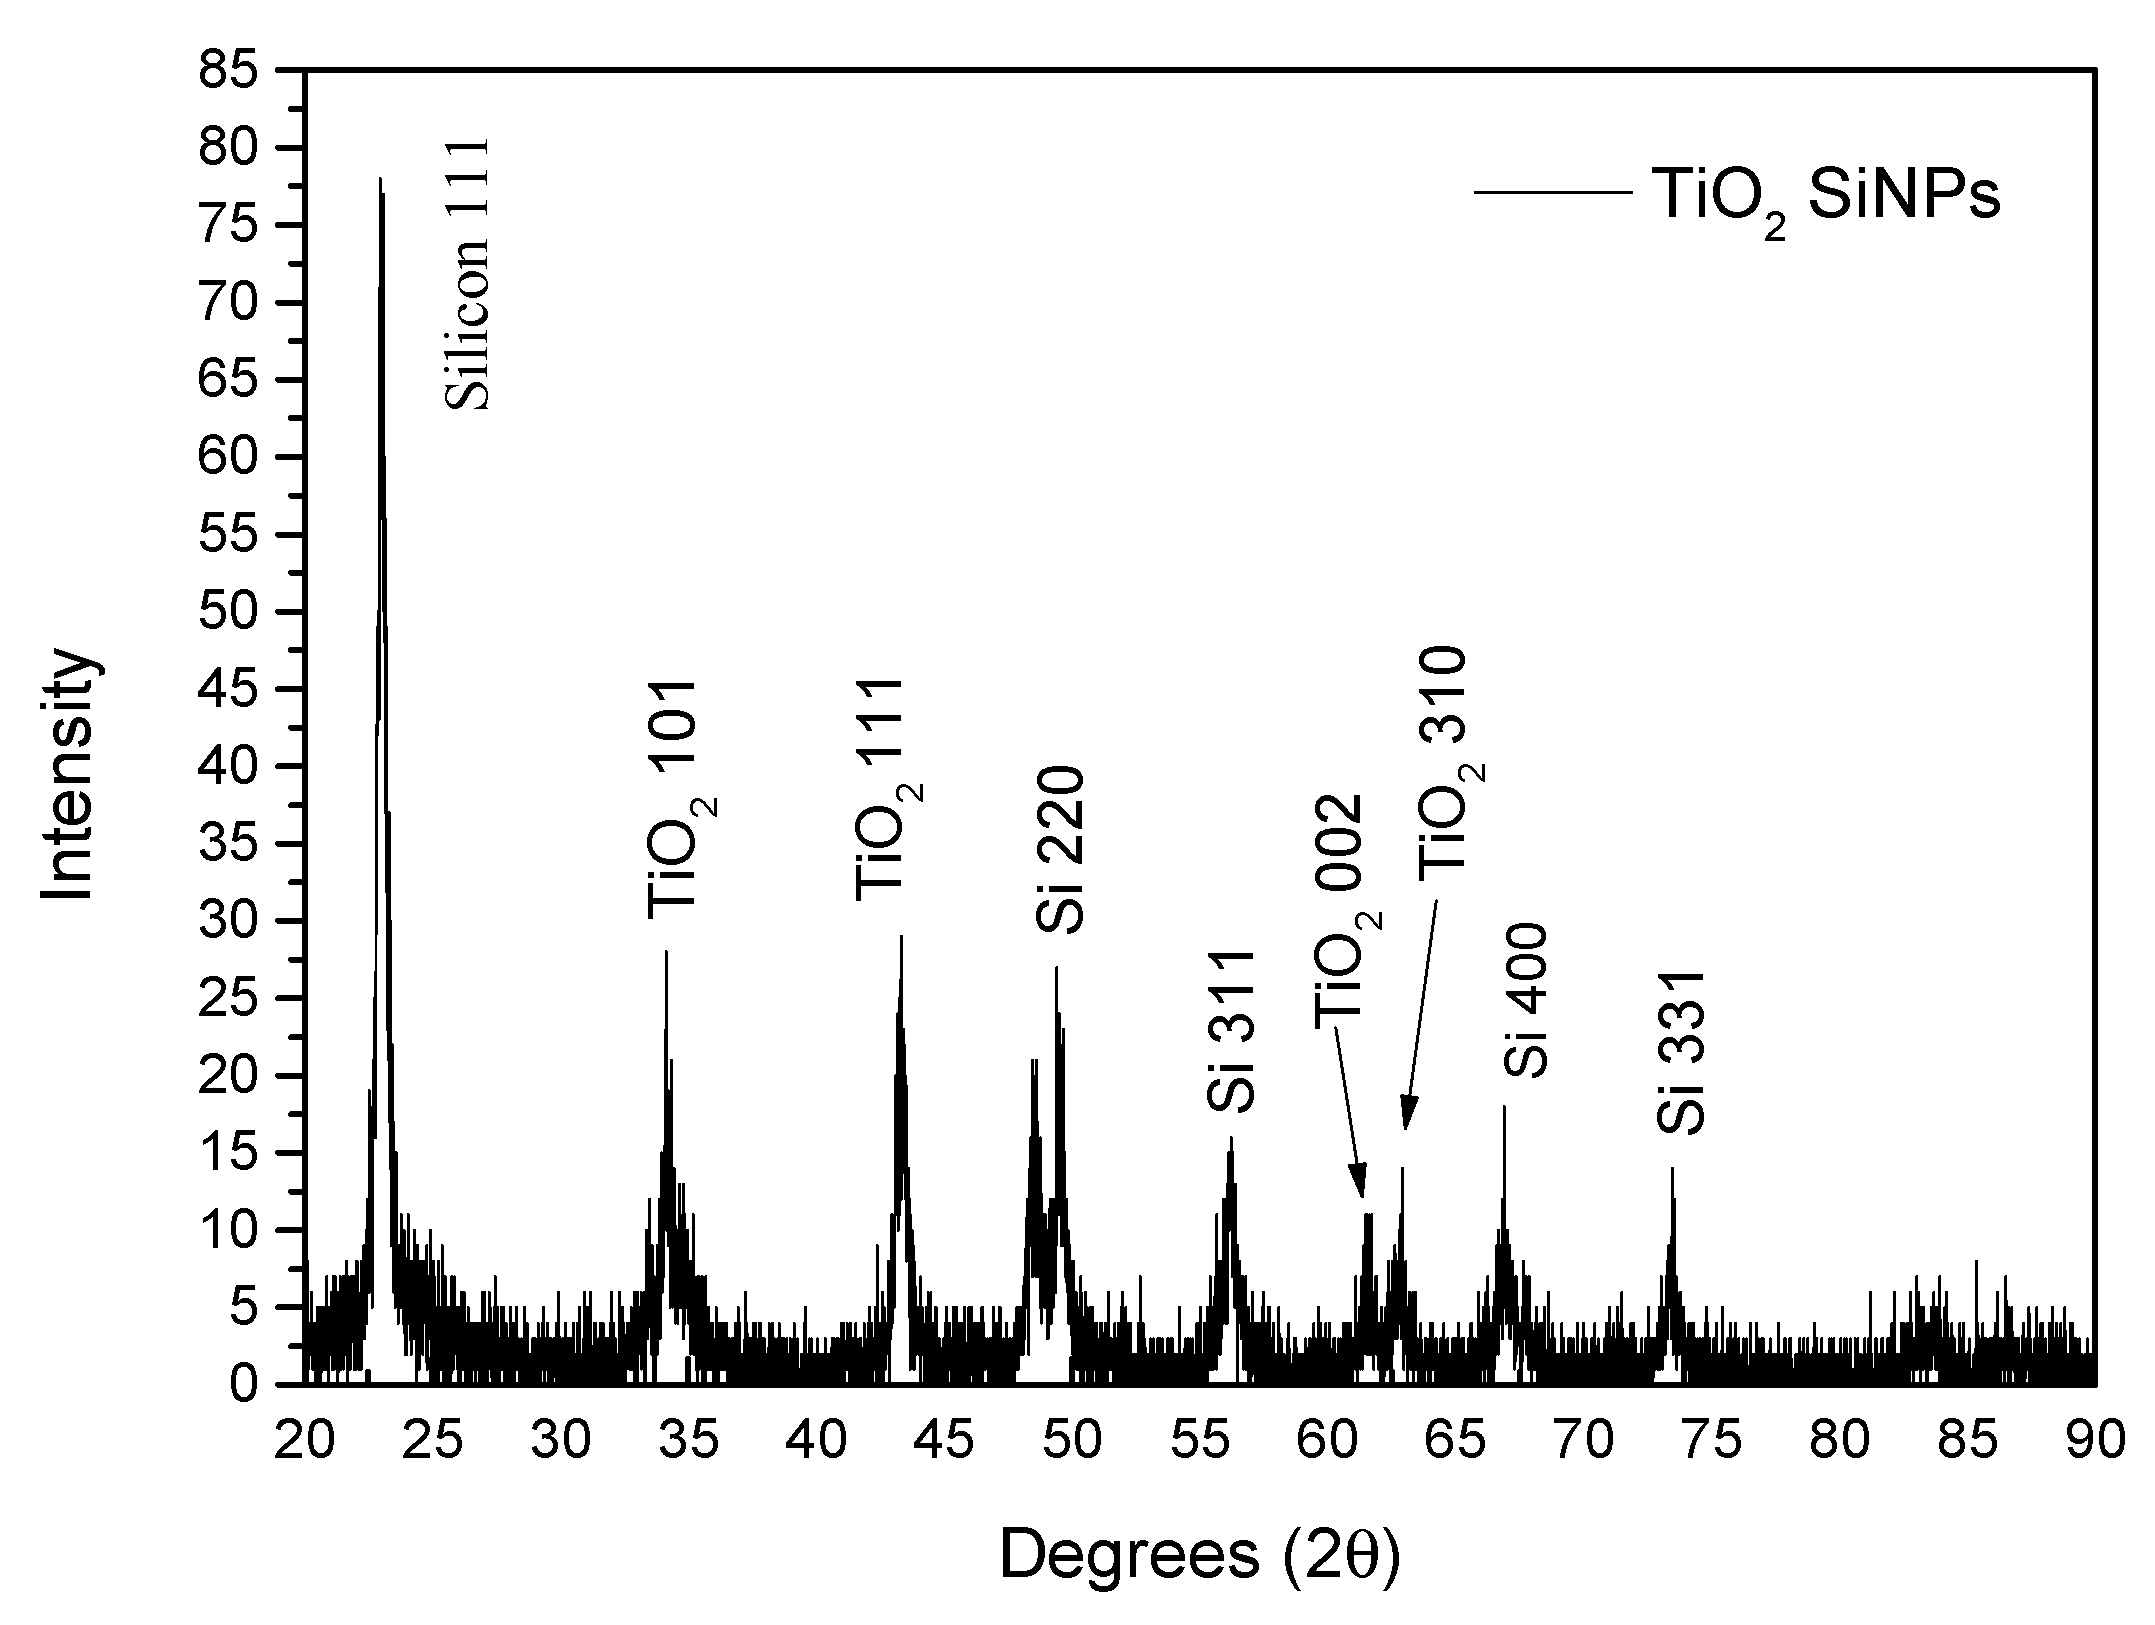
Figure 9.
Battery performance of Si@TiO2 (high amount of Ti): (a) Cycling data from Si@TiO2, and (b) CV curve of Si@TiO2.
Figure 9.
Battery performance of Si@TiO2 (high amount of Ti): (a) Cycling data from Si@TiO2, and (b) CV curve of Si@TiO2.
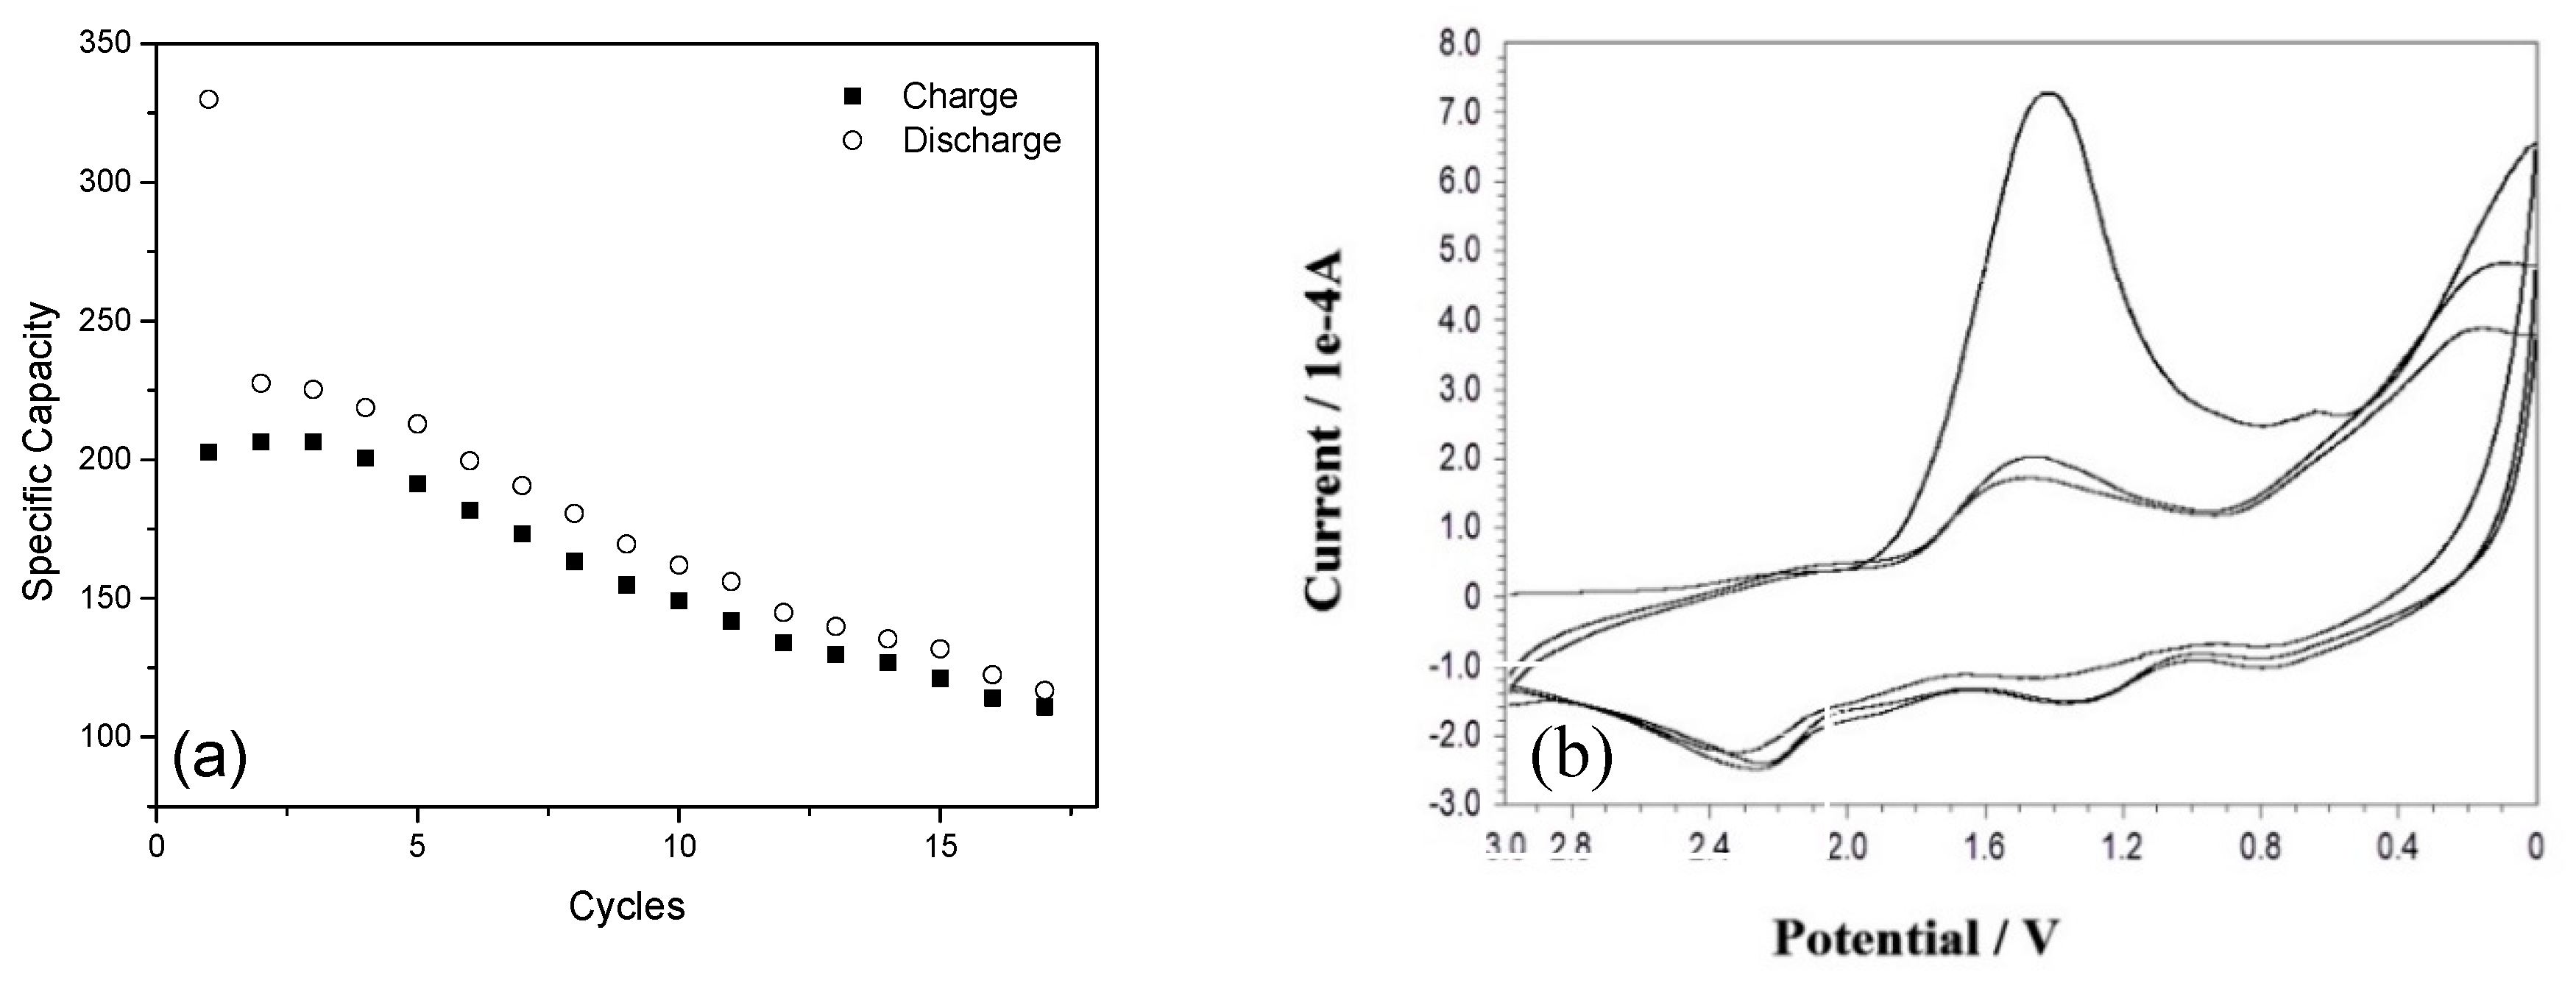
Figure 10.
Specific capacity from Si@TiO2 (low amount) and cycling data from Si@TiO2 (1, 5, 10,20, 30, 50 cycle).
Figure 10.
Specific capacity from Si@TiO2 (low amount) and cycling data from Si@TiO2 (1, 5, 10,20, 30, 50 cycle).
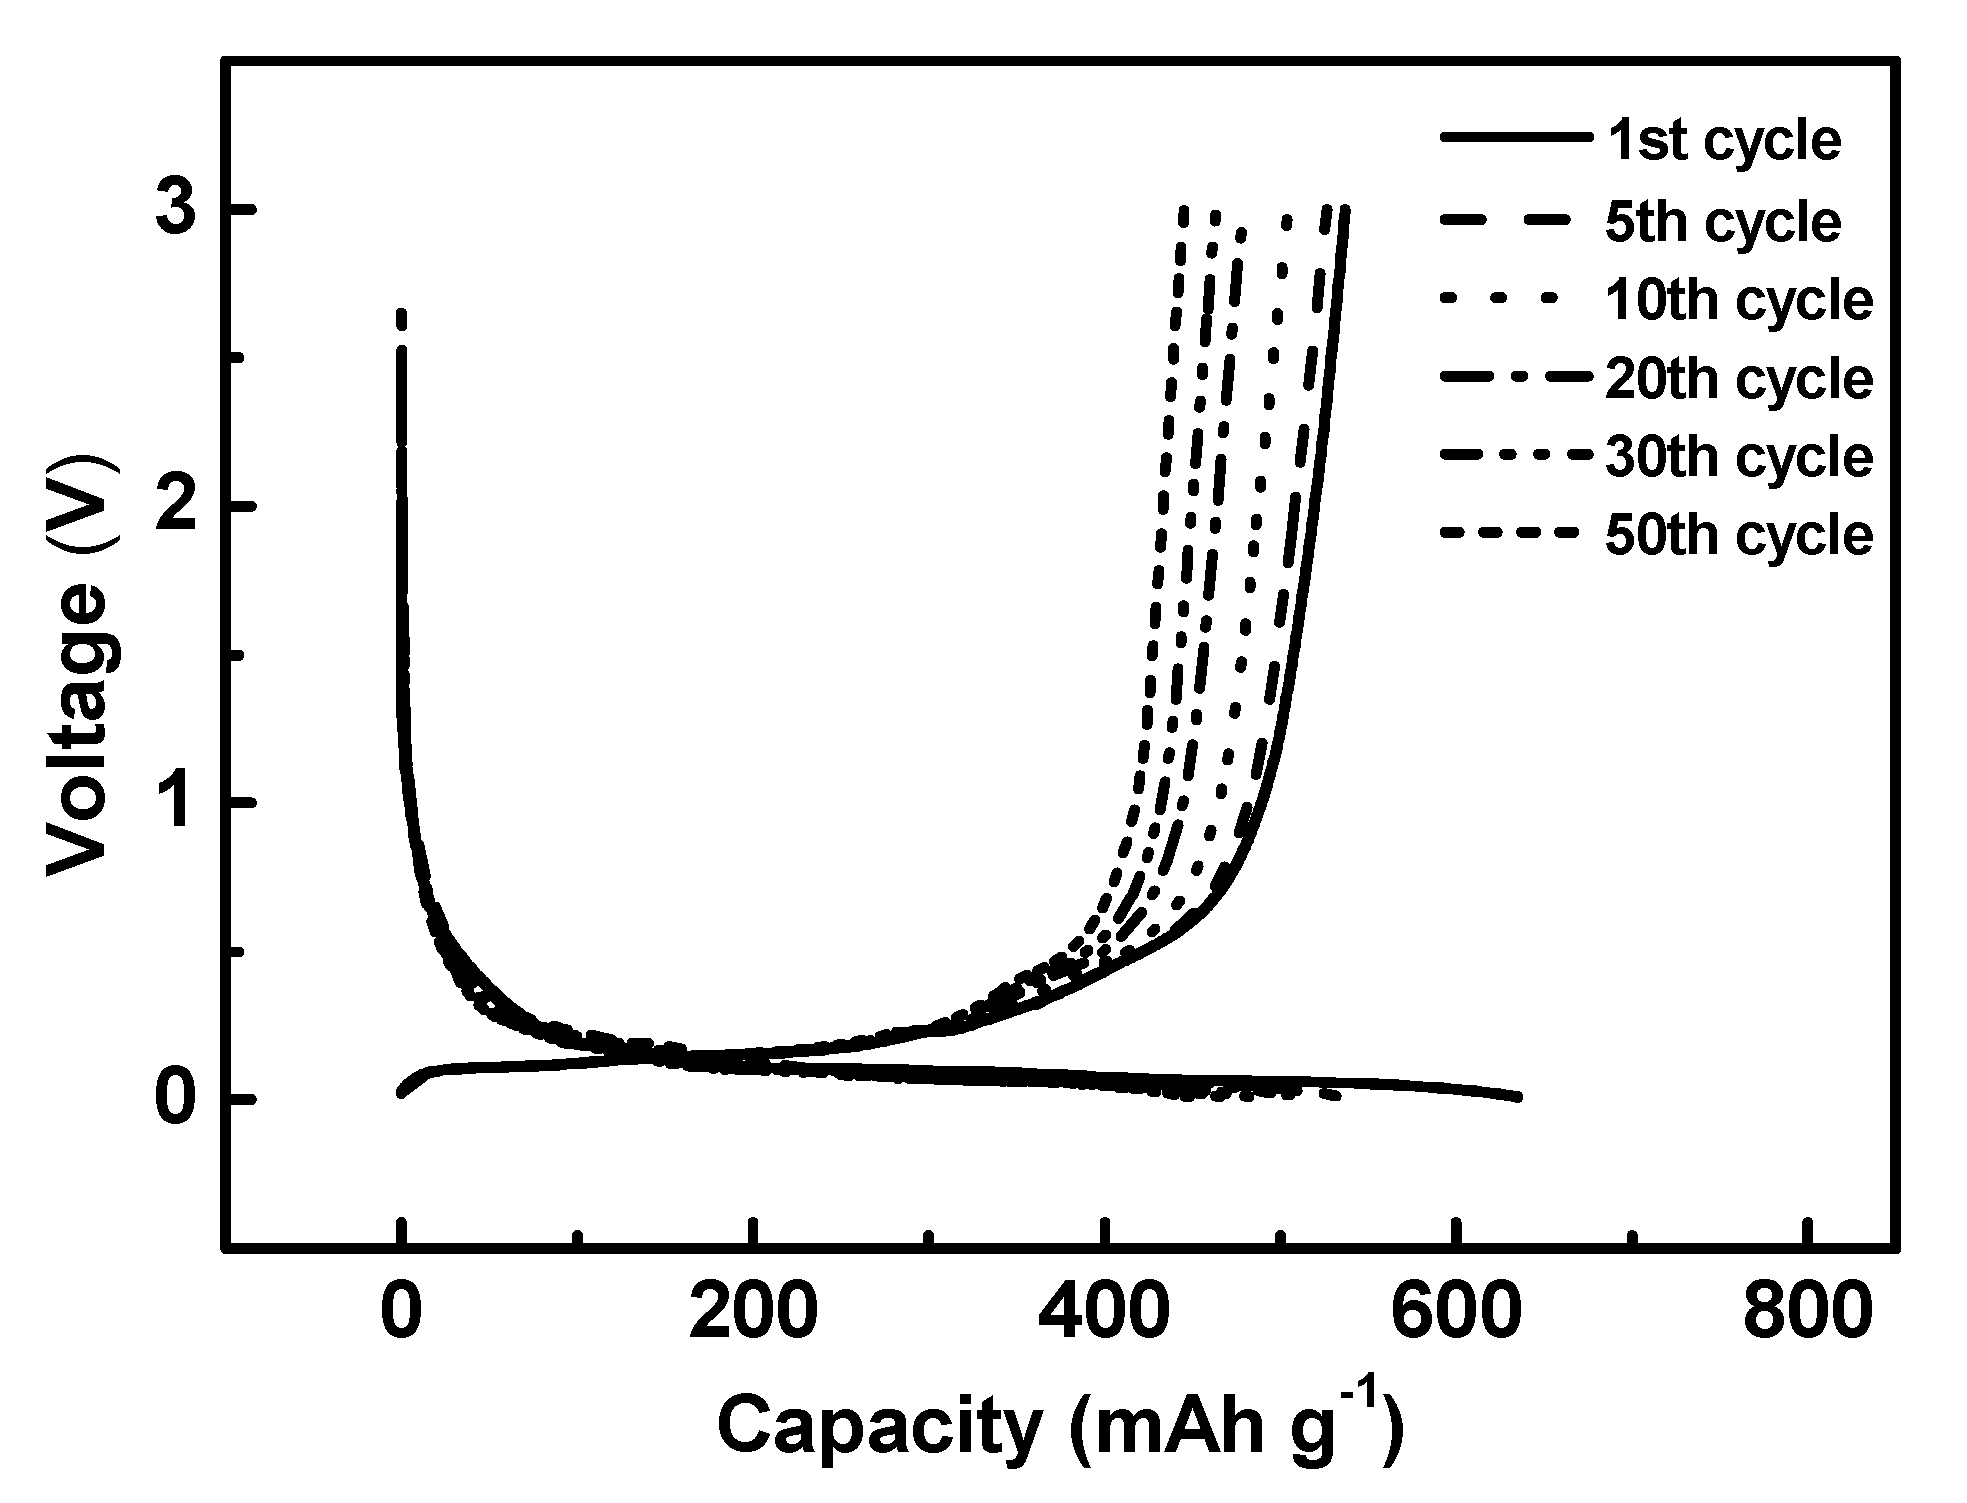
Figure 11.
Full-cell cycling data from Si@TiO2 (anode mass loaded: 1.36mg, cathode mass loaded: 4.088 mg),.
Figure 11.
Full-cell cycling data from Si@TiO2 (anode mass loaded: 1.36mg, cathode mass loaded: 4.088 mg),.
Disclaimer/Publisher’s Note: The statements, opinions and data contained in all publications are solely those of the individual author(s) and contributor(s) and not of MDPI and/or the editor(s). MDPI and/or the editor(s) disclaim responsibility for any injury to people or property resulting from any ideas, methods, instructions or products referred to in the content. |
© 2023 by the authors. Licensee MDPI, Basel, Switzerland. This article is an open access article distributed under the terms and conditions of the Creative Commons Attribution (CC BY) license (http://creativecommons.org/licenses/by/4.0/).
Copyright: This open access article is published under a Creative Commons CC BY 4.0 license, which permit the free download, distribution, and reuse, provided that the author and preprint are cited in any reuse.


