Preprint
Article

Geomorphology, Geoarchaeology and Geochronology of the Upper Pleistocene archaeological site of El Olivo Cave (Llanera, Asturias, Northern Spain).

Altmetrics

Downloads

124

Views

79

Comments

0

A peer-reviewed article of this preprint also exists.

Submitted:

25 July 2023

Posted:

27 July 2023

You are already at the latest version

Alerts
Abstract
El Olivo Cave (Pruvia de Arriba, Llanera, Asturias, Spain) is a small karst cave located in the Aboño River basin and formed in the Cretaceous limestone of the Mesozoic cover of the Cantabrian Mountains (north of the Iberian Peninsula). It contains an important upper Pleistocene sedimen-tary, archaeological and paleontological record, with abundant technological evidence and faunal remains. The archaeological record shows a first occupation that could correspond to the Middle Paleolithic and a second occupation in the Middle Magdalenian. The stratigraphic sequence inside and outside the cave was studied with geoarchaeological methodology. In this paper, the lithostratigraphic sequence is analyzed and the data from the granulometric, mineralogical, edaphological and radiometric analyses are presented. The results of these analyses enable an accurate interpretation of both the lithostratigraphy of the deposit as well as the processes re-sponsible for its formation and subsequent evolution. The available numerical dates allow us to locate the first sedimentation episode in the cave in OIS 7a, in the Middle Pleistocene, the base of the outer fluvial sedimentation in the cold OIS 3a stage of the Upper Pleistocene and the Magdalenian occupation in the Last Glacial Maximum (OIS 2) at the end of the Late Pleistocene.
Keywords: 
Subject: Environmental and Earth Sciences  -   Geophysics and Geology

1. Introduction

El Olivo Cave is situated in the Cantabrian Region, northern Iberian Peninsula (Figure 1A), at UTM coordinates (Zone 30 N; ETRS89) X. 275,133 Y. 4,815,338, and an altitude of 145m a.s.l. The cave, which is 10 m long, has an entrance 2x3m in diameter. It formed in Mesozoic limestone. The cave is close to the Cabornio Stream belonging to the Aboño River basin (123 km2 in size), which flows towards the N (Figure 1).
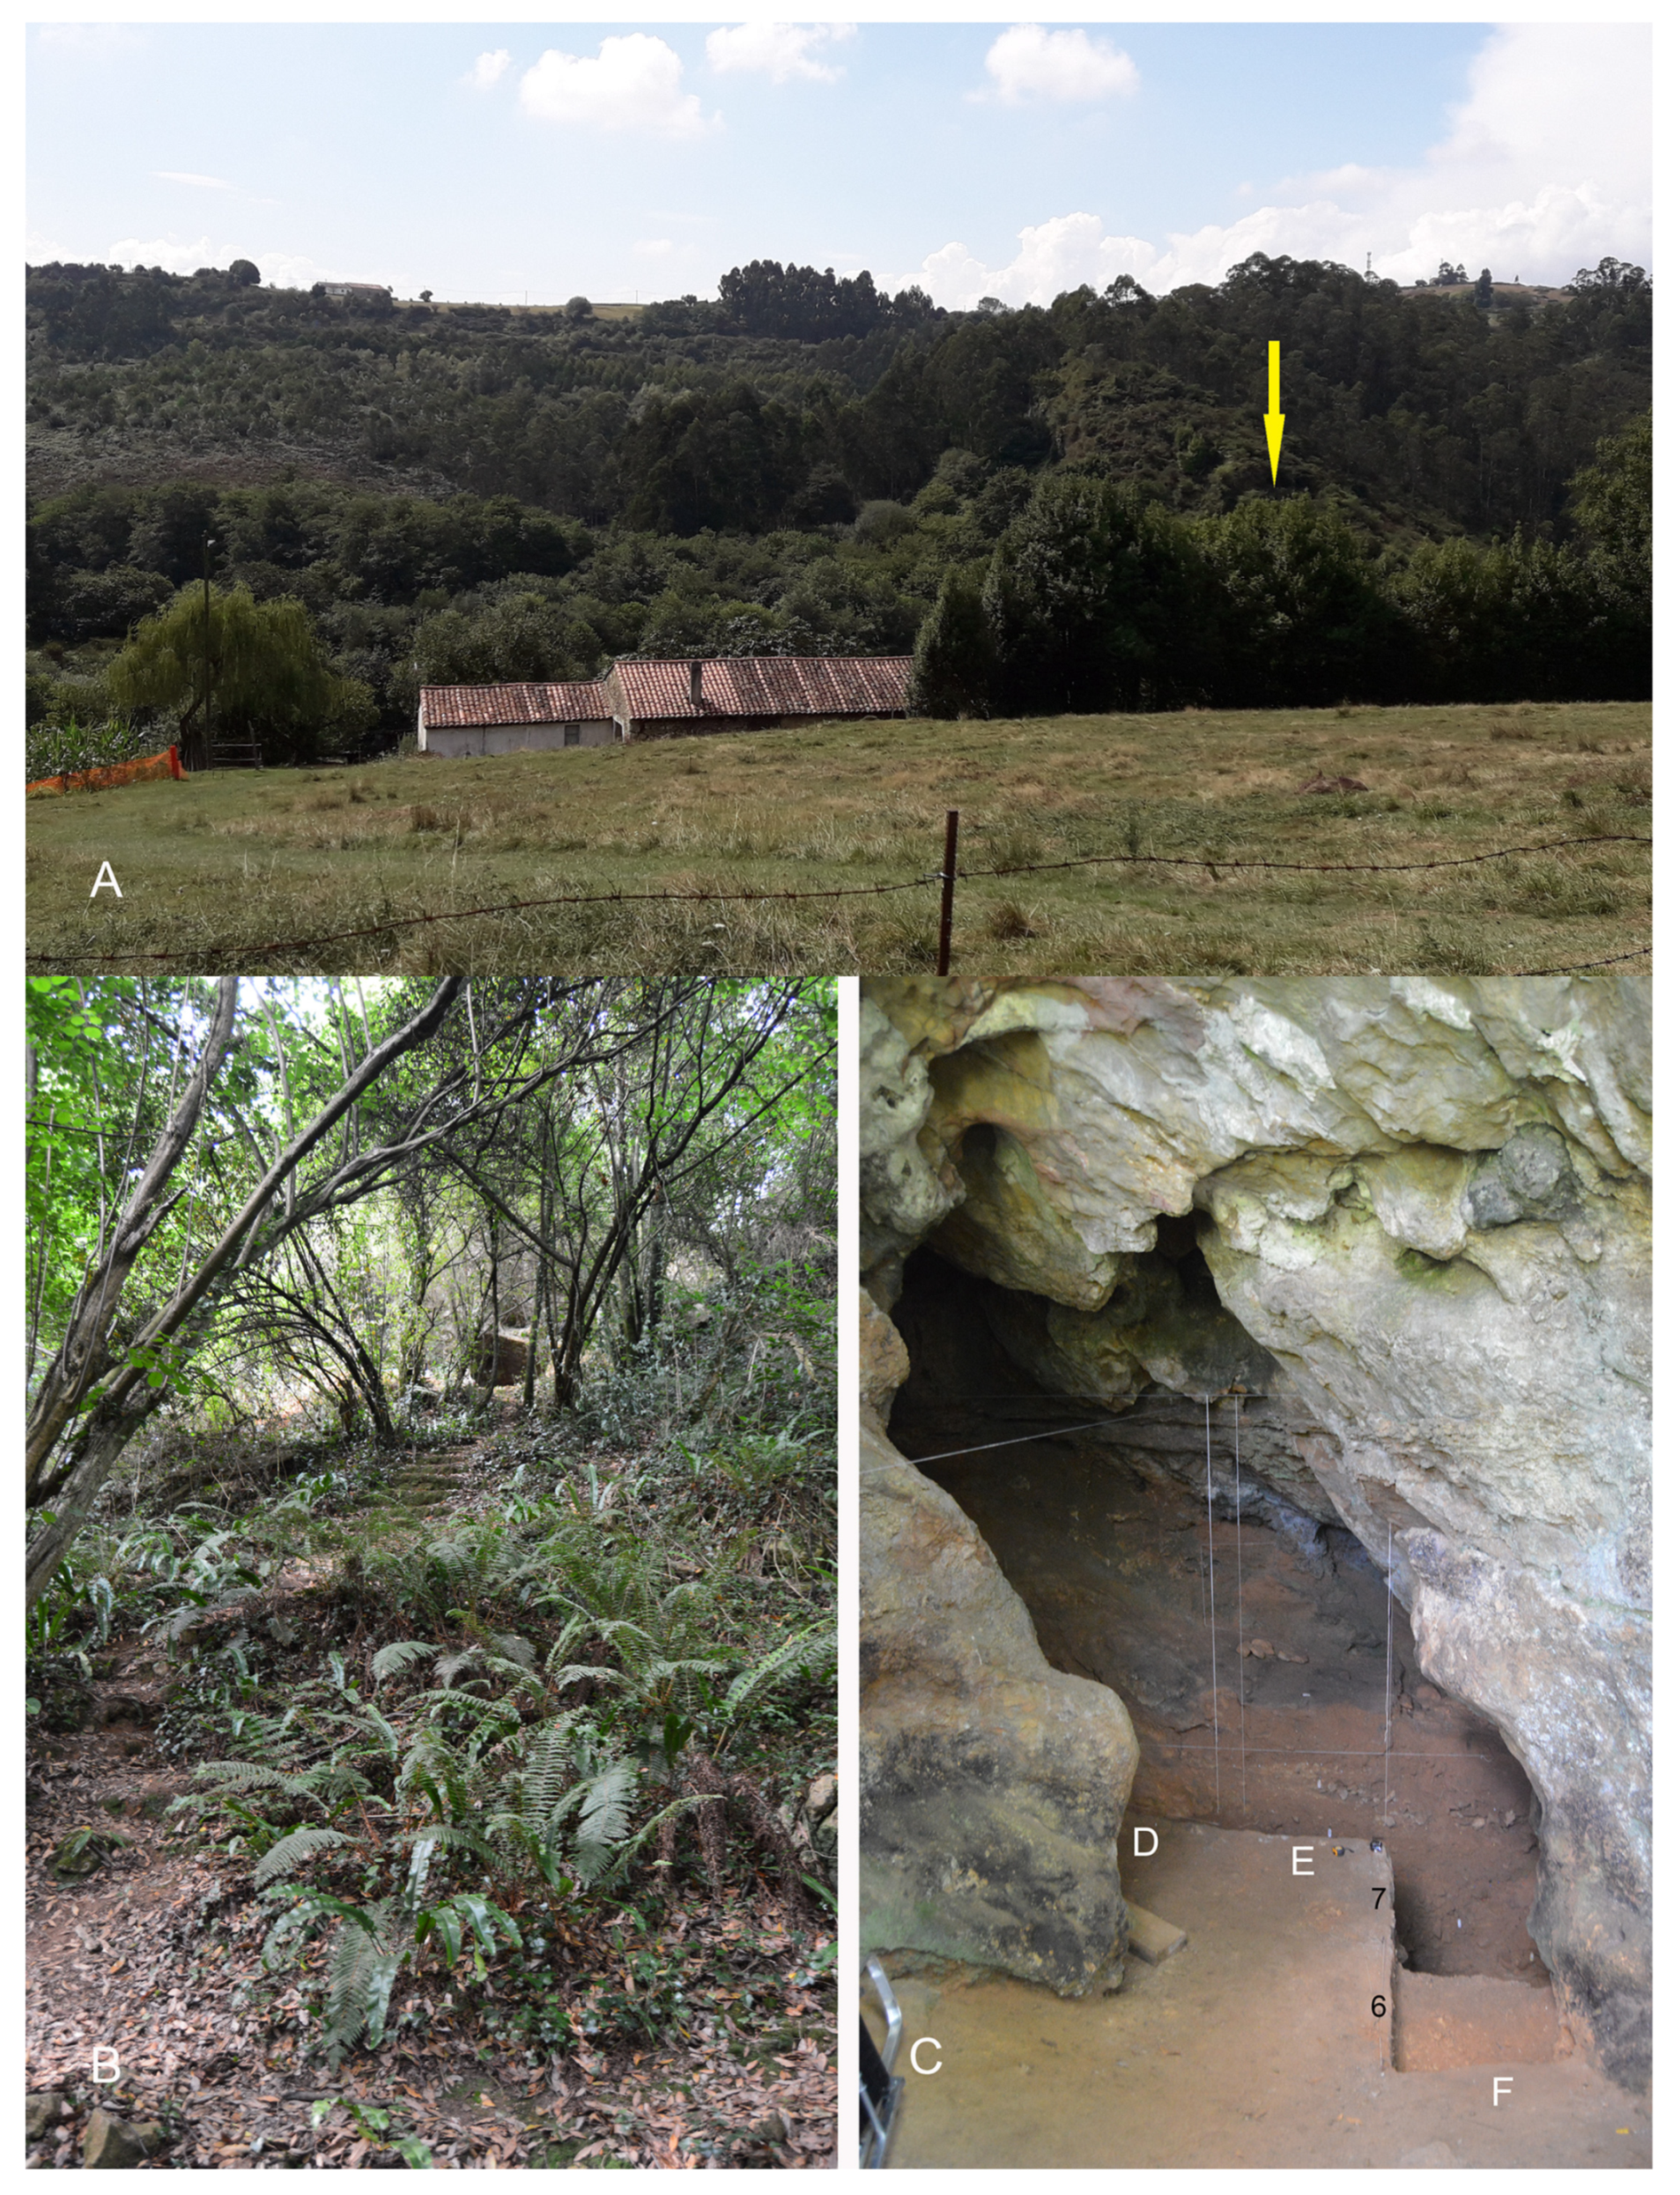
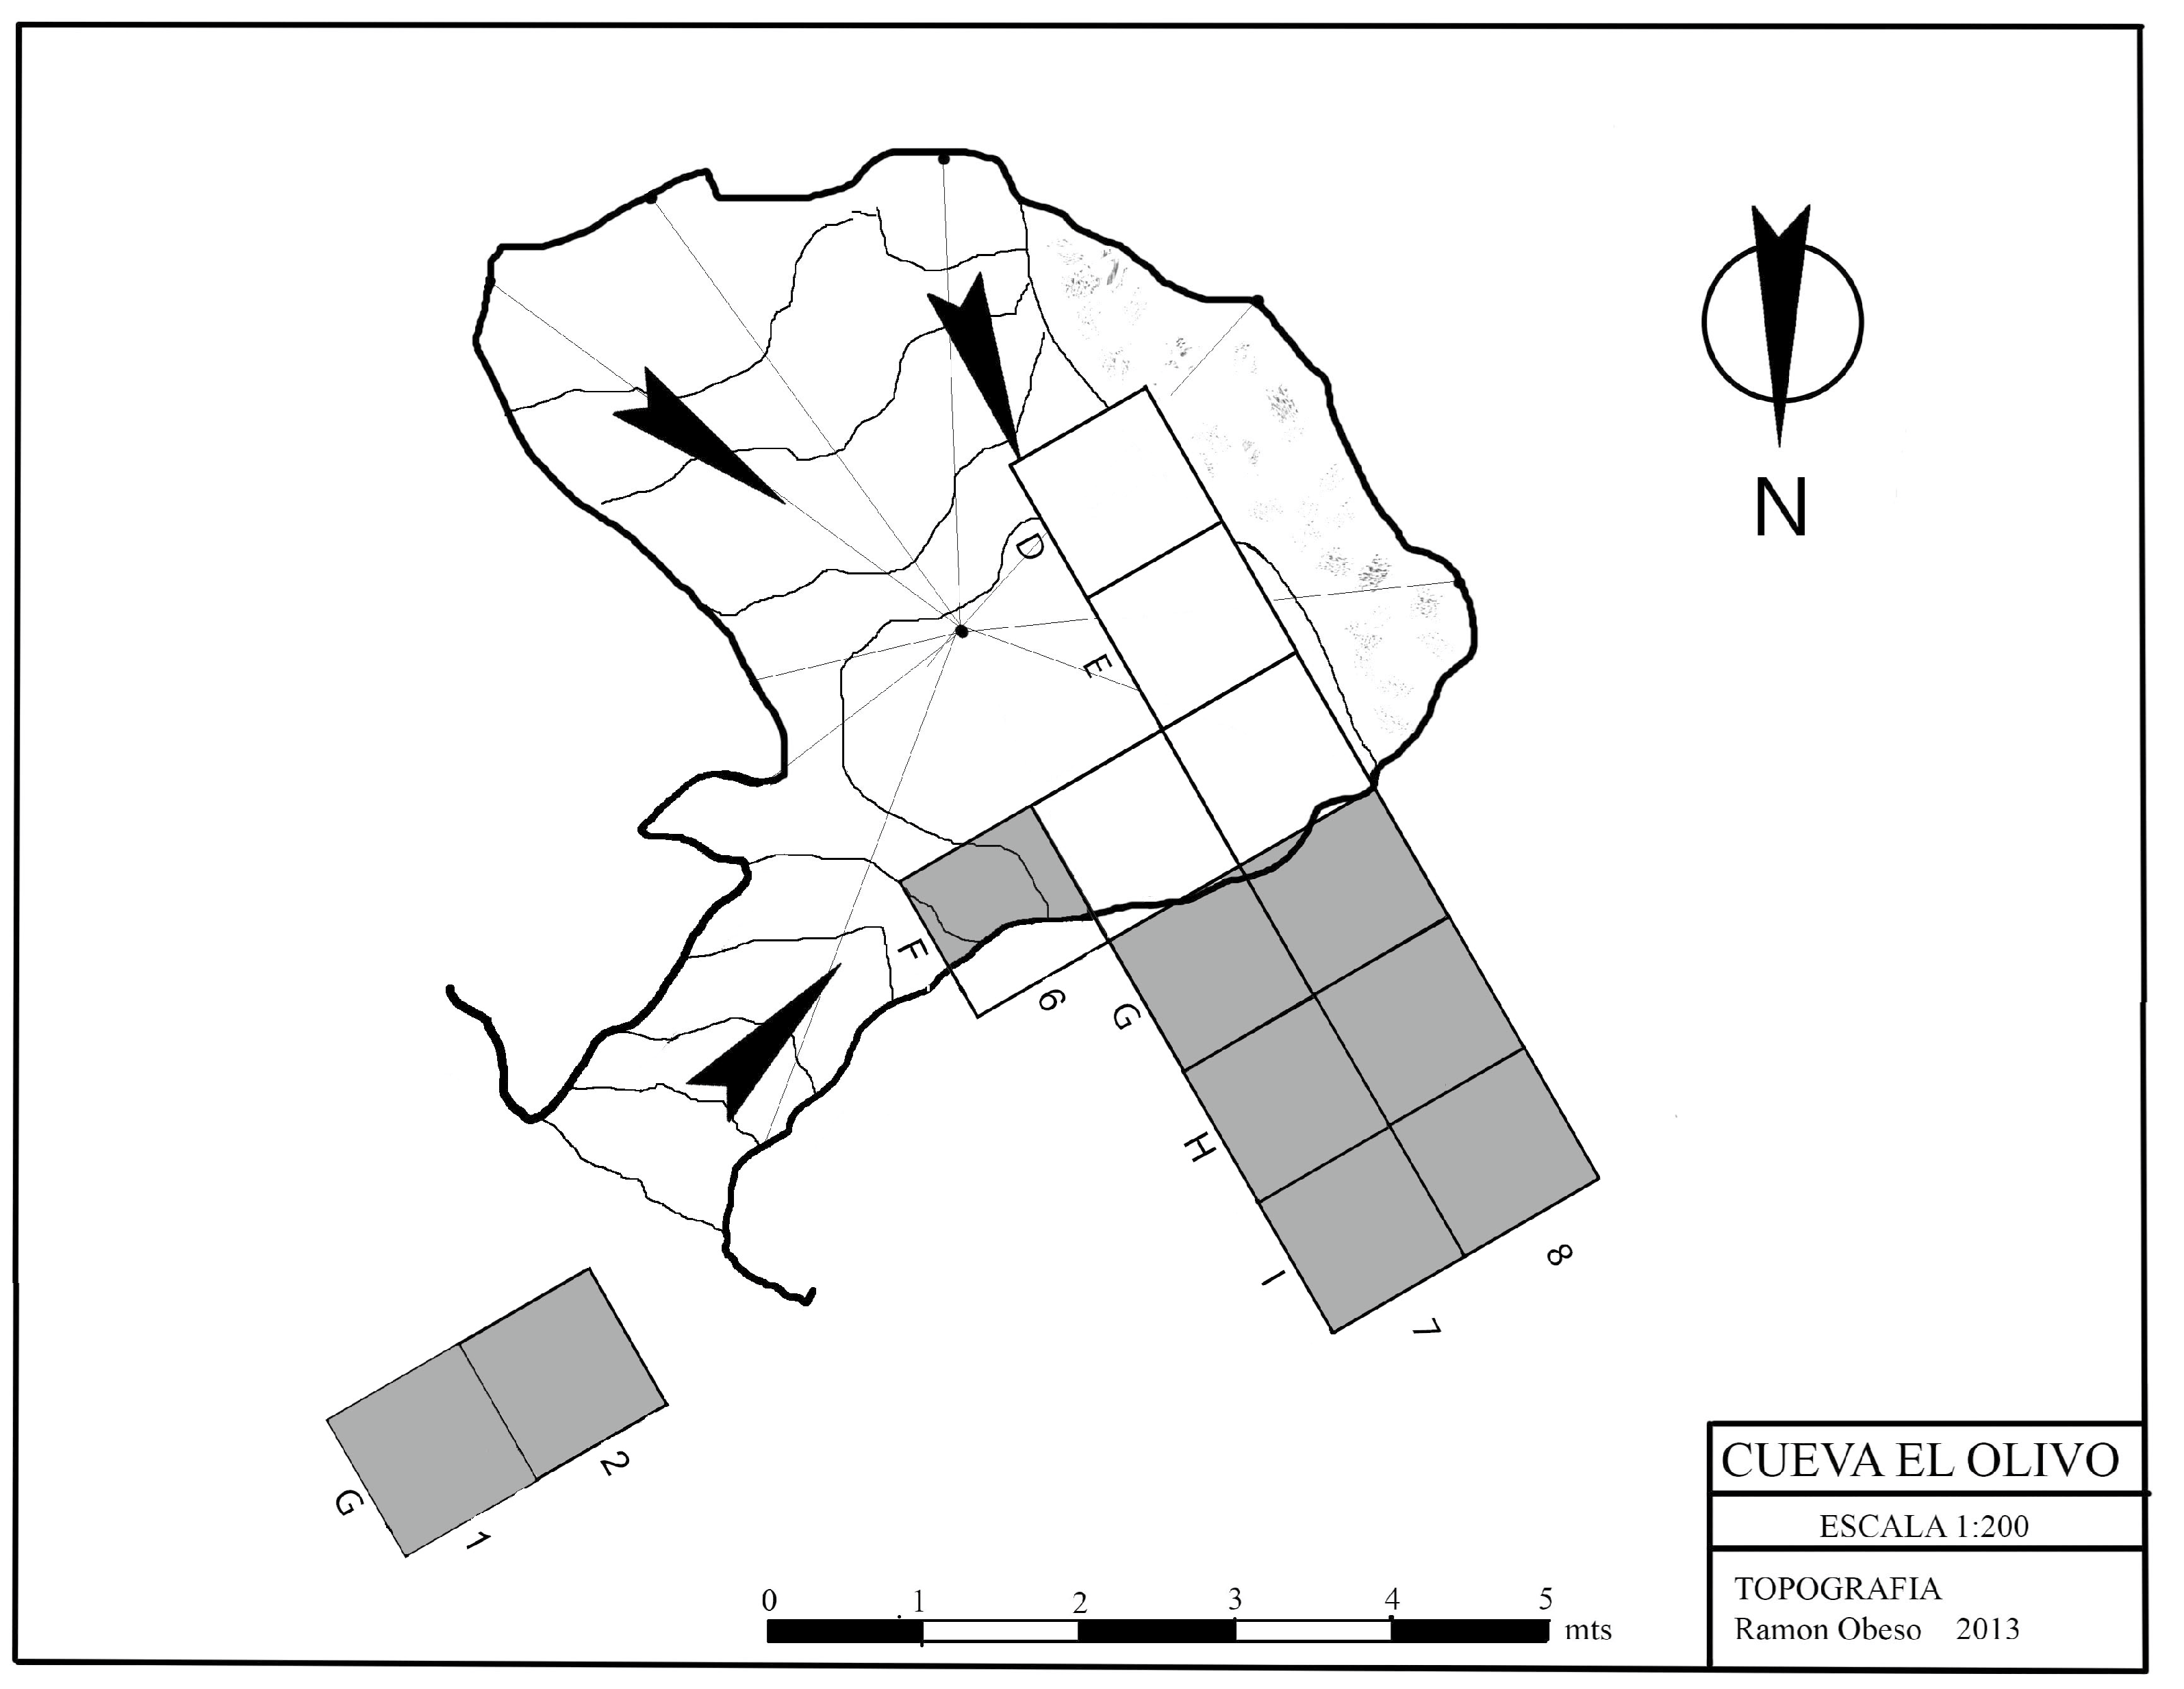
Local inhabitants used the cave, known since ancient times, as a refuge during the Spanish Civil War (1936-39). Even though in 1985 a speleological group explored and inventoried El Olivo Cave, an archaeological exploration of the cave was never carried out. In July 2012, due to the excavation of the open-air Mousterian site of El Barandiallu, located about 3 km to the west of the cave [1], a survey was carried out in El Olivo. In this first year, a test pit was excavated to verify the existence of a Paleolithic deposit. Between 2013 and 2017, systematic archaeological fieldwork was conducted in the cave (Figure 2 and Figure 3) [1,2,3,4,5].
In this paper, we present the results of the geoarchaeological investigations carried out in El Olivo Cave, which reveal complex fluviokarstic evolution of its sedimentary fill, at the same time that they show important action of external geomorphological agents during the Last Glacial Maximum (LGM) and the Late Glacial period in this sector of the northern coastal strip of the Iberian Peninsula, as also occurs in other deposits with similar chronology, such as Bañugues (Gozón, Asturias) [6,7] and El Barandiallu (Llanera, Asturias) [1,8,9].
The objective of this work is threefold: (i) to develop the evolutionary geoarchaeological model of El Olivo cave karst and its surroundings; (ii) to characterize the archaeological site geoarchaeologically, and (iii) to establish the chronostratigraphy of its deposits. The geoarchaeological study addresses the following aspects:
  • Study of the sedimentary sequence of the archaeological site.
  • Interpretation of the formation and transformation processes that gave rise to the current configuration of its archaeological record.
  • Differentiation, to the extent possible, of natural processes (N transforms) and/or cultural processes of anthropic origin (C transforms) [11].
  • Identification of sedimentary processes.
  • Identification of diagenetic and postdepositional processes [12].
  • Establishment of the geoarchaeological evolution of the site.

2. Materials and Methods

The applied work methodology combines geological, geomorphological, geoarchaeological and geochronological techniques to establish the geomorphological evolution of El Olivo Cave and its surroundings, as well as the archaeosedimentary fill at the site.

2.1. Geomorphology

To understand the origin and development of El Olivo Cave and the local landscape evolution during the Pleistocene, the geomorphology of the cave and its surroundings were mapped using a combination of photointerpretation, GIS tools, and fieldwork in ArcGIS 10.2. Specifically, the cave plan was created following the method outlined by Ballesteros et alii [13], which involves collecting survey data using the DistoX2 laser range-finder [14] and processing it in Compass software [15].

2.3. Lithostratigraphic study

The geoarchaeological study of the site was carried out through the detailed analysis and lithostratigraphic description of the archaeosedimentary sequences obtained in the archaeological excavations located both inside and outside the cave. These sequences were also appropriately sampled for sedimentological and edaphological analyses, whose results are detailed below.

2.4. Sedimentological analyses

Sedimentological analyses carried out involved the textural classification of the sediments using:
  • Laser granulometry for the fraction finer than 2 mm,
  • Phi granulometry for the total sediment including the coarse section, and
  • Mineralogical identification by means of X-ray diffraction (XRD) of the fraction finer than 0.63 mm.
These analyses were carried out at the Assistance Center for Research in Geological Techniques at the Complutense University of Madrid.
The granulometric analysis was carried out following this protocol:
  • Suspension of a known quantity of each of the samples.
  • Sample disintegration.
  • Sieving at 700 μm, the upper limit of technical measurement capacity in laser granulometric equipment.
  • Phi scale granulometry of the fractions greater than 700 μm with the 4, 2 and 1 mm mesh size sieves.
  • Laser granulometry for fractions finer than 700 μm.
The laser granulometric analysis was carried out with Honeywell Microtrac X100 equipment, with the capacity to measure fractions from 700 to 0.10 μm. The statistical treatment of the granulometry data was performed with the GRADISTAT software version 8.0 [16,17], which allows the sediment in the detrital samples to be grouped statistically into different textural groups depending on the greater or lesser presence of gravel, sand and mud (silt and clay). To do this, we have applied the granulometric classification adopted by the program that comes from the modification of the Udden (1914) [18] and Wentworth (1922) [19] scales: pebbles (clasts with diameters greater than 64 mm), gravel (clasts with diameters between 64 mm and 2 mm), sand (grains between 2 mm and 62 microns), silt (grains between 62 and 2 microns) and clay (particles smaller than 2 microns).
A Brucker D8 ADVANCE model diffractometer was used to obtain X-ray diffraction data. Disoriented dust diffraction diagrams to characterize the mineralogy of the total sample were obtained in an angular interval of 2 to 65°, a step size of 0.02° and a step time of 1 s. The semiquantitative analysis was followed Chung’s (1975) [20] method, using Brucker’s EVA software.

2.5. Soil analyses

Soil analyses carried out in the Laboratory of Edaphology in the Department of Geology and Geochemistry at the Autonomous University of Madrid consisted of determining color, pH, total carbonates –CaCO3-, organic matter –OM-, organic charcoal –OC-, electrical conductivity, salts, cation concentration and osmotic pressure.
For the precise determination of the color –dry- the Munsell Soil Color Charts [21] were used as a reference for an objective description and a standardized denomination. For the color description, these tables use three basic parameters that are expressed in the following order: Hue + Value + Chroma.
The pH was measured following the Soil Science Society of America criteria [22], from a soil:water = 1:2.5 ratio, to obtain the current acidity since the soil, given its dynamics, is very sensitive to changes that occur in its evolution. One of the related factors to such modifications is the hydrogen ion concentration. The concept of pH used here is the same as for true solutions despite being a heterogeneous system. Its measurement is a technique that, despite its simplicity, acquires very useful routine data.
The addition of a known amount of acid that causes the dissolution of the carbonates, and the subsequent titration of the excess of added acid (acid not consumed) with a base, was used for the quantitative determination of inorganic charcoal. The primary reaction that occurs is CaCO3 + 2HCl → CaCl2 + CO2 + H2O.
The determination of total charcoal, which includes different forms of C presentation such as carbonates, condensed forms, plant residues, etc., was calculated using the organic matter called easily oxidizable. For this reason, its determination was made by wet oxidation of organic C by excess of potassium dichromate, in a strongly sulfuric medium, using the dilution heat of this acid, to facilitate oxidation according to the formula 3C + 2K2Cr2O7 + 8H2SO4 → 2K2SO4 + 2Cr2(SO4)3 + 3CO2 + 8H2O. Excess of dichromate is titrated with ferrous ammonium sulfate, (NH4)2Fe(SO4)2·6H2O, Mohr’s salt, in the presence of phosphoric acid, using diphenylamine as the indicator.

2.6. Geochronology

Three different ages were determined using a speleothem, a cave fluvial deposit, and a paleontological remain to establish the chronological framework for El Olivo Cave. Flowstone on the cave walls was selected for dating using alpha-spectrometry at the U/Th laboratory of the Geoscience Barcelona Institute-CSIC (Spain). The flowstone was identified as a perched ledge located 2.05 m above the cave floor (before archaeological excavation). To obtain a sample for dating, the OL-3 sample was collected using a hammer and chisel, and approximately 20 g of carbonate powder were extracted using a hand diamond drill in the laboratory. The U and Th isotopes separation and purification procedures followed the Bischoff et alii (1988) method [23], and the isotope electrodeposition method developed by Talvitie (1972) [24], modified by Hallstadius (1984) [25]. The radioisotope concentrations were determined using an ORTEC OCTETE PLUS spectrometer equipped with eight BR-024-450-100 detectors developed by Ivanovich and Harmon (1992) [26]. The speleothem age was calculated based on the time of analysis (2017) using the Rosenbauer (1991) method [27] and expressed in years before the time of analysis with an uncertainty error of two standard deviations (2σ).
The sample OL-4 of cave fluvial deposits was dated using optically stimulated luminescence (OSL) at the Institute of Geology Isidro Parga Pondal, University of Coruña (Spain). To extract the sample, an opaque PVC tube (20 cm long, 55 mm diameter, 4 mm wall) was driven into a homogeneous quartz-rich sand layer (OL.Exterior.3) at a depth of 0.97 m. The tube was immediately covered with duct tape foil to prevent light exposure and preserve humidity and sediment deformation. In the laboratory, samples were processed under red light conditions. The sand stored within the tubes was dried, sieved, and treated with HCl and H2O2 to remove potential carbonate and organic matter. Quartz was separated from feldspar and heavy minerals using centrifugation and diluted in HF to obtain pure quartz. The purity of the quartz was verified using Infrared Stimulated Luminescence (IRSL), and preheat and bleached-aliquot recovery tests were carried out following the methods of Murray and Wintle (2003) [28]. OSL signals were recorded using an automated RISØ TL/OSL-DA-15 reader equipped with a photomultiplier EMI 9635 QA (PMT) and a 90Sr/90Y source. A 6 mm-thick Hoya U-340 filter was placed between the aliquots and the PMT to measure the UV range emission. The Single Aliquot Regeneration (SAR) protocol of Murray and Wintle (2000) [29] was applied to 35 multigrain aliquots to estimate the equivalent dose (De) using the Central Age Model [30] to date the sample. The activity of radioisotopes (40K, 238U, 235U, 232Th) was inferred using low background gamma-ray spectrometry. Measurements of calcined and ground sediments were performed using a coaxial Canberra XTRA gamma detector (Ge Intrinsic) model GR6022 within a 10 cm-thick lead shield. The alpha dose-rate was neglected due to the HF etching step, the beta dose-rate was corrected [31], and the cosmic dose-rate was estimated using the methods of Prescott and Hutton (1994) [32] and Guerin et alii (2011) [33]. The OSL age is expressed in years before the time of analysis (2009) with a corresponding 2σ uncertainty.
The third date was obtained through the AMS radiocarbon method at the Beta Analytic laboratory, using a sample of fauna (from a medium-size ungulate) taken from Sublevel OL.2b of the inner excavation. The conventional dating result was originally calibrated and published using the INTCAL13 calibration curve [3,34] and it has now been re-calibrated with INTCAL20 [35].

3. Geomorphology

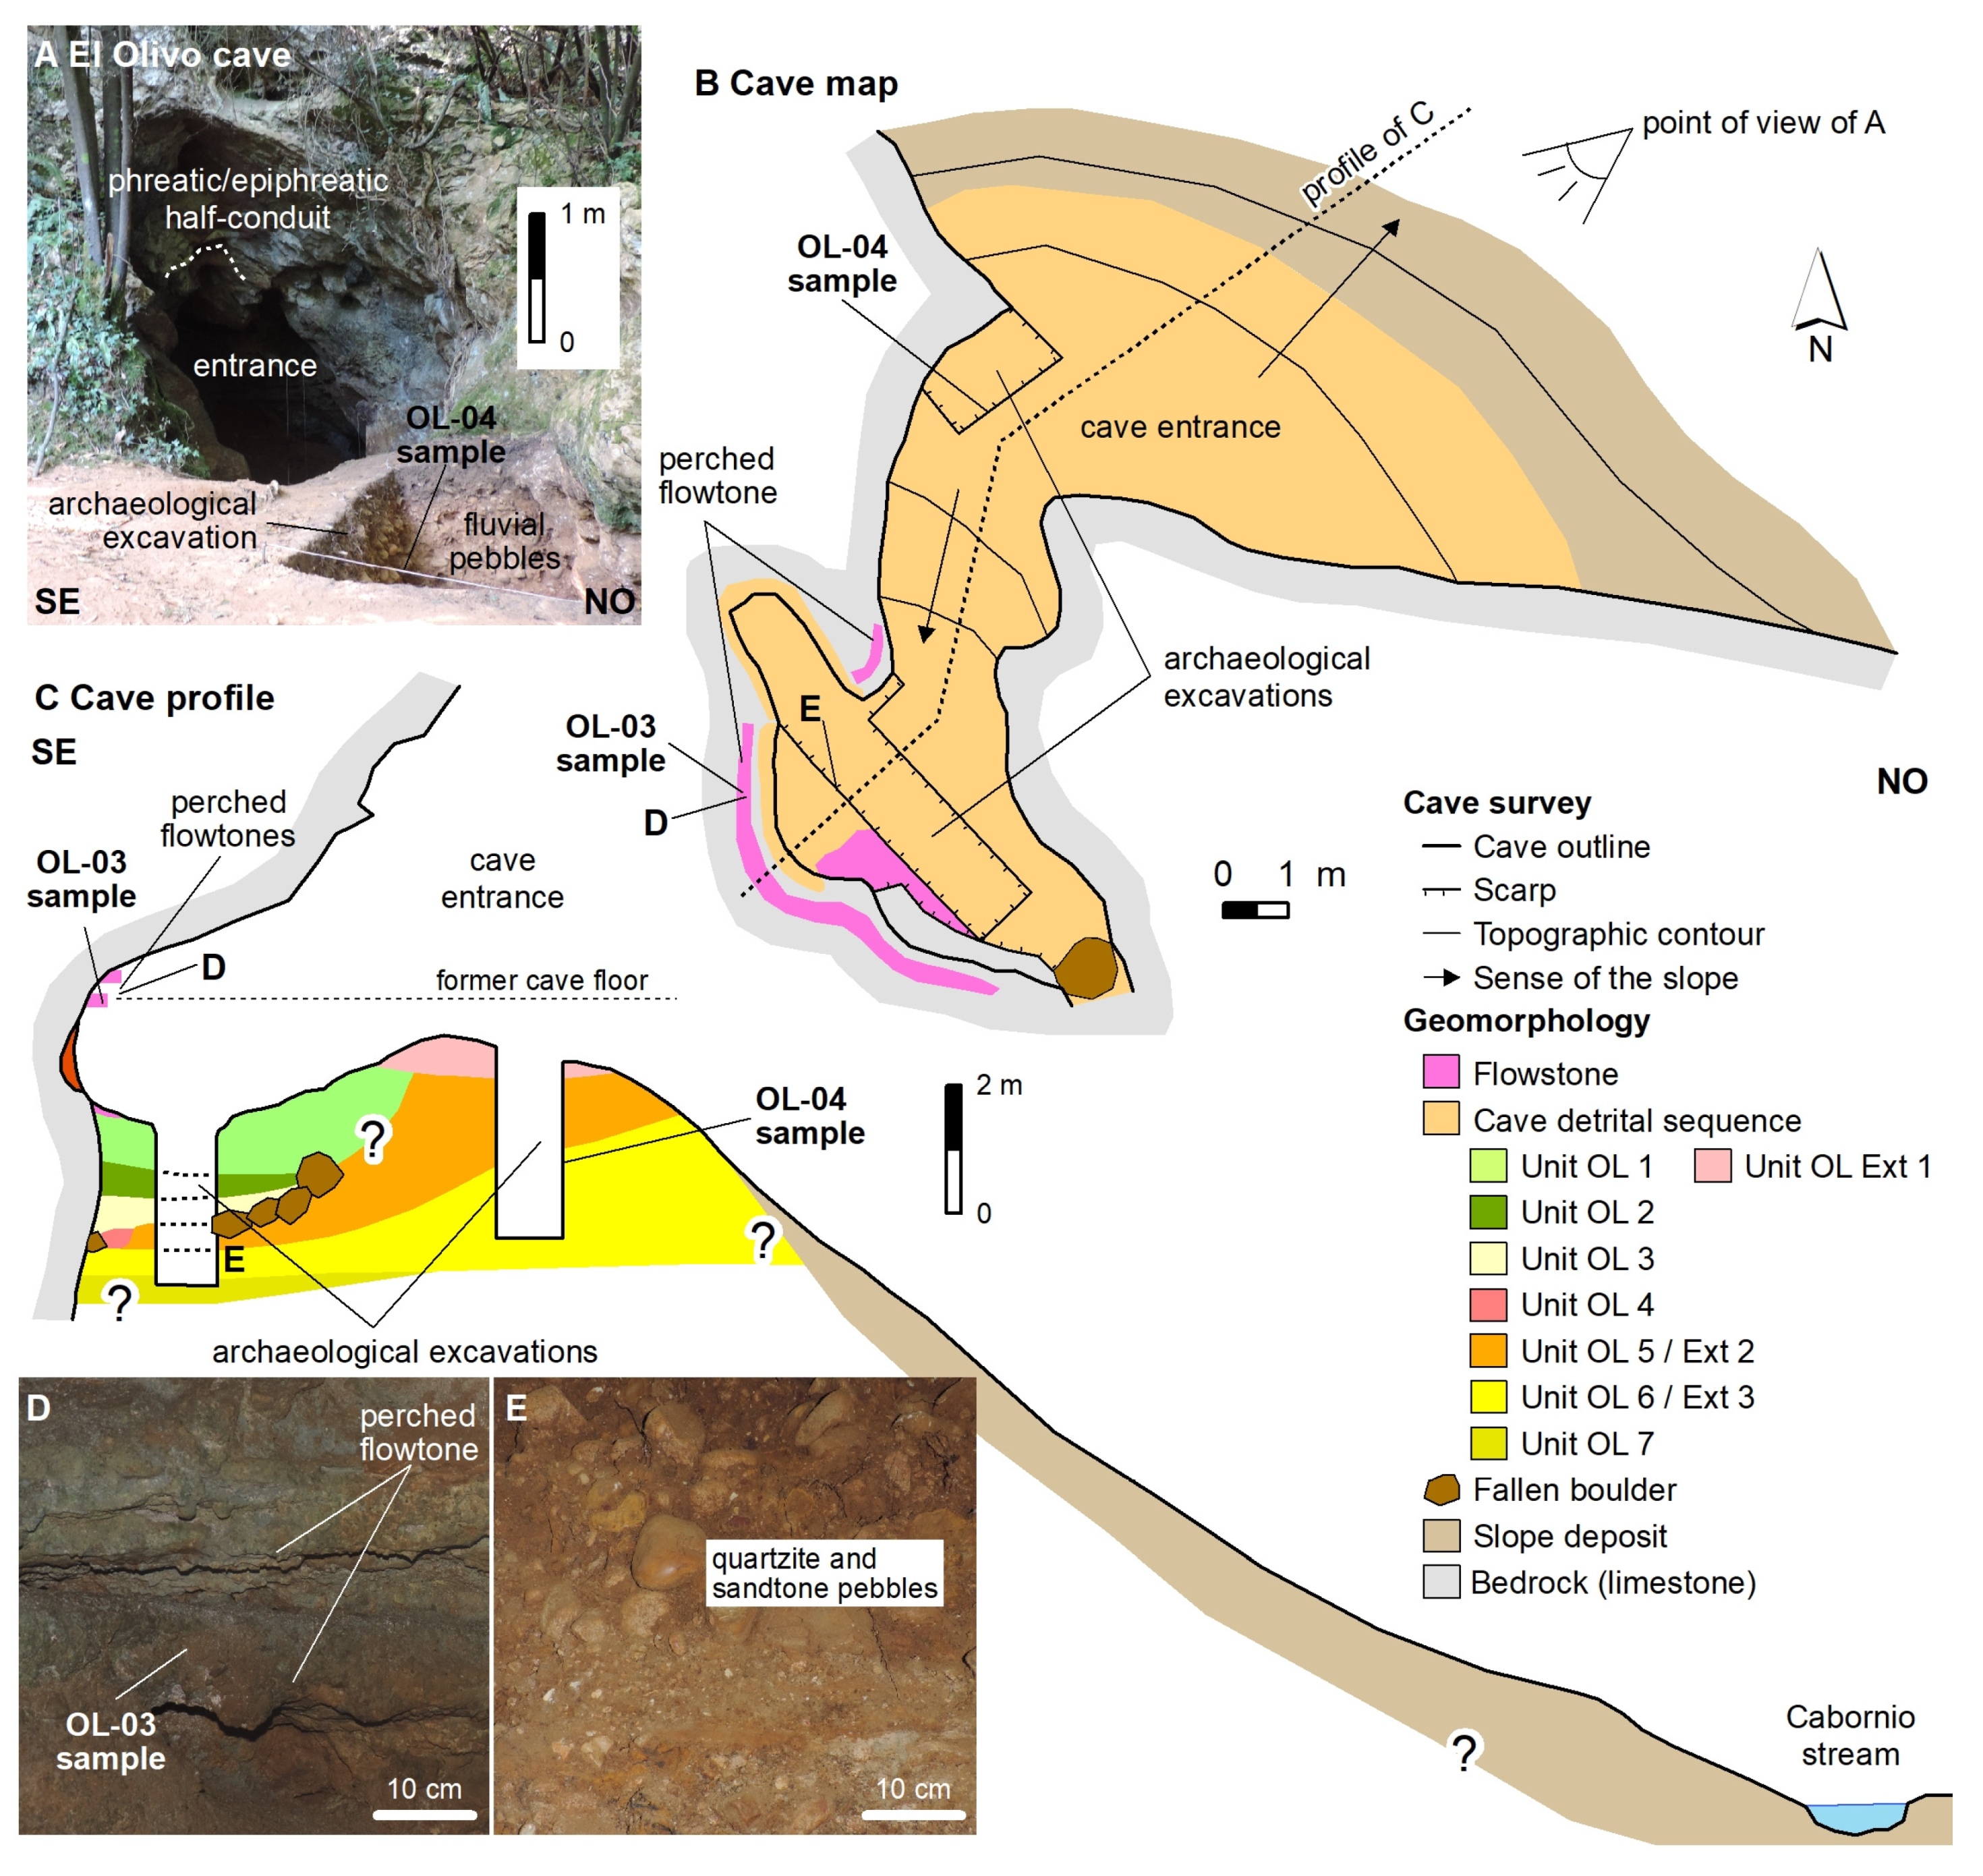
El Olivo Cave is a limestone conduit with a rounded ceiling of phreatic/epiphreatic origin (Figure 4A), suggesting the formation of the cave passage at a paleo-water table. Cave walls exhibit flowstone preserved as ledges perched 2 m above the detrital infill (cave floor) containing the archaeomaterials (Figure 4B-D). The flowstone would have precipitated on a detrital deposit that was partially or totally removed later by natural erosion. Therefore, the perched flowstone marks the occurrence of an earlier cave infill (represented as the former cave floor in Figure 4C). Afterwards, a period of fluvial incision occurred because El Olivo cave is 13 m higher than the Cabornio stream belonging to the Aboño River system (Figure 4C). The present cave infill is detailed in Section 4 and includes fluvial sediments (Figure 4E), breakdown deposits and archaeological remains.
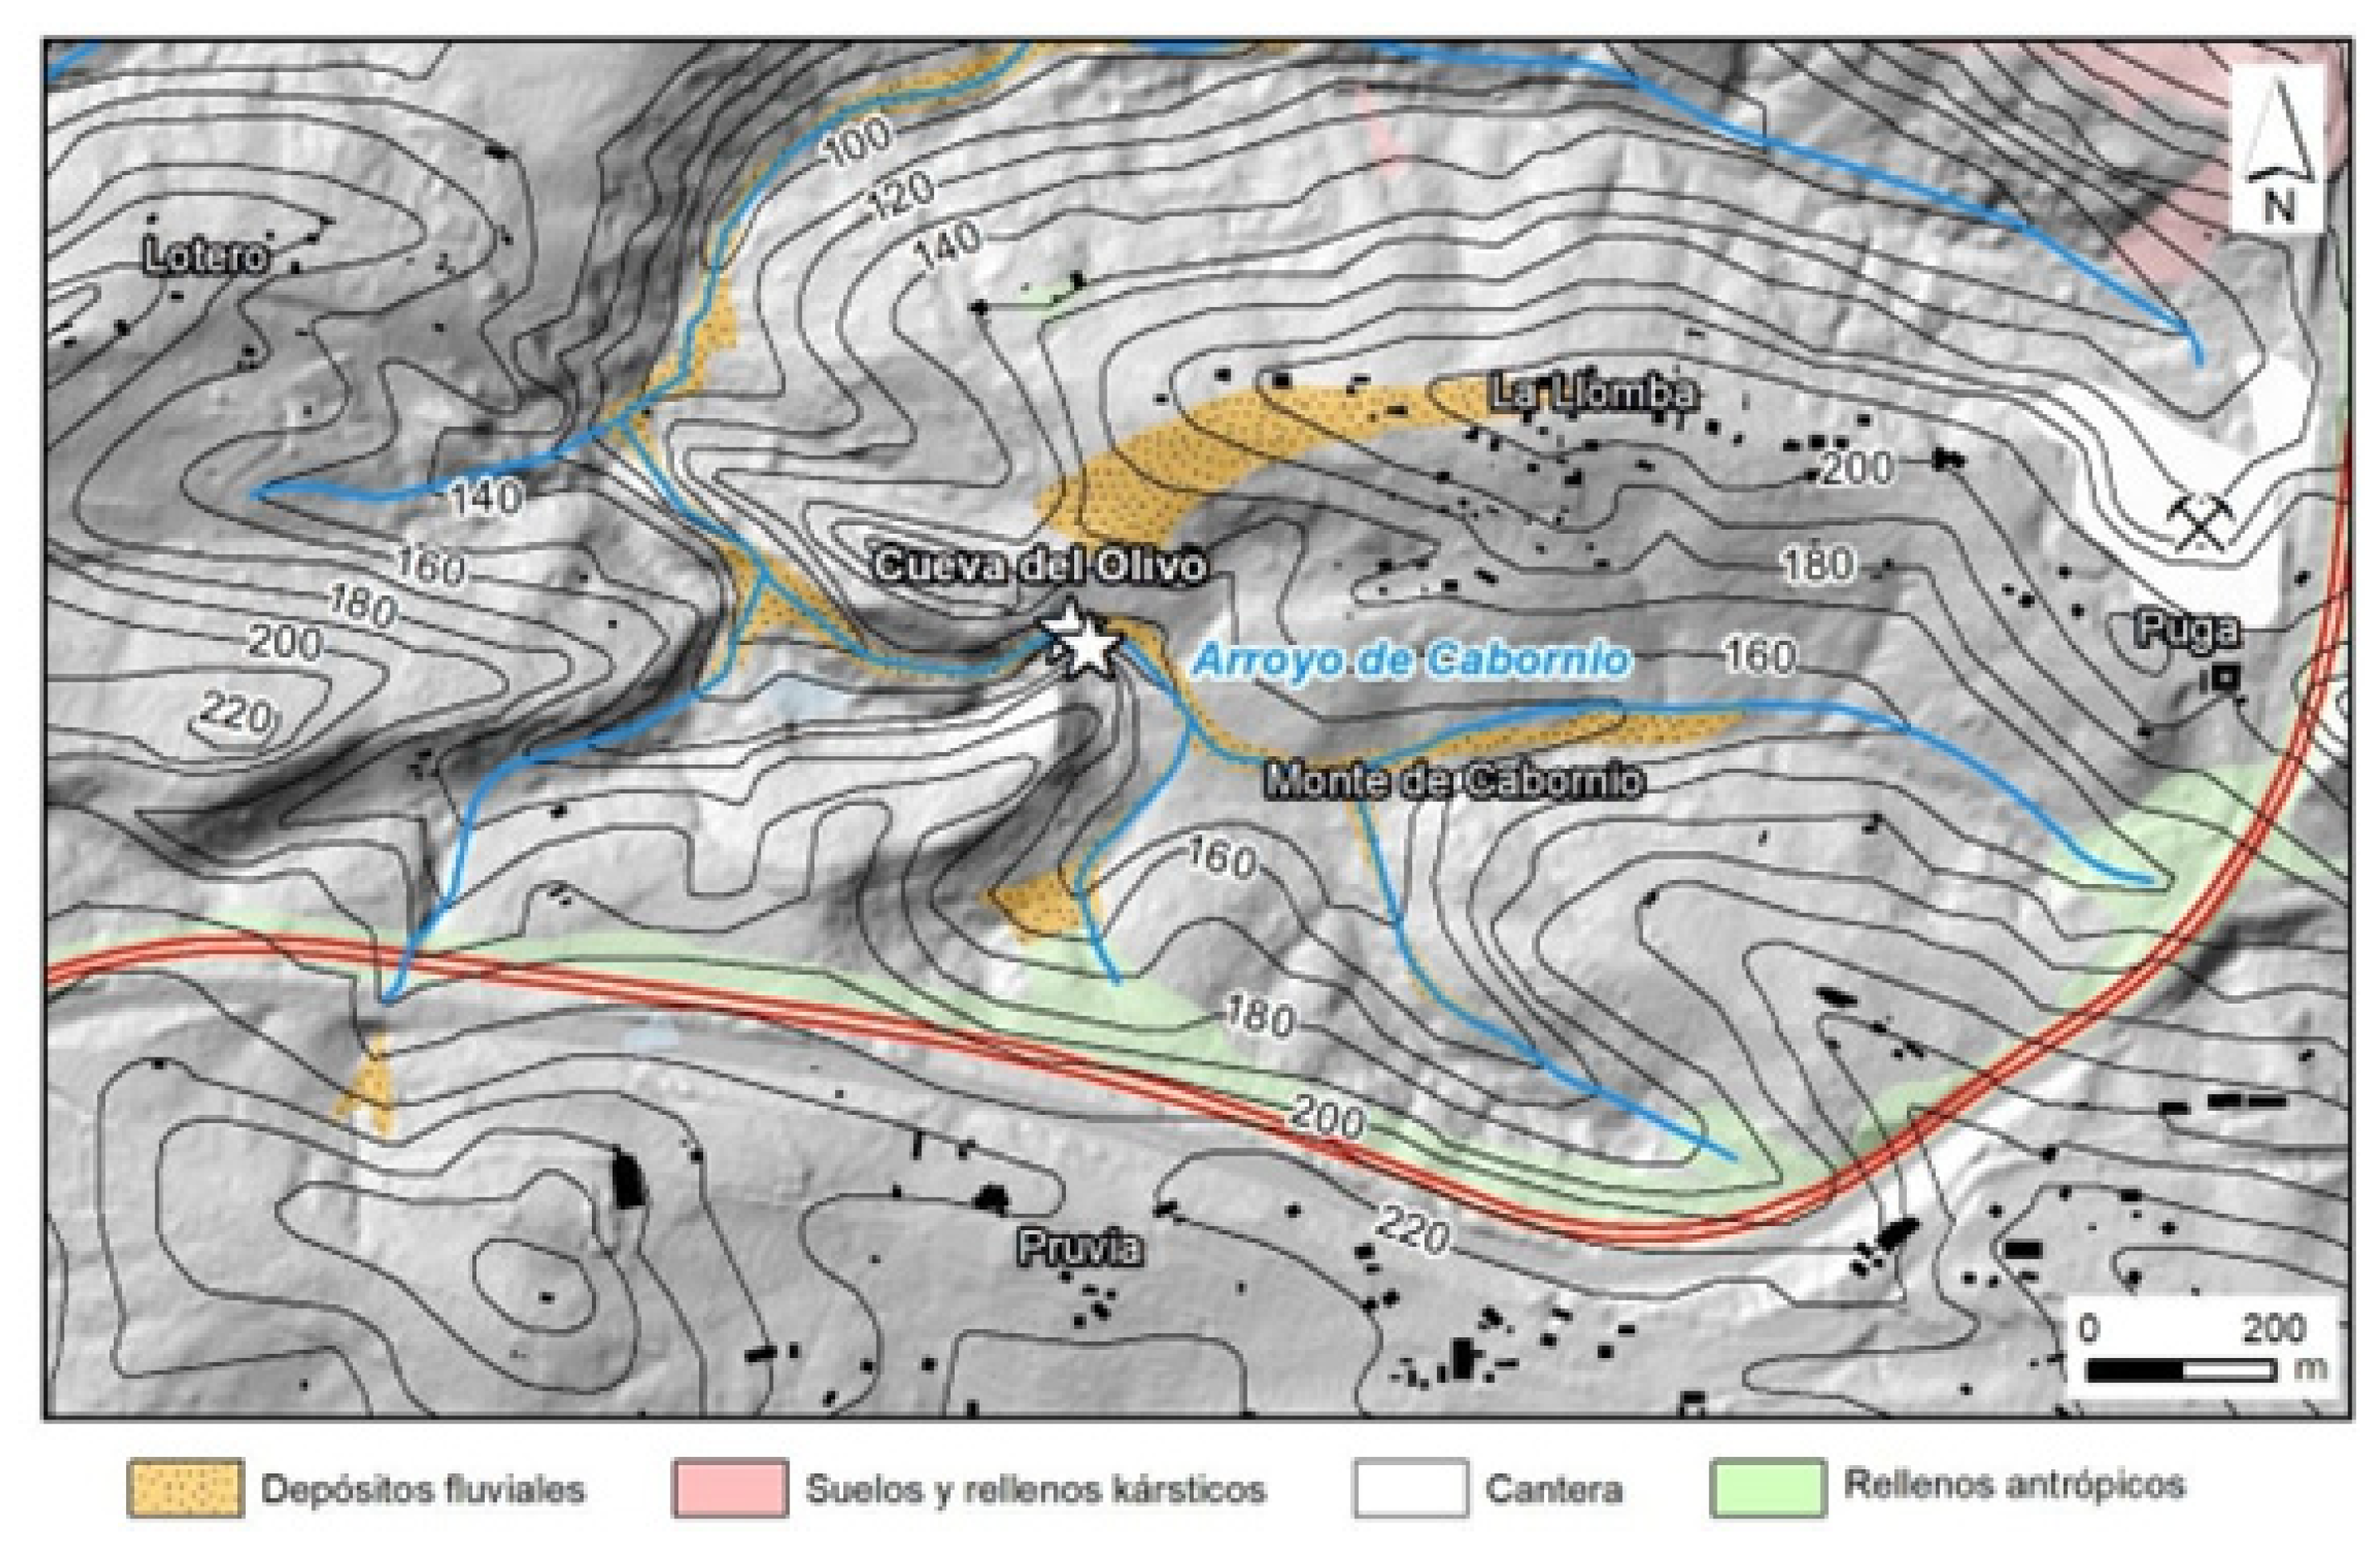
The alluvial deposits containing quartzite and sandstone pebbles found in the cave and the Aboño River basin are likely derived from the erosion of Paleogene siliceous conglomerate and sandstone located approximately 530 m S of El Olivo Cave (Figure 5). These detrital rocks are situated on the Cretaceous bedrock and form the Llanera plain, an approximately 100 km2 paleosurface that rises to 200-250 m in altitude. The steep slope of the headwaters of the Aboño River indicates the migration of the water divides to the S, resulting in the Aboño watershed capturing the Llanera plain.

4. Geoarchaology

4.1. The lithostratigraphic sequence

El Olivo Cave is partially filled although its sediments reached higher levels in the past. Proof of this is visible on the walls of the cave, where remains of speleothems can be observed 2 meters above the current floor. At the same time, below the speleothems, numerous patches of sand are adhered to the walls, as remnants of a first fill that was dismantled. To the right, the cave continues in an N-NW direction through a narrow passage or sink, which was also filled before the excavations began. The archaeological work in the cave allowed us to observe that the sink continues inwards through a conduit, which was also filled with clastic sediments of autochthonous character. In this area, water circulation followed the wall-ceiling plane of the drain, which caused a dragging of sediments toward the interior of the cave. The sink was filled with autochthonous boulders that partially blocked it. These boulders were embedded in fine orange-colored sediments on which a package of fluvial boulders rest in a highly erosive manner. In the innermost part, the accumulation of these sediments and rocks completely filled the channel. Above all these deposits, in the main chamber of the cave, other more recent deposits with a partially mixed appearance were deposited.
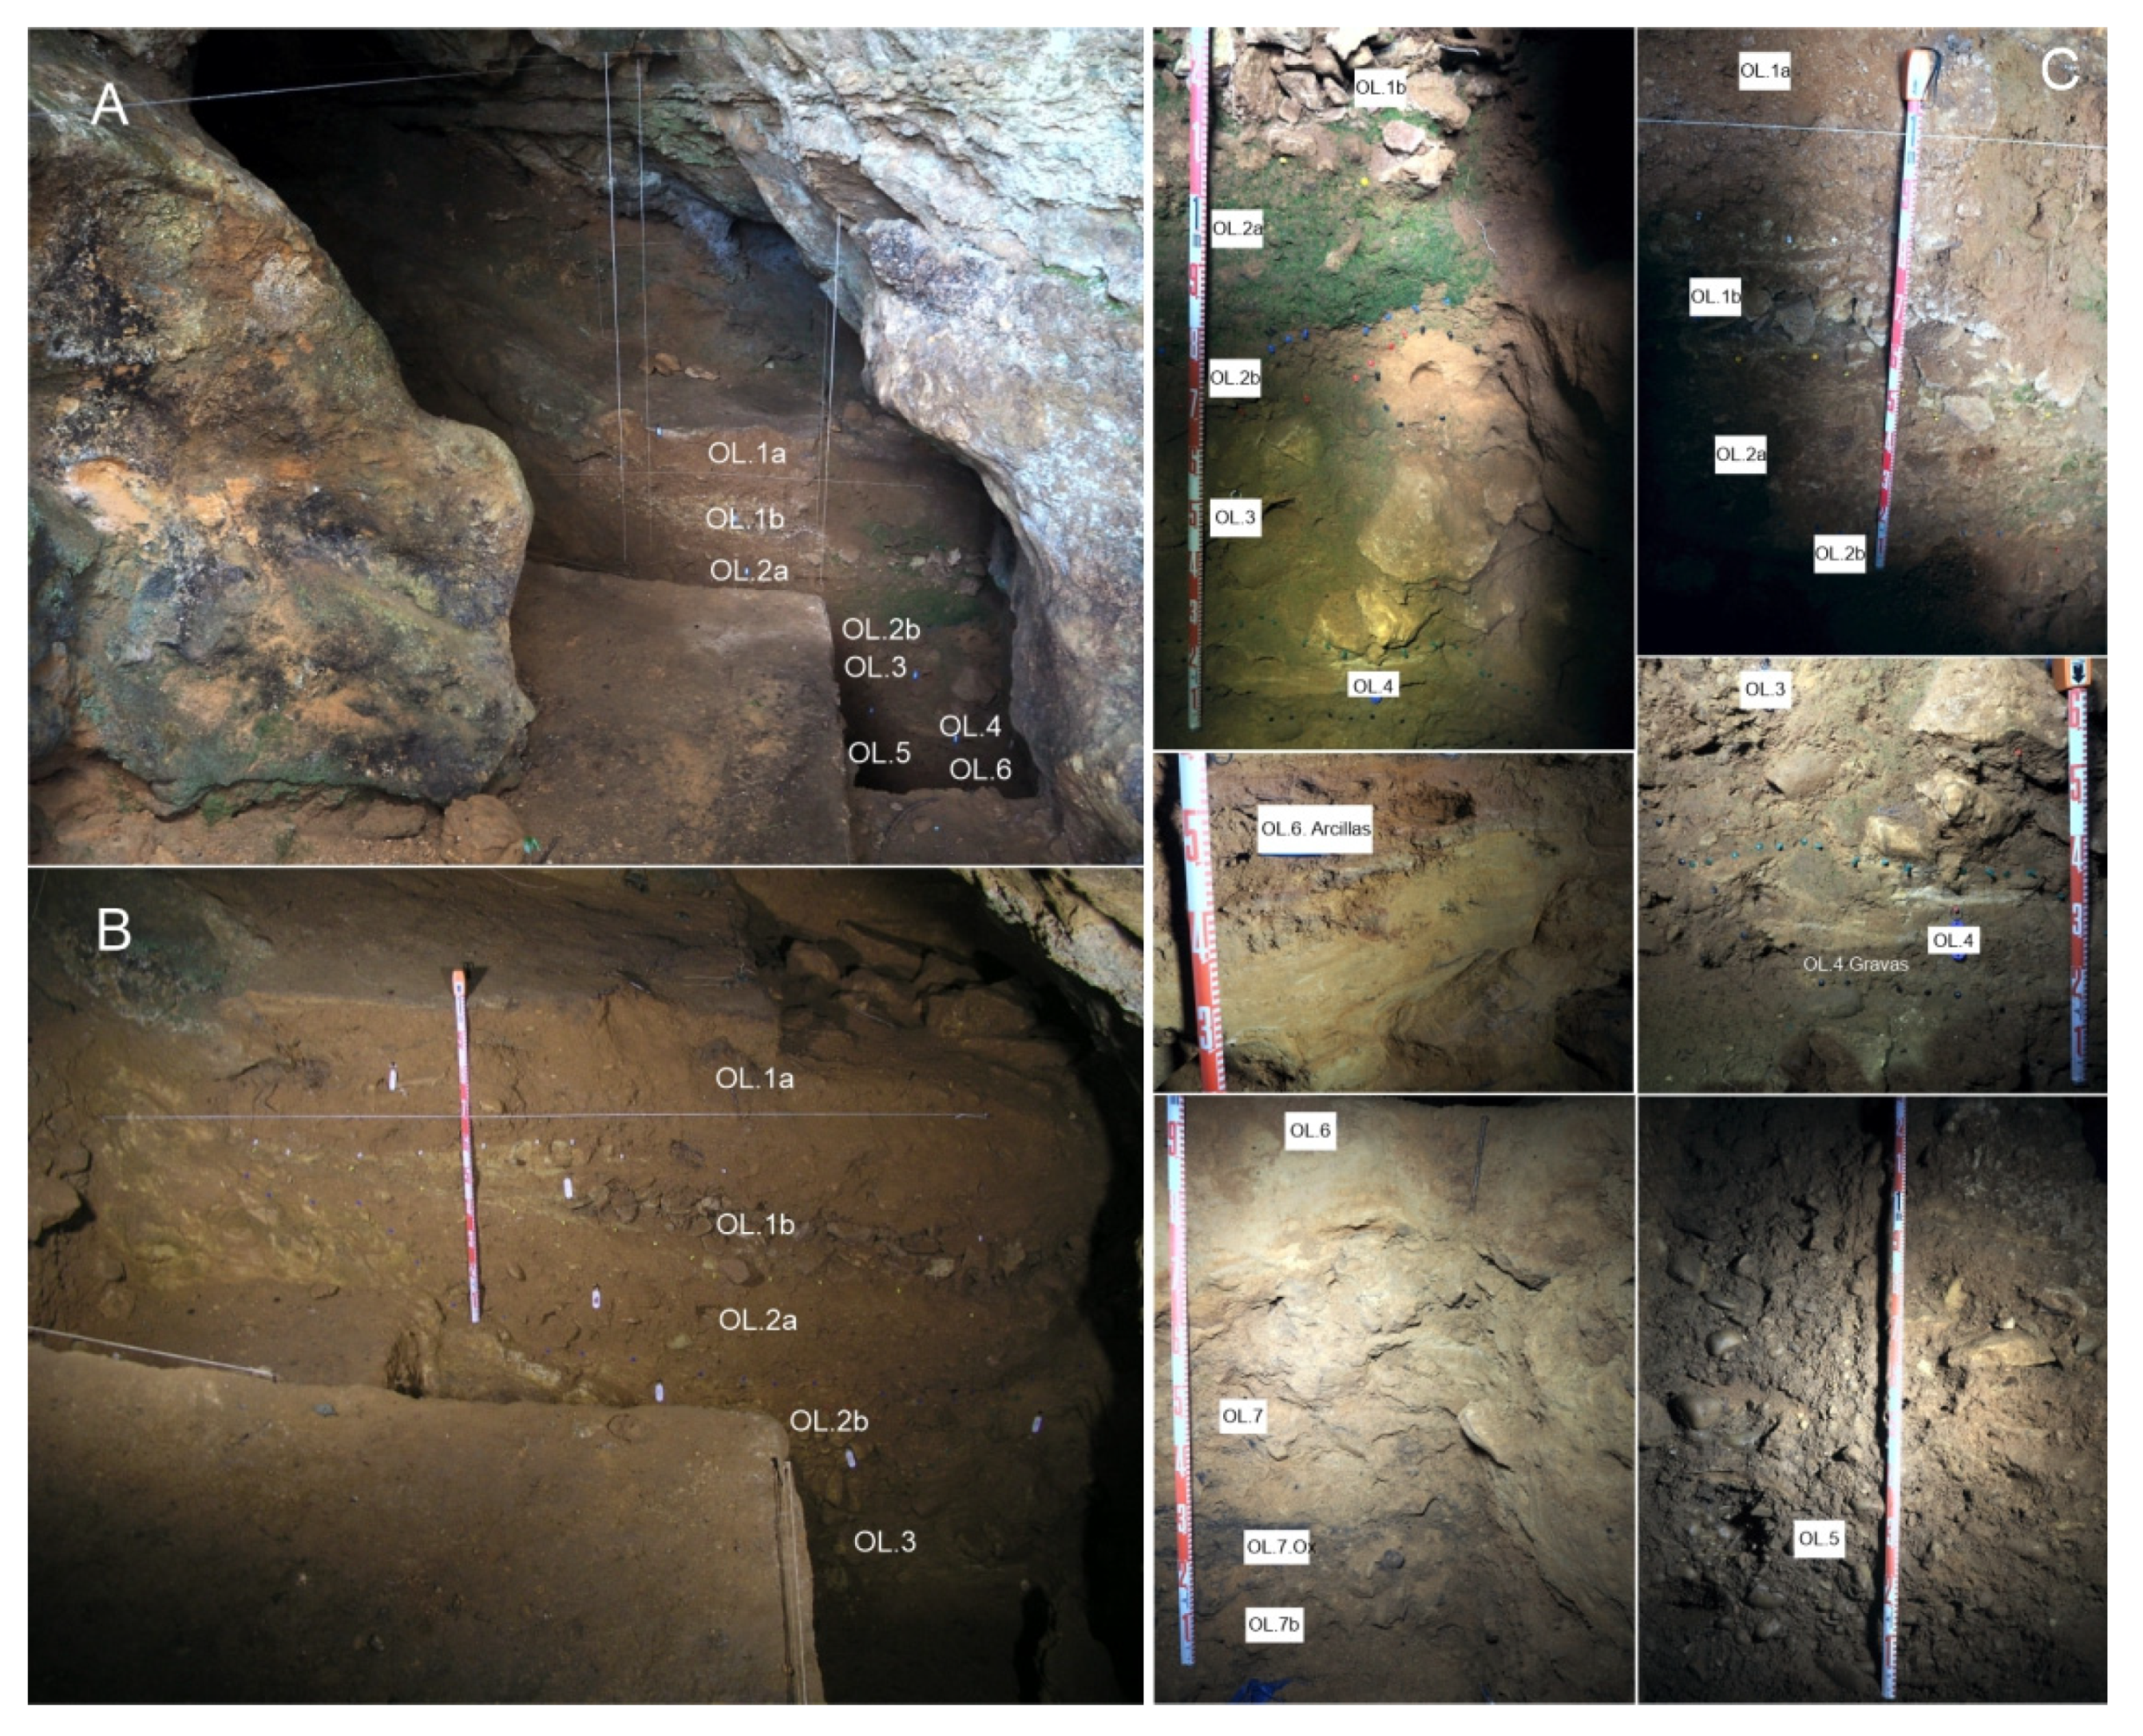
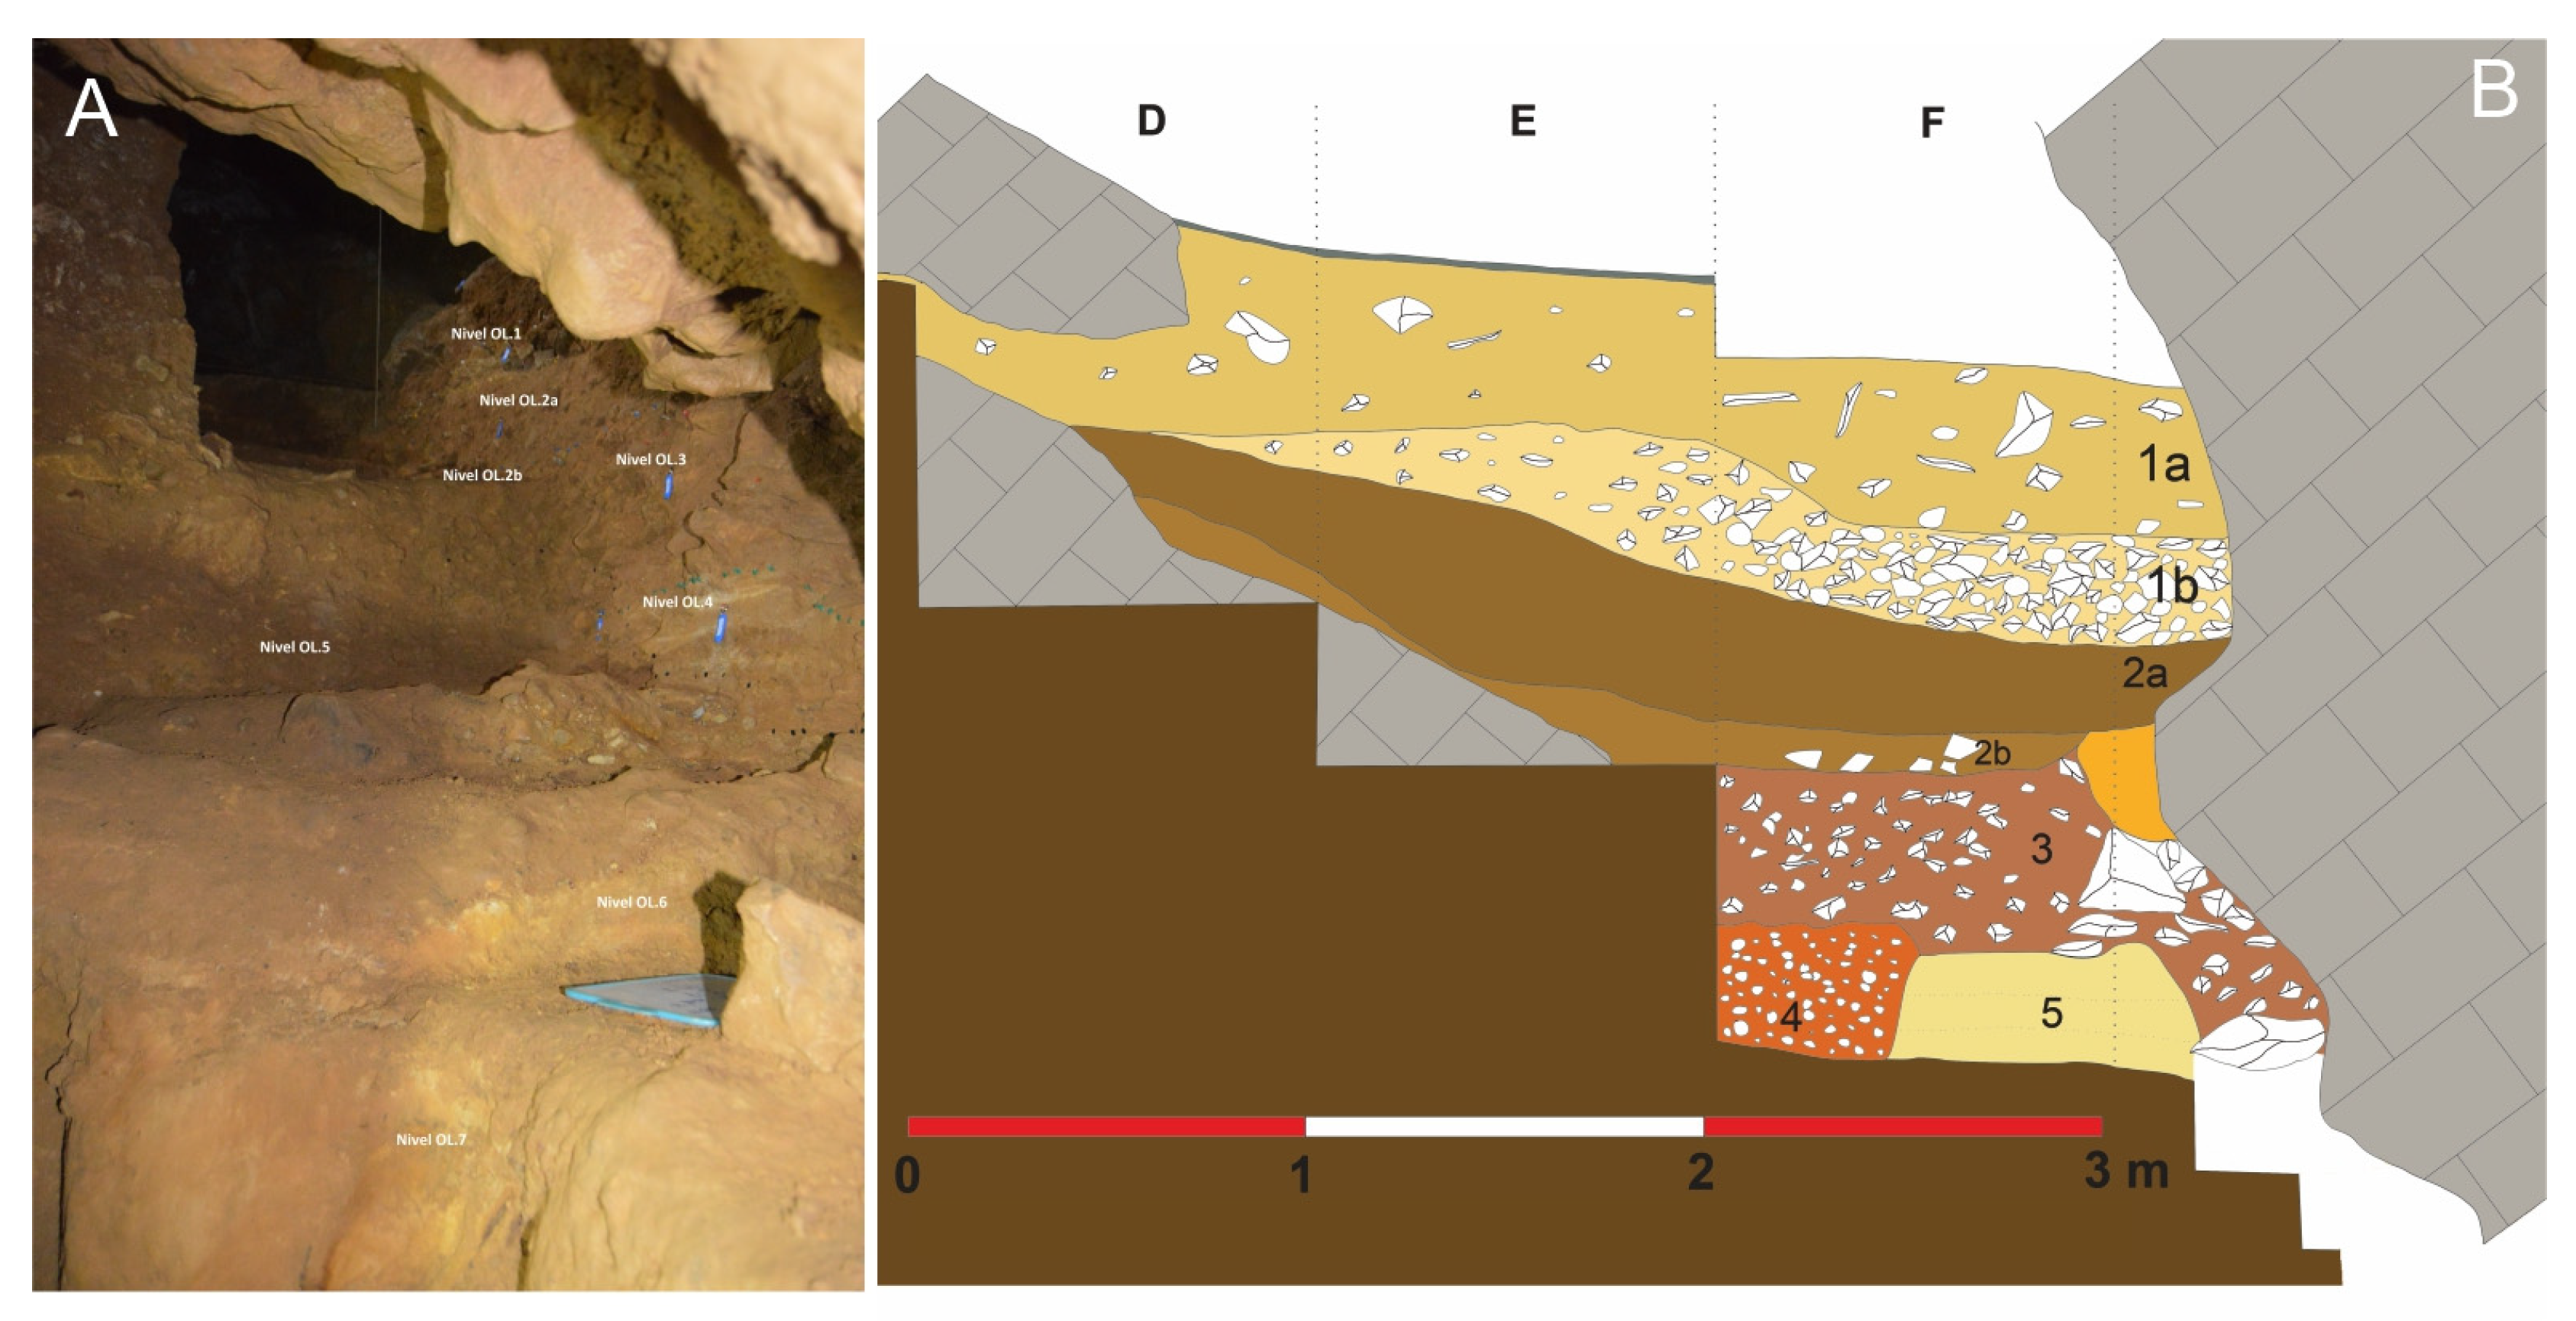
In the archaeological trench excavated inside the cave, the following levels are observed from bottom to top (Figure 6 and Figure 7):
OL.7 Level: Known basal level of the sequence. More than 60 cm of reddish brown clays and black spots due to dark oxides, with fine and medium quartz sands, well rounded and with abundant gravel and pebbles (10 cm centile, 3 cm average) arranged chaotically. Most of them are autochthonous limestone clasts, with very irregular geometry and sharp edges, together with other moderately rounded limestone clasts. It is structured in two sections: the lowermost (sample OL.7b), characterized by the greater presence of dark oxides that stain the faces of the limestone clasts; and the uppermost (sample OL.7a), with less presence of oxides, separated from the previous one by a horizontal thin level of dark oxides. It contains interspersed lithic and faunal remains, all of them arranged chaotically in the deposit. The lithic industry is no longer laminar and quartzite is more abundant than flint, and the fauna is large in size. The two samples sent for radiocarbon dating (AMS direct and Beta Analytic) lacked sufficient collagen because the bones were highly altered. There is plentiful evidence of dark oxides on the faunal remains, and it is possible that the level was formed in a context with abundant water. Although the recovered lithic collection is very scarce, it shows characteristics that mean that, provisionally, this level has been assigned to the Middle Paleolithic [4,5]. The base of this level has not been reached.
OL.6 Level: 40 cm of well-rounded fine and medium quartz sand, predominantly yellow with silt and clay (sample OL.6), which appears finely laminated with a depositional slope towards the interior of the cave (N-NW). The sand is affected by hydromorphism that results in a mottled coloration (white, yellow, orange). This level is strongly erosive on OL.7 and in the contact between both, planar carbonate concretions appear in some areas. Ascending up the passage, it is possible to observe how the sands vertically pass to some red clay with silt and very fine quartz sand and some gravel (sample OL.6. Clays), massive, inclined towards the interior with a carbonated crust on top and a desiccation crack filled by carbonates. It is heavily eroded by OL5 and OL.4. It presents faunal remains that show the action of carnivores at the top of the level.
OL.5 Level: From 30 to 120 cm of a heterometric clast-supported conglomerate (sample OL.5), yellowish in color with gray tones, formed by quartzite pebbles and quartz gravels, spherical to subspherical and very well rounded (12 cm centile, mean 2 cm), with a scarce reddish matrix of clay and silt with coarse, fine and very fine quartz sand. The fine fraction is composed mainly of quartz grains with little presence of calcite. The size of the clasts varies from 2 to 12 cm from bottom to top, resulting in a grain-increasing arrangement, although internally the deposit presents a massive appearance, with a certain horizontal organization of the planar clasts. The uppermost part is heavily eroded –hence its thickness variation- and the erosive scar generated is filled by OL.3 which, as we will see, is made up of angular autochthonous limestone clasts. It contains some isolated quartzite flakes with a strong patina. It can be correlated with the OL.Exterior.2 level of the exterior trench, although the contact between the OL.5 pebbles and the OL.6 sand inside the cave is about 2 m below the same contact in the exterior trench.
OL.4 Level: From 20 to 30 cm of clayey silt with fine and medium quartz sand, slightly angular and rounded, ranging in color from white, yellow, orange and red (sample OL.4), which towards the lowermost part becomes silty-clayey sand with gravel in thin levels (sample OL.4. Gravels). They are laminated with a depositional inclination towards the interior of the cave, overlying the large scar that erodes the underlying conglomerates, and they gradually decrease in thickness in a stepped manner until they disappear. A patch of them is visible on the W wall of the sink. It contains Upper/Middle Magdalenian levels.
OL.3 Level: From 40 to 50 cm of clayey fine sand, light brown in color with whitish areas (sample OL.3), with scattered gravel and large irregular blocks of autochthonous limestone, both rounded and angular, together with fragments of stalagmitic crusts arranged chaotically towards the interior of the cave. It is partially cemented by carbonates, giving it a breccia-like appearance. The level is disturbed, with isolated faunal and lithic remains.
OL.2 Level: Deposit of yellow sand internally structured in two sections:
OL.2b: Lower section, 0 to 10 cm thick, formed by yellow quartz sand, fine and very fine, well-rounded, silty and clayey, with whitish tones and some angular limestone pebbles and gravel (2 cm centile) (sample OL.2b ). The fine fraction is predominantly quartz with very little presence of sodium feldspar and calcite. It wedges towards the east, resting on the underlying rock of the substratum while towards the west it is abruptly interrupted without reaching the wall, as it is supported by a patch of yellow sand attached to the wall, possibly a remnant of a previously eroded deposit. Its appearance is massive. It does not appear to be altered. It contains lithic and faunal remains from the Middle Magdalenian period, and a fauna sample from this sub-level has provided a radiocarbon age of 13,960 ± 40 BP [4].
OL.2a: Upper section, 35 to 40 cm of yellow quartz sand, fine to very fine, well-rounded, clayey and silty, with scattered gravel and pebbles (sample OL.2a). It includes angular limestone pebbles (centile 7 cm, mean 2 cm) and some scattered red sandstone pebbles, as well as small-sized rounded pebbles (centile 3 cm) and well-rounded quartzite gravels, arranged chaotically. The fine fraction (silt and clay) is mainly composed of quartz with a limited presence of calcite. It is wedged laterally, and its overall appearance is massive. It contains soft mud pebbles up to 8 cm in diameter and fragments of carbonized organic matter along with archaeological remains from the Middle Magdalenian period [38]. The upper part shows traces of alteration due to the intrusion of isolated modern material.
OL.1 Level: Reworked deposit with modern materials (ceramics, earthenware, bullet casings, glass) and Paleolithic artifacts (lithic and fauna from Level OL.2) that can be divided into two sections:
OL.1b: Lower section 25 cm thick of clast-supported conglomerate with autochthonous limestone clasts and rounded pebbles with a limited clayey-silty matrix. Laterally it transitions to yellow sands and silts. It wedges laterally and exhibits strong erosive characteristics on the underlying level.
OL.1a: Upper section formed by 45 cm of reddish-brown to orangish sands and silts, with some autochthonous clasts and pebbles.
The rounded pebbles in this level appear to originate from the dismantling or excavation of level OL.Exterior.2 in the part of the entrance that occurred in modern times, creating this artificial stratigraphy.
Surface level: 2 cm thick dark layer composed of organic matter, possibly resulting from the modern use of the cave. It is highly compacted due to trampling.
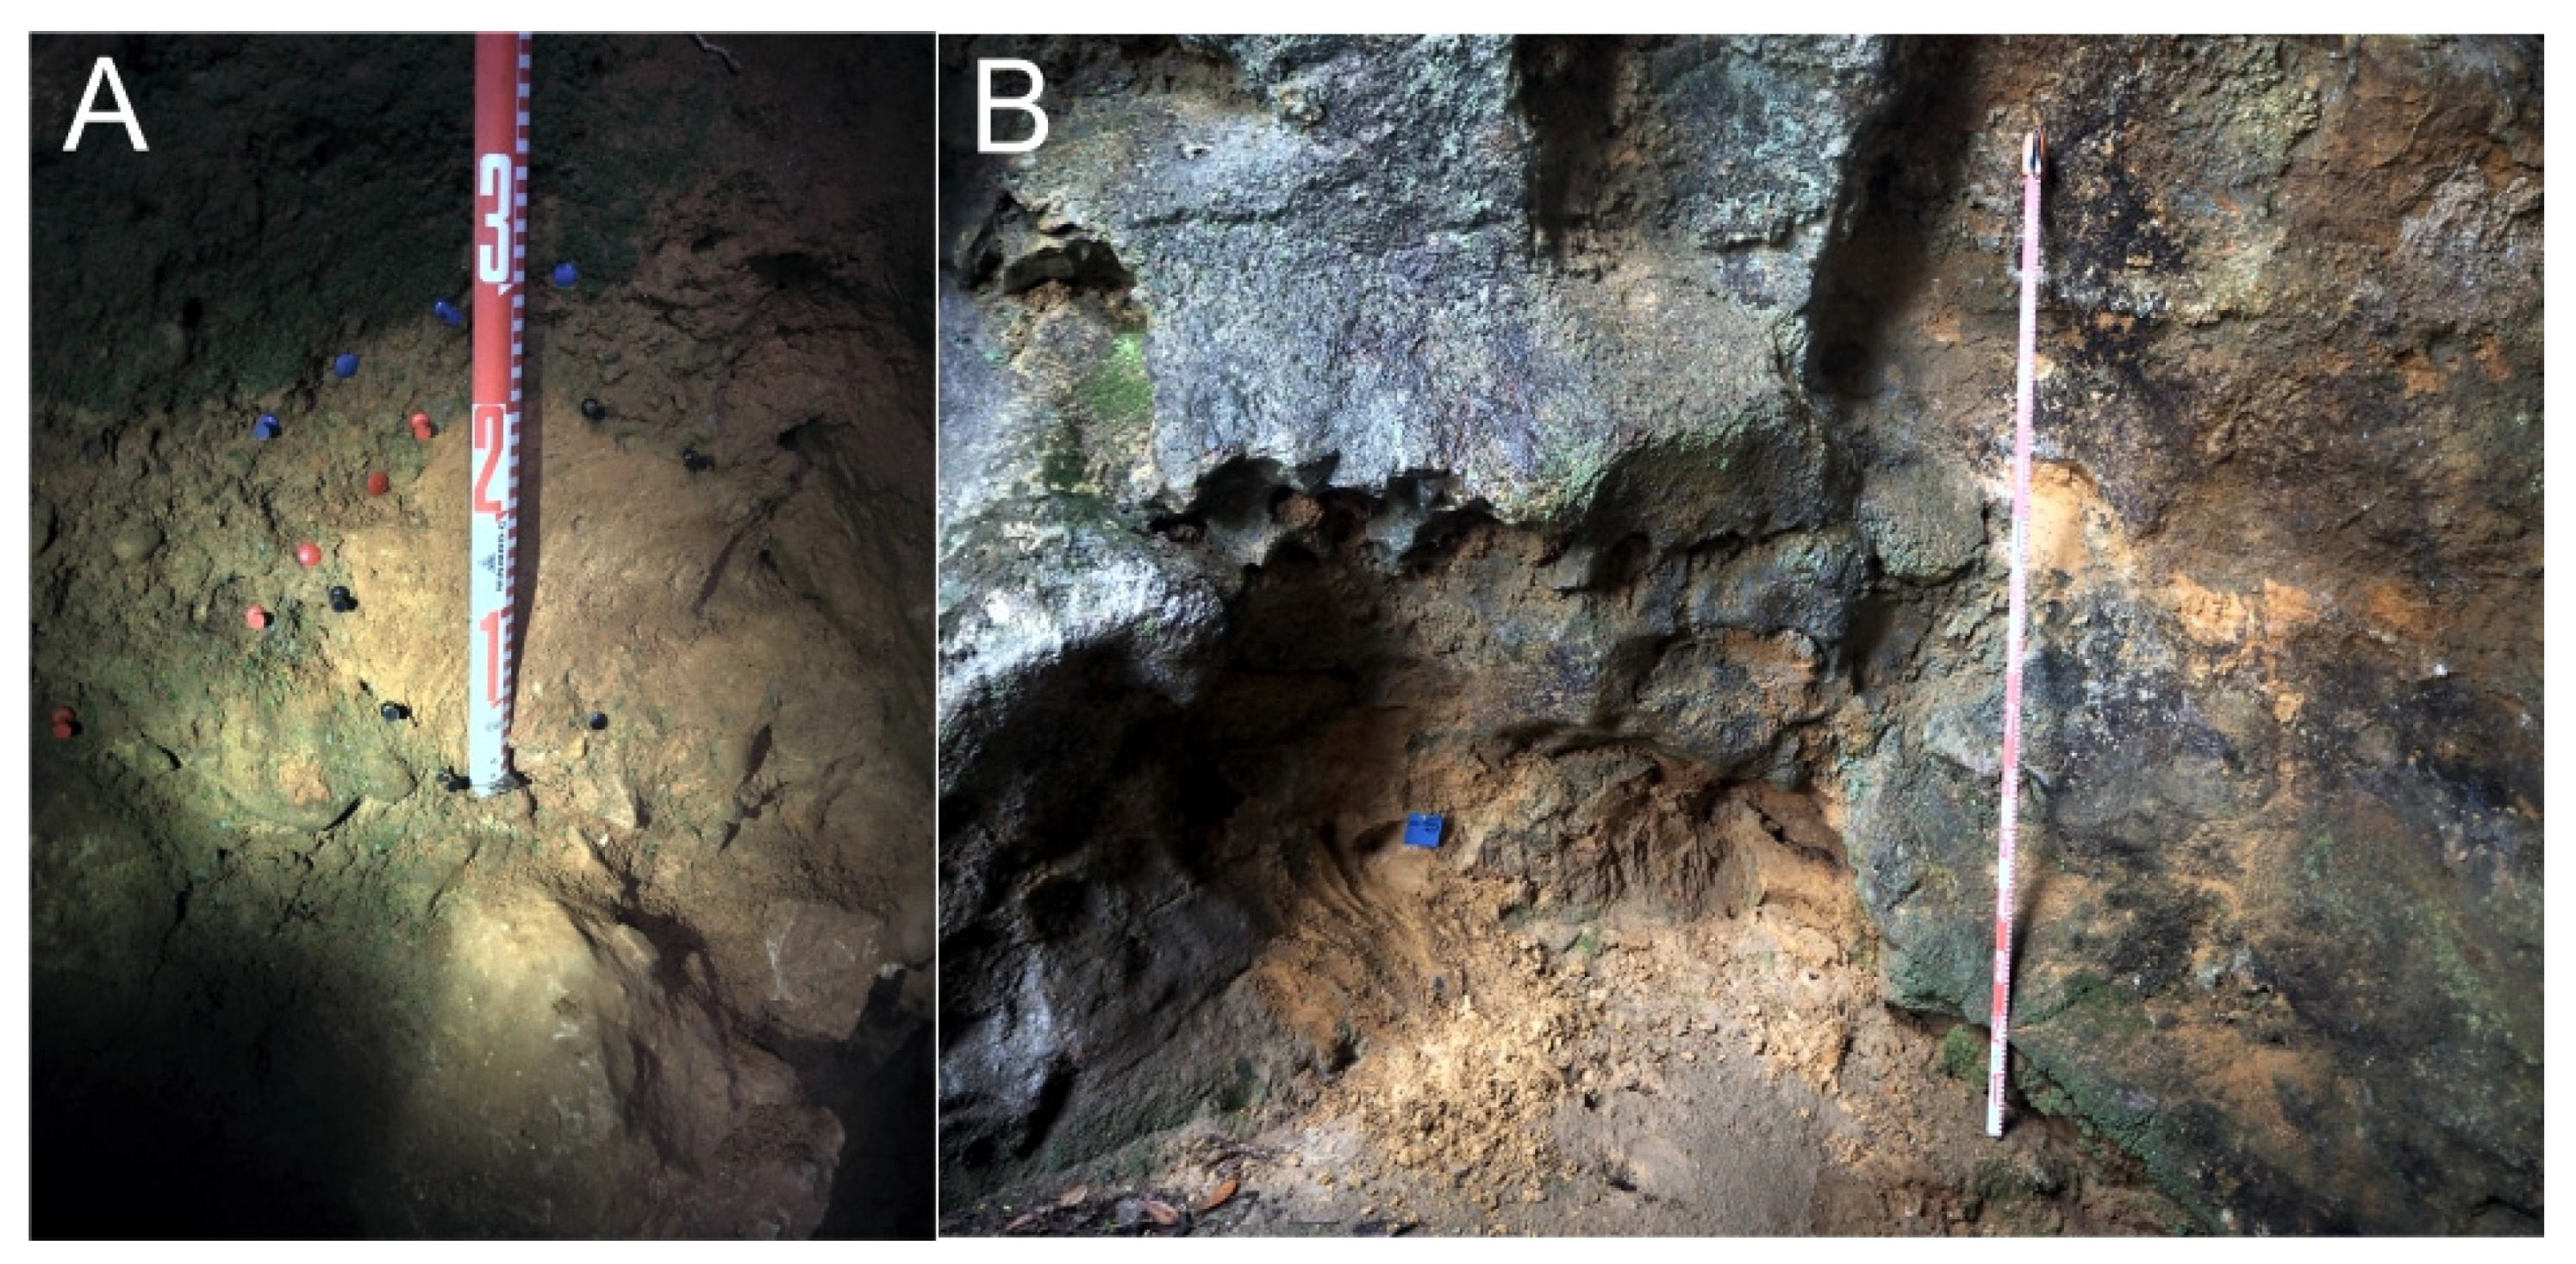
Attached to the left wall (W) of the sink there is a small patch 30 cm wide and 20 cm thick, composed of medium, fine and very fine well-rounded quartz sand. It is likely a remnant from a previous fill (OL.Arenas anteriores) (Figure 8).
We also took a sample of the orange sand located outside the cave (OL.Arenas exteriores), adhered to the wall. It consists of medium quartz sand grains that are well-rounded (Figure 8).
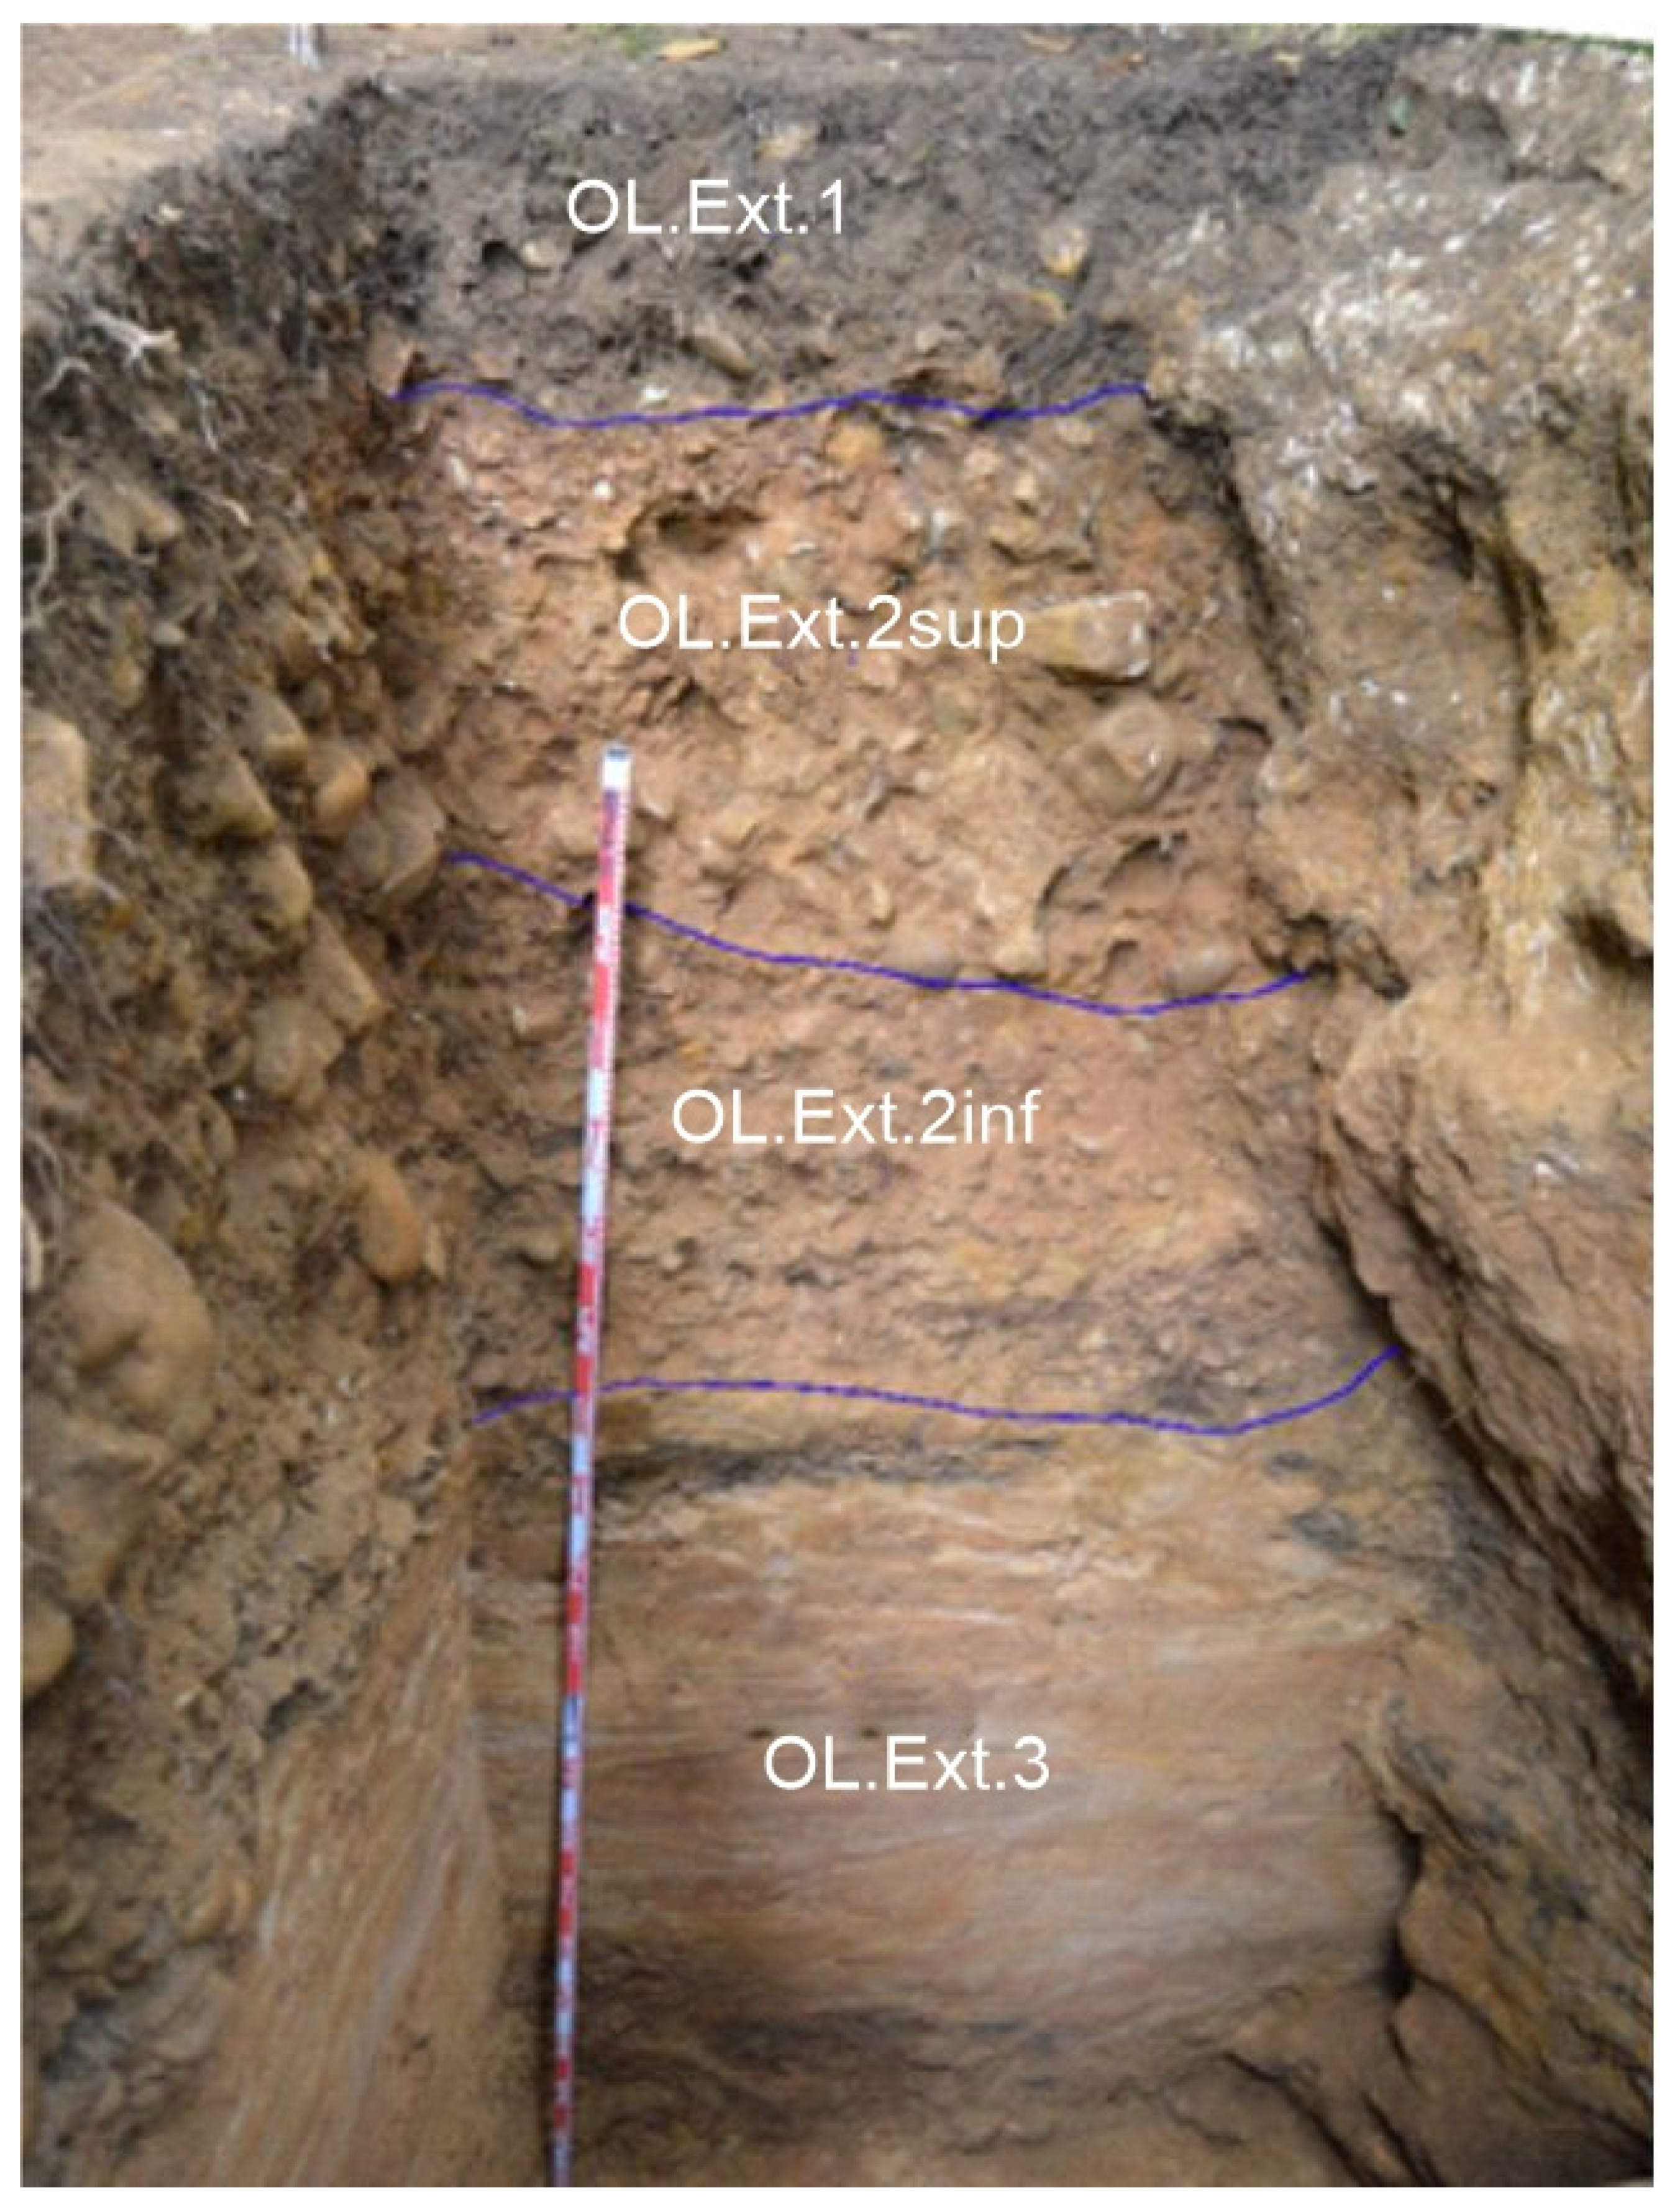
In the archaeological excavation conducted outside the cave (Squares G1 and G2), on the existing terrace in the access area to the cave, a sequence can be observed consisting of, from bottom to top (Figure 9):
OL.III Level: (140 cm visible) Medium, fine and very fine quartz sand finely laminated horizontally, light orange in color, similar to the sand in the interior level OL.6 (sample OL.Exterior.3). A sample taken from the uppermost part of this level for OSL dating provided a date of 23,500 ± 6,200 years old1.
OL.II Level: (95 cm) Heterometric and growing grain conglomerate, with a class-supported structure, containing a matrix of medium and fine quartz sands, well-rounded, reddish-brown in color, similar to the interior level OL.5 (sample OL.Exterior.2). It is divided into two sections: a lower section with fewer pebbles and gravel (IIb), and an upper section with abundant rounded clasts (IIa)
OL.I Level: (40 cm) Dark brown to black clay, with quartz sand and abundant organic matter (sample OL.Exterior.1).

4.2. Sedimentological and edaphological analysis

4.2.1. Granulometry

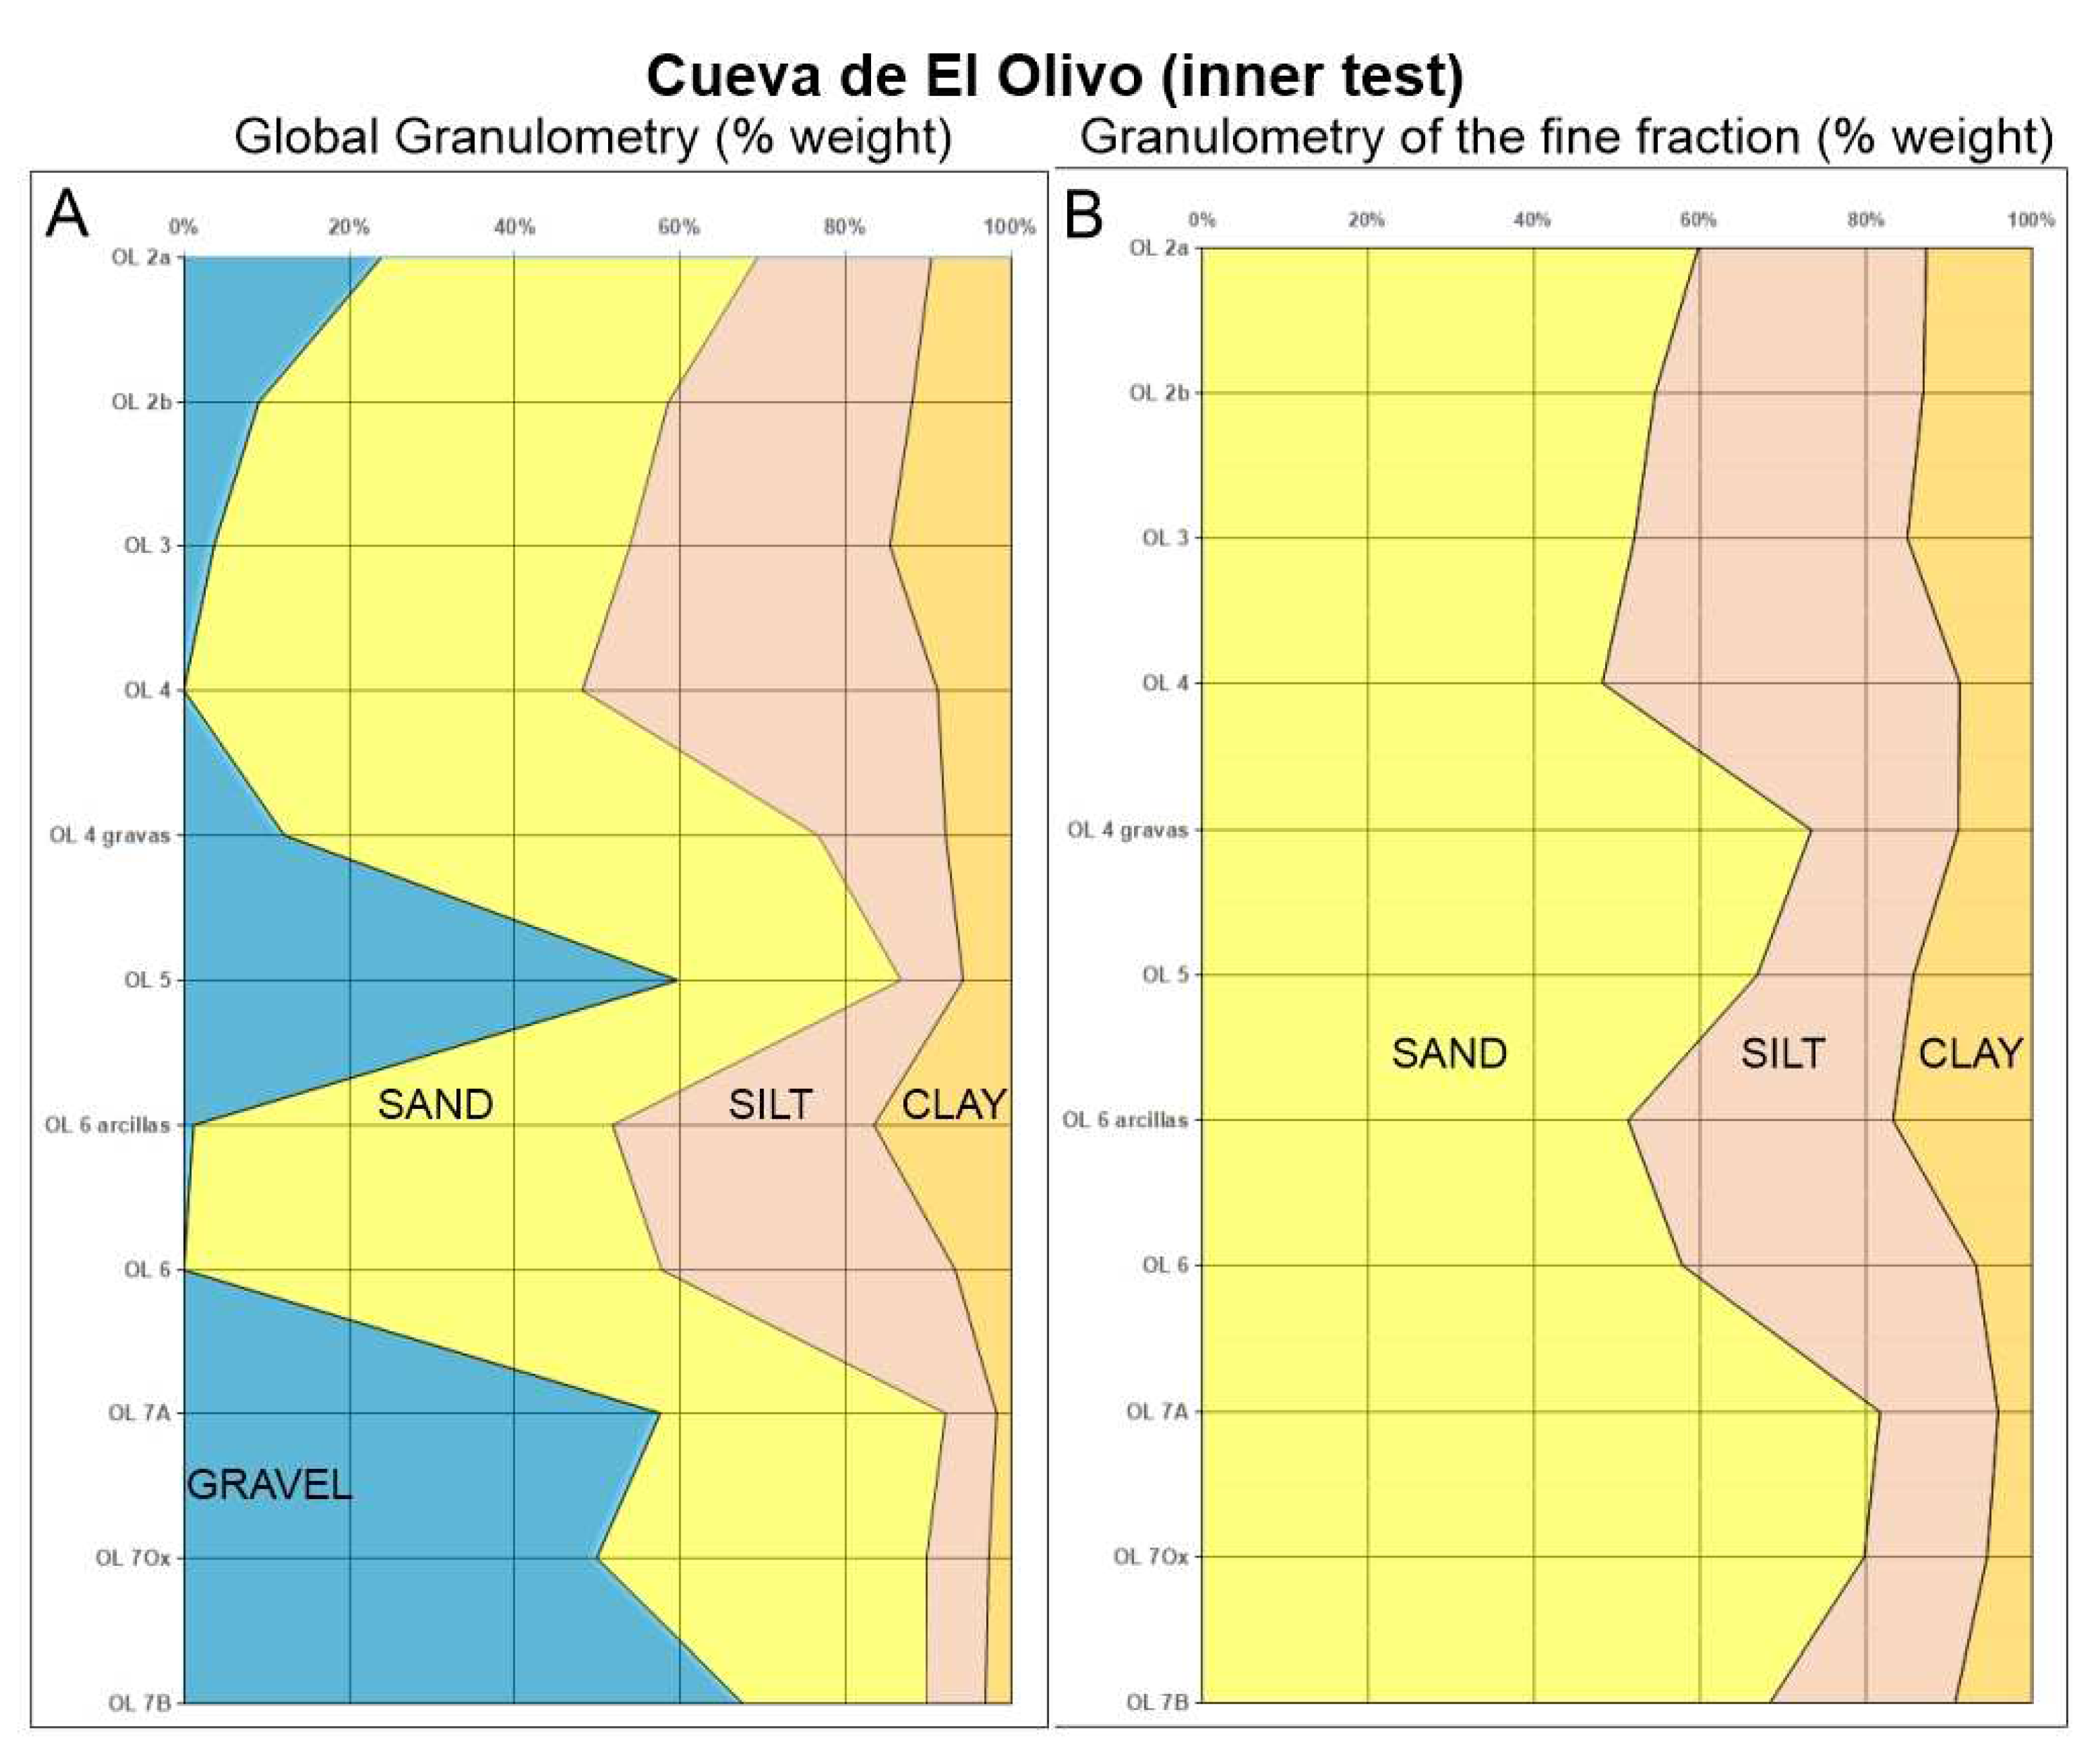
The granulometric analyses of samples from the excavation inside El Olivo Cave has identified a fining-upward detrital sequence, with a predominance of the fine fraction (sand, silt and clay), and three pulses of gravel and pebble input in the base, middle and upper part, with the latter being less intense. Sand is predominant in the fine fraction, with a higher presence in the basal and middle parts, while silt and clay increase slightly towards the top (Figure 10).
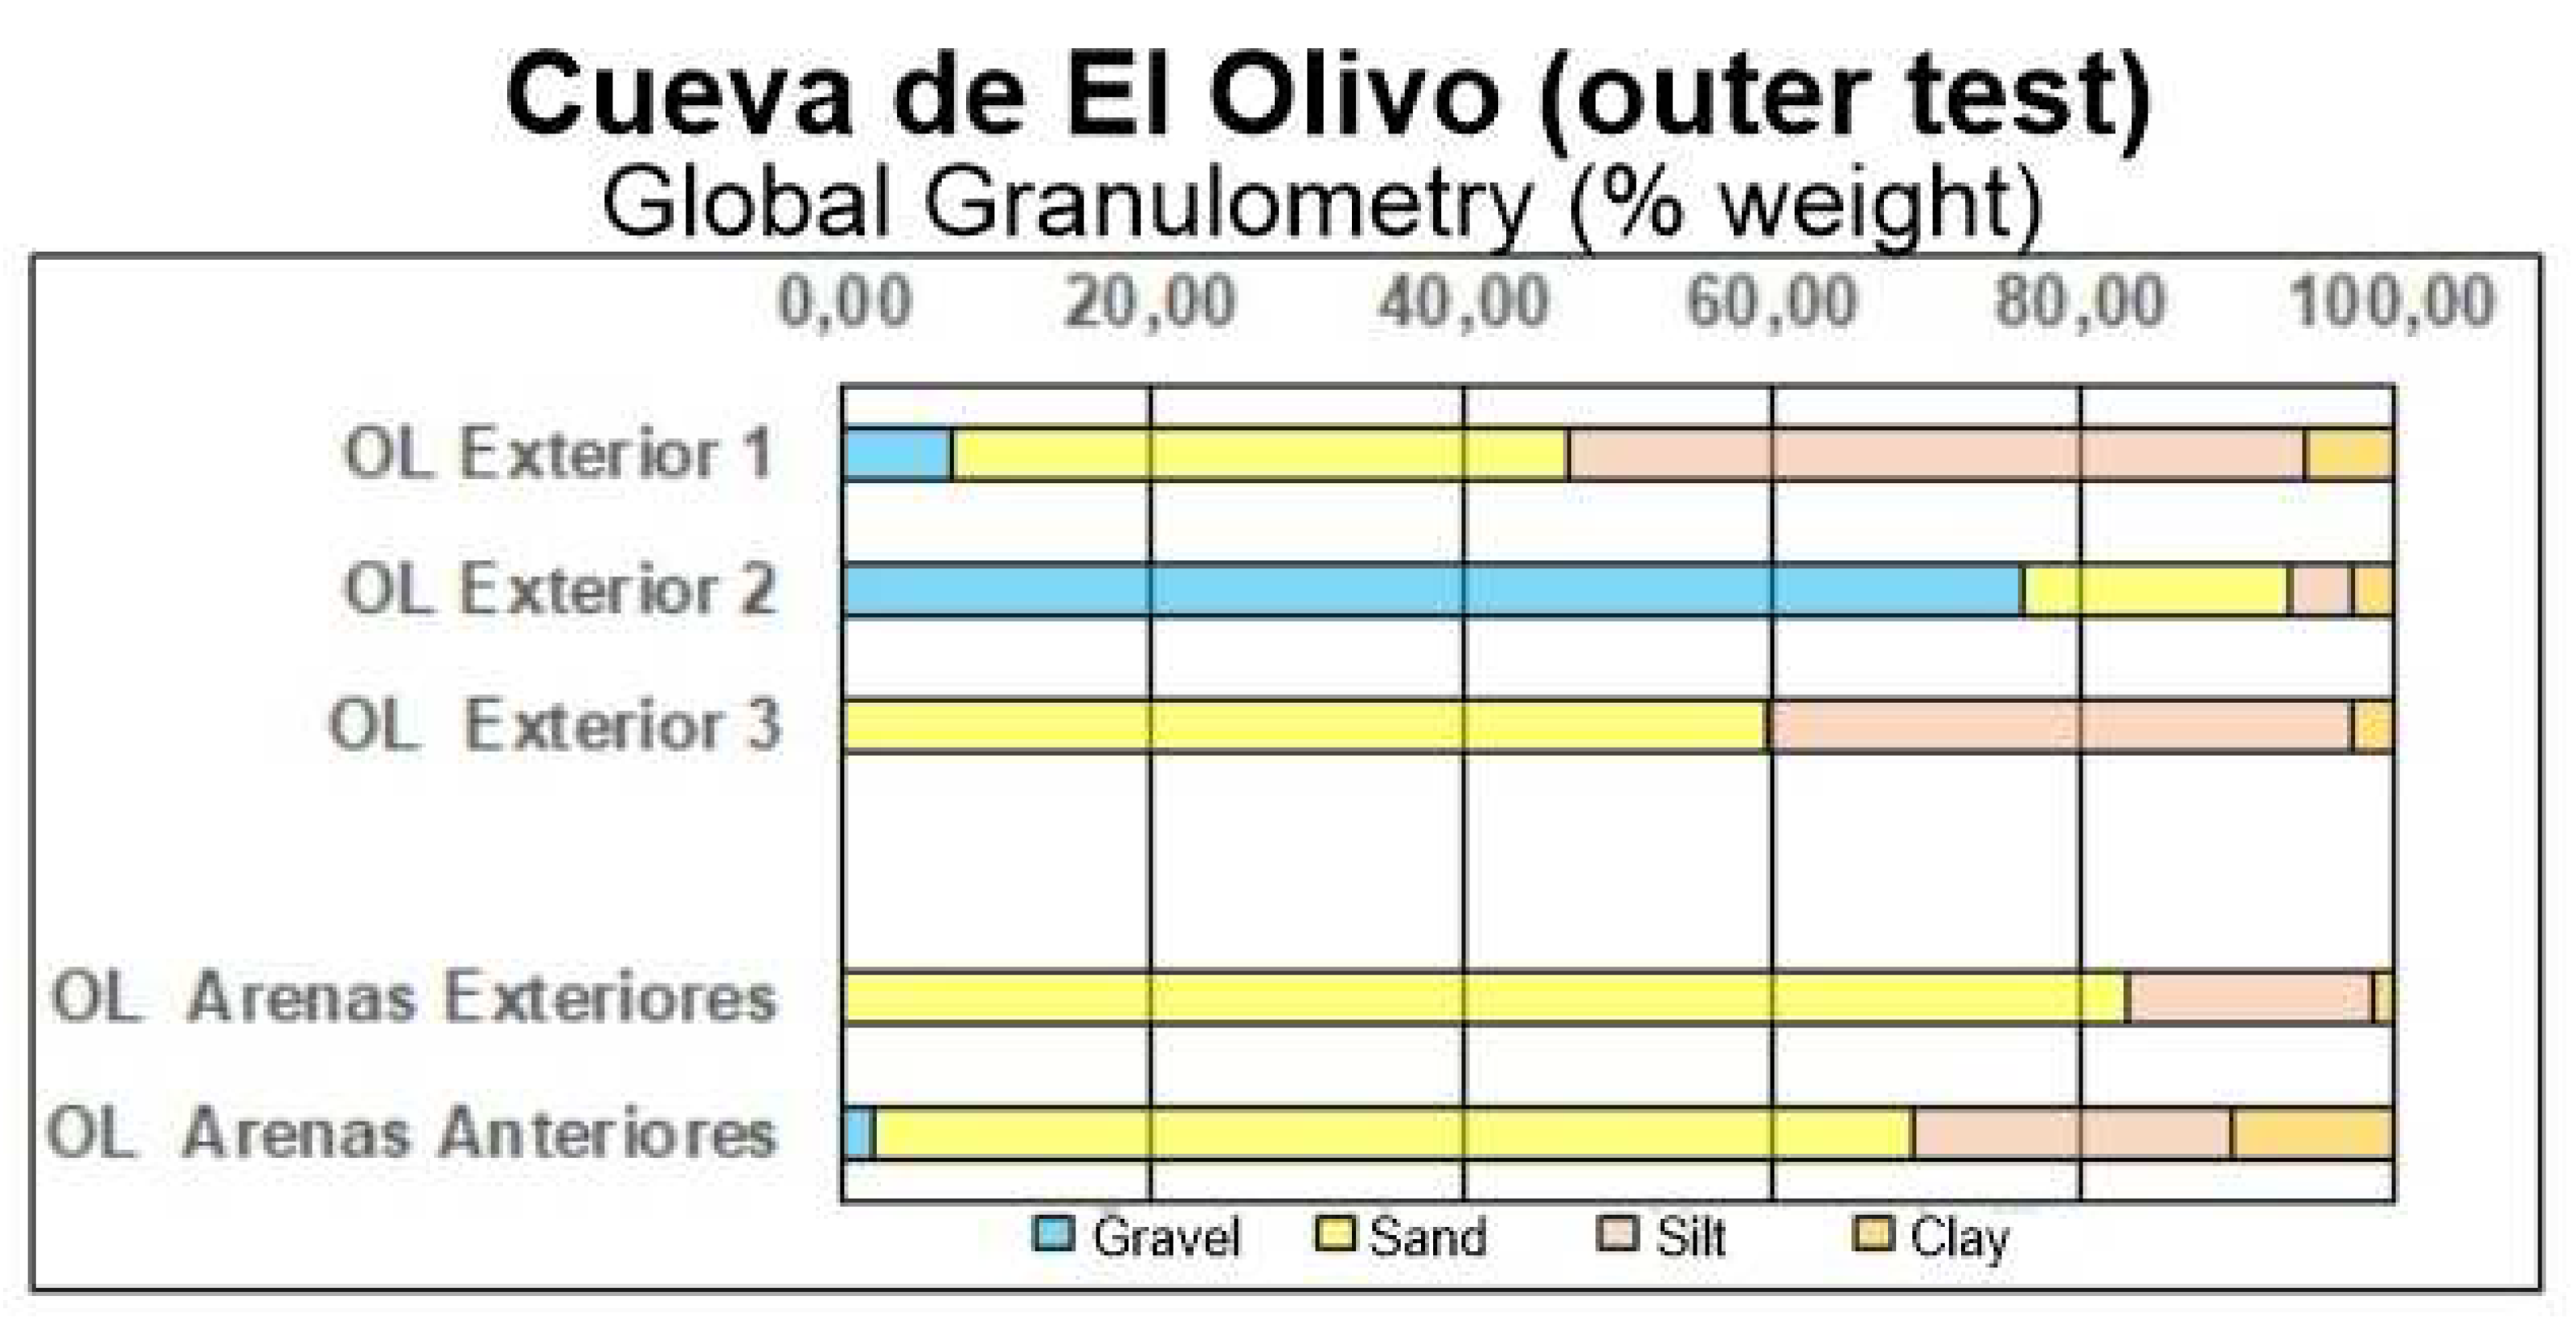
In the outer excavation, sand predominates in its lower section, whereas pebbles and gravel dominate in its middle section. Silt and clay are prevalent in the upper section (Figure 11). In the samples obtained from the interior and exterior walls of the cave, sand predominates with a low proportion of silt and clay (Figure 11).
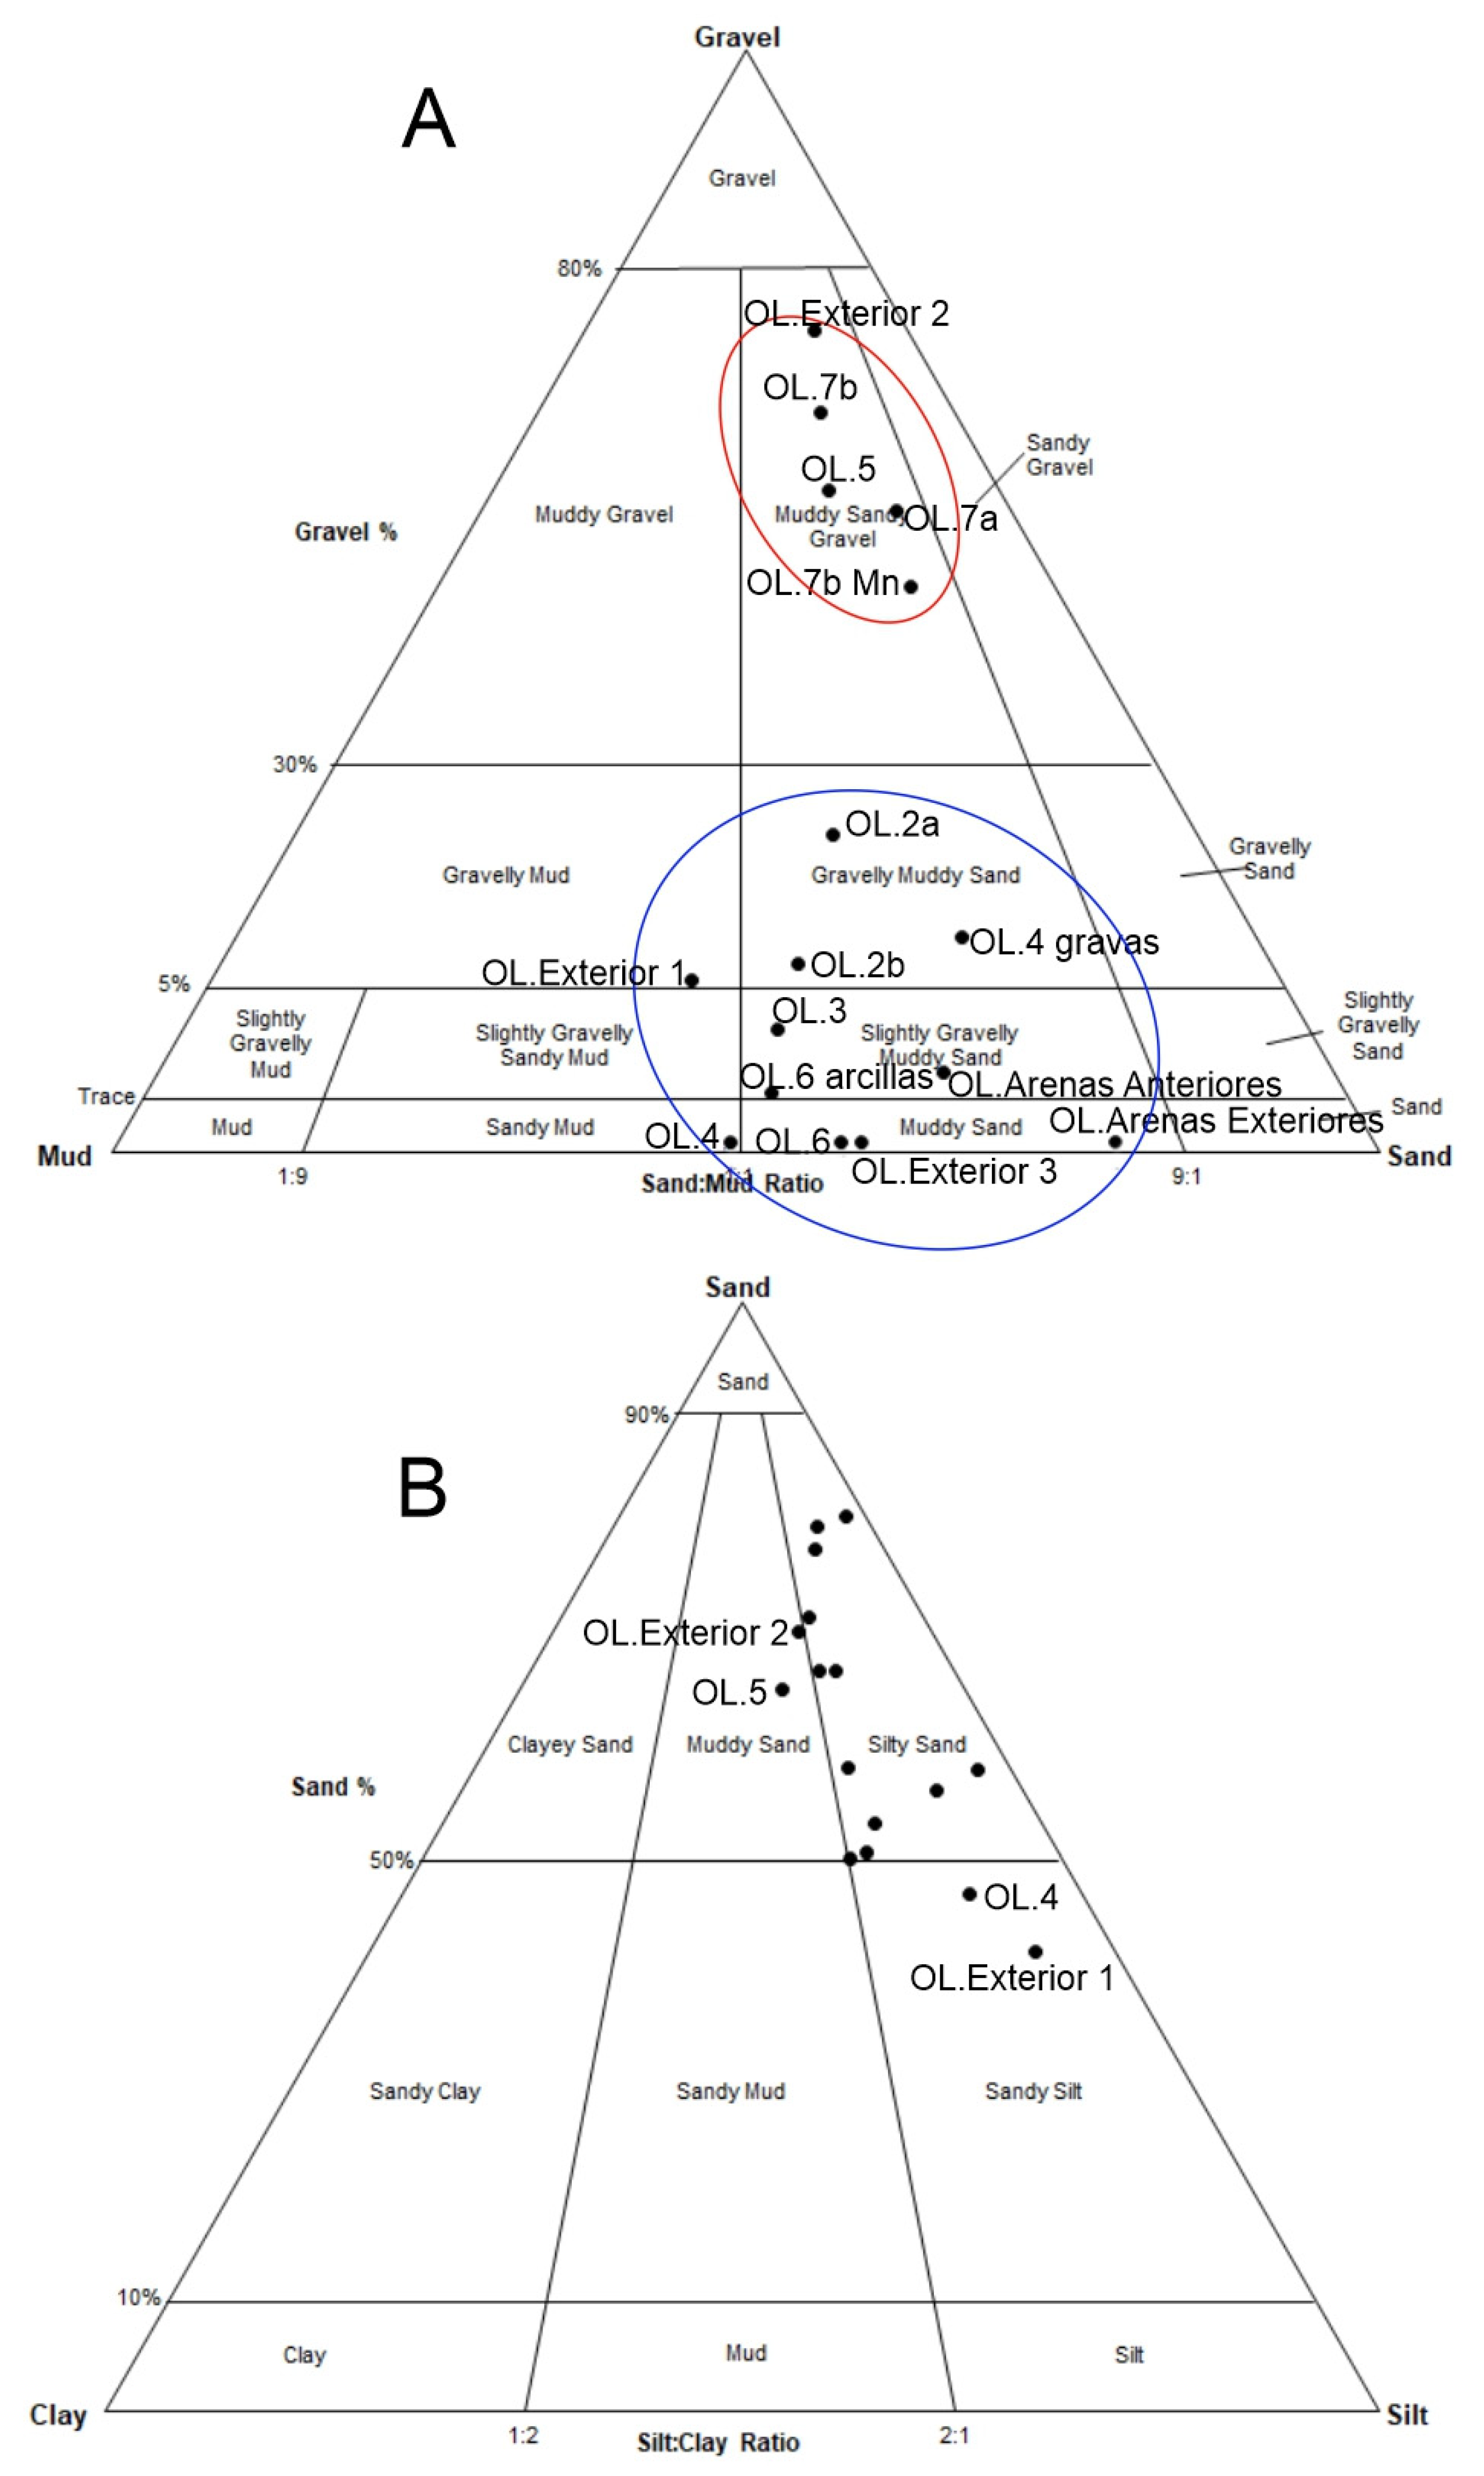
As observed in the triangular diagram representing the overall grain size distribution (gravel, sand, mud) of the samples (Figure 12 A), there is certain homogeneity in the sediments forming the levels in El Olivo Cave. They fall within the range of silty muddy sands with varying amounts of gravel and sandy gravel with silt and clay. This allows for the differentiation of two sediment groups with slightly different meanings:
  • Group A, which encompasses sediments from the textural group of muddy sandy gravel (OL.5, OL.7a, OL.7b, OL.7 Ox and OL.Exterior.2).
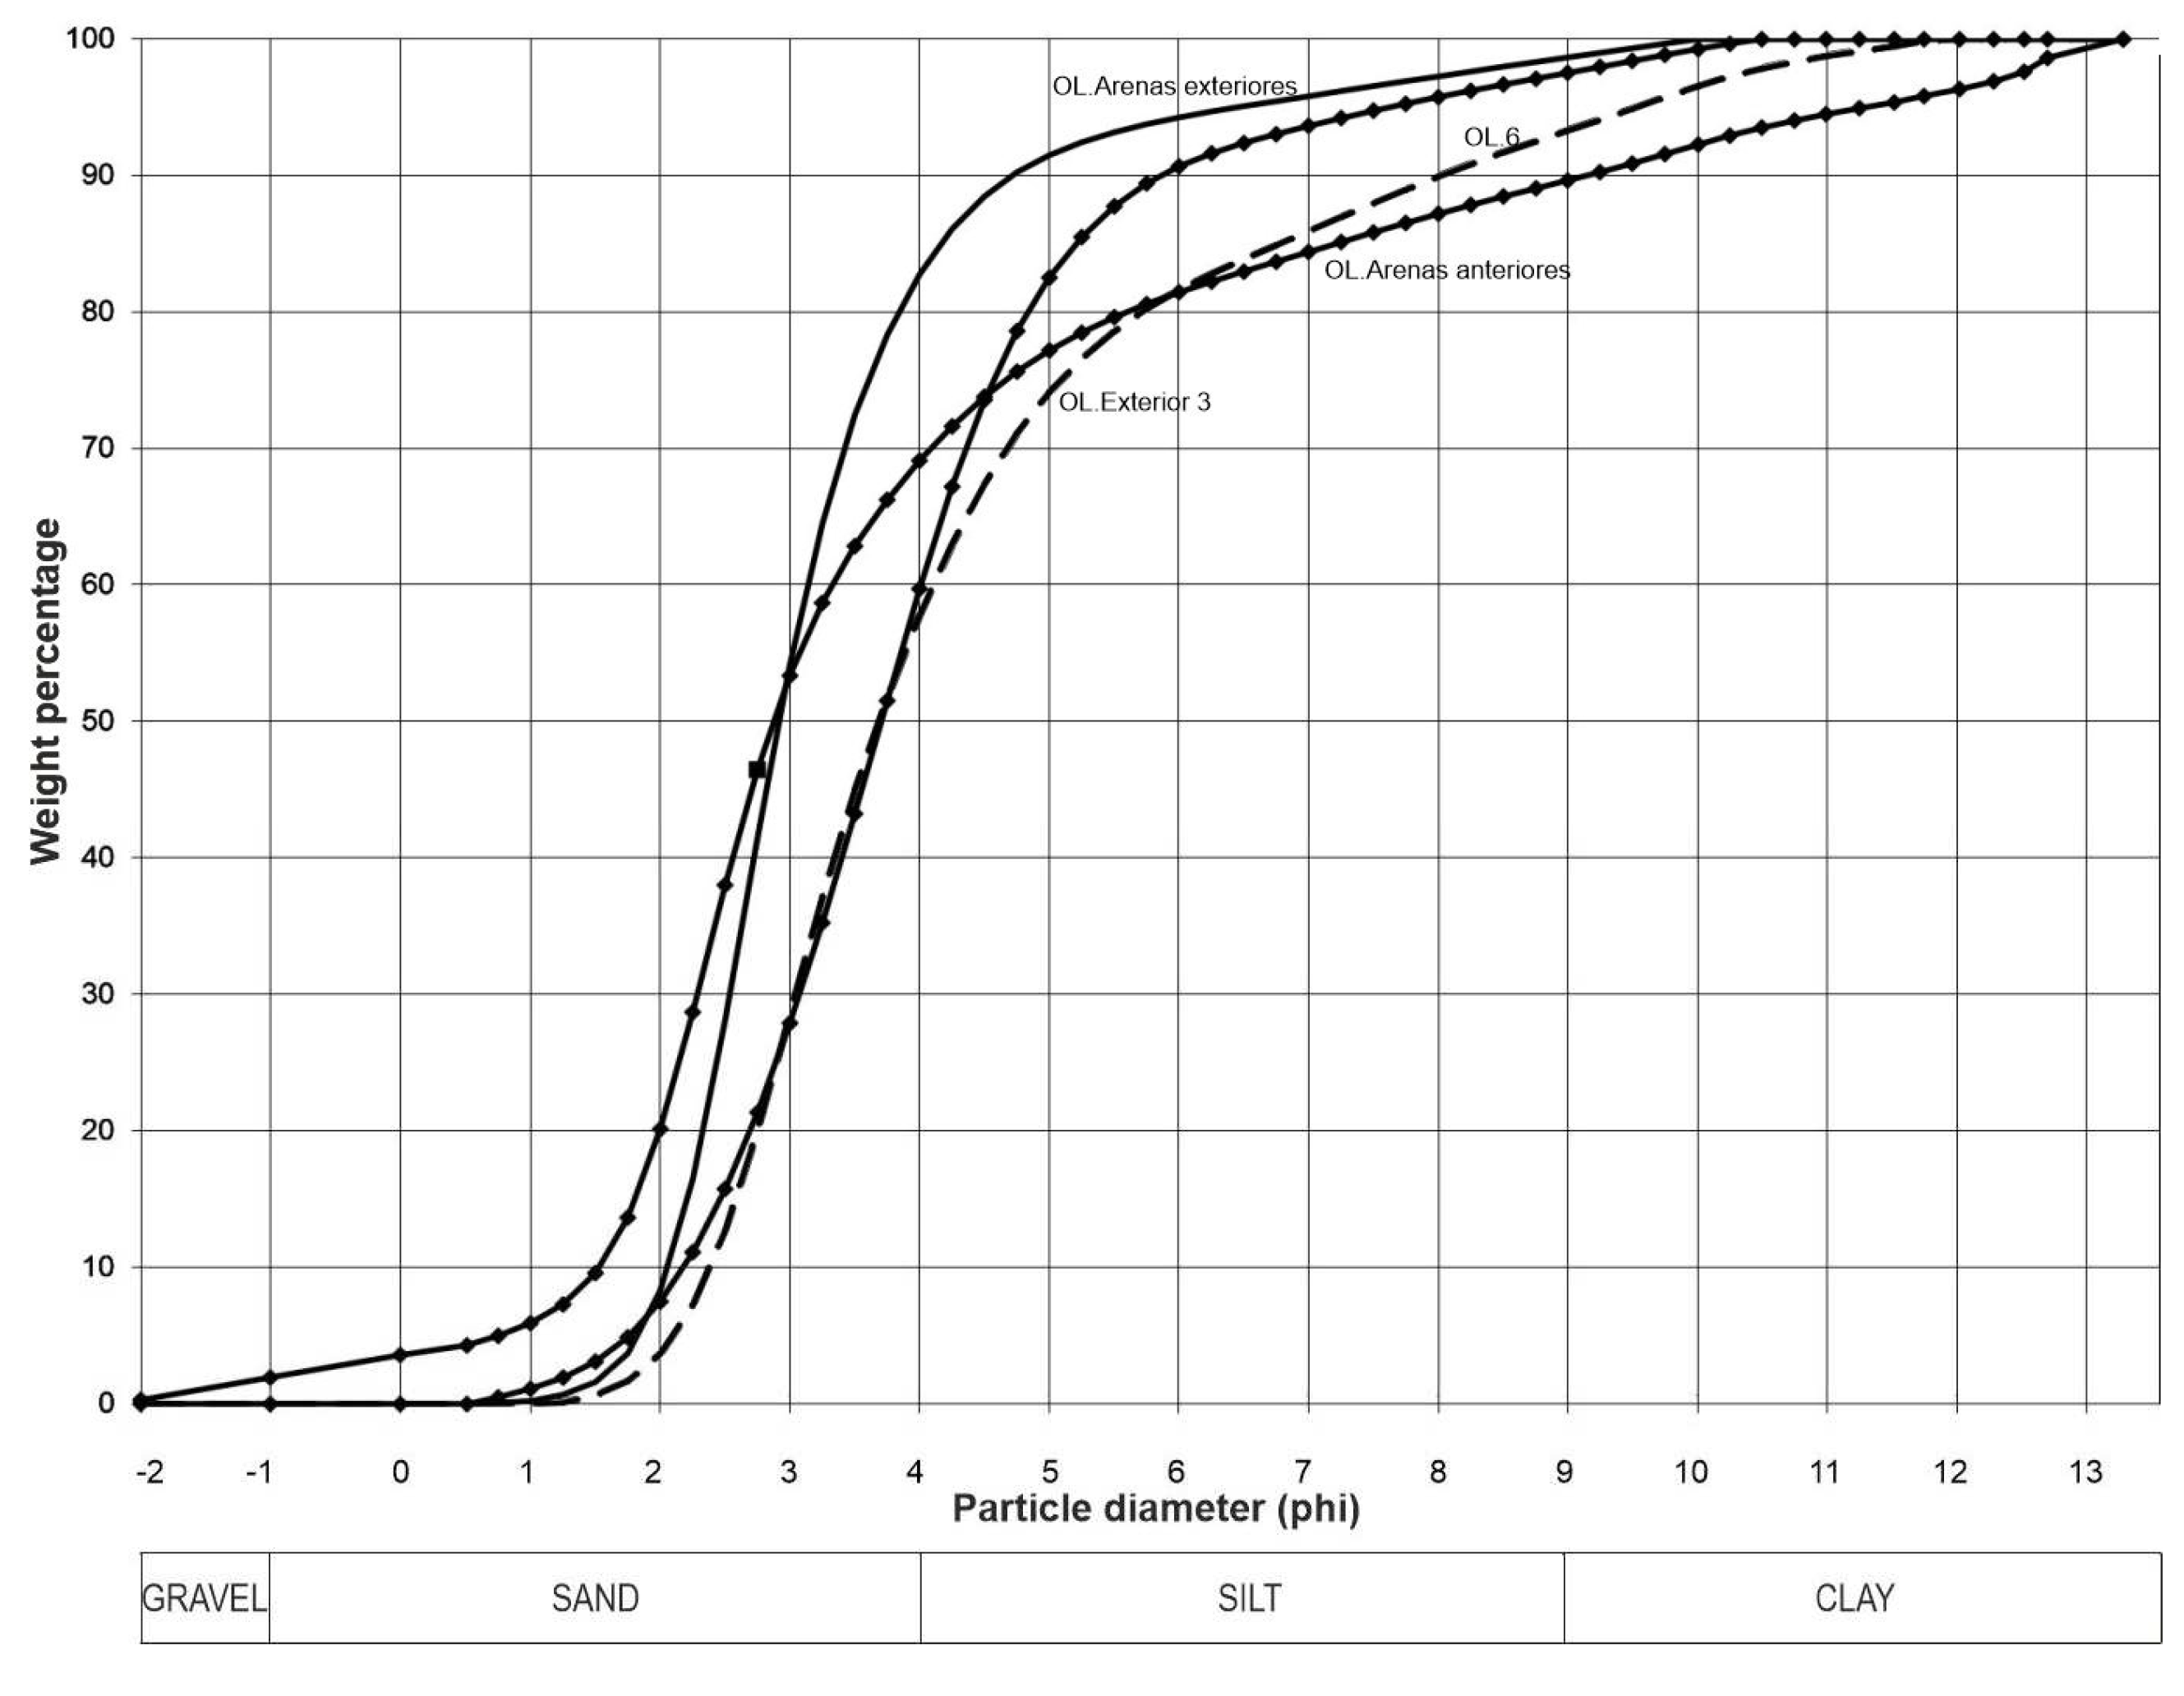
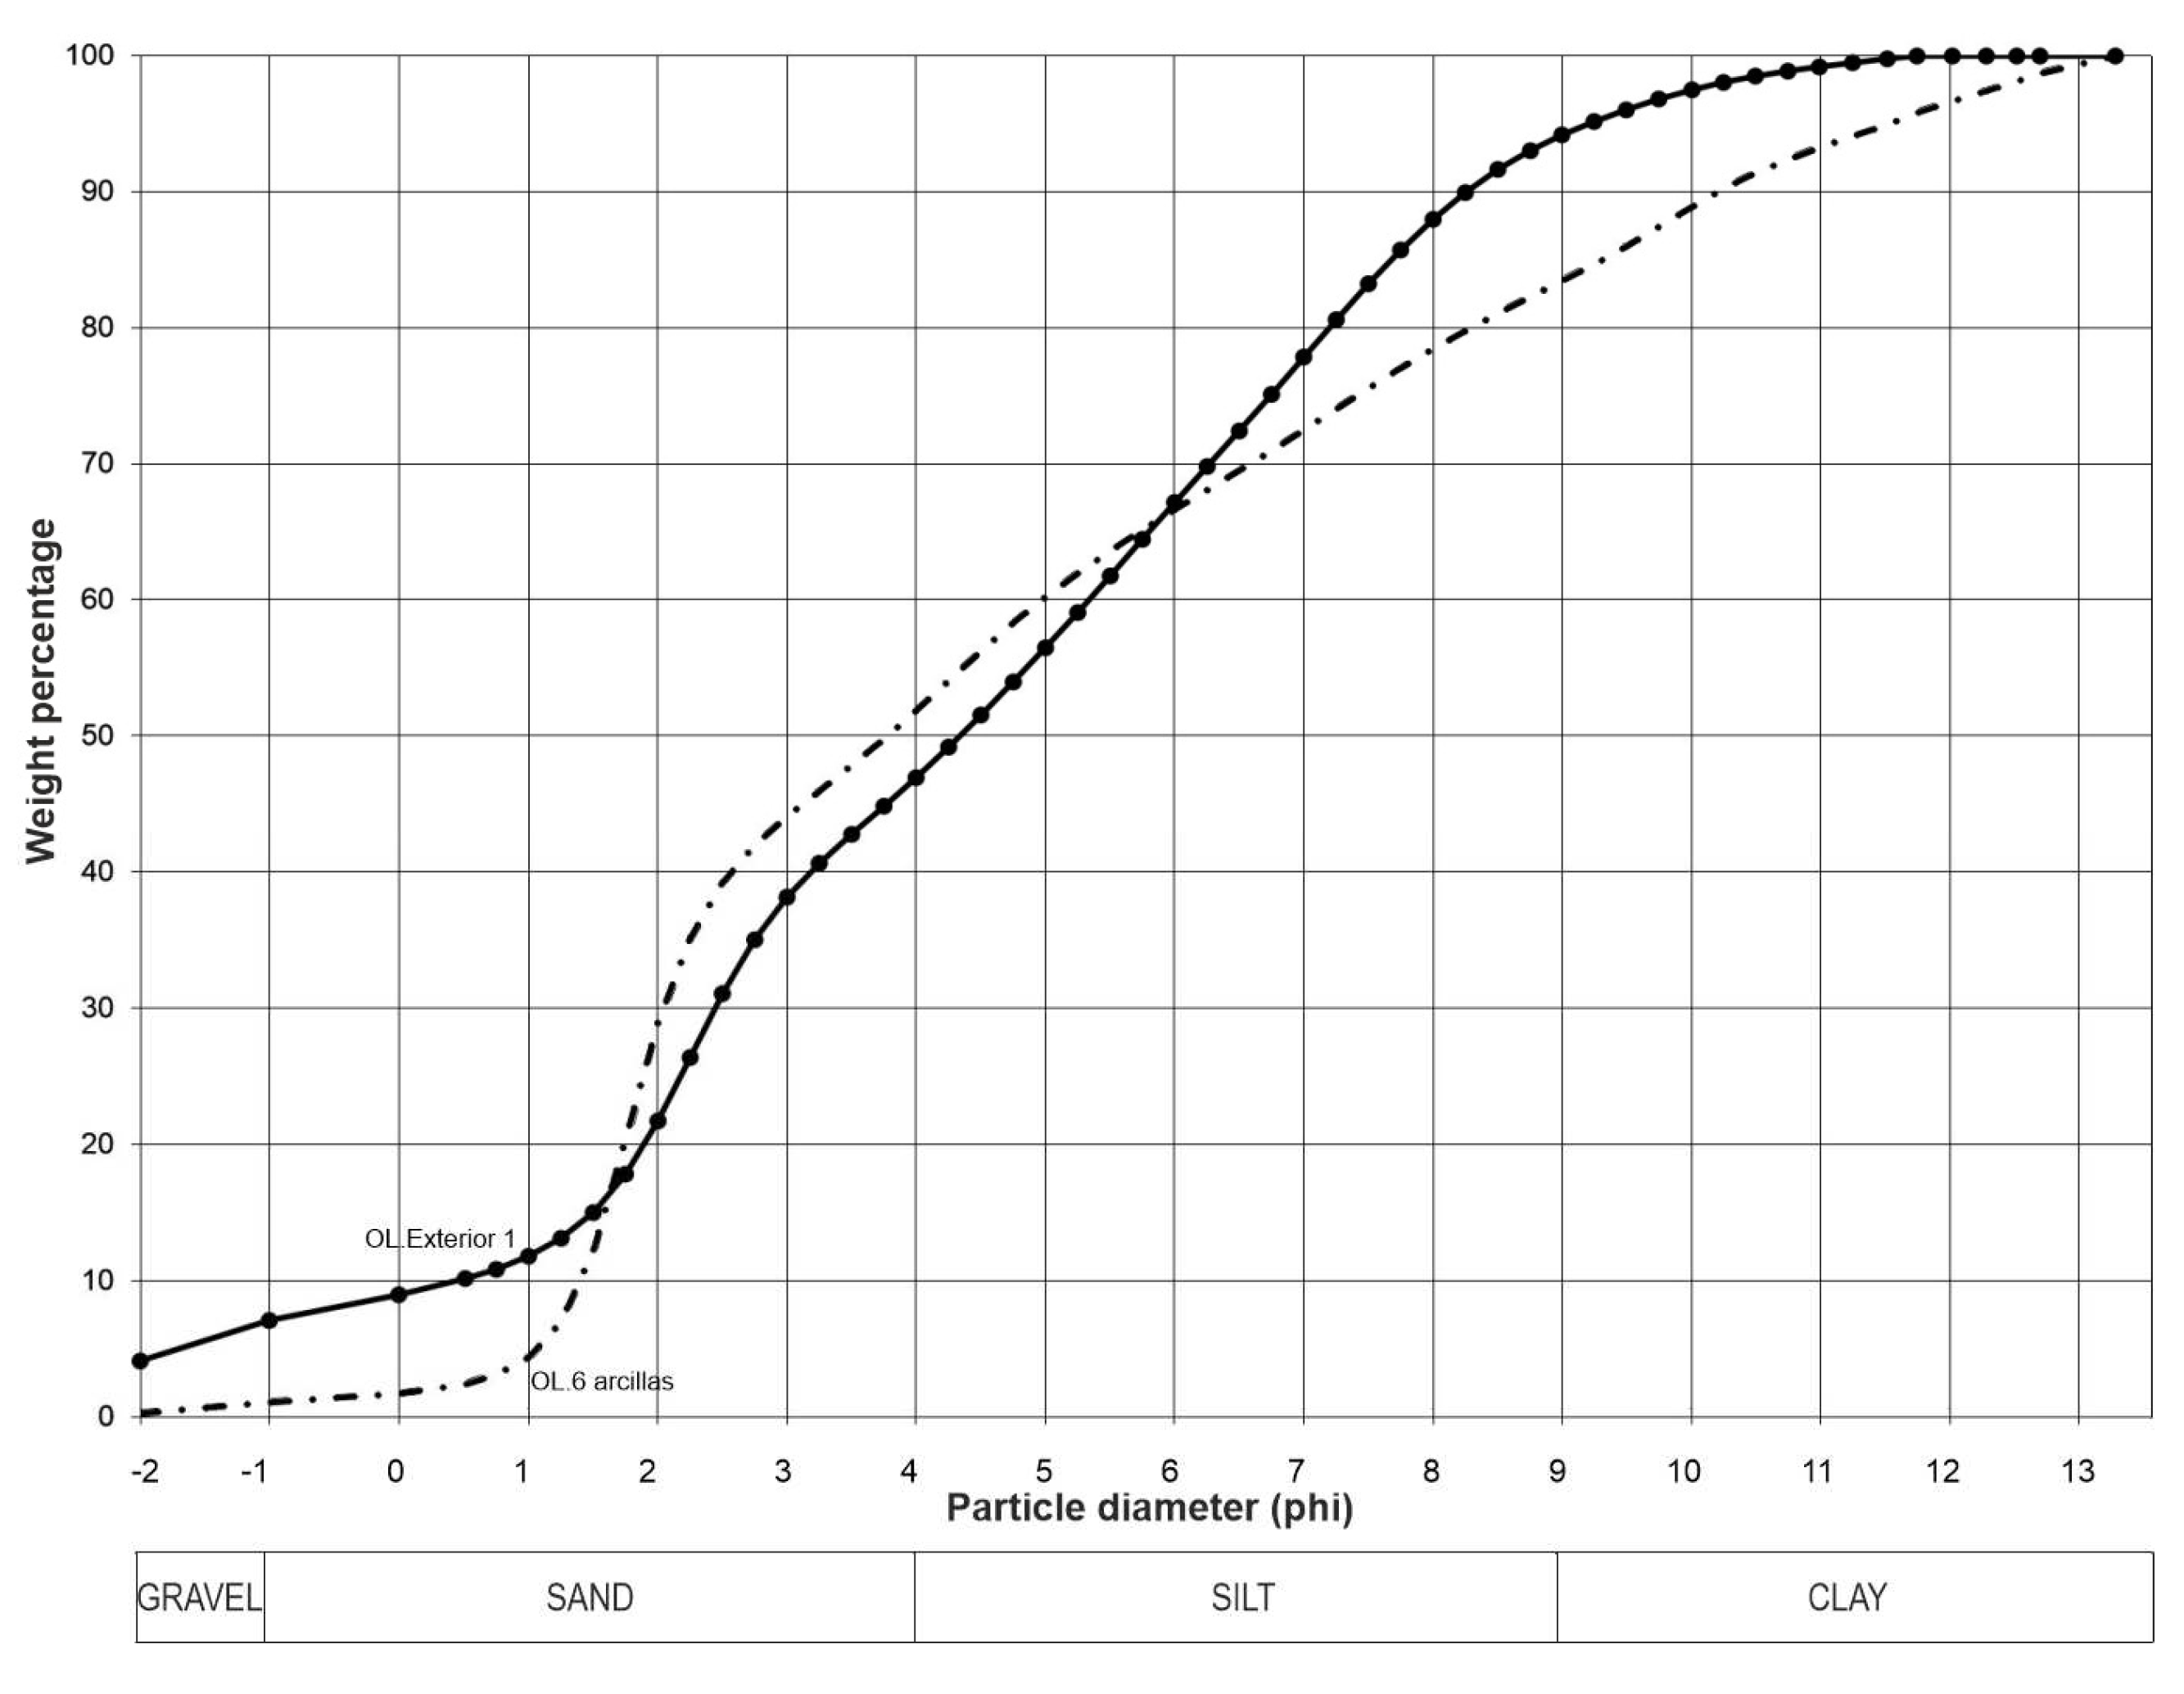
  • Group B, consisting of sediments corresponding to the textural groups of gravelly muddy sand (OL.2a, OL.2b, OL.4 gravas), slightly gravelly muddy sand (OL3, Ol.6 arcillas, OL.Arenas anteriores), muddy sand (OL.6, OL.Exterior 3 and OL.Arenas Exteriores), gravelly mud (OL.Exterior 1) and sandy mud.
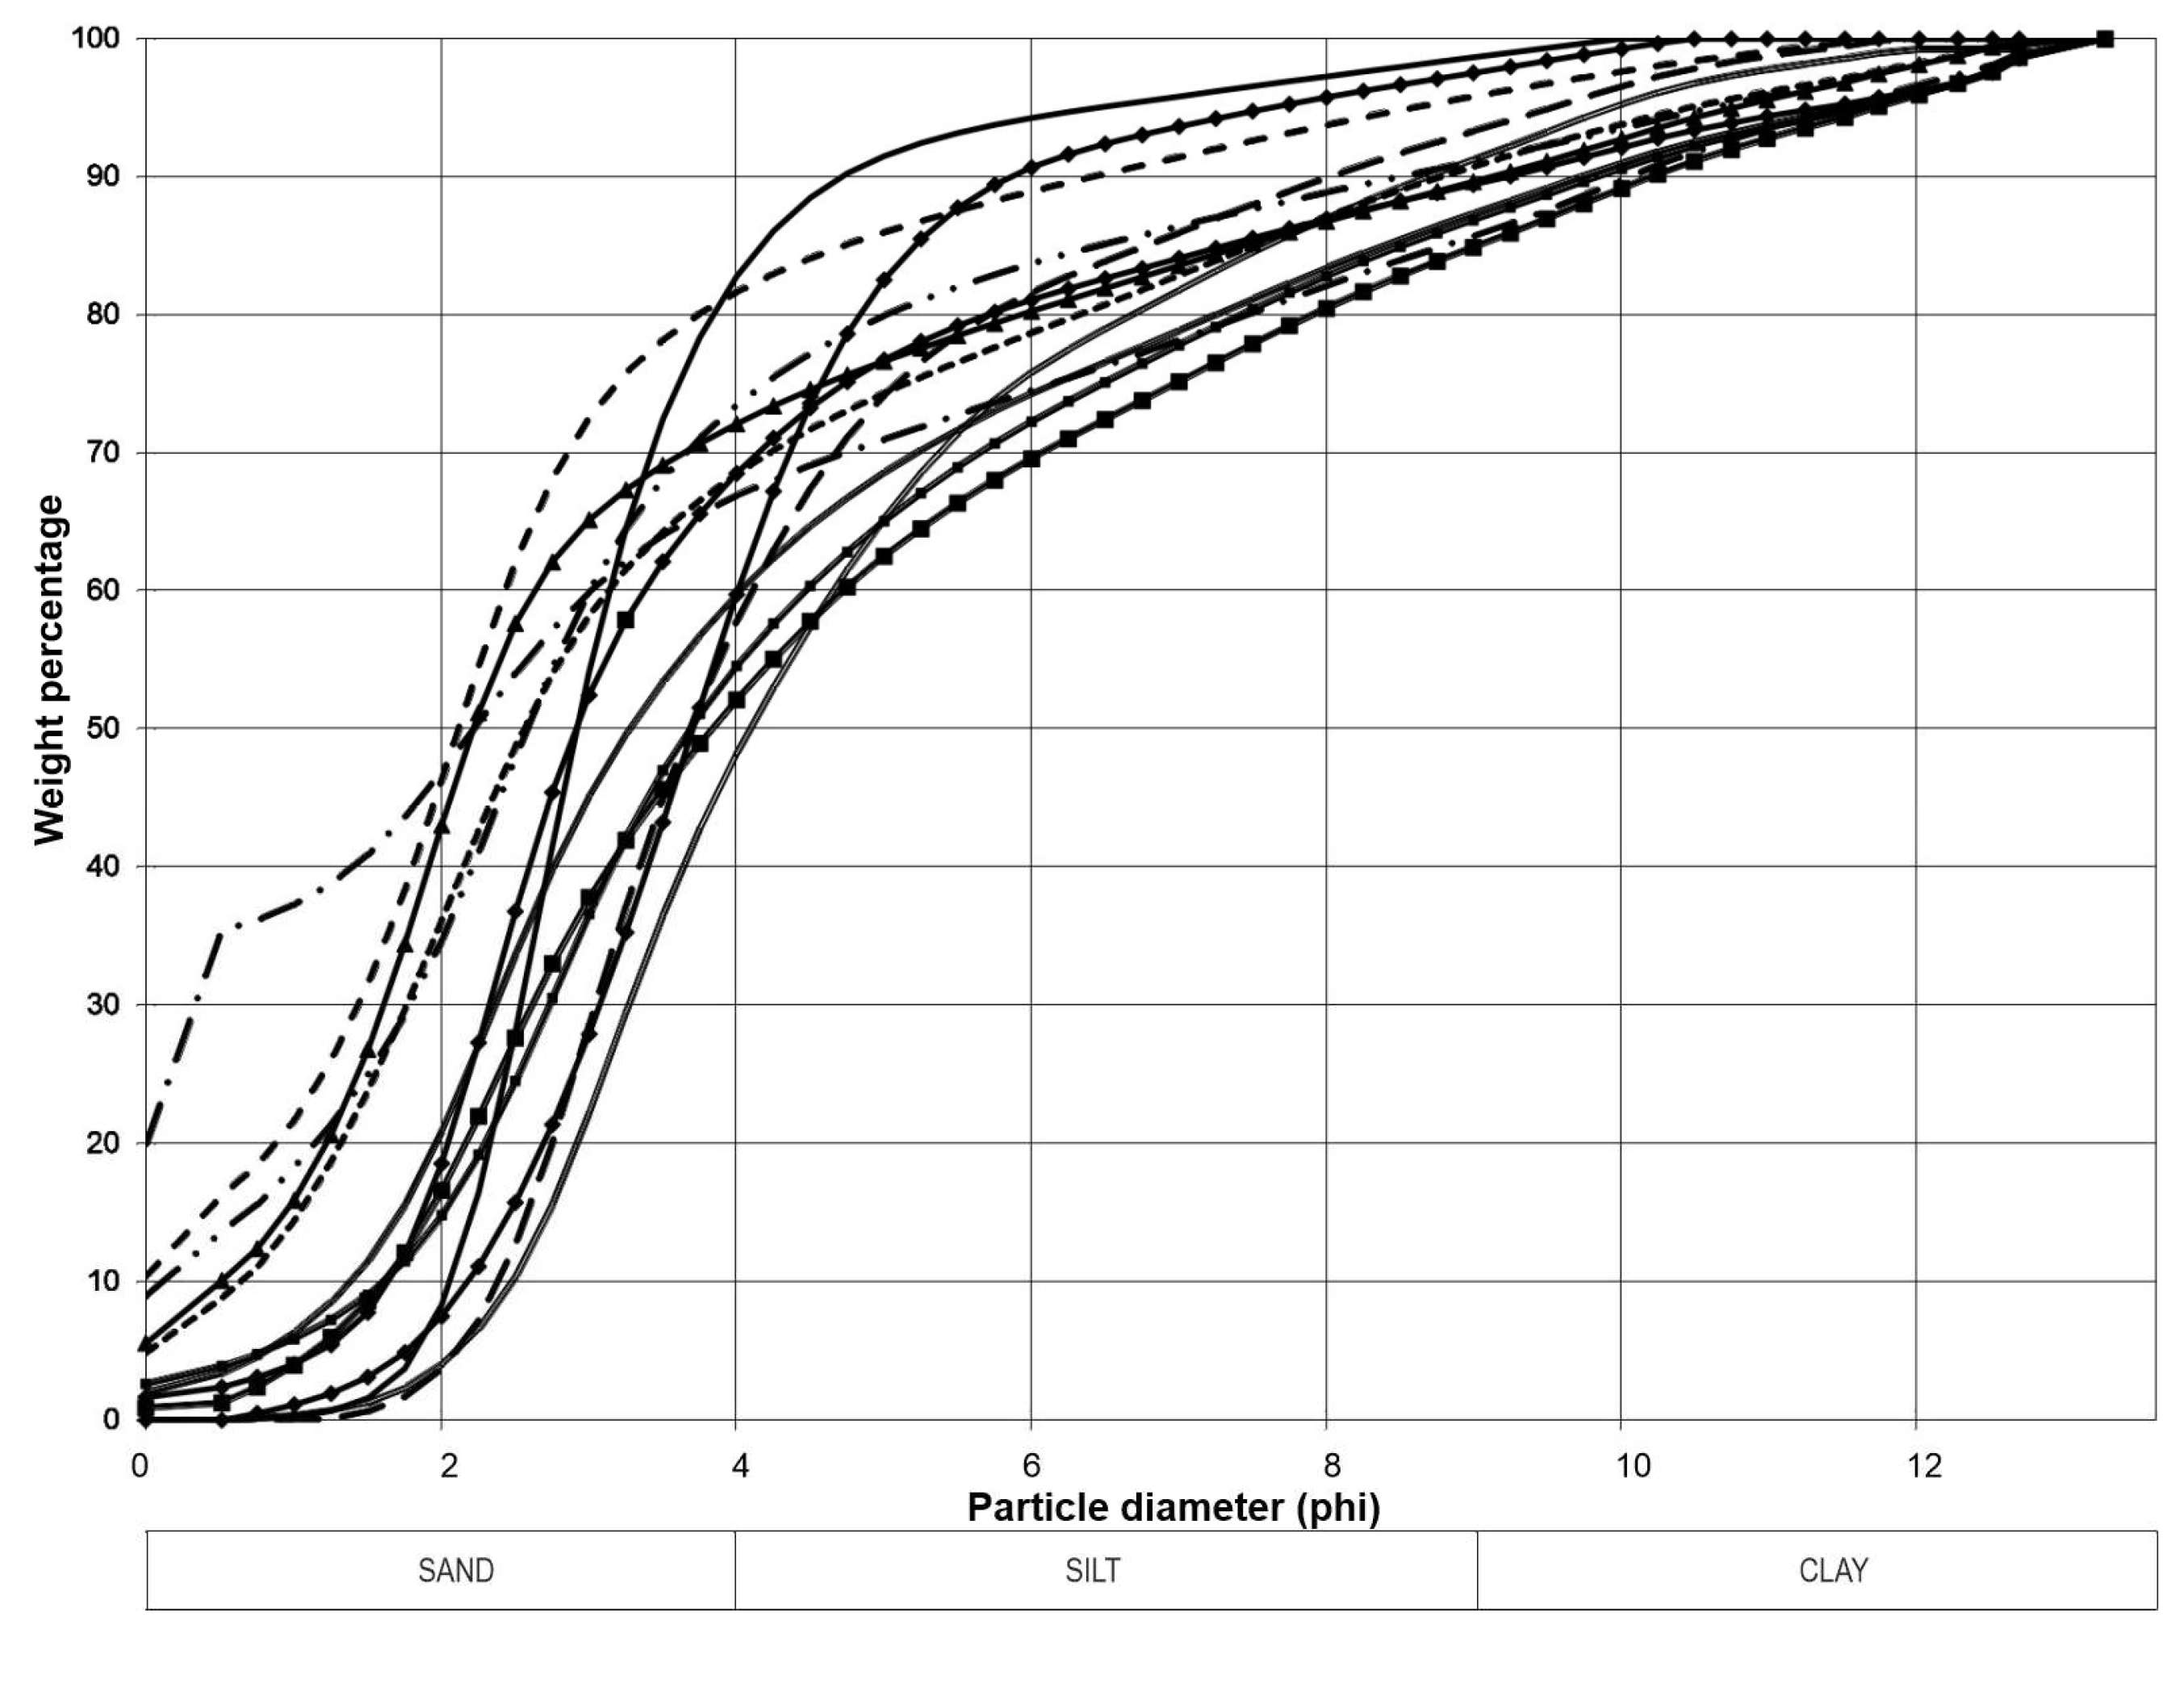
If we exclude the gravel fraction and focus on grain sizes smaller than 2 mm (sand, silt and clay) (Figure 12 B), the sediment homogeneity of the different units increases, as most of the samples fall within the group of silty sand, except for two samples that correspond to sandy silt (OL.4 and OL.Exterior 1) and muddy sand.
Both diagrams exhibit very similar characteristics to those described for the sediments of Coímbre Cave (Peñamellera Alta, Asturias) [37].
The granulometric curves of the overall fraction are also quite homogeneous, but four families can be distinguished within them:
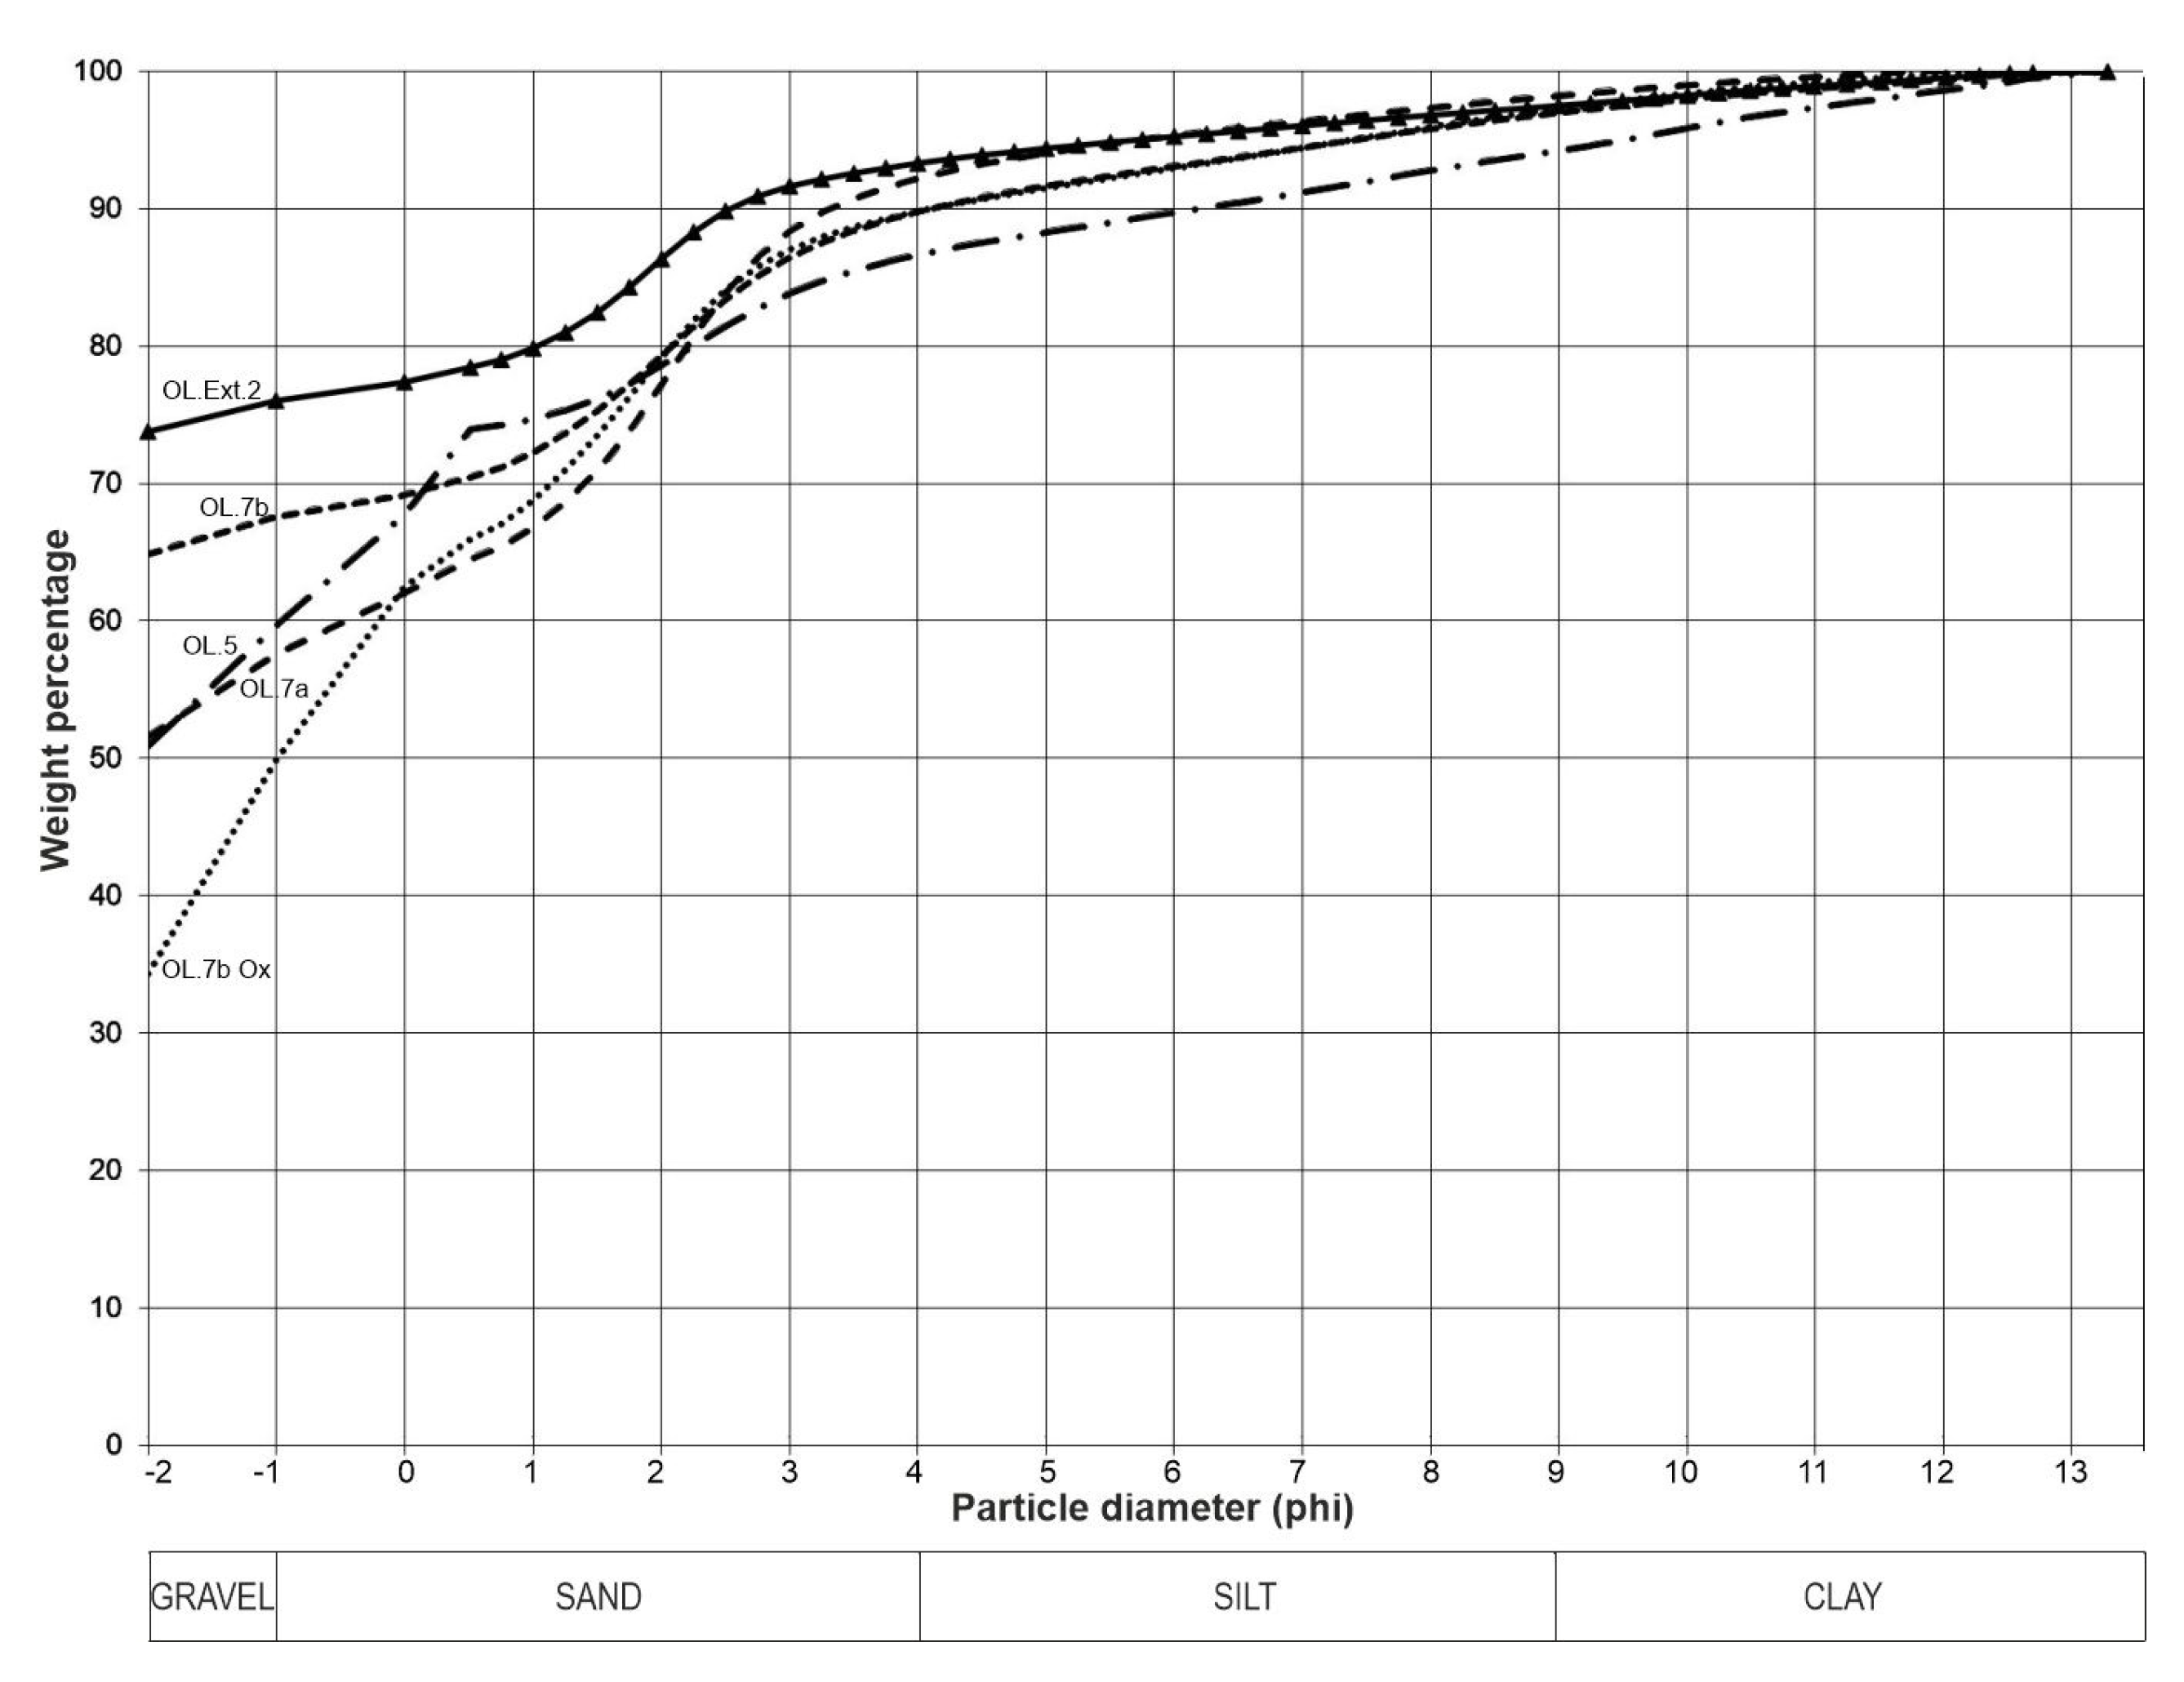
  • G-A Family: includes the samples belonging to Group A in the triangular diagram of the global fraction (OL.5, OL.7a, OL.7b, OL.7 Ox, OL.Exterior 2), which exhibit curves with an initial segment dominated by fine gravel and very coarse to fine sand, accounting for approximately 80 to 90% of the sediment. This is followed by a flatter segment containing very fine sands, silts and clays, which together make up around 20% of the sediment (Figure 13). It corresponds to two types of deposits: on the one hand, clast-supported conglomerates with limited matrix, indicating high-energy environments with subsequent settling of the finer particles that make up the matrix (OL.5 and OL.Exterior 2); and on the other hand, debris flow deposits with a minimal matrix that include both fluvial-derived and autochthonous clasts.
  • G-B1 Family: it includes the samples OL.2a, OL.2b, OL.3, OL.4 and OL.4 gravas, which exhibit sigmoidal curves with three well-defined segments: an initial flat segment with varying presence of coarse and medium-grained sands, a steep middle segment with abundant fine sands and coarse silts; and a flat final segment with the remaining silts and clays (Figure 14). These curves indicate the presence of an essential population centered around fine sand and coarse silt, accompanied by silts, clays and varying amounts of coarse sands and gravels. They are indicative of a typically fluvial environment with high to medium energy, characterized by freight transport through reptation, saltation and suspension.
  • G-B2 family: it includes samples OL.6, OL.Exterior 3, OL.Arenas Anteriores and OL.Arenas Exteriores, which exhibit curves with a strongly sigmoidal shape with three distinct sections. The first section is relatively flat and includes fine gravels and very coarse, coarse and medium sands. The second section is steep and rapidly ascending, ranging from fine sands to coarse silts. The third section is again relatively flat and consists of the remaining silts and clays, extending to clays (Figure 15). These sections indicate the presence of a dominant population, the central one composed of fine sands and very coarse silts, transported by saltation and suspension. These curves are typical of high-energy fluvial environments with a high sorting capacity.
  • G-B3 family: it includes the samples OL.Exterior 1 and OL.6 arcillas, which exhibit slightly sigmoidal curves. The first section is relatively flat and includes fine gravel and very coarse sand. The second section is steep and corresponds to an increase in the remaining sands until reaching 50% of the sample. The final section represents the remaining portion of the sample, consisting of silt and clay (Figure 16). This corresponds to fluvial sedimentation where significant settling follows the initial bedload deposition.
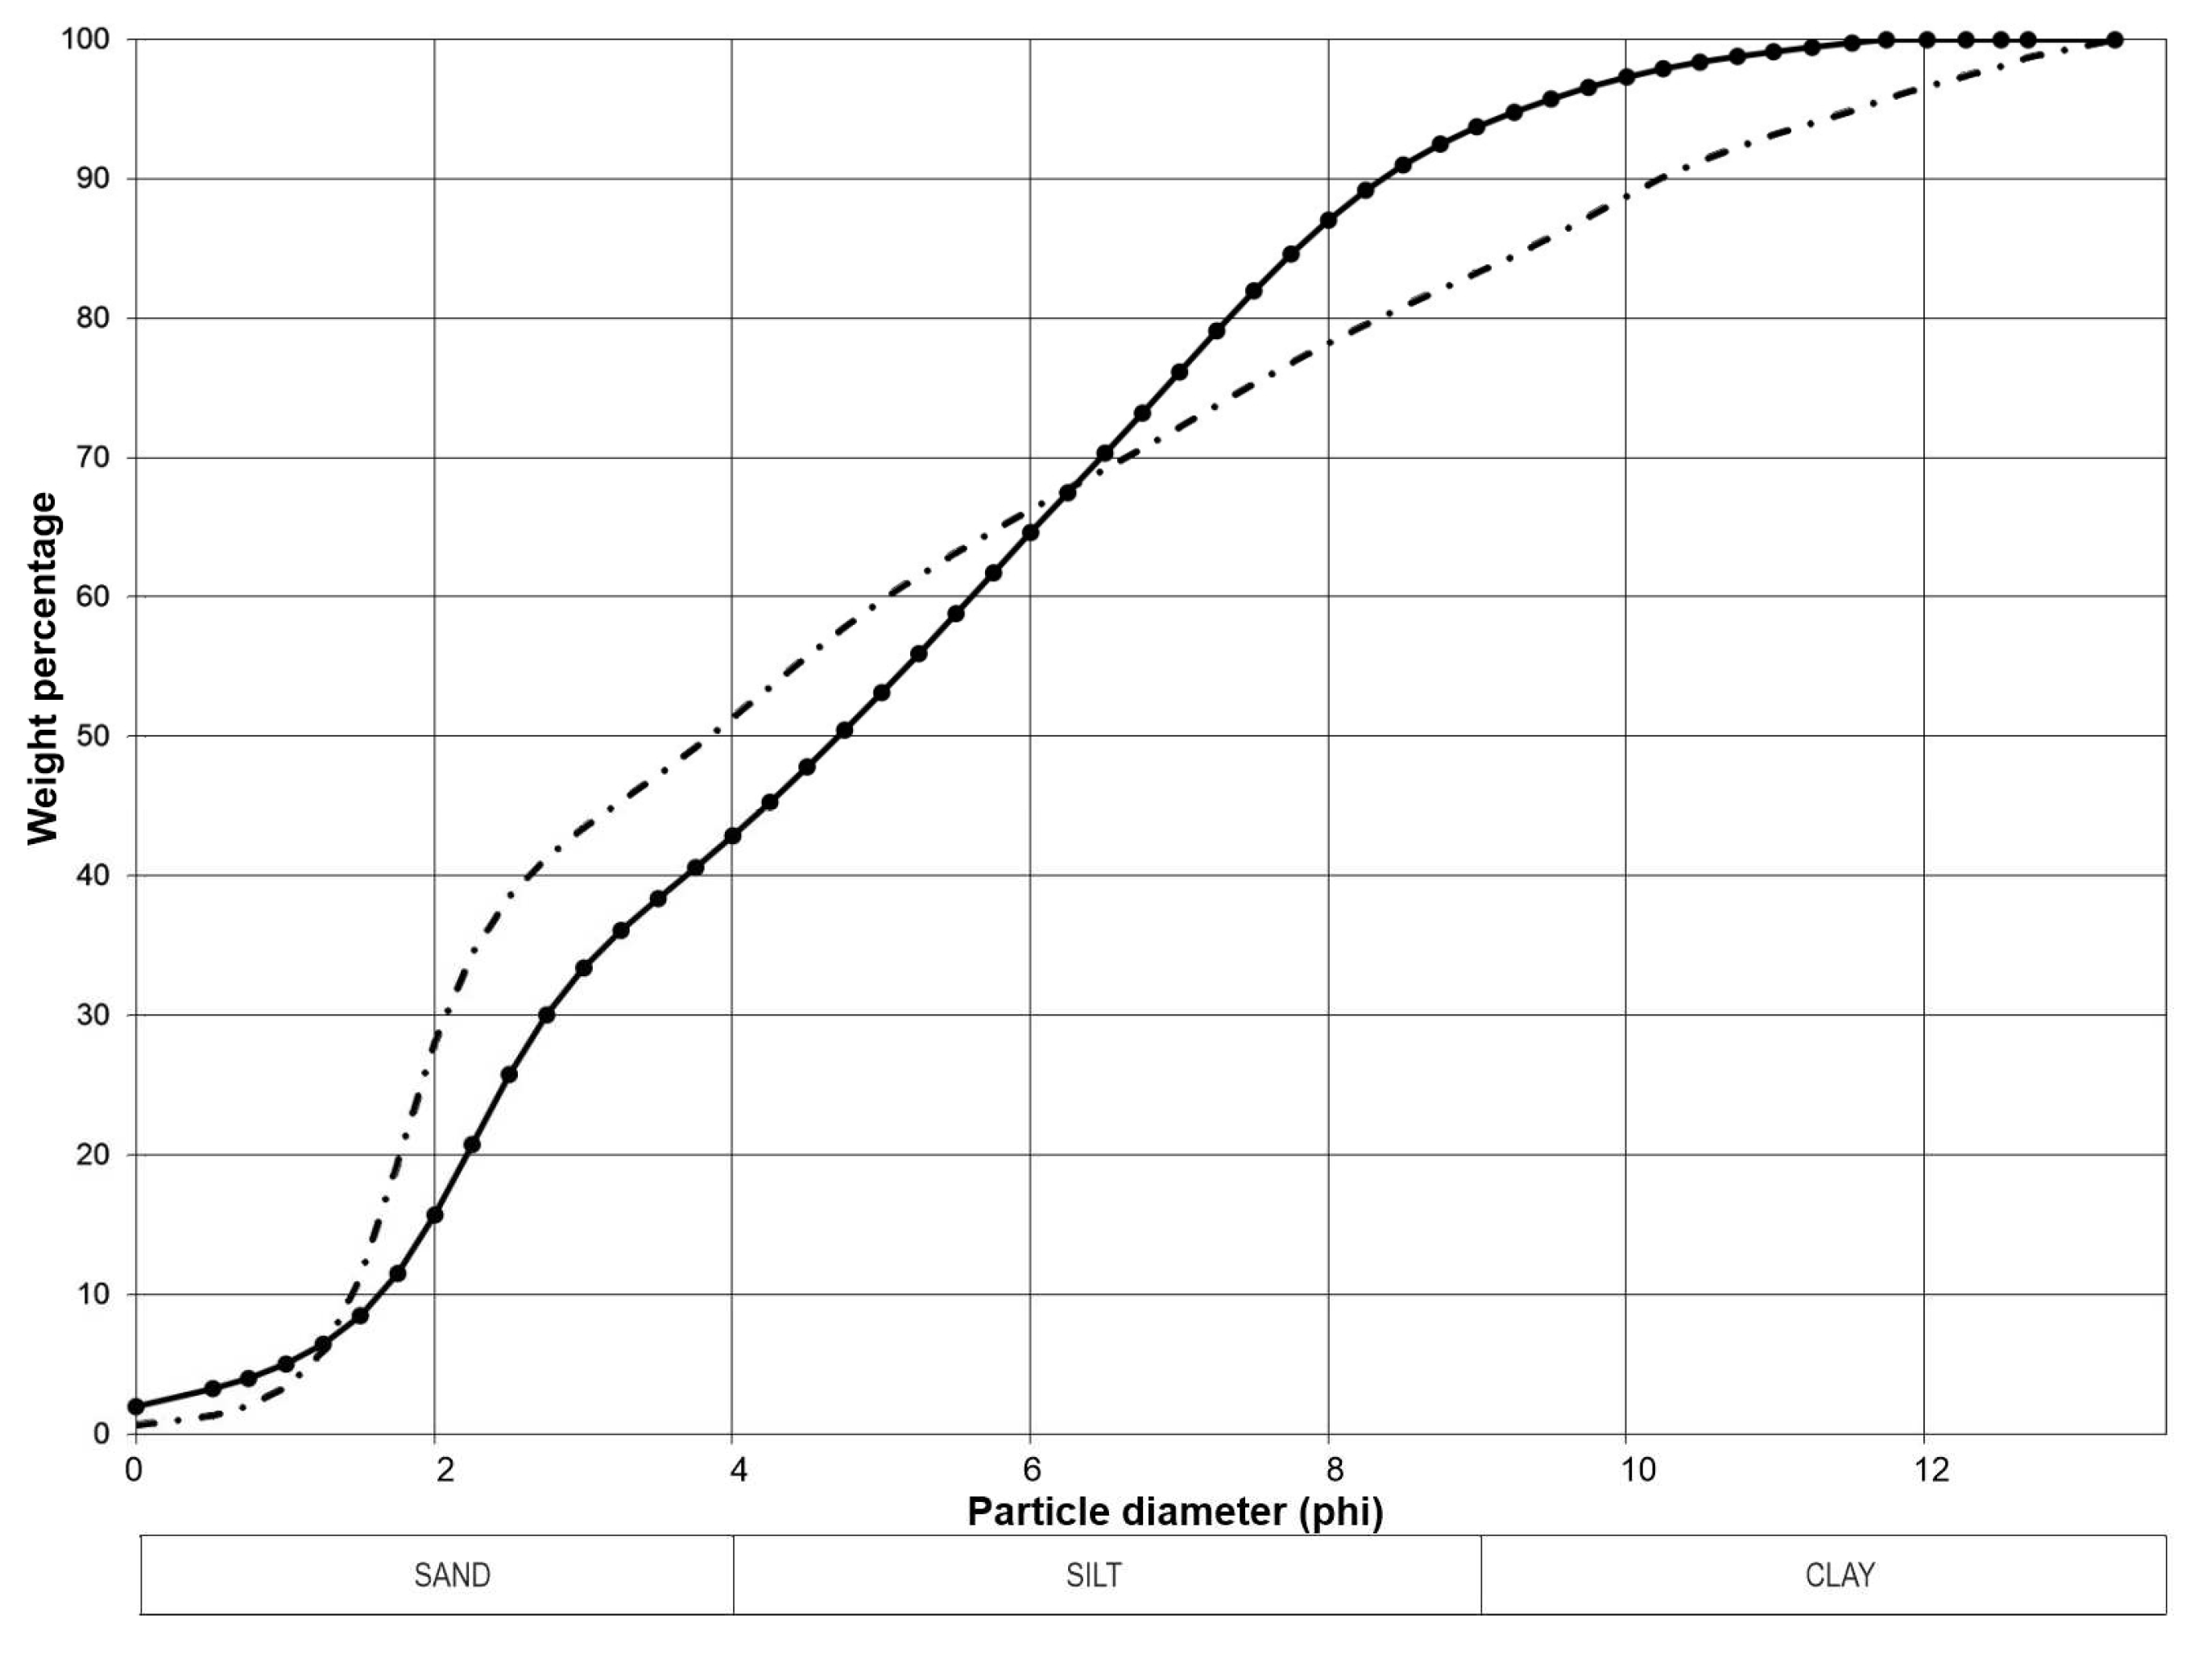
In the curves of the fine fraction (< 2 mm), two families can be distinguished:
  • F-1 family: it includes the curves of the samples from G-A, G-B1 and G-B2 (Figure 17).
  • F-2 family: it is identical to the G-B3 family of the coarse fraction (OL.6 arcillas, OL.Exterior.1) (Figure 18).
The morphological characteristics of the curves in the described families, both in the overall fraction and in the fine fraction, show significant similarities with the grain size curves of predominantly sandy fluvial sediments from Coímbre Cave [37].

4.2.2. Mineralogy

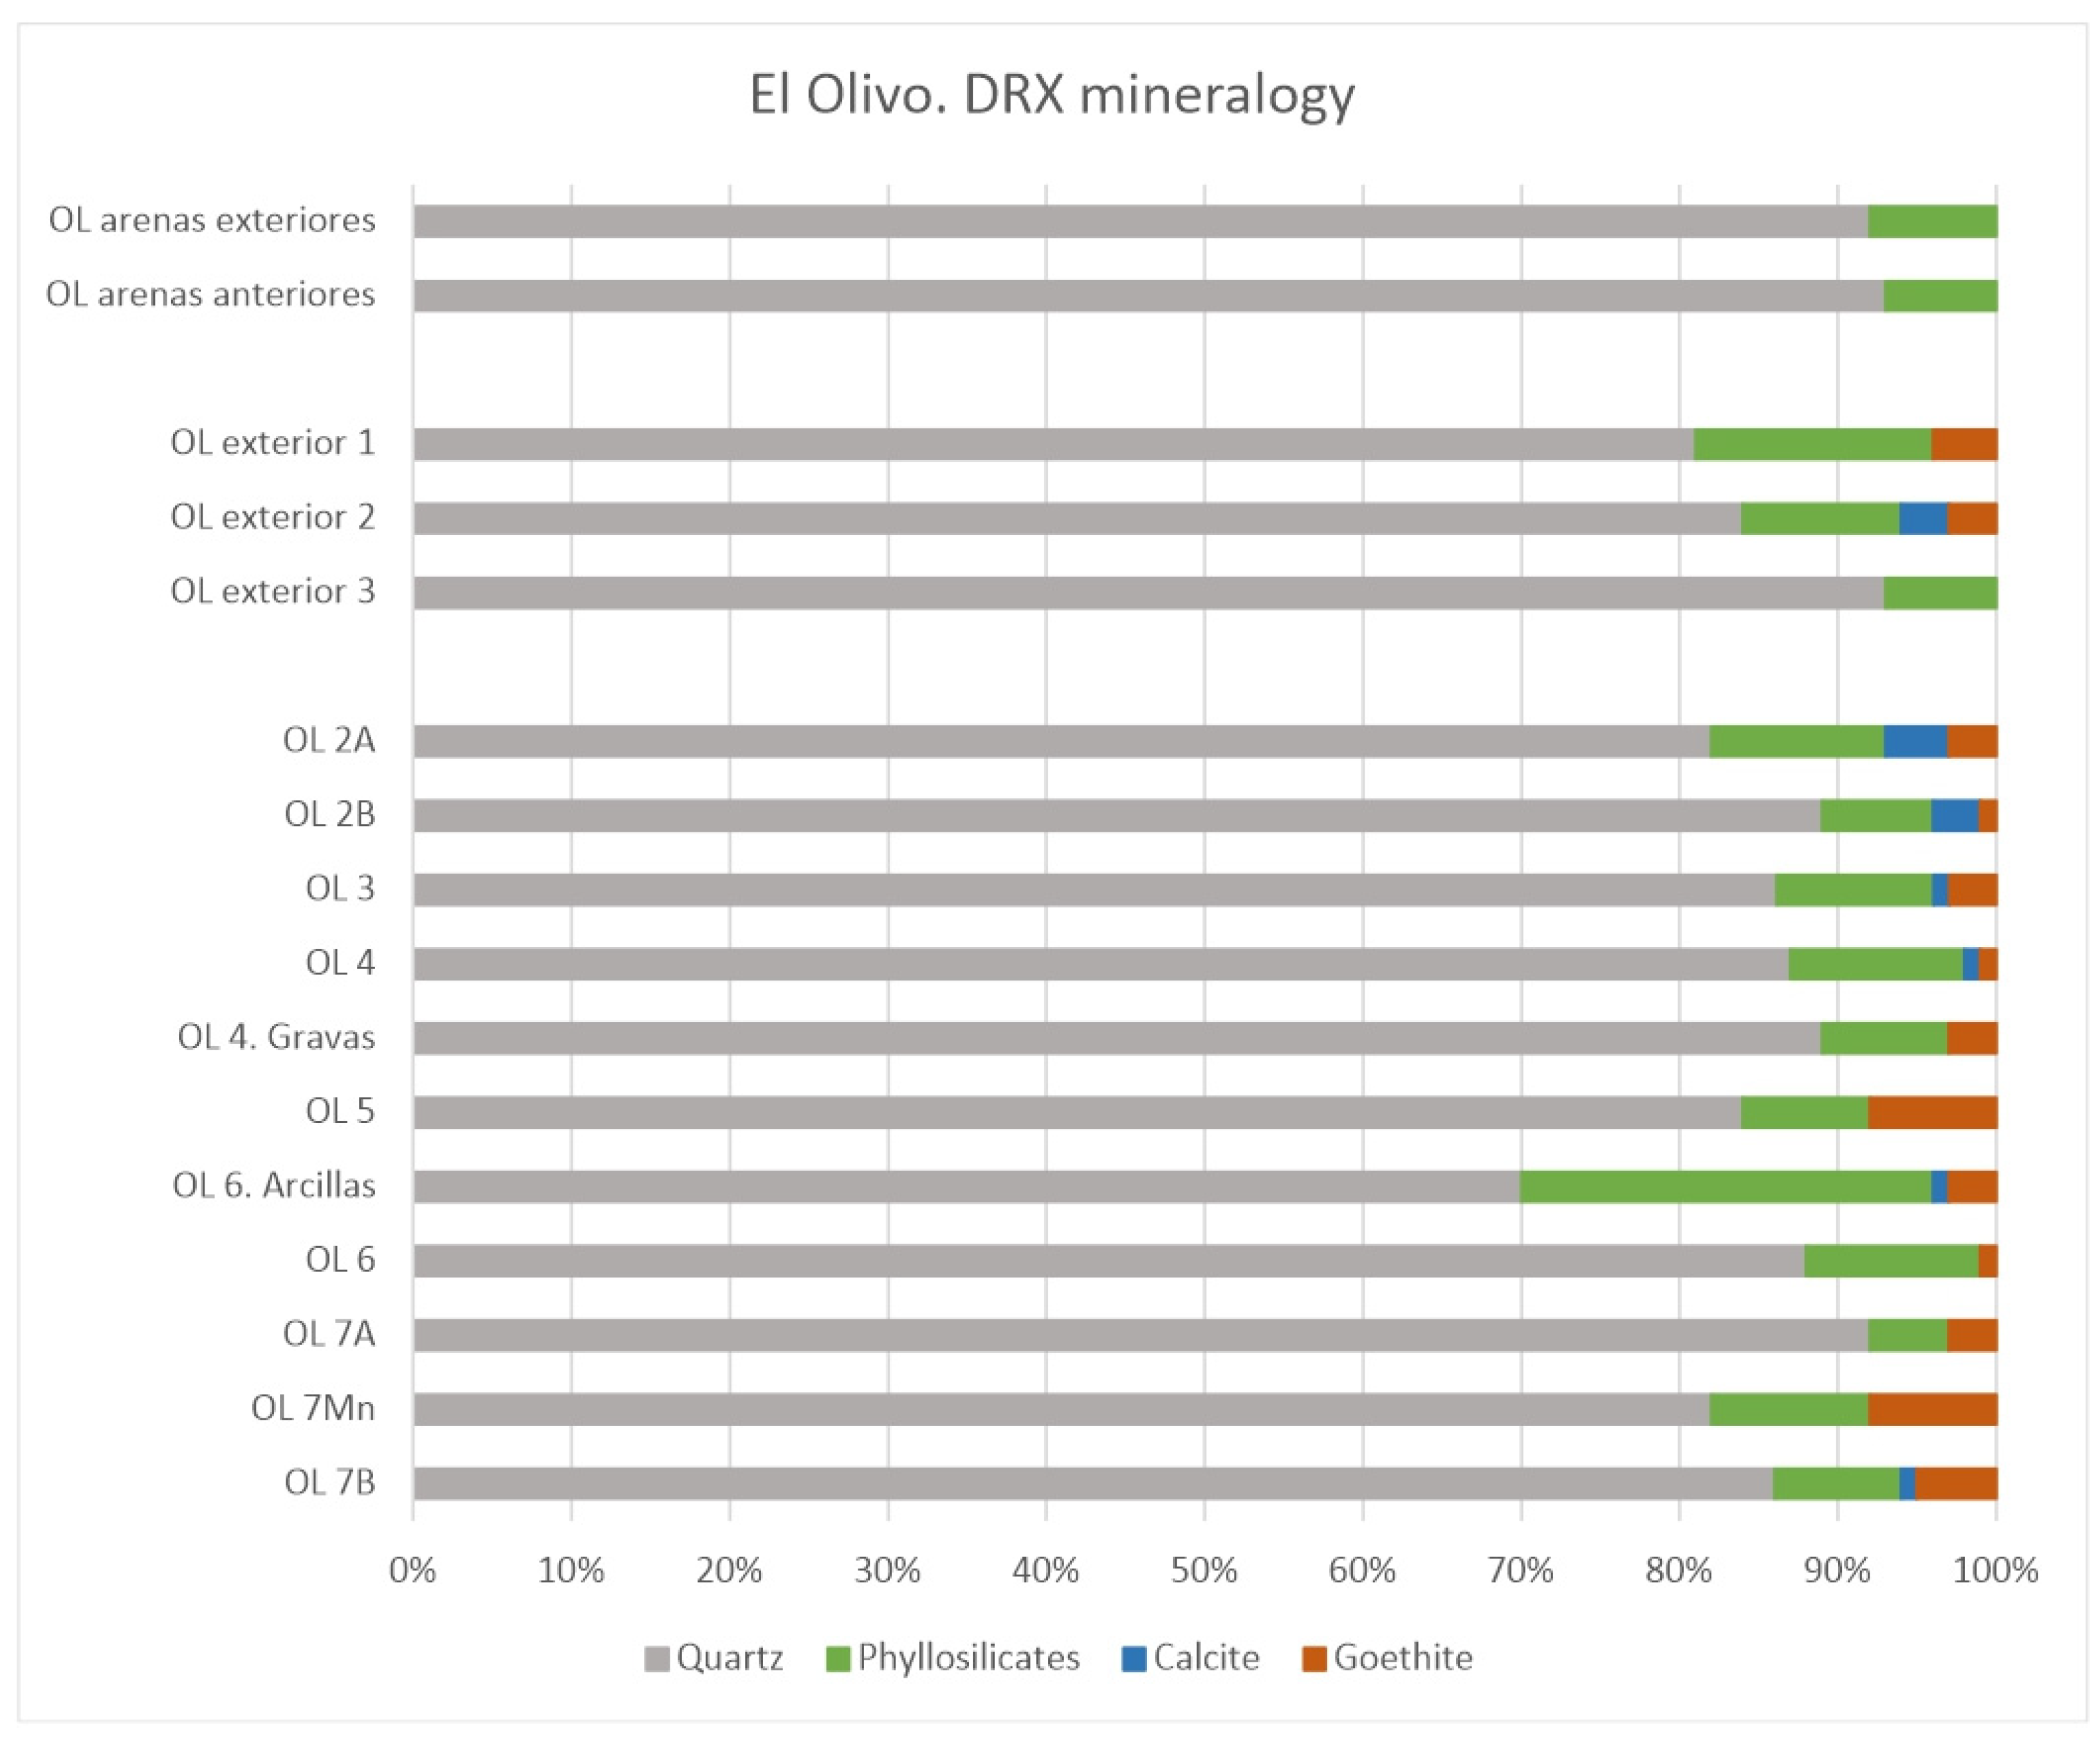
The interior and the exterior excavation sequences are very homogeneous in their mineralogy (Figure 19). They are characterized by the predominance of quartz, accounting for over 80% in all samples except for OL.6 arcillas, where it only reaches 70%. Phyllosilicates are present in all samples, but their percentages are below 15%, except for OL.6 arcillas, OL.4 and OL.3. There is a slight increase in OL.2b (3%) and OL.2a (4%). In the exterior sequence, calcite is only found in the middle section, specifically in OL.Exterior 2 (3%). Throughout the interior sequence and in the middle and upper levels of the exterior sequence, goethite is present, but with values below 8%.

4.2.3. Calcium carbonate, organic charcoal and organic matter

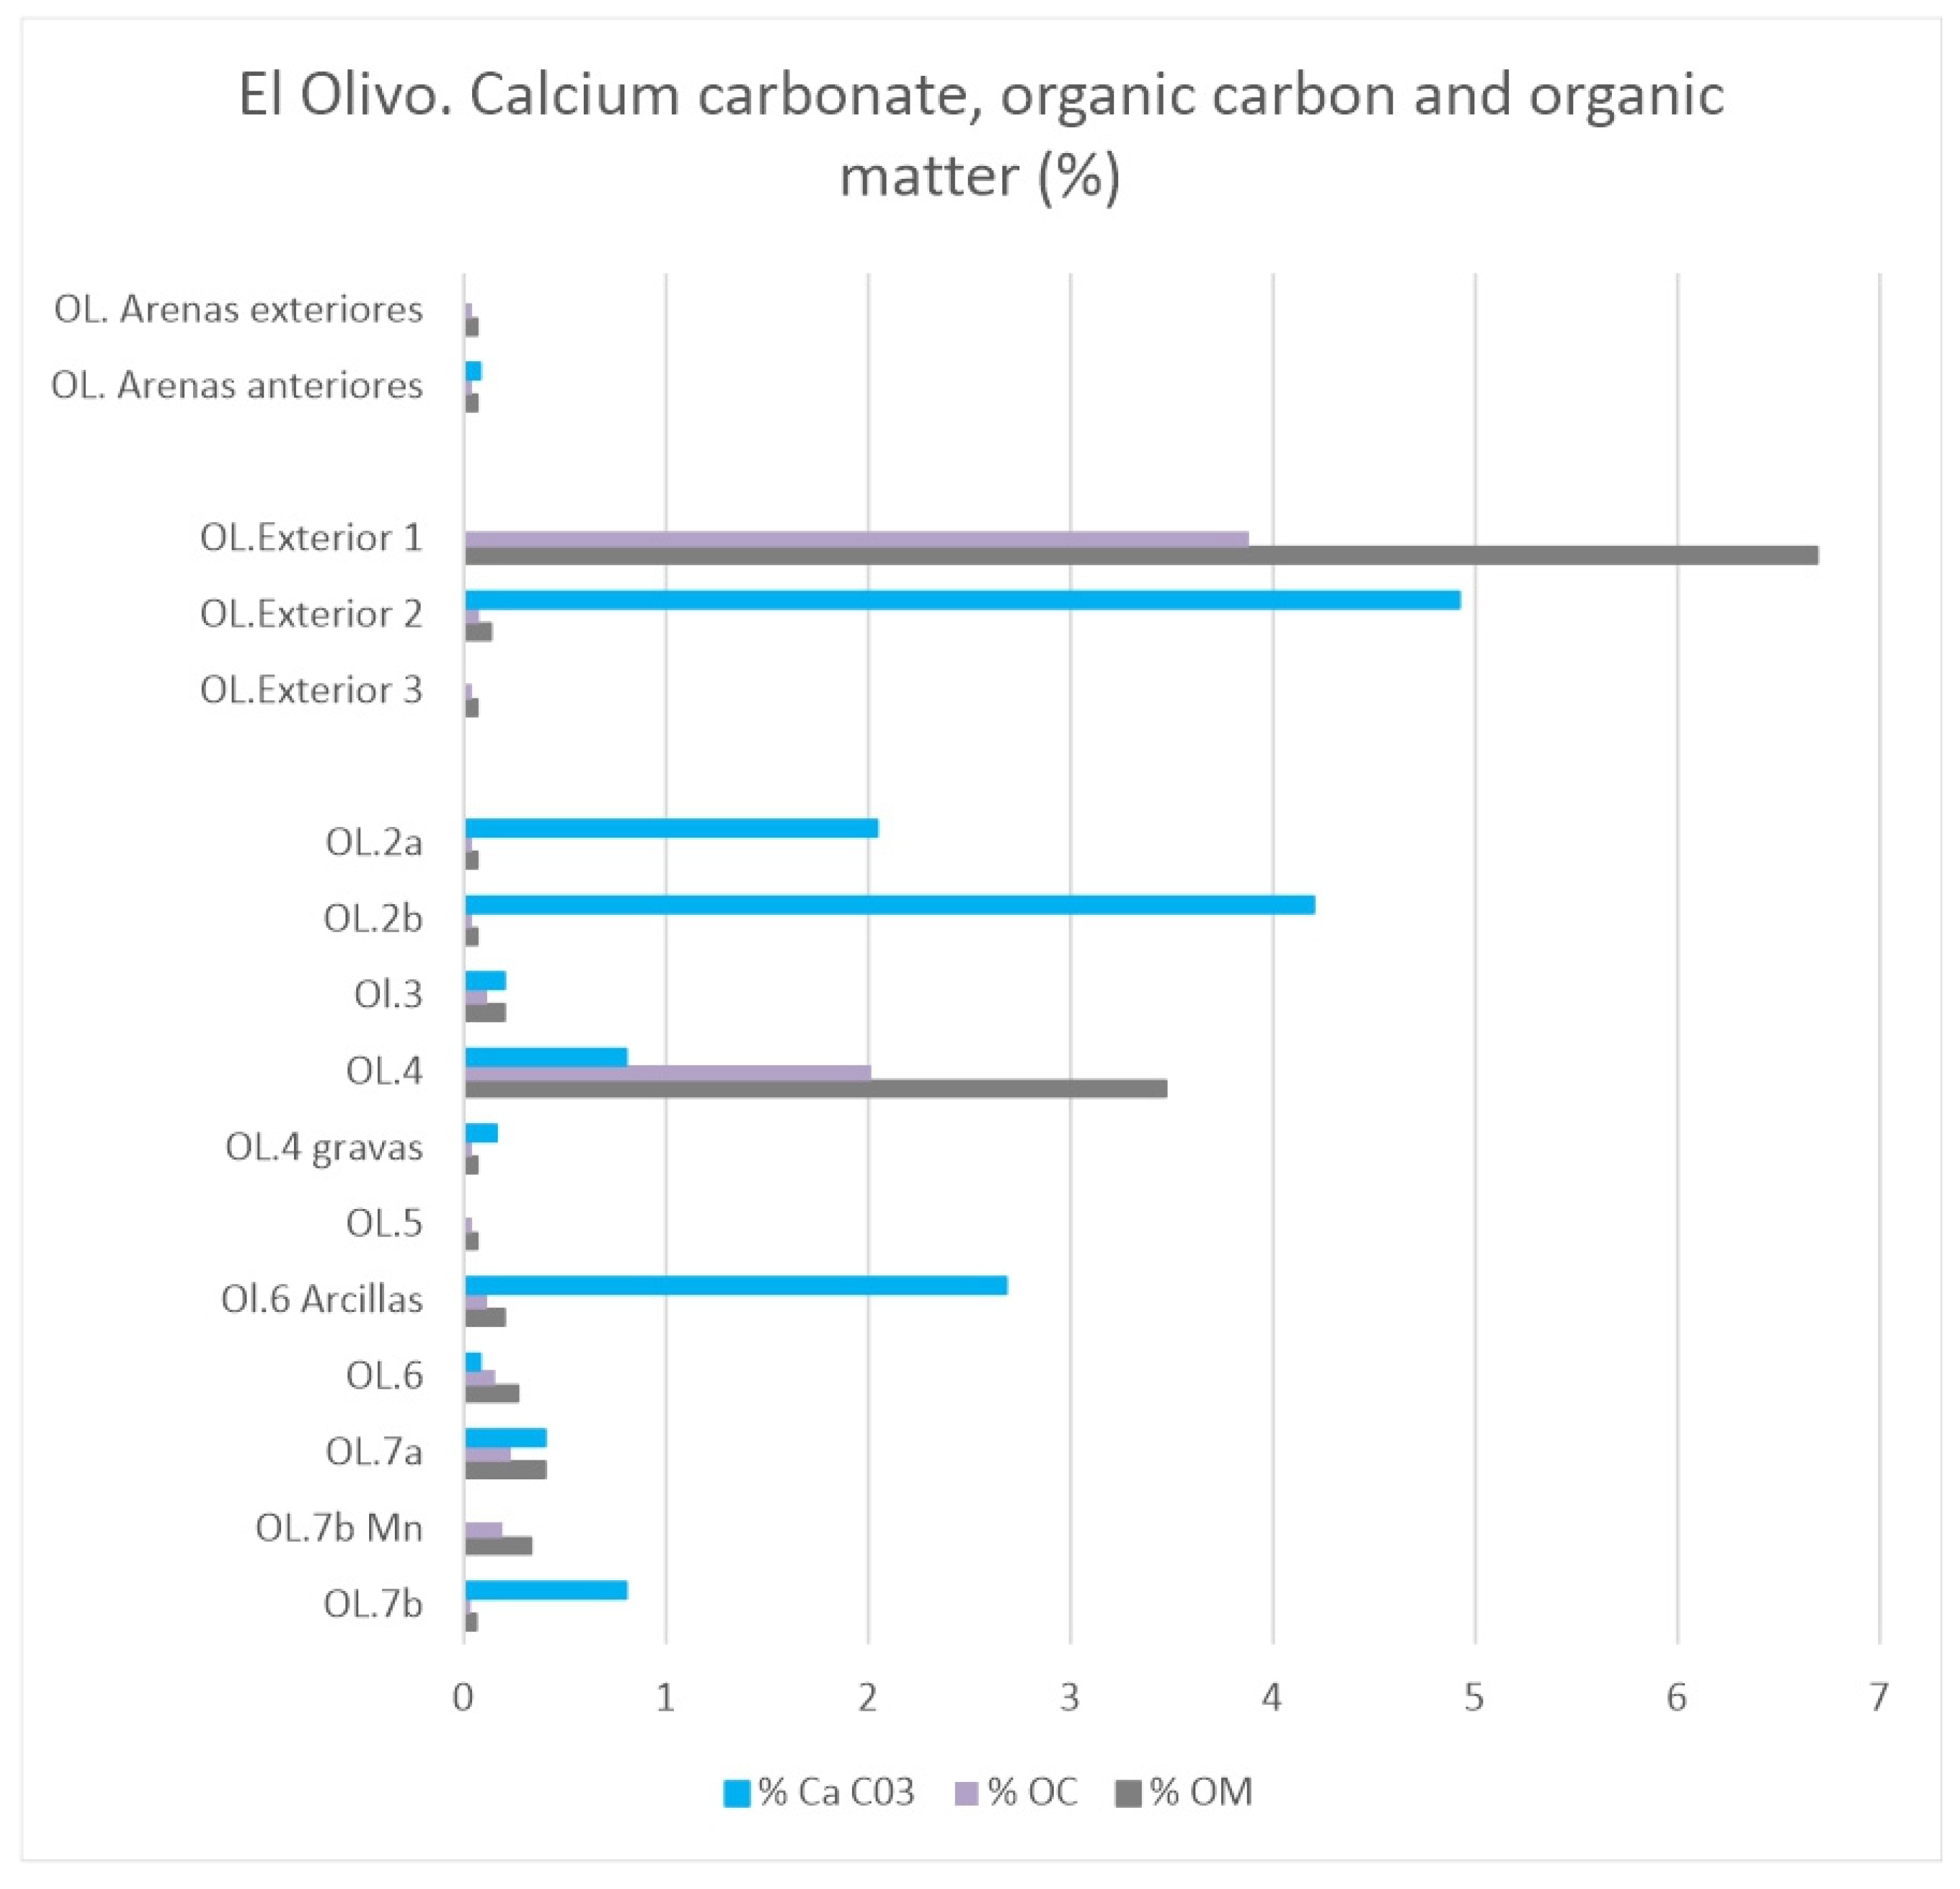
In the interior excavation, the presence of these three components is minimal (<1%), with variations in CaCO3 that notably increase in the samples OL.6arcillas (2.68%), OL.2b (4.2%) and OL.2a (2.04%). The presence of organic matter (OM) and organic charcoal (OC) also increases in the OL.4 sample, reaching 3.47% and 2.01% respectively (Figure 20). In the exterior excavation, the basal level lacks CaCO3 and has a minimal presence of OM and OC. The middle level exhibits almost 5% CaCO3 and minimal levels of OM and OC, which experience a significant increase in the upper level while CaCO3 disappears. The samples labeled as “arenas anteriores” and “arenas exteriores” hardly contain these components.

4.2.4. Color and pH

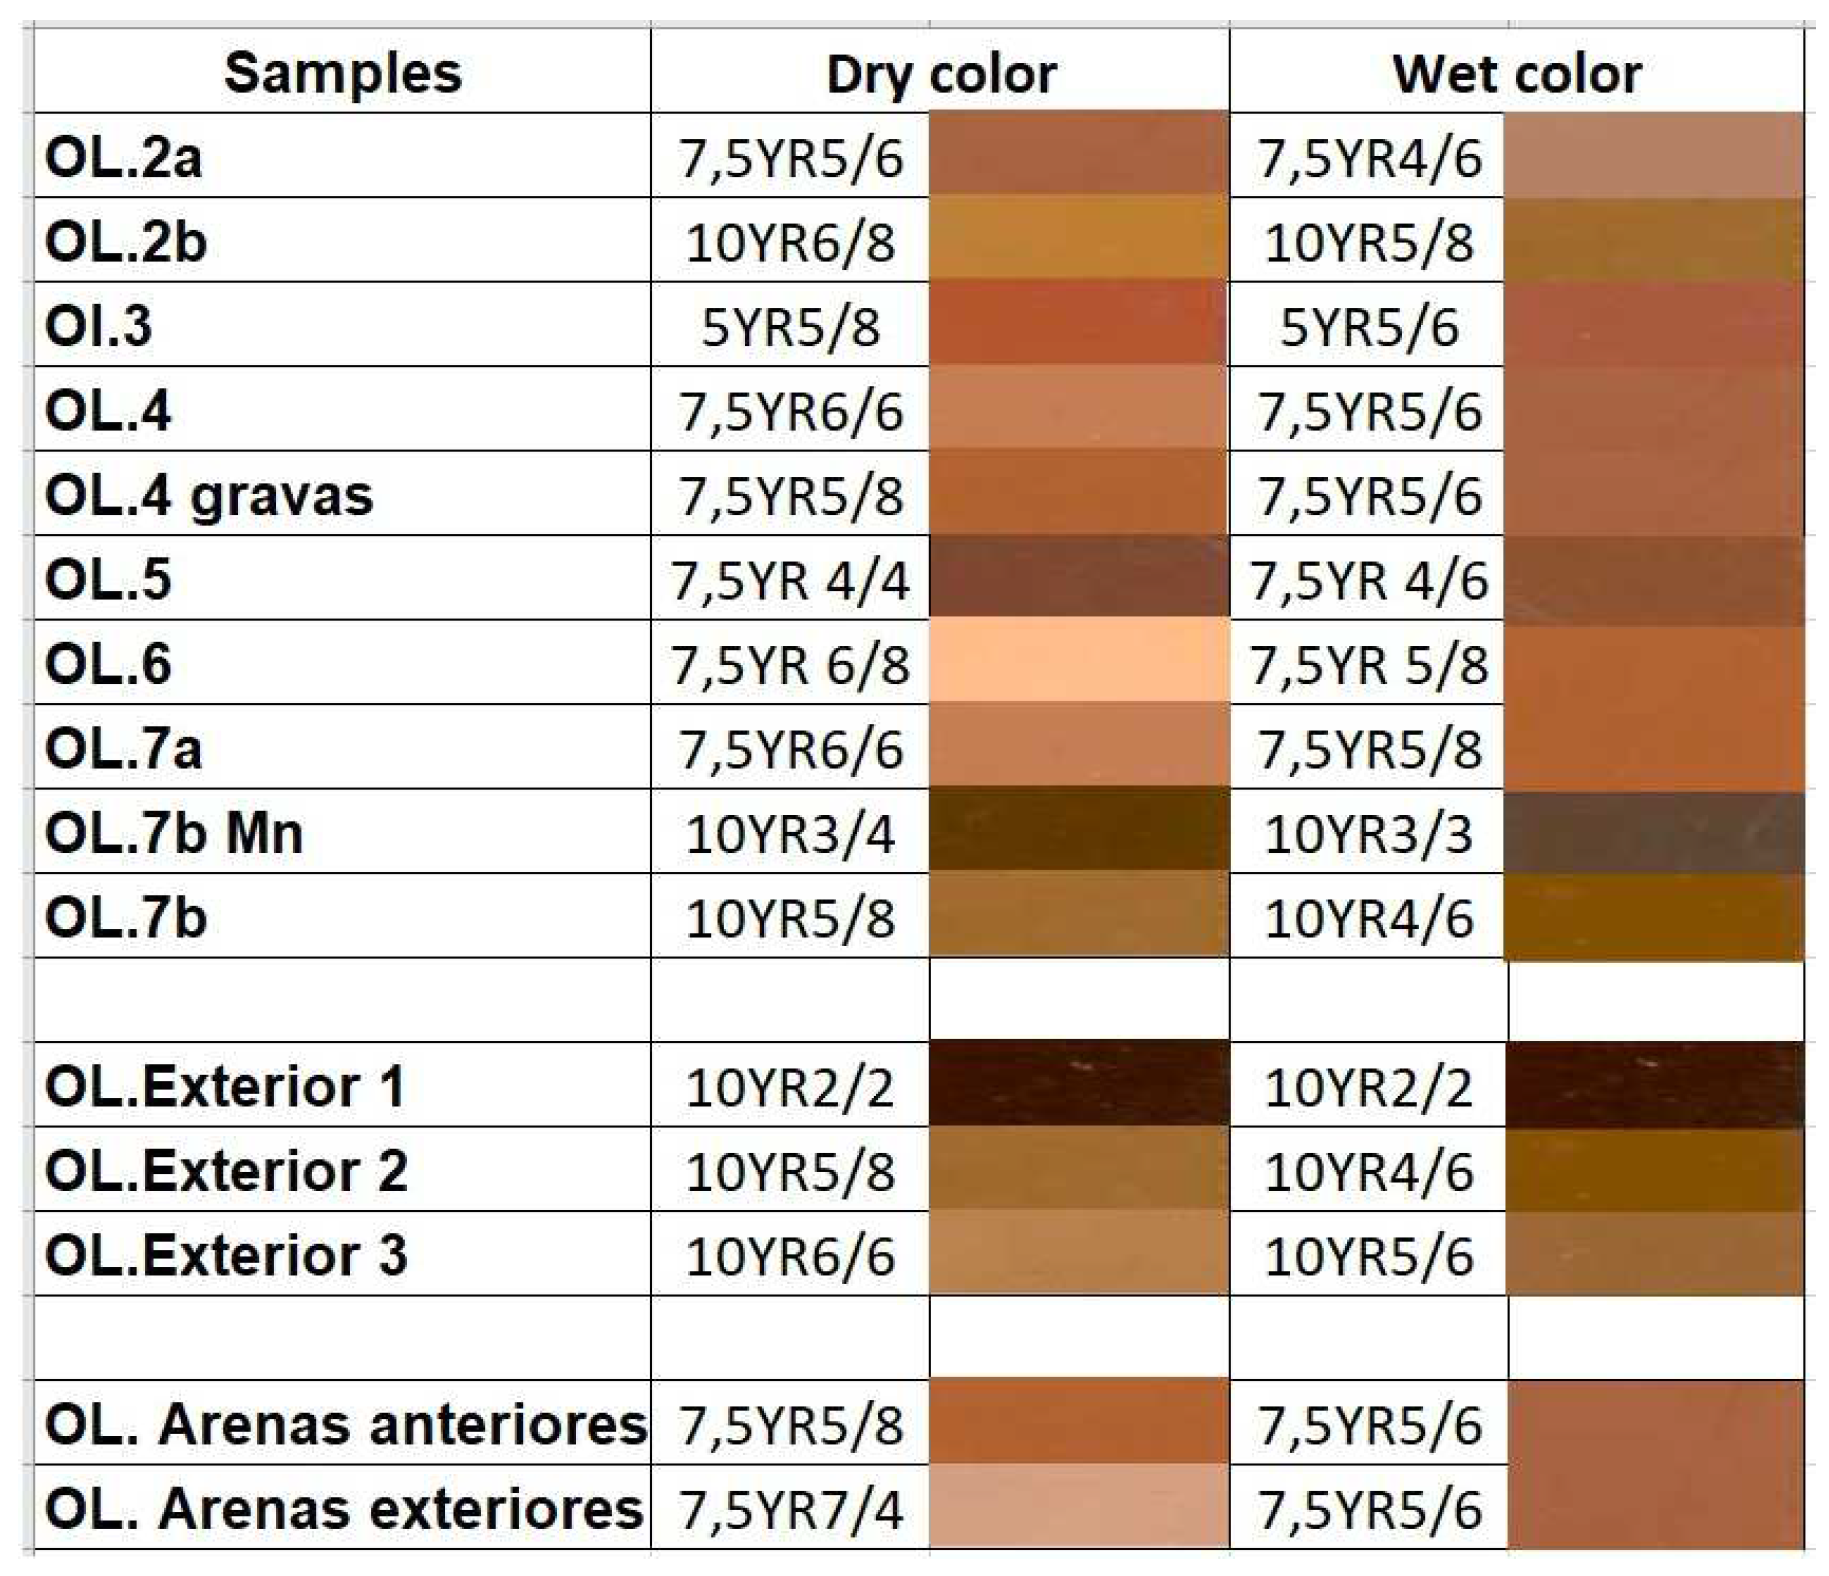
From the determination of the dry color of the sediments in the exterior sequence, certain differences can be observed between the colors of its different levels (Figure 21). The basal level OL.7 exhibits a brown color with a hue of 10YR and 7.5YR, and high brightness and chroma values. On the other hand, OL.6 is beige in color with high brightness and chroma values. The middle section, between OL.5 and OL.4, displays brown colors with a hue of 7.5 YR, ranging from darker tones with low brightness and chroma to darker tones with higher brightness and chroma. The OL.3 level exhibits a reddish-brown color with a hue of 5YR and high brightness and chroma values. OL.2b, a yellowish-brown color, returns to a hue of 10YR with high values of brightness and chroma, while OL2a, a brown color, has a hue of 7.5YR with high brightness and chroma values. The wet color follows a similar pattern with greater color homogeneity. In the exterior sequence, there is a progressive darkening of the color, with a hue of 10YR and brightness and chroma values transitioning from high to low in the uppermost part, both in dry and wet conditions. The “arenas anteriores” and “arenas exteriors” are brown with a hue of 7.5 YR and identical brightness and chroma in wet conditions.
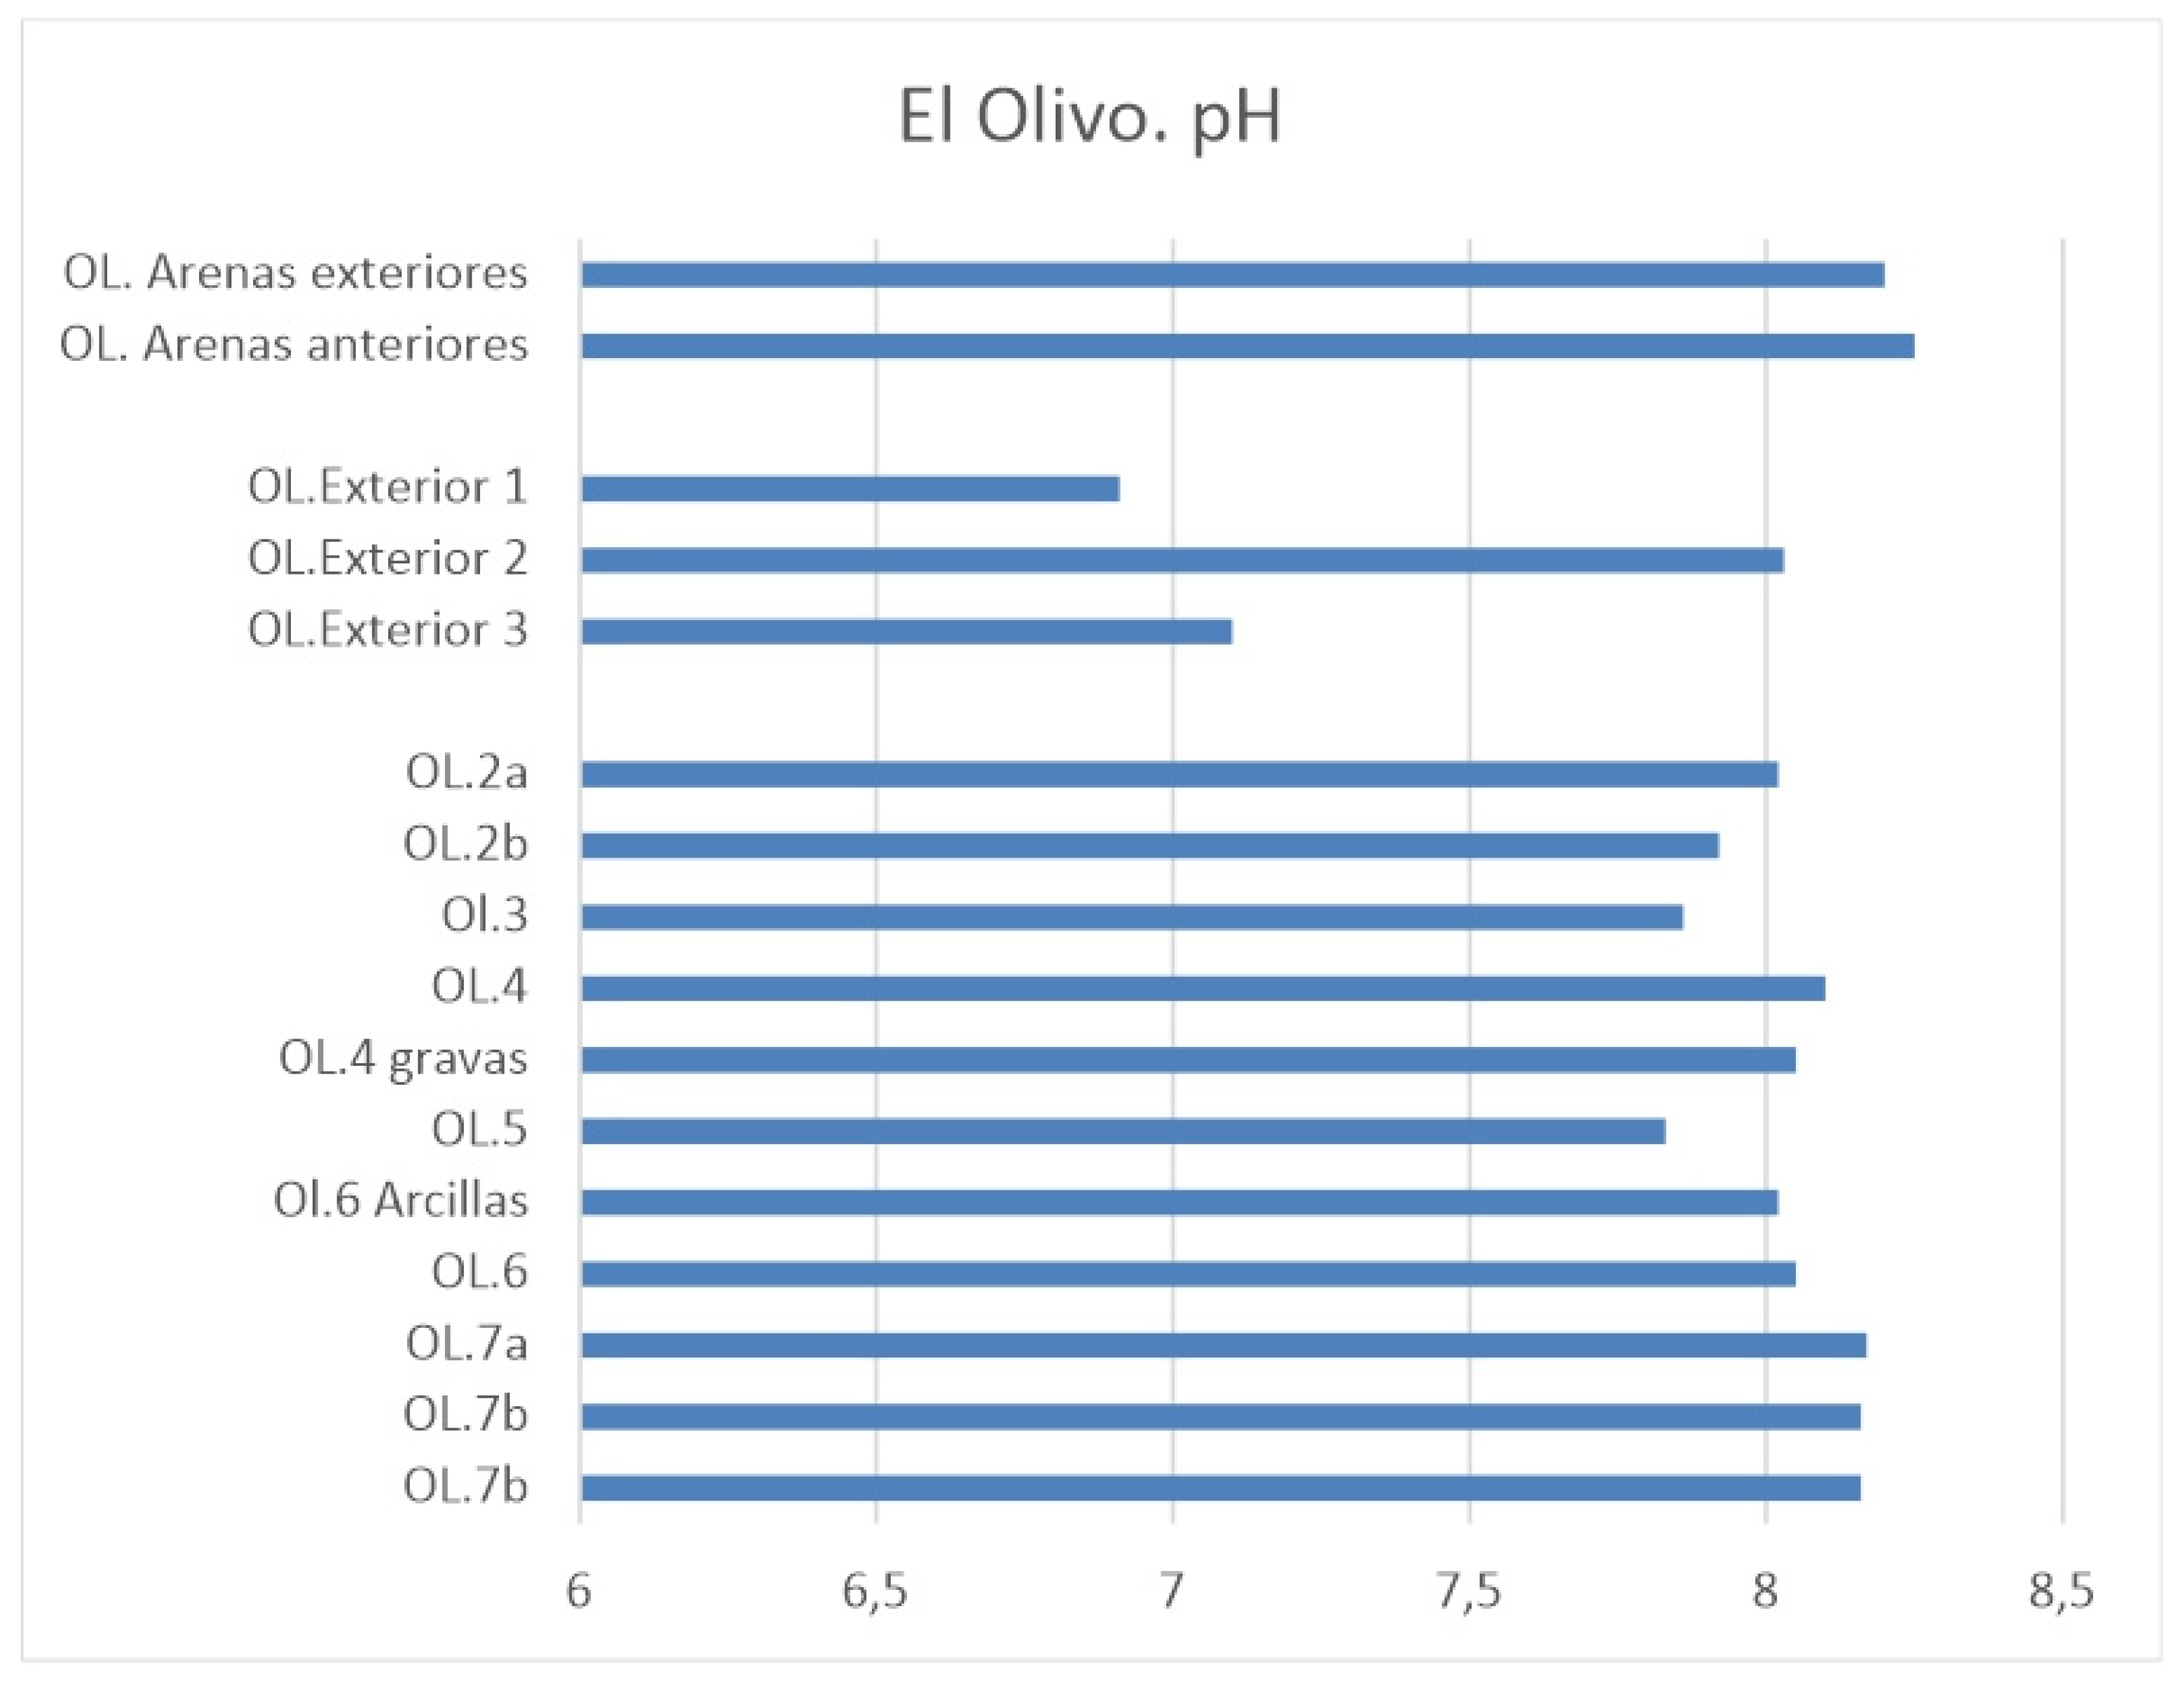
The pH values (Figure 22) of the sediments in the interior excavation sequence are slightly basic, around 8. However, in the exterior core sequence, there is a significant variation in pH. The basal level exhibits a pH close to 7, which increases to 8 in the middle level and then becomes slightly acidic (6.91) in the uppermost part. The “arenas anteriores” and “arenas exteriores” samples have the highest basic pH values among the samples (8.25).

5. Geochronology

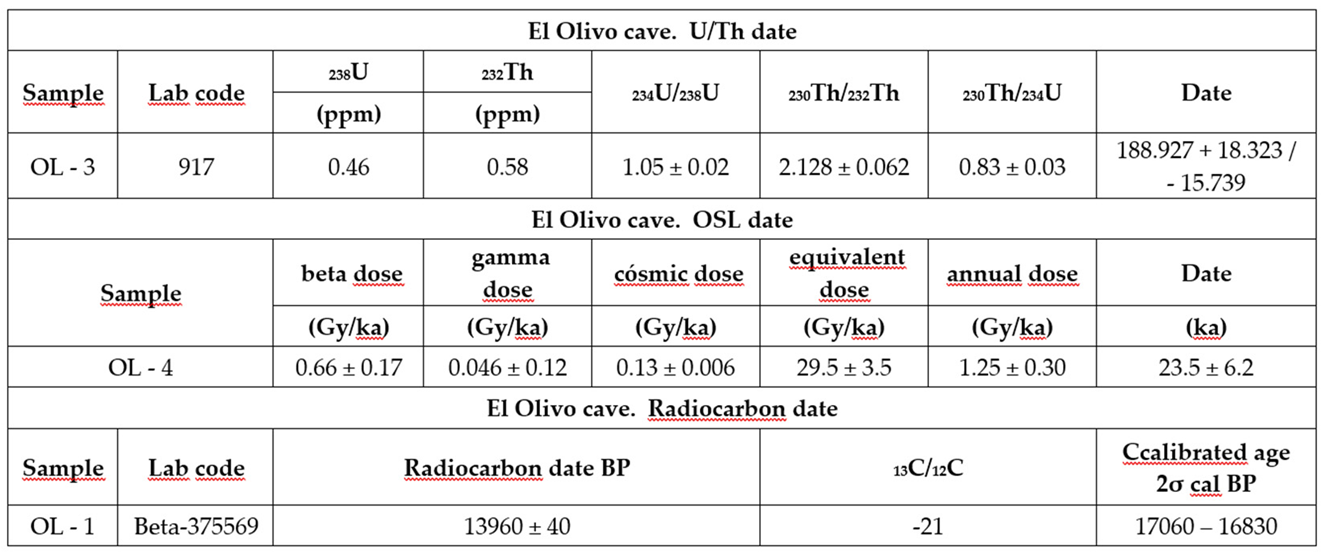
The chronological framework of the archaeological site (Table 1) derived from three U/Th, OSL and radiocarbon ages. The perched flowstone sample OL-03 has a 234U/238U isotopic ratio close to 1, indicating that the geochemical system remained closed after speleothem precipitation. Furthermore, the detrital contamination is negligible due to the 230Th/232Th ratio being higher than 2. As a result, the age of 189 ± 17 ka for flowstone OL-03 is robust, despite the lower concentration of 238U (0.46 ppm). This U/Th age marks the end of the former cave sedimentary aggradation within El Olivo Cave during OIS-7a.
Sample OL-04 had a very low radioisotope content (<0.7 Gy·ka-1), and no disequilibrium was observed in any U and Th decay chains. The OSL signals were dim but fast (Figure S1 of Supplementary data). After accepting 35 aliquots, a Central Age Model was applied because the equivalent dose (De) distributions were non-skewed, the over-dispersion was low, and there was no evidence of incomplete bleaching (Figure S2 of Supplementary data). As a result, the OSL age of 24 ± 6 ka is considered reliable for inferring the timing of the second detrital deposition period, which is coeval with OIS-3a.
Finally, Table 1 provides the results of the radiocarbon dating obtained from medium-sized ungulate remains, recovered in the sublevel OL.2b of the interior excavation. The conventional results indicate an age of 13,960 ± 40 BP, which corresponds to the calibrated range of 17,096 – 16,811 cal BP with 95% probability using the INTCAL20 curve. This places the deposit and the remains of the Middle Magdalenian period it contains at the beginning of the cold stage GS 2a of the Last Glacial Maximum, within the OIS2 (Oxygen Isotope Stage 2), coinciding with the onset of the Heinrich H1 event at the end of the Upper Pleistocene.

6. Geomorphological and geoarchaeological interpretation

6.1. Paleogeographic evolution of El Olivo cave

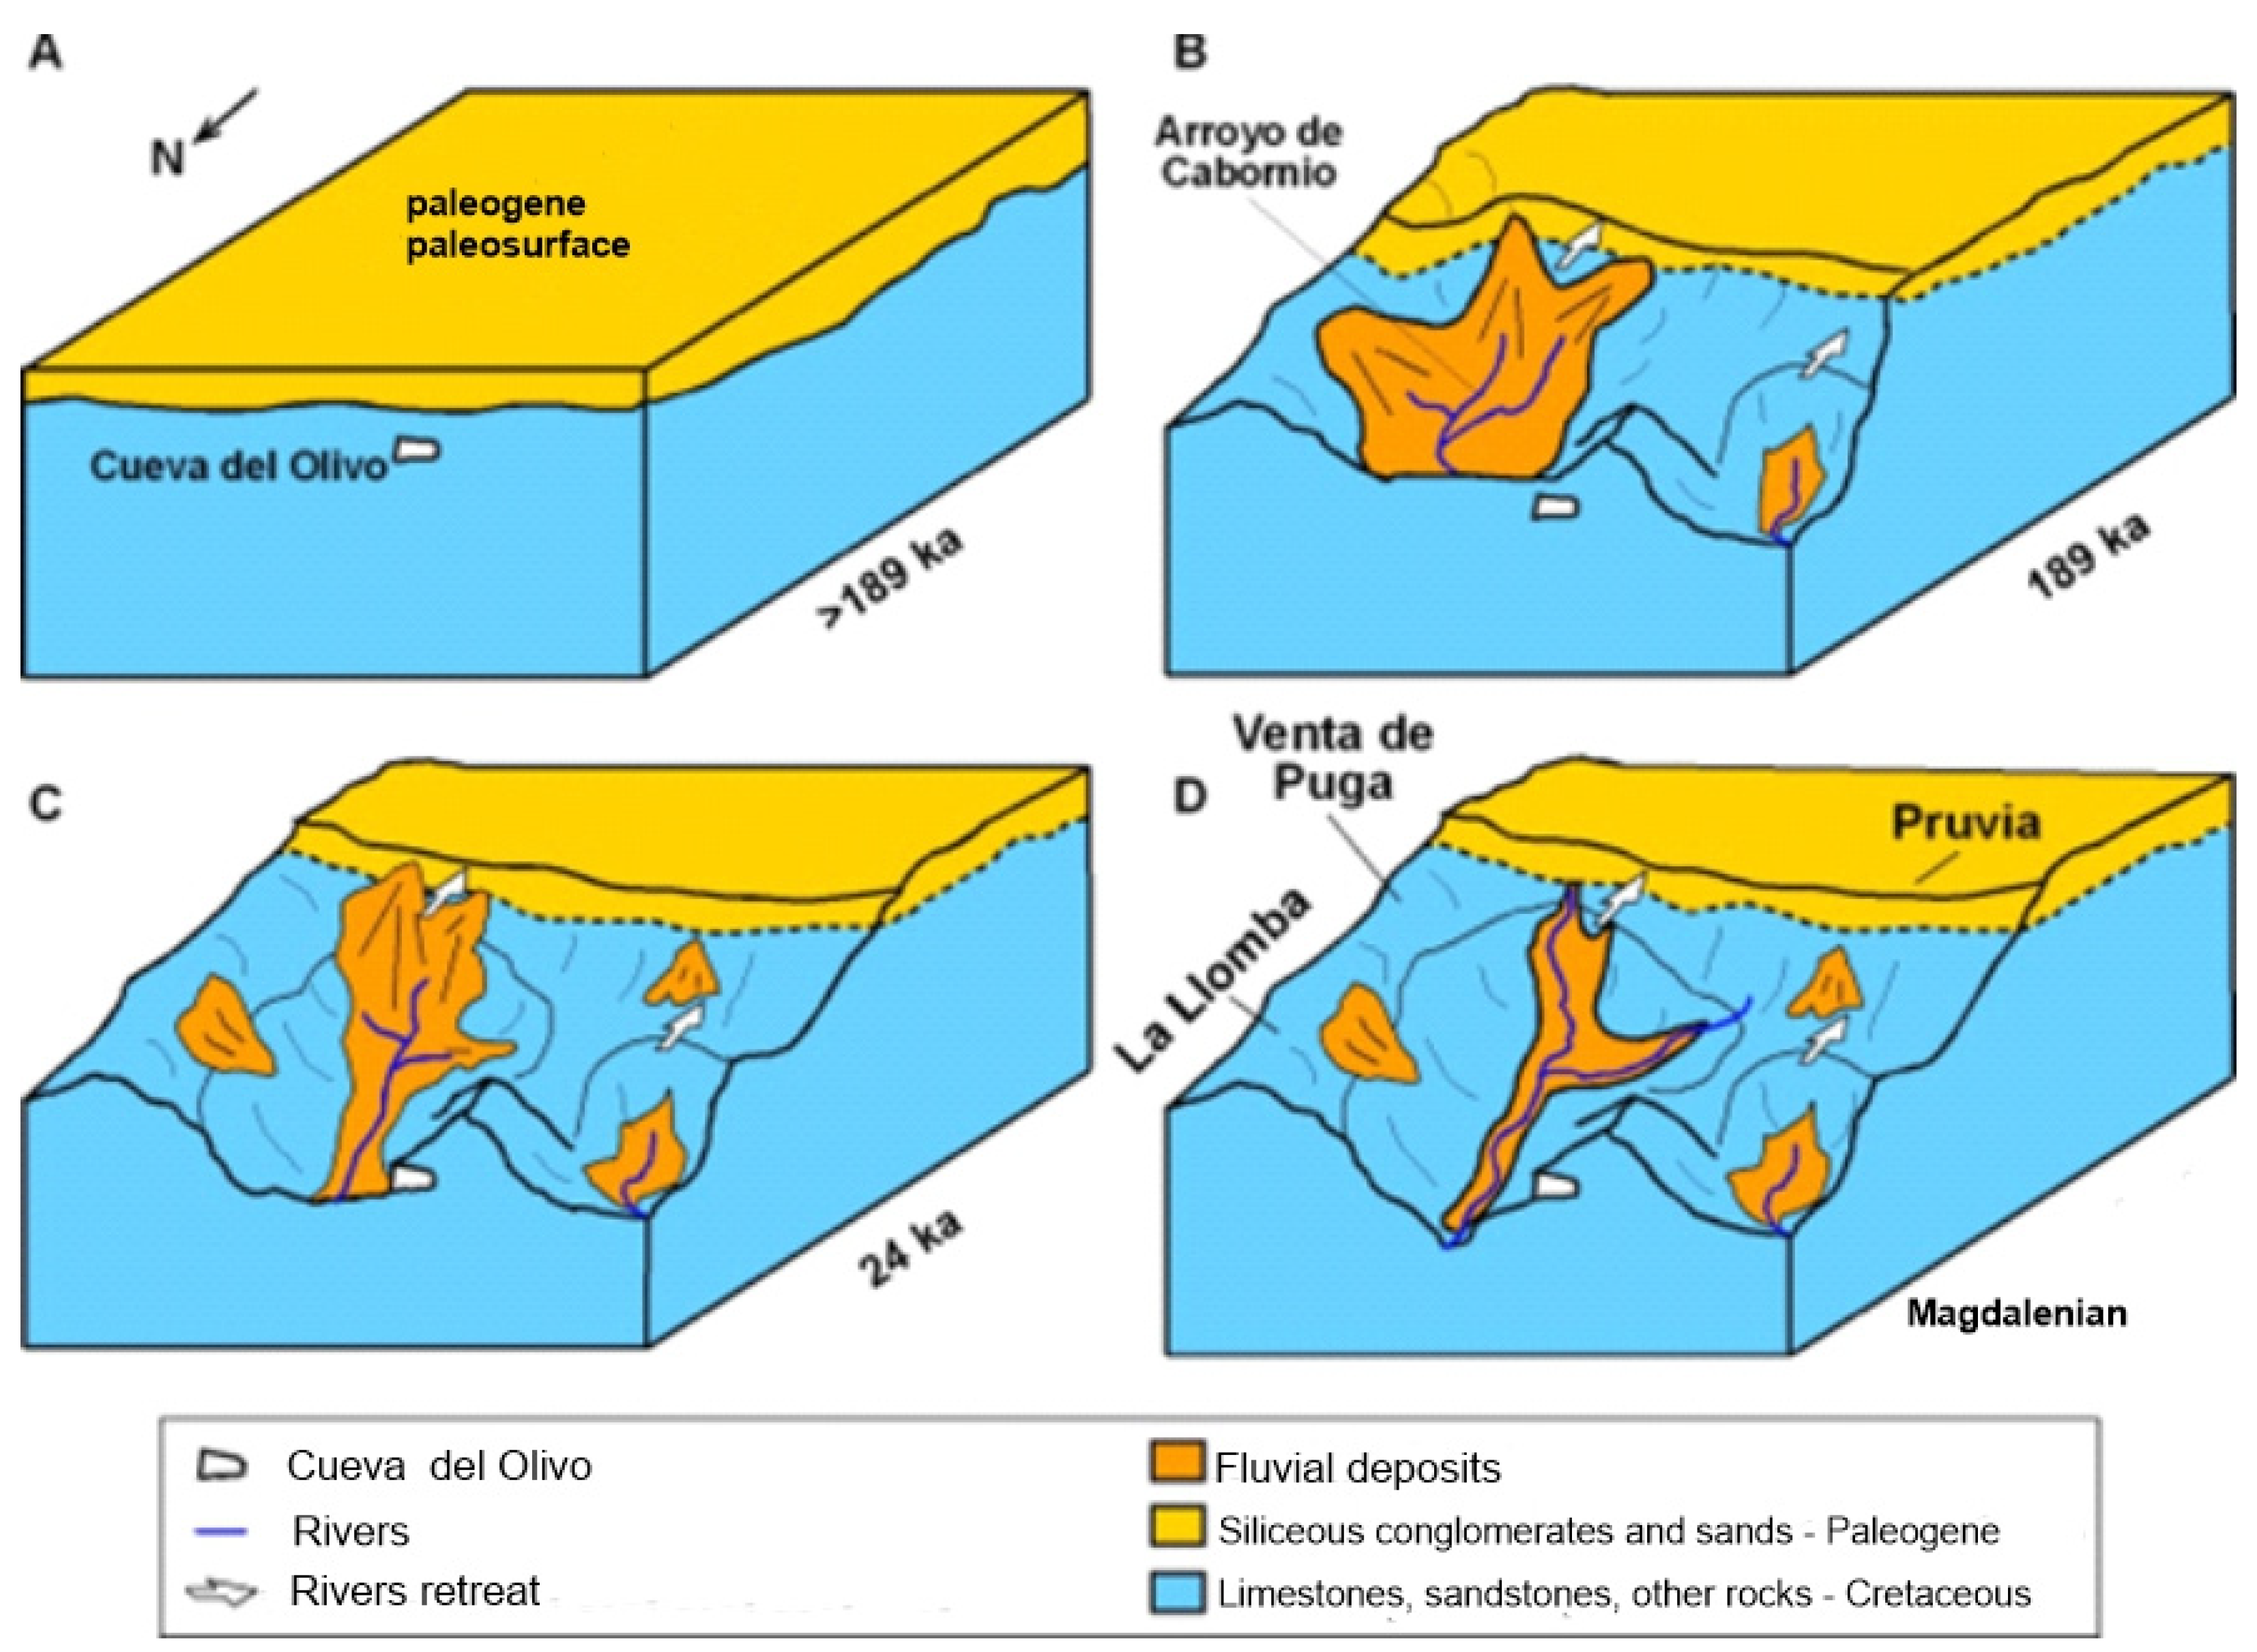
Based on the geomorphological and geochronological evidence obtained from El Olivo Cave and its surroundings, we were able to reconstruct the paleogeographic evolution since the Chibanian, as illustrated in Figure 23. The model consists of five phases:
  • The first phase began with the formation of El Olivo Cave within Cretaceous bedrock covered by Paleogene detrital rocks, which formed the Llanera plain (Figure 22A). The cave conduit originated when the water table was located 147 m above the present sea level. Therefore, Phase 1 took place a long time before the precipitation of the flowstone OL-03 at 189 ± 17 ka.
  • Phase 2 comprised the entrenchment of the Aboño river network on the Llanera plain in the vicinity of El Olivo Cave (Figure 22B). The headwaters migrated southwards eroding the Llanera plain. The fluvial incision also caused the lowering of the water table and the vadose development of the cave. Finally, the cave was partially filled by detrital sediments and flowstones precipitated at 189 ± 17 ka, coeval with the limit between OIS 7-6. These detrital and speleothem deposits remain perched on the cave walls. The cave infill would be related to the erosion of the Paleogene rocks (Figure 22B) and coincides with a sedimentary aggradation event in karst caves along the Cantabrian Region during OIS 7-6 [38,39].
  • Fluvial incision, the drop of the water table and the erosion of the Llanera plain continued during Phase 3 (Figure 22C). At the same time, the cave sedimentary infill was partially removed before or after the interception of the cave by the topographic surface. This led to the creation of the cave entrance, which allowed the potential entrance of fauna and humans, as shown by the probable presence of Neanderthal groups in the cave.
  • Phase 4 corresponds to the deposition of sandstone and quartzite pebbles and quartz sand transported by the Cabornio stream from Llanera plain to El Olivo cave (Figure 22D). This implies the location of the Cabornio stream channel at the position of the cave. The alluvial deposition within the cave occurred around 24 ± 6 ka and would be related to alluvial fans developed under the dry and cold conditions of OIS-2
  • Fluvial incision continued during Phase 5 (Figure 22E) and humans frequented El Olivo cave at the end of OIS-2 according to Álvarez-Alonso et alii (2018) [4]. Simultaneously, the stream flooded the cave leading to sandy-loamy sediment with reworked archaeological remains during the OIS-2. Cabornio stream has descended 13 m from 24 ka to the present, representing an incision rate of 0.54 mm·a-1.
The examination of this archaeological site has yielded novel insights into the evolution of the landscape in central Asturias during the Pleistocene. This region has been constrained by the scarcity of sedimentary records, thereby limiting the development of pertinent Quaternary investigations. The northern central region of Asturias is characterized by continental plains [40] and provided potential habitats for large herbivores, all of which have been documented in numerous paleontological and archaeological sites throughout the region [41,42,43].

6.2. Geoarchaeological interpretation

Based on the results of the geomorphological analysis of the surroundings and the cave, as well as the lithostratigraphic description and the sedimentological and edaphological characterization of the sediments from both the interior and exterior sequences of El Olivo cave deposits, it appears evident that its genesis is related to typically alluvial sedimentation.
As previously observed, before the incision of the river, the Paleogene conglomerates and sandstones formed a cover that extended over most of the Cretaceous limestone in the vicinity of the cave. In this context and any case before the Middle Pleistocene, the cave was formed by the circulation of phreatic water flow directed towards the NE. Subsequently, the development and incision of the fluvial network of the Aboño River resulted in the dismantling of the Paleogene cover from the north, while El Olivo Cave was nearly completely filled with fluvial sediments that were sealed by a speleothem dated at 189 ± 17 ka. Evidence of this fluvial deposit includes the sand adhered to the walls of the cave in both its inner and outer zones, which we have referred to as “arenas anteriores” and “arenas exteriores”. These sands are identical to each other and exhibit strong similarities in terms of grain size, mineralogy, OM, OC and CaCO3 with the basal sands of the exterior excavation. However, differences can be observed in terms of pH and color. These differences suggest that the two sets of sand do not correspond to the same process. The sands adhered to the cave walls are believed to be a part of the initial sedimentation of the cave, which was sealed by the speleothem dated at 189 ± 17 ka. In contrast, the sands in the exterior excavation on the fluvial terrace are more recent. This sedimentary fill was later eroded, leading to the near-complete emptying of the cave.
When the Cabornio stream had already cut down 70 m into the Paleocene cover, it intersected El Olivo Cave, allowing it to communicate with the topographic surface and resulting in the emptying of the sediments that filled the cave. From that moment on, the cave began to refill with fluvial deposits, with episodes in which the cave was occupied by prehistoric human groups. Furthermore, during that time, sedimentation of the exterior deposits occurred, forming a small terrace. These detrital deposits, both interior and exterior, originated from the dismantling of the Paleogene cover. Subsequently, the Cabornio stream continued to incise, interrupting the influx of sediments into the cave.
During the Upper Pleistocene, the cave was once again filled with a sequence (interior excavation) that begins with a well-documented sedimentation of muddy conglomerates (level OL.7). These conglomerates comprise both angular autochthonous clasts and fluvial rounded pebbles, with quartz being the predominant mineral accompanied by a low proportion of phyllosilicates. A certain presence of goethite is detected, which stains the surfaces of the clasts black and accumulates in a thin intermediate layer, indicating a process of hydromorphism. These deposits consist of a clast-supported conglomerate that exhibits characteristics of a debris flow. They contain archaeological remains that appear to correspond to the Middle Paleolithic [4].
The sequence in the exterior trench excavated in this terrace presents a basal level consisting of well-sorted fine sands, primarily composed of quartz with minimal presence of phyllosilicates, no carbonates and scarce organic matter. These sands exhibit fine horizontal lamination. They were deposited around 23.5 ± 6.2 ka. Above them, a clast-supported and grain-increasing conglomerate consists of rounded pebbles with a matrix of coarse and medium quartz sands, with few fine sands and silts. This conglomerate serves as the substrate for the current soil, which is rich in organic matter and dark in color.
The sequence inside the cave continues with high to medium-energy fluvial sedimentation, contributing deposits transported through reptation, saltation and suspension. There is an initial low-energy episode where the sedimentation of the sandy bedload occurs, followed by the settling of silts and clays (OL.6). These fluvial sands inside the cave may correlate with the fluvial sands at the base of the exterior terrace (OL.Exterior.3), which are dated around 23.5 ± 6.2 ka, during the final stages of the cold stage OIS 3a (Last Cold Period).
Above these sands, fluvial conglomerate deposits (OL.5) enter the cave and extend into the narrow passage at the NW end, blocking it. These deposits exhibit similar textural and mineralogical characteristics to those in the middle level of the exterior sequence (OL.Exterior 2), although the latter shows a higher presence of CaCO3 compared to the interior levels.
Above these conglomerates, the sequence continues with predominantly sandy fluvial sedimentation. It starts with fluvial gravel (OL.4 gravas), followed by a muddy section (OL.4) associated with a period of ponding with a predominance of decantation.
Above that, the sequence continues with fluvial sands containing abundant autochthonous clasts and fragments of speleothems (OL.3), followed by fluvial sand and silt with gravel (OL.2), that contain remains of Middle Magdalenian occupations dated to 17,096 – 16,811 cal BP [3,4], corresponding to the beginning of the cold stage GS 2a of the Last Glacial Maximum within OIS2.
The landscape during the human occupation of the cave was likely very similar to the present day, with well-developed river valleys and gentle hills. Immediately south of the cave, there would be a small plain corresponding to the current area of Llanera and Noreña. At that time, the distance from the cave to the sea was greater than the current 10 to 15 km, as sea level was between 115 and 80 meters below the current level, which extended the coastal strip between 6 and 15 km [7].
The sequence of the interior excavation concludes with a superficial deposit articulated into two sub-levels. In these reworked fluvial deposits, Paleolithic archaeological remains are found alongside recent materials. There is evidence of the cave being used during the Spanish Civil War, supported by Mauser bullet casings and the oral accounts of the local residents in the area. As far as we know, the cave was used as a refuge, primarily in 1937 during the advance of Francoist troops towards Gijón. Subsequently, while local residents are aware of the cave and visit it, there is no record of any more recent activity or use [4]. Outside, the current top soil has developed on the conglomerate of the fluvial terrace.

6. Conclusions

El Olivo Cave has a long geological history that begins with its formation at an undetermined time in the Neogene/Pleistocene before 189 ± 17 ka. During the Lower and Middle Pleistocene, the Aboño River and its tributaries were embedded and the cave opened to the exterior, and it was practically filled by sedimentation of fluvial sands, culminating in a speleothem dated to 189 ± 17 ka, during the end of the warm stage OIS7a, in the Chibanian (Middle Pleistocene). Subsequently, these sands were eroded, leaving remnants of them on the cave walls. Sedimentation resumed inside the cave, resulting in a fluvial clastic sequence. In its lower section, there is a basal level containing archaeological remains tentatively assigned to the Middle Paleolithic, followed by sands that correlate well with a sandy deposit located at the base of the outer terrace, dated to 23.5 ± 6.2 ka, at the end of the cold stage OIS3a (Last Cold Period) of the Upper Pleistocene. The fluvial sequence continues, and in its upper section, there is an occupation during the Middle Magdalenian period, dated within the calibrated range of 17,096 – 16,811 cal BP. The sequence concludes with a disturbed deposit that contains contemporary remains, among which notable artifacts from the Spanish Civil War, including weaponry, can be found.
The occupation evidence corresponding to the Middle Magdalenian period is situated within the context of significant human presence of a similar chronology in the Nalón Valley. This leads to the formulation of new hypotheses regarding the organization of space, mobility, and territoriality during the Upper Paleolithic [3]. Thus, the consideration of a new type of settlement, defined as a “secondary camp” based on the evidence from the OL.2 level, opens the door to new interpretative perspectives regarding the cultural, economic and social space that defines Magdalenian territories.
1
We use the expression “years old” because, in the case of OSL dating, is not appropriate to use the term “BP”, which should be restricted to radiocarbon dates, as recently was pointed out [36].

Author Contributions

J.F.J.P.: conceptualization, field work, methodology, collection of the sample material, writing—original draft, figure preparation, review and editing; D.A.A.: conceptualization, field work, methodology, collection of the sample material, writing—original draft, figure preparation, review and editing; M.A.H.: conceptualization, field work, methodology, writing—original draft, review and editing; D.B.: field work, methodology, writing—original draft, figure preparation and review; P.C., methodology, soil analyses, writing—original draft, figure preparation and review; A.H.C., field work, methodology, collection of the sample material; J.S.: methodology, U/Th analyses, writing—original draft, figure preparation; S.G.: methodology, OSL analyses, writing—original draft, figure preparation; M.J.S.: field work, methodology, writing—original draft, figure preparation and review. All authors have read and agreed to the published version of the manuscript.

Funding

The excavation in El Olivo Cave was funded by the Llanera City Council and Fluor S.A. This work has been carried out within the projects CantabricOIS2 (PID2020-115192GB-I00) funded by the Government of Spain, and FUO-367-16 funded by the University of Oviedo Foundation. DB is affiliated to Plan Andaluz de Investigación, Desarrollo e Innovación 2020 (Junta de Andalucía, Spain) and both DB and MJS belong to the GEOCANTABRICAE Project (SV-PA-21-AYUD/2021/51766, FEDER-FICYT).

Acknowledgments

This article is a contribution to the research projects CantabricOIS2 (PID2020-115192GB-I00) and FUO-367-16 funded by the University of Oviedo Foundation.

Conflicts of Interest

The authors declare no conflict of interest.

References

  1. Álvarez-Alonso, D. El Paleolítico en la cuenca del río Aboño (Llanera). Excavaciones en los yacimientos de El Barandiallu y la cueva del Olivo. Excavaciones Arqueológicas en Asturias 2007-2012; Consejería de Cultura, Principado de Asturias: Oviedo, Spain, 2013; Volume 7, pp. 57–68. [Google Scholar]
  2. Álvarez-Alonso, D. La cueva del Olivo (Llanera). Un nuevo yacimiento magdaleniense en el centro de Asturias. Nailos: estudios interdisciplinares de arqueología 2014, 1, 181–192. Available online: https://nailos.org/index.php/nailos/article/view/62/69.
  3. Álvarez-Alonso, D.; de Andrés Herrero, M.; Álvarez Fernández, E.; García-Ibaibarriaga, N.; Jordá Pardo, J.F.; Rojo, J. Los ‘campamentos secundarios’ en el Magdaleniense cantábrico: resultados preliminares de la excavación en la cueva del Olivo (Llanera, Asturias). In Cien Años de arte rupestre paleolítico. Centenario del descubrimiento de la cueva de la Peña de Candamo (1914-2014); Corchón, Mª. S., Menéndez Fernández, M., Eds.; Acta salmanticensia. Estudios históricos y geográficos; Universidad de Slamanca: Salamanca, Spain, 2014; Volume 106, pp. 359–368. [Google Scholar]
  4. Álvarez-Alonso, D.; Álvarez- Fernández, E.; Andrés Herrero, M. de; Ballesteros, D.; Domínguez, M.; García-Ibaibarriaga, N.; Jordá-Pardo, J.F.; Yravedra, J. Excavaciones en el yacimiento paleolítico de la cueva del Olivo (Pruvia, Llanera): campañas 2013-2016. Excavaciones Arqueológicas en Asturias 2013-2016; Consejería de Cultura, Principado de Asturias: Oviedo, Spain, 2018; Volume 6, pp. 121–132. [Google Scholar]
  5. Álvarez-Alonso, D.; Andrés Herrero, M. de; Hevia Carrillo, A.; Mielgo Villalpando, C.; Yravedra, J. La cueva del Olivo (Pruvia, Llanera). Campaña de 2017. Excavaciones Arqueológicas en Asturias 2017-2020. Consejería de Cultura, Principado de Asturias: Oviedo, Spain, 2022; Volume 8, pp. 8992.
  6. Álvarez-Alonso, D.; Rodríguez Asensio, J.A.; Jordá Pardo, J.F. Reflexiones en torno a la caracterización tecnotipológica del yacimiento de Bañugues (Asturias, España) en el marco del Paleolítico medio del norte de la Península Ibérica. Munibe 2014, 65, 5–24. Available online: https://www.aranzadi.eus/fileadmin/docs/Munibe/2014005024AA.pdf. [CrossRef]
  7. Álvarez-Alonso, D.; Jordá Pardo, J.F.; Carral, P.; Flor Blanco, G.; Flor, G.; Iriarte-Chiapusso, Mª.J.; Kehl, M.; Klasen, N.; Maestro, A.; Rodríguez Asensio, J.A.; Weniger, G.-Ch. At the edge of the Cantabrian sea. New data on the Pleistocene and Holocene site of Bañugues (Gozón, Asturias, Spain): Palaeogeography, geoarchaeology and geochronology. Quaternary International 2020, 566–567, 284–302. [Google Scholar] [CrossRef]
  8. Estrada García, R.; Jordá Pardo, J.F. Arqueología y gas natural: el Paleolítico medio de El Barandiallu (Villabona, Llanera, Asturias central). Península Ibérica. In XI Reunión Nacional de Cuaternario, Oviedo (Asturias), 2 - 3 y 4 de julio 2003; AEQUA and Universidad de Oviedo, Oviedo, 2003; 253-260.
  9. Álvarez Alonso, D. Las cadenas operativas líticas de El Barandiallu (Asturias, norte de Iberia): adaptación y variabilidad tecnológica en el contexto del Musteriense cantábrico. Munibe 2017, 68, 49–72. Available online: https://www.aranzadi.eus/fileadmin/docs/Munibe/maa.2017.68.11.pdf.
  10. Merino-Tomé, O.; Suárez Rodríguez, A.; Alonso, J.; González Menéndez, L.; Heredia, N.; Marcos, A. Mapa Geológico Digital continuo E. 1:50.000, Principado de Asturias (Zonas: 1100-1000-1600); Navas, J., Ed.; GEODE. Mapa Geológico Digital continuo de España; SIGECO-IGME: Madrid, 2013. [Google Scholar]
  11. Schiffer, M.B. Formation Processes of the Archaeological Record; University of New Mexico Press: Albuquerque, USA, 1987. [Google Scholar]
  12. Wood, W.R.; Johnson, D.L. A survey of disturbance processes in archaeological site formation. In Advances in Archaeological Method and Theory, 1; Academic Press: New York, USA, 1978; pp. 315–381. [Google Scholar]
  13. Ballesteros, D.; Jiménez-Sánchez, M.; Giralt, S.; García-Sansegundo, J.; Meléndez-Asensio, M. A multi-method approach for speleogenetic research on alpine karst caves. Torca La Texa shaft, Picos de Europa (Spain). Geomorphology 2015, 247, 35–54. [Google Scholar] [CrossRef]
  14. Heeb, B. An all-in-one electronic cave surveying device. Cave Radio and Electronics Group Journal 2009, 72, 8–10. [Google Scholar]
  15. Fish, L. Computer Modelling of Cave Passages. Compass & Tape 2001, 15, 19–24. [Google Scholar]
  16. Blott, S.J.; Pye, K. GRADISTAT: A grain size distribution and statistics package for the analysis of unconsolidated sediments. Earth Surface Processes and Landforms 2001, 26, 1237–1248. [Google Scholar] [CrossRef]
  17. Blott, S.J. GRADISTAT Version 8.0. In A Grain Size Distribution and Statistics Package for the Analysis of Unconsolidated Sediments by Sieving or Laser Granulometer; Kenneth Pye Associates Ltd., Crowthorne Enterprise Centre, Old Wokingham Road: Crowthorne, UK, 2010. [Google Scholar]
  18. Udden, J.A. Mechanical composition of clastic sediments. Bulletin of the Geological Society of America 1914, 25, 655–744. [Google Scholar] [CrossRef]
  19. Wentworth, C.K. A scale of grade and class terms for clastic sediments. Journal of Geology 1922, 30, 377–392. Available online: https://www.journals.uchicago.edu/doi/epdf/10.1086/622910. [CrossRef]
  20. Chung, F.H. Quantitative interpretation of X-Ray diffraction patterns. III. Simultaneous determination of a set of reference intensities. Journal of Applied Crystallography 1975, 8, 17–19. [Google Scholar] [CrossRef]
  21. Munsell, A.H. A color notation: an illustrated system defining all colors and their relations by measured scales for Hue, Value and Chroma. 14th ed.; Munsell Color, Baltimore, USA, 1981.
  22. Thomas, G.W. Soil pH and soil acidity. Methods of Soil Analysis, Part 3 - Chemical Methods; Soil Science Society of America: Madison, USA, 1996; pp. 475–490. [Google Scholar]
  23. Bischoff, J.L.; Julià, R.; Mora, R. Uranium-series dating of the Mousterian occupation at at Abric Romaní, Spain. Nature 1988, 332, 68–70. [Google Scholar] [CrossRef]
  24. Talvitie, N.A. , Electrodeposition of actinides for alpha spectrometric determination. Analytical Chemistry 1972, 44, 280–283. [Google Scholar] [CrossRef]
  25. Hallstadius, L. A method for the electrodeposition of actinides. Nucl. Instrum. Methods Phys. Res. 1984, 223, 266–267. [Google Scholar] [CrossRef]
  26. Ivanovich, M.; Harmon, R.S. Uranium-Series Disequilibrium: Applications to Earth, Marine, and Environmental Sciences; Clarendon Press: Oxford, UK, 1992; 910 pp. [Google Scholar]
  27. Rosenbauer, R.J. UDATE1: a computer program for the calculation of Uranium- series isotopic ages. Comput. Geosci. 1991, 17, 45–75. [Google Scholar] [CrossRef]
  28. Murray, A.S.; Wintle, A.G. The single aliquot regenerative dose protocol: potential for improvements in reliability. Radiation Measurements 2003, 37, 377–381. [Google Scholar] [CrossRef]
  29. Murray, A.S.; Wintle, A.G. Luminescence dating of quartz using an improved single-aliquot regenerative-dose protocol. Radiation Measurements 2000, 32, 57–73. [Google Scholar] [CrossRef]
  30. Galbraith, R.; Roberts, R.; Laslett, G.; Yoshida, H.; Olley, J. Optical dating of single and multiple grains of quartz from Jinmium Rock Shelter, Northern Australia: Part I. Experimental design and statistical models. Archaeometry 1999, 41, 339–364. [Google Scholar] [CrossRef]
  31. Brennan, B.J. Beta doses to spherical grains. Radiation Measurements 2003, 37, 299–303. [Google Scholar] [CrossRef]
  32. Prescott, J.R.; Hutton, J.T. Cosmic ray contributions to dose rates for luminescence and ESR dating: large depths and long term variations. Radiation Measurements 1994, 23, 497–500. [Google Scholar] [CrossRef]
  33. Guerin, G.; Mercier, N.; Adamiec, G. Dose-rate conversion factors: update. Ancient TL 2011, 29, 5–8. Available online: http://ancienttl.org/ATL_29-1_2011/ATL_29-1_Guerin_p5-8.pdf.
  34. Reimer, P.J.; Bard, E.; Bayliss, A.; Beck, C.W.; Blackwell, G.; Bronk Ramsey, C.; Buck, C.E.; Cheng, H.; Edwards, R.L.; Friedrich, M.; Grootes, P.M.; Guilderson, T.P.; Haflidason, H.; Hajdas, I.; Hatté, C.; Heaton, T.J.; Hoffmann, D.L.; Hogg, A.G.; Hughen, K.A.; Kaiser, K.F.; Kromer, B.; Manning, S.; Niu, M.; Reimer, R.W.; Richards, D.A.; Marian Scott, E.; Southon, J.R.; Staff, R.A.; Turney, C.S.M.; Van der Plicht, J. INTCAL13 and Marine 13 radiocarbon age calibration curves 0–50,000 years cal BC. Radiocarbon 2013, 55, 1869–1887. [Google Scholar] [CrossRef]
  35. Reimer, P.J.; Austin, W.E.N.; Bard, E.; Bayliss, A.; Blackwell, P.G.; Bronk Ramsey, C.; Butzin, M.; Cheng, H.; Edwards, R.L.; Friedrich, M.; Grootes, P.M.; Guilderson, T.P.; Hajdas, I.; Heaton, T.J.; Hogg, A.G.; Hughen, K.A.; Kromer, B.; Manning, S.W.; Muscheler, R.; Palmer, J.G.; Pearson, C.; van der Plicht, J.; Reimer, R.W.; Richards, D.A.; Scott, E.M.; Southon, J.R.; Turney, C.S.M.; Wacker, L.; Adolphi, F.; Büntgen, U.; Capano, M.; Fahrni, S.M.; Fogtmann-Schulz, A.; Friedrich, R.; Köhler, P.; Kudsk, S.; Miyake, F.; Olsen, J.; Reinig, F.; Sakamoto, M.; Sookdeo, A.; Talamo, S. The IntCal20 Northern Hemisphere Radiocarbon Age Calibration Curve (0–55 cal k BP). Radiocarbon 2020, 62, 725–757. [Google Scholar] [CrossRef]
  36. Silva, P.G. Métodos de datación en el Cuaternario: La Cartografía del Cuaternario en España y la controversia del concepto “Datación Absoluta”. Cuaternario y Geomorfología 2022, 36, 9–18. [Google Scholar]
  37. Jordá Pardo, J.F.; Carral González, P. Estudio litoestratigráfico, sedimentológico y edafológico del registro del Pleistoceno superior de la cueva de Coímbre (zona B) (Asturias, España). In La cueva de Coímbre (Peñamellera Alta, Asturias); Fundación Masaveu: Oviedo, 2017; pp. 170–185. [Google Scholar]
  38. Ballesteros, D.; Giralt, S.; García-Sansegundo, J.; Jiménez-Sánchez, M. Quaternary Regional Evolution Based on Karst Cave Geomorphology in Picos de Europa (Atlantic Margin of the Iberian Peninsula). Geomorphology 2019, 336, 133–51. [Google Scholar] [CrossRef]
  39. Arriolabengoa, M.; Intxaurbe, I.; Medina Alcaide, M.A.; Rivero, O.; Rios Garaizar, J.; Líbano, I.; Bilbao, P.; Aranburu, A.; Cheng, H.; Edwards, R.L.; Gárate, D. L.; Gárate, D. From Cave Geomorphology to Palaeolithic Human Behaviour : Speleogenesis, Palaeoenvironmental Changes and Archaeological Insight in the Atxurra - Armiña Cave (Northern Iberian Peninsula). Journal of Quaternary Science 2020, 1–13. [Google Scholar] [CrossRef]
  40. Flor, G.; Peón, A. Rasas y superficies de erosión continental en el relieve alpídico del noroeste peninsular y los depósitos terciarios. In Geomorfología do NW da Península Ibérica; Araújo, M.A., Gomes, A., Eds.; Faculdade de Letras da Universidade do PortoPorto, Portugal, 2004; pp. 13–31.
  41. Álvarez-Lao, D.J.; García, N. ; García, N. Chronological Distribution of Pleistocene Cold-Adapted Large Mammal Faunas in the Iberian Peninsula. Quaternary International 2010, 212, 120–28. [Google Scholar] [CrossRef]
  42. Pinto-Llona, A.C.; Clark, G.; Karkanas, P.; Blackwell, B.; Skinner, A.R.; Andrews, P.; Reed, K.; Miller, A.; Macías-Rosado, R.; Vakiparta, J. The Sopeña Rockshelter, a New Site in Asturias (Spain) Bearing Evidence on the Middle and Early Upper Palaeolithic in Northern Iberia. Munibe Antropologia-Arkeologia 2012, 63, 45–79. Available online: https://www.aranzadi.eus/fileadmin/docs/Munibe/2012045079AA.pdf.
  43. Álvarez-Lao, D.J.; Ruiz-Zapata, M.B.; Gil-García, M.J.; Ballesteros, D.; Jiménez-Sánchez, M. ; Ruiz-Zapata, M.B.; Gil-García, M.J.; Ballesteros, D.; Jiménez-Sánchez, M. Palaeoenvironmental Research at Rexidora Cave: New Evidence of Cold and Dry Conditions in NW Iberia during MIS 3. Quaternary International 2015, 379, 35–46. [Google Scholar] [CrossRef]
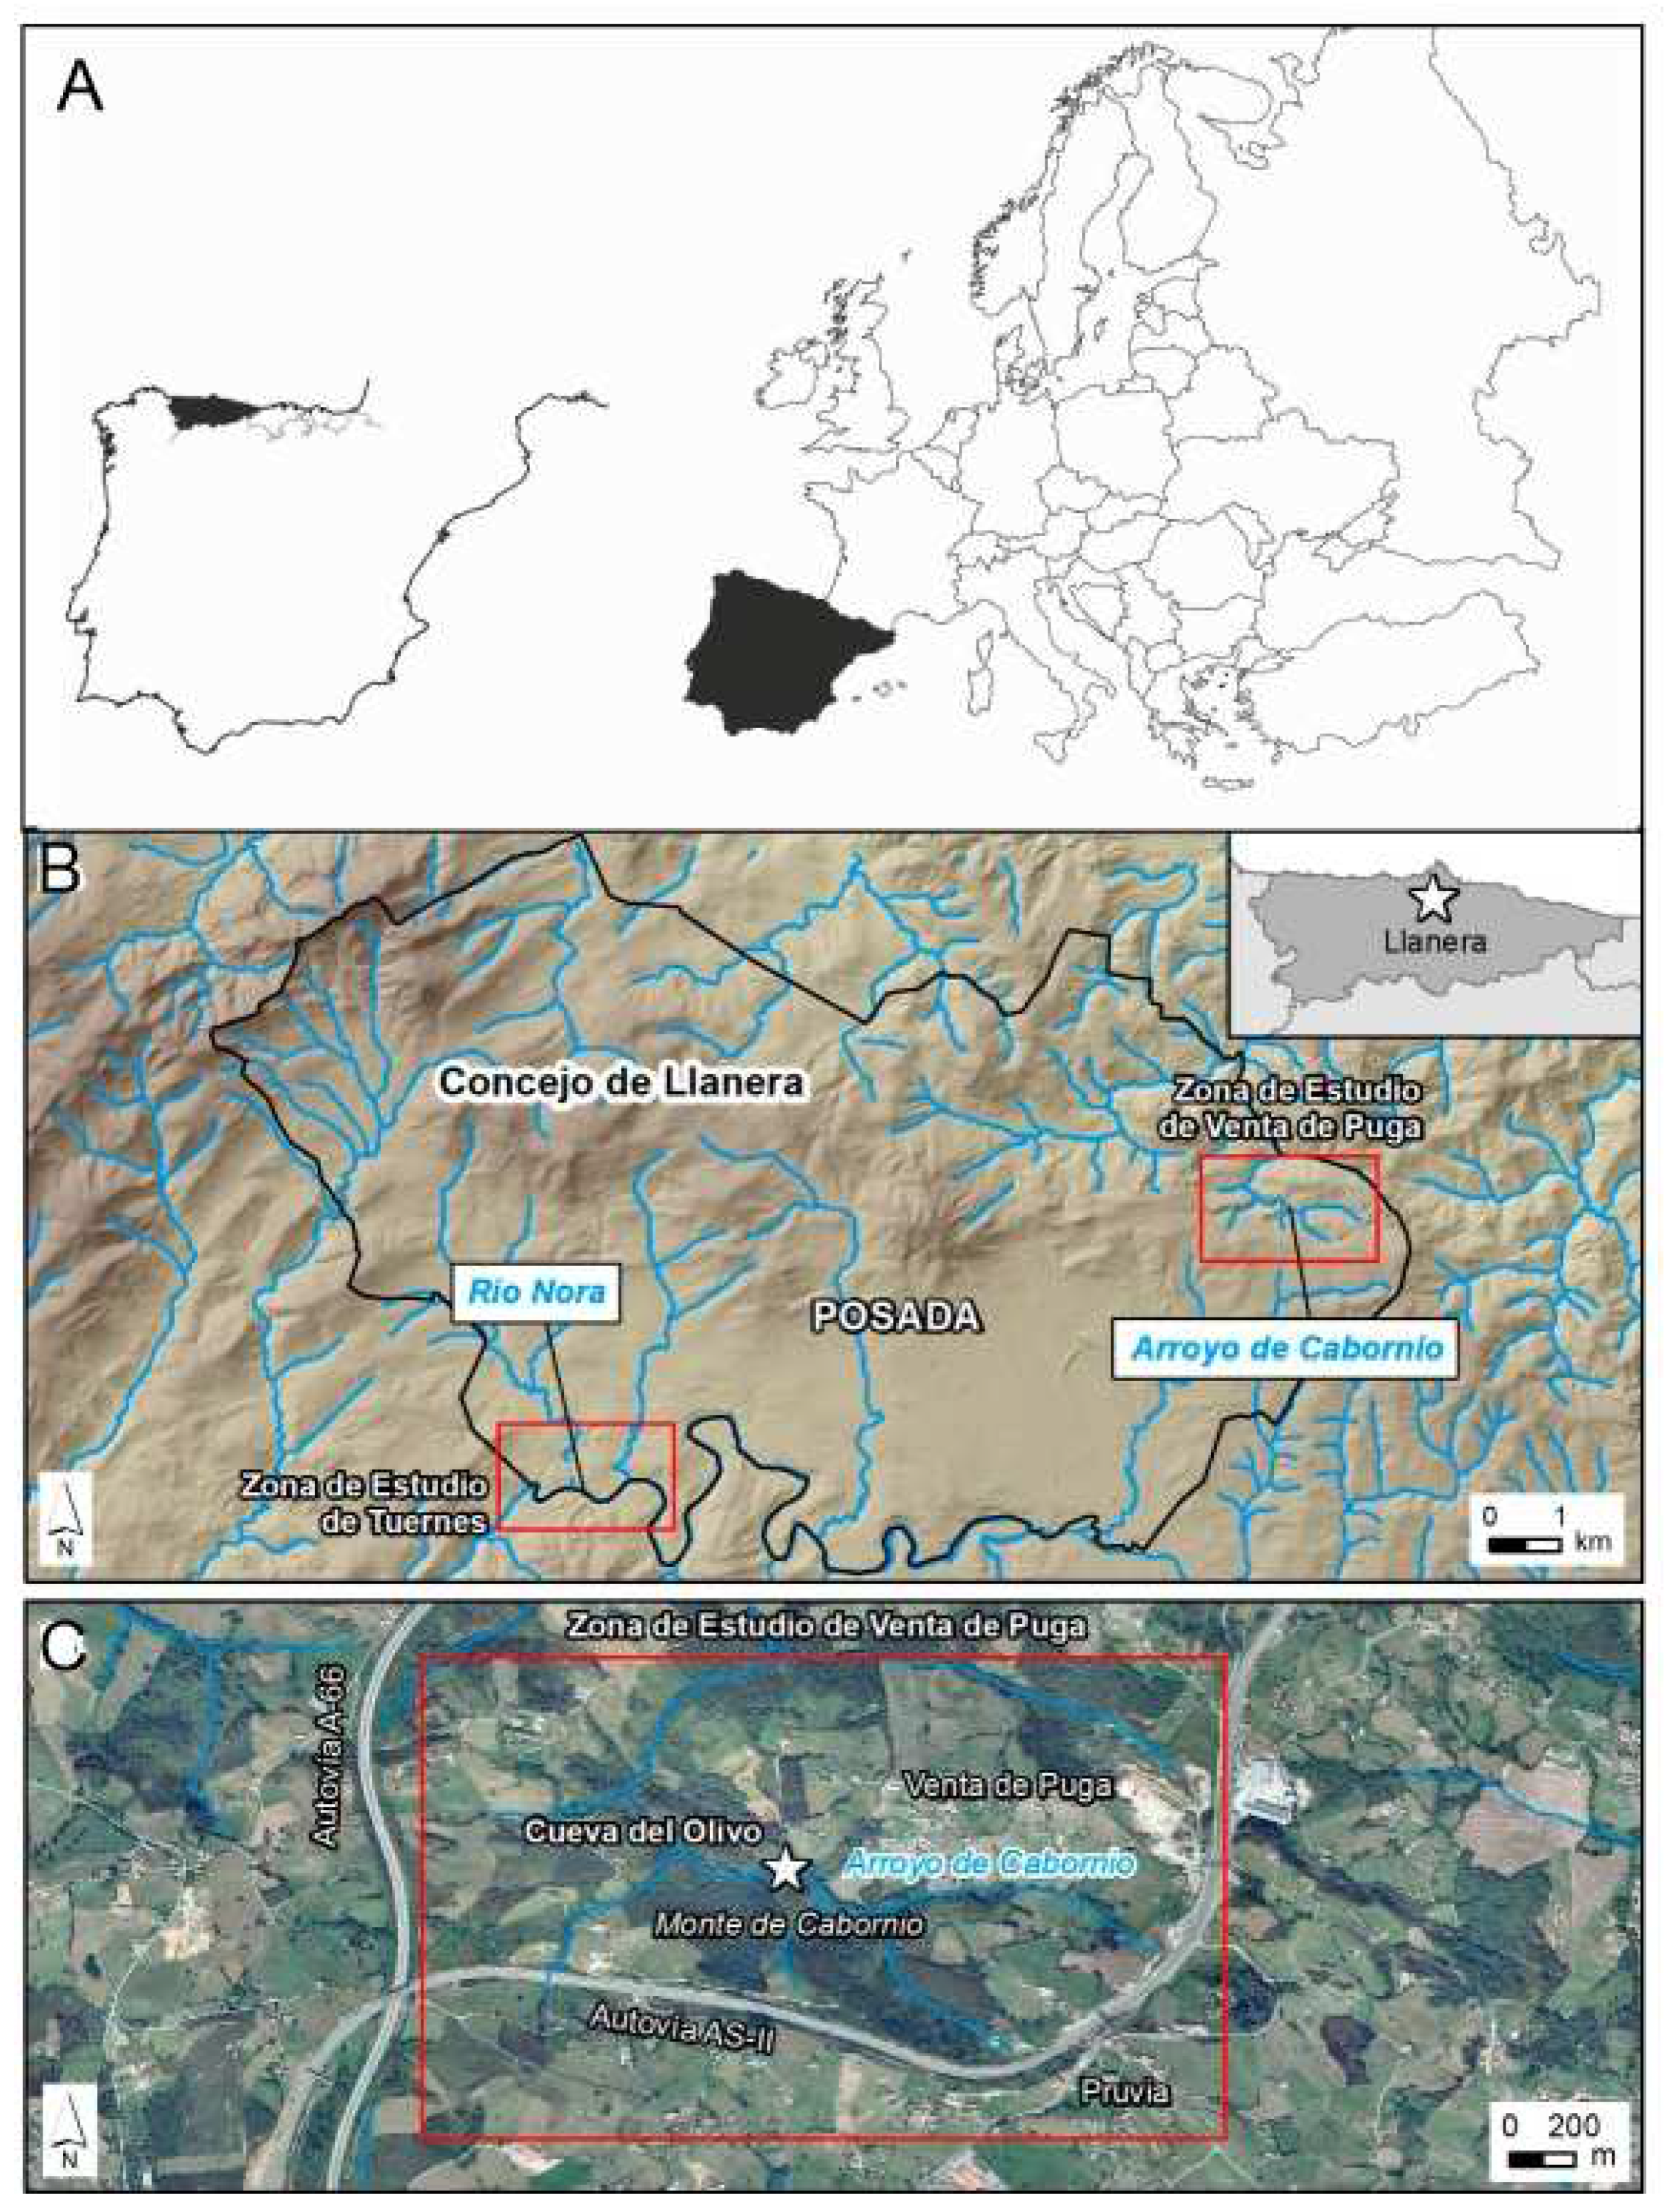
Figure 1. (A) Location of El Olivo Cave in the northern Iberian Peninsula. (B) Geological areas in the surroundings of the cave, which is in the Aboño River basin. Geology after [10].
Preprints 80488 g001
Figure 2. General view with the location of El Olivo Cave (A, yellow arrow), detail of its access (B) and interior of the cave showing the excavated areas (C).
Preprints 80488 g002
Figure 3. El Olivo Cave plan [4].
Preprints 80488 g003
Figure 4. (A) El Olivo Cave showing the archaeological excavation into fluvial deposits at the cave entrance. (B) Cave geomorphological map with the perched flowstone projected outside the cave outline because it is preserved on the cave walls. (C) Profile from the cave to the present-day fluvial network, showing the position of the perched flowstone (which marks a former cave floor) and the cave detrital infill made of fluvial and breakdown sediments with archaeological remains. (E) Fluvial deposits with quartzite and sandstone pebbles reported in the archaeological excavation performed inside the cave.
Preprints 80488 g004
Figure 5. Alluvial deposits associated with the Cabornio Stream in the surroundings of El Olivo Cave. Alluvial sediments came from the erosion of the Llanera plain, made of Paleogene conglomerate and sandstone. The plain surface is being captured by the Aboño River basin at the present time.
Preprints 80488 g005
Figure 6. El Olivo Cave. A, General view of the stratigraphic profile from the entrance; B, Detail of the previous view; C, Details of the stratigraphic sequence.
Preprints 80488 g006
Figure 7. El Olivo Cave. Interior trench stratigraphy.
Preprints 80488 g007
Figure 8. El Olivo Cave. Photographs of the sampling points of OL.Arenas anteriores and OL.Arenas exteriors.
Preprints 80488 g008
Figure 9. El Olivo Cave. Stratigraphy outside the cave.
Preprints 80488 g009
Figure 10. El Olivo Cave, inner excavation. A, granulometry of the global fraction. B, Granulometry of the fine fraction (< 2mm).
Preprints 80488 g010
Figure 11. El Olivo Cave, outer excavation and samples of sand; granulometry of the global fraction.
Preprints 80488 g011
Figure 12. El Olivo Cave. A, triangular diagram representing the global fraction of the sediments from the interior and exterior excavations. B, Triangular diagram representing the fine fraction (< 2mm) of sediments from the interior and exterior excavations.
Preprints 80488 g012
Figure 13. El Olivo Cave. Granulometric curves representing the global fraction of the samples in the G-A family.
Preprints 80488 g013
Figure 15. El Olivo Cave. Granulometric curves representing the global fraction of the samples in the G-B2 family.
Preprints 80488 g014
Figure 16. El Olivo Cave. Granulometric curves representing the global fraction of the samples in the G-B3 family.
Preprints 80488 g015
Figure 17. El Olivo Cave. Granulometric curves representing the fine fraction of the samples in the F-1 family.
Preprints 80488 g016
Figure 18. El Olivo Cave. Granulometric curves representing the fine fraction of the samples in the F-2 family.
Preprints 80488 g017
Figure 19. El Olivo Cave. XRD mineralogy of the fine fraction of the sediments from the interior and exterior excavations.
Preprints 80488 g018
Figure 20. El Olivo Cave. Calcium carbonate, organic charcoal and organic matter of the sediments from the interior and exterior excavations.
Preprints 80488 g019
Figure 21. El Olivo Cave. Color according to Munsell scale (1981) of the sediments from the interior and exterior excavations.
Preprints 80488 g020
Figure 22. El Olivo Cave. pH of the sediments from the interior and exterior excavations.
Preprints 80488 g021
Figure 23. Paleogeographic evolution of El Olivo Cave: (A) Phase 1: cave formation within Cretaceous bedrock covered by Paleogene rocks (Llanera plain). (B) Phase 2: Erosion of the northern Llanera plain due to fluvial incision and headwater upstream migration; cave aggradation until 189 ± 17 ka. (C) Phase 3: Partial erosion of the former cave infill coeval to fluvial incision. (D) Phase 4: alluvial deposition inside the cave in relation to alluvial fans during OIS-2. (E) Phase 5: fluvial incision up to present-day coevally with human frequentation.
Preprints 80488 g022
Table 1. Dates obtained in El Olivo Cave.
Preprints 80488 i001
Disclaimer/Publisher’s Note: The statements, opinions and data contained in all publications are solely those of the individual author(s) and contributor(s) and not of MDPI and/or the editor(s). MDPI and/or the editor(s) disclaim responsibility for any injury to people or property resulting from any ideas, methods, instructions or products referred to in the content.
Copyright: This open access article is published under a Creative Commons CC BY 4.0 license, which permit the free download, distribution, and reuse, provided that the author and preprint are cited in any reuse.
Prerpints.org logo

Preprints.org is a free preprint server supported by MDPI in Basel, Switzerland.

Subscribe

© 2024 MDPI (Basel, Switzerland) unless otherwise stated