Preprint
Article

Impact of SLC22A1 Variants rs622342 and rs72552763 on HbA1c and Metformin Plasmatic Concentration Levels among Mexican DMT2 Patients

Altmetrics

Downloads

167

Views

158

Comments

0

Submitted:

25 July 2023

Posted:

27 July 2023

You are already at the latest version

Alerts
Abstract
This study reports on allelic and genotypic frequencies of OCT1, OCT2, OCT3 polymorphisms among metformin-treated DMT2 patients. It also reports the association with HbA1c control on 59 DMT2 patients. They were genotyped through real-time PCR (TaqMan assays). Metformin plasmatic levels were determined through mass spectrometry. Neither the analysis of HbA1c control by SNPs in SLC22A1, SLC22A2, and SLC22A3, nor the dominant genotypic model analysis yielded statistical significance across genotypes in polymorphisms rs72552763 (p=0.4678), rs622342 (p= 0.2215), rs316019 (p=0.2209), and rs2076828 (p=0.215). HbA1c levels were different in rs72552763 (p= 0.0220) and rs622342 (p=0.0093) genotypes. The dominant genotypic model found the lowest HbA1c levels by GAT/GAT (p= 0.0058) and A/A (p=0.0108), in rs72552763 and rs622342 respectively. We may conclude that rs72552763 and rs622342 polymorphisms in SLC22A1, exercise a relevant effect in metformin response determined by HbA1c levels among Mexican-Mestizo DMT2 patients.
Keywords: 
Subject: Medicine and Pharmacology  -   Medicine and Pharmacology

1. Introduction

The UN and WHO have pointed to diabetes as the greatest health issue from a global epidemic prospect [1]. Global diagnosis criteria have already been synchronised between the WHO, the International Diabetes Federation (IDF), and the American Diabetes Association (ADA)[1]. The 2021 edition of IDF’s atlas estimates that 537 million adults between 20 and 79 years of age live with diabetes (10.5% prevalence), of whom 90% are type 2 patients [2]. Moreover, 240 million people are undiagnosed, meaning that almost half of the world’s diabetic patients are not aware of their ailment [2]. By 2045, about 783 million people will suffer from diabetes (12.2% prevalence).
In Mexico, the Secretary of Health, through the National Institute for Public Health (INSP), has carried out the National Health and Nutrition Survey (ENSANUT) for over 25 years. According to the latest data of ENSANUT 2021 COVID 19 [3], diabetes’ prevalence was 11.1% (IC95%=9.5-12.8) in a country whose population was 128.9 million by 2020.
Glycaemic control is fundamental to treat diabetes. The United Kingdom Prospective Diabetes Study (UKPDS), confirmed that it significantly reduced complication rates among DMT2 patients [4]. This study’s results established that the HbA1c control objective <7% (53 mmol) reported a microvascular complication decrease among both type 1 and type 2 patients, thus DMT2 patient handling should be focused on adequate control of hyperglycaemia and other risk factors [5, 6].
Metformin is classified as a biguanide and it is considered an essential drug by the WHO. It is the first-line therapy because of its efficacy, safety, and cost. Besides, it has a beneficial effect on HbA1c and weight reduction, and it can reduce cardiovascular and death risks [4].
Metformin’s primary effect is the hepatic inhibition of gluconeogenesis, however, its action mechanism is still debated [7]. Patients receiving a daily dose between 500 and 2,550 mg reach a plasmatic concentration ranging from ~10 up to 40 µM.
Metformin’s consensus plasmatic concentration in treated humans ranges between 0.1 mg/L up to 4 mg/L (~10 a 40 µM) [7]. Metformin is a positively charged hydrophilic molecule, it is mainly transported by organic cations 1-3 (OCT1-3), equilibrant nucleoside transporter 4 (ENT4), and multidrug and toxin extrusions 1 and 2k (MATE 1 and MATE 2-k) [7, 8]. In the intestinal lumen, metformin is absorbed by enterocytes through ENT4 and OCT3, then it is released into the intravascular space through OCT1 and distributed across the organism. Hepatocytes engage on metformin through OCT1 and OCT3, excreting it biliary through MATE1, although that is not the only elimination path, as renal tubular cells engage on metformin in the intravascular space by way of OCT2, from where it is subsequently excreted as urine via MATE1, MATE2-k, and OCT1 [8]. Thus, metformin distribution in humans is consistent with these transporters’ expression, where higher concentrations are found in the liver, kidneys, and intestines, whilst lower uptakes are found in peripheral organs [7]. The efficacy and toxicity of any drug are determined by its pharmacokinetic and pharmacodynamic balance. Inherent genetic variations contribute to this variability, since multiple genes codify proteins directly involved in the aforementioned pharmacological balance [9]. Transporters involved in metformin’s pharmacokinetics and pharmacodynamics belong to the SLC (Solute Carrier) family. This superfamily encompasses a few groups such as OCTs. OCT1 is a 554 aminoacid protein with a molecular weight of 61,154 Da; it is codified by gene SLC22A1, located in the long arm of chromosome 6, in region 25.3 (6q25.3), possessing a total of 12 exons [10]. Like many other members of the SLC22 family, it has 12 helixes or transmembrane domains (TMDs), including a large extracellular loop between domains 6 and 7 [11]. SLC22A1 is a highly polymorphic gene, and its polymorphisms may induce an altered OCT1 function, which affects metformin’s pharmacokinetics and the eventual response to it [8, 12]. More than 23 genetic variants or single nucleotide polymorphisms (SNPs) have been identified for SLC22A1. This study focuses on one exonic (due to direct protein changes) and one intronic polymorphism (due to possible changes in the protein’s translation). The exonic polymorphism in question is rs72552763, since it may represent another 3: rs3567514, rs34305973, and rs35191146, located in exon 7, which would be found by TMD 9 in the final protein [11, 13]. The intronic OCT1 polymorphism is rs622342, a variant which affects transcription rate decrease [14]. Studying the frequence and functionality of these two polymorphisms could lead to identifying pharmacogenetic biomarkers of relevance in DMT2 therapeutic response.

2. Results

2.1. Clinical and Biochemical Data of the Studied Population

Out of 103 patients, 59 fulfilled inclusion criteria. As shown in Table 1 [15], patients were grouped by gender. Statistically significant differences only regarded height (p<0.001). HbA1c median was found at 6.30 (5.80 – 7.30) and 6.40 (6.10 – 7.85) respectively for men and women. Uncontrolled (HbA1c >7%) proportions were 29.42% for men and 26.19% for women, where no statistical significance regarding gender was found.

2.2. Allelic and Genotypic Frequencies of the Studied Polymorphisms among DMT2 Patients Undergoing Metformin Treatment

Table 2 shows the allelic and genotypic frequencies, as well as the p value for the Hardy-Weinberg equilibrium (HWE) test, which was > 0.05 across all analysed polymorphisms in every single case.

2.3. HbA1c Control by SNPs in SLC22A1, SLC22A2, and SLC22A3.

We assessed frequency distribution among controlled (HbA1c< 7%) and uncontrolled (HbA1c≥ 7%) patients. We analysed frequency distribution across the two groups based on both polymorphism genotype and dominant genotypic model for every SNP; yet, no statistical significance was found (Table 3).

2.4. Studied Biomarker Values by Genotypic Model

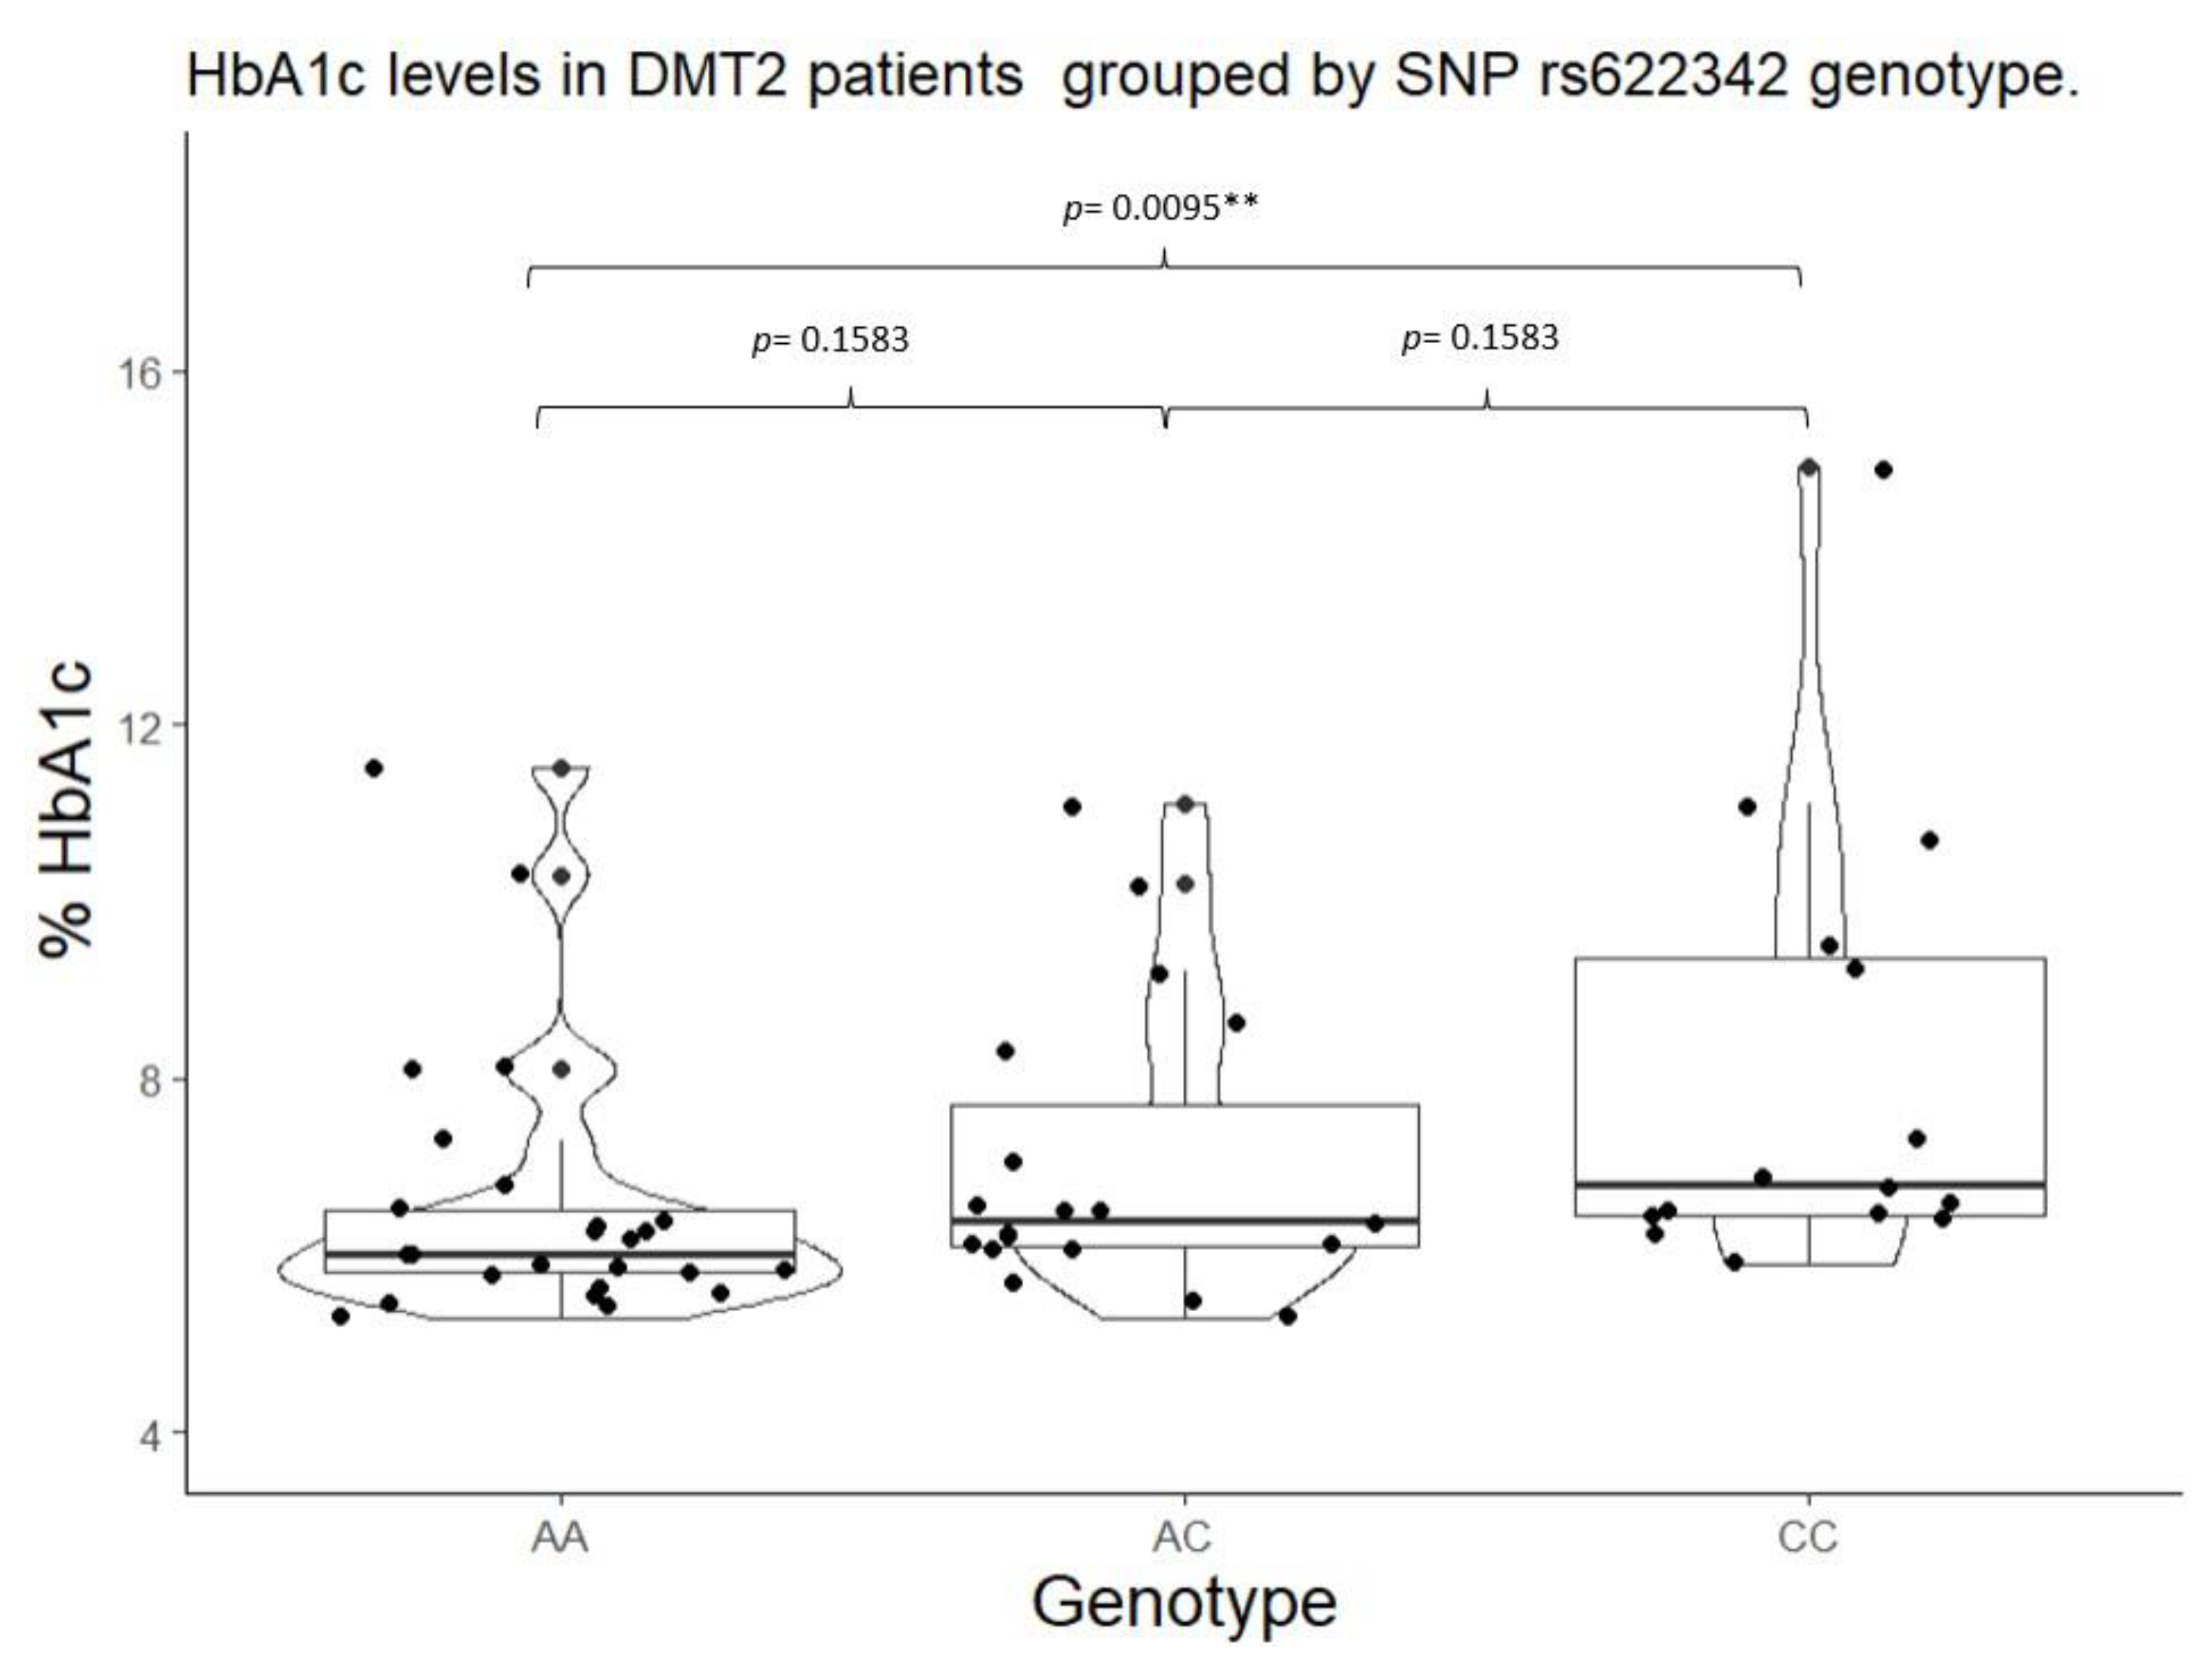
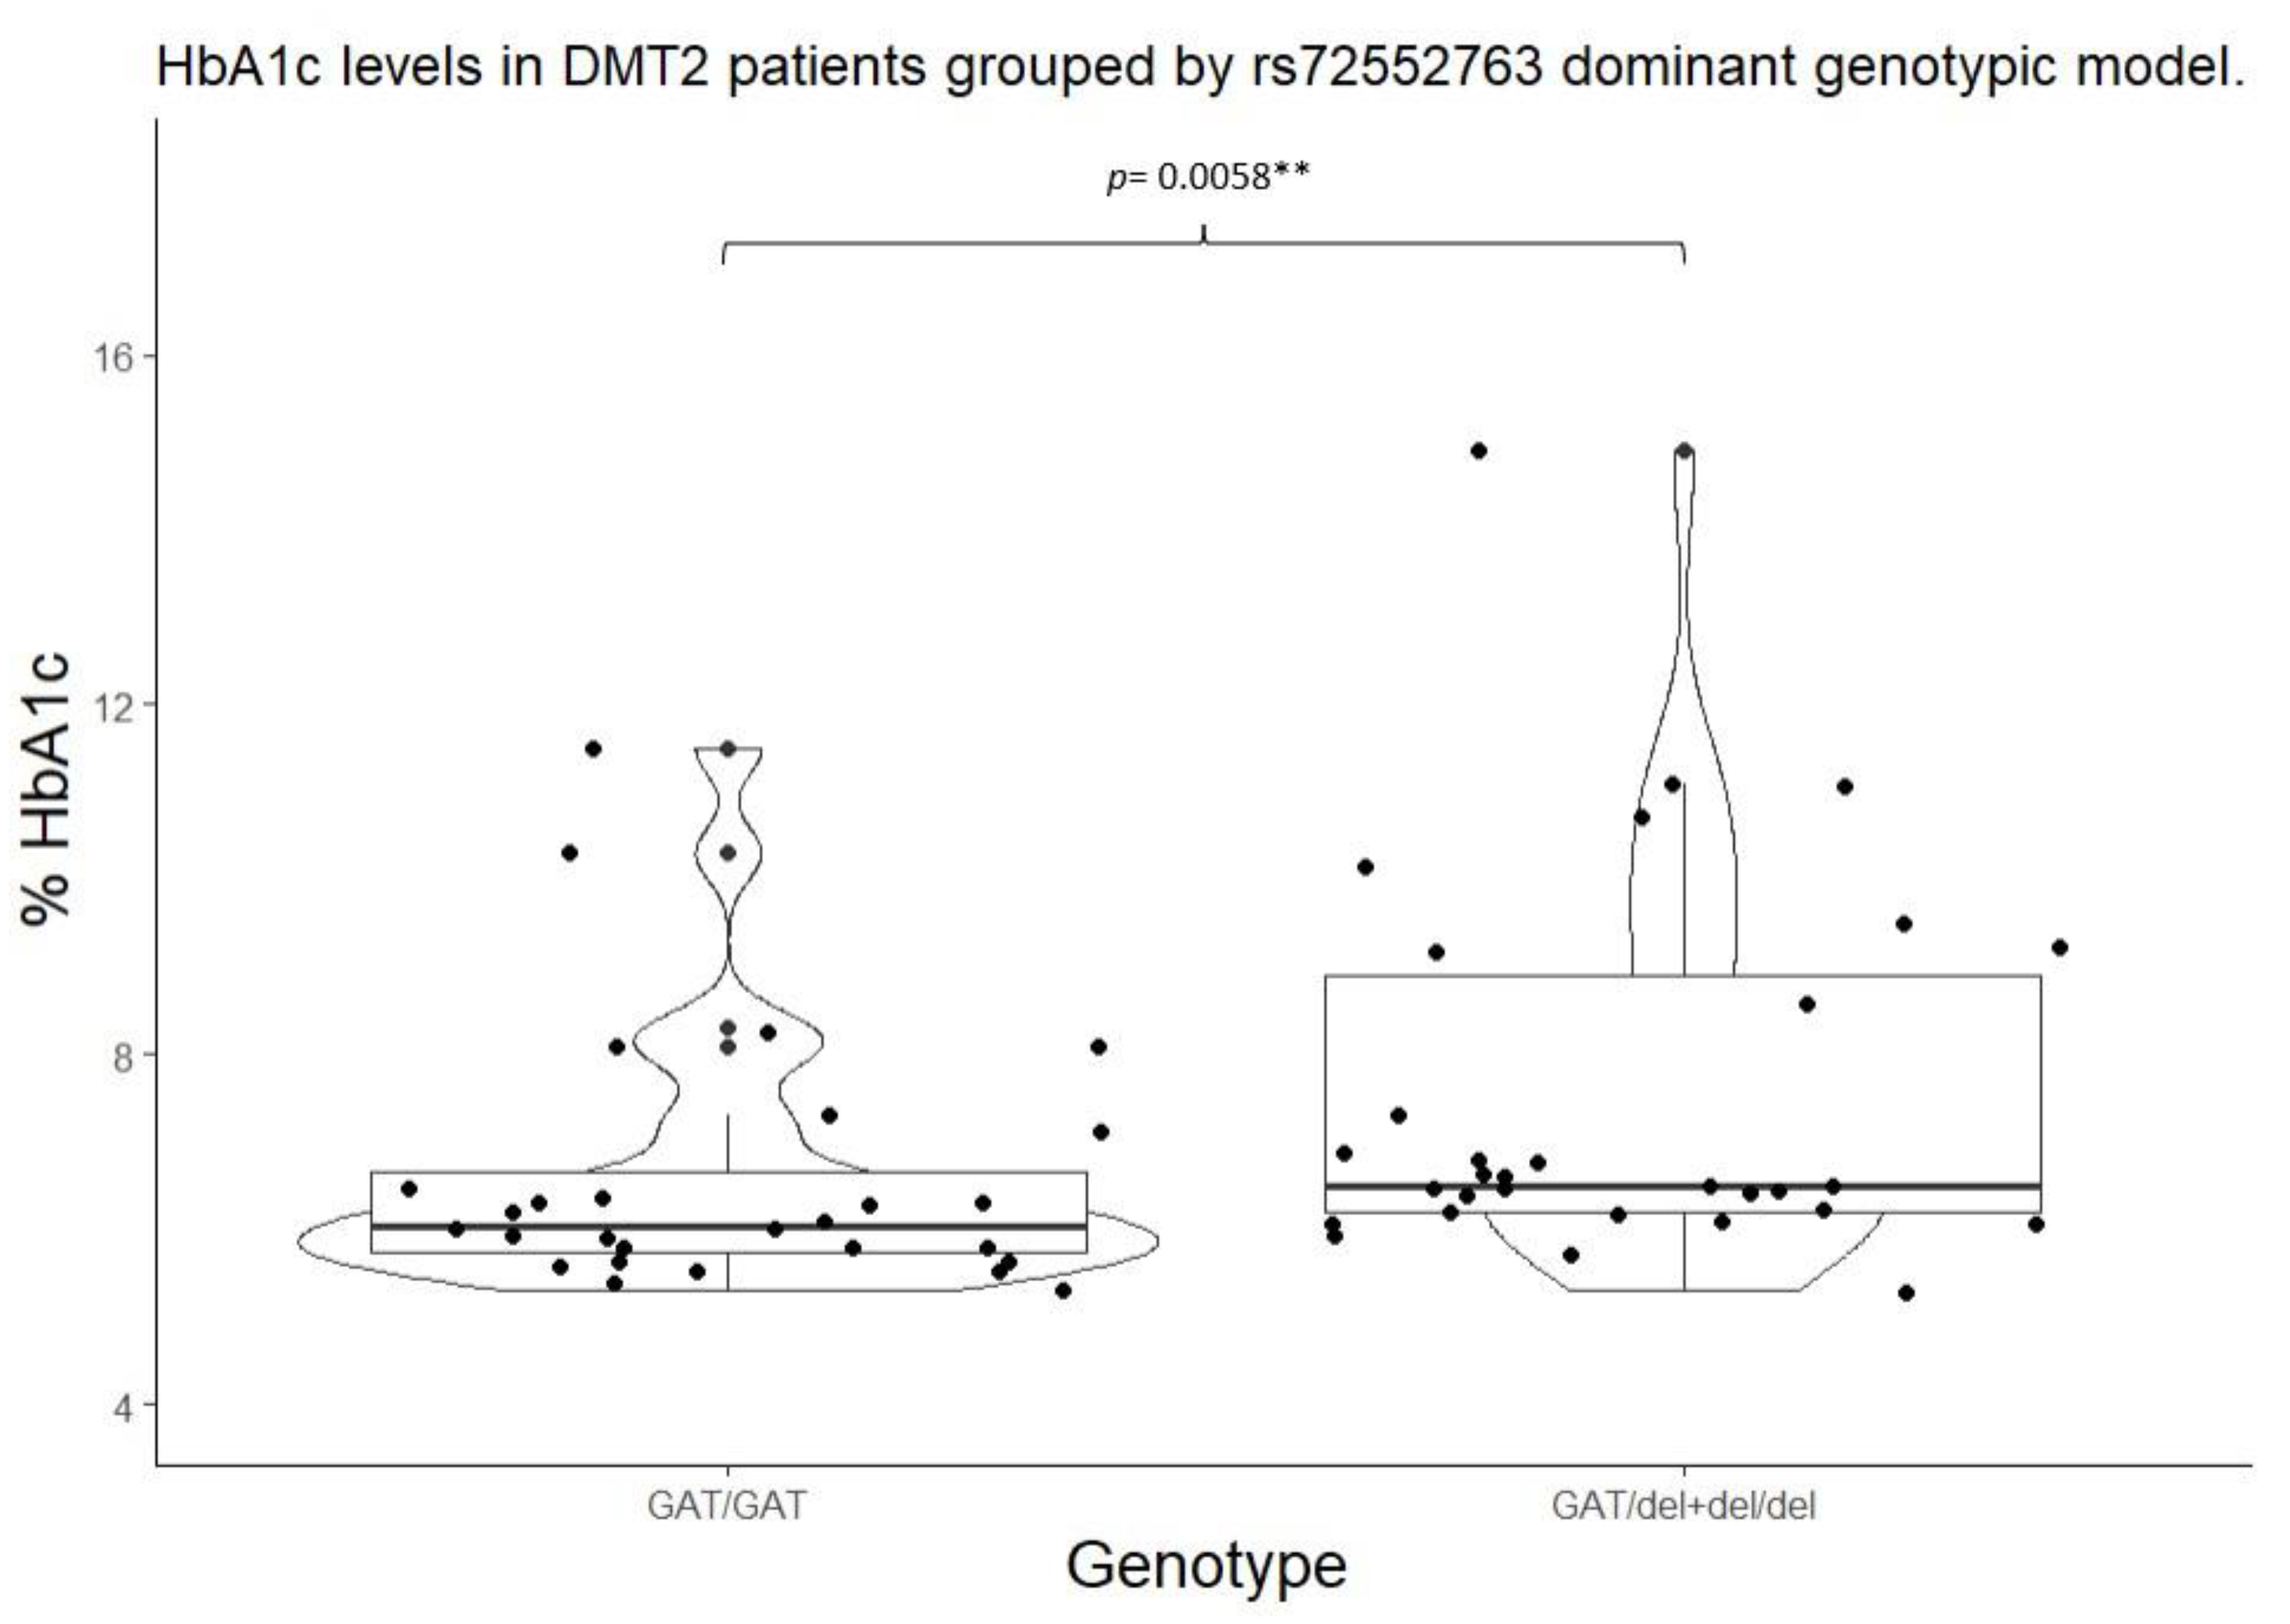
We conducted a statistical inference across the different SNP genotypes and grouped them according to an individualised genotypic model (Table 4). There were significant differences in HbA1c levels by rs72552763 (p=0.0220) and rs622342 (p=0.0093) in SLC22A1; however, this result found no echo in fasting glucose levels. The pertaining post hoc trials revealed a statistical difference (p<0.05) by GAT/del (Figure 1) and CC in rs72552763 and rs622342 (Figure 2) respectively.
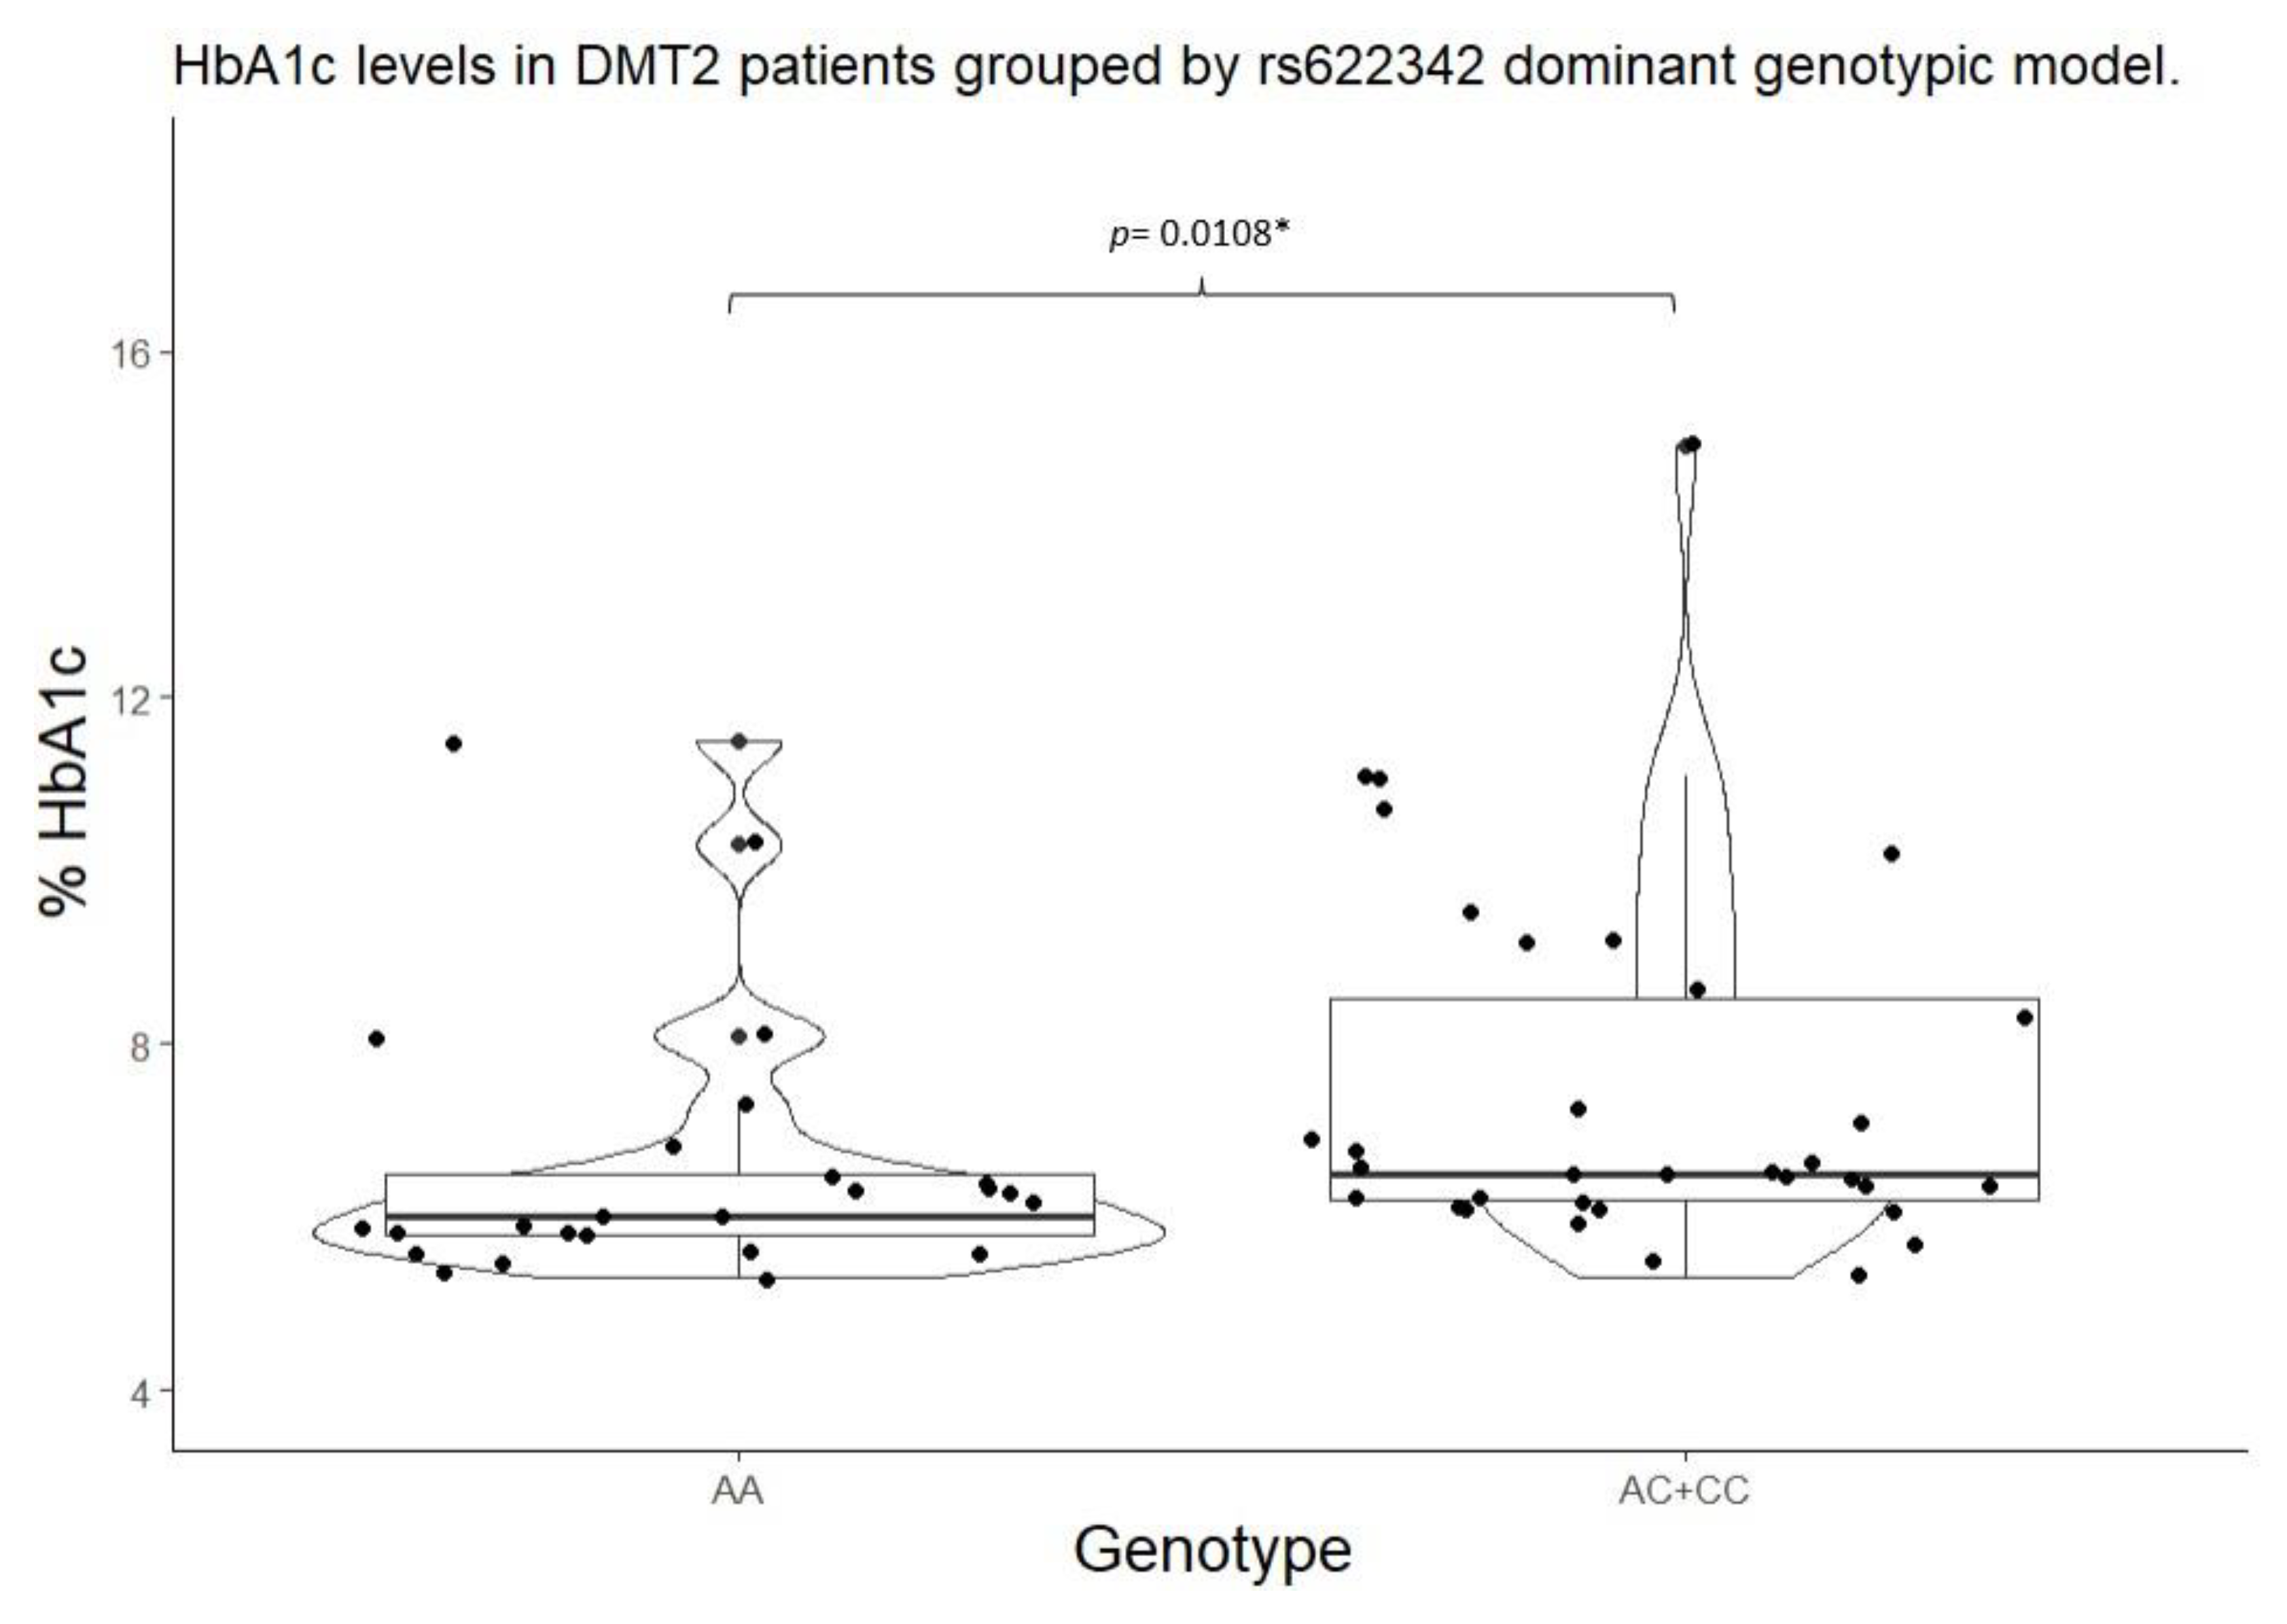
There was no significant difference by SNPs in SLC22A2 and SLC22A3 regarding HbA1c levels across genotypes. Grouping by dominant genotypic model (GAT/GAT vs GAT/del + del/del) revealed statistical significance in both HbA1c (p=0.0058) (Figure 3) and fasting glucose levels (p=0.0260), whilst the dominant genotypic model of rs622342 (A/A vs A/C+C/C) revealed statistical significance only in HbA1c levels (p=0.0108) (Figure 4), not in fasting glucose (p=0.1551). Models applied to rs316019 and rs2076828 yielded no significant difference.

2.5. Metformin Plasmatic Concentrations by Genotype and Genotypic Model

Metformin plasmatic concentrations (ng/ml) were assessed by comparing their levels across all four polymorphisms (Table 5). There were no significant differences. The dominant genotypic model assessment revealed no significant difference either.

3. Discussion

There are official reports which indicate an HbA1c non-control prevalence of about 75% among DMT2 patients [16]; yet, our Mexican-Mestizo sample undergoing metformin monotherapy reported a non-control prevalence of 29.42% among men and 26.19% among women (p= 1.000), where no frequency difference regarding gender was found. This study reported an overall non-control prevalence of 27.11%, a very inferior rate with respect to ENSANUT 2012 [16]. It is important to clarify that ENSANUT reports consider diabetic populations undergoing any kind of treatment, not just metformin monotherapy. Our data suggest that the disease’s non-control proportion in the case of metformin monotherapy is lower than presently reported by ENSANUT. This may be due to our sample’s median diagnosis period (3 years), which could be expressing data on the disease’s first stages. However, according to central tendency measurements revealed by our sample’s description (table 1), at least 50% of the studied population has a BMI higher than 30 Kg/m2, which represents a non-control risk as per previously reported data [17].
OCTs have already been reported to directly affect metformin pharmacokinetics. Moreover, genetic variations caused by polymorphisms codifying SLC22A1, SLC22A2, and SLC22A3, have been proven to alter metformin pharmacokinetics, affecting its hepatic action. Polymorphism rs72552763 in SLC22A1, where 3 bases (ATG) in codon 420 (p.M420del) are deleted, has been studied in Mexican populations by Reséndiz-Abarca [18] and Menjivar et al. [19]. On rs622342 Reséndiz found no significant differences between alleles AA, AC, and the minor allele CC regarding HbA1c among patients treated with metformin for less than 3 years. In a linear model association analysis of rs622342, adjusted by gender, age, disease duration and waist perimeter, Reséndiz did find a significant difference by CC, where HbA1c value (p<0.001) increased after 12 months of observation [18]. Nonetheless, Menjívar’s study of rs72552763 found no significant difference between fasting glucose (mg/dl) (p=0.368) and HbA1c levels (p=0.181).
Even so, Menjívar reported differences in rs72552763 genotypic proportions when comparing controlled and uncontrolled patients depending on HbA1c levels: GAT/GAT= 33/107, GAT/del= 19/39, and del/del=16/16, (p=0.011).
These results differ from those reported by the present work, because we found no significant differences between controlled and uncontrolled patients across rs72552763 genotypes (p= 0.4678). Still, our analysis of HbA1c suggests that its lowest levels are found in GAT/GAT as compared to the minor allele (p= 0.0220).
It shall be mentioned that Menjívar’s study [19] included patients undergoing a combined treatment of metformin and glibenclamide, whereas our study includes only metformin monotherapy, like Reséndiz-Abarca [18]. Our results coincide with Christensen’s work [20], which reported that reduced function alleles in OCT1 SNPs, including rs72552763, is associated with a statistically significant decreasing trend in metformin’s stationary concentration and an increase in HbA1c levels during the cohort’s observation (p= 0.043). We analysed metformin’s plasmatic concentrations, and while its median was higher by GAT/GAT, 504.04 (131.65 – 900.16)(ng/ml) with respect to deletion carriers of s72552763, 236.48 (86.76 – 785.24)(ng/ml), there was no statistical significance (p=0.2384).
The Audit trail in Tayside, Scotland (DARTS) [21], a cohort survey including 1531 patients treated with metformin, reported that genotypes of rs72552763 have no effect on HbA1c levels or the biomarker’s decrease after 42 months; but in that study the proportion of del/del was 3 times less than our sample’s (15.25% vs 4.7%) [22].
On the other hand, in 2015 Umamaheswaran 2015 [22] reported that recently diagnosed DMT2 patients from Southern India, were treated with lifestyle adequation and metformin monotherapy, starting at 500 mg/day, which increased to 2.5 g/day after 12 weeks. When studying metformin response across AA, AC, and CC, in rs622342, a comparison between respondent (HbA1c decrease ≥ 0.5 %) and non-respondent patients (fasting glucose >180 mg; HbA1c decrease <1 % after 12 weeks) by way of a logistic regression based on AA as the reference group found that minor allele C presented a greater non-response risk in genotypes AC (p= 0.011) OR= 3.50 (1.39 - 8.84; 95% CI) and CC (p=0.033) OR= 5.60 (1.24 - 25.80; 95% CI). A dominant genotypic model ( AA vs AC+CC), found that minor allele C is at greater non-response risk (p= 0.003) OR= 3.85 (1.61 - 9.19; 95% CI). These results [22] coincide with ours, as we found higher HbA1c levels among patients carrying the minor allele C of rs622342 in SLC22A1 (p= 0.0108).

4. Materials and Methods

4.1. Study Design and Sample Description (DMT2 Patients)

Study design

This is an observational, transversal, clinical and analytical trial, conducted at HRAEI between April 2018 and April 2019. Patients’ histories were compiled collecting clinical and biochemical data found in their electronic record. These included age, disease duration, HbA1c levels, etc. A peripheral venous blood sample was collected from every patient using two tubes containing ethylenediaminetetraacetic acid (EDTA).

Patient recruitment

Out of a previously studied sample of 103 Mexican-Mestizo DMT2 patients (diagnosed by ADA and WHO criteria) from Hospital Regional de Alta Especialidad de Ixtapaluca (HRAEI) [17], those 59 who fulfilled the metformin monotherapy marker were selected for this new study.

4.2. Clinical Evaluation

The procedure has been previously reported in detail [17] (pp16-17).

4.3. Genotyping Procedure

The procedure has been previously reported in detail [17] (pp17-18).

4.4. Plasmatic Metformin Determination

The procedure has been previously reported in detail [17] (pp18-19).

4.5. Statistical Analyses

Inferential analysis.

The pertaining statistical analyses were conducted using R language (available at https://www.r-project.org/). Apposite code lines were generated to programme every analysis. Either Kolmogorov-Smirnov or Shapiro-Wilk tests were performed for the population description analysis. According to their distribution, quantitative variables were analysed using either T-Student’s or U Mann-Whitney’s tests, accounting for p<0.05 as a statistically significant value. Qualitative variables were analysed through Pearson’s Chi-square test. The Kruskal-Wallis test was used to conduct comparisons between more than two groups, where p<0.05 was considered a significant value as well.

Genotypic and Allelic Frequency Analysis

Allelic frequencies were counted, and respective expected values were calculated for each genotype. A p value > 0.05 defined the frequencies in Hardy–Weinberg equilibrium as calculated through Pearson’s Chi square test.

5. Conclusion

Summarising, although our sample is small, the obtained data allow us to conclude that polymorphisms of rs72552763 and rs622342 in SLC22A1, seem to relevantly affect metformin response among Mexican-Mestizo DMT2 patients. Still, longitudinal studies in a similar population undergoing metformin monotherapy are necessary to observe this effect’s consistency in time.

Author Contributions

Conceptualization, ADIEL ORTEGA-AYALA, CARLOS BARTOLO-MONTIEL, Fernando De Andrés, Adrián LLerena and Juan Arcadio Molina-Guarneros; Data curation, ADIEL ORTEGA-AYALA, CARLOS BARTOLO-MONTIEL, Fernando De Andrés, Adrián LLerena and Juan Arcadio Molina-Guarneros; Formal analysis, ADIEL ORTEGA-AYALA, CARLOS BARTOLO-MONTIEL, Fernando De Andrés, Adrián LLerena and Juan Arcadio Molina-Guarneros; Funding acquisition, Adrián LLerena and Juan Arcadio Molina-Guarneros; Investigation, Adrián LLerena and Juan Arcadio Molina-Guarneros; Methodology, ADIEL ORTEGA-AYALA, CARLOS BARTOLO-MONTIEL, Fernando De Andrés, Adrián LLerena and Juan Arcadio Molina-Guarneros; Resources, Adrián LLerena and Juan Arcadio Molina-Guarneros; Software, ADIEL ORTEGA-AYALA and CARLOS BARTOLO-MONTIEL; Validation, ADIEL ORTEGA-AYALA, CARLOS BARTOLO-MONTIEL, Fernando De Andrés, Adrián LLerena and Juan Arcadio Molina-Guarneros; Writing – original draft, ADIEL ORTEGA-AYALA, CARLOS BARTOLO-MONTIEL, Fernando De Andrés, Adrián LLerena and Juan Arcadio Molina-Guarneros; Writing – review & editing, ADIEL ORTEGA-AYALA, Fernando De Andrés, Adrián LLerena and Juan Arcadio Molina-Guarneros.

Funding

Supported by the Programa de Apoyo a Proyectos de Investigación e Innovación Tecnológica (Project No. IN205121) of the Dirección General de Apoyo a Personal Académico, Universidad Nacional Autónoma de México. The present study was also partially supported by AEXCID, Junta de Extremadura, Spain (“Hampi-Yachay” AEXCID 22IA002).

Institutional Review Board Statement

The study was conducted in accordance with the Declaration of Helsinki. Protocol NR-004-2016 was approved on the 7th of April, 2016 by the Research and Ethics Commissions of the Hospital Regional de Alta Especialidad de Ixtapaluca, the Secretary of Health, and the Research Division of UNAM’s Faculty of Medicine 001/SR/2016 01/17/2017.

Informed Consent Statement

All patients who agreed to voluntarily be involved in the present study provided written informed consent. No identifying information, including names, initials, date of birth, or hospital numbers, images, or statements are included in the manuscript.

Data Availability Statement

The data presented in this study are available on request via the corresponding author. These data are not publicly available because the patients and researchers are bound to an agreement establishing that only the head of the study and Mexican health authorities shall have access to them, in accordance with the presidential decree of 16th April, 2015, sanctioning the General Law on Transparency and Access to Public Information.

Conflicts of Interest

The authors declare no conflict of interest.

References

  1. Standl, E., Khunti, K., Hansen, T. B., & Schnell, O. The global epidemics of diabetes in the 21st century: Current situation and perspectives. European Journal of Preventive Cardiology (2019). 26(2_suppl), 7–14. [CrossRef]
  2. Sun H., Pouya P., Karuranga S., Pinkepank M., Ogurtsova K., Duncan B.B., Stein C., Basit A., Chan J.C.N., Mbanya J.C., Pavkov M. E., Ramachandaran A, Wild S.H., James S., Herman W.H., Zhang P., Bommer C., Kuo S., Boyko E.J., Dianna J., Magliano D.J. IDF DiabetesAtlas:Global, regional and country-level diabetes prevalence estimates for 2021 and projections for 2045. Diabetes Research and Clinical Practice (2022) 183 I09II9, 1-13. [CrossRef]
  3. Romero-Martínez M, Barrientos-Gutiérrez T, Cuevas-Nasu L, Bautista-Arredondo S, Colchero A, Gaona-Pineda E.B, Lazcano-Ponce E, Martínez-Barnetche J, Alpuche-Aranda C, Rivera-Dommarco J, Shamah-Levy T. Metodología de la Encuesta Nacional de Salud y Nutrición 2020 sobre Covid-19. Salud Publica Mex (2021) May 3;63(3):444-451. [CrossRef]
  4. Intensive blood-glucose control with sulphonylureas or insulin compared with conventional treatment and risk of complications in patients with type 2 diabetes (UKPDS 33). UK Prospective Diabetes Study (UKPDS) Group. Lancet (1998). 352: 837-853,.
  5. Diabetes Care Volume 45, Supplement 1, January (2022). Matthew C. Riddle, MD. [CrossRef]
  6. Diagnóstico y Tratamiento Farmacológico de la Diabetes Mellitus Tipo 2 en el Primer Nivel de Atención. Guía de Evidencias y Recomendaciones: Guía de Práctica Clínica. México, Instituto Mexicano del Seguro Social. (2018). 55. http://imss.gob.mx/profesionales-salud/gpc (accessed on July 18th 2023).
  7. LaMoia T. and Shulman G.I. Cellular and Molecular Mechanisms of Metformin Action Endocr Rev. 2021 Feb; 42(1): 77–96. [CrossRef]
  8. Staiger, H., Schaeffeler, E., Schwab, M., & Häring, H. U. Pharmacogenetics: Implications for modern type 2 diabetes therapy. Review of Diabetic Studies, (2015). 12(3–4), 363–376. [CrossRef]
  9. Huang, C., & Florez, J. C. Pharmacogenetics in type 2 diabetes: Potential implications for clinical practice. Genome Medicine (2011). 3(11). [CrossRef]
  10. Weizzman Institute of Science. (2022). Gene cards SLC22A1. https://www.genecards.org/cgi-bin/carddisp.pl?gene=SLC22A1(Accessed July 20th 2023).
  11. Koepsell, H., Lips, K., & Volk, C. Polyspecific organic cation transporters: Structure, function, physiological roles, and biopharmaceutical implications. Pharmaceutical Research (2007) 24(7), 1227–1251. [CrossRef]
  12. Lai Y. Organic anion, organic cation and zwitterion transporters of the SLC22 and SLC47 superfamily (OATs, OCTs, OCTNs and MATEs). In Transporters in Drug Discovery and Development. (2013). [CrossRef]
  13. Srijib, G. PharmGKB summary: very important pharmacogene information for SLC22A1. Pharmacogenetics and Genomics (2014). 23(1), 1–7. [CrossRef]
  14. Becker M.L., Visser L.E., van Schaik, R.H.N., Hofman A., Uitterlinden A.G., Stricker B.H.C. Interaction between polymorphisms in the OCT1 and MATE1 transporter and metformin response. Pharmacogenet. Genom. (2010) 20, 38–44. Available online: https://pubmed-ncbi-nlm-nih-gov.pbidi.unam.mx:2443/19898263/ (accessed on 2 May 2022).
  15. WHO. Physical Status: The Use of and Interpretation of Anthropometry, Report of a WHO Expert Committee. 1995. Available online: https://apps.who.int/iris/handle/10665/37003 (accessed on July 21th 2023).
  16. Shamah Levy T, Cuevas Nasu L, Morales Ruan MC, Mundo Rosas V, Méndez Gómez-Humarán I, Villalpando Hernández S. Profile of the Health and Nutritional Status of Older Adults in Mexico. 2012 National Health and Nutrition Survey. J Frailty Aging. 2013;2(4):184-91. [CrossRef]
  17. Ortega-Ayala A, Rodríguez-Rivera NS, Andrés F. d, LLerena A, Pérez-Silva E, Espinosa-Sánchez AG, Molina-Guarneros JA Pharmacogenetics of Metformin Transporters Suggests No Association with Therapeutic Inefficacy among Diabetes Type 2 Mexican Patients. Pharmaceuticals (2022). 15(7):774. [CrossRef]
  18. Reséndiz-Abarca C., Flores-Alfaro E., Suárez-Sánchez F., Cruz M., Valladares-Salgado A., Alarcón-Romero L.D.C., Wacher-Rodarte N.A., Gómez-Zamudio J.H. Altered Glycemic Control Associated With Polymorphisms in the SLC22A1 (OCT1) Gene in a Mexican Population With Type 2 Diabetes Mellitus Treated With Metformin: A Cohort Study. J. Clin. Pharmacol. (2019), 59 (10) 1384–1390. Available online: https://pubmed-ncbi-nlm-nih-gov.pbidi.unam.mx:2443/31012983/ (accessed on Jul 18th 2023).
  19. Menjivar M., Sánchez-Pozos K., Jaimes-Santoyo J., Monroy-Escutia J., Rivera- Santiago C., Granados-Silvestre A., Ortiz-López M.G. Pharmacogenetic Evaluation of Metformin and Sulphonylurea Response in Mexican Mestizos with Type 2 Diabetes. Curr. Drug Metab. (2020), 21, 291–300. Available online: https://pubmed-ncbi-nlm-nih-gov.pbidi.unam.mx: 2443/32407269/ (accessed on May 2nd 2022).
  20. Christensen MH , Brasch-Andersenb C , Greene H, Nielsen F , Damkierc P , Beck-Nielsen H and Brosena K. The pharmacogenetics of metformin and its impact on plasma metformin steady-state levels and glycosylated hemoglobin A1c. Pharmacogenetics and Genomics (2011) 21(12):p 837-850. [CrossRef]
  21. Morris A.D., Boyle D.R. , MacAlpine R, Emslie-Smith A, Jung R.T., Newton RW, MacDonald T. M. for the DARTS/MEMO Collaboration. The diabetes audit and research in Tayside Scotland (darts) study: electronic record linkage to create a diabetes register. BMJ (1997) 315:524.
  22. Zhou, K., Donnelly, L. A., Kimber, C. H., Donnan, P. T., Doney, A. S. F., Leese, G., Hattersley, A. T., McCarthy, M. I., Morris, A. D., Palmer, C. N. A., & Pearson, E. R. Reduced-function SLC22A1 polymorphisms encoding organic cation transporter 1 and glycemic response to metformin: A GoDARTS study. Diabetes, (2009) 58(6), 1434–1439. [CrossRef]
  23. Umamaheswaran G, Praveen R.G. Damodaran S. E. Das A.K. Adithan C. Influence of SLC22A1 rs622342 genetic polymorphism on metformin response in South Indian type 2 diabetes mellitus patients. Clin Exp Med (2015) 15:511–517.
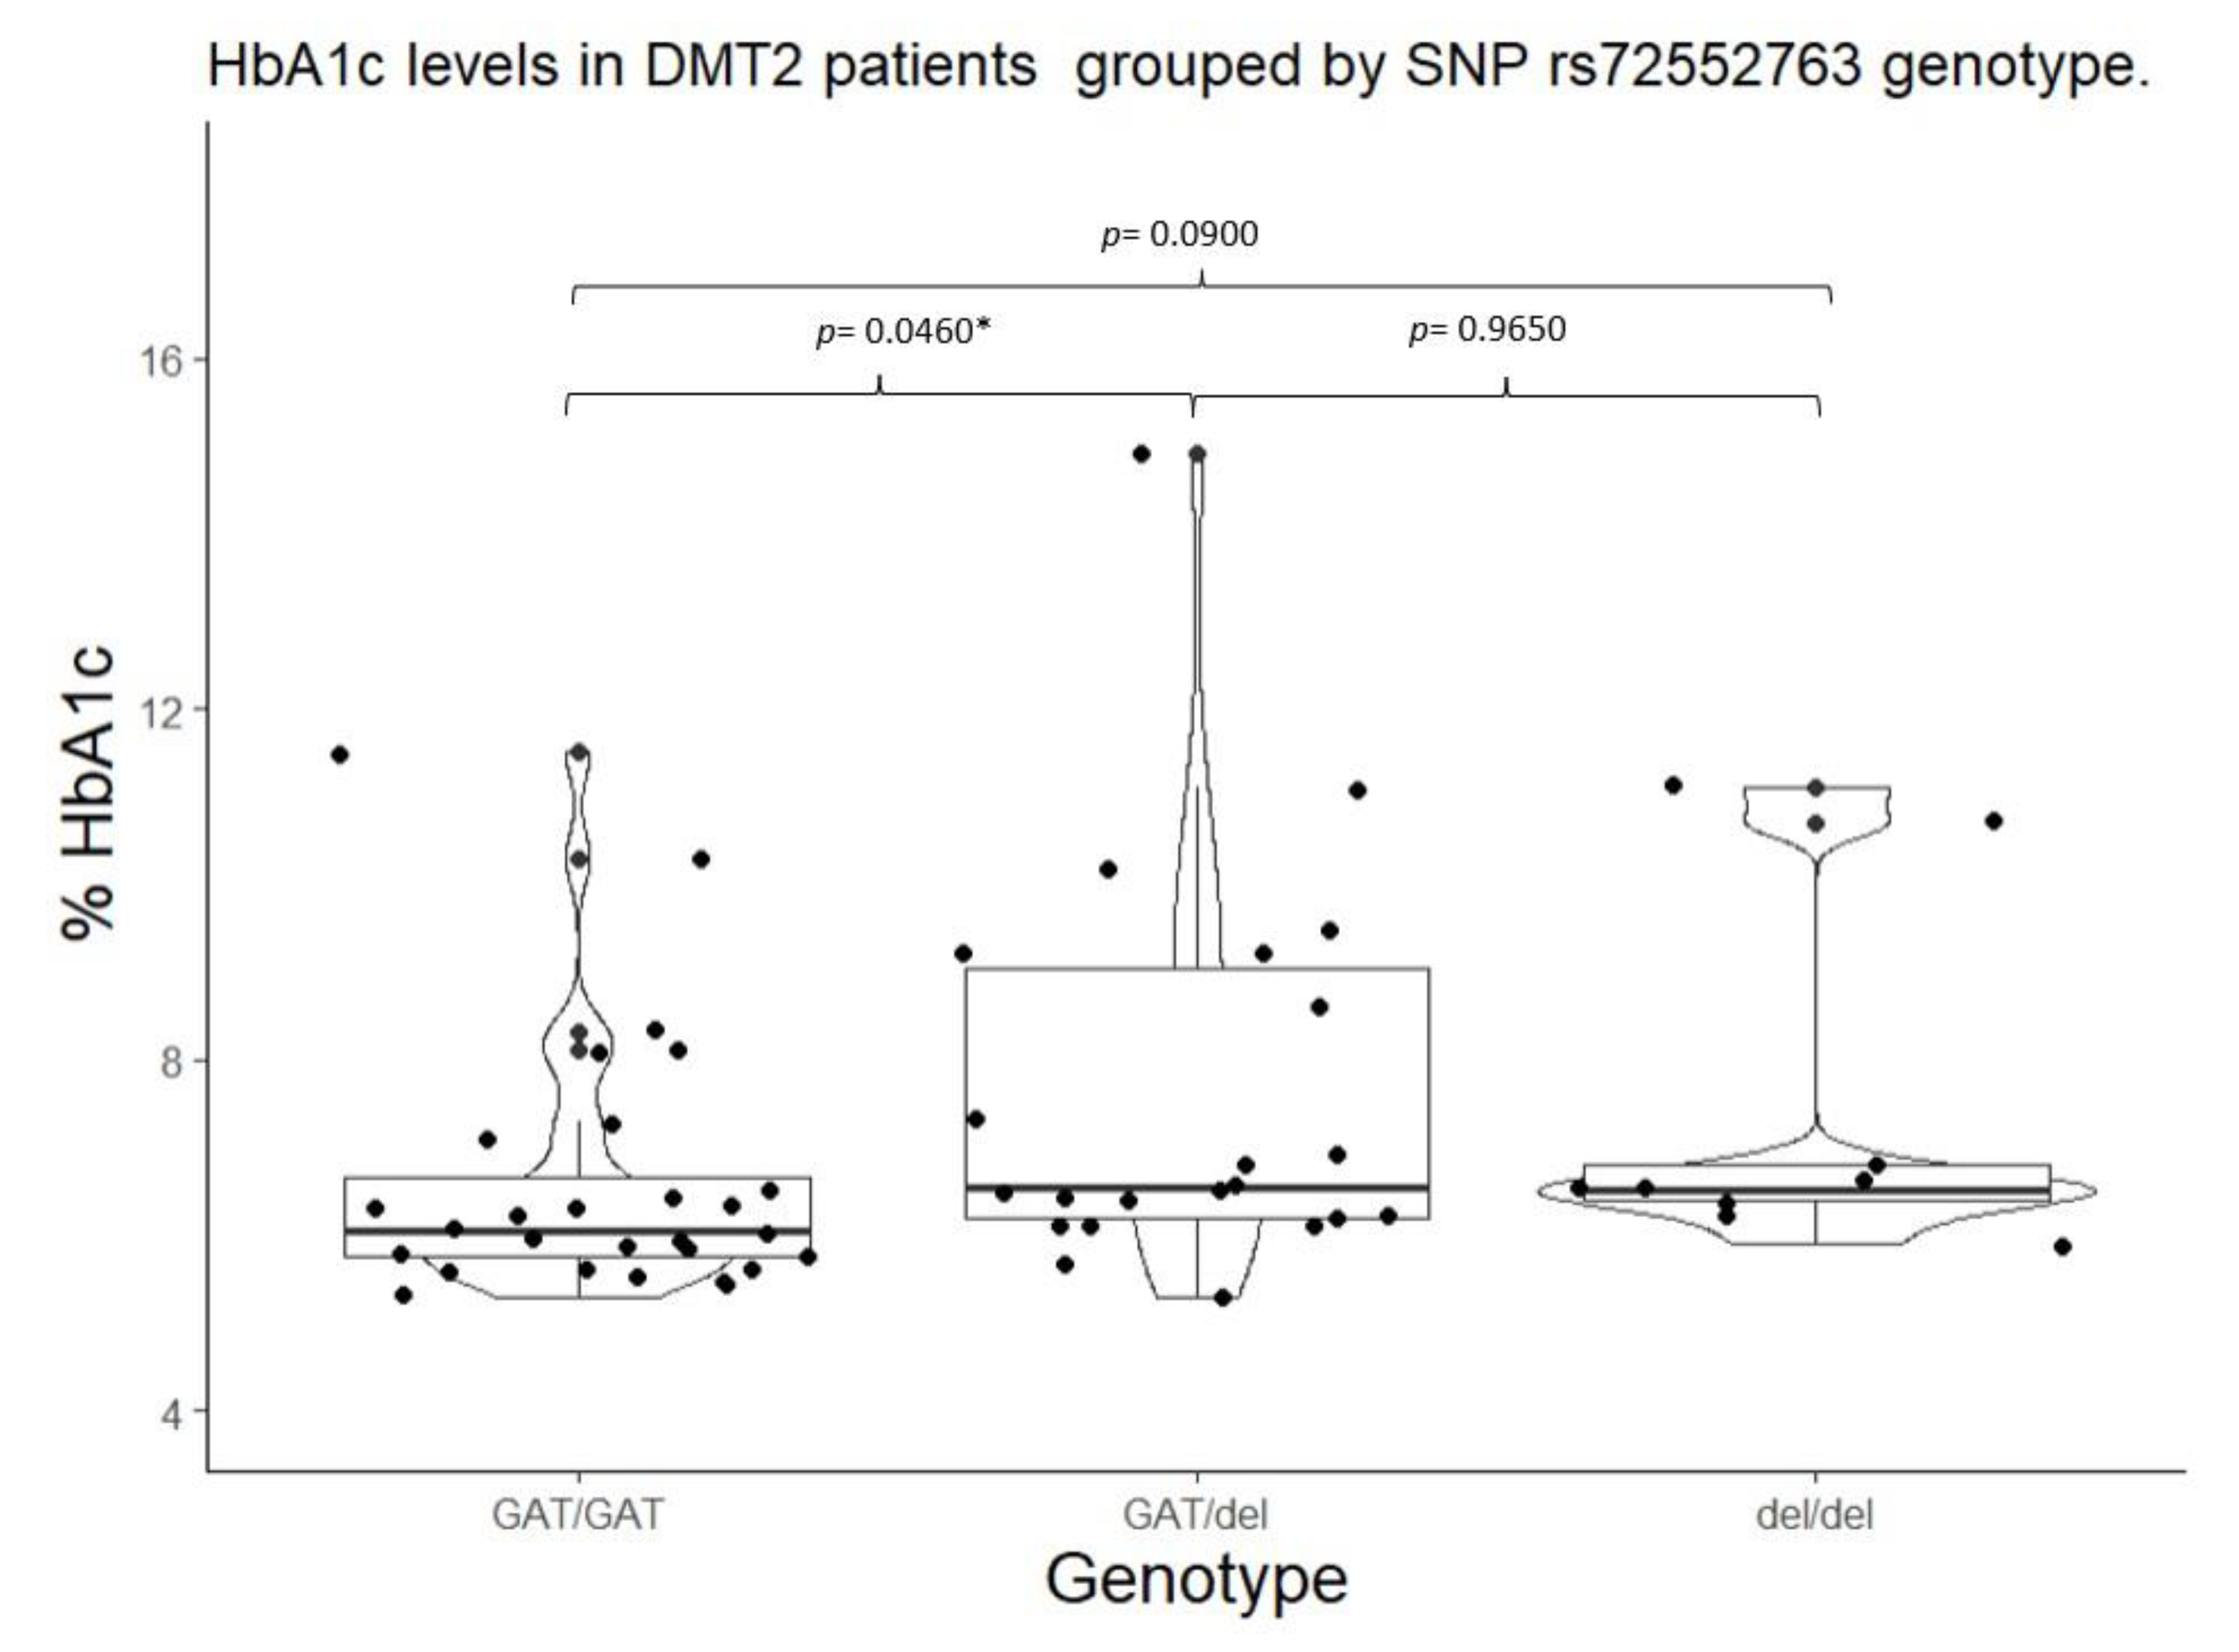
Figure 1. Figure 1. Box-plot over violin and jitter plots of HbA1c levels by SNP genotype of rs72552763 in SLC22A1; p value corresponds to Wilcoxon’s signed-rank test with continuity correction. *Statistical significance. (p<0.05).
Preprints 80551 g001
Figure 2. Box-plot over violin and jitter-plots of HbA1c levels by SNP genotype of rs622342 in SLC22A1; p value corresponds to Wilcoxon’s signed-rank test with continuity correction. **Statistical significance (p<0.01).
Preprints 80551 g002
Figure 3. Box-plot over violin and jitter-plots of HbA1c levels by SNP dominant genotypic model of rs72552763 in SLC22A1; p value corresponds to Mann-Whitney’s U test. **Statistical significance (p<0.01).
Preprints 80551 g003
Figure 4. Box-plot over violin and jitter-plots of HbA1c levels by SNP dominant genotypic model of rs622342 in SLC22A1; p value corresponds to Mann-Whitney’s U test. *Statistical significance (p<0.05).
Preprints 80551 g004
Table 1. Descriptive data from DMT2 patients undergoing metformin treatment at HRAEI; gender comparison.
Men Women
Variable n= 17 n= 42 p value
Age (years) 59.00 (51.00 – 62.00) 54.50 (46.20 – 61.00) 0.3354
Height (metres) 1.64 ±0.05 1.54 ±0.05 <0.001*
Weight (kg) 81.50 ±11.90 77.70 ±18.30 0.2249
BMI (kg/m2) 30.20 ±4.04 32.6 ±6.93 0.0957
BMI clasification
Normal weight
Overweight
Obesity I
Obesity II
Obesity III

0 (0.00%)
8 (47.05%)
7 (41.17%)
2 (11.76%)
0 (0.00%)

4 (9.52%)
12 (28.57%)
11 (26.19%)
10 (23.80%)
5 (11.90%)


0.2830
Systolic BP (mmHg) 127 (119 – 136) 124 (110 – 134) 0.5135
Diastolic BP (mmHg) 78 (68 – 88) 77 (70 – 80) 0.9069
Diagnose date (years) 3.00 (1.00 – 6.00) 3.50 (1.62 – 8.00) 0.4534
Metformin dose(mg/kg/day) 19.80 (10.50 – 23.80) 18.4 (12.70 – 26.80) 0.3839
Metformin dose (mg/day)
500
850
1700
2550

0 (0.00%)
7 (43.75%)
7 (43.75%)
2 (12.50%%)

2 (5.00%)
13 (32.50%)
16 (40.00%)
9 (22.50%)


0.5878
Metformin concentration (ng/ml)
650.00
(135.00 – 877.00)
263.00
(107.00 – 748.00)
0.3750
Fasting glucose (mg/dl)

<126 mg/dl
>126 mg/dl
107.00 (102.00 – 134.00)

13 (76.47%)
4 (23.53%)
121.00 (100.00 – 187.00)

22 (53.65%)
19 (46.35%)
0.5051

0.1863
HbA1c (%)
<7%
≥7%
6.30 (5.80 – 7.30)
12 (70.58%)
5 (29.42%)
6.40 (6.10 – 7.85)
31 (73.81%)
11 (26.19%)
0.3229
1.000
Total cholesterol (mg/dL)
<200
≥200
165.00 ±32.40
13 (81.25%)
3 (18.75%)
179.00 ±41.60
28 (66.66%)
14 (33.33%)
0.2367
0.4426
Triglycerides (mg/dL)
<150
≥150
185.00 (108.00 –201.00)
6 (42.85%)
8 (57.15%)
195.00 (132.00 – 239.00)
10 (24.39%)
31 (75.61%)
0.3339

0.3307
FGR (MDRD-4, ml/min) 92.80 (80.7 – 113.00) 94.50 (89.30 – 115.00) 0.9334
Mean ± (standard deviation), percentile median (25-75), and frequency (%).
*Statistic significance (p<0.05).
Table 2. Allelic and genotypic frequencies of OCT polymorphisms among metformin-treated DMT2 patients.
Gene SNP Genotype n=59 Frequency Allele n Frequency p value
SLC22A1 rs72552763 GAT/GAT 28 0.4745 GAT 78 0.6610 0.6654
GAT/del 22 0.3728 del 40 0.3389
del/del 9 0.1525
rs622342 A/A 25 0.4237 A 69 0.5847 0.1829
A/C 19 0.3220 C 49 0.4152
C/C 15 0.2542
SLC22A2 rs316019 C/C 52 0.8813 C 110 0.9322 0.7479
C/A 6 0.1016 A 8 0.0677
A/A 1 0.0169
SLC22A3 rs2076828 C/C 46 0.7796 C 103 0.8728 0.7531
C/G 11 0.1864 G 15 0.1271
G/G 2 0.0338
p value of Pearson’s chi-squared test for Hardy-Weinberg equilibrium
Table 3. Fasting HbA1c control by SNPs in SLC22A1, SLC22A2, and SLC22A3.
Dominant genotypic model
Gene SNP Genotype HbA1c<7%
n (%)
HbA1c≥ 7%
n (%)
p value Genotype HbA1c<7%
n (%)
HbA1c≥ 7%
n (%)
p value
SLC22A1 rs72552763 GAT/GAT 22 (51.20%) 6 (37.50%) 0.4678 GAT/GAT 22 (51.16%) 6 (37.50%)
0.5215
GAT/del 14 (32.50%) 8 (50.00%) GAT/del + del/del 21 (48.83%) 10 (62.50%)
del/del 7 (16.30%) 2 (12.50%
rs622342 A/A 21 (48.83%) 4 (25.00%) 0.2215 A/A 21 (48.83% 4 (25.00%)
0.1767
A/C 13 (30.23%) 6 (37.50%) A/C + C/C 22 (51.16%) 12 (75.00%)
C/C 9 (20.93%) 6 (37.50%)
SLC22A2 rs316019 C/C 38 (88.37%) 14 (87.5%) 0.2209 C/C 38 (88.37%) 14 (87.50%) 1.000
C/A 5 (11.62%) 1 (6.25%) C/A + A/A 5 (11.62%) 2 (12.50%)
A/A 0 (0%) 1 (6.25%)
SLC22A3 rs2076828 C/C 36 (83.72%) 10 (62.50%) 0.215 C/C 36 (83.72%) 10 (62.50%) 0.163
C/G 6 (13.95%) 5 (31.25%) C/G + G/G 7 (16.28%) 6 (37.50%)
G/G 1 (2.32%) 1 (6.25%)
In display: frequency and percentage (%).
Table 4. HbA1c and glucose fasting levels by genotype and dominant genotypic model.
Genotype Dominant genotypic model
Gene SNP Genotype HbA1c (%) p value Fasting glucose p valor Genotype HbA1c (%)
p value Fasting glucose (mg/dl) p value
SLC22A1 rs72552763 GAT/GAT 6.05
(5.75 – 6.65)
0.0220* 103.00
(100.00 – 133.20)
0.0822 GAT/GAT 6.05
(5.75 – 6.65)
0.0058** 103.00
(100.00 – 133.25)
0.0260**
***
GAT/del
6.55
(6.20 – 9.05)
127.00
(106.00 – 195.00
GAT/del
+
del/del
6.50
(6.20 – 8.90)
127.00
(107.20 – 193.00)
del/del 6.5
(6.4 – 6.8)
127.00
(116.00 – 146.00)
rs622342 A/A 6.00
(5.80 – 6.50)
0.0093* 105.00
(102.00 – 133.00)
0.0864 A/A 6.00
(5.80 – 6.50)
0.0108** 105.00
(102.00 – 133.00)
0.1551
A/C 6.4
(6.10 – 7.70)
113.00
(100.00 – 133.00)
A/C
+
C/C
6.50
(6.20 – 8.50)
127.00
(104.00 – 187.00)
***
C/C
6.8
(6.45 – 9.35)
135.00
(118.50 – 205.00)
SLC22A2 rs316019 C/C 6.4
(5.97 – 7.15)
0.6097 115.00
(101.00 – 140.00)
0.3138 C/C 6.40
(5.90 – 7.10)
0.888 115.00
(101.00 – 140.5)
0.210
C/A 6.25
(5.90 – 7.65)
139.00
(107.50 – 207.20)
C/A
+
A/A
6.30
(6.00 – 8.10)
157.00
(112.00 – 223.50)
A/A 8.1 223
SLC22A3 rs2076828 C/C 6.3
(5.90 – 6.80)
0.3356 115.00
(102.00 – 152.00)
0.507 C/C 6.30
(5.90 – 6.80)
0.3552 115.00
(102.00 – 152.00)
0.8156
C/G 6.40
(5.90 – 8.20)
107.00
(100.00 – 167.00)
C/G
+
G/G
6.60
(6.10 – 9.20)
121.00
(100.00 – 204.00)
G/G 8.60
(7.60 – 9.60)
175.00
(151.00 – 199.00)
Mean ± (standard deviation), percentile median (25-75), and frequency (%)
*Statistical significance (p<0.05) for Kruskal-Wallis test.
**Statistical significance (p<0.05) for Mann Whitney’s U test.
***Statistical significance (p<0.05) for Wilcoxon’s signed-rank test with continuity correction vs Wild type genotype.
Table 5. Metformin plasmatic concentration by genotype and dominant genotypic model.
Genotype Dominant genotypic model
Gene SNP Genotype Metformin concentration (ng/ml) p value Genotype Metformin concentration (ng/ml) p value
SLC22A1 rs72552763 GAT/GAT 504.04
(131.65 – 900.16)


0.4628
GAT/GAT 504.04
(131.65 – 900.16)


0.2384
GAT/del 262.17
(57.23 – 765.18)
GAT/del
+
del/del

236.48
(86.76 – 785.24)
del/del 146.14
(119.93 – 792.97)
rs622342 A/A 451.65
(128.01 – 848.18)
0.6390 A/A 451.65
(128.01 – 848.18)


0.4548
A/C 270.56
(61.85 – 747.55)
A/C
+
C/C

263.24
(95.18 – 807.73)
C/C 237.55
(126.04 – 934.38)
SLC22A2 rs316019 C/C 327.96
(105.88 – 812.59)
0.7780 C/C 283.43
(250.93 – 446.05)
0.7780
C/A 283.43
(250.93 – 446.05)
C/A
+
A/A
6.3
(6.0 – 8.1)
A/A -
SLC22A3 rs2076828 C/C 146.14
(102.66 – 810.16)
0.4560 C/C 146.14
(102.66 – 810.16)
0.1748
C/G 481.75
(264.30 – 687.45)
C/G
+
G/G
618.85
(320.64 – 848.03)
G/G -
Mean ± (standard deviation), percentile median (25-75), and frequency (%)
*Statistical significance (p<0.05) for Kruskal-Wallis test.
**Statistical significance (p<0.05) for Mann-Whitney’s posthoc test vs. Wild type genotype.
Disclaimer/Publisher’s Note: The statements, opinions and data contained in all publications are solely those of the individual author(s) and contributor(s) and not of MDPI and/or the editor(s). MDPI and/or the editor(s) disclaim responsibility for any injury to people or property resulting from any ideas, methods, instructions or products referred to in the content.
Copyright: This open access article is published under a Creative Commons CC BY 4.0 license, which permit the free download, distribution, and reuse, provided that the author and preprint are cited in any reuse.
Prerpints.org logo

Preprints.org is a free preprint server supported by MDPI in Basel, Switzerland.

Subscribe

© 2024 MDPI (Basel, Switzerland) unless otherwise stated