Preprint
Article

Co-Analysis of the Metabolome and Transcriptome Reveals Regulation Network of Mint Pigment and Flavone

Altmetrics

Downloads

128

Views

42

Comments

0

This version is not peer-reviewed

Submitted:

28 July 2023

Posted:

31 July 2023

You are already at the latest version

Alerts
Abstract
Mint is considered to have a greater number of phenolic acids, flavonoids, antioxidants and other bioactive components, and is widely used as food, medicine, spices, and flavoring agents. Thus, chemical composition is an important parameter for assessing the quality of mint. In this study, two mint cultivars were sampled, purple mint and green mint. The purple mint had much higher anthocyanin and total flavone content compared with green mint. Transcriptome and metabolome technique were employed to elucidate the regulation network of mint pigment and flavone. A total of 167,901 unigenes were obtained by high-throughput RNA-Seq and 34,608 genes were differentially expressed. The differentially expressed genes (DEGs) were mainly involved in lignin metabolic process and flavonoid biosynthetic process. A total of 143 differentially expressed metabolites (DEMs) were enriched in isoflavonoid biosynthesis, flavonoid biosynthesis, flavone and flavonol biosynthesis, and anthocyanin biosynthesis pathways. The co-analysis results of DEGs and DEMs showed that the flavone and flavonol biosynthesis pathway (ko00944) contained the most DEMs, followed by flavonoid biosynthesis pathway (ko00941) and anthocyanin biosynthesis pathway (ko00942). Furthermore, the most important nine genes and metabolites were screened using O2PLS model. The results will provide a theoretical basis for revealing pigment and flavone biosynthesis network of mint.
Keywords: 
Subject: Biology and Life Sciences  -   Plant Sciences

1. Introduction

Mint (Mentha spp.) which contains about 56 accepted taxa including 42 plant species are widely distributed worldwide especially in temperate and tropical/subtropical regions [1]. Corn mint (Mentha canadensis L.), spearmint (Mentha spicata L.), and peppermint (Mentha piperita L.) are the most important and well known of the mint species. Because of its medicinal value, flavoring and health beneficial properties, there is a huge demand in both the food and pharmaceutical industries, which make mint one of the most economically significant medicinal and aromatic crops [2]. Mint is used as an ingredient in food industry. Leaves, flowers and stems of Mentha species have traditionally been used as herbal teas and spices in many foods to add aroma and flavor. Fresh and dried plant material, raw extracts and essential oils of mint plants are used as a part of confectionary, as flavor enhancing agents in toothpastes, chewing gums and beverages, bakery, cosmetics, as oral hygiene products [3-5]. In addition to its food uses, mint is well-known for its traditional medicinal properties because mint is rich in antioxidants. For over thousand years, the mint plant has been used extensively for its therapeutic characteristics. People have used it to make poultices or balms, or it can be inhaled due to its high menthol content. Extract of mint possesses good total phenolic and flavonoid contents, so mint has usually been linked to physiological benefits to humans, for instance, antimicrobial, anticancer and antiallergenic, analgesic, digestive disorders, antioxidant, neuralgia, hypoglycemic, gastrointestinal tract disorders, and antidiarrheal properties [6-8].
Mint contains thousands of bioactive compounds, which are nontoxic and largely effective substitutes with an almost negligible negative consequence [2]. The most important chemical compounds that have been found in various species of mints are menthol and terpenes which exist both in the free state as well as in esters. Menthol of peppermint oil has been recognized for its medicinal properties, whereas esters, for example, menthyl acetate of peppermint is the reason for its minty taste and associated sensory fragrance [9]. The various chemical constituents of mint have a lot of economic importance. Mint oil have been used as an agent of flavor in the flavoring industry and in many types of foods, herbal products, medicine, and different perfumes. Odorous secondary metabolite biosynthesis in Mentha species occurs in peltate glandular trichomes, specialized epidermal tissues located on leaves, stems, petals and seed coat surfaces, depending on the species [10]. Mint oil is a complex blend of organic chemicals that include volatile components such as carvone (1%), pulegone (0.5–1.6%), β-myrcene (0.1–1.7%), β-caryophyllene (2–4%), limonene (1–7%), isomenthone (2–8%), menthofuran (1–10%), menthyl acetate (2–11%), 1,8-cineole (eucalyptol) (5–13%), menthone (15–32%), and menthol (33–60%) [11, 12]. Many essential oil chemotypes show distinct aromatic flavor conferred by different proportions.
With the development of technology, we have more opportunities to understand the underlying reasons and molecular regulatory mechanisms of biological differences. For example, high-throughput transcriptomics produces extensive transcript datasets that can be applied to identify candidate key genes in particular processes using co-expression networks analysis [13]. Metabolomics studies the accumulation and changes of metabolites in specific samples, as metabolites are the final products of gene expression in cells, which can directly reflects the physiological state of the organism. Furthermore, draft genome sequence of Mentha longifolia was finished [14]. All of these laid the foundation for in-depth research on mint. Members of the genus Mentha show a great variability in phenotype or chemical composition, both intra and inter-species, which is a consequence of their specific gene expression and metabolic pathways. Understanding the molecular mechanisms of mint is a prerequisite for its genetic improvement. In the present study, samples of two cultivars were collected. Purple mint (Z) had higher anthocyanin, total flavone and soluble protein content, whereas green mint (L) had higher chlorophyll content. High-throughput transcriptome and metabolome techniques were employed to explore the regulation mechanisms of anthocyanin and flavone biosynthesis. The results will provide a theoretical basis for improving the quality and breeding of mint.

2. Materials and Methods

2.1. Plant materials

The mint materials were planted in the field station of Tangshan Normal University, Tangshan, China in 2022. Stem samples were collected from both purple mint (Mentha canadensis Linnaeus. ‘Z’) and green mint (Mentha haplocalyx Briq. ‘L’) with three biological replicates at 20 days after planting, and used for transcriptome and metabolomics analysis. The purple mint (Z) had higher anthocyanin, total flavone and soluble protein content, whereas green mint (L) had higher chlorophyll content (Table 1).

2.2. Transcriptome analysis

The total RNA was isolated using the Trizol reagent (www.tiangen.com) according to the manufacturers’ instructions. A total amount of 1 μg RNA per sample was used as input material for the RNA sample preparations. Sequencing libraries were generated using NEBNext® UltraTM RNALibrary Prep Kit for Illumina® (NEB, USA) following manufacturer’s recommendations and index codes were added to attribute sequences to each sample. The clustering of the index-coded samples was performed on a cBot Cluster Generation System using TruSeq PE Cluster Kit v3-cBot-HS (Illumia) according to the manufacturer’s instructions. After cluster generation, the library preparations were sequenced on an Illumina platform by Metware Biotechnology Co., Ltd. (Wuhan, China) and 150 bp paired-end reads were generated.
The software fastp [15] was used to filter the raw data and obtain the clean reads. Adapter reads, reads with over 10% unknown bases and low-quality reads which had over 20% reads with quality score lower than 15 were removed to obtain clean reads. Transcriptome assembly was performed using Trinity [16]. Corset [17] was used to regroup relevant transcripts into gene clusters (https://github.com/trinityrnaseq/trinityrnaseq). TransDecoder (https://github.com/TransDecoder/TransDecoder/wiki) was used to identify candidate coding regions within transcript sequences generated by de novo RNA-Seq transcript assembly using Trinity. RSEM (version 1.2.8) [18] was used to calculate the expression levels of genes and transcripts. Differentially expressed genes (DEGs) were classified using the official annotation and classification. The gene expression level of RNA-Seq was estimated by RSEM, and then FPKM (Fragments per kilobase of transcript per million fragments mapped) of each gene was calculated based on the gene length. Software DESeq2 (version 1.26) [19] was employed to analyze the differential gene expression, and genes with |log2Fold Change| >= 1 and FDR (False discovery rate) < 0.05 were identified as DEGs. Gene function was annotated based on the following databases using DIAMOND and HMMER [20]: Nr (NCBI non-redundant protein sequences), Swiss-Prot (A manually annotated and reviewed protein database), Trembl (A variety of new documentation files and the creation of TrEMBL), KEGG (Kyoto Encyclopedia of Genes and Genomes), GO (Gene Ontology), KOG (euKaryotic Ortholog Groups) and Pfam (Protein family).

2.3. Metabolomics analysis

Mint samples were freeze-dried by vacuum freeze-dryer (Scientz-100F). The freeze-dried samples were crushed using a mixer mill (MM 400, Retsch) with a zirconia bead for 1.5 min at 30 Hz. Dissolve 50 mg of lyophilized powder with 1.2 mL 70% methanol solution, vortex 30 seconds every 30 minutes for 6 times in total. Following centrifugation at 12000 rpm for 3 min, the extracts were filtrated (SCAA-104, 0.22 μm pore size; ANPEL, Shanghai, China, http://www.anpel.com.cn/) before UPLC-MS/MS analysis.
The sample extracts were analyzed using an UPLC-ESI-MS/MS system (UPLC, SHIMADZU Nexera X2, https://www.shimadzu.com.cn/; MS, Applied Biosystems 4500 Q TRAP, https://www.thermofisher.cn/cn/zh/home/brands/applied-biosystems.html). The analytical conditions were as follows, UPLC: column, Agilent SB-C18 (1.8 μm, 2.1 mm * 100 mm); The mobile phase was consisted of solvent A, pure water with 0.1% formic acid, and solvent B, acetonitrile with 0.1% formic acid. Sample measurements were performed with a gradient program that employed the starting conditions of 95% A, 5% B. Within 9 min, a linear gradient to 5% A, 95% B was programmed, and a composition of 5% A, 95% B was kept for 1 min. Subsequently, a composition of 95% A, 5.0% B was adjusted within 1.1 min and kept for 2.9 min. The flow velocity was set as 0.35 mL per minute; The column oven was set to 40°C; The injection volume was 4 μL. The effluent was alternatively connected to an ESI-triple quadrupole-linear ion trap (QTRAP)-MS.
The ESI source operation parameters were as follows: source temperature 550°C; ion spray voltage (IS) 5500 V (positive ion mode)/-4500 V (negative ion mode); ion source gas I (GSI), gas II(GSII), curtain gas (CUR) were set at 50, 60, and 25 psi, respectively; the collision-activated dissociation(CAD) was high. Instrument tuning and mass calibration were performed with 10 and 100 μmol/L polypropylene glycol solutions in QQQ and LIT modes, respectively. QQQ scans were acquired as MRM experiments with collision gas (nitrogen) set to medium. DP (declustering potential) and CE (collision energy) for individual MRM transitions was done with further DP and CE optimization. A specific set of MRM transitions were monitored for each period according to the metabolites eluted within this period.
Based on the MWDB database (https://www.metware.cn/), metabolite characterizations were analyzed based on secondary spectral information. When analyzing, the isotopic signals, duplicate signals containing K+, Na+, NH4+, and duplicate signals of fragment ions of large molecular weight substances were removed. Metabolite quantification was achieved using multiple reaction monitoring (MRM). The software Analyst 1.6.3 was employed for mass spectrometry analysis. Differential metabolites were determined by VIP (Variable importance in projection, VIP ≥ 1) and absolute Log2FC (|Log2FC| ≥ 1.0). VIP values were extracted from OPLS-DA result, which also contain score plots and permutation plots, was generated using R package MetaboAnalystR. The data was log transform (log2) and mean centering before OPLS-DA. In order to avoid overfitting, a permutation test (200 permutations) was performed. Differentially expressed metabolites (DEMs) were identified and enriched, then the GO and KEGG enrichments were performed as described in the transcriptome analysis.

2.4. Data analyses

Unsupervised PCA (principal component analysis) was performed by statistics function prcomp within R. The data was unit variance scaled before unsupervised PCA. The HCA (hierarchical cluster analysis) results of genes and metabolites were presented as heatmaps with dendrograms. For HCA, normalized signal intensities of metabolites (unit variance scaling) are visualized as a color spectrum. Correlation analysis (Pearson correlation coefficient) of genes and metabolites was performed using the cor function in R and O2PLS model [21]. The genes and metabolites with a correlation coefficient greater than 0.80 and p-value less than 0.05 were considered significantly related.

3. Results

3.1. Transcriptome

3.1.1. Differentially expressed genes

The transcriptome sequencing of 6 samples (Z1, Z2, Z3, L1, L2 and L3) was performed in this study, and totally 48.67 Gb clean data was obtained. The clean data of each sample reached more than 7 Gb, and the Q30 base percentage was more than 91%. Total 282,411 transcripts and 167,901 unigenes were obtained after assembly. Unigene annotation information was achieved by comparing the sequence with the Nr, Swiss-Prot, KEGG, GO, KOG and TrEMBL database using software DIAMOND. The annotation information of each database was shown in Supplementary Table 1. The genes expressed in inter group samples had a very high correlation, and there were significant differences between groups (Supplementary Figure 1). Software DESeq2 was employed to analyze the DEGs between purple mint and green mint. In total, 34,608 genes were differentially expressed (Supplementary Table 2). Compared to purple mint, 14,226 genes were downregulated and 20,382 genes were in green mint (Supplementary Figure 2).

3.1.2. Annotation and enrichment analysis of DEGs

After GO annotation of DEGs, the annotated DEGs were classified according to the secondary level of GO classification. The top 5 classification were cellular anatomical entity (21,503 DEGs), cellular process (15,966 DEGs), binding (14,791 DEGs), metabolic process (12,629 DEGs) and catalytic activity (11,732 DEGs) (Figure 1a). The GO enrichment was measured by the rich factor and qvalue. Rich factor refers to the ratio of the number of DEGs enriched in the pathway to the number of all genes annotated in the pathway. The 19 most significantly enriched GO terms were displayed in Figure 1b. The GO enrichment results showed that, the top 5 pathways were plant-type secondary cell wall biogenesis (193 DEGs), lignin metabolic process (171 DEGs), flavonoid biosynthetic process (167 DEGs), oxidoreductase activity (120 DEGs) and lignin catabolic process (113 DEGs). KEGG analysis of DEGs results showed that the most enriched genes were characteristic with metabolic pathways (4,708 DEGs), biosynthesis of secondary metabolites (2,625 DEGs) and plant-pathogen interaction (1,825 DEGs) (Figure 1c).

3.2. Metabolome

3.2.1. Differentially expressed metabolites

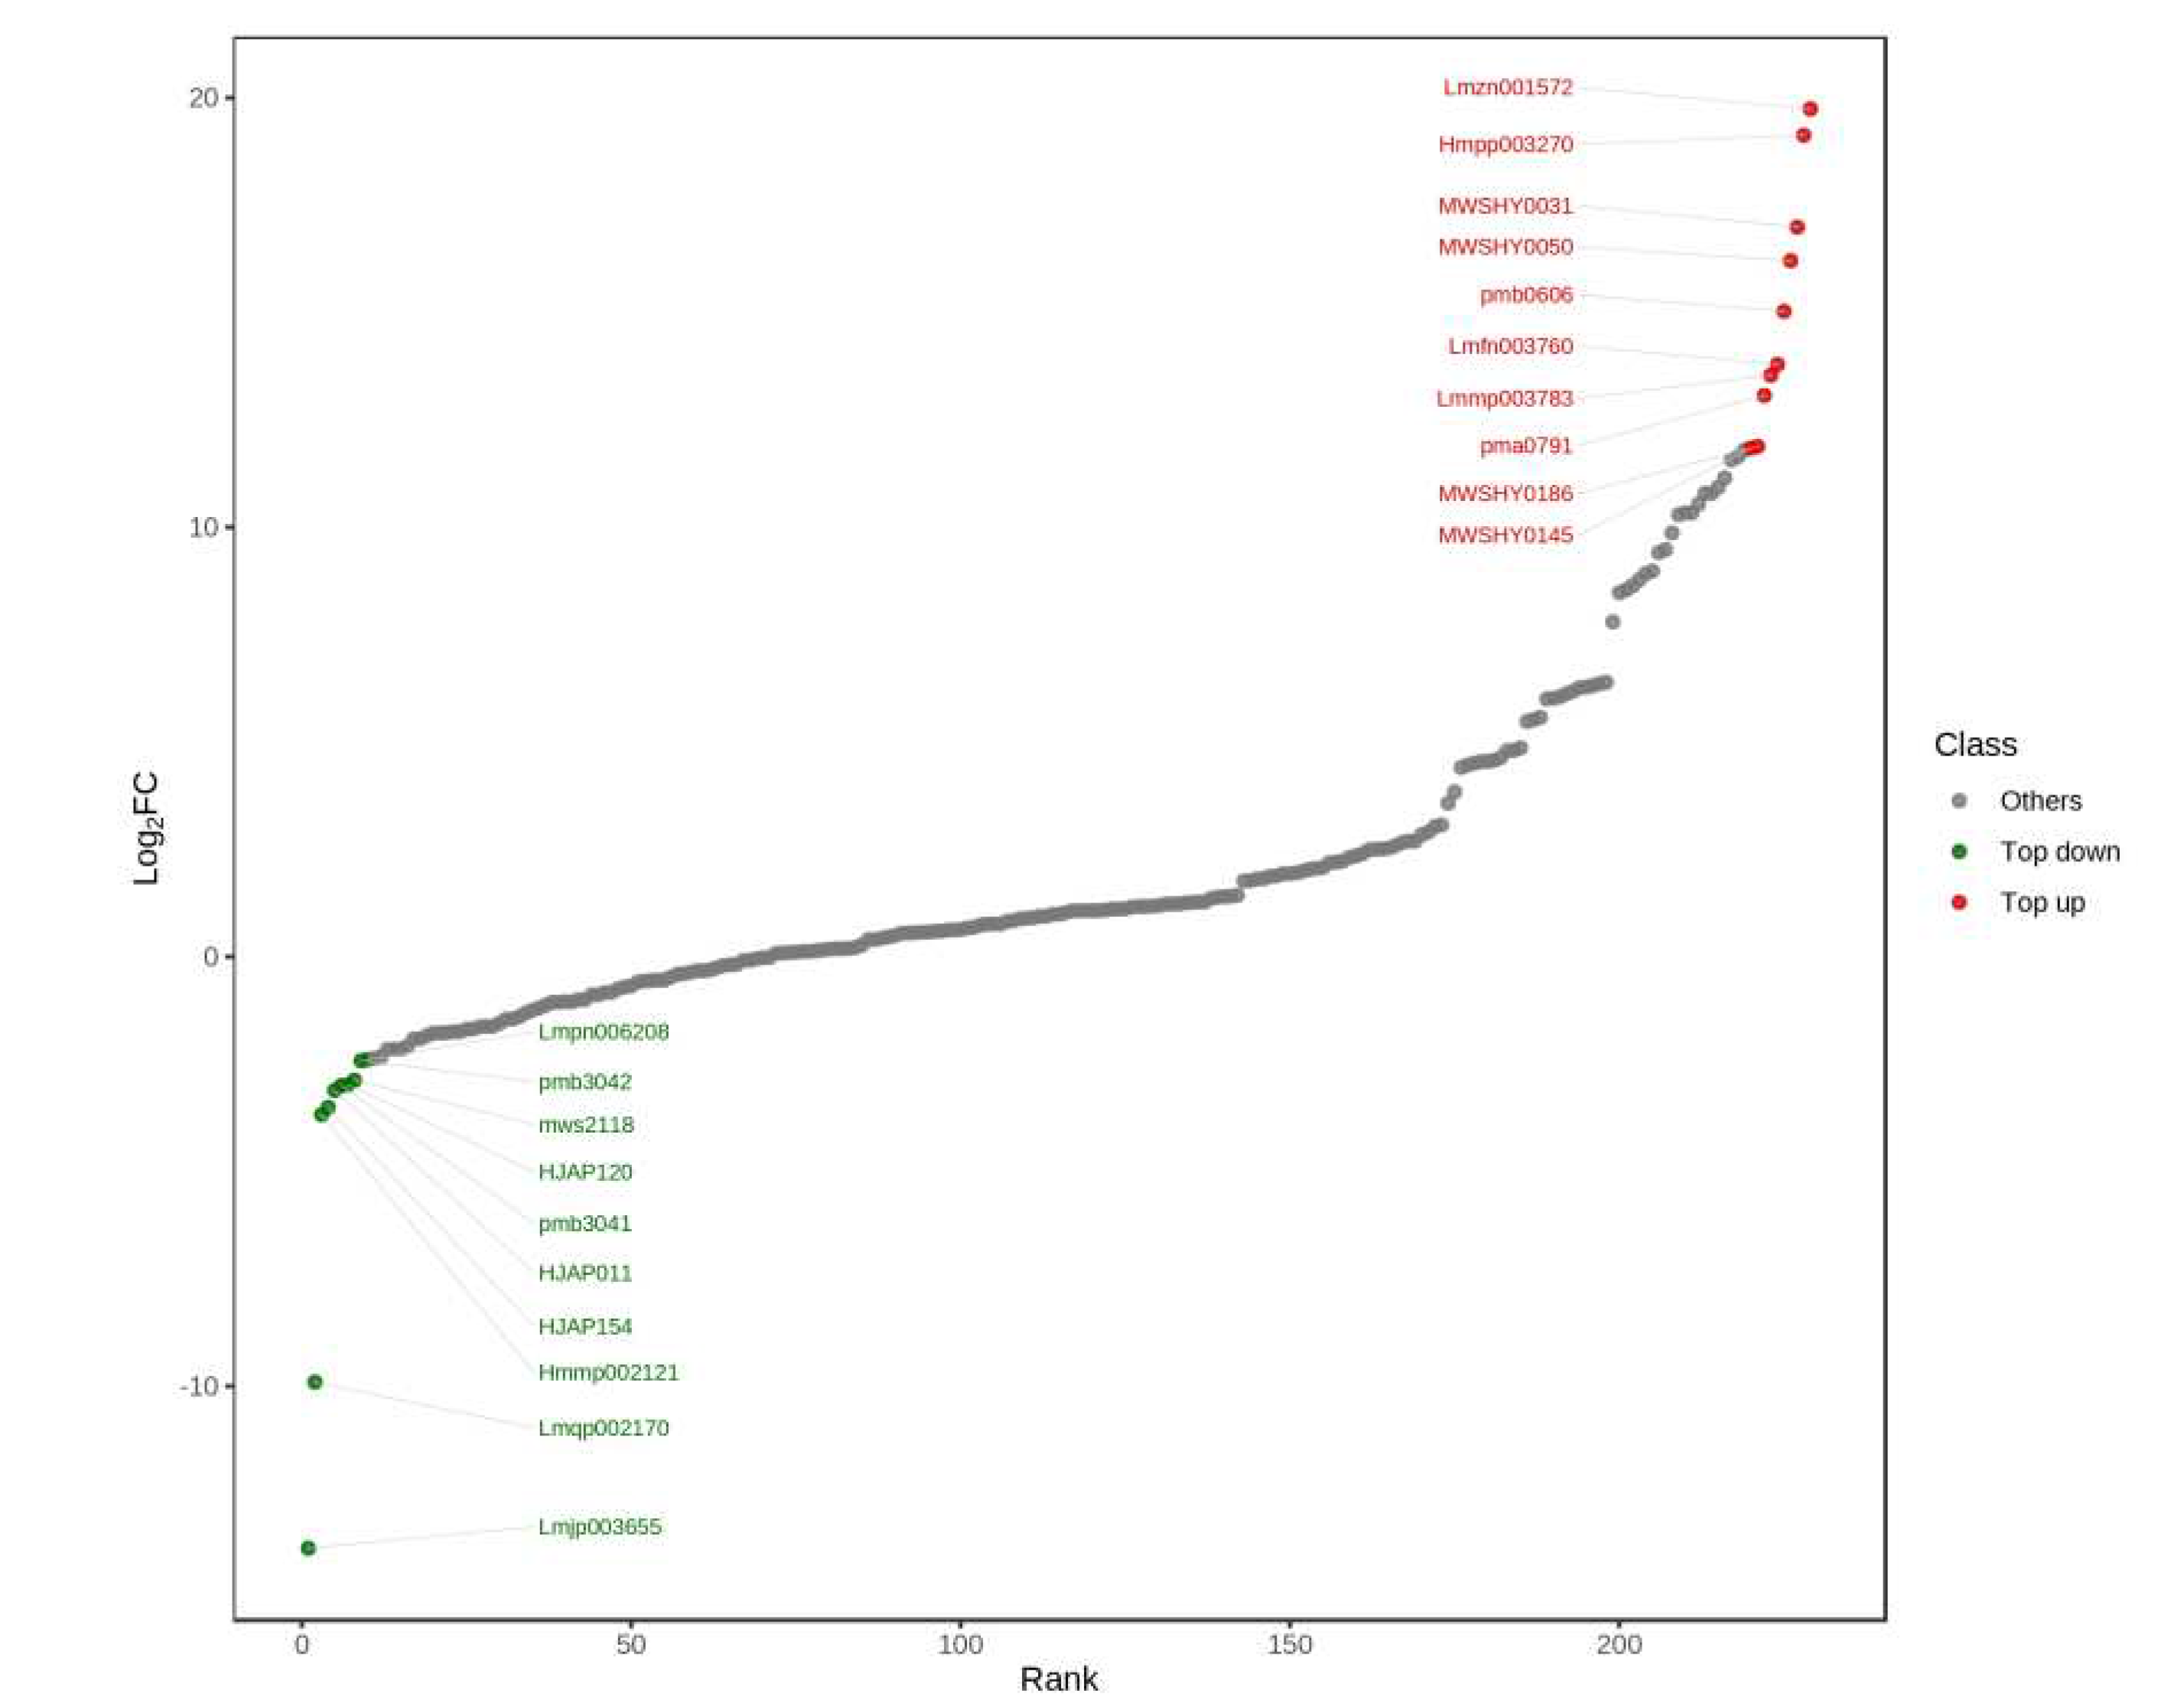
Flavonoids are a class of compounds commonly found in nature, playing an important role in many aspects of plant growth, development, and resistance. Based on the UPLC-MS/MS platform, a total of 229 metabolites were detected in this study. Among them, there were a total of 143 differential metabolites. Compared with purple mint, the content of 38 metabolites in green mint decreased, while the content of 105 metabolites increased (Supplementary Table 3 and Supplementary Figure 3). In order to display the DEMs clearly, the fold change (FC) values of metabolites between L and Z groups were calculated. The FC values were arranged from large to small, and the top 10 metabolites for upregulation and downregulation were listed in Table 2, then a dynamic distribution diagram of metabolite contents was shown as Figure 2.

3.2.1. Enrichment analysis of DEMs

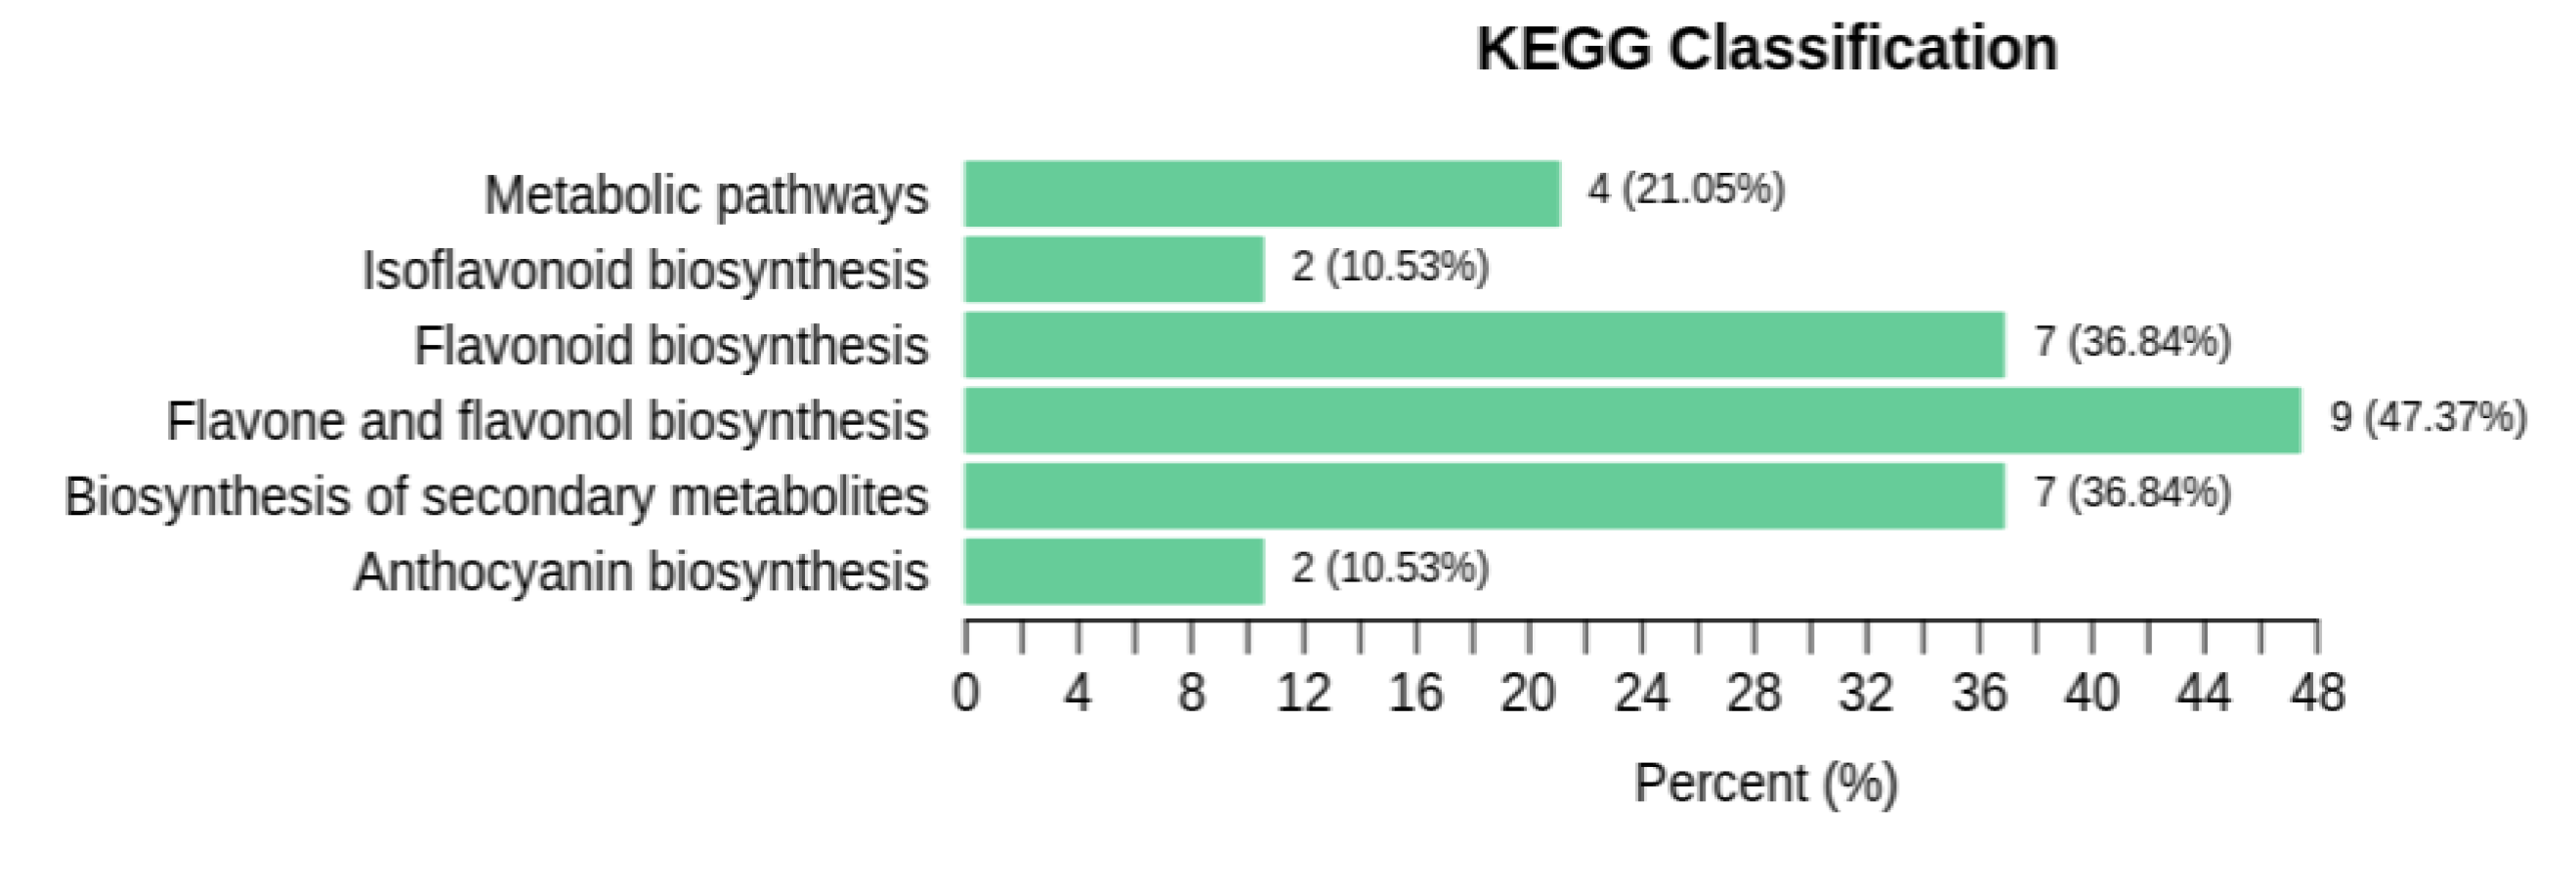
A total of 6 significantly correlated pathways were obtained by using the KEGG database annotation. They were metabolic pathways, isoflavonoid biosynthesis, flavonoid biosynthesis, flavone and flavonol biosynthesis, biosynthesis of secondary metabolites and anthocyanin biosynthesis (Figure 3). The number of metabolites enriched in each pathway was shown in Table 3, showing that the flavone and flavonol biosynthesis pathway enriched the most metabolites, followed by the flavonoid biosynthesis and biosynthesis of secondary metabolites pathways.
Sig_compound refers to the number of significant compounds in the pathway; All_compound refers to the number of all compounds in the pathway.

3.3. Joint analysis of transcriptome and metabolome

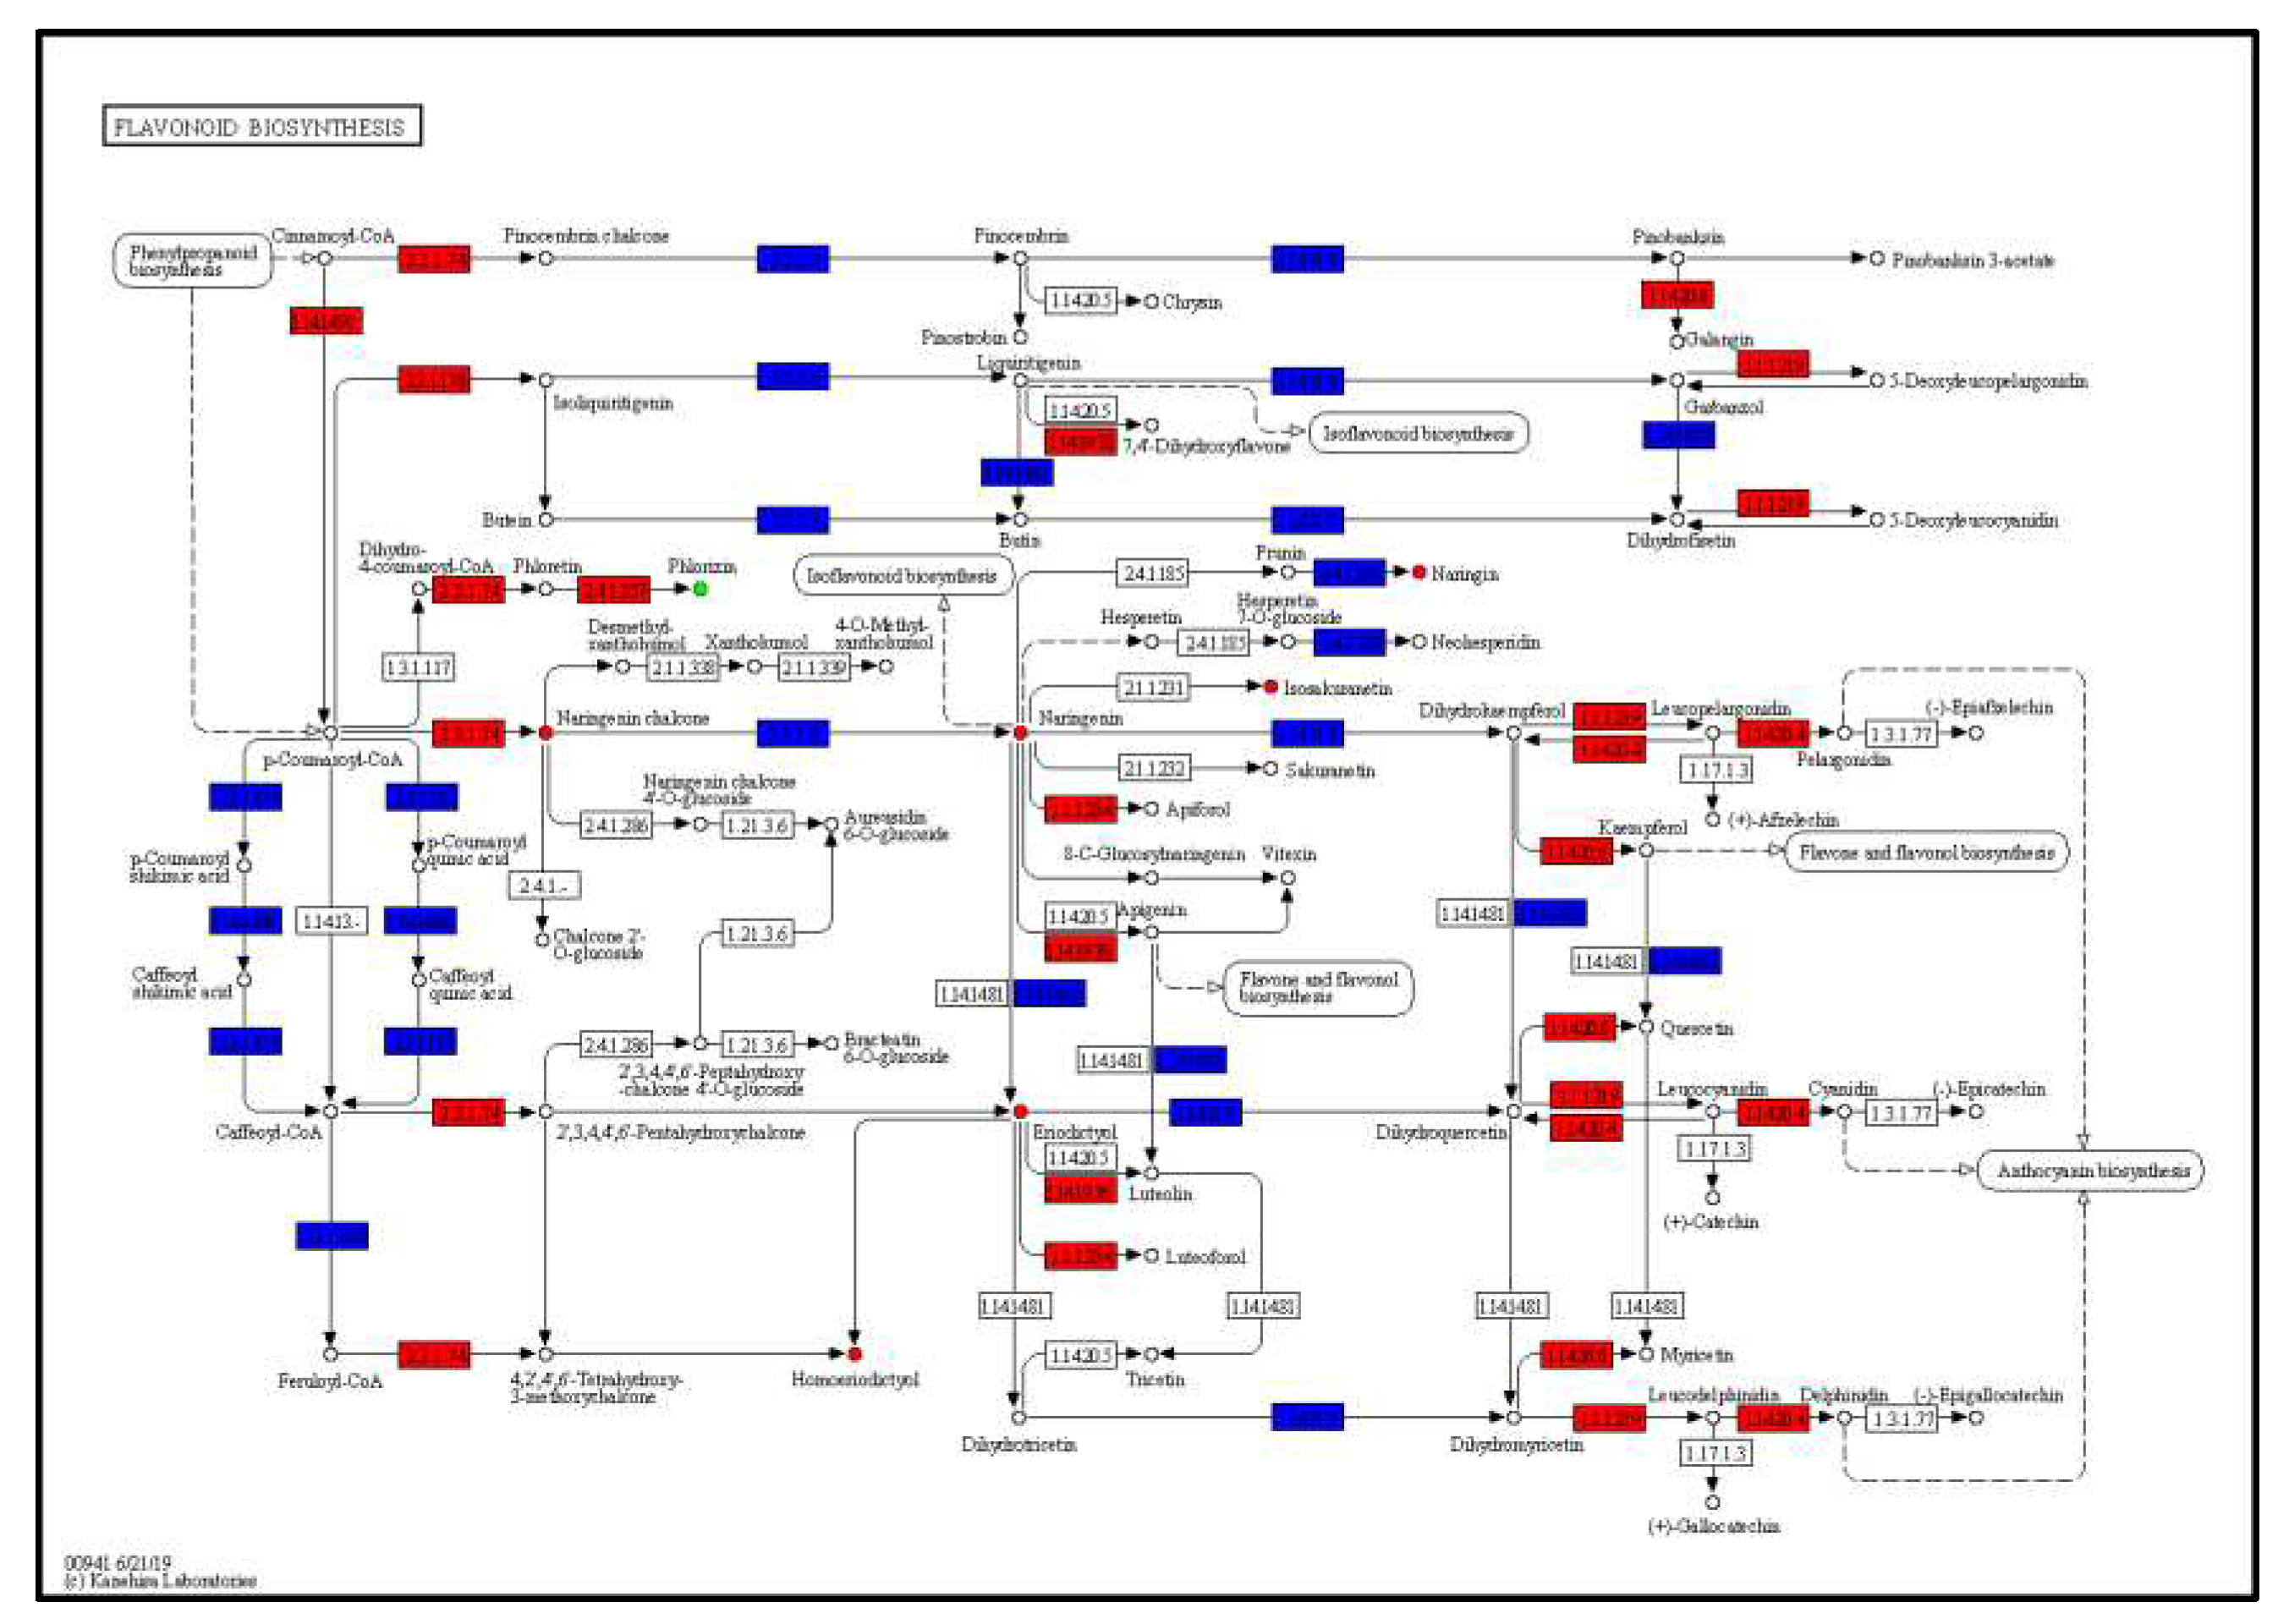
Based on the results of transcriptome and metabolome in this study, the DEGs and DEMs were simultaneously mapped onto the KEGG pathway diagram to better understand the relationship between genes and metabolites. By jointly analyzing the KEGG enrichment results of DEGs and DEMs, a total of 6 KEGG pathways were identified (Supplementary Table 4). The results of KEGG enrichment analysis (Table 4) showed that the metabolic pathways (ko01100) and biosynthesis of secondary metabolites (ko01110) pathway contained a large number of DEGs. Four flavonoid-related pathways were annotated. The flavone and flavonol biosynthesis pathway (ko00944) contained the most DEMs, followed by flavonoid biosynthesis pathway (ko00941) (Figure 4). Anthocyanin biosynthesis pathway (ko00942) related to the color of mint stem included 2 DEMs and 36 DEGs.
The O2PLS model was used for the integration analysis between two omics data sets. This model can reflect the overall impact between different data sets, and it can directly reflect the weight of different variables in the model (the larger of the weight, the more impacts on the other group), thereby key regulatory factors can be accurately discovered. O2PLS is a unsupervised model that objectively describes whether there is a correlation between two data sets, avoiding false associations as much as possible, which helps to establish biology regulatory networks. In this study, all differentially expressed genes and metabolites were selected to establish an O2PLS model. Through establishing loading plot, the most important genes and metabolites were screened out (Table 5).
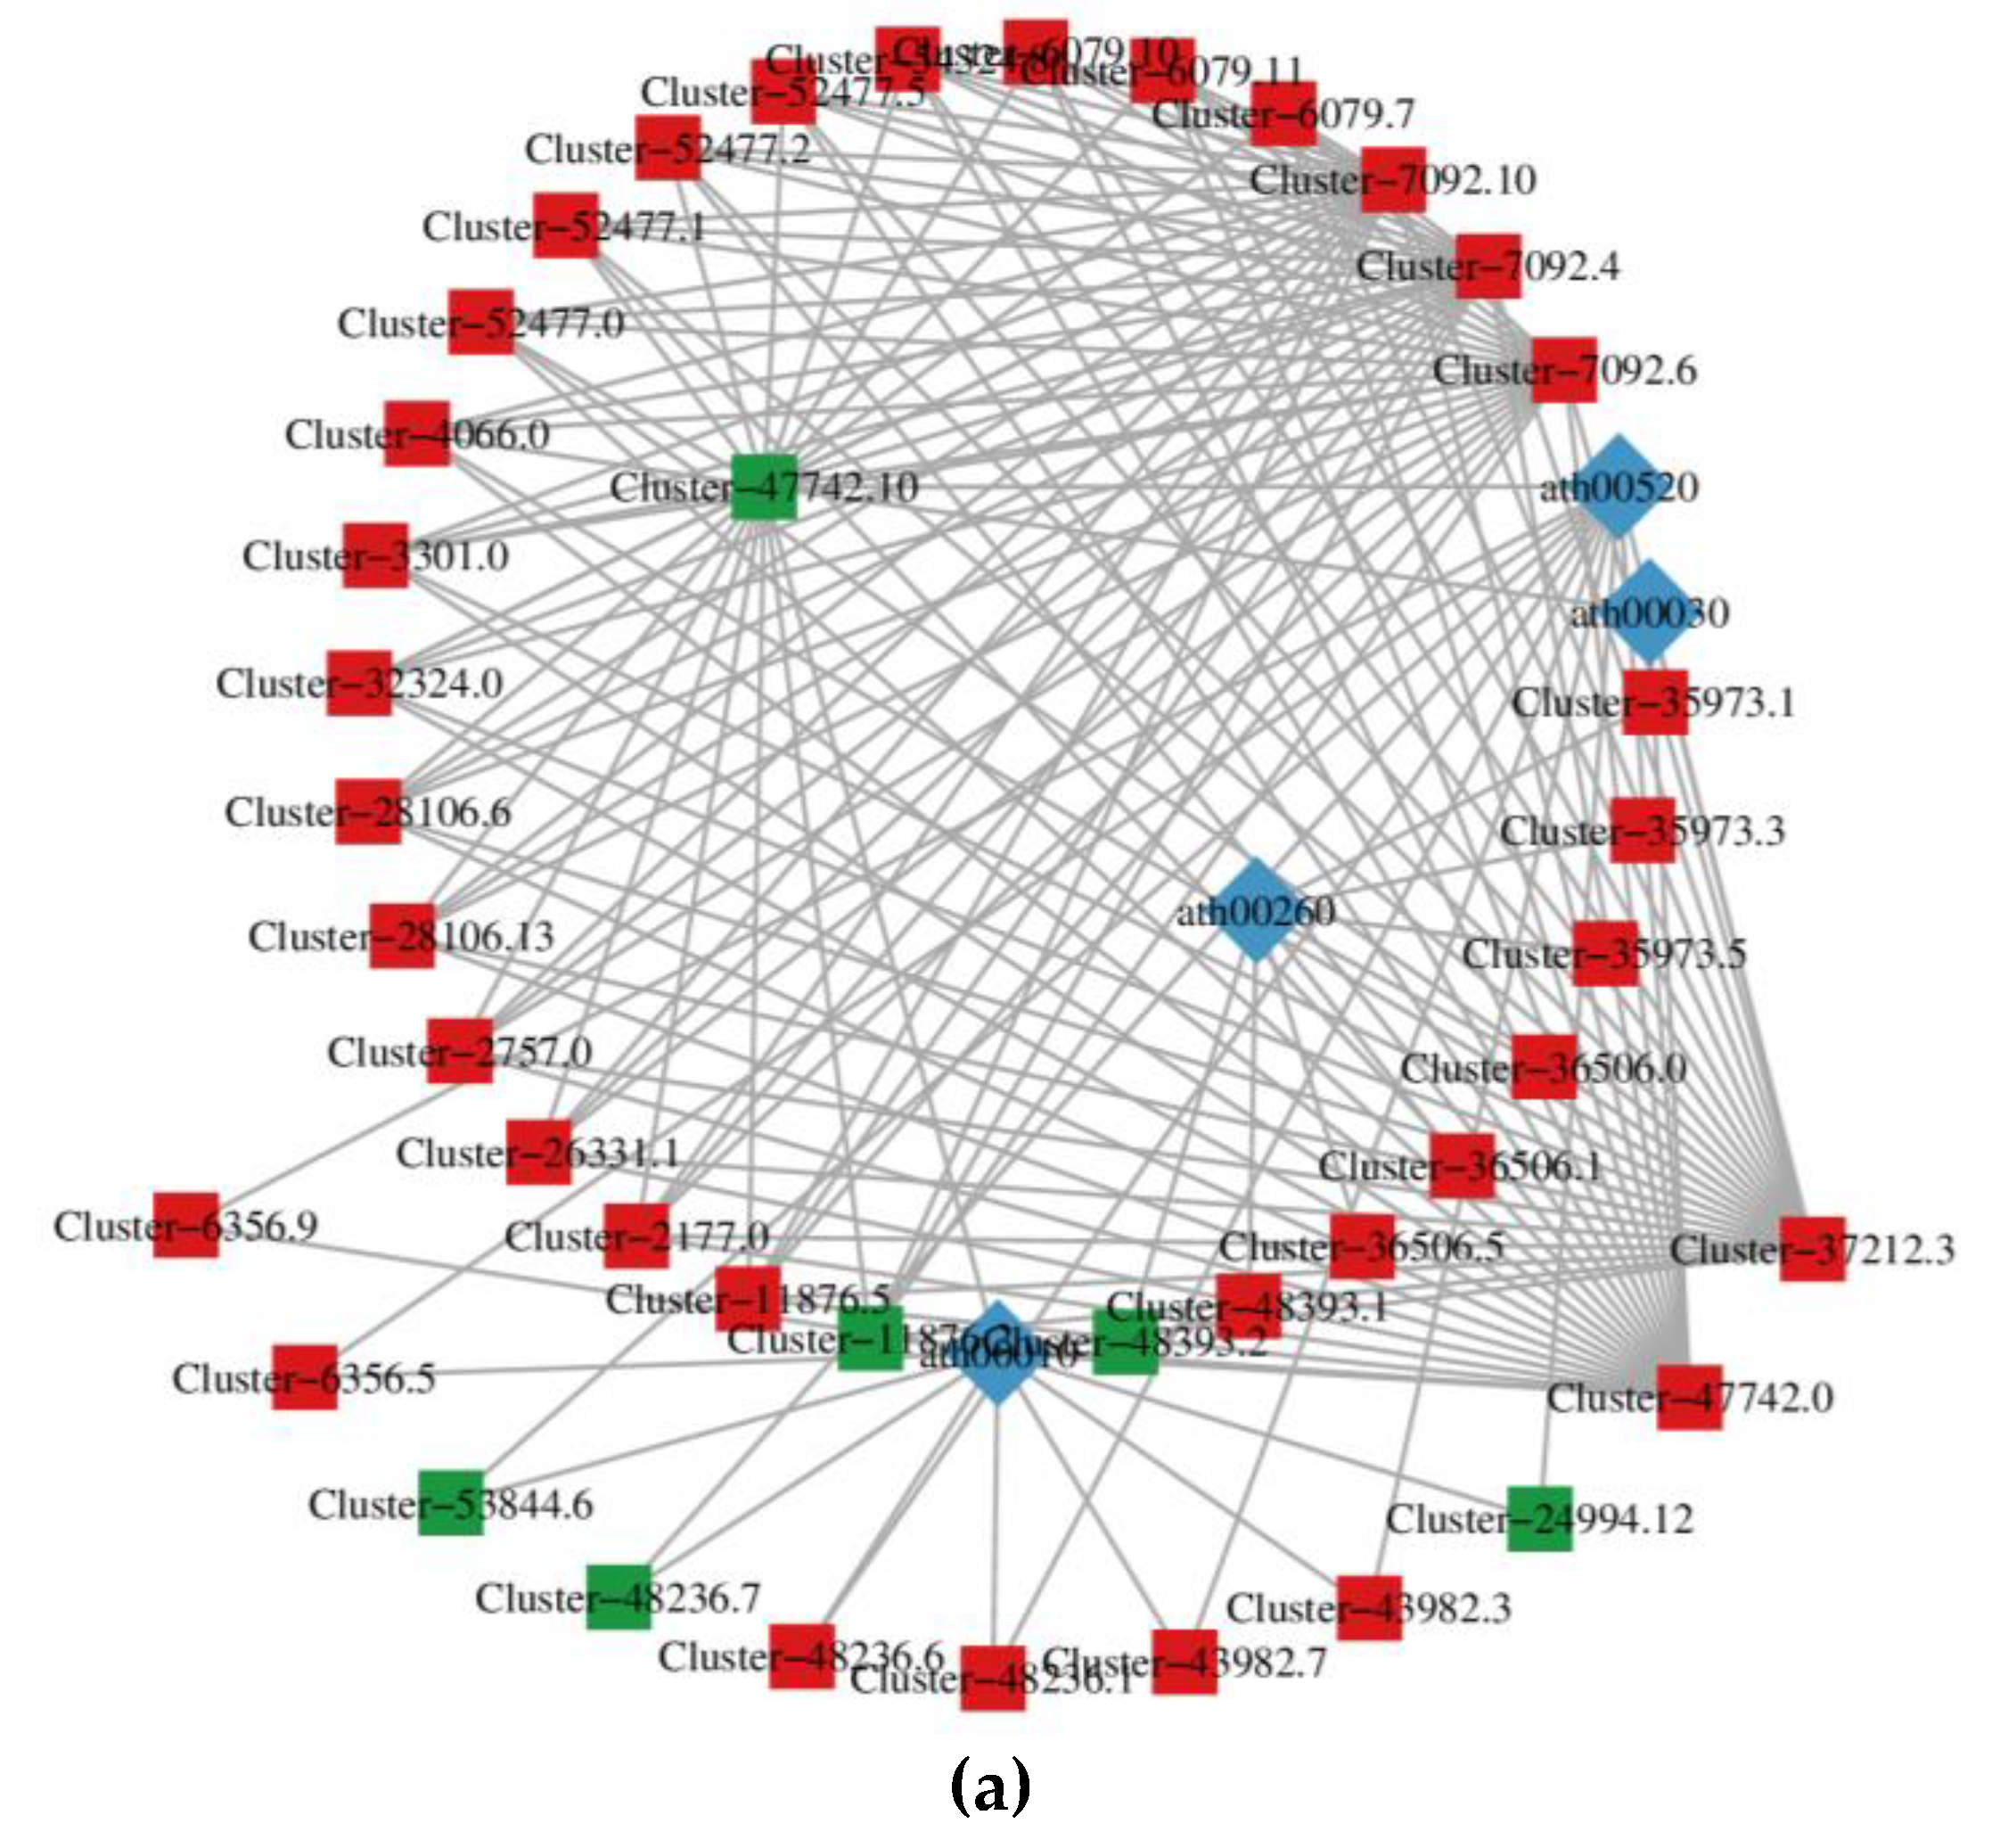
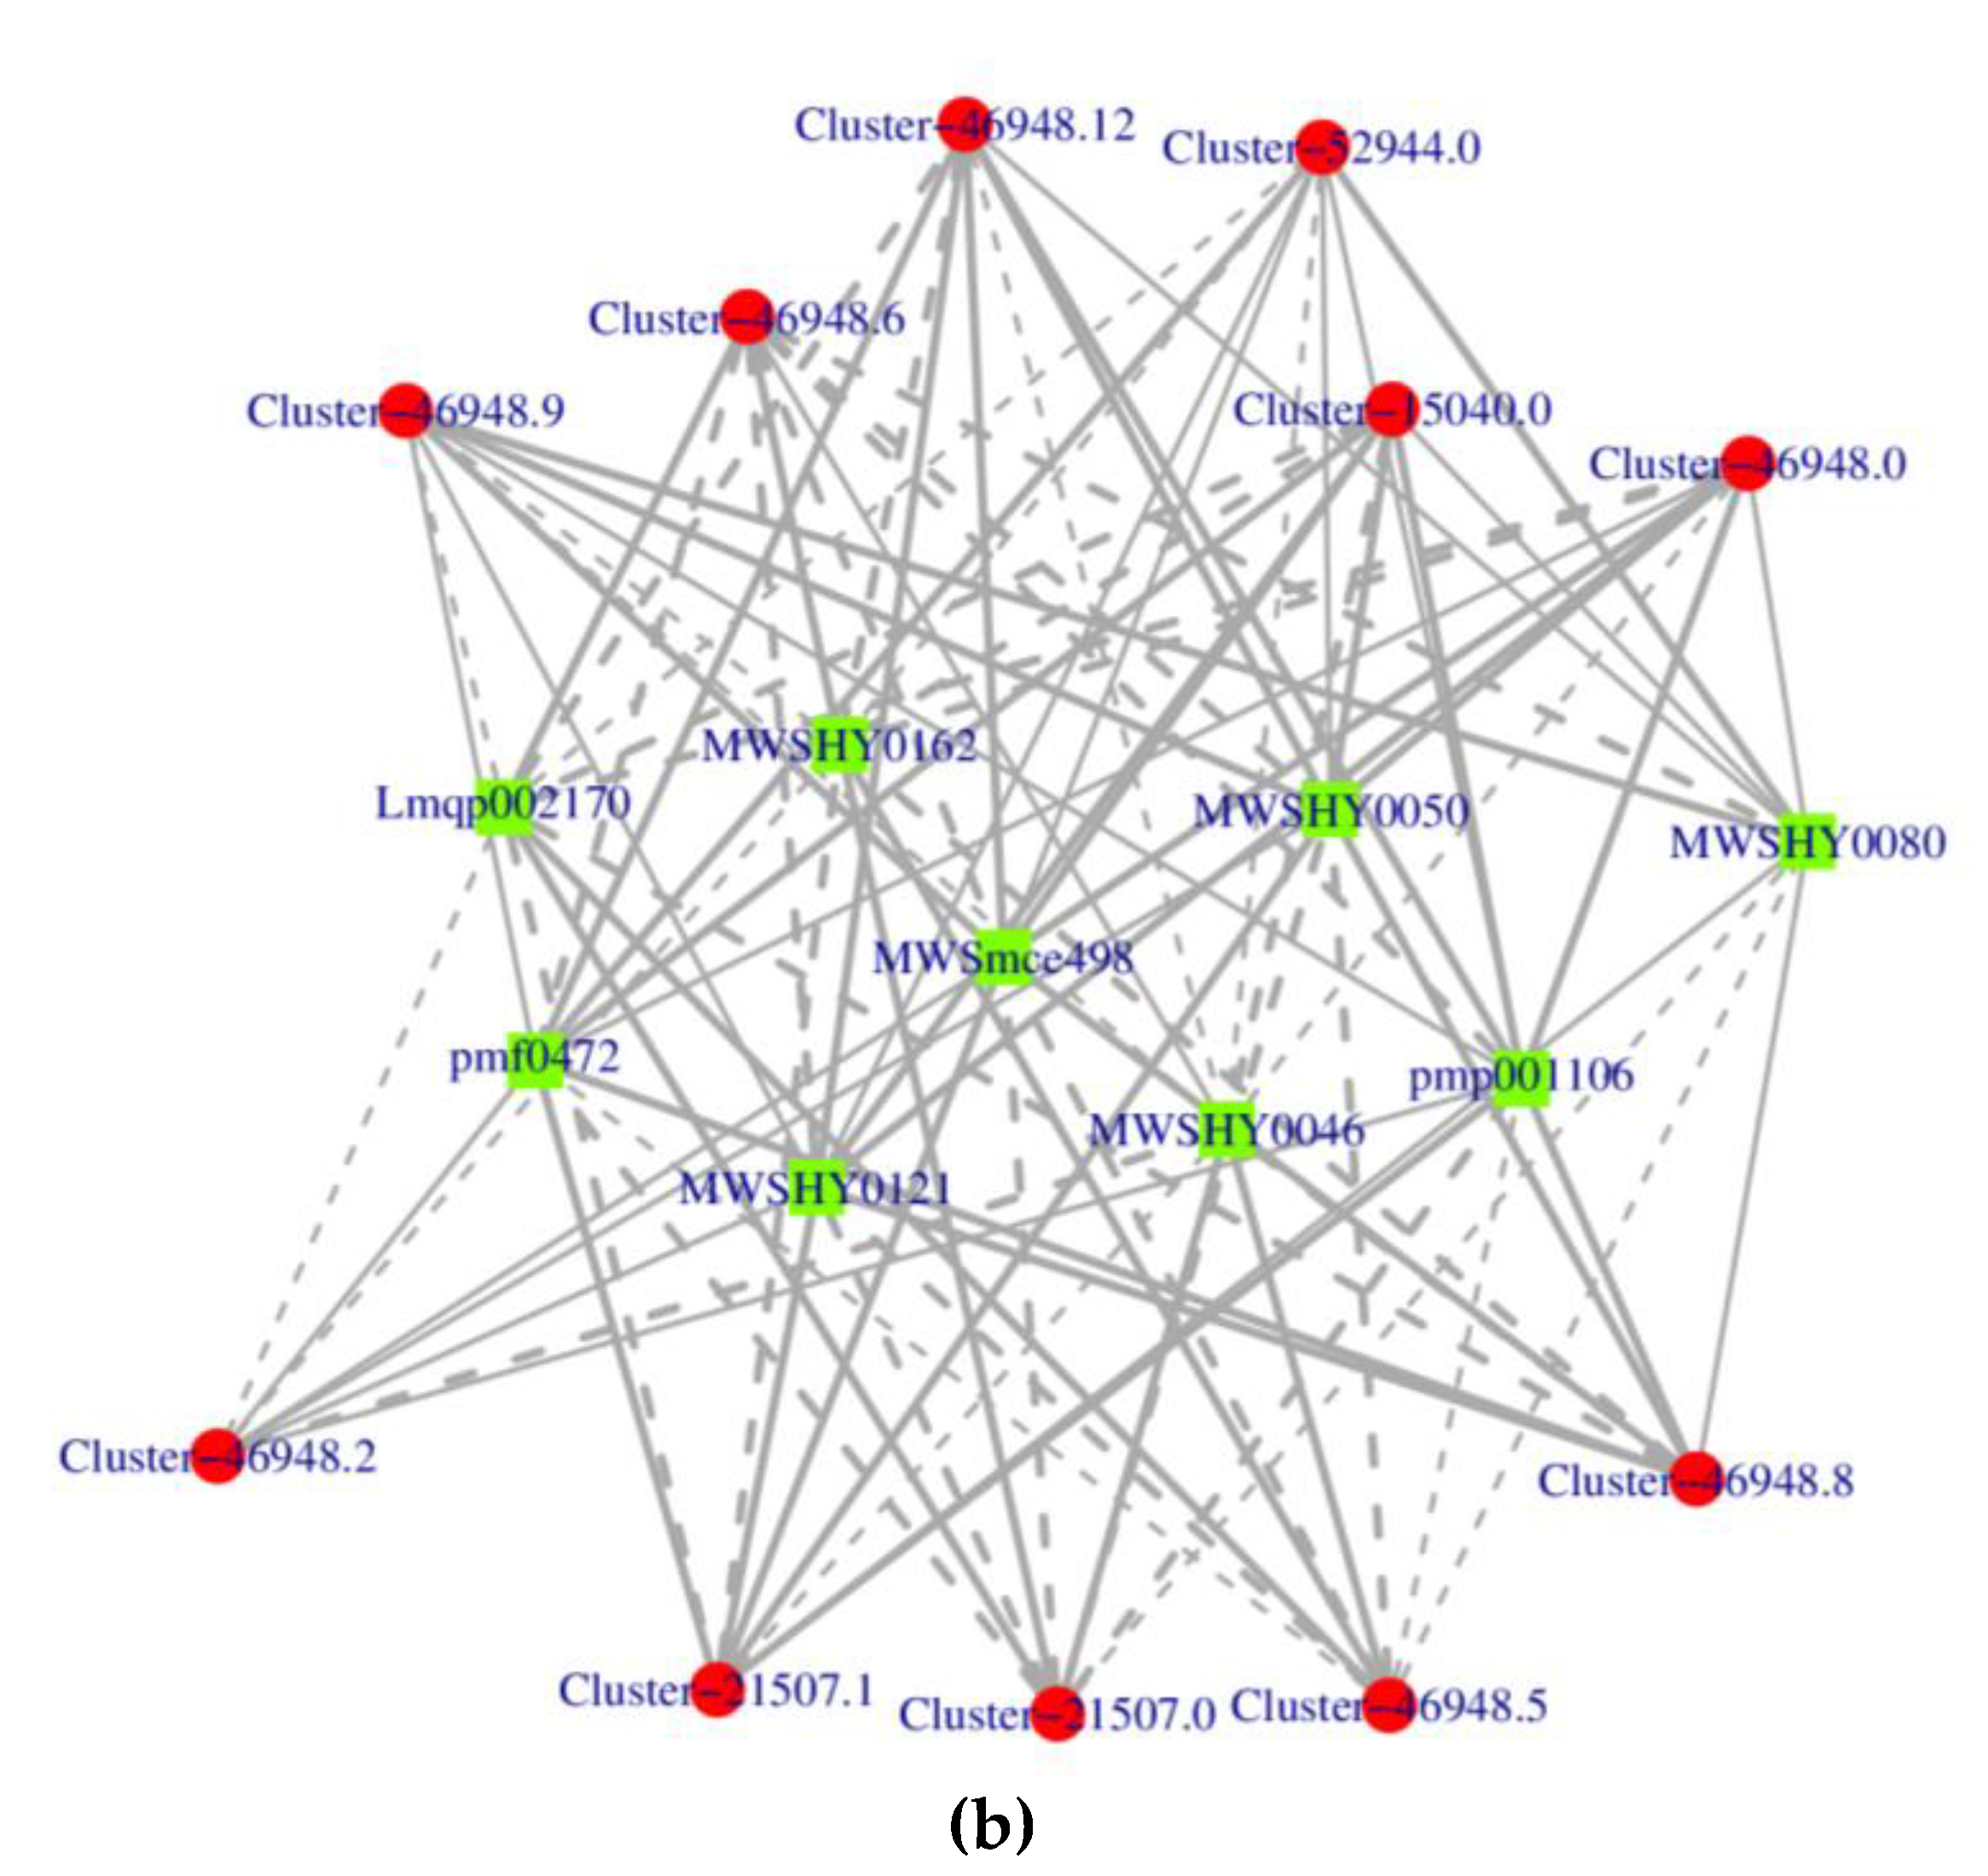
The KGML (KEGG markup language) results contain not only the relationship between graphic objects in the KEGG pathway, but also the information of orthologous genes in the KEGG database. Through this information, we can get the network relationship between genes and metabolites, which is convenient to study the interaction between transcriptome and metabolome. The KGML result (Figure 5a) showed that 41 genes were closely related to 4 pathways (ath00520, ath00030, ath00260 and ath00010). Among the 41 genes, 6 genes were downregulated in expression, while the other 35 genes were upregulated in expression. The Cluster-47742.10, Cluster-7092.10, Cluster-7092.4, Cluster-7092.6, Cluster-37212.3 and Cluster-47742.0 were more closely related to other genes. We also analyzed the correlation of genes and metabolites through network diagrams by selecting differential expressed genes and metabolites in the pathway with Pearson correlation coefficient greater than 0.80 and p-value less than 0.05. For example, the result (Figure 5b) visually displays the correlation between genes and metabolites in ko00944 pathway.

4. Discussion

Mentha species are of big economic value and largely consumed in food and pharmaceutical industries mostly due to they are rich in phenolic compounds, especially in phenolic acids and flavonoids. In this study, the purple mint had much higher anthocyanin (8.493±0.481) and total flavone (8.531±0.758) content compared with green mint (0.363±0.035 and 5.457±0.276), meaning the purple mint may has higher production value. But the molecular mechanisms of anthocyanin and flavone biosynthesis remain unclear between purple and green mints. Transcriptome sequencing is a powerful tool for screening gene expression patterns and identifying candidate genes, and it has also been successfully used in gene mining in genus Mentha [22]. For example, Boachon et al [23] combined leaf transcriptome data from 48 Lamiaceae species and four outgroups with a robust phylogeny and chemical analyses of three terpenoid classes (monoterpenes, sesquiterpenes, iridoids), and finally elucidated the mechanisms of chemical diversity in Lamiaceae. To identify the critical genes during light-regulated changes in mint oil content, leaves were collected for transcriptome analysis. A total of 10,977 DEGs were found to be involved in the light signaling pathway and monoterpene synthesis pathway [24].Godden et al [25] used transcriptomic data investigate the prevalence, occurrence, and timing of gene duplications in Lamiaceae. They found evidence for widespread but asymmetrical levels of gene duplication and ancient polyploidy in Lamiaceae. The results help disentangle gene duplicates from those produced by other mechanisms. Vining et al [26] used high-throughput Illumina sequencing to study gene expression in response to V. dahliae inoculation in two M. longifolia accessions with contrasting phenotypes (wilt-resistant CMEN 585 and wilt-susceptible CMEN 584), and found that greatest numbers of differentially expressed genes were found in the roots of CMEN 585 at the early time points. Six important genes involved in the biosynthesis of triterpenic acids in the mint family were identified using transcriptome analysis. Based on the results of in-depth data analysis, genes encoding squalene epoxidase and oxido squalene cyclases were proposed as targets for boosting triterpene production [27]. So, transcriptome analysis can bridge the knowledge gap and facilitate the identification of the main genes in mint.
In the current study, high-throughput RNA sequences were generated to analyze the transcriptomes between purple and green mints. A total of 167,901 unigenes were obtained and 34,608 genes were differentially expressed. The annotated DEGs were mainly classified as cellular anatomical entity (21,503 DEGs), cellular process (15,966 DEGs), binding (14,791 DEGs), metabolic process (12,629 DEGs) and catalytic activity (11,732 DEGs). The top 5 pathways the DEGs involved in were plant-type secondary cell wall biogenesis (193 DEGs), lignin metabolic process (171 DEGs), flavonoid biosynthetic process (167 DEGs), oxidoreductase activity (120 DEGs) and lignin catabolic process (113 DEGs). From the results, it can be seen that the four pathway (plant-type secondary cell wall biogenesis, lignin metabolic process, flavonoid biosynthetic process and lignin catabolic process) were closely related. Lignin is a complex phenylpropanoid polymer deposited in the secondary cell walls of plants [28]. The biosynthesis of both flavonoid and lignin originate from phenylalanine, and they were in a tight biosynthetic regulatory network. Flavonoids naringenin chalcone, naringenin, dihydrotricin, and tricin are lignin monomers. Various classes of flavonoids, the chalconoid naringenin chalcone, the flavanones naringenin and dihydrotricin, and the flavone tricin, incorporated into the lignin polymer. These flavonoids were released from the lignin by Derivatization Followed by Reductive Cleavage (DFRC), indicating that at least a fraction of each was integrated into the lignin as ether-linked structures [29]. Lam et al [30]reported that mutants deficient in the early flavonoid biosynthetic genes encoding CHALCONE SYNTHASE (CHS), CHALCONE ISOMERASE (CHI), and CHI-LIKE (CHIL), with an emphasis on the analyses of disrupted tricin-lignin formation and the concurrent changes in lignin profiles and cell wall digestibility. So, in this study, the purple mint with higher total flavone content also showed significant different gene expression pattern of secondary cell wall biogenesis and lignin metabolic process. The results was useful to identify the key genes in the flavone biosynthetic pathway.
Metabolomics is the systematic identification and quantification of all metabolites in an organism or biological sample [31]. The combination of chromatography and mass spectrometry enables the entire process from substance separation using chromatography to substance identification using mass spectrometry. The UPCL-MS/MS platform can perform accurate qualitative and quantitative analysis of plant metabolites. Plants, as a direct or indirect source of nutrition, energy, and medicine for humans, can synthesize a large number of metabolic substances with diverse biological functions. Therefore, metabolomics plays a very important role in plant research. Because mint contains a lot of secondary metabolites, the metabolomics analysis is a good way to detect and screen metabolites with significant biological significance, and to elucidate the metabolic processes and mechanisms of mint. In the present study, a total of 143 differentially expressed metabolites were detected. Compared with purple mint, the content of 38 metabolites in green mint decreased, while 105 metabolites increased (Supplementary Table 3 and Supplementary Figure 3). These DEMs were enriched in isoflavonoid biosynthesis, flavonoid biosynthesis, flavone and flavonol biosynthesis, and anthocyanin biosynthesis. The results indicated that compared with green mint, there had indeed been significant changes in the biosynthesis of flavone in purple mint.
Biological processes are very complex. Integrating multi omics data can reduce false positives caused by single omics analysis. The joint analysis of multiple omics data is more conducive to the study of phenotype and biological process regulation mechanisms in biological models [32]. The joint analysis of multi omics data can not only verify each other, but also provide us with a panoramic window to understand the biological activity process [33]. In this study, by establishing data relationships between mint transcriptome and metabolic pathway enrichment, we systematically and comprehensively analyzed the regulatory mechanisms of anthocyanin and flavone, and ultimately achieved a comprehensive understanding of the biological changes, and screened out key genes and metabolic pathways for subsequent in-depth analysis. A total of 6 KEGG pathways were identified by jointly analyzing the KEGG enrichment results of DEGs and DEMs. The flavone and flavonol biosynthesis pathway (ko00944) contained the most DEMs, followed by flavonoid biosynthesis pathway (ko00941) (Figure 4). Anthocyanin biosynthesis pathway (ko00942) related to the color of mint stem included 2 DEMs and 36 DEGs. Furthermore, the most important genes and metabolites were screened using O2PLS model (Table 5), the glucuronides, sophoroside and nicotiflorin were all the key compounds in the flavone biosynthesis pathways.

Supplementary Materials

The following supporting information can be downloaded at the website of this paper posted on Preprints.org. Figure S1: Pearson’s correlation coefficient of different samples; Figure S 2: Volcano plot of DEGs between green and purple mint; Figure S3: Volcano plot of DEMs between green and purple mint groups; Table S1: Statistics of gene annotation information in various databases; Table S2: Detailed information of the total 34608 DEGs; Table S3: Detailed information of the DEMs; Table S4: KEGG results of transcriptome and metabolome.

Author Contributions

For research articles with several authors, a short paragraph specifying their individual contributions must be provided. The following statements should be used “Conceptualization, X.W. and Y.M.; methodology, X.W. and S.K.; software, H.A.; validation, X.W., Y.M. and H.C.; formal analysis, H.A.; investigation, X.W. and H.C.; resources, Y.M.; data curation, H.A. and H.C.; writing—original draft preparation, X.W.; writing—review and editing, X.W. and H.A; visualization, H.C.; supervision, Y.M.; project administration, X.W.; funding acquisition, Y.M and S.K. All authors have read and agreed to the published version of the manuscript.” Please turn to the CRediT taxonomy for the term explanation. Authorship must be limited to those who have contributed substantially to the work reported.

Funding

This work was supported by “Hebei Province science and technology support plan, [2020]” and “Tangshan Key Laboratory for Germplasm Evaluation and Systematic Utilization of medicinal plants [2020]”.

Data Availability Statement

The data presented in this study are available in the article and supplementary material.

Conflicts of Interest

The authors declare that the research was conducted in the absence of any commercial or financial relationships that could be construed as a potential conflict of interest.

References

  1. Bahadori, M.B.; Zengin, G.; Bahadori, S.; Dinparast, L.; Movahhedin, N. Phenolic composition and functional properties of wild mint (Mentha longifolia var. calliantha (Stapf) Briq.). International journal of food properties. 2018, 21, 183–193. [Google Scholar] [CrossRef]
  2. Wani, S.A.; Naik, H.; Wagay, J.A.; Ganie, N.A.; Mulla, M.Z.; Dar, B. Mentha: A review on its bioactive compounds and potential health benefits. Quality Assurance and Safety of Crops & Foods. 2022, 14, 154–168. [Google Scholar] [CrossRef]
  3. Yilmaztekin, M.; Lević, S.; Kalušević, A.; Cam, M.; Bugarski, B.; Rakić, V.; Pavlović, V.; Nedović, V. Characterisation of peppermint (Mentha piperita L.) essential oil encapsulates. Journal of microencapsulation. 2019, 36, 109–119. [Google Scholar] [CrossRef]
  4. Shaikh, S.; Yaacob, H.; Rahim, Z. Prospectve role in treatment of major illnesses and potental benefts as a safe insectcide and natural food preservatve of mint (Mentha spp.): A review. Asian J Biomed Pharm. 2014, 4. [Google Scholar]
  5. Salehi, B.; Stojanović-Radić, Z.; Matejić, J.; Sharopov, F.; Antolak, H.; Kręgiel, D.; Sen, S.; Sharifi-Rad, M.; Acharya, K.; Sharifi-Rad, R. Plants of genus Mentha: From farm to food factory. Plants. 2018, 7, 70. [Google Scholar] [CrossRef] [PubMed]
  6. Šarić-Kundalić, B.; Fialová, S.; Dobeš, C.; Ölzant, S.; Tekeľová, D.; Grančai, D.; Reznicek, G.; Saukel, J. Multivariate numerical taxonomy of Mentha species, hybrids, varieties and cultivars. Scientia Pharmaceutica. 2009, 77, 851–876. [Google Scholar] [CrossRef]
  7. Arumugam, P.; Priya, N.G.; Subathra, M.; Ramesh, A. Anti-inflammatory activity of four solvent fractions of ethanol extract of Mentha spicata L. investigated on acute and chronic inflammation induced rats. Environmental toxicology and pharmacology. 2008, 26, 92–95. [Google Scholar] [CrossRef]
  8. Diop, S.M.; Guèye, M.T.; Ndiaye, I.; Ndiaye, E.H.B.; Diop, M.B.; Heuskin, S.; Fauconnier, M.-L.; Lognay, G. Chemical composition of essential oils and floral waters of Mentha longifolia (L.) Huds. from Senegal. American Journal of Essential Oils and Natural Products. 2016, 4, 46–49. [Google Scholar]
  9. Peixoto, I.; Furlanetti, V.; Anibal, P.; Duarte, M.; Höfling, J. Potential pharmacological and toxicological basis of the essential oil from Mentha spp. Revista de Ciências Farmacêuticas Básica e Aplicada. 2009, 30. [Google Scholar]
  10. Tiwari, P. Recent advances and challenges in trichome research and essential oil biosynthesis in Mentha arvensis L. Industrial Crops and Products. 2016, 82, 141–148. [Google Scholar] [CrossRef]
  11. Dimandja, J.M.D.; Stanfill, S.B.; Grainger, J.; Patterson Jr, D.G. Application of comprehensive two-dimensional gas chromatography (GC× GC) to the qualitative analysis of essential oils. Journal of High Resolution Chromatography. 2000, 23, 208–214. [Google Scholar] [CrossRef]
  12. Gherman, C.; Culea, M.; Cozar, O. Comparative analysis of some active principles of herb plants by GC/MS. Talanta. 2000, 53, 253–262. [Google Scholar] [CrossRef] [PubMed]
  13. Carrera, J.; Rodrigo, G.; Jaramillo, A.; Elena, S.F. Reverse-engineering the Arabidopsis thaliana transcriptional network under changing environmental conditions. Genome biology. 2009, 10, 1–15. [Google Scholar] [CrossRef] [PubMed]
  14. Vining, K.J.; Johnson, S.R.; Ahkami, A.; Lange, I.; Parrish, A.N.; Trapp, S.C.; Croteau, R.B.; Straub, S.C.; Pandelova, I.; Lange, B.M. Draft genome sequence of Mentha longifolia and development of resources for mint cultivar improvement. Molecular plant. 2017, 10, 323–339. [Google Scholar] [CrossRef]
  15. Chen, S.; Zhou, Y.; Chen, Y.; Gu, J. Fastp: an ultra-fast all-in-one FASTQ preprocessor. Bioinformatics. 2018, 34, i884–i890. [Google Scholar] [CrossRef]
  16. Grabherr, M.G.; Haas, B.J.; Yassour, M.; Levin, J.Z.; Thompson, D.A.; Amit, I.; Adiconis, X.; Fan, L.; Raychowdhury, R.; Zeng, Q. Full-length transcriptome assembly from RNA-Seq data without a reference genome. Nature biotechnology. 2011, 29, 644–652. [Google Scholar] [CrossRef]
  17. Davidson, N.M.; Oshlack, A. Corset: enabling differential gene expression analysis for de novoassembled transcriptomes. Genome biology. 2014, 15, 1–14. [Google Scholar] [CrossRef]
  18. Li, B.; Dewey, C.N. RSEM: accurate transcript quantification from RNA-Seq data with or without a reference genome. BMC Bioinformatics. 2011, 12, 323. [Google Scholar] [CrossRef]
  19. Love, M.I.; Huber, W.; Anders, S. Moderated estimation of fold change and dispersion for RNA-seq data with DESeq2. Genome Biology. 2014, 15, 550. [Google Scholar] [CrossRef]
  20. Buchfink, B.; Xie, C.; Huson, D.H. Fast and sensitive protein alignment using DIAMOND. Nature methods. 2015, 12, 59–60. [Google Scholar] [CrossRef]
  21. Bouhaddani, S.E.; Houwing-Duistermaat, J.; Salo, P.; Perola, M.; Jongbloed, G.; Uh, H.W. Evaluation of O2PLS in Omics data integration. BMC Bioinformatics. 2016, 17, 117–132. [Google Scholar] [CrossRef] [PubMed]
  22. López-Hernández, F.; Cortés, A.J. Whole transcriptome sequencing unveils the genomic determinants of putative somaclonal variation in Mint (Mentha L.). International Journal of Molecular Sciences. 2022, 23, 5291. [Google Scholar] [CrossRef] [PubMed]
  23. Boachon, B.; Buell, C.R.; Crisovan, E.; Dudareva, N.; Garcia, N.; Godden, G.; Henry, L.; Kamileen, M.O.; Kates, H.R.; Kilgore, M.B. Phylogenomic mining of the mints reveals multiple mechanisms contributing to the evolution of chemical diversity in Lamiaceae. Molecular plant. 2018, 11, 1084–1096. [Google Scholar] [CrossRef]
  24. Yu, X.; Qi, X.; Li, S.; Fang, H.; Bai, Y.; Li, L.; Liu, D.; Chen, Z.; Li, W.; Liang, C. Transcriptome analysis of light-regulated Monoterpenes biosynthesis in leaves of Mentha canadensis L. Plants. 2021, 10, 930. [Google Scholar] [CrossRef]
  25. Godden, G.T.; Kinser, T.J.; Soltis, P.S.; Soltis, D.E. Phylotranscriptomic analyses reveal asymmetrical gene duplication dynamics and signatures of ancient polyploidy in mints. Genome Biology and Evolution. 2019, 11, 3393–3408. [Google Scholar] [CrossRef]
  26. Vining, K.J.; Pandelova, I. Dynamic tissue-specific transcriptome changes in response to Verticillium dahliae in wild mint species Mentha longifolia. Plants. 2022, 11, 674. [Google Scholar] [CrossRef] [PubMed]
  27. Aminfar, Z.; Rabiei, B.; Tohidfar, M.; Mirjalili, M.H. Identification of key genes involved in the biosynthesis of triterpenic acids in the mint family. Scientific Reports. 2019, 9, 1–15. [Google Scholar] [CrossRef]
  28. Vanholme, R.; De Meester, B.; Ralph, J.; Boerjan, W. Lignin biosynthesis and its integration into metabolism. Current opinion in biotechnology. 2019, 56, 230–239. [Google Scholar] [CrossRef]
  29. Rencoret, J.; Rosado, M.J.; Kim, H.; Timokhin, V.I.; Gutiérrez, A.; Bausch, F.; Rosenau, T.; Potthast, A.; Ralph, J.; Del Río, J.C. Flavonoids naringenin chalcone, naringenin, dihydrotricin, and tricin are lignin monomers in papyrus. Plant Physiology. 2022, 188, 208–219. [Google Scholar] [CrossRef]
  30. Lam, P.Y.; Wang, L.; Lui, A.C.; Liu, H.; Takeda-Kimura, Y.; Chen, M.-X.; Zhu, F.-Y.; Zhang, J.; Umezawa, T.; Tobimatsu, Y. Deficiency in flavonoid biosynthesis genes CHS, CHI, and CHIL alters rice flavonoid and lignin profiles. Plant Physiology. 2022, 188, 1993–2011. [Google Scholar] [CrossRef]
  31. Zhang, A.; Sun, H.; Wang, P.; Han, Y.; Wang, X. Modern analytical techniques in metabolomics analysis. Analyst. 2012, 137, 293–300. [Google Scholar] [CrossRef] [PubMed]
  32. Georgii, E.; Jin, M.; Zhao, J.; Kanawati, B.; Schmitt-Kopplin, P.; Albert, A.; Winkler, J.B.; Schäffner, A.R. Relationships between drought, heat and air humidity responses revealed by transcriptome-metabolome co-analysis. BMC plant biology. 2017, 17, 1–23. [Google Scholar] [CrossRef] [PubMed]
  33. Cho, K.; Cho, K.-S.; Sohn, H.-B.; Ha, I.J.; Hong, S.-Y.; Lee, H.; Kim, Y.-M.; Nam, M.H. Network analysis of the metabolome and transcriptome reveals novel regulation of potato pigmentation. Journal of experimental botany. 2016, 67, 1519–1533. [Google Scholar] [CrossRef] [PubMed]
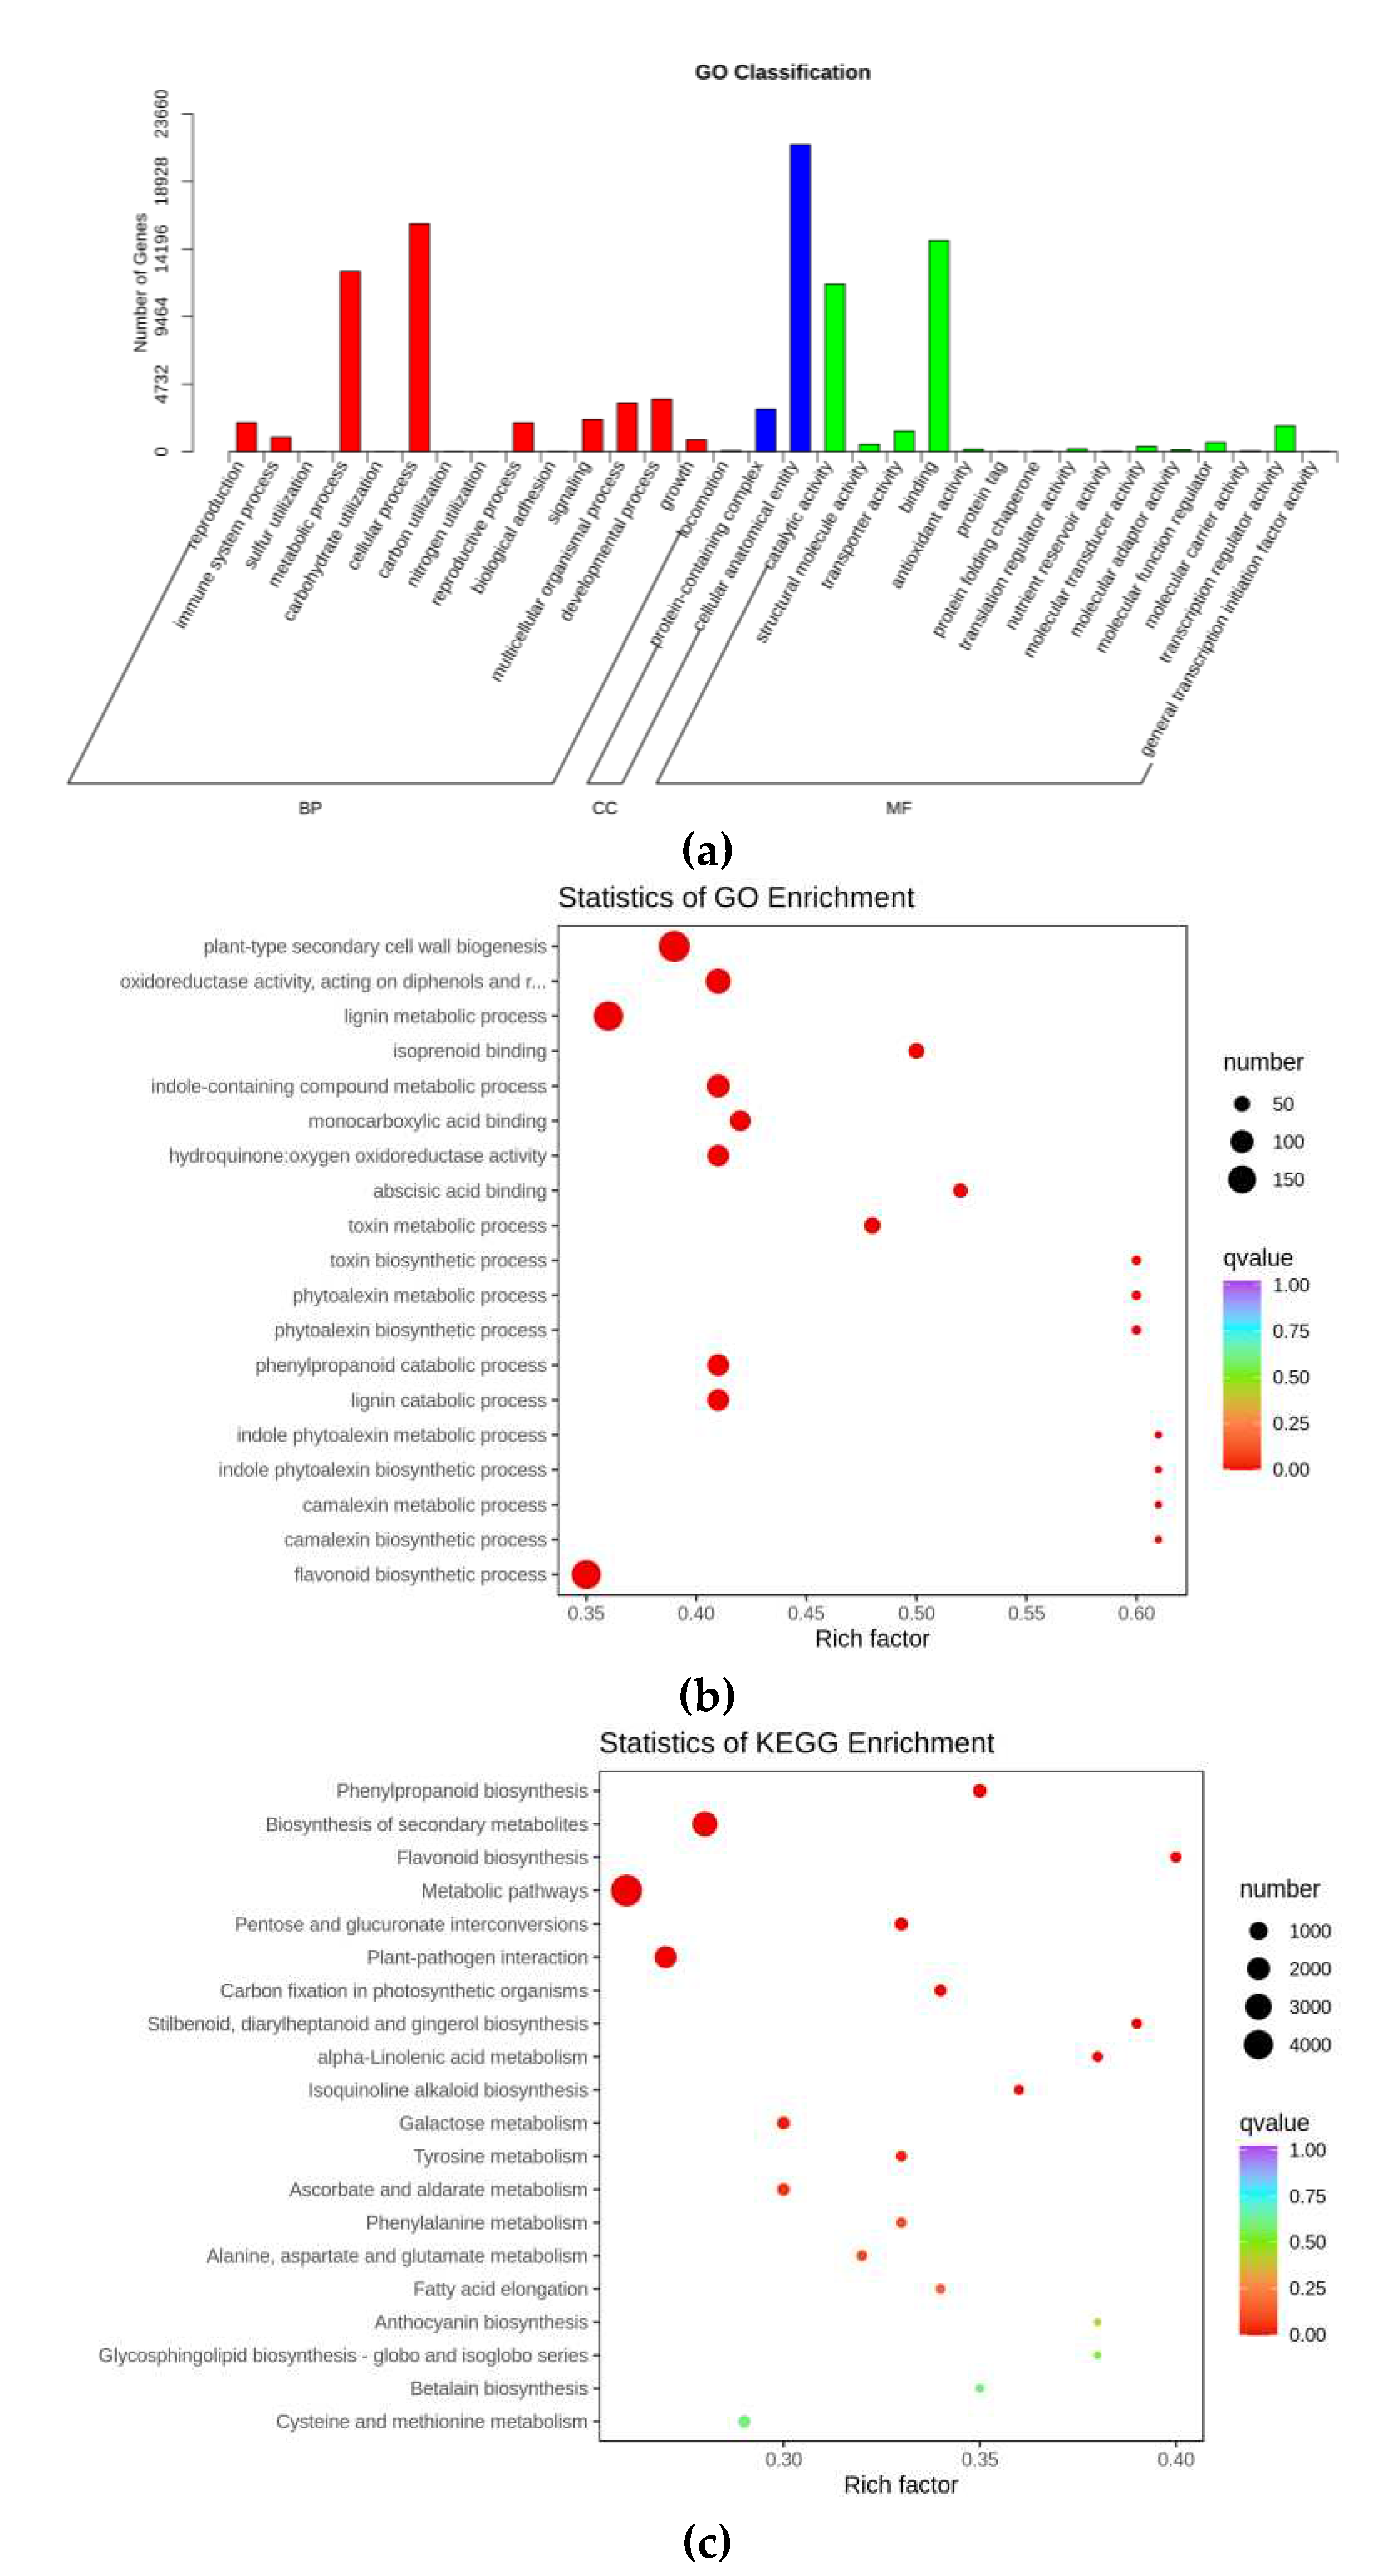
Figure 1. GO and KEGG analysis results. (a) GO classification histogram. BP, biological process; CC, cellular component; MF, molecular function. (b) GO enrichment plot diagram. (c) KEGG enrichment plot diagram.
Preprints 80841 g001
Figure 2. The dynamic distribution diagram of metabolite contents
Preprints 80841 g002
Figure 3. KEGG classification diagram of DEMs
Preprints 80841 g003
Figure 4. The flavonoid biosynthesis pathway map. The box represents gene, the dot represents metabolite, the red color represents upregulation of gene or metabolite, and the blue color represents both upregulation and downregulation of genes or metabolites.
Preprints 80841 g004
Figure 5. Figure 5. Interaction Networks between genes and metabolites. (a) KGML results. The square represents the gene, and the diamond represents the pathway. Red indicates gene upregulation, green indicates gene downregulation. (b) Correlation network diagram. The red circle represents genes, and the green square represents metabolites. Solid line indicates positive correlation, while dashed line indicates negative correlation.
Preprints 80841 g005aPreprints 80841 g005b
Table 1. Biochemical data of mint samples
Materials Chlorophyll (mg/g) Anthocyanin (mg/g) Total flavone (mg/g) Soluble sugar (mg/g) Soluble protein (mg/g)
Purple mint 0.215±0.008 a 8.493±0.481 a 8.531±0.758 a 60.861±10.027 a 4.126±0.306 a
Green mint 0.152±0.009 b 0.363±0.035 b 5.457±0.276 b 70.407±0.439 a 1.773±0.104 b
Different letters represent significant differences at P<0.05.
Table 2. List of top 10 metabolites upregulated or downregulated between groups
Index Compounds Class Log2FC Type
Lmzn001572 Scutellarein-7-O-glucuronosyl-(1->2)-glucuronide flavones 1.97E+01 up
Hmpp003270 Luteolin-4'-O-glucoside flavones 1.91E+01 up
MWSHY0031 Apigenin-7-O-glucuronide flavones 1.70E+01 up
MWSHY0050 Kaempferol-3-O-rutinoside flavonols 1.62E+01 up
pmb0606 Chrysoeriol-7-O-glucuronide flavones 1.50E+01 up
Lmfn003760 Quercetin-4'-O-glucuronide flavonols 1.38E+01 up
Lmmp003783 Quercetin-3-O-glucuronide flavonols 1.35E+01 up
pma0791 Naringenin-7-O-(6''-malonyl) glucoside flavanones 1.31E+01 up
MWSHY0186 Isosakuranetin (5,7-Dihydroxy-4'-methoxy flavanone) flavanones 1.19E+01 up
MWSHY0145 Eriodictyol (5,7,3',4'-Tetrahydroxy flavanone) flavanones 1.18E+01 up
Lmpn006208 8-Methoxykaempferol-7-O-rhamnoside flavonols -2.39E+00 down
pmb3042 Tricin-5-O-glucoside flavones -2.42E+00 down
mws2118 Phloretin-2'-O-glucoside chalcones -2.88E+00 down
HJAP120 Rhamnetin-3-O-rutinoside flavonols -2.98E+00 down
pmb3041 Tricin-7-O-saccharic acid flavones -3.00E+00 down
HJAP011 Chrysoeriol-8-C-glucoside flavones -3.11E+00 down
HJAP154 Galloylisorhamnetin flavonols -3.51E+00 down
Hmmp002121 Isorhamnetin-3-O-gallate flavonols -3.68E+00 down
Lmqp002170 Kaempferol-3-O-sophorotrioside flavonols -9.91E+00 down
Lmjp003655 6-C-Methyl Kaempferol-3-glucoside Flavones -1.38E+01 down
Table 3. Statistics of annotated metabolites in KEGG pathways.
Ko_ID Sig_compound All_compound
ko00941 7 12
ko01100 7 9
ko01100 4 5
ko00944 9 16
ko00942 2 2
ko00943 2 2
Table 4. The results of KEGG enrichment analysis
KEGG_map Description P-value_meta Count_meta P-value_gene Count_gene
ko01100 Metabolic pathways 0.3808 4 0.0000 4708
ko01110 Biosynthesis of secondary metabolites 0.2583 7 0.0000 2625
ko00941 Flavonoid biosynthesis 0.8027 7 0.0000 141
ko00942 Anthocyanin biosynthesis 0.3931 2 0.0031 36
ko00943 Isoflavonoid biosynthesis 0.3931 2 0.0140 64
ko00944 Flavone and flavonol biosynthesis 0.8931 9 0.2014 11
P-value_meta: the P-value of metabolomics significance test; Count_meta: the number of DEMs annotated to this pathway; P-value_ gene: the P-value of transcriptome significance test; Count_gene: the number of DEGs annotated to this pathway.
Table 5. The most important genes and metabolites screened using O2PLS model
Genes Metabolites Description_meta
Cluster-51396.2 Lmmp003783 Quercetin-3-O-glucuronide
Cluster-7658.8 Lmmn004625 Dihydrokaempferol-7-O-glucoside
Cluster-16235.0 HJN086 Eriodictyol-3'-O-glucoside
Cluster-52100.1 pmb2976 Chrysoeriol-8-C-arabinoside-7-O-sophoroside
Cluster-25073.0 Hmpp003270 Luteolin-4'-O-glucoside
Cluster-42022.2 MWSHY0031 Apigenin-7-O-glucuronide
Cluster-53874.0 Lmzn001572 Scutellarein-7-O-glucuronosyl-(1->2)-glucuronide
Cluster-1116.5 pma0791 Naringenin-7-O-(6''-malonyl) glucoside
Cluster-1676.2 MWSHY0050 Kaempferol-3-O-rutinoside (Nicotiflorin)
Disclaimer/Publisher’s Note: The statements, opinions and data contained in all publications are solely those of the individual author(s) and contributor(s) and not of MDPI and/or the editor(s). MDPI and/or the editor(s) disclaim responsibility for any injury to people or property resulting from any ideas, methods, instructions or products referred to in the content.
Copyright: This open access article is published under a Creative Commons CC BY 4.0 license, which permit the free download, distribution, and reuse, provided that the author and preprint are cited in any reuse.
Prerpints.org logo

Preprints.org is a free preprint server supported by MDPI in Basel, Switzerland.

Subscribe

© 2024 MDPI (Basel, Switzerland) unless otherwise stated