Preprint
Article

Evolving a Model for Cochlear Implant Outcome

Altmetrics

Downloads

86

Views

16

Comments

0

A peer-reviewed article of this preprint also exists.

Submitted:

27 July 2023

Posted:

31 July 2023

You are already at the latest version

Alerts
Abstract
Background: Cochlear implantation is an efficient treatment for postlingually deafened adults who do not benefit sufficiently from acoustic amplification. Implantation is indicated when it can be foreseen that speech recognition with a cochlear implant (CI) is superior to that with a hearing aid. Especially for subjects with residual speech recognition it is desirable to predict CI outcome on the basis of preoperative audiological tests. Purpose: The purpose of the study was to extend and to refine a previously developed model for CI outcome prediction for subjects with preoperative word recognition to include subjects with no residual hearing by incorporat-ing additional results of routine examinations. Results: By introducing the duration of unaided hearing loss (DuHL) the median absolute error (MAE) of the prediction was reduced. While for subjects with preoperative speech recognition the model modification did not change the MAE, for subjects with no residual speech recognition before surgery, the MAE decreased from 23.7% with the previous model to 17.2% with the extended model. Conclusions: Prediction of word recognition with CI is possible within clinically relevant limits. Outcome prediction is particu-larly important for preoperative counselling and in CI aftercare, to support systematic monitor-ing of CI fitting.
Keywords: 
Subject: Medicine and Pharmacology  -   Otolaryngology

1. Introduction

Cochlear implantation is an efficient treatment for postlingually deafened adults with severe and profound hearing loss. In particular, a cochlear implant (CI) is indicated when the benefit from acoustic amplification is insufficient [1,2,3,4,5,6,7]. For mild and moderate hearing loss, a hearing aid (HA) is the option of choice, while for higher degrees of hearing loss it must be carefully considered which approach is better. Especially in the transition range, i.e. hearing thresholds better than 80 dBHL (dB hearing loss), the variability of the aided speech recognition is substantial [8,9,10,11,12,13,14,15,16,17]. Nevertheless, in individual cases the speech recognition with HA can be assessed preoperatively. However, the large variability in CI outcome as assessed by word recognition scores with CI [18,19,20,21,22] represents a major obstacle: For the patient population with benefit from HAs the individual prediction is of major importance, as the patient and the professional have to balance the residual aided word recognition with the HA, the expected word recognition with CI, the expected improvement in quality of life, and the impact of CI surgery. Some studies have also included subjects with lesser hearing loss (e.g. <80 dBHL) who were considered likely to benefit from cochlear implantation [5,6,17,23,24,25,26,27,28,29]. A retrospective analysis [22] of 312 postlingually deafened adult CI recipients yielded the preoperative maximum word recognition score (WRSmax) as a predictor for the minimum WRS with CI at conversation level, WRS65(CI). The importance of this preoperative measure was confirmed by two studies including respectively 128 [28] and 664 [17] cases. In an earlier study we addressed explicitly the prediction of WRS65(CI) in a population with hearing losses of less than 80 dBHL only [6]. This retrospective analysis led to a generalised linear model (GLM) that provides an estimated prediction of WRS65(CI) six months after implantation on the basis of three preoperatively known factors: the WRSmax, the patient's age at implantation, and the aided WRS at conversation level, WRS65(HA), according to equation 1.
W R S 65 C I   % = 100 1 + e β 0 + β 1 · W R S m a x + β 2 · A g e + β 3 · W R S 65 H A
with β0 = 0.84 ± 0.18, β1 = 0.012 ± 0.0015, β2 = –0.0094 ± 0.0025 year-1 and β3 = 0.0059 ± 0.0026; all WRS expressed in %.
Figure 1 illustrates the characteristics of this GLM. The WRSmax accounts for up to 27 percentage points (pp) in WRS65(CI) differences. The WRS65(HA) influences the prediction by up to 9 pp, while age at implantation is associated with a deterioration of up to 17 pp. The GLM resulted from an analysis based on a population of 128 postlingually deafened adult CI recipients, all with a preoperative hearing loss equal to or less than 80 dBHL as measured by the hearing loss at 0.5, 1, 2 and 4 kHz (four-frequency pure-tone average, 4FPTA).
The prediction error of the model as described by the median absolute error (MAE) was found to be 13.5 pp [6], with one-quarter of the study population scoring 12 pp or more below prediction. A subsequent prospective study [29] confirmed the applicability of the model for CI recipients within certain boundary conditions: for a patient population with a preoperative WRSmax greater than zero, a prediction error of 11.5 pp was found. Only 6% (5/85) of the recipients missed the predicted score by more than 20 pp within one year after implantation. As shown in Figure 1, the output range is limited to scores between 49% and 90%. This is due to the fact that patients with significant residual hearing are most likely to perform in this range [6,17,22,28,29]. This is not the case for the application of the model in a population with preoperative WRSmax = 0%; that, as expected, resulted in a higher prediction error of 23.2 pp. If both WRSmax and WRS65(HA) are zero, the prediction from equation (1) is based solely on the patient's age, represented by β2, and the population mean outcome, represented by β0.
While in some previous analyses duration of deafness (DoD) played a significant role [19], DoD was not included in the model (Eq. 1). This is due to the fact that only subjects with hearing threshold better than 80 dBHL were included. Holden et al. [20] showed that the duration of hearing impairment (DHI) is a factor that contributes to speech recognition with CI. Additionally, DHI is applicable for subjects with residual hearing, regardless of the degree of hearing loss.
The goal of this study was the extension and evolution of the model [6] in order to improve the prediction, especially for the patient population with a preoperative WRSmax of zero. The design requirements for the model were defined as follows: Since equation 1 has proved its applicability [29,30] the coefficients β0–3 remained fixed. Only preoperative measures were to be included in the model. Additionally, these measures were to be subsets of clinical routine measurements within the CI candidate assessment according to the German CI Guidelines [3] and the German white book CI provision [4].

2. Materials and Methods

2.1. Patients

In this study we evaluated data from all postlingually deafened adult patients who were provided with a Nucleus CI (Cochlear Ltd., Sydney, Australia) in the period April 2020 to December 2022 at the Ear, Nose and Throat Clinic within the department of Head and Neck Surgery at the University Hospital of Erlangen. All study participants were native German speakers. The CI indication was in accordance with the current German CI guidelines [3]. All participants suffered from sensorineural or mixed hearing loss in the ear to receive the implant. They took part in our rehabilitation programme for a minimum of six months. Exclusion criterion was cognitive impairment that would have influenced the performance of the speech audiometry. Reimplant cases were excluded. Postoperative WRS65(CI) for a period of at least six months after surgery and CI fitting were available for 165 patients. The patient population consisted of 90 men and 75 women. Their mean age at the time of surgery was 66 ± 14 years. The hearing loss for air conduction was determined as the mean value over the four octave frequencies 0.5, 1, 2 and 4 kHz (4FPTA). For hearing thresholds beyond the maximum possible presentation levels of the audiometers, a value of 130 dBHL was imputed. The resulting mean preoperative hearing loss was 94 ± 21 dBHL. The 165 CI recipients used either the behind-the-ear processor CP1000 (or later) or the off-the-ear processor CP950 (or later). CI-aided listeners were divided in two groups according to their preoperative WRSmax. Group 1 (n = 109) comprised individuals with WRSmax > 0%, while group 2 (n = 56) comprised those with WRSmax = 0%. While there were no significant differences between these groups in age or in duration of hearing impairment, audiometric data differed owing to the group definitions. Demographic details are summarised in Table 1. Figure 2 complements the characteristics in Table 1 representing the individual data for age, duration of hearing loss and duration of unaided hearing loss. Age was not correlated with either duration of hearing impairment (DHI) or duration of unaided hearing impairment (DuHI) while DHI and DuHI were strongly correlated (RSpearman = 0.68 with p = 5∙10–24).

2.2. Speech audiometry

Speech recognition was assessed by the Freiburg monosyllable and Freiburg two-digit-number tests. The monosyllable test comprises 20 groups of 20 monosyllabic German nouns each; the number test comprises multisyllabic two-digit numbers in 10 groups of 10 numbers each (e.g., 98 was read as “achtundneunzig”) [31,32]. Usually, the numbers are recognised much better than the monosyllabic words. Recognition rates correspond to low-frequency hearing thresholds [33]. The monosyllable test was used to determine the maximum word recognition score (WRSmax), i.e., the word recognition score at the greatest just tolerable sound pressure level or in case of 100% at lower levels. Additionally, the WRS65(HA) was defined as the word recognition score with hearing aid measured at 65 dBSPL. The hearing aids were checked technically in advance. In particular, in situ measurements were taken to ensure that the settings yielded the necessary gains [16].
For the Freiburg two-digit numbers, the sound levels were adjusted individually in the range from 30 to 120 dBSPL in 5 dB steps in order to find the sound pressure level for 50% recognition (SRTnum). For SRTs above the maximum possible presentation levels of the audiometers, a value of 120 dBHL was imputed. All audiometric measurements were performed monaurally with the ear that was intended for the implant, while the contralateral ear was masked appropriately when necessary.
The 4FPTA was calculated from the pure-tone audiometry data as the mean value of the hearing threshold at 0.5, 1, 2 and 4 kHz.
For the postoperative measurements, the word recognition score with CI system in free field at 65 dBSPL, WRS65(CI) was assessed. The free-field measurements were conducted in a soundproof cabin measuring 6×6 m. The loudspeaker was placed 1.5 m in front of the patient (0° azimuth). The contralateral ear was masked appropriately with broadband noise introduced through headphones, if necessary.

2.3. Data analysis

The software Matlab (MathWorks, Natick, USA-MA) version R2019b was used for all calculations and figures. A GLM was applied to the data to predict the WRS65(CI); this model represented a further development of our earlier model (see Introduction) and is described below. Significant differences in word recognition scores were determined according to the characteristics of the Freiburg monosyllable test [34].

3. Results

3.1. Preoperative measurements

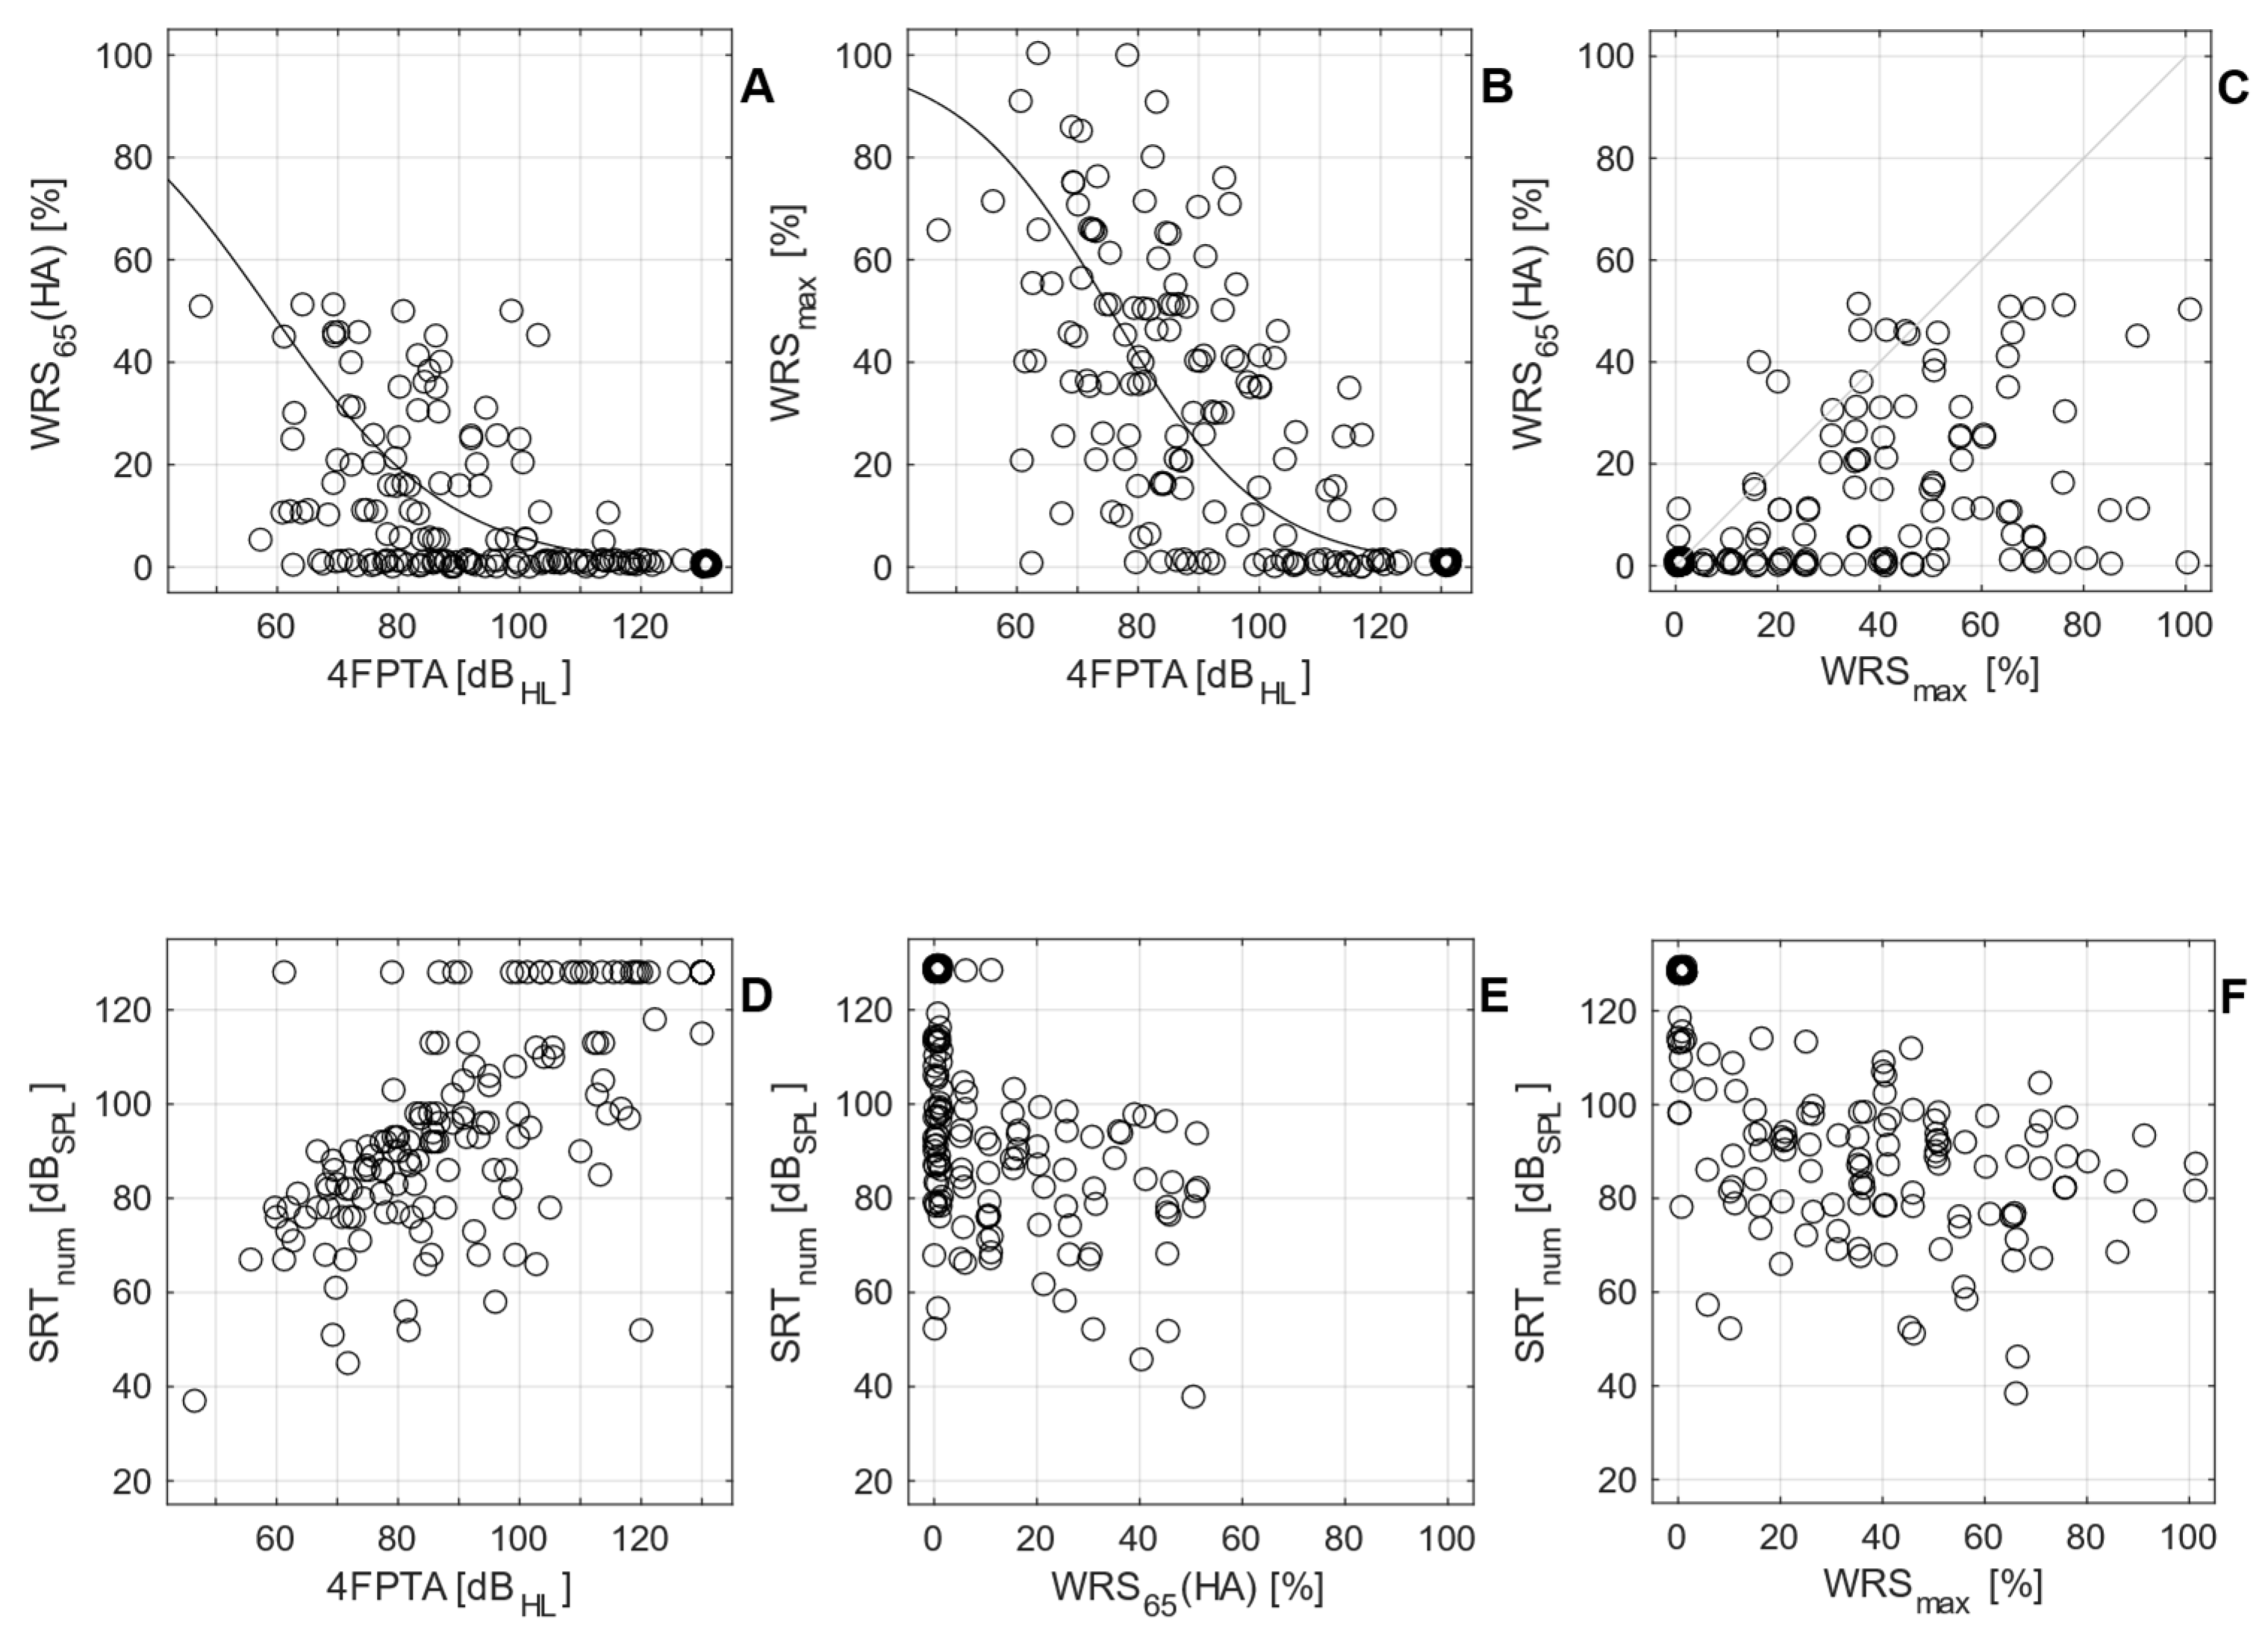
Figure 3A–C show the interrelationships between word recognition scores, WRS65(HA) and WRSmax, and the average pure-tone hearing loss, 4FPTA. Figure 3D–F show how speech recognition threshold for numbers in quiet (SRTnum) is related to the 4FPTA and the two WRS. The curves in Figure 3A/B represent the WRS as a function of 4FPTA in a population of HA users from previous studies [8,14]. In all cases the preoperative WRS65(HA) was within the current German CI guidelines [3] which recommend a cut-off at 60% for preoperative WRS65(HA). Figure 3D–F illustrate the relationship between the audiometric measures WRS65(HA), WRSmax, 4FPTA and the SRTnum. Even for cases where WRS65(HA) and WRSmax are zero, the SRTnum can be still measured: there were 95 of 165 cases with WRS65(HA) = 0%, of which 53 (56%) had a measurable SRTnum. Among the 56 cases in group 2 (preoperative WRSmax = 0%), a measurable SRTnum was still found in 12 cases (21%). All speech recognition measures were highly correlated: WRSmax with SRTnum (RSpearman = –0.72 with p = 6∙10–28), WRS65(HA) with SRTnum (RSpearman = –0.58 with p = 2∙10–16) and WRSmax with WRS65(HA) (RSpearman = –0.62 with p = 1∙10–18).

3.2. Postoperative measurements

Figure 4 illustrates the relationship between the two preoperative WRS and the WRS65(CI) six months after surgery. The two groups with WRSmax above zero (group 1, black) or equal to zero (group 2, blue) show WRS65(CI) ranging from 0 to 100%. Both groups have their peak in Figure 4C at a WRS65(CI) of 70% and the median for WRS65(CI) is 70% for both groups. However, the variabilities differed considerably: the standard deviation of WRS65(CI) was 19 pp for group 1 and 30 pp for group 2. Postoperative results are summarised in Table 2.
With respect to the minimum predictor [22] for WRS65(CI) this study yielded the following results for group 1: Six months after surgery, 6 cases (5.5%) did not reach the WRSmax, while in 64 cases (58.7%) the WRSmax was significantly [34] exceeded. The remaining 39 (35.8%) cases reached the WRSmax within the confidence intervals yielded by the Freiburg test [34].

3.3. Model expansion

GLMs were applied to the complete data set. As additional input variables to the previous model [6], see equation 1, the duration of hearing impairment, DHI, and the duration of unaided hearing impairment, DuHI (a subperiod of DHI) and SRTnum were considered. The strong correlations between SRTnum and WRSmax, and between SRTnum and WRS65(HA) (see section 3.1) indicate that the linear equation system is over-determined.
All regressions with SRTnum included resulted in a GLM with a corresponding positive βi. Such an equation would result in a poorer prediction for WRS65(CI) with better preoperative SRTnum. The ablation analysis [36] did not yield an improvement with respect to the overall MAE with SRTnum included (12 pp) compared with the final GLM (12 pp). Consequently, the regression analysis was continued with DHI and DuHI only. The ablation analysis yielded the best results applying the two predictors with an interaction term [35]: The overall MAE was 12.3 pp, while for group 1 it was 11.1 pp and for group 2 it was 17.0 pp. Table 3 summarises the results of the regression analysis.
On the basis of Table 3 and with removal of the two non-significant contributors DHI and the interaction term DHI:DuHI, equation 1 expands to
W R S 65 C I   % = 100 1 + e β 0 + β 1 · W R S m a x + β 2 · A g e + β 3 · W R S 65 H A + β 0 ' + β 4 · D u H I
with β 0 = 0.84 ± 0.18, β 1 = 0.012 ± 0.0015, β 2   = –0.0094 ± 0.0025 year-1, β 3 = 0.0059 ± 0.0026, β 0 ' = 0.35 ± 0.04 and β 4 = –0.0171 ± 0.0056 year-1 (all WRS expressed in %), as shown in Table 3.
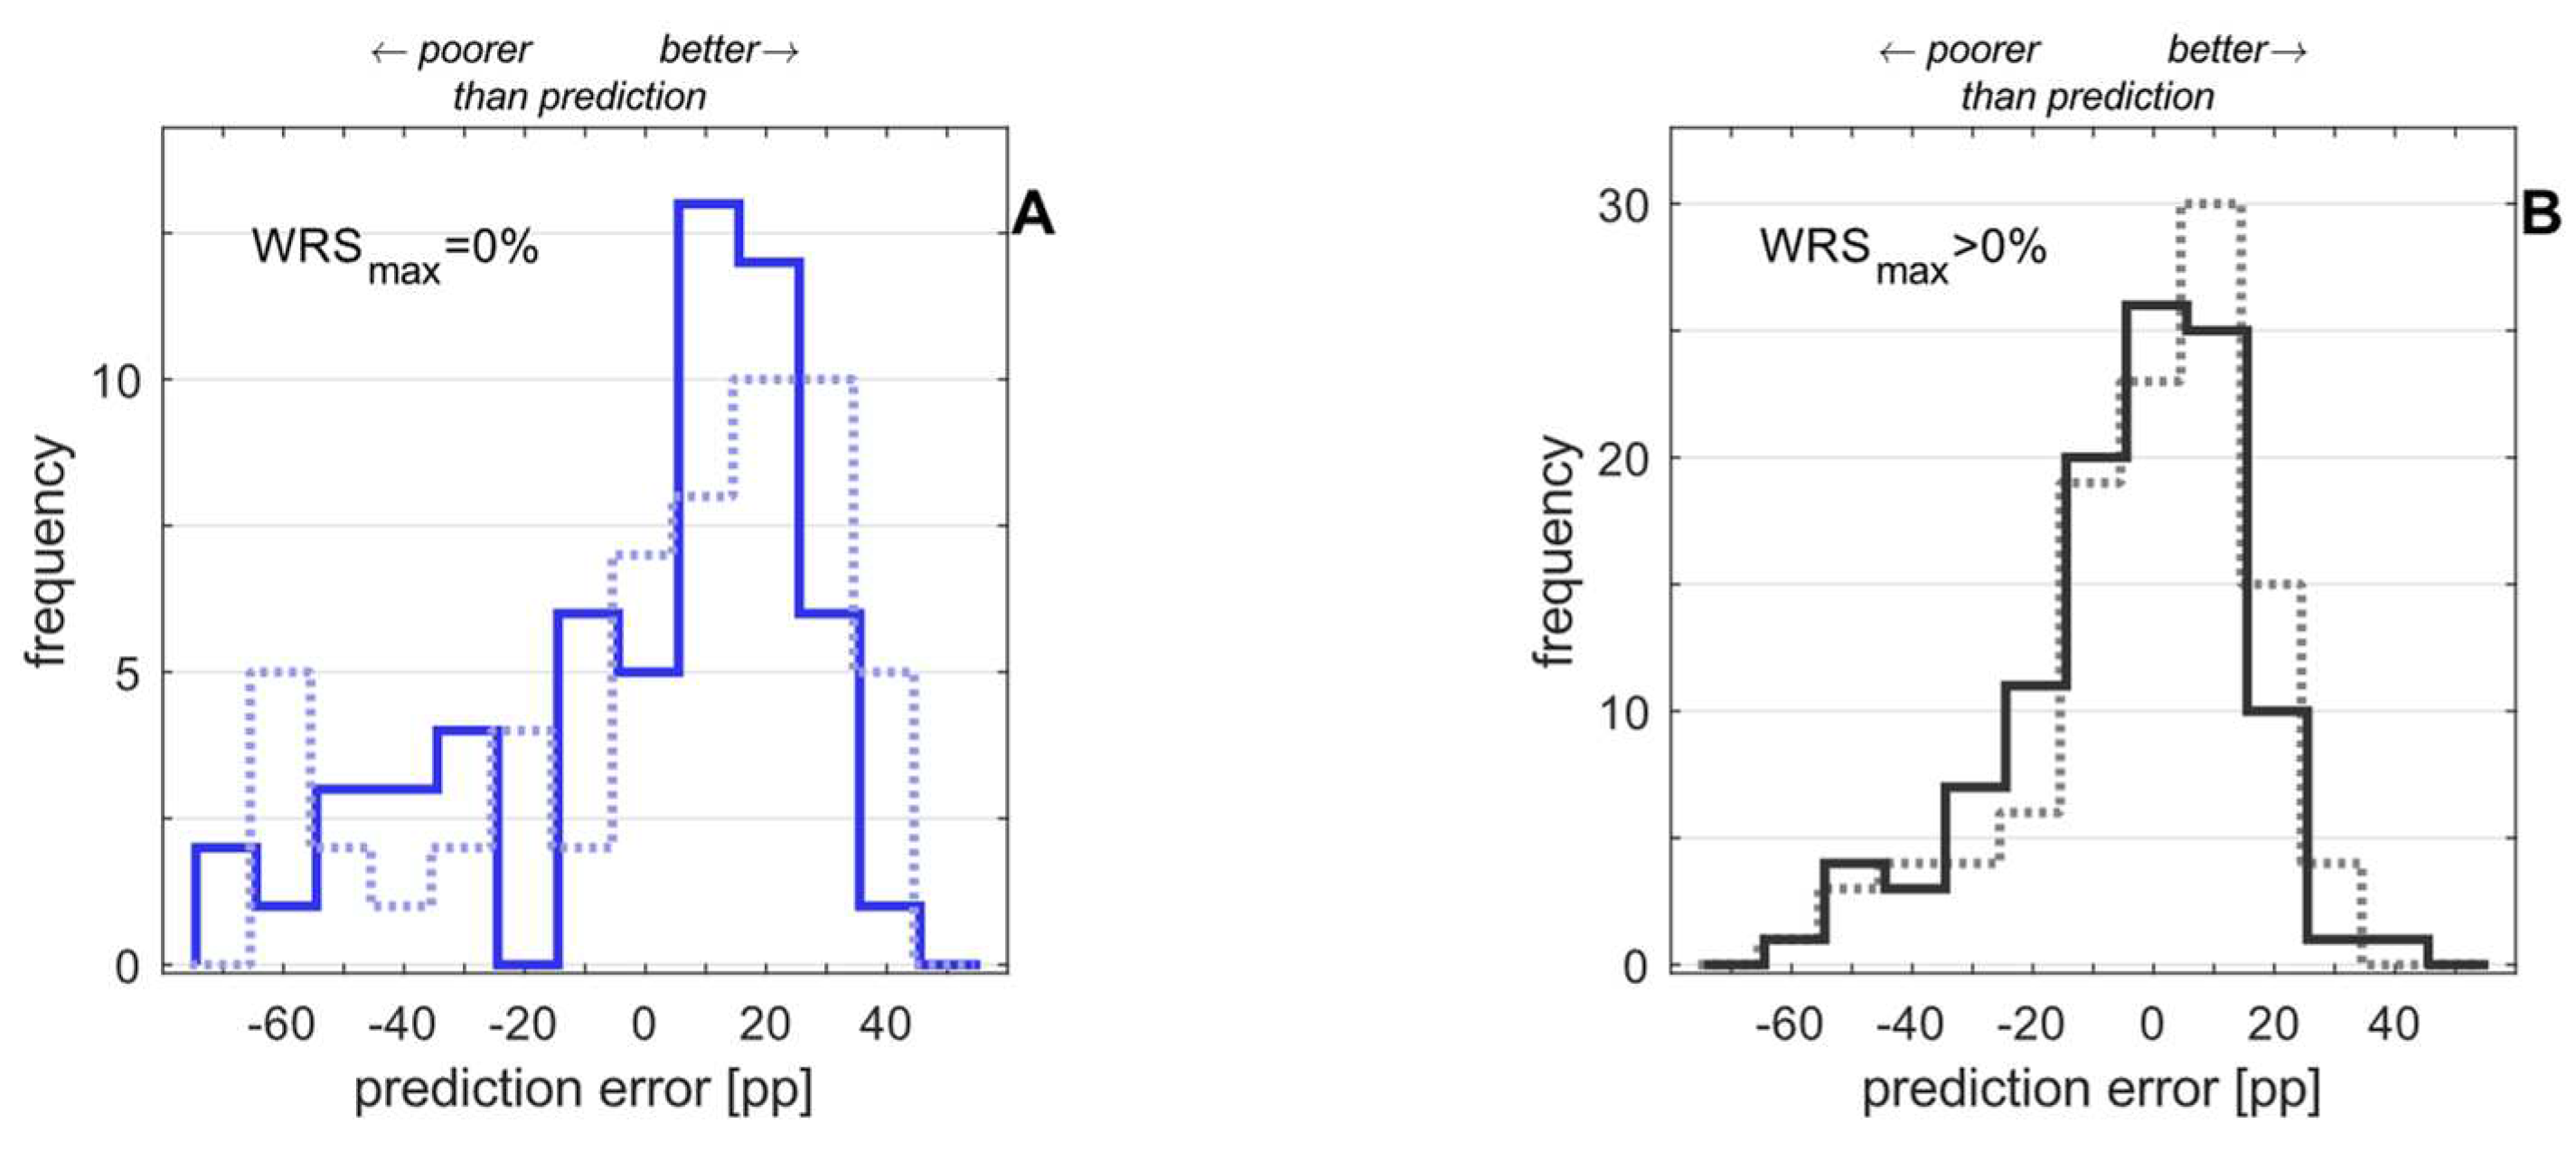
The application of equation 2 to the study population yields prediction errors as shown in Figure 5, separately for the two groups. A comparison with the previous model [6] is displayed as well.
In cases where DuHI is not available in the clinical data set, a regression analysis with DHI would be helpful. This was therefore performed. Table 4 summarises the results of this analysis. On the basis of Table 4 equation 1 would expand to
W R S 65 C I   % = 100 1 + e β 0 + β 1 · W R S m a x + β 2 · A g e + β 3 · W R S 65 H A + β 0 ' + β 4 · D H I
with β 0 = 0.84 ± 0.18, β 1 = 0.012 ± 0.0015, β 2   = –0.0094 ± 0.0025 year-1, β 3 = 0.0059 ± 0.0026, β 0 ' = 0.41 ± 0.04 and β 4 = –0.0125 ± 0.0013 year-1 (all WRS expressed in %), as shown in Table 4.
The resulting MAEs would be 11.3 pp for group 1 and 18.8 pp for group 2, with an overall MAE of 14.0 pp.

4. Discussion

The vast majority (89%) of the patients included in this study showed significantly improved speech recognition without any patient experiencing a lower WRS six months after cochlear implantation.
Both populations (patients with preoperative WRSmax larger than zero, group 1, and patients with preoperative WRSmax equal to zero, group 2) showed a median WRS65(CI) of 70%. However, as illustrated by Figure 4, the variability of the outcome was greater for group 2, and the mean WRS65(CI) was smaller: 59% in group 2, compared with 68% in group 1.
The extension of the prediction model for CI outcome in CI recipients with preoperative WRSmax = 0 is feasible. It was shown that for group 2 an improved prediction is possible without impairment of the prediction for group 1. Most remarkably, the inclusion of just one additional input variable (the duration of unaided hearing impairment, DuHI) in the previous prediction model for the WRS65(CI) [6] resulted in a decreased prediction error for group 2: The new GLM (equation 2) resulted in a decreased MAE of 17.0, compared with the MAE of the previous model (equation 1) of 23.7 pp. The prediction error for group 1 remained almost unchanged. The new model indicates a slightly decreased MAE of 11.1 pp, compared with 11.4 obtained from the previous model [6].
The durations of hearing impairment and unaided hearing impairment, DHI and DuHI, were found to be strongly correlated (RSpearman = 0.7). Hence, they may provide similar information on the CI outcome. The ablation analysis showed that the MAE was not greatly increased when DHI or DuHI was omitted. We decided to retain the latter, because DHI was found as not significant (p=0.16) in the presence of DuHI. Additionally, the MAE was smaller for both groups when DuHI is used instead of DHI (equation 2). However, the DHI offers some advantages. The DHI is just defined by one time point, the time of onset of hearing loss, while determination of DuHI requires knowledge of two time points – of HA provision and of onset of hearing loss. Yet both factors depend on the patient's ability to remember or reconstruct events which may well have occurred decades earlier. In summary, the model according to equation 3 inherits larger MAE. However, equation 3 and therefore the DHI may be used in cases where DuHI is not available.
In this study the DHI replaces the previously used duration of deafness, DoD, for several reasons. Regarding DoD, an obsolete classification [37] refers to a cut-off of 81 dBHL for the grade “profound impairment including deafness”. A more recent classification [38] defines “Complete or total hearing loss/deafness” via a hearing threshold in the better ear of 95 dBHL or greater. As already pointed out by those authors [38] “the classification and grades are for epidemiological use”. For prediction models and clinical process management, to our knowledge, there is a lack of applicable, defined criteria for cut-off relating to the duration of deafness and hearing impairment. Additionally, in the presence of a decentralised hearing health care system (e. g. in Germany) the chance of obtaining a precise assessment is rather low. In our population of consecutive Nucleus CI provisions in adults within a period of 2.5 years, only 42% exhibited a 4FPTA of ≥95 dBHL in the ear to receive the implant, so that a broader application of DoD in a regression model is not relevant. On the other hand, in this subpopulation (numbering 69 patients), about one-third had a measurable ipsilateral maximum recognition score for Freiburg words and slightly under one-half had a measurable speech recognition threshold for Freiburg numbers in quiet. This supports the preference for functional, speech-related variables instead of DoD.
There was a slight decrease in MAE for group 1 only (preoperative WRSmax > 0). This can be interpreted as giving strong support to the use of the WRSmax for predictive purposes [6,17,22,28], as it accumulates the detrimental effects of long DHI (or DuHI). The situation is different in group 2 (preoperative WRSmax = 0) where such functional assessment with the established test WRSmax and WRS65(HA) is not possible. Here the additional information of DuHI or DHI considerably reduces the prediction error.
According to the design requirements, the regression analysis using the GLM was conducted across all data by using all data in a first attempt. The effects of these three variables upon the prediction error are different. It was found that the SRTnum did not decrease the MAE. Hence, SRTnum was not taken into account any longer, which however does not necessarily mean that this variable is unimportant. Together with the strong correlation with WRSmax and WRS65(HA) this indicates an over-determined equation system. Nevertheless, especially for cases with no preoperative monosyllable speech perception it might be a useful addition. In our population only about one-quarter of group 2 had a measurable SRTnum. Perhaps an additional split beyond groups 1 and 2 will improve the prediction with the help of SRTnum in a clearly and more narrowly defined population. On the other hand, other model approaches – such as random forest regression – would induce such a split per se. However, more data would be needed for such approach. In a recent study, Rieck et al. [17] used the Freiburg numbers and found a predictive value in a population of nearly 500 recipients. Two characteristics of their study population would support the assertion of a positive impact of SRTnum on prediction error in a population with low preoperative speech perception in general. The mean values obtained in their study represent the characteristics of an established patient population with a preoperative mean WRS65(HA) of 4.2% compared with 9.7% and a WRSmax of 11.8 compared with 27.6% in this population. Rieck et al. [17] included clinical data with implantations dating from 2002 to 2019, while the inclusion period of the present study was from 2020 to 2022. Consequently, this relationship should be reconsidered in future studies that include more CI candidates who are in group 2 but who have measurable SRTnum.

5. Conclusions

Cochlear implantation can be considered if speech recognition with hearing aids is insufficient. This applies also for patients with pure-tone hearing loss in the range of 60 dBHL. The preoperative prediction of expected word recognition after CI provision is possible within clinically relevant limits.
Less variable results for postoperative word recognition were observed in patients with preoperative maximum word recognition greater than zero (group 1) compared with patients without preoperative maximum word recognition (group 2).
The inclusion of additional model input variables – ‘duration of hearing impairment’ or ‘duration of unaided hearing impairment’ – to the variables ‘word recognition scores‘ and ‘age at implantation‘ already used in the model resulted in decreased prediction errors for group 2. However, the prediction error in group 2 was still larger than in group 1. In group 1 the inclusion of additional input variables did not result in a lower prediction error.
We believe that this model will be applicable in preoperative counselling (with a higher accuracy in group 1 than in group 2) and will also be useful in CI aftercare, to support the systematic monitoring of CI fitting that is conducted to optimise postoperative adjustment.

Author Contributions

Conceptualization, U.H. and J.H.; methodology, U.H.; software, T.H. and UH; validation, A.H. and J.H.; writing—original draft preparation, U.H. and T.H.; writing—review and editing, U.H and A.H.; visualization, T.H.; supervision, J.H.; All authors have read and agreed to the published version of the manuscript.

Funding

This research was partially funded by Cochlear Research & Development Ltd.

Institutional Review Board Statement

The study was conducted in accordance with the Declaration of Helsinki, and approved by the Institutional Review Board of Erlangen University No. 60_20B 06.03.2020.

Informed Consent Statement

Informed consent was obtained from all subjects involved in the study.

Data Availability Statement

Research data are available on request from the first author.

Conflicts of Interest

T.H. is working for a cochlear implant company. All other authors declare no conflict of interest. The funders had no role in the design of the study, in the data collection or in the decision to publish the results.

References

  1. National Institute for Health and Care Excellence. Cochlear implants for children and adults with severe to profound deafness. 2019. Available online: https://www.nice.org.uk/guidance/ta566 (accessed on 1 June 2023).
  2. Buchman, C. A.; Gifford, R. H.; Haynes, D. S.; Lenarz, T.; O'Donoghue, G.; Adunka, O.; Biever, A.; Briggs, R. J.; Carlson, M. L.; Dai, P.; Driscoll, C. L.; Francis, H. W.; Gantz, B. J.; Gurgel, R. K.; Hansen, M. R.; Holcomb, M.; Karltorp, E.; Kirtane, M.; Larky, J.; Mylanus, E. A. M.; Roland, J. T., Jr.; Saeed, S. R.; Skarzynski, H.; Skarzynski, P. H.; Syms, M.; Teagle, H.; Van de Heyning, P. H.; Vincent, C.; Wu, H.; Yamasoba, T.; Zwolan, T. Unilateral Cochlear Implants for Severe, Profound, or Moderate Sloping to Profound Bilateral Sensorineural Hearing Loss: A Systematic Review and Consensus Statements. JAMA Otolaryngol Head Neck Surg. 2020, 146, 942–953. [Google Scholar] [CrossRef]
  3. AWMF. Leitlinien: Cochlea-Implantat Versorgung und zentral-auditorische Implantate. 2020. Available online: https://www.awmf.org/uploads/tx_szleitlinien/017-071l_S2k_Cochlea-Implantat-Versorgung-zentral-auditorische-Implantate_2020-12.pdf (accessed on 1 June 2023).
  4. DGHNO-KHC. Weißbuch Cochlea-Implantat(CI)-Versorgung. 2nd Edition. 2021. Available online: https://cdn.hno.org/media/2021/ci-weissbuch-20-inkl-anlagen-datenblocke-und-zeitpunkte-datenerhebung-mit-logo-05-05-21.pdf (accessed on 1 June 2023).
  5. van der Straaten, T. F. K.; Briaire, J. J.; Vickers, D.; Boermans, P.; Frijns, J. H. M. Selection Criteria for Cochlear Implantation in the United Kingdom and Flanders: Toward a Less Restrictive Standard. Ear Hear. 1097. [Google Scholar]
  6. Hoppe, U.; Hocke, T.; Hast, A.; Iro, H. Cochlear Implantation in Candidates With Moderate-to-Severe Hearing Loss and Poor Speech Perception. Laryngoscope. 2021, 131, E940–e945. [Google Scholar] [CrossRef] [PubMed]
  7. Turton, L.; Souza, P.; Thibodeau, L.; Hickson, L.; Gifford, R.; Bird, J.; Stropahl, M.; Gailey, L.; Fulton, B.; Scarinci, N.; Ekberg, K.; Timmer, B. Guidelines for Best Practice in the Audiological Management of Adults with Severe and Profound Hearing Loss. Semin Hear. 2020, 41, 141–246. [Google Scholar] [CrossRef] [PubMed]
  8. Hoppe, U.; Hast, A.; Hocke, T. Audiometry-Based Screening Procedure for Cochlear Implant Candidacy. Otol Neurotol. 2015, 36, 1001–1005. [Google Scholar] [CrossRef] [PubMed]
  9. McRackan, T. R.; Fabie, J. E.; Burton, J. A.; Munawar, S.; Holcomb, M. A.; Dubno, J. R. Earphone and Aided Word Recognition Differences in Cochlear Implant Candidates. Otol Neurotol. 2018, 39, e543–e549. [Google Scholar] [CrossRef]
  10. Kronlachner, M.; Baumann, U.; Stover, T.; Weissgerber, T. [Investigation of the quality of hearing aid provision in seniors considering cognitive functions]. Laryngorhinootologie. 2018, 97, 852–859. [Google Scholar] [CrossRef]
  11. Franks, Z. G.; Jacob, A. The speech perception gap in cochlear implant patients. Cochlear Implants Int. 2019, 20, 176–181. [Google Scholar] [CrossRef]
  12. Lupo, J. E.; Biever, A.; Kelsall, D. C. Comprehensive hearing aid assessment in adults with bilateral severe-profound sensorineural hearing loss who present for Cochlear implant evaluation. Am J Otolaryngol. 2020, 41, 102300. [Google Scholar] [CrossRef]
  13. Weissgerber, T.; Muller, C.; Stover, T.; Baumann, U. Speech perception and cognitive abilities in seniors without subjective hearing loss. Laryngorhinootologie. 2019, 98, 489–496. [Google Scholar] [PubMed]
  14. Dörfler, C.; Hocke, T.; Hast, A.; Hoppe, U. Speech recognition with hearing aids for 10 standard audiograms : English version. HNO. 2020, 68, 93. [Google Scholar] [CrossRef]
  15. Digeser, F. M.; Engler, M.; Hoppe, U. Comparison of bimodal benefit for the use of DSL v5.0 and NAL-NL2 in cochlear implant listeners. Int J Audiol. 2020, 59, 383–391. [Google Scholar] [CrossRef]
  16. Engler, M.; Digeser, F.; Hoppe, U. [Effectiveness of hearing aid provision for severe hearing loss]. HNO. 2022, 70, 520–532. [Google Scholar] [CrossRef]
  17. Rieck, J. H.; Beyer, A.; Mewes, A.; Caliebe, A.; Hey, M. Extended Preoperative Audiometry for Outcome Prediction and Risk Analysis in Patients Receiving Cochlear Implants. J Clin Med. 2023, 12. [Google Scholar] [CrossRef]
  18. Krüger, B.; Joseph, G.; Rost, U.; Strauss-Schier, A.; Lenarz, T.; Büchner, A. Performance groups in adult cochlear implant users: Speech perception results from 1984 until today. Otol Neurotol. 2008, 29, 509–512. [Google Scholar] [CrossRef]
  19. Blamey, P. J.; Artieres, F.; Baskent, D.; Bergeron, F.; Beynon, A.; Burke, E.; Dillier, N.; Dowell, R.; Fraysse, B.; Gallégo, S.; Govaerts, P. J.; Green, K.; Huber, A. M.; Kleine-Punte, A.; Maat, B. Factors affecting auditory performance of postlinguistically deaf adults using cochlear implants: an update with 2251 patients. Audiol Neuro-Otol. 2013, 18, 36–47. [Google Scholar] [CrossRef]
  20. Holden, L. K.; Finley, C. C.; Firszt, J. B.; Holden, T. A.; Brenner, C.; Potts, L. G.; Gotter, B. D.; Vanderhoof, S. S.; Mispagel, K.; Heydebrand, G.; Skinner, M. W. Factors affecting open-set word recognition in adults with cochlear implants. Ear Hear. 2013, 34, 342–360. [Google Scholar] [CrossRef]
  21. Zeh, R.; Baumann, U. Inpatient rehabilitation of adult CI users : Results in dependency of duration of deafness, CI experience and age. HNO. 2015, 63, 557–576. [Google Scholar] [CrossRef] [PubMed]
  22. Hoppe, U.; Hocke, T.; Hast, A.; Iro, H. Maximum preimplantation monosyllabic score as predictor of cochlear implant outcome. HNO. 2019, 67, 62–68. [Google Scholar] [CrossRef] [PubMed]
  23. Helbig, S.; Adel, Y.; Rader, T.; Stover, T.; Baumann, U. Long-term Hearing Preservation Outcomes After Cochlear Implantation for Electric-Acoustic Stimulation. Otol Neurotol. 2016, 37, e353–e359. [Google Scholar] [CrossRef] [PubMed]
  24. Dalbert, A.; Huber, A.; Baumann, N.; Veraguth, D.; Roosli, C.; Pfiffner, F. Hearing Preservation After Cochlear Implantation May Improve Long-term Word Perception in the Electric-only Condition. Otol Neurotol. 2016, 37, 1314–1319. [Google Scholar] [CrossRef] [PubMed]
  25. Buchman, C. A.; Herzog, J. A.; McJunkin, J. L.; Wick, C. C.; Durakovic, N.; Firszt, J. B.; Kallogjeri, D. Assessment of Speech Understanding After Cochlear Implantation in Adult Hearing Aid Users: A Nonrandomized Controlled Trial. JAMA Otolaryngol Head Neck Surg. 2020. [Google Scholar] [CrossRef]
  26. Kelsall, D.; Lupo, J.; Biever, A. Longitudinal outcomes of cochlear implantation and bimodal hearing in a large group of adults: A multicenter clinical study. Am J Otolaryngol. 2021, 42, 102773. [Google Scholar] [CrossRef] [PubMed]
  27. Walia, A.; Shew, M. A.; Kallogjeri, D.; Wick, C. C.; Durakovic, N.; Lefler, S. M.; Ortmann, A. J.; Herzog, J. A.; Buchman, C. A. Electrocochleography and cognition are important predictors of speech perception outcomes in noise for cochlear implant recipients. Sci Rep. 2022, 12, 3083. [Google Scholar] [CrossRef] [PubMed]
  28. Thangavelu, K.; Nitzge, M.; Weiß, R. M.; Mueller-Mazzotta, J.; Stuck, B. A.; Reimann, K. Role of cochlear reserve in adults with cochlear implants following post-lingual hearing loss. Eur Arch Otorhinolaryngol. 2022. [Google Scholar] [CrossRef] [PubMed]
  29. Hoppe, U.; Hast, A.; Hocke, T. Validation of a predictive model for speech discrimination after cochlear impIant provision. HNO. 2023. [Google Scholar] [CrossRef]
  30. Dziemba, O. C.; Merz, S.; Hocke, T. [Evaluative audiometry after cochlear implant provision]. HNO. 2023. [Google Scholar] [CrossRef]
  31. Hahlbrock, K. H. Sprachaudiometrie: Grundlagen und praktische Anwendung einer Sprachaudiometrie für das deutsche Sprachgebiet; Thieme Verlag: Stuttgart, 1957. [Google Scholar]
  32. DIN45621-1:1995-08; Word lists for recognition tests – Part 1: Monosyllabic and polysyllabic words. Beuth Berlin, 1995.
  33. Braun, T.; Wimmer, M.; Hempel, J. M. [Two formulas for exact calculation of hearing loss for numbers]. HNO. 2012, 60, 814–816. [Google Scholar] [CrossRef]
  34. Winkler, A.; Holube, I. [Test-retest reliability of the Freiburg monosyllabic speech test]. HNO. 2016, 64, 564–571. [Google Scholar] [CrossRef]
  35. Matlab Documentation. 2023. Available online: https://de.mathworks.com/help/stats/wilkinson-notation.html (accessed on 12 June 2023).
  36. Cohen, P. R.; Howe, A. E. How Evaluation Guides AI Research: The Message Still Counts More than the Medium. AI Magazine. 1985, 9, 35–43. [Google Scholar] [CrossRef]
  37. Olusanya, B. O.; Davis, A. C.; Hoffman, H. J. Hearing loss grades and the International classification of functioning, disability and health. Bull World Health Organ. 2019, 97, 725–728. [Google Scholar] [CrossRef]
  38. World report on hearing. Geneva: World Health Organization; 2021. Licence: CC BY-NC-SA 3.0 IGO. Available online: https://www.who.int/publications/i/item/9789240020481 (accessed on 12 June 2023).
Figure 1. Output characteristics of the generalised linear model as a function of the three input variables within a reasonable input range. The predicted word recognition score WRS65(CI) after six months is shown as a function of: (A) preoperative maximum word score WRSmax, (B) preoperative aided score WRS65(HA), and (C) age at implantation. In each panel the remaining two factors are kept constant at the selected values indicated, covering the observed range, and the thin black curves show the variation in WRS65(CI). The thick grey curves represent the model's results for the most recent population means at our clinic: WRSmax = 50%, WRS65(HA) = 9%, age = 66 years. Dotted lines indicate a rather unlikely combination of input factors, namely a high WRS65(HA) in the presence of much lower WRSmax.
Preprints 80775 g001
Figure 2. Distribution of age, duration of hearing impairment and duration of unaided hearing impairment in the two patient groups with preoperative maximum word recognition (WRSmax) of zero (left) or above zero (right).
Preprints 80775 g002
Figure 3. Preoperative audiometry of the 165 cases: (A) The aided word recognition score, WRS65(HA) as a function of average pure-tone hearing loss, 4FPTA; (B) The maximum word recognition score, WRSmax, as a function of 4FPTA; (C) relation between WRS65(HA) and WRSmax. The black curves in panels A and B represent the average relation between WRS values and 4FPTA in a population of HA users [8,14]. The lower panels (D–F) show the relationship between the SRTnum and 4FPTA, WRS65(HA) and WRSmax, respectively.
Preprints 80775 g003
Figure 4. Relationship between preoperative and postoperative word recognition scores for the 165 cases: (A) Word recognition score with CI after six months (WRS65(CI) vs. the preoperative aided score, WRS65(HA)); (B) WRS65(CI) vs. the maximum preoperative word recognition score, WRSmax; (C) distribution of the WRS65(CI) for the two patient groups (black, group 1 with a preoperative WRSmax > 0%; blue, group 2 with WRSmax = 0%). This colour code applies to panels A and B as well.
Preprints 80775 g004
Figure 5. Distribution of differences between predicted and measured word recognition with CI, WRS65(CI), six months after surgery: (A) Prediction errors in percentage points (pp) for group 1 (preoperative WRSmax > 0); (B) prediction errors for group 2 (WRSmax = 0). In both panels the dotted line indicates the prediction error resulting from the application of the previous model [6] (equation 1). The solid line indicates the prediction error resulting from the advanced model (Table 3). The MAE was 11.1 pp in group 1 and 17.1 pp in group 2 according to equation 2. The previous model resulted in MAEs of 11.3 pp for group 1 and 23.7 pp for group 2.
Preprints 80775 g005
Table 1. Patient characteristics.
Size Age[years] 4FPTA[dBHL] WRSmax[%] WRS65(HA) Duration of hearing impairment[years] Duration of unaided hearing impairment[years] SRTnum[dBSPL]
Group 1WRSmax > 0% 109 67 ± 14 83 ± 14 42 ± 23 15 ± 16 24 ± 18 9 ± 13 85 ± 15
Group 2WRSmax = 0% 56 64 ± 14 114 ± 17 0 0 ± 1 20 ± 22 10 ± 16 124 ± 10
total 165 66 ± 14 94 ± 21 27 ± 27 10 ± 15 22 ± 20 9 ± 14 98 ± 23
SRTnum, speech recognition threshold for 50% number recognition; SPL, sound pressure level; for other abbreviations see text above. Means ± standard deviation are shown.
Table 2. Variability of word recognition with CI six months after surgery with respect to preoperative maximum word recognition.
Group Size WRS65(CI) [%] No. of cases with a score of...
Mean ± SD Median WRS65(CI)=0% WRS65(CI):>0% - <50% WRS65(CI): 50% - 100%
Group 1WRSmax > 0% 109 68 ± 19 70 1 (1%) 12 (11%) 96 (88%)
Group 2WRSmax = 0% 56 59 ± 30 70 7 (13%) 9 (16%) 40 (71%)
total 165 65 ± 24 70 8 (5%) 21 (13%) 136 (82%)
Table 3. Results of regression analysis with two additional predicting variables and their interaction term, duration of hearing impairment (DHI) and duration of unaided hearing impairment (DuHI). The coefficients from the previous model [6] were fixed.
Estimate Standard Error t Statistic p
Constant, β 0 ' . 0.35 0.04 8.44 3∙10–17
DHI [year-1] –0.0027 0.0019 –1.41 0.16
DuHI, β 4 [year-1] –0.0171 0.0056 –3.05 0.002
DHI:DuHI [year-2] –4.20 0.0001 –0.41 0.68
Included are 6600 observations, 6596 error degrees of freedom. χ2 statistic vs. constant model: 152, p = 1∙10–32.
Table 4. Results of regression analysis with one additional predicting variable only: duration of hearing impairment (DHI). The coefficients from the previous model [6] were fixed.
Estimate Standard Error t Statistic p
Constant, β 0 ' . 0.41 0.04 10.75 6∙10–27
DHI, β 4 [year-1] –0.0125 0.0013 –9.73 2∙10–22
Included are 6600 observations, 6598 error degrees of freedom. χ2-statistic vs. constant model: 96.4, p = 1∙10–22.
Disclaimer/Publisher’s Note: The statements, opinions and data contained in all publications are solely those of the individual author(s) and contributor(s) and not of MDPI and/or the editor(s). MDPI and/or the editor(s) disclaim responsibility for any injury to people or property resulting from any ideas, methods, instructions or products referred to in the content.
Copyright: This open access article is published under a Creative Commons CC BY 4.0 license, which permit the free download, distribution, and reuse, provided that the author and preprint are cited in any reuse.
Prerpints.org logo

Preprints.org is a free preprint server supported by MDPI in Basel, Switzerland.

Subscribe

© 2024 MDPI (Basel, Switzerland) unless otherwise stated