Preprint
Article

A Synthetic Microbial Daisyworld: Planetary Regulation on the Test Tube

Altmetrics

Downloads

294

Views

309

Comments

0

A peer-reviewed article of this preprint also exists.

This version is not peer-reviewed

Submitted:

27 July 2023

Posted:

31 July 2023

You are already at the latest version

Alerts
Abstract
The idea that the Earth system self-regulates in a habitable state was proposed in the 1970s by James Lovelock, who conjectured that life plays a self-regulatory role on a planetary-level scale. A formal approach to such hypothesis was presented afterwards under a toy model known as the Daisyworld. The model showed how such life-geosphere homeostasis was an emergent property of the system, where two species with different properties adjusted their populations to the changing external environment. So far, this ideal world exists only as a mathematical or computational construct, but it would be desirable to have a real, biological implementation of Lovelock's picture beyond our one Biosphere. Inspired in the exploration of synthetic ecosystems using genetic engineering and recent cell factory designs, here we propose such a living, microbial Daisyworld. This is based on a synthetic microbial ecosystem using pH as the external, abiotic control parameter. Several case studies are considering, including two, three and multiple species assemblies. Despite that oscillatory dynamics and chaos emerge in the latter case, it is shown that global regulation is also achieved in most cases as species diversity increases. The alternative implementations and their implications of this model in other synthetic biology scenarios, including ecosystem engineering, are outlined.
Keywords: 
Subject: Biology and Life Sciences  -   Ecology, Evolution, Behavior and Systematics

1. Introduction

Our biosphere is the result of a long-term evolutionary experiment where living life forms and their environments have been interacting closely and on multiple scales through millions of years. The composition of our biotas has been changing, sometimes in dramatic ways, as shown by the fossil record of life [2,3]. This evolutionary process has been taking place on a planet that has also experienced profound changes. Some were caused (or driven) by astronomical phenomena, from deterministic orbital cycles to fateful asteroid impacts. However, major changes took place as a consequence of the entangled nature between climate and the biosphere [4]. The deep connections between environment and life leave a mark in the geological past. How has life influenced climate and viceversa? As early pointed out by Vladimir Vernadsky [5], the emergence of life fundamentally transformed the geosphere. One specially interesting observation made by geochemist James Lovelock in the 1970s was the realisation that our planet should have been driven by our Sun into higher temperature regimes.
We know from our two closest planetary neighbours, Mars and Venus, that steady changes in physical parameters can trigger runaway effects leading to a planet devoted of life [14]. In general, positive feedback loops can drive a planet to extreme steady states, from boiling temperatures to a snowball [4]. And yet, life on Earth has emerged and diversified, somehow dealing with the impacts of external drivers. To explain such stability, Lovelock suggested that an active coupling between life and physical systems make up the planet [6,7,8,9]. To make this point more explicit, Watson and Lovelock proposed in 1983 a simple model of planetary regulation known as the Daisy World Model (DWM) [22,25]. In a nutshell, the DWM considered an ideal planet where two kinds of agents, namely black and white daisies, had a distinct impact on planet albedo thus changing the local temperature in a way that could allow for climate stability over a wide range of solar luminosity values. Since its formulation, DWM has become a canonical model for Earth System Science [26] and has been used to explore a very diverse range of problems, from tipping points [11,27], to evolutionary dynamics [23,24] to climate bistability in exoplanets [1,15]. In contrast with other problems, the planetary scale makes rather unlikely to approach this coupling between environment and ecology in terms of controlled experimental conditions. Within synthetic biology, successful modelling and implementation of engineered ecosystems has been achieved, including cooperative consortia [16,17], predator-prey systems [18] or even multispecies assemblies [19,20,21]. Could such a synthetic counterpart be found for the DWM?
A general formulation of the Watson-Lovelock model is described by means of a set of coupled differential equations, namely (see [28] and references therein):
d x k d t = x k β k ( T ) 1 j = 1 n x j δ k
which correspond to an ecological model of species interactions. The basic feedback loops involved are represented in Figure 1a for the standard two-species WLM. Increasing luminosity can trigger the growth of both kinds of vegetation, at rates indicated by β k ( T ) (with k = 1 , 2 ). In the best known (and simpler) version, two species are considered and the following model was explored, for a "world" involving black and white daisies
d x w d t = x w β w ( T ) [ 1 x w x b ] δ w
d x b d t = x b β b ( T ) [ 1 x w x b ] δ b
where [ 1 x w x b ] introduces the available bare soil that both species can occupy. In Figure 1a we sketch the basic model components using a spatial version (see [10,12,13]), with dark, white and gray sites indicating black and white daisies and bare soil, respectively (lower inset, Figure 1a). These equations remind us of a competition model, but the relevant complexity is captured within the β i ( T ) factors (with i = b , w ), defined by means of a single-humped function involving an optimum. The details of this model can be found elsewhere [22,25] but the crucial intuition is that the growth rates of each kind of daisy is affected by temperature in opposite ways. At low temperature, black ones will thrive since they will warm their local environment and spread. As T increases, white daisies are favoured because they reduce warming. The area covered by each species contributes to the albedo and affect local temperatures in such a way that a self-adjustment occurs, leading to a stable regime of local temperatures, as shown in Figure 1b. Here the grey, increasing trend indicates how temperatures will rise in the absence of biological control. The underlying populations of each type are also shown in Figure 1c.
The DWM, despite its specific traits and potential challenges in translating it to the real biosphere, offers a valuable principle of living homeostasis that warrants consideration under broader assumptions. The concept of a living ecosystem that can respond to external forces and readjust itself to preserve diversity or some global property is inherently intriguing. It opens the door to creating mathematical and computational models representing such homeostatic ecologies, but an even more relevant prospect lies in constructing a real living ecosystem that echoes Lovelock’s vision. Synthetic biology emerges as an ideal candidate for achieving this ambitious goal. Through genetic engineering techniques, scientists have successfully designed cells with novel functionalities and orchestrated their interactions in intricate ways. Consequently, the main objective of this paper is to demonstrate the feasibility of constructing a synthetic daisy world..
Creating a living surrogate of the original DWM could help exploring the general problem in novel ways, as well as providing a rich context to explore the role of lower-scale features (such as molecular regulation) on the global regulation processes. The challenge is not minor: an experimental surrogate of the planetary coupling between life and environment involving a cooperative feedback is far from obvious. However, although a potential choice could involve using temperature as the driving parameter, there are other no less important properties that have been also controlled at the planetary level. One of them is acidity [8]: despite of the tendency towards acidification associated to an increasing oxidation of the atmosphere, the mean pH of the oceans has been remarkably stable over millions of years. As pointed out in [4], "the daisies are a surrogate for any kind of life that can affect the global temperature – and temperature could equally well be any other environmental variable that life cares about, for instance the oxygen concentrations, or pH." And indeed in their early analysis of the problem, Margulis and Lovelock already pointed out that, along with temperature and atmosphere composition, ocean acidity has been under feedback control [8].
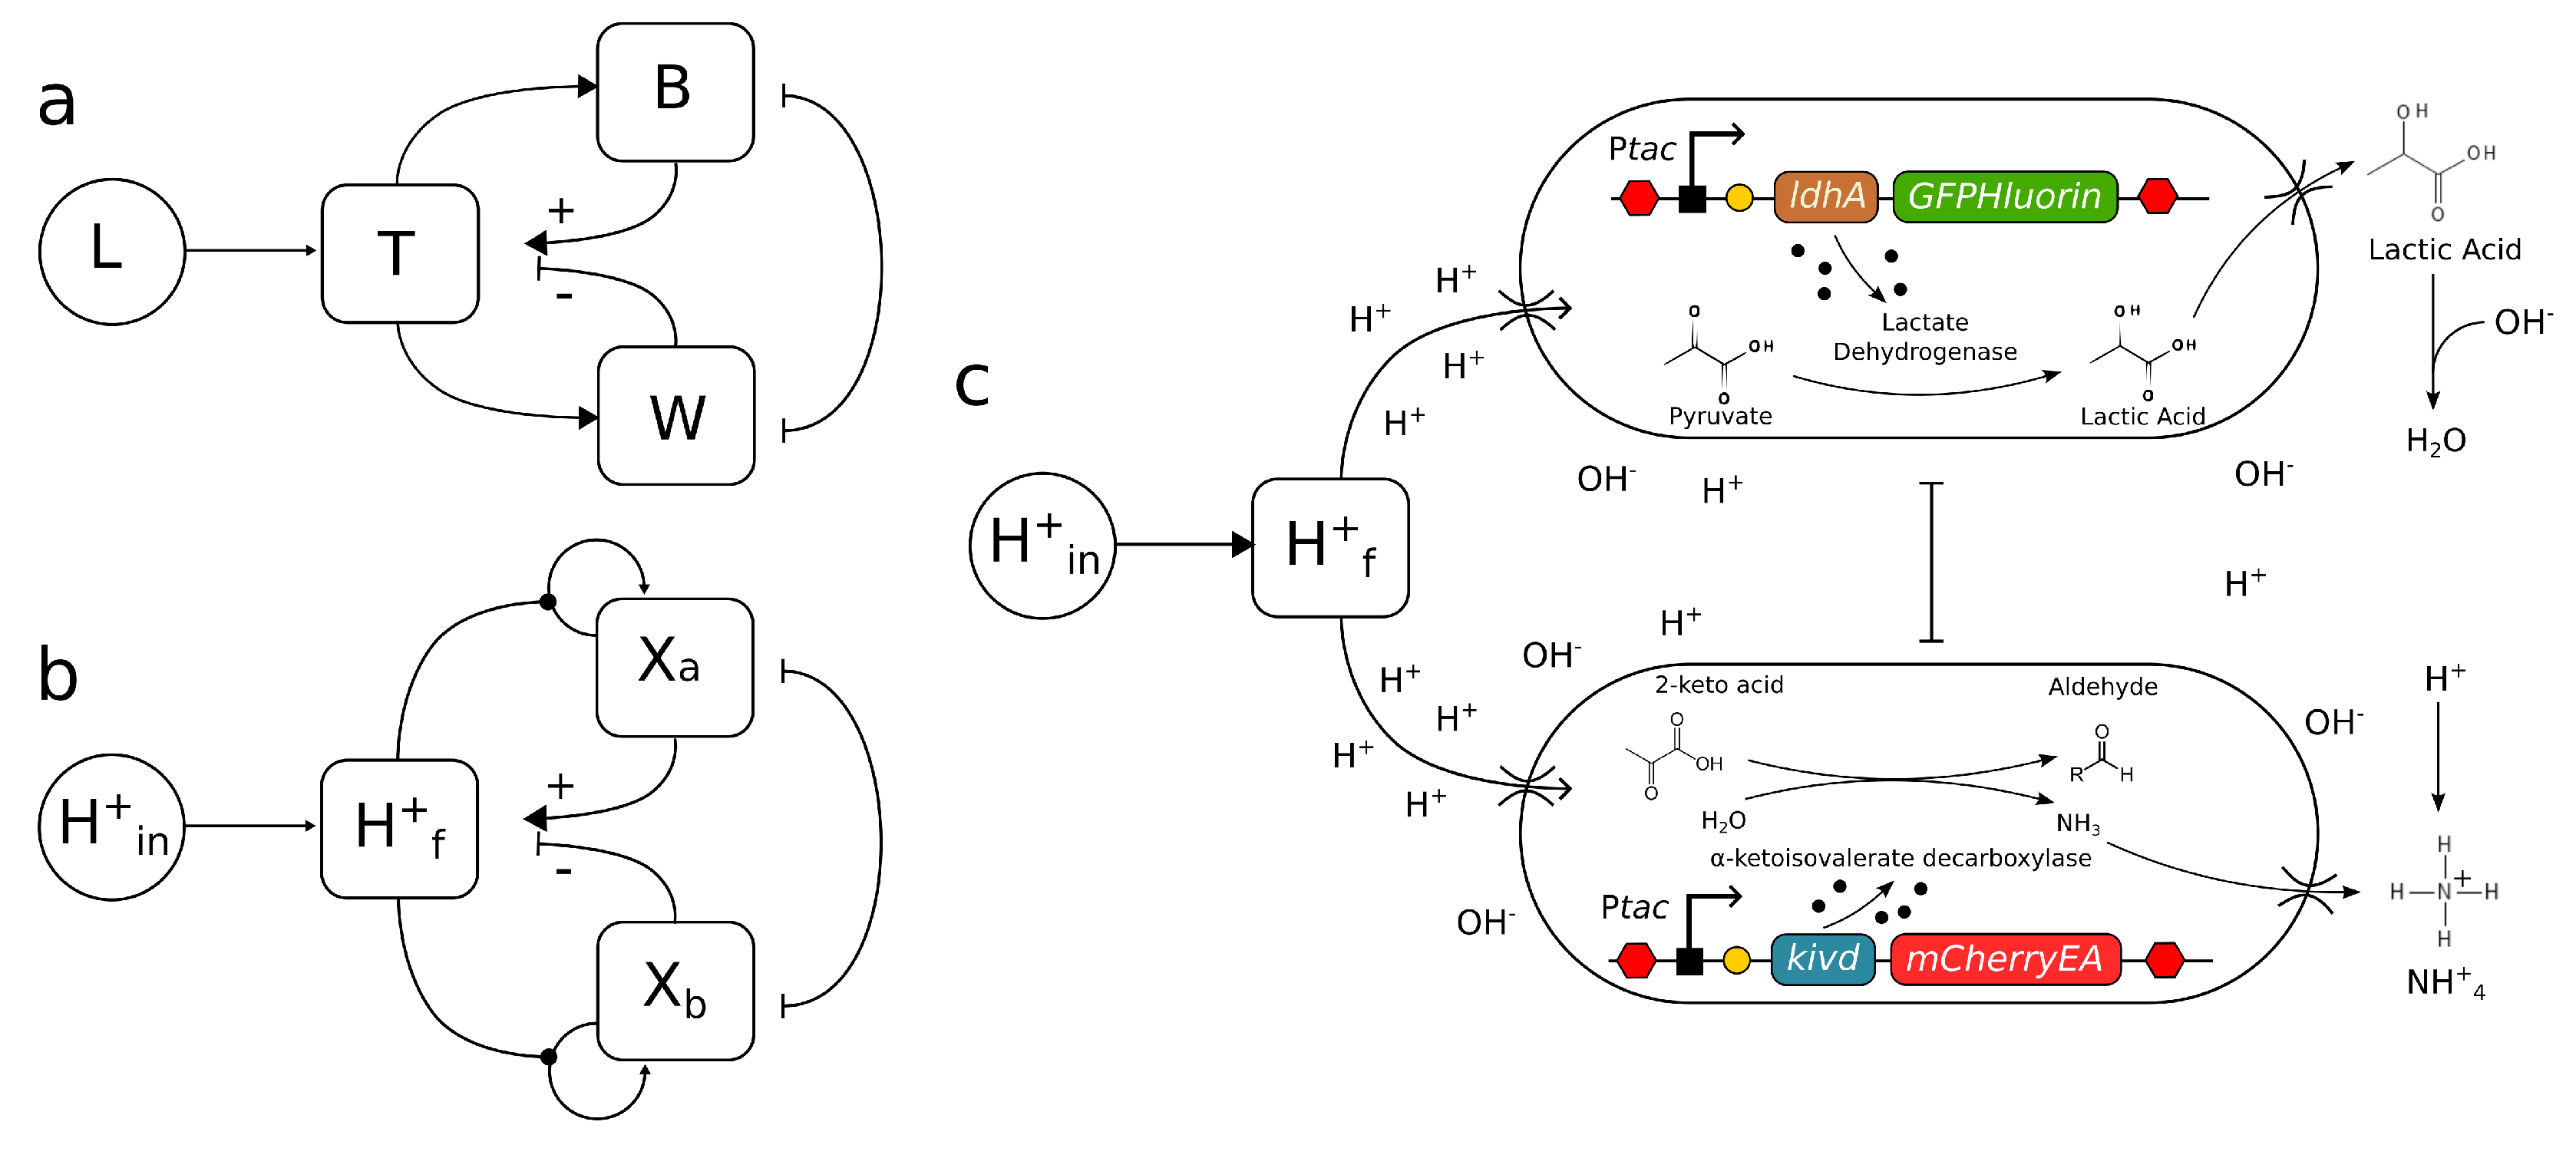
In this work, we choose pH as a relevant environmental parameter that can be used as an external, tuneable input. Thus, we instead consider an alternative that allows a straightforward approach that captures all the relevant feedbacks and allows for a microcosm/mesocosm implementation (Figure 1d) based on a synthetic microbial ecosystem where pH is tuned by two populations that will play the role of our daisies.

2. Methods

This paper delves into two crucial aspects concerning the definition of a synthetic microbial Daisyworld. Firstly, we explore a collection of genetic circuits linked to a two-strain consortia specially engineered to regulate the environmental p H . Drawing inspiration from recent research on the controlled management of industrial fermentation [29], we present a synthetic approach aligned with the regulatory feedback principles of the DWM. Secondly, we demonstrate how the well-established impacts of acidity on microbial growth can be mapped onto ecological network models, akin to those of the DWM based on temperature and albedo.

2.1. Microbial Daisy World: synthetic circuits

The success of implementing a p H -based synthetic DWM hinges on two key factors: (a) ensuring a strong alignment with the growth response assumptions originally formulated by Lovelock, which were based on local temperature, and (b) skillfully engineering microbial-environment interactions to effectively regulate local p H , simulating the feedback mechanisms depicted in Figure 2a. Extensive research has been conducted on the growth responses of microorganisms to p H , leading to the development of various mathematical models to characterize their behavior. Notably, the analysis of the relative growth rate against p H reveals a distinctive inverted parabolic pattern [30], which harmonizes with the foundational assumptions of the DWM. These assumptions entailed a smooth curve with a single optimum and well-defined limits. Empirical data from diverse species, such as E. coli or Listeria sp., demonstrate symmetric functional responses within a p H range of [ p H m , p H M ] , where p H m and p H M represent the zero-growth limits of the fitted curve.
While different mathematical models, such as the Presser [31] or Lambert-Pearson [30,32] models, have been proposed, they all exhibit a near-parabolic behavior. Consequently, the effects of p H closely align, in mathematical terms, with the control space assumptions of the DWM. This congruence underscores the potential feasibility of establishing a synthetic microbial Daisyworld based on p H regulation.
Is it possible to design a synthetic consortium comprising two strains that can effectively control the acidity of the environment? Our aim is to create a pair of synthetic organisms capable of responding to changes in p H in a manner that mirrors Lovelock’s concept, as illustrated in Figure 2a,b. In this scenario, the two engineered strains would function in opposing ways: although they share a common optimum p H ," they would either increase or decrease the environmental acidity/alkalinity levels. This complementary behaviour would lead to a mutual self-regulation, ideally maintaining a constant environmental p H value. In a broader context, this approach represents a specific application of metabolic engineering facilitated by synthetic biology [33]. Unlike traditional methods that involve continuous monitoring and manual addition of sterile bases and acids as needed [29,34], our case study focuses on developing a system capable of self-correcting deviations from the optimal p H . By doing so, we aim to eliminate the need for constant fine-tuning, making the process more efficient.
We propose the utilization of two engineered cell types (Figure 2c): the acid-producing and the base-producing strains. The first is the acid-producing strain, which incorporates the ldhA functional gene responsible for expressing lactate dehydrogenase. This enzyme facilitates the conversion of pyruvate to lactic acid, resulting in a decrease in pH [29]. Conversely, the base-producing strain employs the kivd functional gene, encoding α -ketoisovalerate decarboxylase. This enzyme is involved in the decarboxylation of branched-chain α -keto acids derived from branched-chain amino acids transamination into aldehydes [35]. In simpler terms, it catalyzes the conversion of 2-keto-acid to aldehyde, leading to an overproduction of ammonia, subsequently reducing the medium’s acidity by forming ammonium ions. While other genes like glsA or gadA could have been considered to catalyze ammonium ion production through alternative processes [29], using them might result in lower yields.
To ensure robustness in our experiments, we propose employing the Escherichia coli knockout strain with a deletion in the glutamine synthetase gene (Keio collection JW3841-1), yielding the ΔglnA genotype. By blocking ammonia re-uptake through this deletion, we can enhance the performance of the base-producing strain. Additionally, we recommend a deletion in ΔlldP, which encodes an inner membrane permease involved in lactate uptake [36,37]. This modification further supports the function of the acid-producing strain, ensuring its efficiency in the system.
Regarding promoter usage, we propose employing pTac in both genetic devices, as it is commonly used to control and overexpress recombinant proteins. However, any controllable promoter without leakiness and with high fold change expression could also be suitable. If an imbalance is detected in the production of both ldhA and kivd genes, the genetic devices could be easily modified to address the issue by using different controllable promoters, such as pTet-ldhA or pTet-kivd.
Furthermore, to facilitate real-time dynamics of the two strains and track the experimental process, fluorescent reporter genes would be used. We suggest using pH-sensitive fluorophores such as green and red fluorescent proteins. The green fluorescent protein GFP-pHlorine and the red fluorescent protein mCherryEA have been identified as ratiometric pH sensors, where the protonation of the chromophore is pH-dependent. They exhibit an approximately 8-fold increase in expression with increasing pH values, ranging from 5 to 9 [38,39].

2.2. Microbial Daisy World: two-species model

Using the known parabolic shape of relative growth responses to acidity, a simple mathematical model can be build under the assumption that the two synthetic strains described above can be engineered. The model now requires taking into account the fact that changes can be observed on two, connected scales. One is described (as in the WLM) in terms of relative cell populations. The second is a cell-level dynamics associated to the pH balances between the intracellular concentration and the one they perceive from their local environment.
The equations that are used to describe the cell dynamics are a coupled set of equations describing the growth of each cell type, similar to standard replicator equations from population genetics:
d X a d t = X a ϕ ( X ) β ( p H a ) δ
d X b d t = X b ϕ ( X ) β ( p H b ) δ
where X a is the concentration of acid-producing cells, X b is the concentration of base-producing cells, ϕ ( X ) = 1 ( X a + X b ) describes the negative feedback associated to the finite amount of available space for cells to occupy, and δ is the dilution rate. The functional form of β describing the change in growth rate depending on the perceived p H is here chosen as
β ( p H x ) = 1 ( p H o p t p H x ) 2 ( p H o p t ± p H l i m ) 2
(other choices gave similar results, provided that the dependence is one-humped). It describes a symmetric, single-peaked function with its maximum output located at p H x = p H o p t , and positive output for an input in the range p H x p H o p t ± p H l i m . The perceived p H depends on the internal level of acidity/alkalinity that each cell experiences on a local scale. Thus we have:
p H a = p H f + a i , p H b = p H f b i ,
Here, both a i and b i stand for the acid or base at the individual cell level and require specific dynamical assumptions (see below). p H f is described as the free p H in the media, that depends on the external input p H i n and the action of each population.
d p H f d t = p H i n + X a a e X b b e δ p H f
Here, a e and b e stand for the external level of acidity/alkalinity is able to excrete to the external surrounding media (see below). Furthermore, if we (reasonable) assume that the dynamics of protocol concentration is fast, then we can use d p H f / d t 0 and in such scenario we have:
p H f = p H i n + X a a e X b b e
Additionally, we need to take in account the microscopic balances at the level of individual cells. Therefore in the molecular level we can assume stoichiometry ruling the internal levels of acid or base production of each cell and the extracelular transport rates. We have the following reactions.
Preprints 80785 i001
Here, as has been previously pointed, a e and b e stand as the external concentration of acid or base in each type of cell, and a i and b i are the amount of acid or base that the cell produces inside the membrane. The production rate is γ . The interchange ratios between the inner cell and the exterior are k. The differential equations according to the reactions are:
d a i d t = γ k 1 a i + k 2 a e
d a e d t = k 1 a i k 2 a e δ a e
d b i d t = γ k e b i + k 4 b e
d b e d t = k 3 b i k 4 b e δ b e
It can be assumed that those reactions happening at the molecular level, in fact, are much faster than the population dynamics, therefore considering d Γ / d t = 0 for each variable Γ { a i , b i , a e , b e } . In this case the equilibrium points can be described as constants. If we further assume all k as equal, we can pack k δ / k as ω .
a i * = γ ( k δ ) δ k = ω γ δ a e * = γ δ
b i * = γ ( k δ ) δ k = ω γ δ b e * = γ δ
Using the fast-relaxation assumption, we can now proceed to the analysis of the system dynamical patterns.

3. Results

Using the previous mathematical model approach (and under the assumptions made above) it is possible now to study the expected dynamical behaviour of our proposed microbial Daisyworld. We first consider the two-species scenarios where a consortium of two microorganisms acts on pH and secondly the more general scenario where (a) a parasitic species is added and (b) multiple species are introduced.

3.1. Two-species consortium

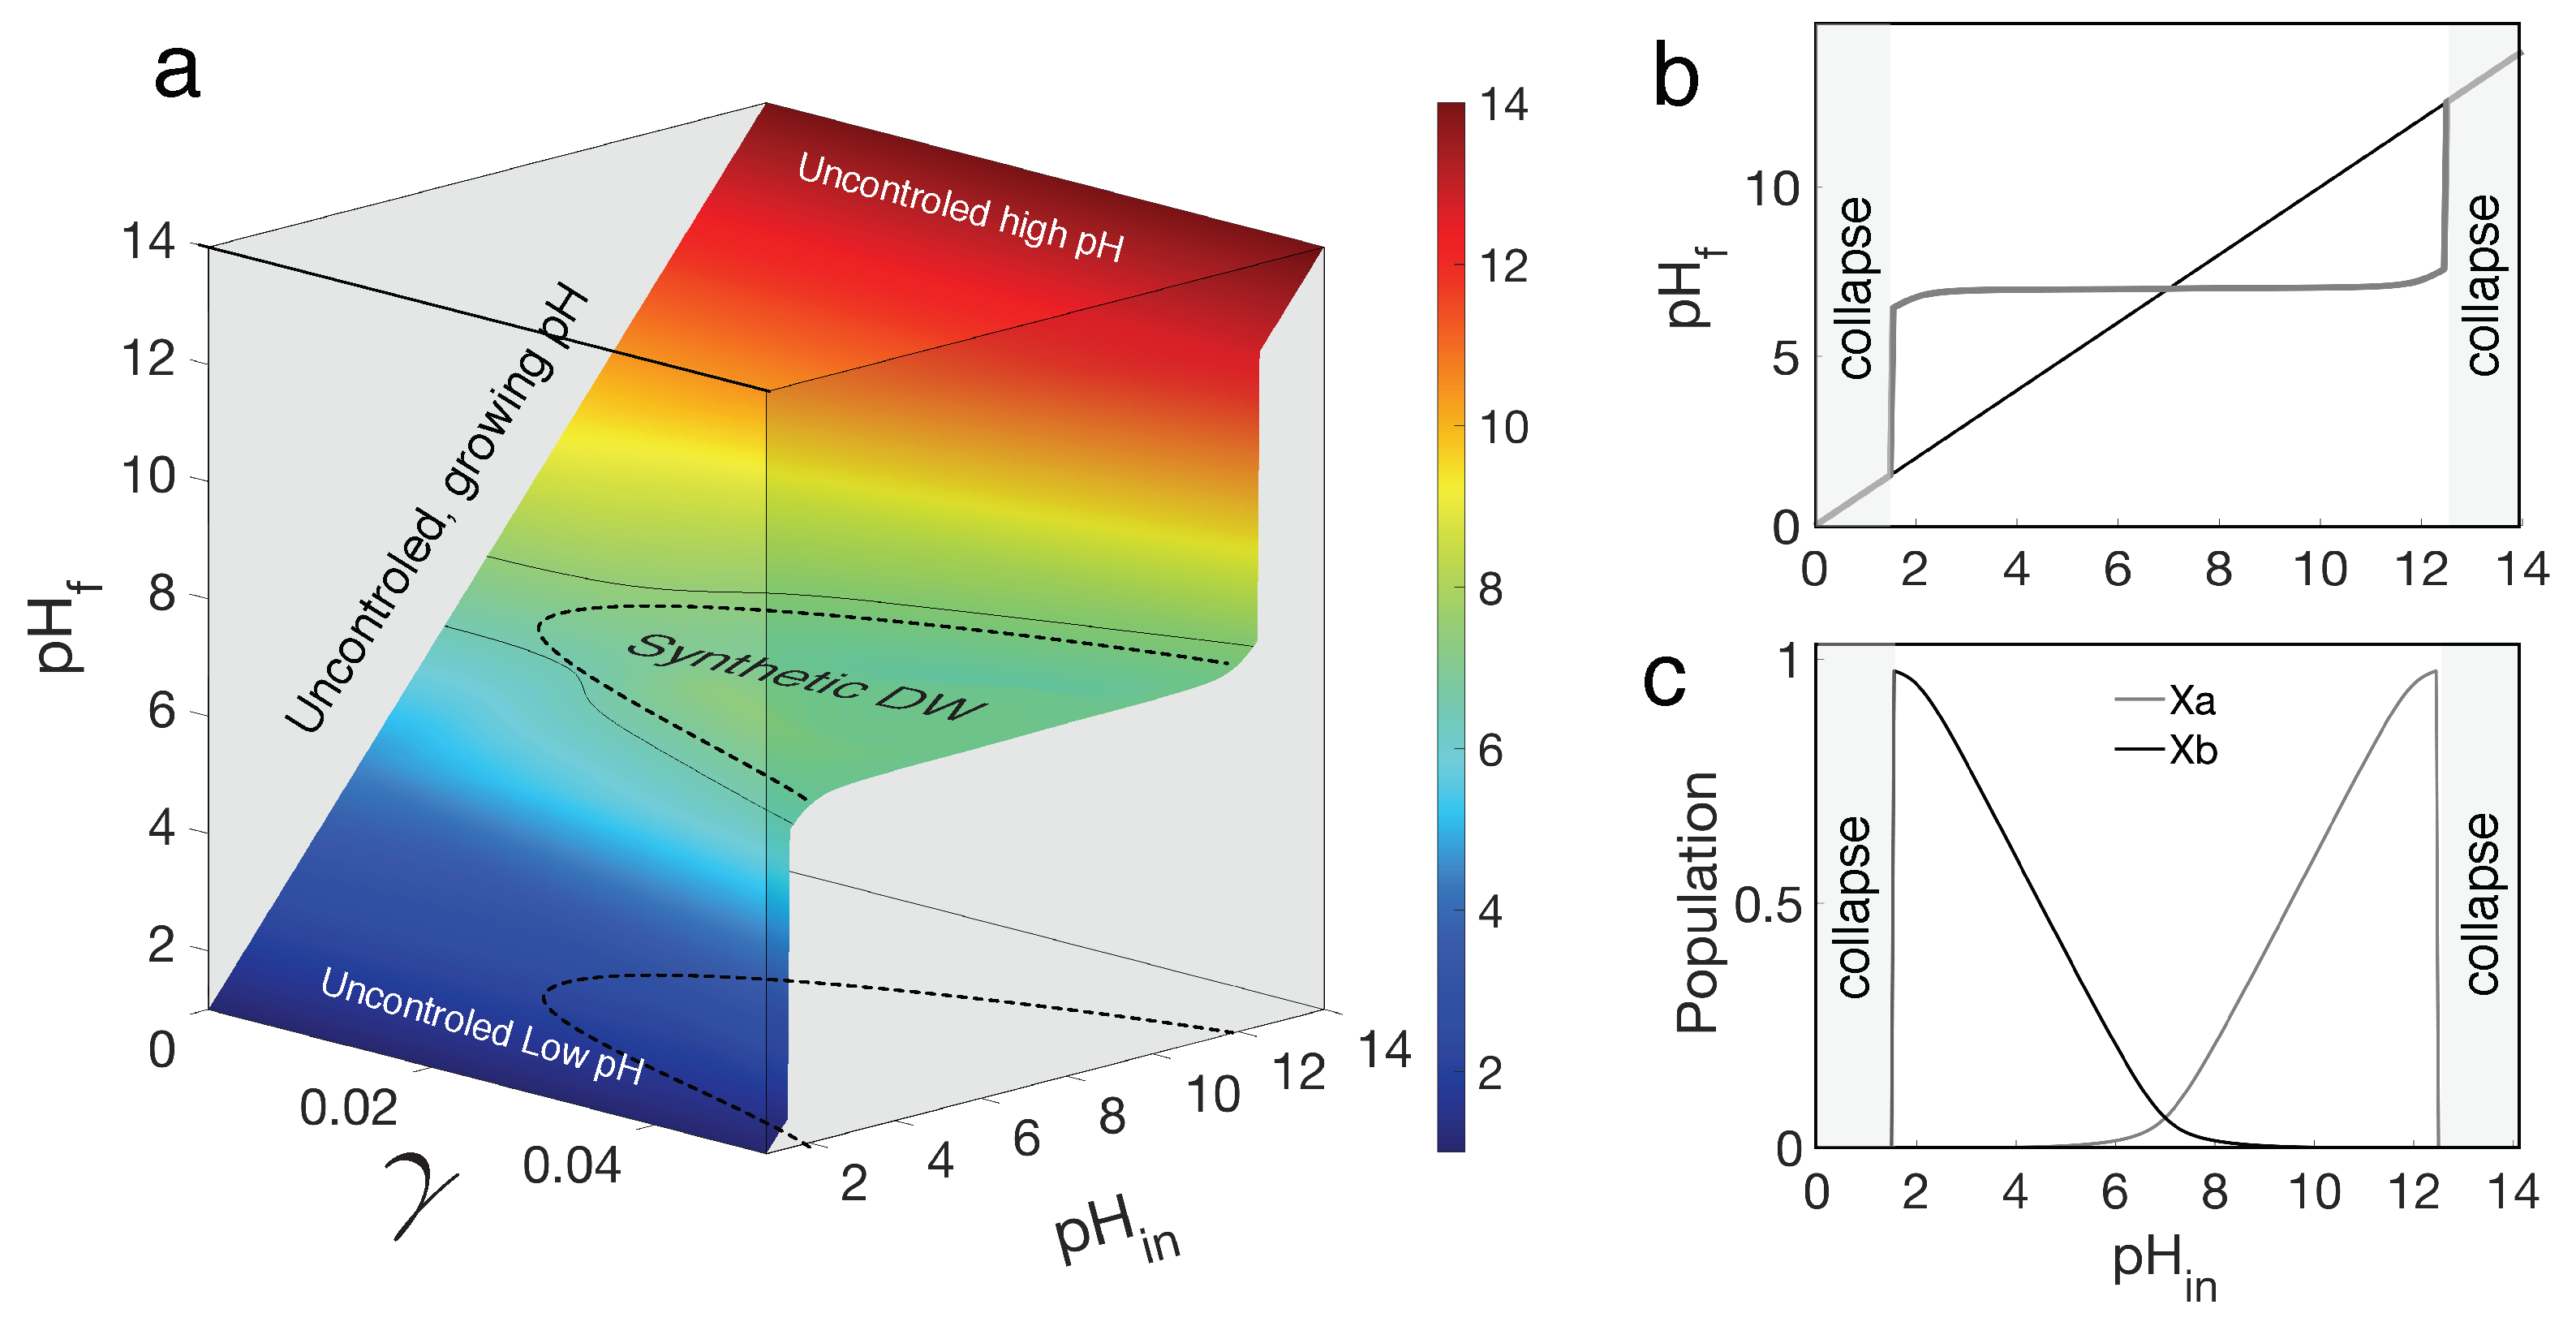
Figure 3 illustrates the behaviour of the synthetic DW design, using the set of equations described above. Here, two species with the same physiological preferences in p H but opposite effects on the surrounding pH establish a wide zone of homeostasis. Similar to the classic work of Watson and Lovelock with temperature, the key parameter ( p H ) also increases in the environment where both species coexist. The surface in Figure 3a fully captures the presence and range of the homeostatic self-regulation achieved by our system. The three axes correspond to the external p H input ( p H i n ), the actual p H in the media ( p H f ) and the γ parameter that gives age rates of the acid/base production. For very small γ values, the strains have no effect on the media pH and thus p H f = p H i n .
As γ increases, self-regulation emerges leading to a bell-shaped curve. This phenomenon can be observed more clearly in Figure 3b, which represents a two-dimensional graph showing p H f , against p H i n , bounded by two extreme scenarios that would lead to ecosystem collapse (gray areas). If species have no effect on the surrounding p H or there are simply no species alive, the result is a straight line representing both pH measures, therefore producing an uncontrolled environment. When a sufficiently high production rate is reached, homeostasis around the optimum appears.
In Figure 3c, we plot the corresponding equilibrium populations against input p H . The involved strains undergo a switch, therefore inducing homeostasis. The base production species ( X b ) grows rapidly at low p H i n since it is able to thrive in acidic environments by alkalizing its surroundings. When the p H is high enough, the acidifying strain experiences a boost and out-competes the first strain until the pH becomes too high, resulting in the collapse of the system. Due to their presence, the p H is regulated around seven within an effective range 3 p H i n 12 , allowing both species to grow within this span. These results are fully consistent with the original DWM and support our proposal that an synthetic, small-scale implementation of planetary regulation can be formulated. How robust is this result? In the next two sections we answer this question under two distinct and relevant scenarios.

3.2. Two-species plus parasites

The conceptual framework of the DWM is grounded in the presence of a cooperative control of the environmental fluctuations. Such control is operated, as described above, by a two-species consortium. The effective outcome of the interactions between the members of the consortium is the stabilization of both populations, although submitted to a marked bias related to the pH input value. How robust is this mechanism of environmental stabilization? One way of answering this question is to consider the introduction of a parasitic component. Parasites are known to destabilise cooperative systems, sometimes pushing the population to the extinction threshold [40,41,42]. Such scenario has been tested in the context of synthetic biology, using a mixotrophic consortium growing in a 2D surface along with a parasitic strain (Amor et al., 2019).
What is the effect of an added parasitic strain? To answer this question, we consider an extended, three-species model where the new set of equations reads as
d X a d t = X a ϕ ( X ) β ( p H a ) δ
d X b d t = X b ϕ ( X ) β ( p H b ) δ
d X c d t = X c ϕ ( X ) β ( p H c ) α δ
Here X a and X b are the two previously defined strains and X c stands for new strain. The logistic term now reads ϕ ( X ) = 1 ( X a + X b + X c ) . A growth rate parameter α [ 0 , 2 ] has been introduced in d X c / d t in order to tune the relative advantage of the extra species in relation to the pair of regulating species. The rest of parameters remain the same. In order to define a parasitic interaction, the functional form of the β term for X c reads as:
β ( p H c ) = 1 ( p H o p t p H f ) 2 ( p H o p t ± p H l i m ) 2
Therefore, as defined, the added species takes advantage of the two other strains, but (as it must be for a parasite) has no effect on the free p H and thus makes no contribution to regulation.
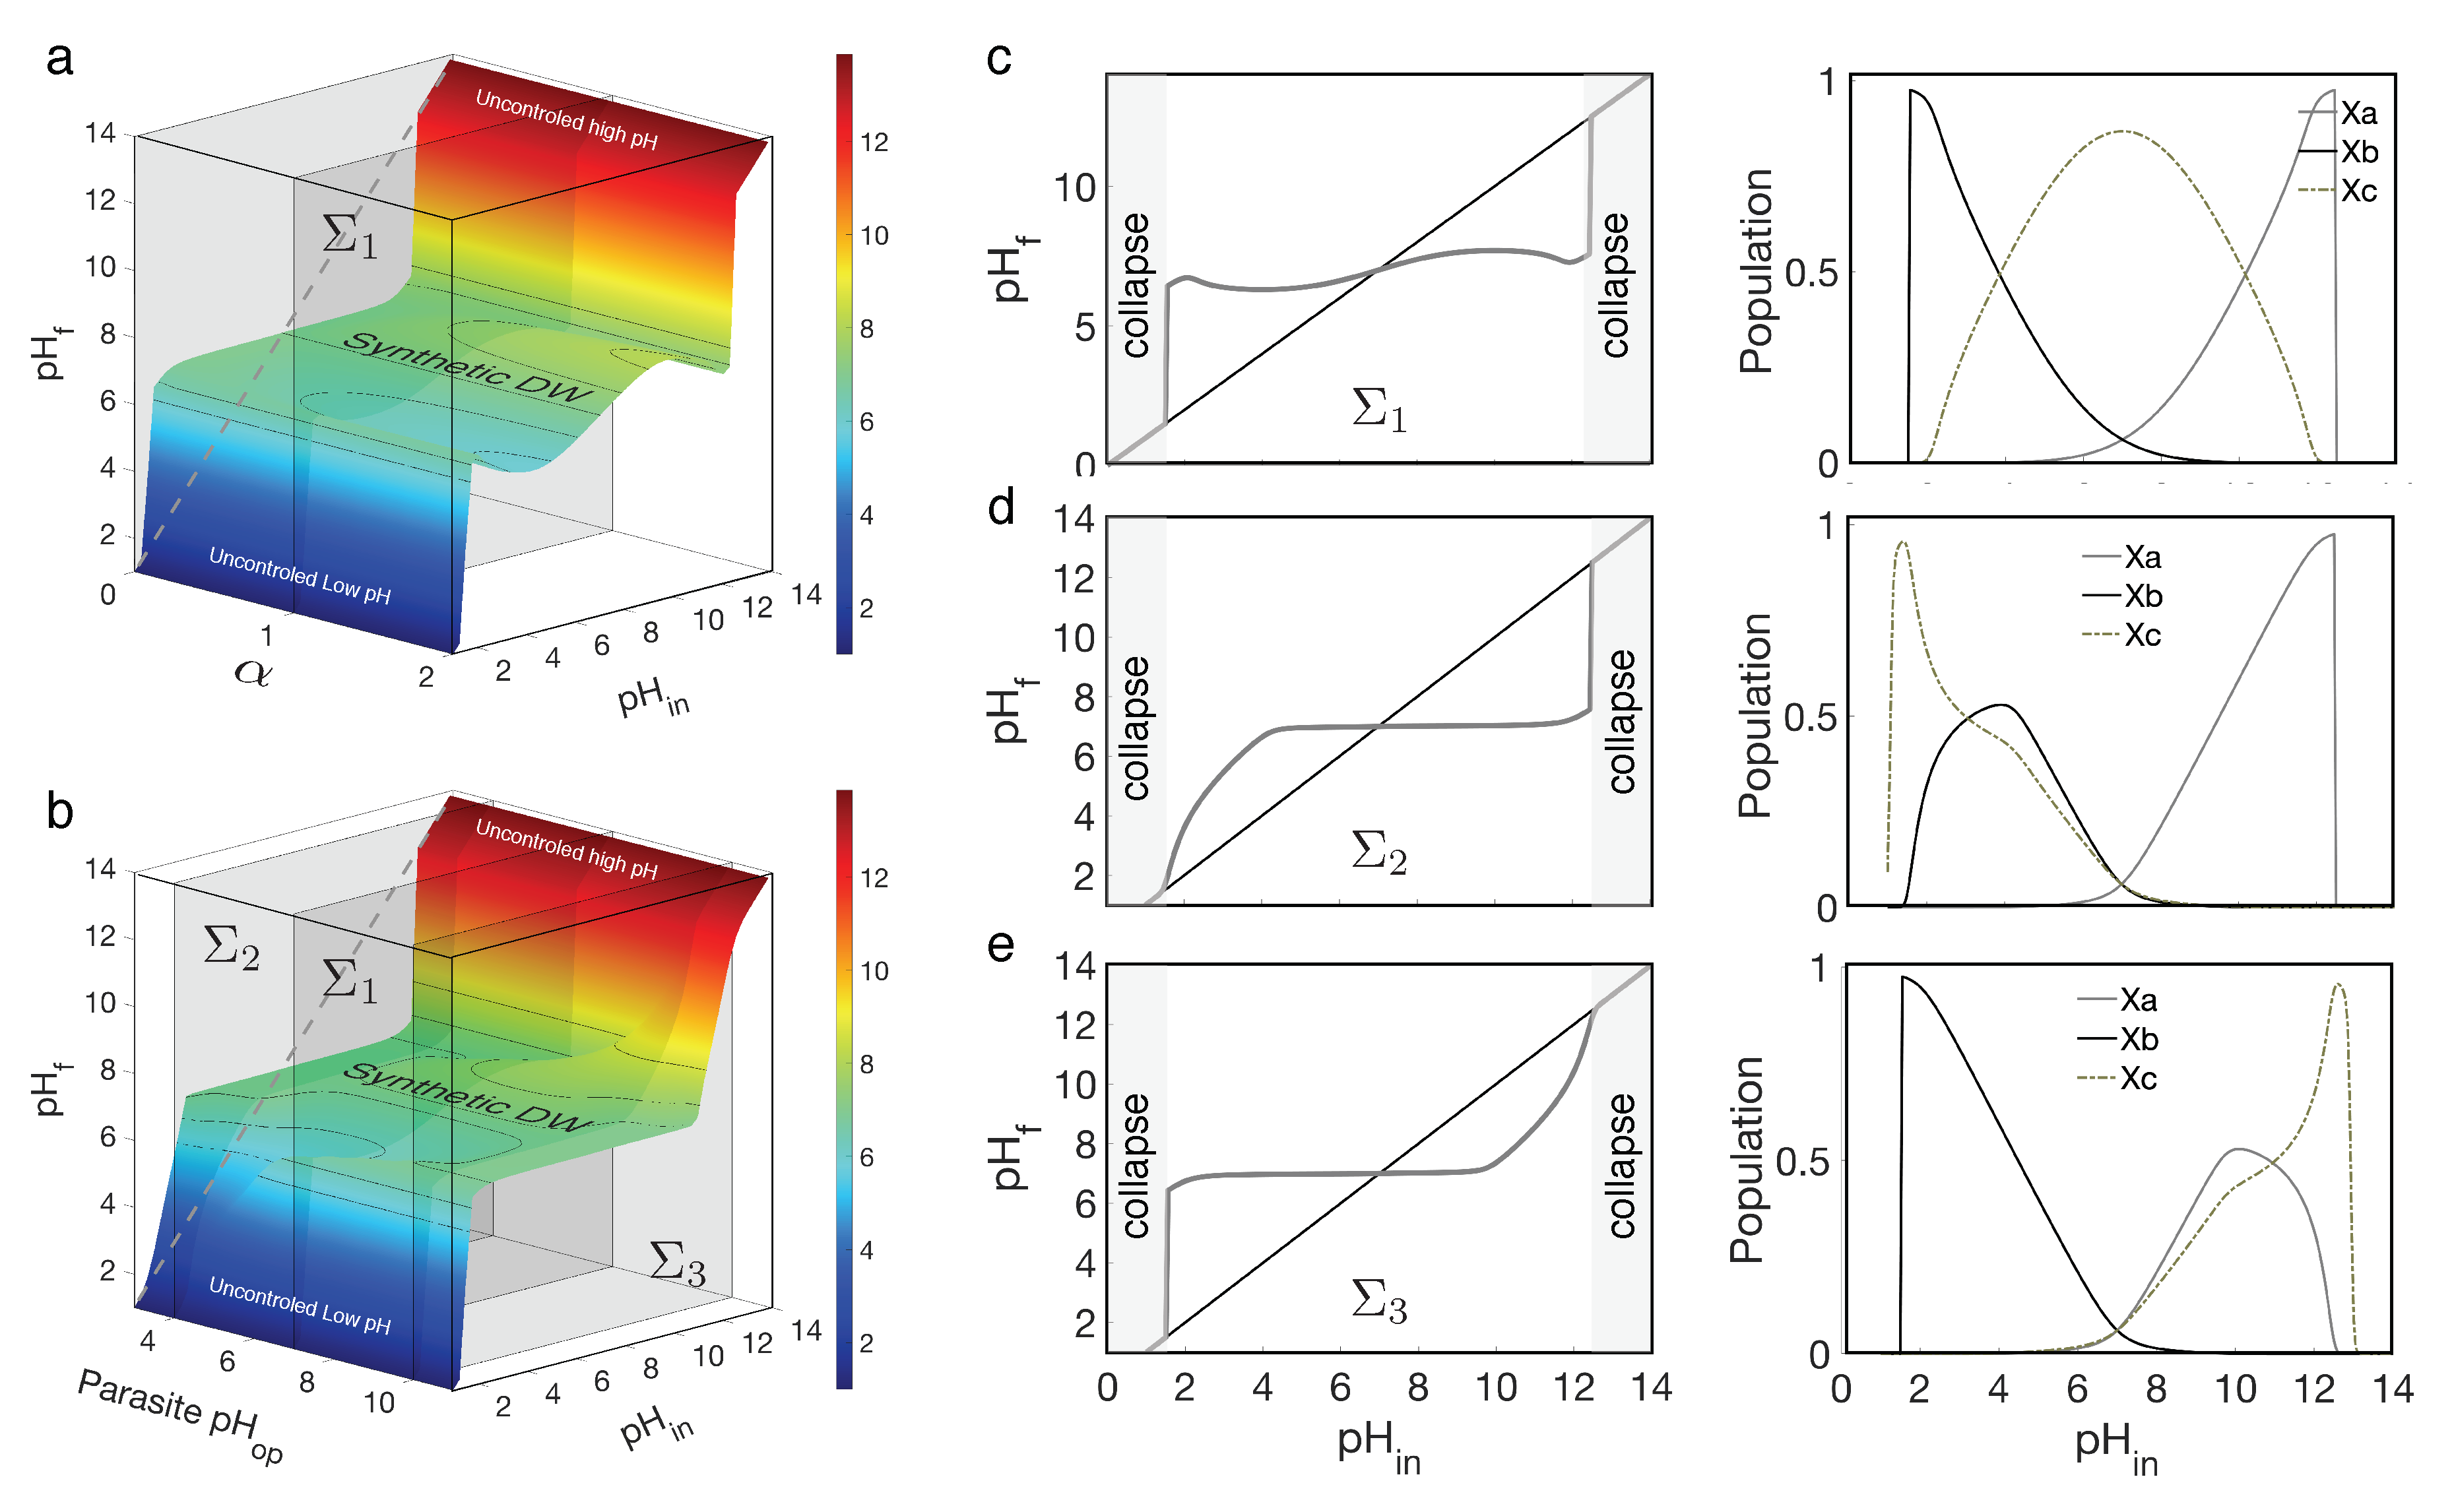
In Figure 4, we summarize the results of our theoretical model. The surface shown in Figure 4a dramatically illustrates the fact that the parasite does not undermine the homeostatic effect; instead, it enhances it, enabling the parasite to thrive in an environment with increasing pH levels. In Figure 4a we clearly appreciate the presence of a very broad domain of regulation.
The section defined for the neutral case α = 1 (vertical, grey plane) is shown in (c) along with the corresponding populations (right column). The homeostasis region appears mildly perturbed, and increases with α (see surface 4a). The p H i n vs P o p u l a t i o n graph shows that the parasite is able to thrive almost reaching carrying capacity when all share optimal p H . What if they don’t share an optimal p H ? Figure 4b shows the robustness of the homeostatic effect. Here the parasite p H o p ranges from 3 to 11 and α has been set to one. Obviously, when p H o p = 7 we have the same plane 1 . When the p H o p is acidic or alkaline (planes 2 and 3 respectively), the perturbation in the homeostasis happens at those specific ranges. Plane 2 (Figure 4b,d) experiences a delay of the regulatory effect diminishing the presence of X b . The inverse effect is expected in 3 (Figure 4b,e). In summary, the introduction of a parasitic component does not (at all) have a detrimental effect on self-regulation. Our model predict instead that such extra population would favour the homeostatic patterns shown by the DWM.

3.3. Multispecies SDW: order and chaos

Low-dimensional ecosystems made of two or three species provide the simplest limit cases where general principles can be derived. As it occurs with genetic switches or simple oscillatory systems, a few components coupled through a nonlinear set of interactions can display robust behaviour [43]. Here too, the two-species example is our proof of concept that planetary regulation scenarios can be properly represented at small scales. Let us consider a general case study involving a multispecies consortium. In third example, we aim to explore the capacity for self-organization within a community where members have different p H o p and p H l i m values that we generate at random, as well as their different effects on pH. The question we seek to answer is whether the community can persist while stabilising the environmental pH. It is important to notice that multi species population dynamics under t nonlinear regimes explored here are likely to develop oscillations and chaos [44]. Will homeostasis also emerge in these cases? How is it affected by species diversity?
To address these questions, a new set of equations can be used. Those describing cell populations are already familiar to us:
d X i d t = X i ϕ ( X ) β ( p H i ) δ + ϵ
Here, X i represents the concentration of pH-modifying bacteria, where i = 1 , 2 , . . . , n . Here ϕ ( X ) = 1 j n X j is the negative feedback associated with finite resources, δ represents the dilution rate, and an immigration factor ϵ is introduced. The growth rate β has the same functional form as before, but now extended to multiple species:
β = 1 1 Δ H 2 p H o p t p H f + ω δ i = 1 n γ i 2
Here, Δ H = p H o p t p H m a x , and γ represents the production rate of acid or base, which can be positive or negative depending on whether it is an acid or base producer. The range of γ is given by γ ± [ γ m i n , γ m a x ] . The dynamics for p H f experience a slight change and can be described as:
d p H f d t = i = 1 n X i γ i ω δ p H f b ( 2 b p H f )
Here, the expression differs from our previous models First, there is no p H i n , indicating that the environment does not change due to external factors; rather, the community itself is the only changing factor. Additionally, following [45], since multiple factors (species) influence the pH, a saturation term has been introduced that ensures that p H f remains within the range of [ 0 , 2 b ] (here b = 7 ).
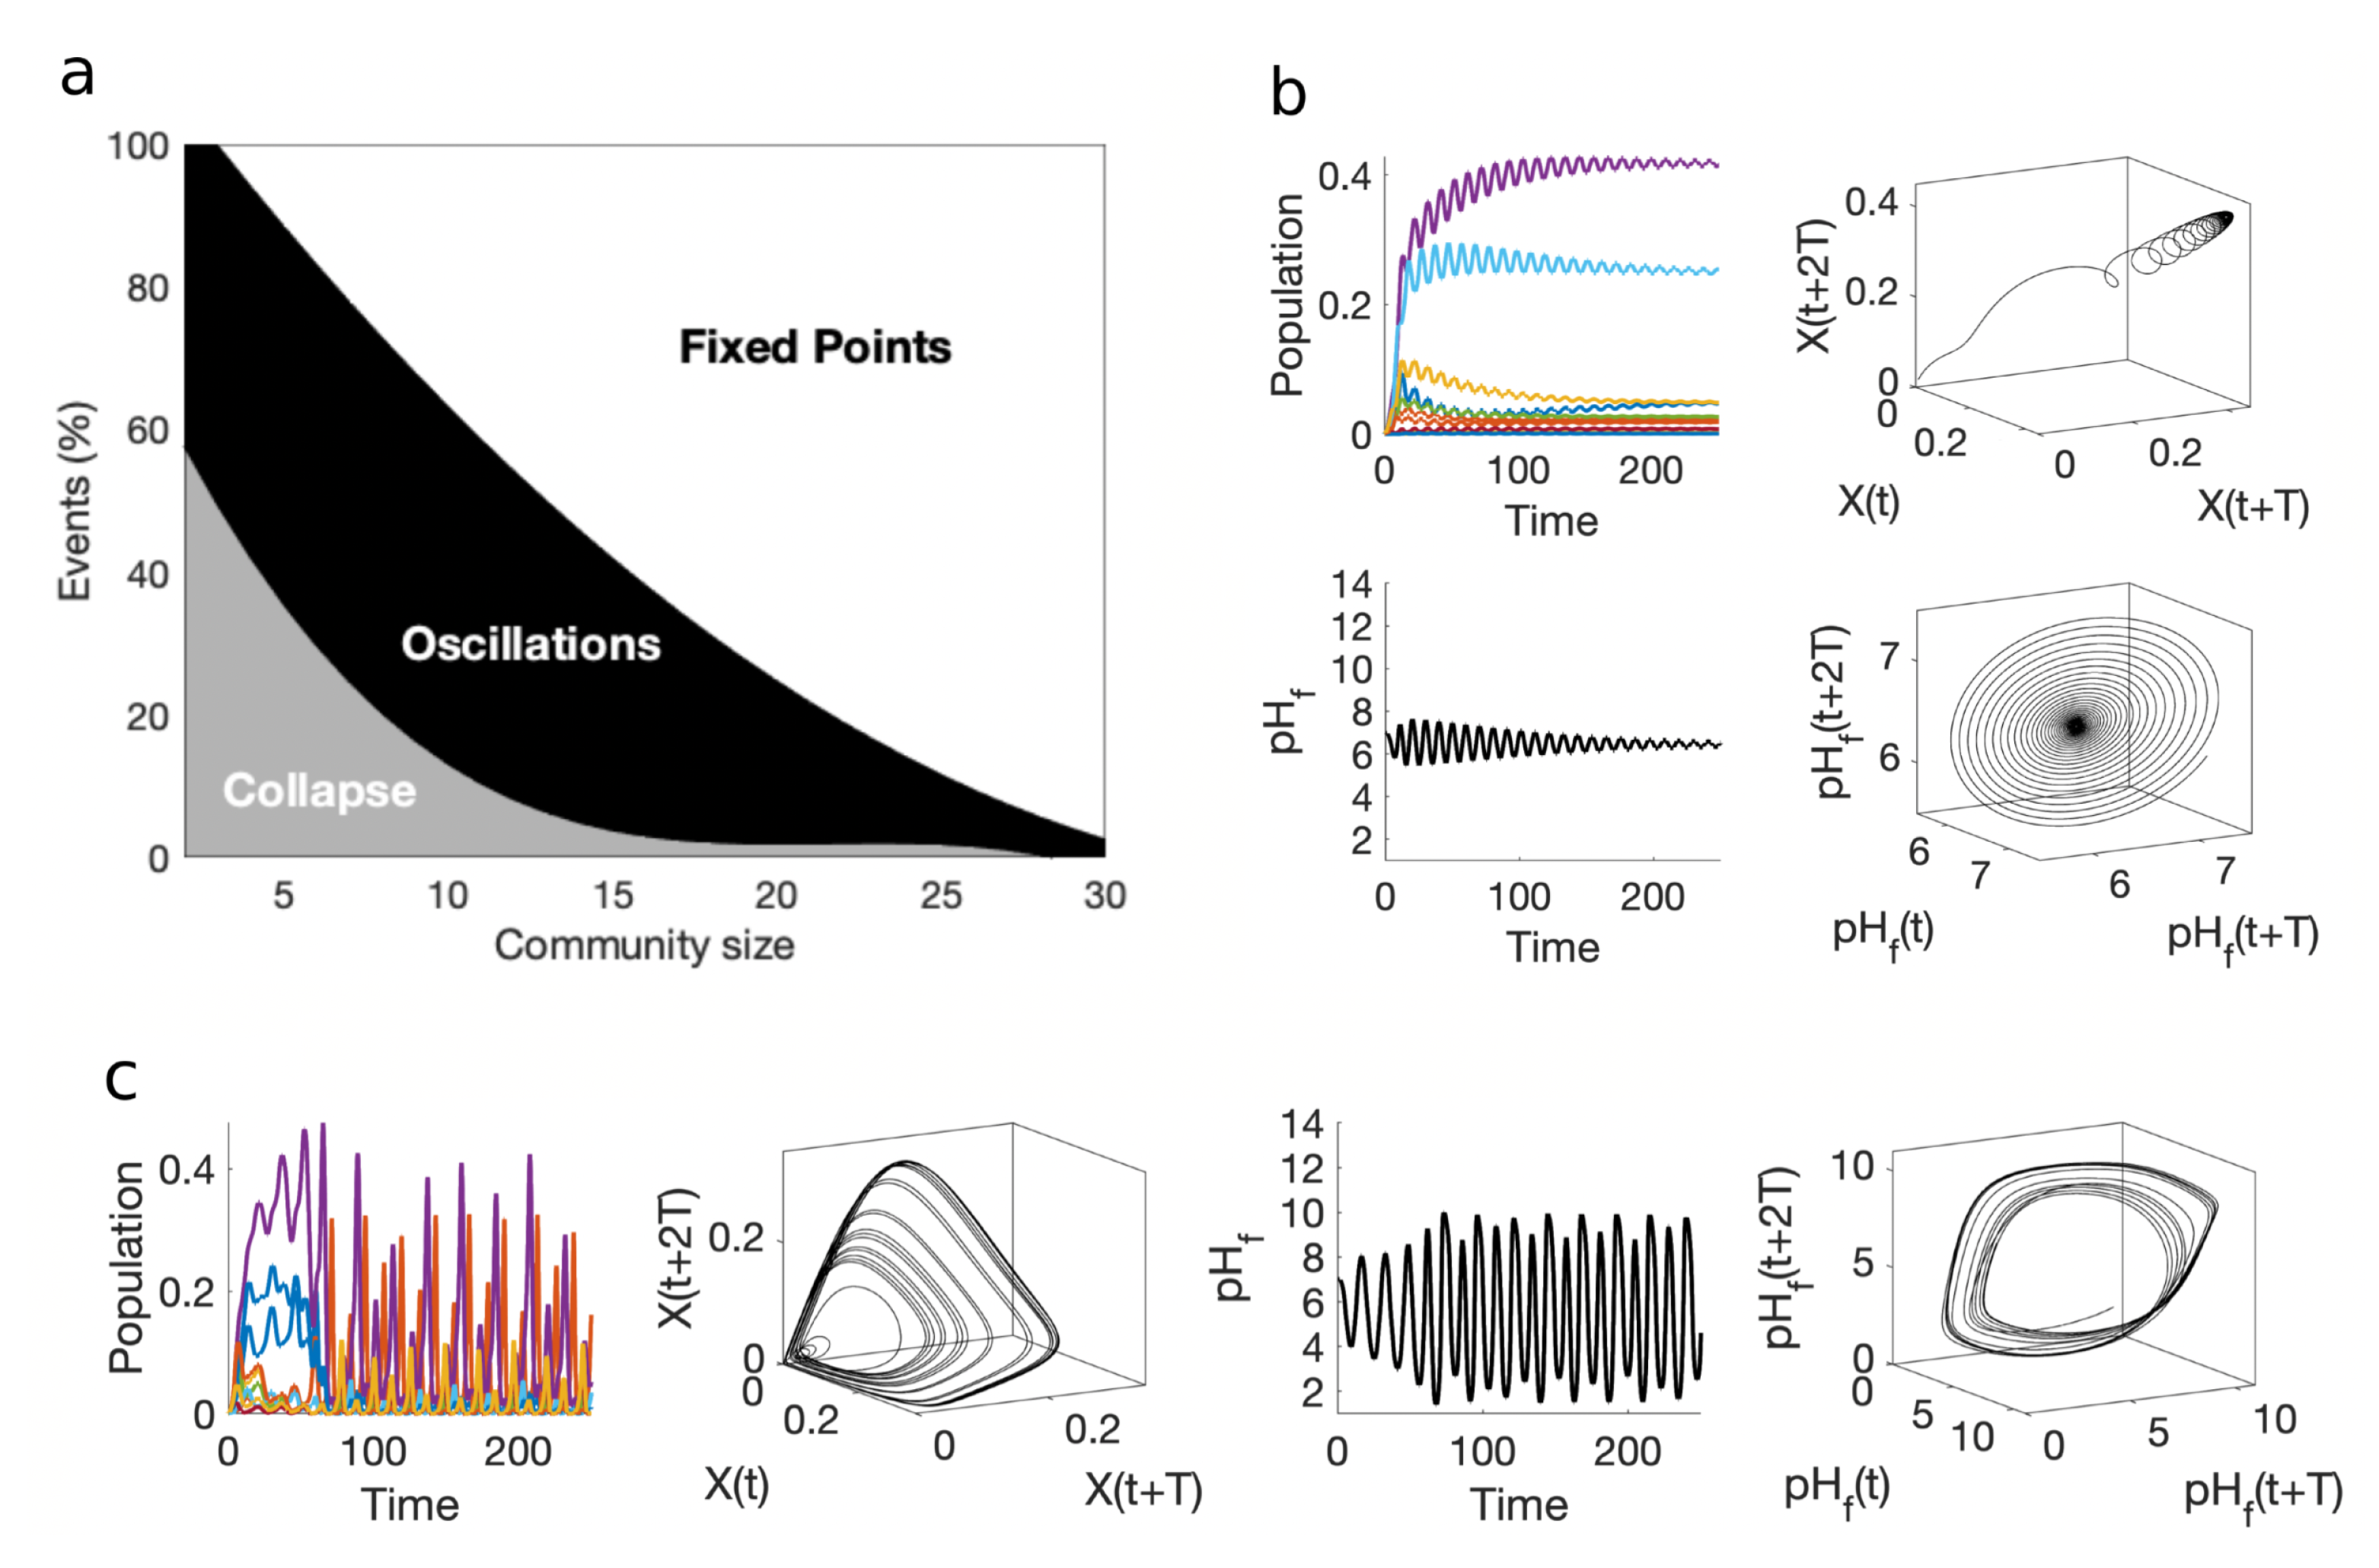
In order to characterise the general patterns of organization emerging from this high-dimensional set of equations, a statistical analysis of their dynamical behaviours has been performed, using different randomly generated communities. The analysis allows to see the frequency of different dynamical states as a function of diversity (Figure 4a). Following previous methods developed elsewhere [46], we use the number of species as a parameter to determine the likelihood to observe our final community in one of these three dynamical states: (a) stable point attractor, (b) oscillations and chaos and (c) collapse. These correspond to communities achieving populations that remain constant over time (after some transient), populations that exhibit deterministic fluctuations (either periodic, quasi periodic or chaotic) and finally those that experience extinction after a short initial instability.
Specifically, we used N = 50 different consortia are simulated for each community size (from n = 1 to n = 30 species), where each species parameters has been randomly generated within the intervals p H o p [ 4 , 9 ] , p H l i m = p H o p + [ 1 , 4 ] and γ [ 0.05 , 0.2 ] , δ = 0.1 , using ω = 1 and a small immigration factor of 0.001 . All species are set in an initial p H = 7 environment.
For each sampled model ecosystem, we discard a long transient to avoid non-stationary effects. Oscillatory or chaotic behaviour are found by looking at the amplitude variations of the time series of any of the species involved, and we do not distinguish among the different kinds of dynamics. Examples of both point attractors and fluctuating populations, along with the corresponding p H f time series are displayed in figures (b) and (c), respectively. We also display three-dimensional reconstructions of the underlying attractors. These are obtained by plotting the dynamics of one chosen species with a population X ( t ) on a delayed 3-d space using the vectors ( X ( t ) , x ( t + T ) , x ( t + 2 T ) using a time delay T [47,48].
The observed fractions of dynamical states as a function of diversity allow us to formulated a strong prediction: despite the dominant presence of communities experiencing collapse or displaying oscillatory behavior, increasing numbers of species have a suppressor effect, favouring point attractors. In other words: species diversity enhances the desired self-regulation effects associated with our original SDWM scenario. Further theoretical model should explore the origins of such diversity-stabilizing pattern.

4. Discussion

The Daisyworld model provides a rationale for a stable self-organized biosphere resulting from a feedback between living beings and their environment, which they modify in predictable ways. Despite (or perhaps because of) its simplicity, the DWM has been instrumental in developing the field of Earth Systems Science [26]. Can new synthetic ecosystems help further develop the field by allowing experimental testing on the test tube? Previous work on synthetic ecosystems, both in vivo and in silico, have considered communities that illustrate the success or failure of feedback control in microbial ecosystems. Examples include ecosystem-level nutrient recycling in the Flask model [49] or the potential for collapse (ecological suicide) in microbial communities where sustained modification of environmental pH by the microbes can end in their extinction [45]. Our proposal instead is that of an engineered biological system capable of self-adjusting itself under a given range of external parametric conditions, actively acting on stabilising a global environmental driver. This, in our view, represents a novel concept.
Synthetic biology has been developing as a unique way to interrogate nature while exploring alternative designs not present in the biological world. One particularly important path involves the construction of synthetic counterparts of well known ecological systems. Over the last decade such developments have been extended into some of the classic problems of theoretical ecology, from tipping points to multispecies stability. In this paper, we propose to move a step forward by mapping the modelling planetary self-regulation problem into our test-tube analogy. Our proposed system will allow experimental testing of the DWM proposal. Along with the standard two-component species regulation, the generality of the design is supported by the robustness of the system under the presence of a parasite, which typically acts as a destabiliser force in cooperative systems. Instead, in the SDW system parasites do not change the potential for pH self-regulation. Moreover, an important, specific prediction from our work is that diverse communities should act in a self-organized way by supressing wide fluctuations and guaranteeing the convergence to a global controlled pH.
There are several potential extensions of our work that are worth exploring. On one hand, the regulatory nature of the system described here can be extended to other systems beyond the ecological context considered here. One avenue is the potential of terraformation scenarios based on synthetic biology, where cooperative consortia might be required for a successful spread over large scales [51]. Another one concerns those physiological systems (such as glucose regulation by glucagon and insulin) that can be described in similar terms [52,53]. These "rein control" systems could be constructed synthetically and used to target given regulation goals within a model organism. Finally, we have not included a major player in Lovelock’s picture: evolutionary dynamics. The role played by evolution has been a matter of intense discussion within the context of the DWM [4,54] and we may wonder if some of these debates could be settle by evolving synthetic communities. Extensions of our model approach could guide future developments towards this goal.

Acknowledgments

This work was funded by grants FIS2016-77447-R MINECO/AEI/FEDER, an AGAUR 2021 SGR 00751. We thank Daniel Amor for insight into synthetic multispecies communities. VM thanks Dimitrije Ivancić and Nastassia Knödlseder for useful discussions. RS thanks the late Patrick Marcos-Nikolaus for introducing him to Vladimir Vernadsky’s work. Special thanks to the Santa Fe Institute, where this research was done and to David Krakauer, who allowed us to work in the monastery on the night shifts.

References

  1. Alberti, T. , Lepreti, F., Vecchio, A. and Carbone, V., 2018. On the stability of a climate model for an Earth-like planet with land-ocean coverage. Journal of Physics Communications 2, 065018. [CrossRef]
  2. Knoll, A.H. , 2015. Life on a young planet, Princeton University Press.
  3. Knoll, A.H. and Nowak, M.A., 2017. The timetable of evolution. Science advances 3, e1603076.
  4. Lenton, T. and Watson, A., 2013. Revolutions that made the Earth, OUP Oxford.
  5. Vernadsky, V.I. , 1998. The biosphere, Springer Science, New York.
  6. Lovelock, J. E. , 1972. Gaia as seen through the atmosphere. Atmos. Environ. 6, 579-580.
  7. Lovelock, J.E. and Margulis, L., 1974. Atmospheric homeostasis by and for the biosphere: the Gaia hypothesis. Tellus 26, 2-10. [CrossRef]
  8. Margulis, L. and Lovelock, J.E., 1974. Biological modulation of the Earth’s atmosphere. Icarus 21, 471-489. [CrossRef]
  9. Lovelock, J. , 2016. Gaia: A new look at life on earth, Oxford University Press.
  10. Adams, B. , Carr, J., Lenton, T.M. and White, A., 2003. One-dimensional daisyworld: spatial interactions and pattern formation. Journal of theoretical biology 223, 505-513. [CrossRef]
  11. Ackland, G. J. , Clark, M. A. and Lenton, T. M., 2003. Catastrophic desert formation in Daisyworld. Journal of theoretical biology 223, 39-44. [CrossRef]
  12. Ackland, G.J. and Wood, A.J., 2010. Emergent patterns in space and time from daisyworld: a simple evolving coupled biosphere?climate model. Philosophical Transactions of the Royal Society A 368, 161-179. [CrossRef]
  13. Punithan, D. , Kim, D.K. and McKay, R.B., 2012. Spatio-temporal dynamics and quantification of daisyworld in two-dimensional coupled map lattices. Ecological complexity 12, 43-57. [CrossRef]
  14. Mackwell, S.J. , Simon-Miller, A.A., Harder, J.W. and Bullock, M.A. eds., 2014. Comparative climatology of terrestrial planets, University of Arizona Press.
  15. Murante, G. , Provenzale, A., Vladilo, G. et al, 2020. Climate bistability of Earth-like exoplanets. Monthly Notices of the Royal Astronomical Society 492, 2638-2650. [CrossRef]
  16. Shou, W. , Ram, S. and Vilar, J.M., 2007. Synthetic cooperation in engineered yeast populations. Proceedings of the National Academy of Sciences 104 1877–1882. [CrossRef]
  17. Amor, D.R. , Montanez, R., Duran-Nebreda, S. and Solé, R., 2017. Spatial dynamics of synthetic microbial mutualists and their parasites. PLOS Computational Biology 13, e1005689. [CrossRef]
  18. Balagadde, F.K. , Song, H., Ozaki, J., Collins, C.H., Barnet, M., Arnold, F.H., Quake, S.R. and You, L., 2008. A synthetic Escherichia coli predator?prey ecosystem. Molecular systems biology 4, 87. [CrossRef]
  19. Mee, M.T. and Wang, H.H., 2012. Engineering ecosystems and synthetic ecologies. Molecular BioSystems 8, 2470-2483. [CrossRef]
  20. Johns, N.I. , Blazejewski, T., Gomes, A.L. and Wang, H.H., 2016. Principles for designing synthetic microbial communities. Current Opinion in Microbiology 31, 146-153. [CrossRef]
  21. Hu, J. , Amor, D.R., Barbier, M., Bunin, G. and Gore, J., 2022. Emergent phases of ecological diversity and dynamics mapped in microcosms. Science 378, 85-89. [CrossRef]
  22. Watson, A.J. and Lovelock, J.E., 1983. Biological homeostasis of the global environment: the parable of Daisyworld. Tellus B 35, 284-289. [CrossRef]
  23. Lenton, T.M. and Lovelock, J.E., 2001. Daisyworld revisited: quantifying biological effects on planetary self?regulation. Tellus B 53, 288-305. [CrossRef]
  24. Lenton, T.M. , Daines, S.J., Dyke, J.G., Nicholson, A.E., Wilkinson, D.M. and Williams, H.T., 2018. Selection for Gaia across multiple scales. Trends in Ecology and Evolution 33, 633-645. [CrossRef]
  25. Lovelock, J.E. and Watson, A.J., 1982. The regulation of carbon dioxide and climate: Gaia or geochemistry. Planetary and Space Science 30, 795-802. [CrossRef]
  26. Steffen, W. , Richardson, K., Rockstrm, J., Schellnhuber, H.J., Dube, O.P., Dutreuil, S., Lenton, T.M. and Lubchenco, J., 2020. The emergence and evolution of Earth System Science. Nature Reviews Earth Environment 1, 54-63. [CrossRef]
  27. Wilkinson, D.M. , 2003. Catastrophes on daisyworld. Trends in Ecology and Evolution 18, 266-268. [CrossRef]
  28. Wood, A.J. , Ackland, G.J., Dyke, J.G., Williams, H.T. and Lenton, T.M., 2008. Daisyworld: A review. Reviews of Geophysics, 46(1). [CrossRef]
  29. Li, C. , Gao, X., Peng, X. et al. 2020. Intelligent microbial cell factory with genetic pH shooting (GPS) for cell self-responsive base/acid regulation. Microbial Cell Factories, 19, 1-13. [CrossRef]
  30. Lambert, R.J. , 2011. A new model for the effect of pH on microbial growth: an extension of the Gamma hypothesis. Journal of applied microbiology 110, 61-68. [CrossRef]
  31. Presser, K.A. , Ratkowsky, D.A. and Ross, T., 1997. Modelling the growth rate of Escherichia coli as a function of pH and lactic acid concentration. Applied and environmental microbiology 63, 2355-2360. [CrossRef]
  32. Lambert, R.J.W. and Pearson, J., 2000. Susceptibility testing: accurate and reproducible minimum inhibitory concentration (MIC) and non-inhibitory concentration (NIC) values. Journal of applied microbiology 88, 784-790. [CrossRef]
  33. Lv, X. , Hueso-Gil, A., Bi, X., Wu, Y., Liu, Y., Liu, L. and Ledesma-Amaro, R., 2022. New synthetic biology tools for metabolic control. Current Opinion in Biotechnology 76, 102724. [CrossRef]
  34. Kambale, S.D. , George, S. and Zope, R.G., 2015. Controllers used in pH neutralization process: a review. IRJET, 2, 354-61.
  35. Mikami, Y. , Yoneda, H., Aoki, W. and Ueda, M., 2017. Ammonia production from amino acid-based biomass-like sources by engineered Escherichia coli. AMB Expr, 7-83. [CrossRef]
  36. Núñez, M.F. , Kwon, O., Wilson, T.H., Aguilar, J., Baldoma, L. and Lin, E.C.C., 2017. Transport of L-Lactate, D-Lactate, and Glycolate by the LldP and GlcA Membrane Carriers of Escherichia coli. Biochemical and Biophysical Research Communications 290, 824-829. [CrossRef]
  37. de la Plaza, M. , Peláez, C. and Requena, T., 2009. Regulation of α-Ketoisovalerate Decarboxylase Expression in Lactococcus lactis IFPL730. J Mol Microbiol Biotechnol 17:96-100. [CrossRef]
  38. Reifenrath, M. and Boles, E., 2018. A superfolder variant of pH-sensitive pHluorin for in vivo pH measurements in the endoplasmic reticulum. Scientific Reports 8:11985. [CrossRef]
  39. Hartmann, F.S.F. , Weiss, T., Shen, J., Smahajcsik, D., Savickas, S. and Seibold, G.M., 2022. Visualizing the pH in Escherichia coli colonies via the sensor protein mCherryEA allows high-throughput screening of mutant libraries. Msystems 7, e00219-22. [CrossRef]
  40. Smith J., M. 1979. Hypercycles and the origin of life. Nature, 280, 445-446.
  41. Boerlijst M., C. and Hogeweg P. 1991. Spiral wave structure in pre-biotic evolution: hypercycles stable against parasites. Physica D 48, 17-28. [CrossRef]
  42. Sardanyes, J. and Solé R. (2007). Spatio-temporal dynamics in simple asymmetric hypercycles under weak parasitic coupling. Physica D 231, 116-129. [CrossRef]
  43. Sneppen, K. , 2014. Models of life, Cambridge University Press.
  44. Munch, S.B. , Rogers, T.L., Johnson, B.J., Bhat, U. and Tsai, C.H., 2022. Rethinking the prevalence and relevance of chaos in ecology. Annual Review of Ecology, Evolution, and Systematics, 53, pp.227-249. [CrossRef]
  45. Ratzke, C. and Gore, J., 2018. Modifying and reacting to the environmental pH can drive bacterial interactions. PLoS biology, 16(3), p.e2004248. [CrossRef]
  46. Maull, V. and Solé, R., 2022. Network-level containment of single-species bioengineering. Philosophical Transactions of the Royal Society B, 377(1857), p.20210396. [CrossRef]
  47. NH Packard, JP Crutchfield, JD Farmer, RS Shaw (1980) Geometry from a time series. Physical Review Letters 45, 712. [CrossRef]
  48. Schaffer, W.M. , 1985. Order and chaos in ecological systems. Ecology, 66(1), pp.93-106. [CrossRef]
  49. Williams, H.T. and Lenton, T.M., 2007. The Flask model: emergence of nutrient?recycling microbial ecosystems and their disruption by environment?altering OrebelOorganisms. Oikos, 116(7), pp.1087-1105. [CrossRef]
  50. Ratzke, C. , Denk, J. and Gore, J., 2018. Ecological suicide in microbes. Nature ecology and evolution, 2(5), pp.867-872. [CrossRef]
  51. Conde-Pueyo, N. , Vidiella, B., Sardanyés, J., Berdugo, M., Maestre, F.T., De Lorenzo, V. and Solé, R., 2020. Synthetic biology for terraformation lessons from mars, earth, and the microbiome. life, 10(2), p.14. [CrossRef]
  52. Saunders, P.T. , Koeslag, J.H. and Wessels, J.A., 1998. Integral rein control in physiology. Journal of Theoretical Biology, 194(2), pp.163-173. [CrossRef]
  53. Saunders, P.T. ., Koeslag, J.H. and Wessels, J.A., 2000. Integral rein control in physiology II: a general model. Journal of Theoretical Biology, 206(2), pp.211-220. [CrossRef]
  54. Lenton, T.M. , 1998. Gaia and natural selection. Nature 394, 439-447. [CrossRef]
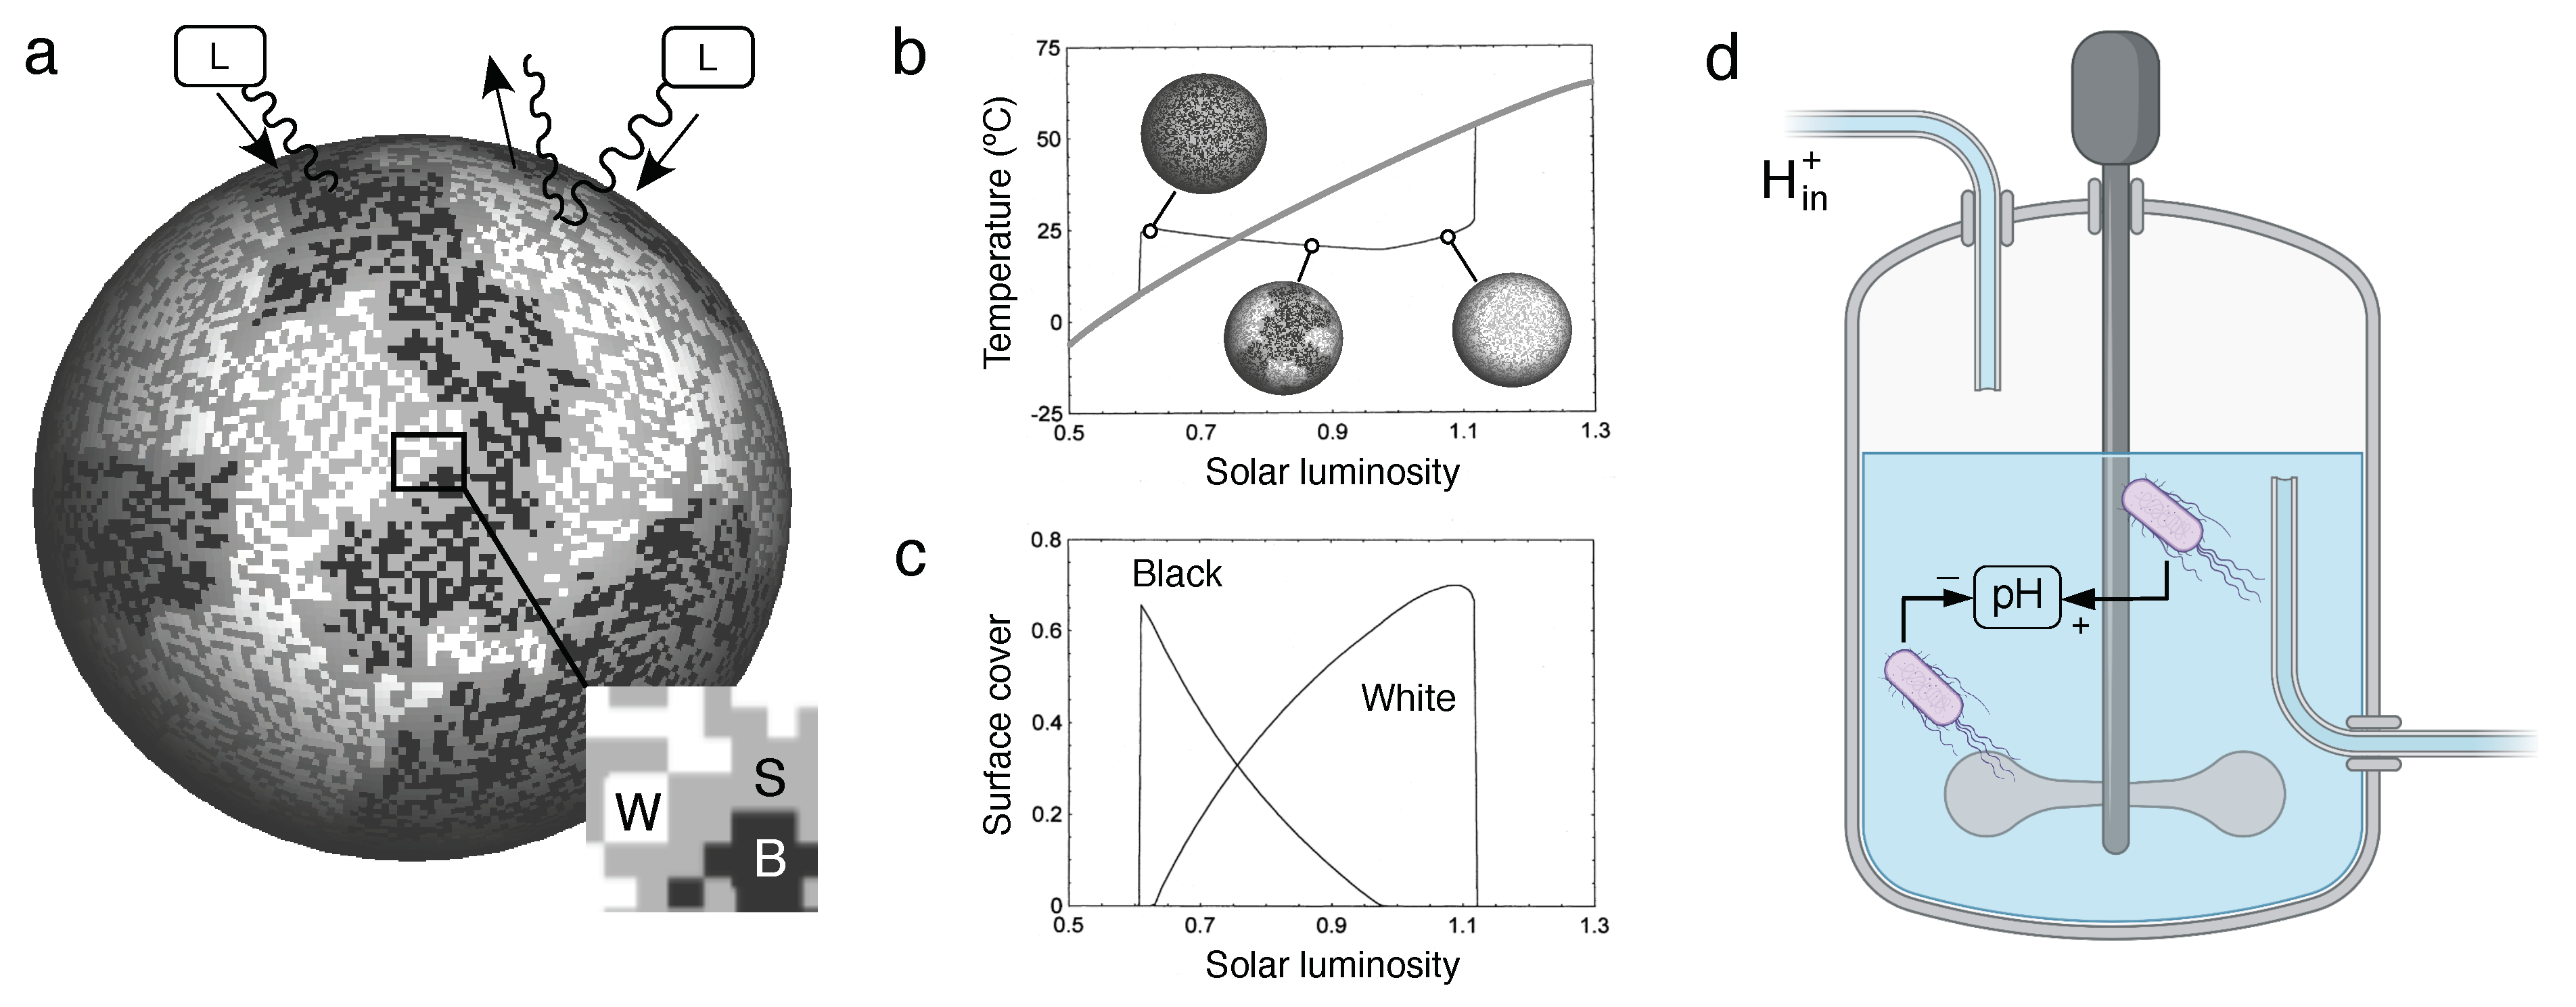
Figure 1. The conceptual feedbacks in the Watson-Lovelock model (WLM)l. Using a two-dimensional surface (a), increasing levels of solar luminosity L trigger the growth (after a threshold) of two populations of plants, indicated as B and W (white and black squares, grey squares stand for bare soil S, see inset on the left bottom, using a zoom on the area indicated). These are identified as black and white daisies, respectively, in the HGM. Opposite feedbacks emerge from the effects of albedo by the two kinds of daisies. As a consequence of these nonlinear couplings, as shown in (b), the planet temperature can be stabilised (instead of just simply growing with L, grey line) ver a wide range of L values, thus indicating a homeostatic response due too the biosphere-climate system. Such stabilization is obtained by means of population arrangements between W and B states (c). In this paper, an equivalent system is proposed (d) using a bioreactor where an external input is also present ( H i n + ) that would rise the pH of the medium, unless feedback controls ae present. In this case, two different strains of bacteria able to increase or decrease pH would replace the daisies.
Preprints 80785 g001
Figure 2. The synthetic microbial Daysyworld. The logic of the zero-dimensional (non-spatial) DWM is summarised in (a) in terms of the interactions between planetary temperature and the distinct role played by the two kinds of daisies (B and W). Using our framework, where acidity would be the controlled variable a similar logic of feedback loops can be described (b) where now two microbial populations would also reduce or increase local acidity. The whole design, including the corresponding genetic constructs, is depicted in (c).
Preprints 80785 g002
Figure 3. Steady state surface for the synthetic Daisyworld are depicted using equations (4-5). The flat surface displayed in (a) corresponds to the self-regulation illustrating dynamics of the SMDW. The relationship between p H i n and p H f is presented against γ . When γ = 0 , neither base nor acid production occurs, resulting in the absence of regulation and a linear increase in p H f with the external input. Conversely, as γ increases, a diverse range of controlled p H values emerges, expanding the homeostatic region of optimal p H . In (b) one section to the surface at γ = 0.04 is made, showing the broad domain of self-regulation surrounded by the collapse domains. The corresponding abundances of each synthetic strain are displayed in (c). X a stands for acid-producing species and X b for base-producing. Here we used: γ [ 0 , 0.05 ] , δ = 0.01 , ω = 0.5 and both species utilize p H o p t = 7 and p H l i m = 9 .
Preprints 80785 g003
Figure 4. Effects of parasitism (using equations (17-19) on self-regulation domains. In (a), the relationship between p H i n and p H f is displayed against α as a control parameter, weighting the parasite advantage relative to the regulating species. In (b), the relationship between p H i n and p H f is shown for parasites with p H o p [ 3 , 11 ] and p H l i m = p H o p + 2.5 are introduced, with α = 1 . The sections obtained from the vertical planes cutting through both surfaces are depicted in (c-e). The three cases correspond (for α = 1 ) parasite optima values of (c) p H o p = 7 , (d) p H o p = 4 and (e) p H o p = 10 . The corresponding population abundances are depicted on the right column. The remaining parameters are the same as those used in Figure 3.
Preprints 80785 g004
Figure 5. Statistical analysis and specific examples are illustrated for the multispecies case-study. Three different final outcomes are obtained, as summarised in (a): extinction due to collapse an failure of regulation, oscillatory, quasiperodic or chaotic fluctuations (black) and self-regulating communities displaying constant values after a ransient. Although chaotic, oscillatory and collapse states are frequent at low-species numbers, they become rare as diversity increases. Two examples of stable (b) and chaotic (c) communities are also shown. In both cases we show the time series of populations, the reconstructed attractor of one of them, the pH time series and its reconstructed attractor are displayed. The population and pH dynamics for case (c) define strange, chaotic attractors.
Preprints 80785 g005
Disclaimer/Publisher’s Note: The statements, opinions and data contained in all publications are solely those of the individual author(s) and contributor(s) and not of MDPI and/or the editor(s). MDPI and/or the editor(s) disclaim responsibility for any injury to people or property resulting from any ideas, methods, instructions or products referred to in the content.
Copyright: This open access article is published under a Creative Commons CC BY 4.0 license, which permit the free download, distribution, and reuse, provided that the author and preprint are cited in any reuse.
Prerpints.org logo

Preprints.org is a free preprint server supported by MDPI in Basel, Switzerland.

Subscribe

© 2024 MDPI (Basel, Switzerland) unless otherwise stated