2.1. Macroscopic Behavior and Determination of Threshold Temperature
As in reference,35 we focus on aqueous mixtures of 12-HSA and SA molecules with an overall content of 2wt% of fatty acids that are solubilized in water thanks to the use of ethanolamine as counterion with a molar ratio surfactant/counter ion r of 0.2. The ratio of 12-HSA to the total concentration of fatty acids R defined as R=n12HSA/(nSA+n12HSA) is probed over the full range varying from R = 0 to R = 1. As described in the Materials and Methods section, the protocol enabling the solubilization of stock solutions of both SA and 12-HSA in water in presence of ethanolamine always involve a step where the fatty acid/ethanolamine mixture is heated at 70°C. The pH of the samples is 10.85 ± 0.15 in H2O, meaning that all the fatty acids bear a carboxylate head.35 The solutions are then macroscopically limpid with an apparent viscosity close to that of water. This behavior is consistent with literature that shows that either SA8 or 12-HSA28 are self-assembled in small micelles at such temperature. The stock solutions are then mixed at 70°C to reach the targeted R. The mixtures stay limpid and not viscous after this final mixing step for every R under scrutiny.
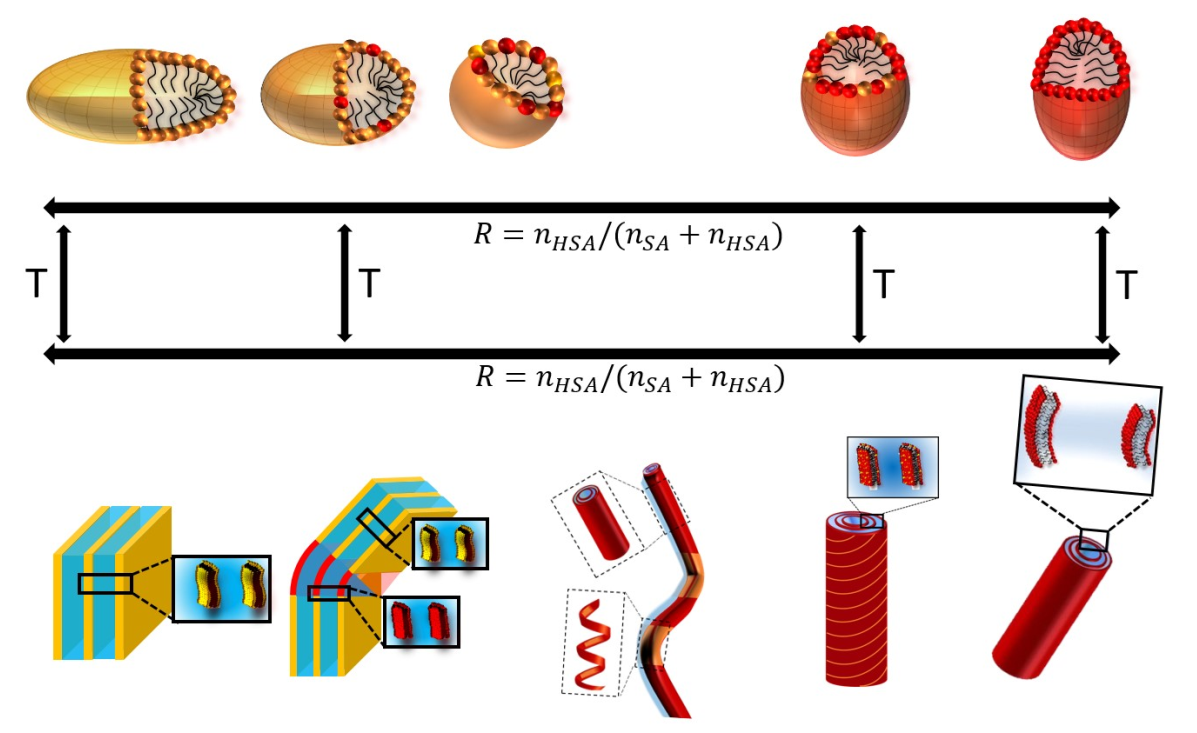
When the mixtures are cooled down to 20°C, they undergo a transition from limpid to turbid, along with an increase of viscosity, at a given temperature that depends on R. The turbidity and change of viscosity arise from the formation of multilamellar self-assemblies of different geometries (planar lamellar phases, multilamellar tubes or supramolecular assemblies containing both of them) that are large enough to scatter visible light.
35 The temperature of transition threshold between the limpid and turbid phases, as identified by visual inspection, depends however strongly on R. In order to determine it and establish the macroscopic state diagram of the system, we have measured the transmittance
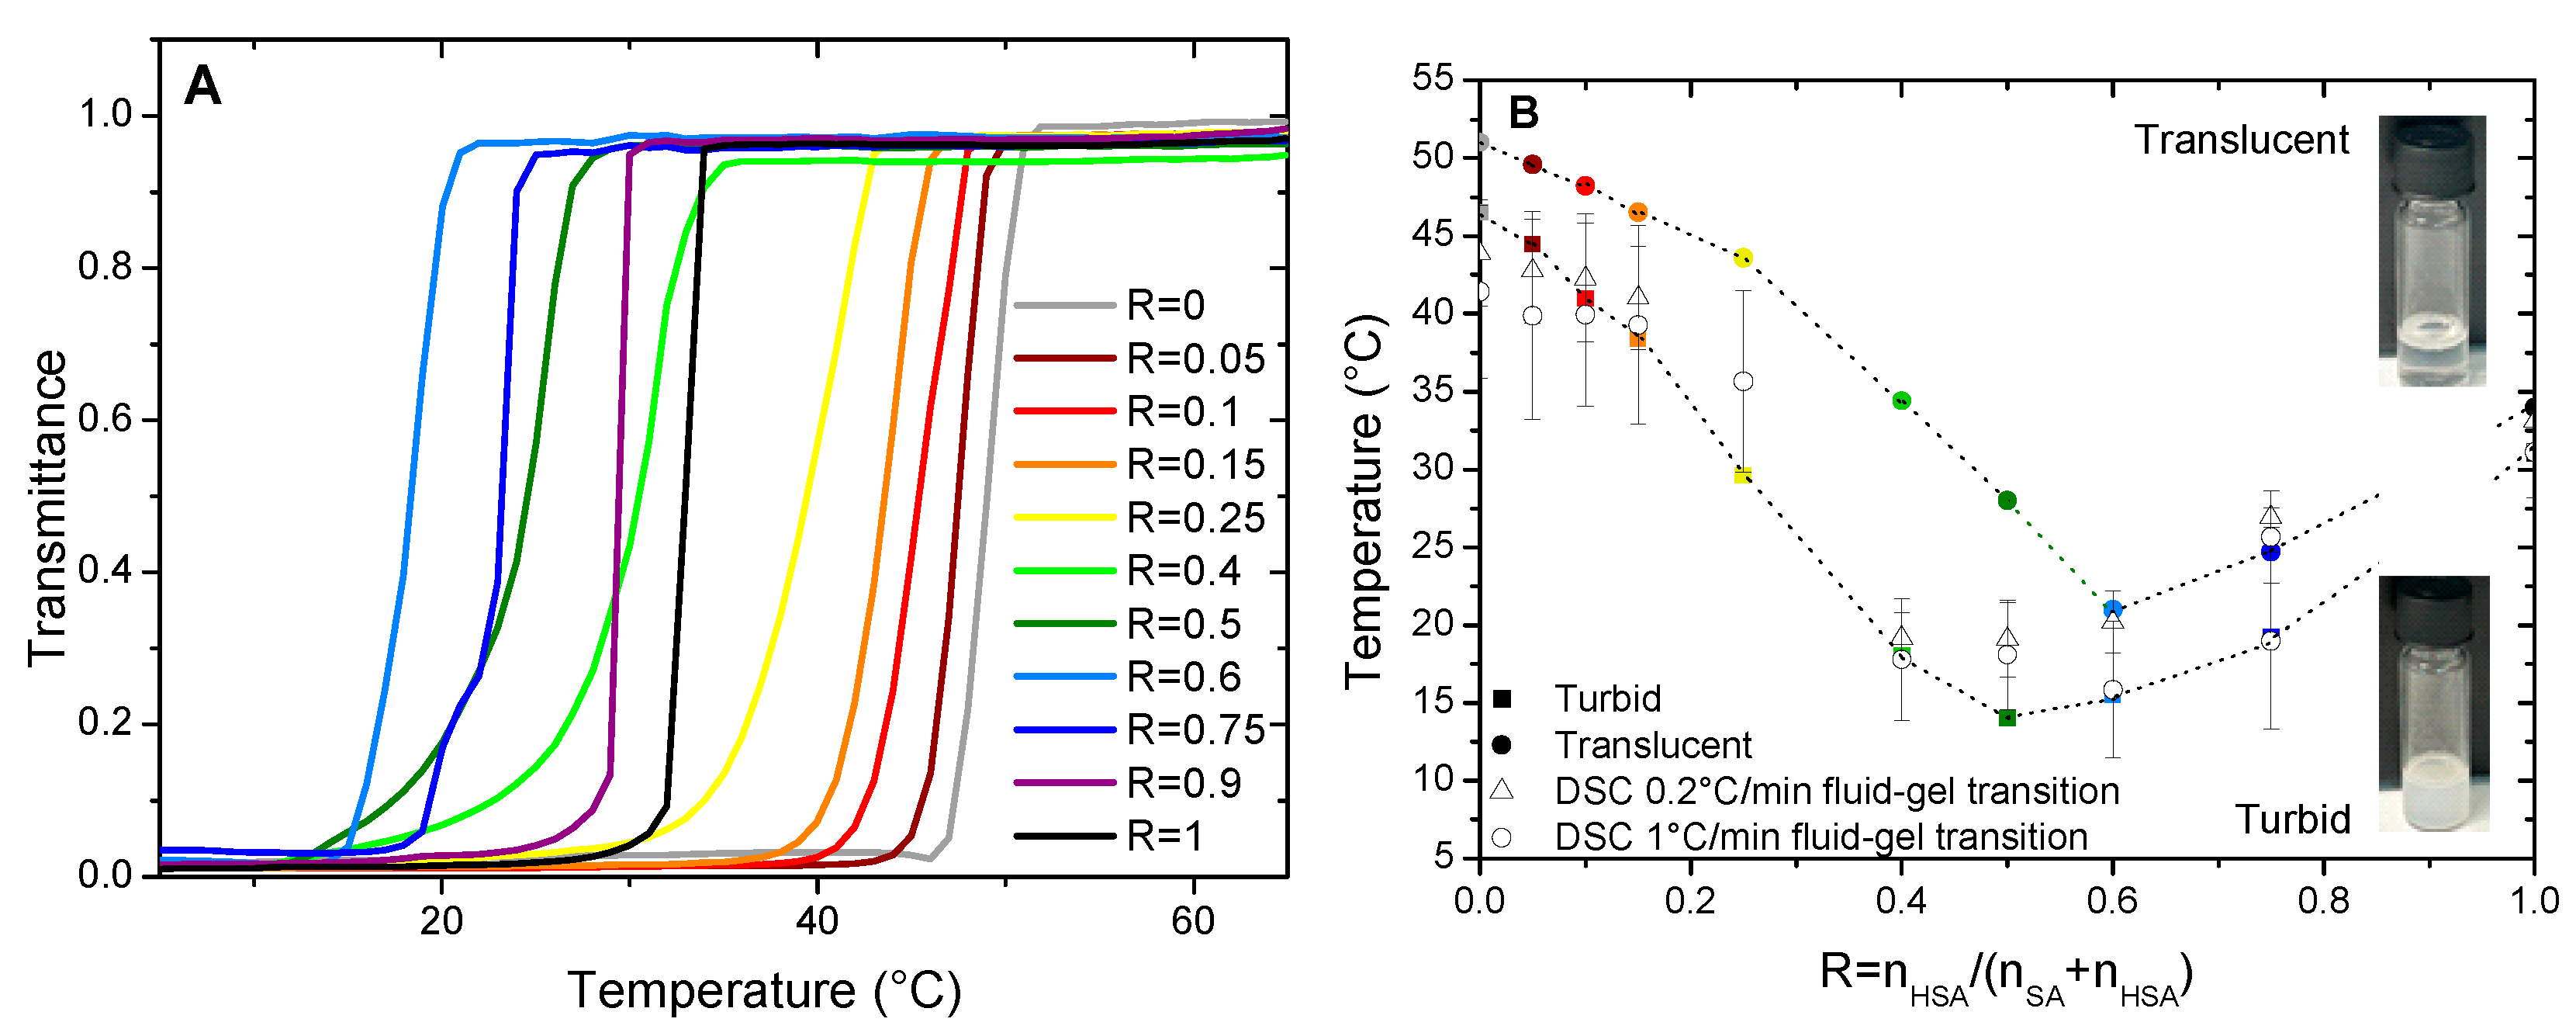
T of the samples at 450 nm on a UV-Vis spectrometer as function of temperature. Whatever the sample, T does not decrease sharply from 100% to 0% at a well-defined temperature upon cooling but over a temperature range of a several degrees with a magnitude that depends on the cooling rate. The lower the cooling rate, the sharper is the transition (compare
Figure 1A obtained with the ramp of 0.2°C/min with
Figure S1 obtained with the ramp of 1°C/min). Besides, the onset temperature of appearance of turbidity is as high as the cooling rate is low. The measurement of
T over a cooling/heating cycle also shows a strong hysteresis with an onset of appearance of turbidity at a lower temperature during the initial cooling step than for the following heating step (see
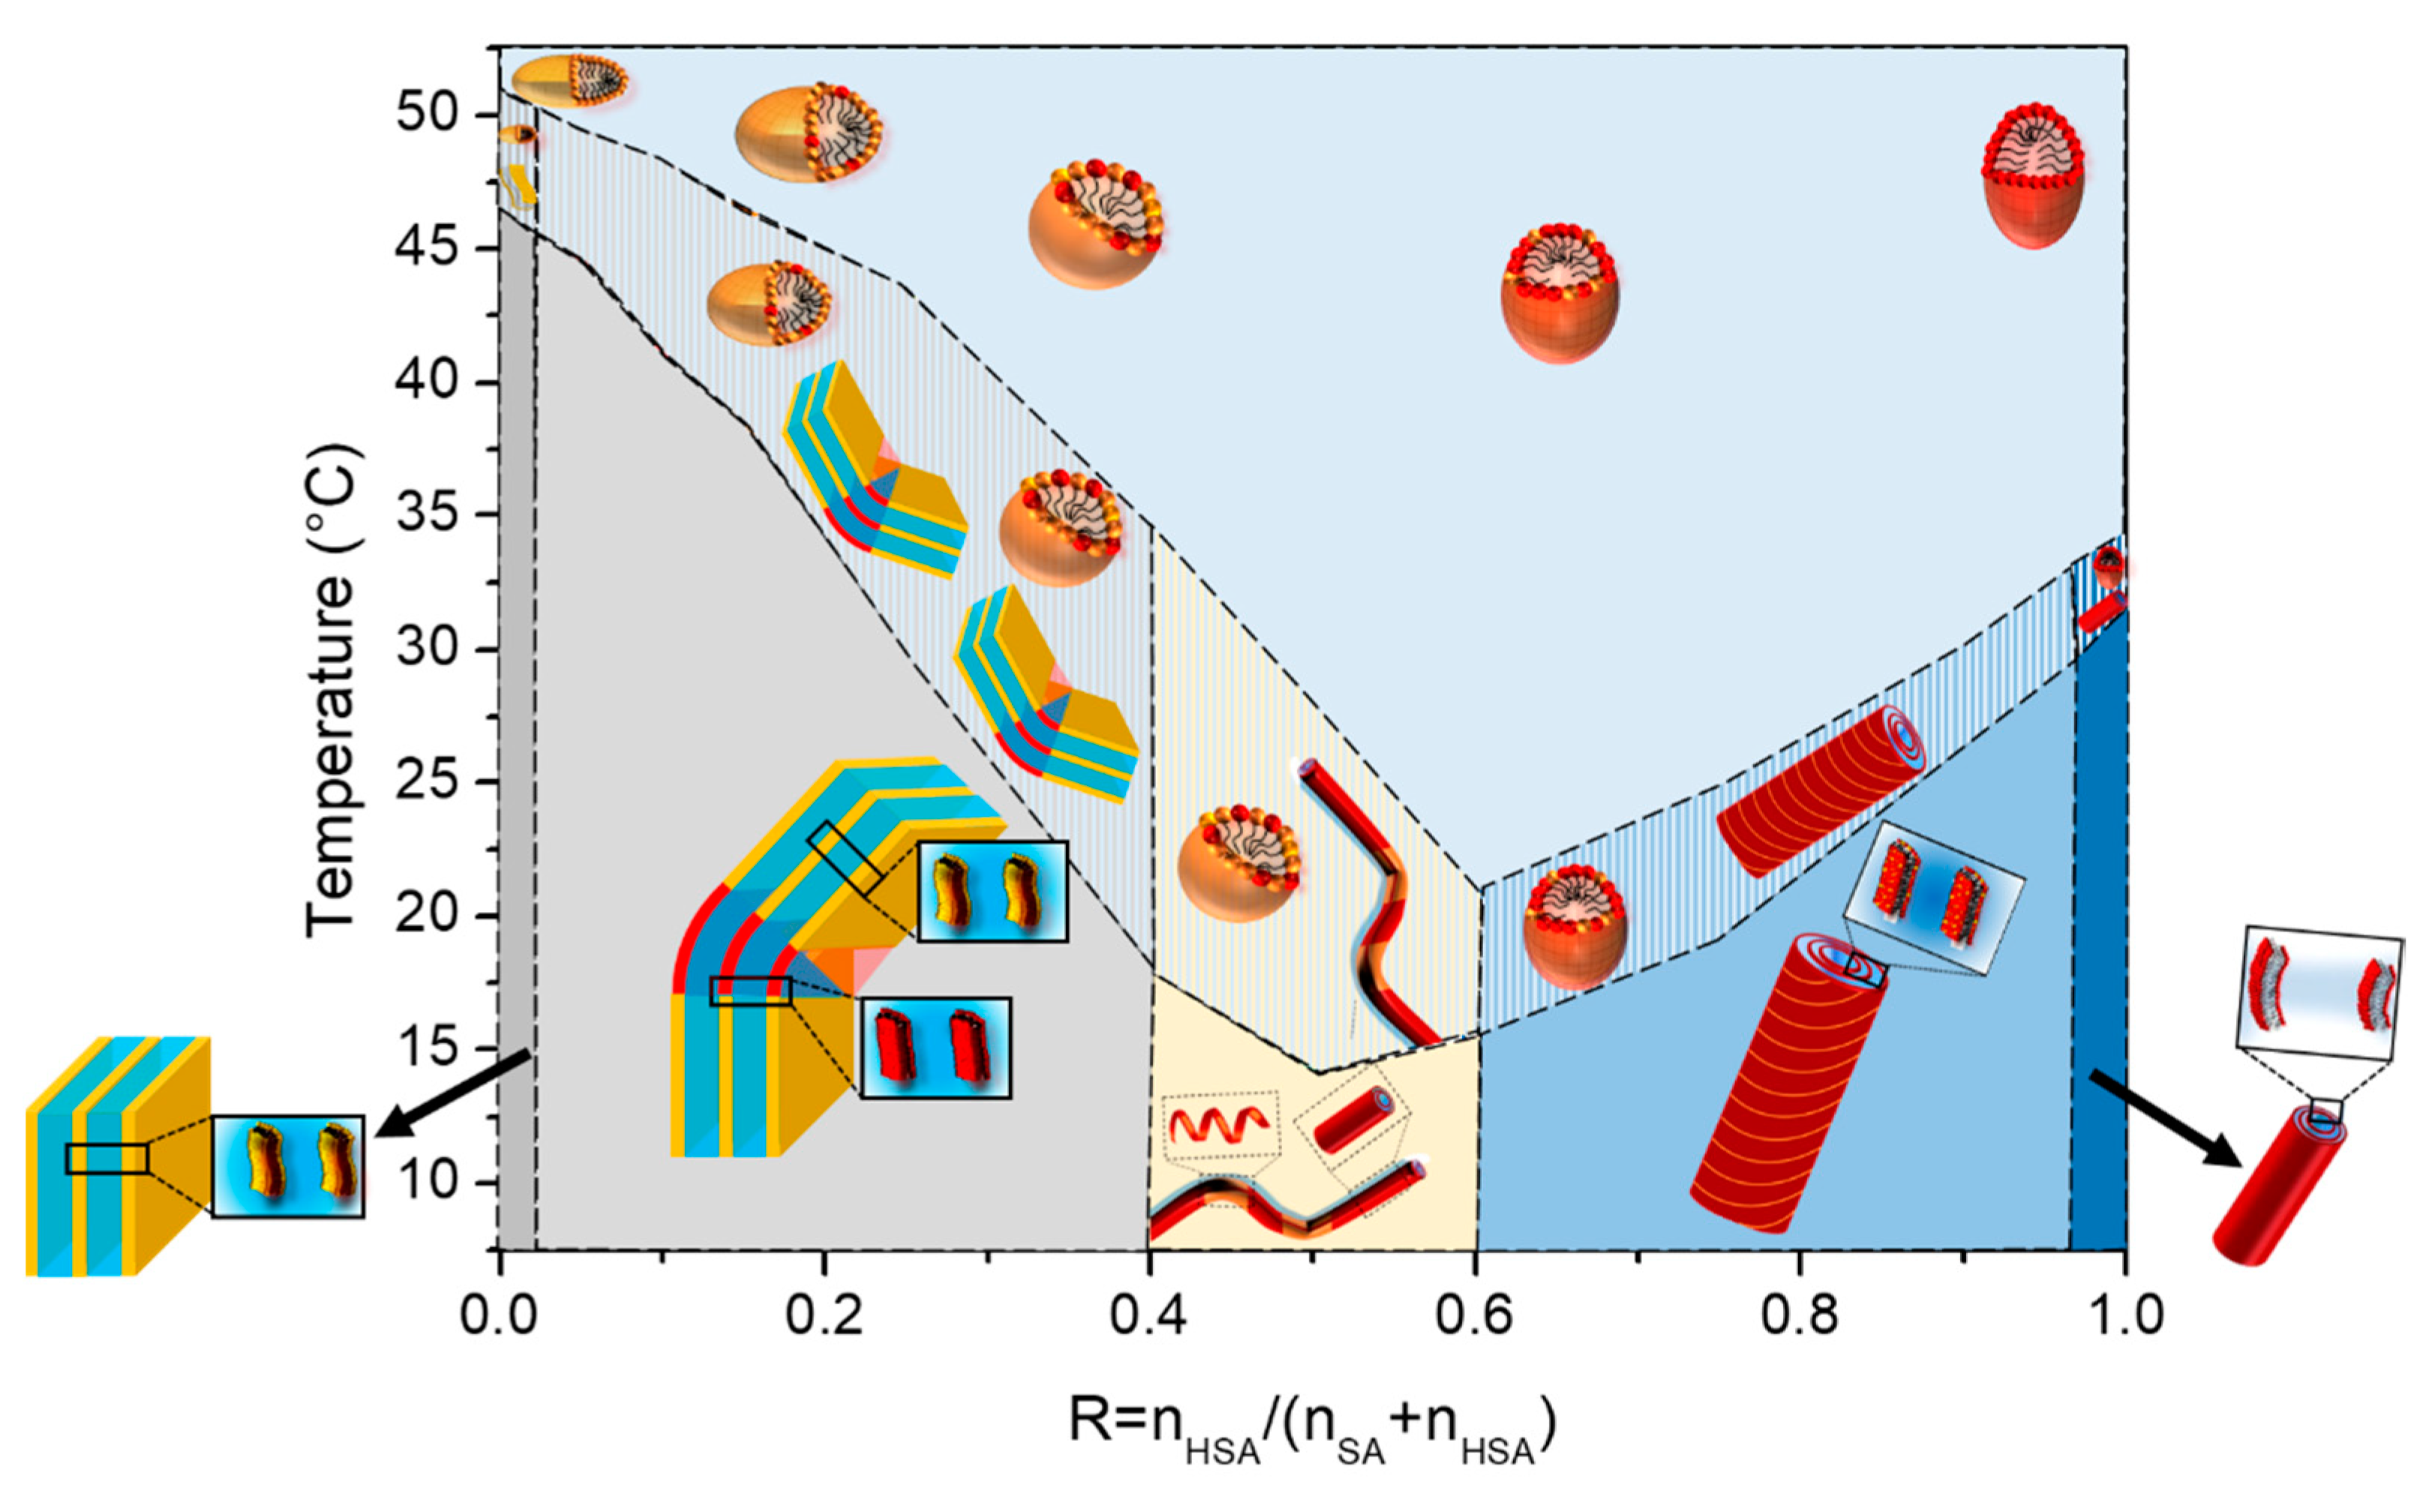
Figure S2). It takes thus an important time for the system to reach a steady state close to equilibrium. The transition appears thus to occur over an extended range of temperature where some self-assembled objects that scatter light coexist with some other ones that do not. The measurements obtained at the lowest cooling rate allow to build a state diagram for the system that is divided into 3 regions (
Figure 1B): at low temperature the turbid phase; at intermediate temperature the regime where the phase transition takes place; and the translucent phase at high temperature. It is likely that the intermediate region of coexistence is only a kinetic feature and would vanish it the state diagram would have been built with an infinitely slow cooling rate. The turbid/transition threshold corresponds to the temperature where transmittance
T falls to 0 and the transition/translucent one to the temperature where
T starts to decrease from 1.
For the pure HSA solution (R = 1), the onset of appearance of turbidity occurs at 35°C, in accordance with reference29 where the temperature of the micelles/multilamellar tube transition was determined at such temperature for an r of 0.2. The temperature threshold occurs by contrary at a much larger temperature close to 51°C for the pure SA system at R = 0 which is consistent with the value obtained by Xu and collaborators8 in which the reported temperature of transition is 50°C. In between, three different regimes can be identified as function of R. At large content in SA (from R=0.05 to R=0.25) the transition temperature decreases slightly and continuously from the R = 0 case upon the progressive introduction of HSA molecules, with an overall decrease of about 7°C. Symmetrically, at large content in HSA (from R=0.9 to R=0.75), the transition temperature slightly decreases upon the progressive introduction of SA molecules; with an overall decrease of about 10°C from the R = 1 case. At intermediate R, the transition temperature drops strongly upon increase of R, with a decrease of ~ 15°C from R=0.25 to R=0.4 - R=0.6, in order to bridge the two regimes of temperature threshold where one of the two fatty acids is in large excess. It is worth noting that the phase transition occurs over a much larger temperature range for such regime of intermediate ratio R where it is more difficult for the system to reach equilibrium.
2.2. DSC Measurements
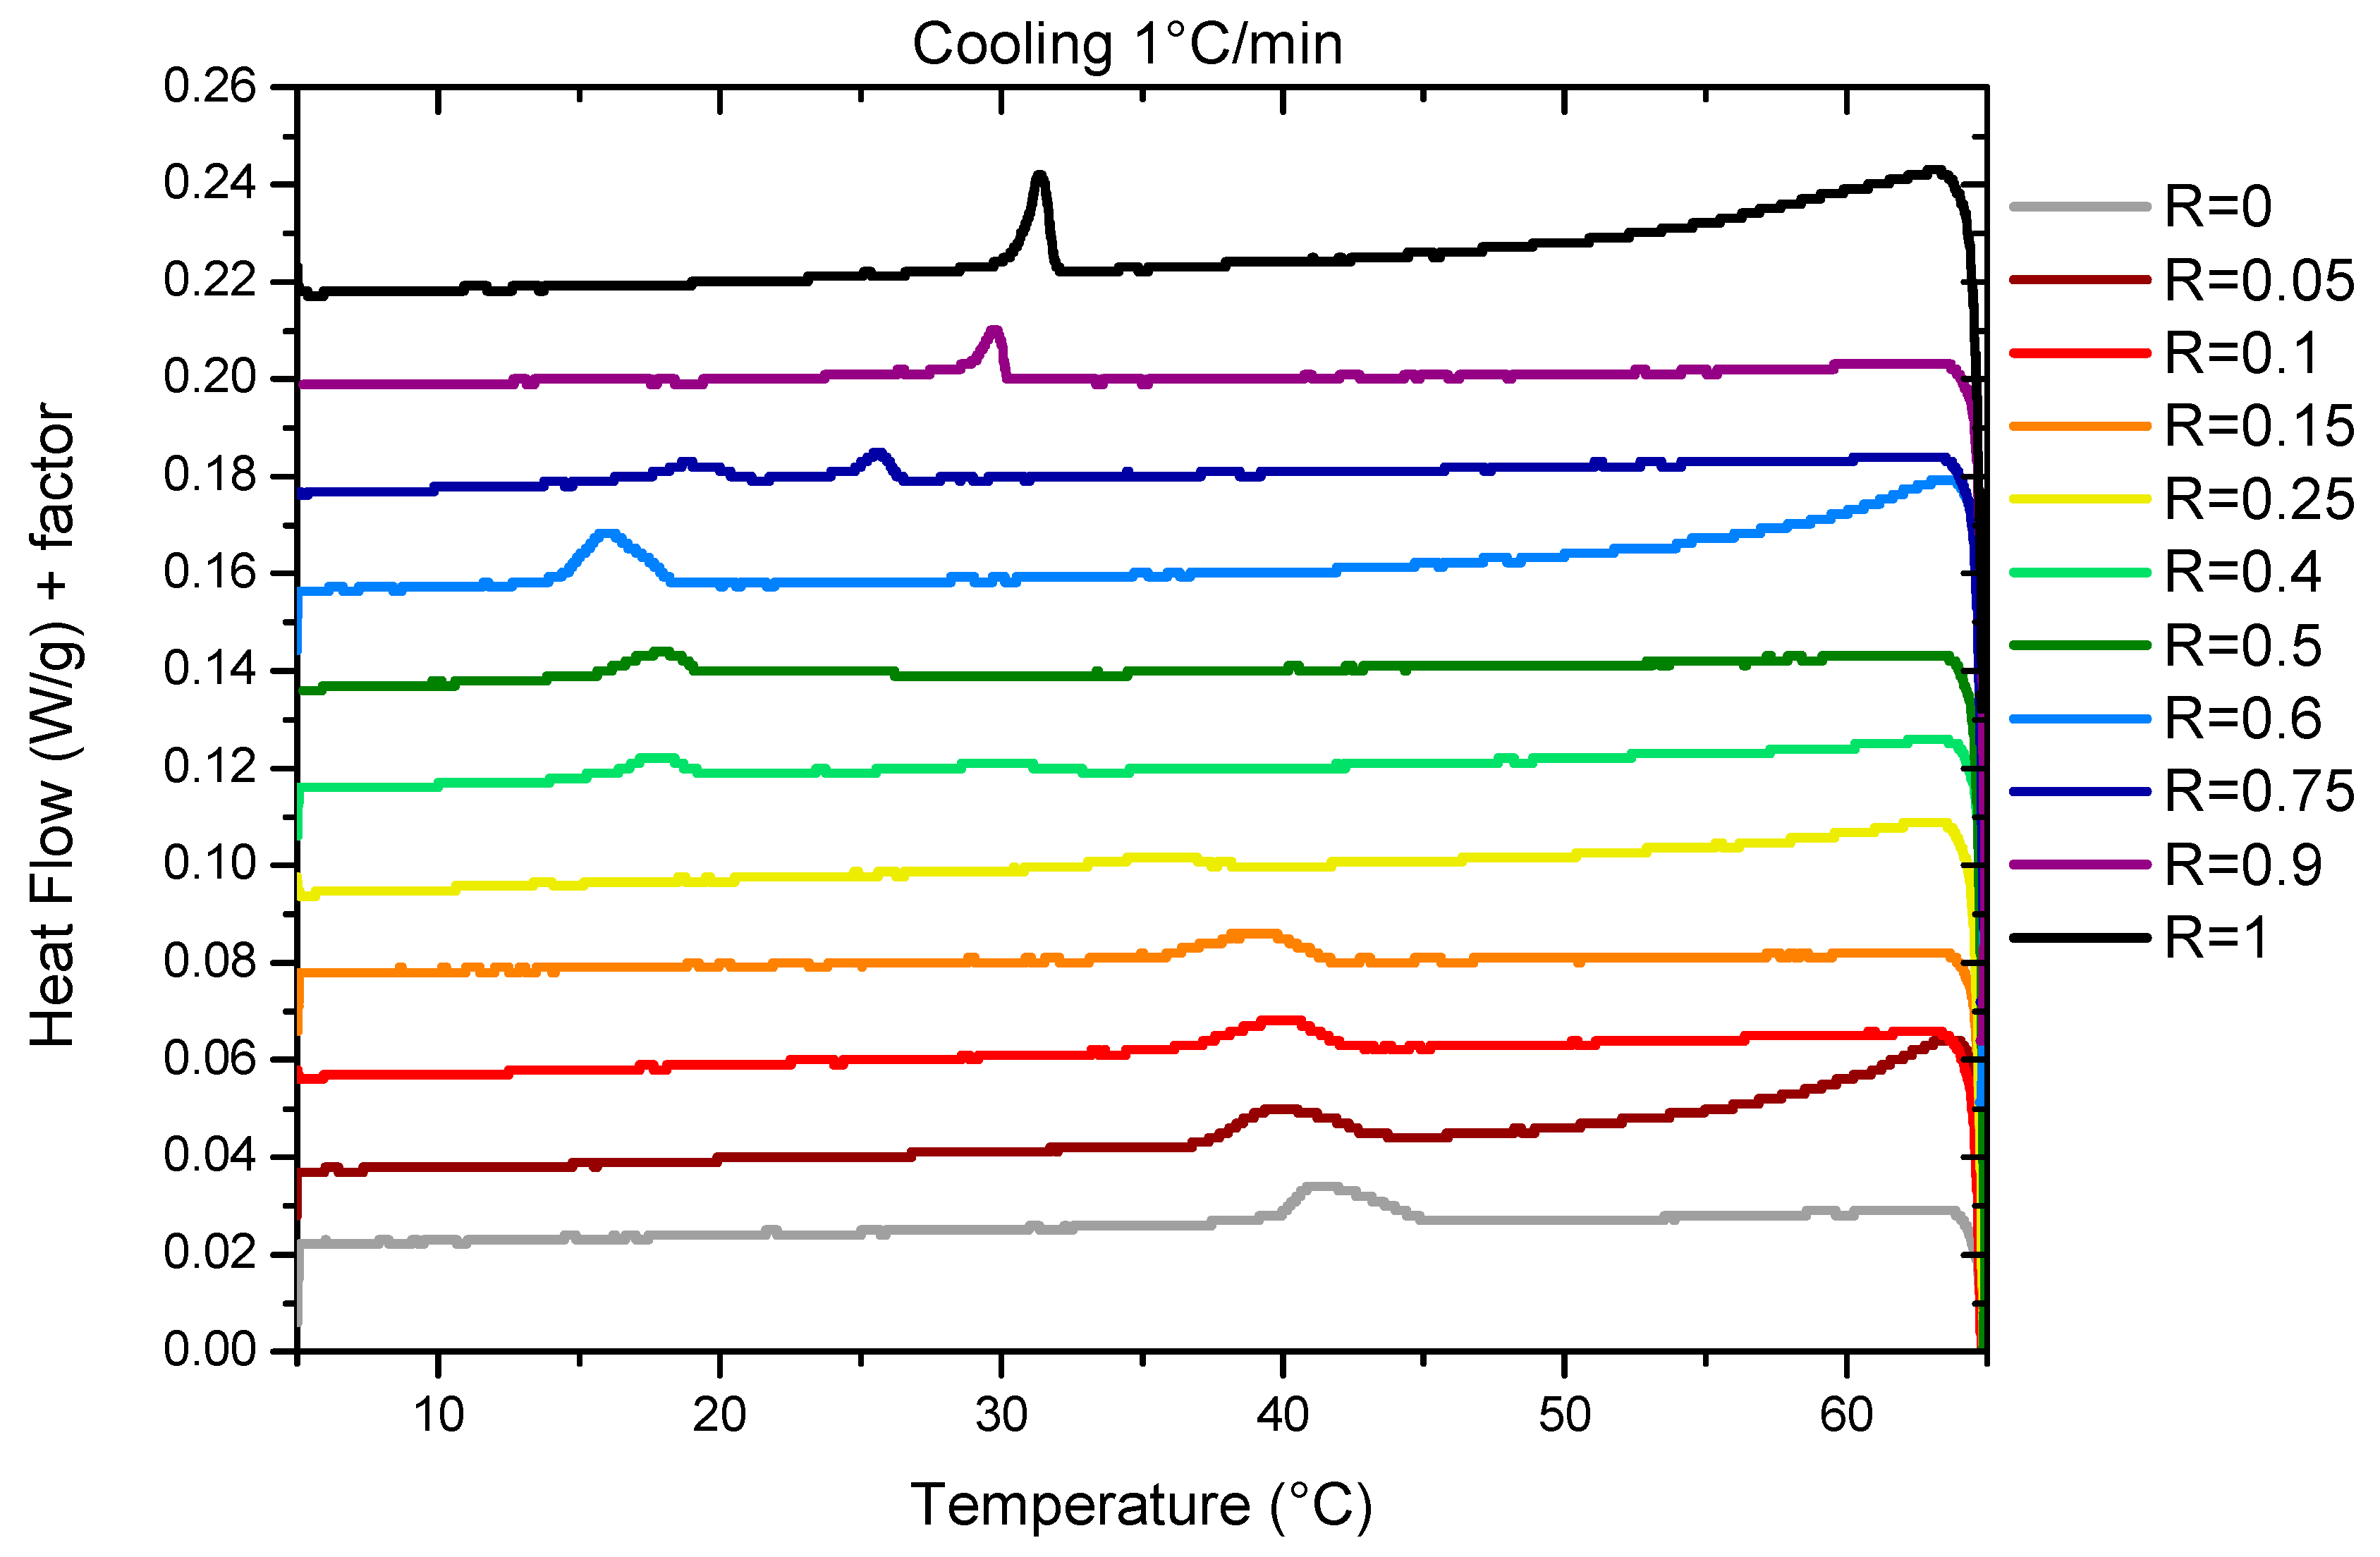
The temperature of transition threshold was also assessed by DSC measurements. Measurements were performed with two different ramps of 0.2°C/min and 1°/min. We represent results obtained during cooling at 1°C/min (
Figure 2) for which the thermal events are easier to evidence than those obtained at 0.2°C/min that have a poorer resolution due to experimental limitations (
Figure S4). As already explained for transmittance measurements, there is a small temperature offset between both set of data associated to the slow kinetics that is taken by the system to reach equilibrium. The temperature of transitions for the two cooling rates are represented on
Figure 1B For the sake of comparison with transmittance, we have chosen to represent here data obtained upon cooling. Heating ramps have been also performed (
Figures SI3 and SI5) and evidence a large hysteresis between cooling and heating cycles, as for transmittance measurements.
For R=1 (pure 12-HSA solution), there is one endothermic peak between 30°C and 35°C whose shape and width is similar to those obtained in reference7 for an ethanolamine/fatty acid ratio r = 0.2, where it was showed that it is associated to both the Lα-Lβ fluid-gel transition of the fatty acids and the transition of multi-lamellar tubes into micelles. For such an r, when all heads are on their COO- form, the melting of the fatty acid chains induce then the morphological transition by changing the packing parameter. For larger r, when part of the heads are on their COOH form, it was shown that Lα-Lβ fluid-gel transition and the melting of multi-lamellar tubes into micelles give rise to two distinct endothermic peaks on enthalpograms because H-bonds that remain within fluid fatty acids above the Lα-Lβ fluid-gel transition have to be broken to allow the transition from tubes to micelles.
For R = 0 (pure SA solution) we identify a broad peak between 40 and 45°C (
Figure 2). This is consistent with previous results by Xu et al.
8 for pure SA solutions solubilized by ethanolamine that evidenced a lamella-micelles transition at around 42°C by coupled DSC and cryo-TEM measurements at a SA concentration (1.5wt%), close to that of our current study (2wt%).
In the case of mixtures, there is only one broad peak whatever the R under scrutiny except for R=0.75. This suggests for all these ratio R the presence of a single transition corresponding to the melting of both fatty acids and mesophases, by analogy to the R = 1 and R = 0 cases. When R varies, the intensity of the peaks and their width evolves. The peak broadening is probably associated to the time necessary to reach equilibrium, that differ from one R to another, as we chose to measure all the samples with the same temperature ramp to compare their behaviors in similar conditions. For some ratios the melting temperature can be shifted up to 5°C by reducing the ramp at 1°C/min down to 0.2°C/min. Indeed, the time necessary to reach a turbid steady state after crossing the limpid-turbid transition is very dependent on the ratio R, as shown by turbidity measurements. At the intermediate R, when the peak becomes hardly visible in the DSC experiment, it is much slower than for other R.
Three different regimes can be identified depending on R. Firstly, at low R, (R=0, R=0.05, R=0.1, R=0.15, R=0.25) the peak decreases in intensity and widens at the same time. The transition temperature decreases slightly from 42°C for R=0 to 36°C for R=0.25. At R=0.25, the peak is hardly detectable at a ramp of 1°C/min and not detectable at 0.2°C/min. This may be due to a broadening of the melting peak to such an extent that apparatus is no longer sensitive enough to enable its measurement. At intermediate R (R=0.4, R=0.5, R=0.6), there is a large peak between 15°C and 20°C whose intensity increases with R. At high R (R=0.9, R=1), where mixtures form multi-lamellar tubes at 20°C,35 a rather broad but well-defined melting peak is observed whose intensity increases with R. The transition temperature also increases when the proportion of HSA increases. For all these ratios, the fact that there is only one single transition, as in the case of pure 12-HSA at r=0.2, suggests that it corresponds to both the transition Lα-Lβ and the multilamellar - micellar transition. For R = 0.75 we observe two different peaks. The comparison with other sample at different R tends to indicate that there are two different structures that are melting at different temperature in the sample. At ambient temperature, we already noticed that the solution is a mixture of two different fatty-acids architectures for such ratio,35 with multi-lamellar tubes co-existing with multi-lamellar ribbons. We hypothesize that the sharper peak at 26°C corresponds to the melting of multilamellar tubes, similarly as for the higher R, whereas the broad peak at 20°C may correspond to the melting of ribbons.
Temperatures of transition obtained by DSC do match the threshold temperatures obtained by transmittance measurements, as shown in
Figure 1B. It demonstrates that the thermodynamical transition evidenced by DSC corresponds to the melting of large self-assembled structures.
2.4. Structure of Samples by SANS
The structure of self-assemblies was determined by SANS. All the samples were prepared in D
2O while the data obtained with other experimental techniques were obtained with samples prepared in H
2O. This isotopic exchange would possibly shift the transition temperatures. We have checked that this is not the case by transmittance measurements (
Figure S6) that demonstrates that the transition temperatures are similar in D
2O and H
2O solutions.
All the results are represented on
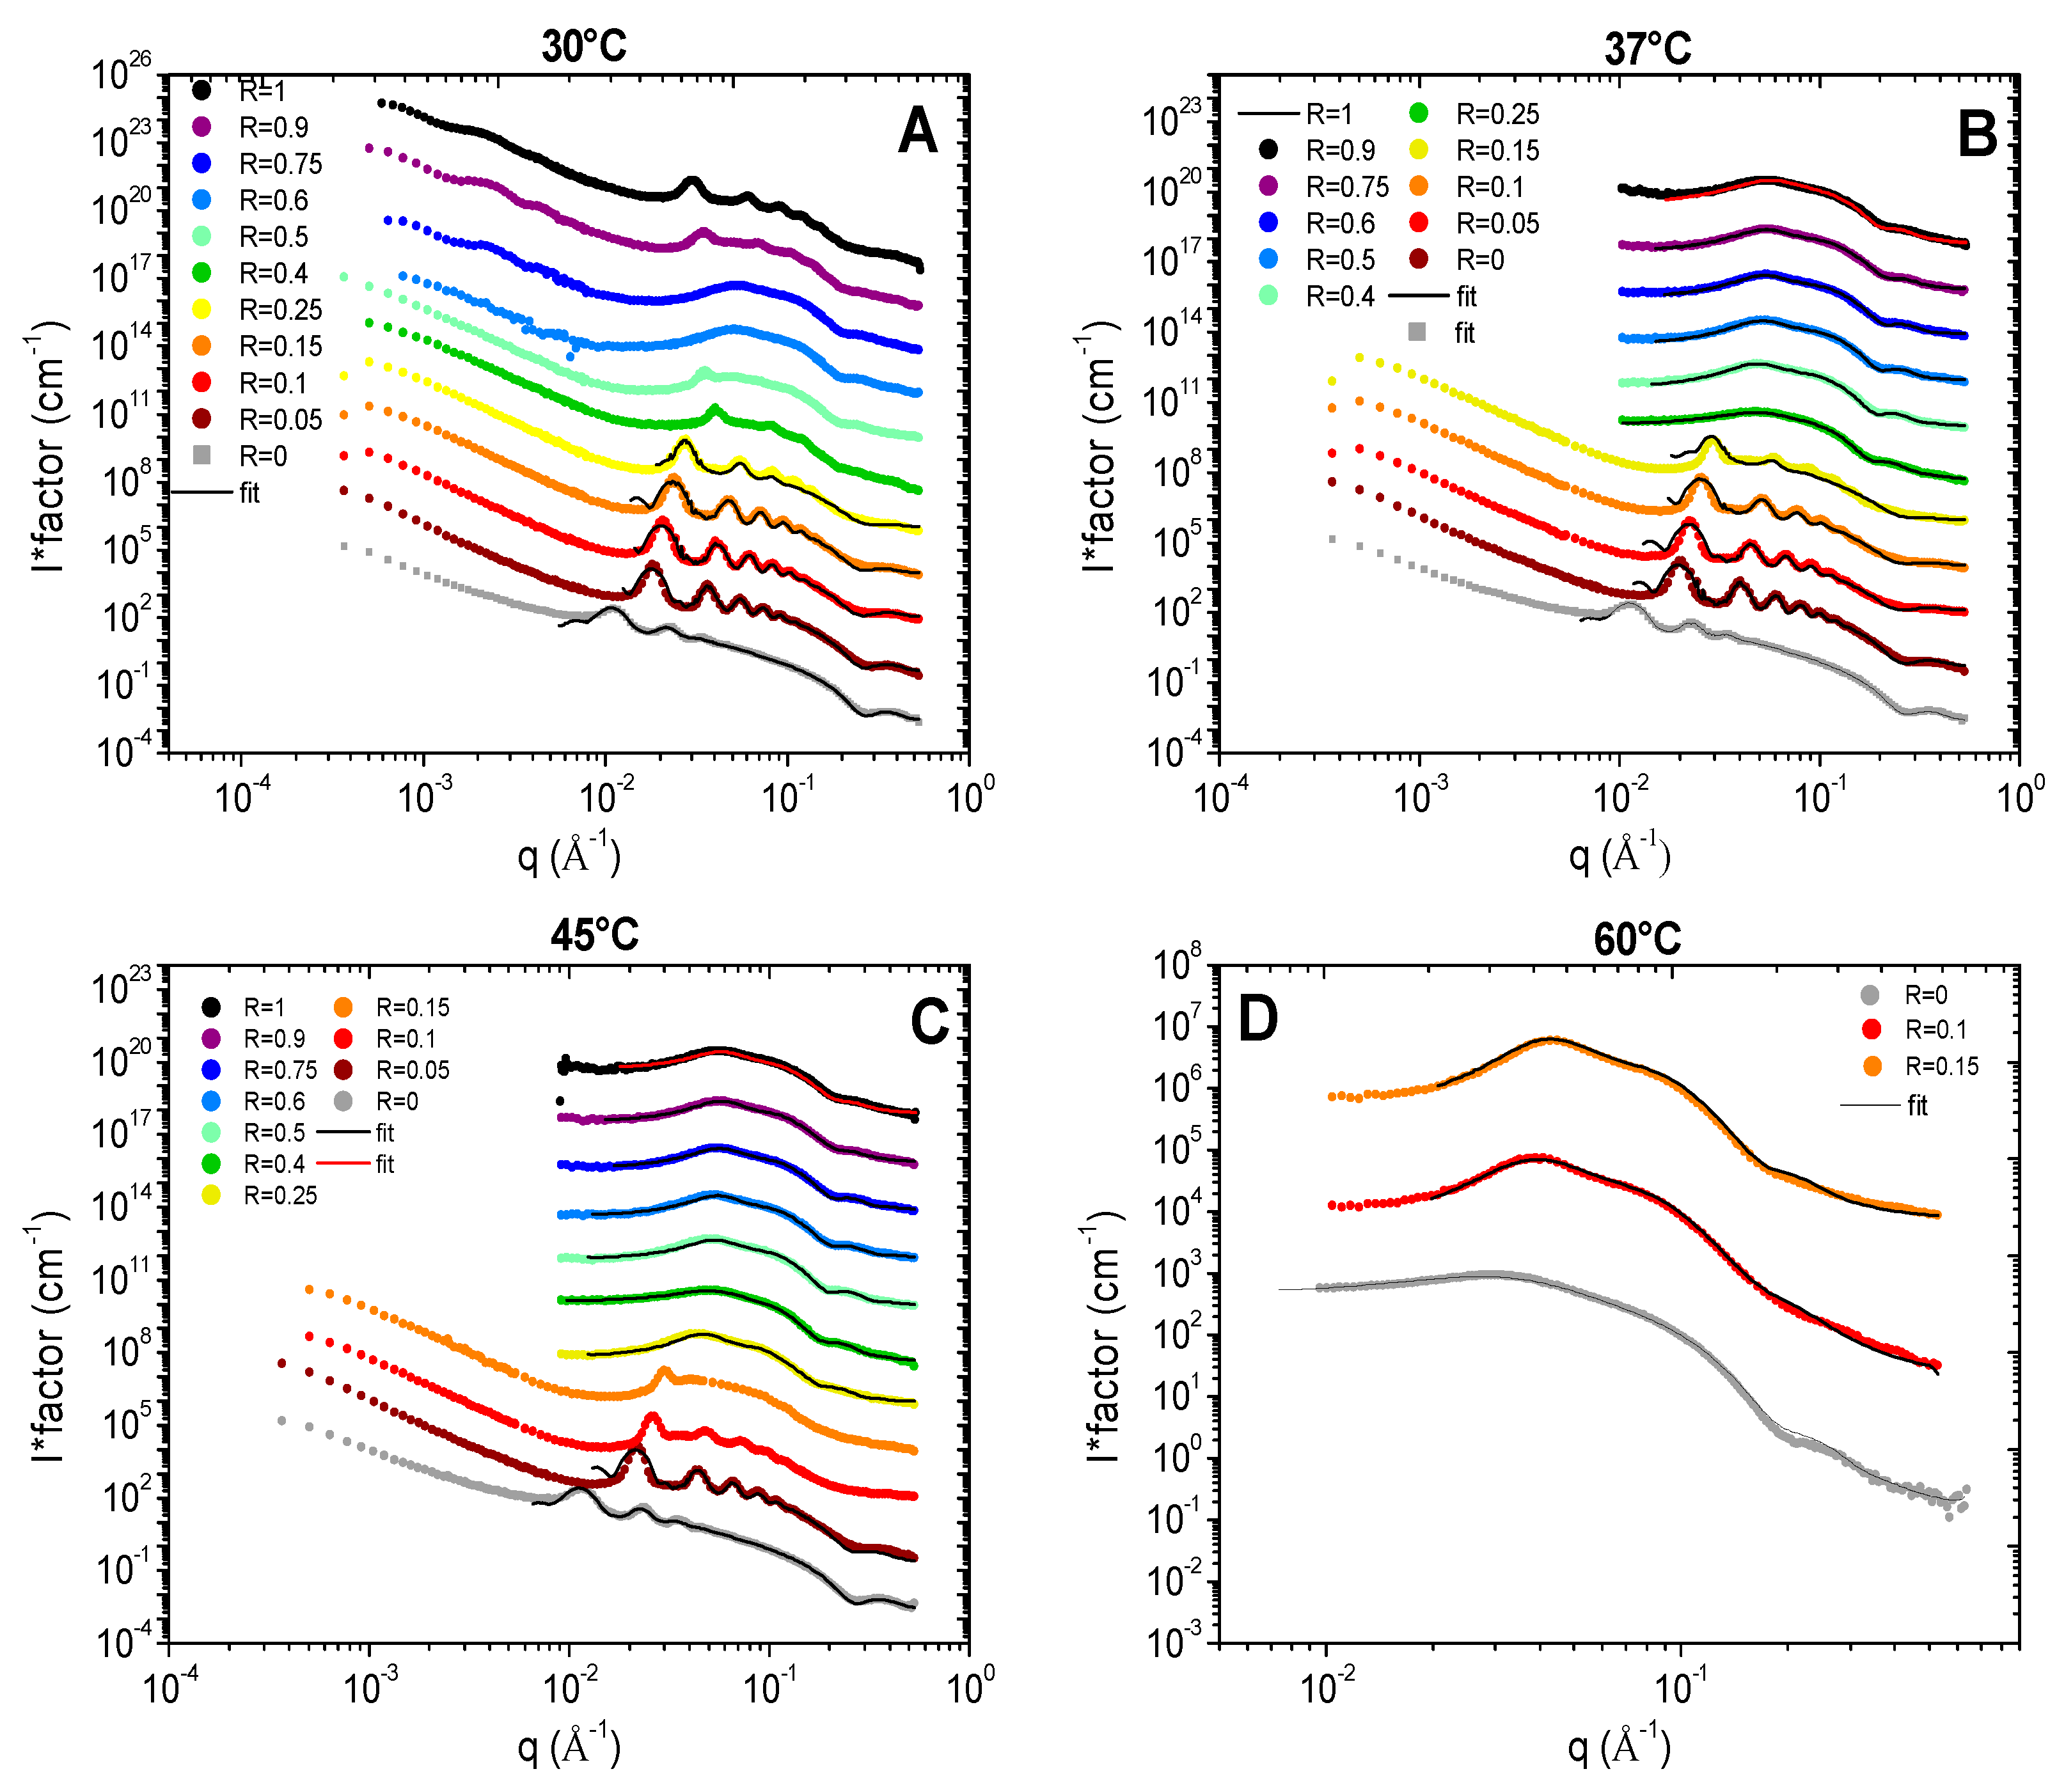
Figure 4 for each temperature (30, 37, 45, 60°C). Depending on R and/or the temperature, the scattered intensity shows 3 different behaviors: (
i) at low temperature, when samples are turbid white, the scattering is characteristic of multilamellar self-assemblies; (
ii) at high temperature, for translucent samples, the scattering is characteristic of small micelles interacting through repulsive interactions and (
iii) in the transition domain at intermediate temperature, the scattering is typical from the combination of scattering of the two types of objects. The turbidity arises thus from the formation of multi-lamellar objects that have a sufficiently large size to scatter light. When all or most of the surfactant molecules are involved in small micelles, the sample is translucent and starts becoming partially turbid as soon as a few molecules make lamellar objects. The translucent/turbid transition threshold of the state diagram corresponds thus to the onset of formation of these first multi-lamellar objects.
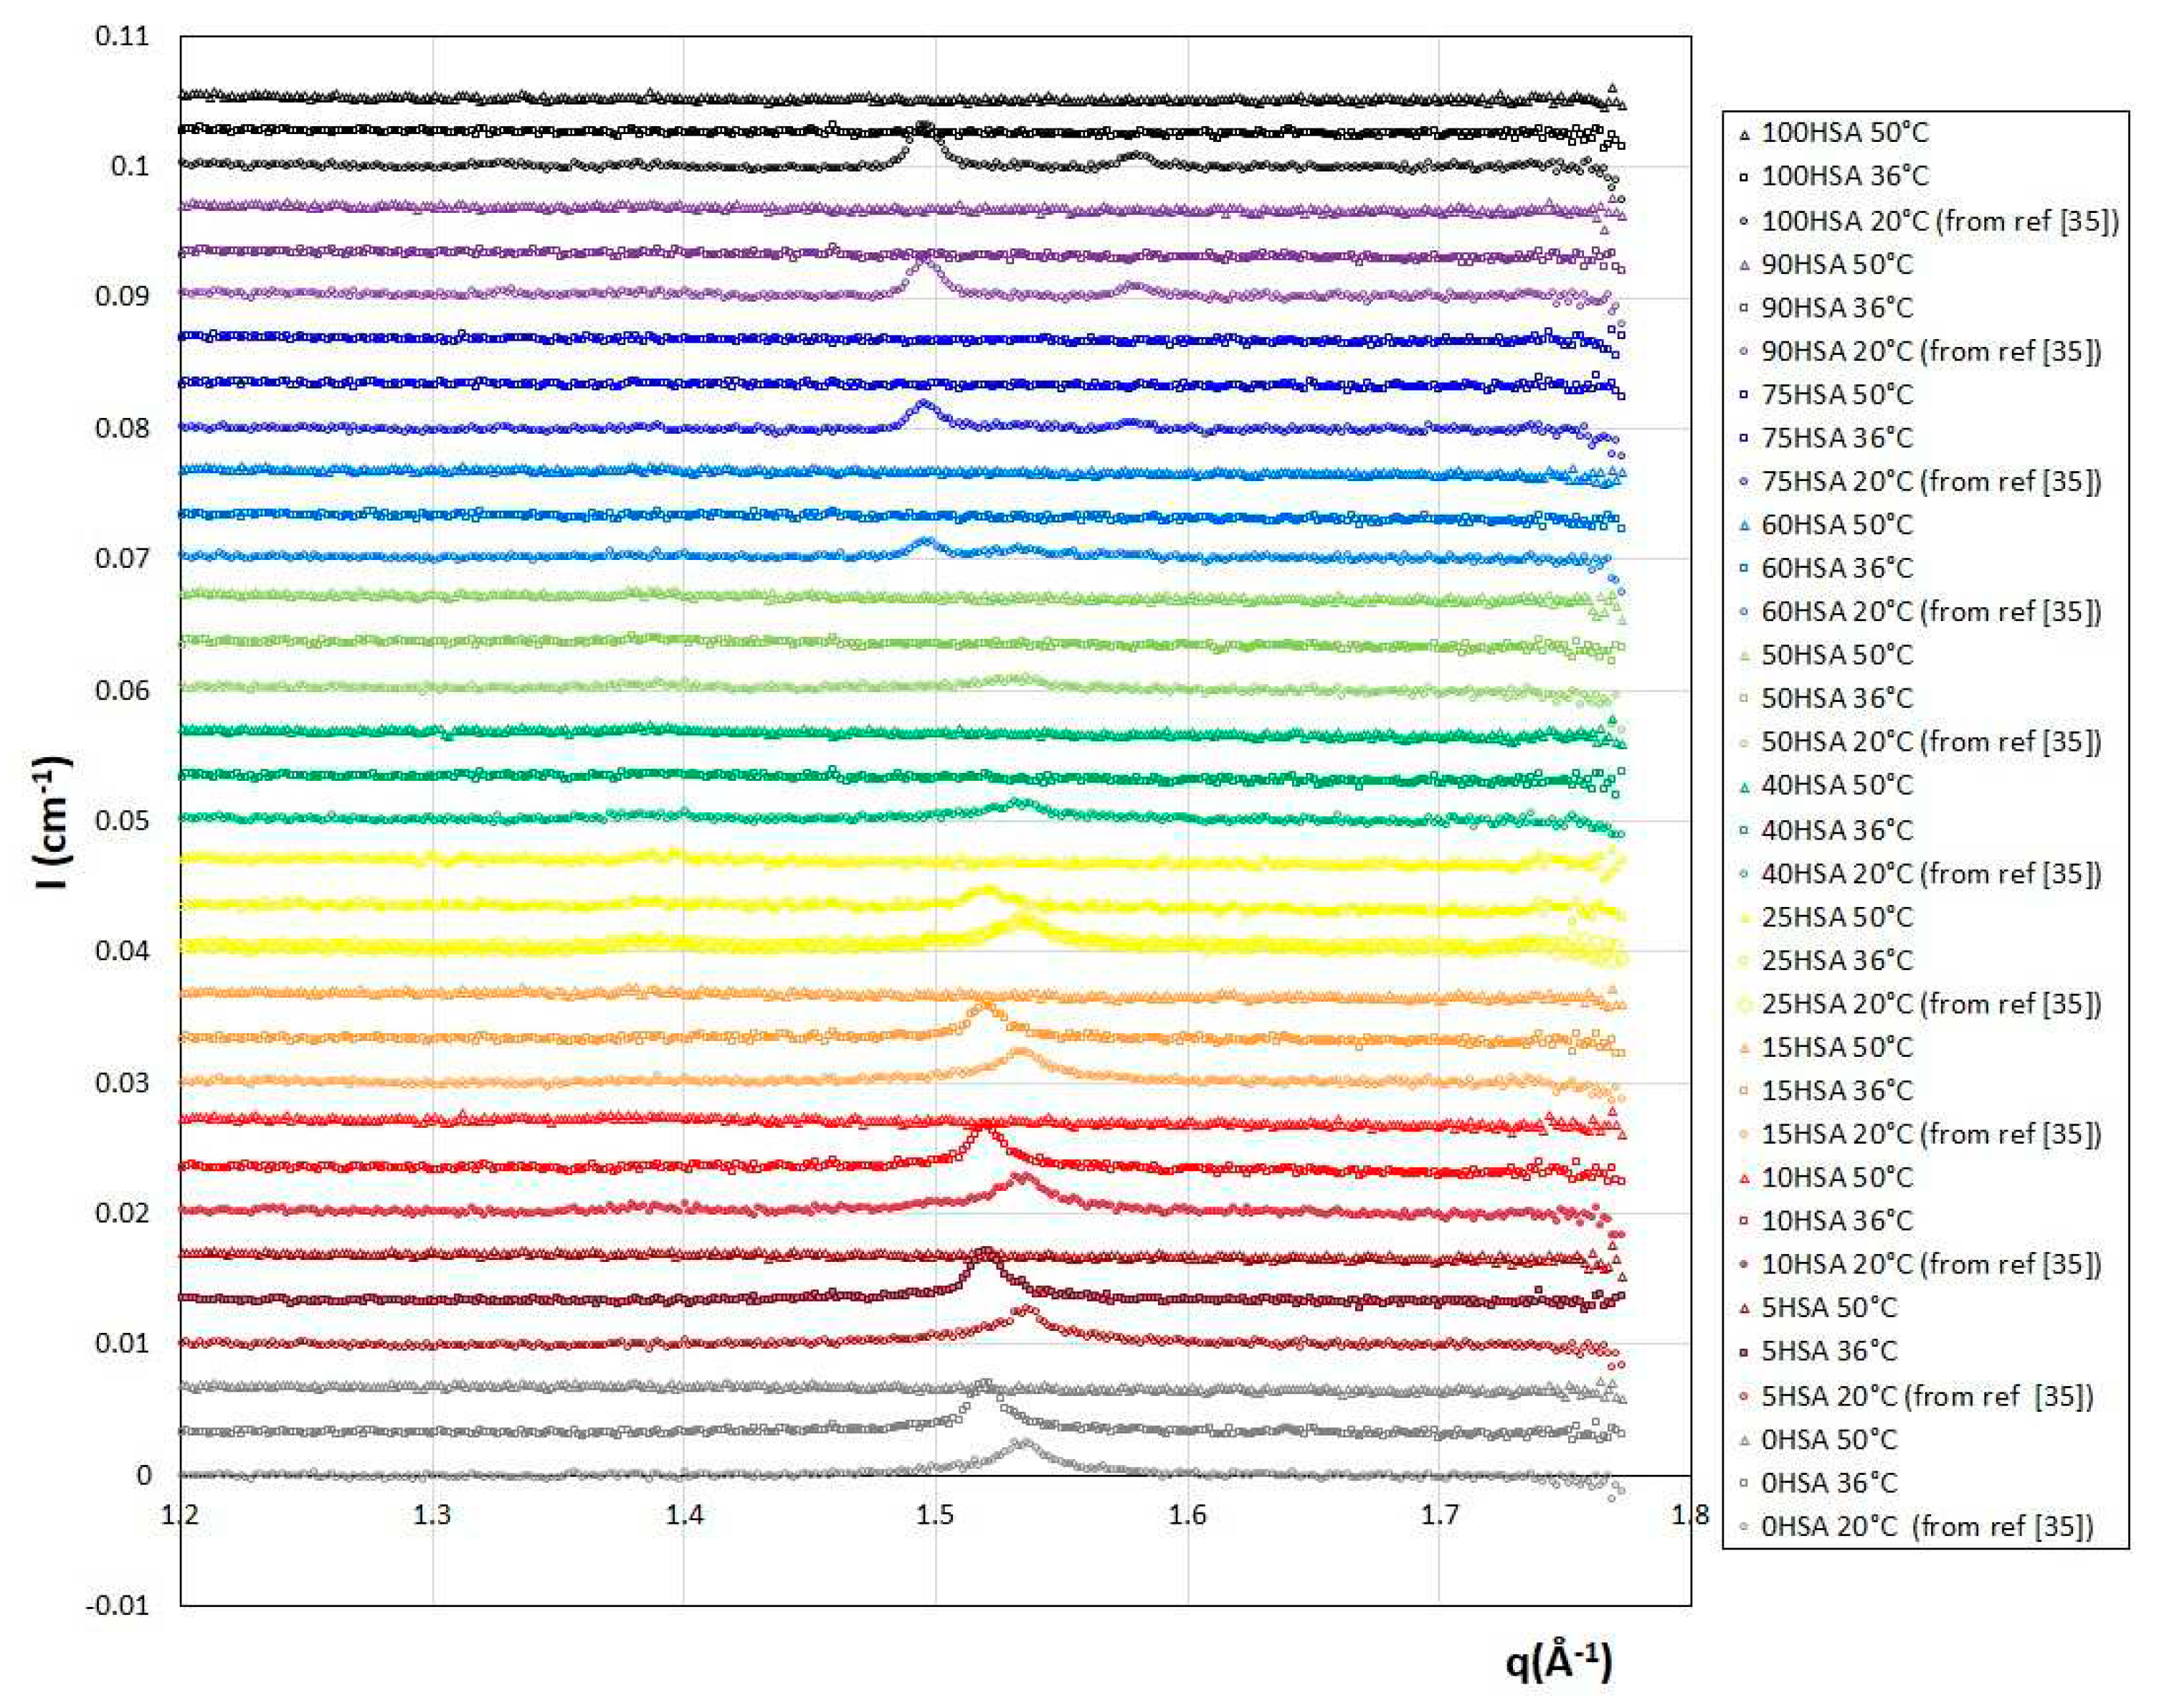
At low temperature, we recover the scattering of the different multilamellar self-assemblies that were obtained at 20°C and exhaustively described in reference.
35 For all samples, there are several Bragg peaks associated with the interlamellar distance at intermediate q and an oscillation at q ~ 0.25 Å
-1 originating from the lamella form factor at large q. Only the low q part differs from one self-assembled structure to another: q
-2 for planar lamella at R = 0, q
-4 at low R for lamellar facetted structures with planar domains bounded by spherical curved domains, q
-3 for mixtures of helical ribbons and multilamellar tubes and q
-3 with an oscillation associated radius of the tubular shape for multilamellar tubes. The scattering curves were thus fitted in the intermediate and large q region following the same approach we used in reference
35 by a model proposed by Nallet et al
36 to determine the structural parameters of lamella (thickness, d-spacing, rigidity represented in
Figure 5). It considers a form factor of the lamella and a structure factor between lamella for which both the number of stacked bilayers and the Caillé parameter (η), accounting for the thermal fluctuations of the bilayers, were adjusted. This model enables to fit satisfactorily all the data for which multi-lamellar objects were formed, respectively for all R except from 0.4 to 1 at 30°C (
Figure 4(A)), all R ≤ 0.25 at 37°C (
Figure 4B) and all R ≤ 0.15 at 45°C (
Figure 4C). Although the ratios 1, 0.9 and 0.4 at 30°C present some Bragg peaks that refer to multi-lamellar objects, at intermediate q they start concomitantly to present the curved shape of a micelle, thus showing that solutions are containing both lamellar objects and micelles. For this reason, these scattering curves were not fitted by the sum of a Nallet model for the lamella and of interacting micelles, as there would be too many free parameters in the modelling to provide an unambiguous result.
All the results of these fits are represented on
Figure 4. The low q part of the curves was not fitted as it displays different behavior from one sample to another (q
-2 versus q
-3 versus q
-4). Please note that the results obtained at R=0.4 were not analyzed. Indeed, we showed in
35 that the sample at 20°C was not homogeneous at the millimetric scale at 20°C, with a possible phase separation, which gives a strong uncertainty on the effective concentration that is actually probed by the neutron beam.
Whatever R, the increase in temperature does not change the morphology of the self-assembly for a given R. As was observed in the case of pure 12-HSA solutions in,
28 the increase in temperature is accompanied by a slight decrease in the inter-lamellar distance (
Figure 4A) while the Caillé parameter does not evolve much with temperature except for the ratio R=0.25 (
Figure 4B). The thickness of the lamella does not evolve with temperature and remains constant around 23
Å for each of the R ratios. This thickness is close to the size of a fatty acid (21
Å)
29 and corresponds to interdigitated lamellar phases. This result is noticeable for samples with low R (R ≤ 0.25). Indeed, when self-assemblies are predominantly formed of SA, WAXS measurements reveal that the lattice parameter of the crystallized fatty acids evolve with temperature. This local modification of the structure is not accompanied by a significant change of the thickness of the lamella. Structural reorganization occurs thus in-plane.
Let us now discuss the scattered curves obtained for all R ≥ 0.25 at 45°C and for R=0, R=0.1 and R=0.15 at 60°C for which the Bragg peaks associated to the lamella self-assemblies have completely vanished (
Figure 4C,D respectively). They are completely different from those at 20°C and are typical of the one of small micelles interacting through repulsive interactions, consistently with literature. They display three main features: (i) at very low q values (q < 0.01 Å
–1), the scattering intensity decreases when q decreases, showing that the isothermal osmotic compressibility (χ
T ) of the system is very weak due to electrostatic repulsions; (
ii) at intermediate q, it shows a strong correlation peak at q
*, ranging between 0.02 Å
–1 and 0.06 Å
–1 depending on the sample, that correspond in direct space to the mean distance between micelles (2π/ q
*); (
iii) for q > 0.1 Å
–1, a Porod like decay in q
-4 stemming from the 3-D character of the micelles with a marked oscillation at ~ 0.25 Å
–1 associated with the first minima of the form factor.
We assume in a first time that micelles are spheres. Since they are centrosymmetric objects, the scattering intensity I(q) can be written like:
where Φ is the volume fraction of micelles, ρ
fatty_acid and ρ
D2O are the respective neutron scattering length density of the fatty acids (considering in first approximation that it is similar for 12-HSA and SA) and of D
2O, V is the volume of the micelle; P(q) is the normalized micelle form factor; S(q) is the inter-micelles structure factor.
The low compressibility of the samples, associated to a strong correlation peak revealing an homogeneous distribution of self-assembled objects within the sample, highlight the presence of strong repulsions between micelles. Since the pH of all the solutions is around 10.85 ± 015, each fatty acid bears a carboxylate head. The micelles are thus strongly negatively charged, and the repulsions are of electrostatic origin. The structure factor S(q) can thus be fitted by a model proposed by Hayter and Penfold for charged 3D objects,37 that consider a Yukawa potential describing electrostatic interactions following DLVO theory in the mean spherical approximation,38 as will be shown later on.
At large q, S(q)q→∞ = 1 by principle. In practice S(q) ~ 1 here for q > 0.1 Å–1, which enables to decouple the structure factor and form factor during fitting procedure and get an accurate description of the form factor without any assumption of the structure factor.
Let us now describe the influence of R on the micelle shape. For R = 1 (pure 12-HSA solution), most studies in the literature have focused on suspensions with a stoichiometric ethanolamine/fatty acid ratio (r = 0.5).29 For this r, the HSA micelles form spherical micelles with a radius of 22 Å at high temperature, which corresponds to the length of the hydrophobic tail.29 We have tested such a form factor model of spheres in our case (r = 0.2) and the best fit gives a micelle radius of 18.5 Å. This result agrees with the literature29 at such r of 0.2 at 72°C but the curve obtained does not fit properly the data.
We therefore chose to refine the model and fit the scattered intensity of the 12-HSA solution at 45°C using an homogeneous ellipsoidal micellar model that is both compatible with the observation of a characteristic length of 18.5 Å and the size of the molecule. For a dispersion of ellipsoids of revolution, the decoupling approximation of the structure factor and of the form factor is not valid. It has however been shown by Green et al
39 that the approximation stays valid for either a dilute dispersion and/or low aspect ratios of the ellipsoids. This is the case for the ranges of volume fraction under scrutiny of our study (~ 2%) and aspect ratios (between 0.5 and 1.7, see later), the deviation of the decoupled S(q) being less than 1% from an explicit calculation of S(q) of hard ellipsoids (see e g
Figure 2 of reference
39). We will then postulate that the decoupling approximation is valid for all data on micelles presented afterwards. The model refines our data well by giving an equatorial radius of 18.5 Å and a polar radius of 32 Å, i.e. an ellipticity of 1.7. HSA micelles are therefore prolate micelles. The fatty acids are thus not interdigitated within micelles, contrarily to the lamellar phase.
For R=0 (pure SA solution) at 60°C (
Figure 4), a simple look at the evolution of the intensity with respect to the 12-HSA case shows that the SA micelles have a larger aggregation number
N than 12-HSA ones (see
Figure S7 that compare all curves in cm
-1 without any multiplication by a pre-factor). Indeed, the q-position of the structure correlation peak q
* shifts towards low q for R = 0. Since q
* is inversely proportional to the distance between scattering objects, this shows that the distance between micelles is larger for R=0 than for R=1. Given that the total fatty acid concentration in solution is constant for both ratios, this implies that
N is larger for R = 0. Moreover, at the same time, the q-range where the Porod q
-4 arise shifts towards low q for R = 0 with respect to R = 1. As for pure 12-HSA micelles, it was not possible to fit properly the scattering curve by using a purely spherical form factor and the best modelling was obtained with an elliptical form factor, with a polar radius of 18.9 Å and an equatorial one of 38.5 Å. The shape of the SA micelles is thus oblate, which is strikingly different from the 12-HSA case where they are prolate.
For the other R, the evolution of the intensity as function of R shows that the aggregation number of fatty acid per micelle
N decreases varies continuously from one sample to another (see Figure SI7) from R = 0 to R = 1. Indeed, q
* shifts towards large q with an increase of R and the q-range where the Porod q
-4 arise shifts towards large q at the same time. Data were fitted at large q by an ellipsoidal micelles model (detailed in
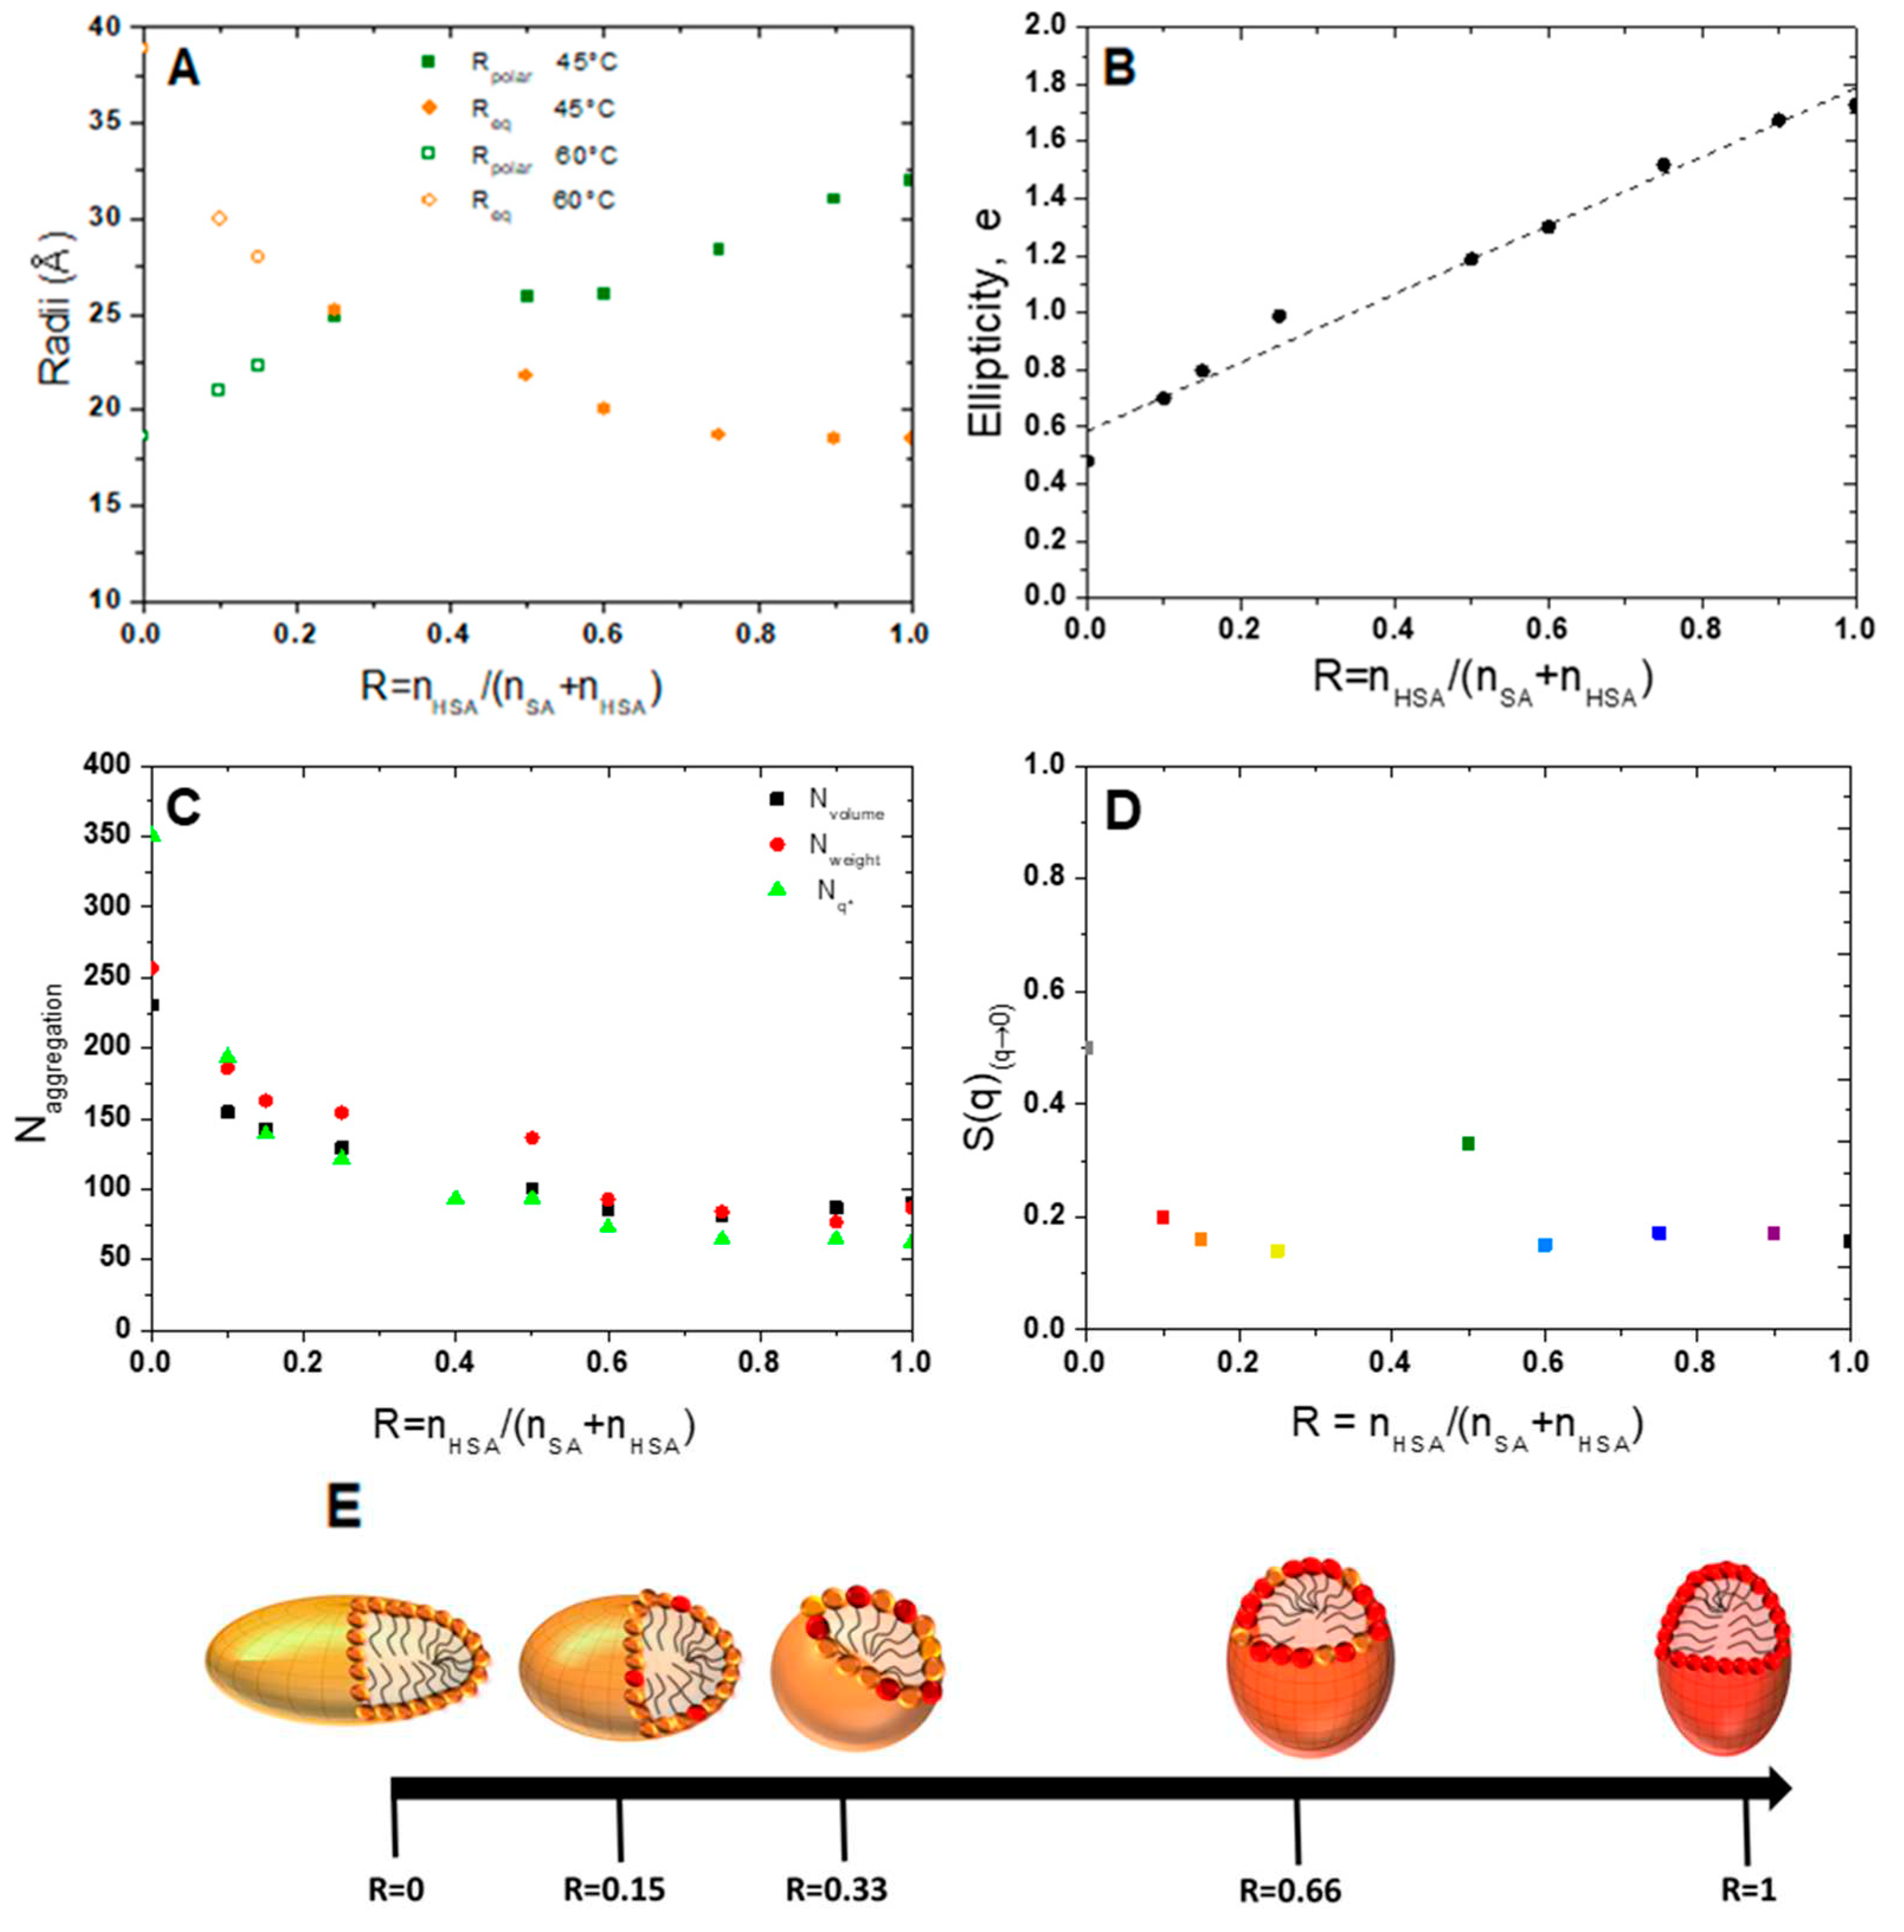
Supplementary Materials) for all R to account for the evolution of shape. Polar and equatorial radii are represented on
Figure 6A and ellipticity on
Figure 6B. The ellipticity
e, defined as 1-(radius polar/radius equatorial), decays linearly when R decreases and takes values lower than 1 for R < 0.25. The system transit from prolate micelles at high R, as for pure 12-HSA micelles, to oblate micelles at low R, as for the pure SA micelles. Spherical micelles are obtained when R is close to 0.33. The ellipticity can be tuned from the choice of R with
e = 0.58 + 1.2 R.
The aggregation number,
N, was determined in three different ways: one deduced from the mass of the scattering objects, from the extrapolation of the scattered intensity when q tends to 0 I(q)
q→0, taking here the structure factor equal to 1 on the full q-range, which we call
NWeight, one obtained by the ratio between the volume of the ellipsoid and that of a fatty acid molecule, which we call
Nvolume, and one extracted from the position of the correlation peak,
q*, assuming that the repartition of micelles is spatially homogeneous, i.e. the mean distance between micelles is 2π/
q*, that we call
Nq*.
Where
is the specific volume of the fatty acid, Δρ is the neutron scattering contrast between fatty acid and D
20 and c the concentration of both fatty acids, N
a, the Avogadro number and M
fatty acid the average molar mass of fatty acids at each ratio (ie M
fatty acid=R.M
HSA+(1-R).M
SA).
The volume of a molecule of fatty acid is approximated by using Tanford’s formula for the alkyl chain volume (V = 27.4 + 26.9n
c, where n
c is the number of alkyl chain carbons).
40 We have chosen to use the same value whatever the ratio R, the slight error introduced in this calculation being minute.
Where
is the volume fraction in fatty acid and
q* the position of the correlation peak.
Nweight and
Nvolume,
Nq* values have the same order of magnitude and vary in the same way. At high R, the values obtained from the three approaches are slightly different which may be due to the value of the volume of a 12-HSA molecule which might be slightly different from the one of pure SA used in this calculation, to the uncertainty one the scattering length density of the micelles as the exact localization of the counter-ion is unknown and to the uncertainty on the different fits. At R=1,
N is close to 100 and vary only slightly when decreasing R up to R= 0.5. It then strongly increases and reach value between 250 and 350 molecules at R = 0, depending on the method used to obtain it. The calculation of
Nq* is not fit-dependent and is probably more accurate than the others. In particular, it does not depend on the scattering length density of the core of the micelle, that we have considered equal to that of a fatty acid in the fitting, a value that may slightly wrong due to presence of the ethanolamine counterions.
The experimental structure factors were then obtained by dividing the scattered intensity by these adjusted form factors (equation 1). They are represented on
Figure S8, which allow to highlight the very low compressibilities of the suspension, and therefore strong repulsions. They were fitted with a model of the Hayter and Penfold,
37 fixing all parameters to their known experimental values (temperature, ionic strength calculated from all ions introduced in solution, concentration, dielectric constant), except for the effective charge by micelle
Zmicelle.
Zmicelle varies from 20 to 50 per micelles depending on R and micelle’s size (see table SI 1). The large values obtained for the effective micellar charge are in agreement with the charged character of the fatty acids.
