Submitted:
31 July 2023
Posted:
01 August 2023
You are already at the latest version
Abstract

Keywords:
1. Introduction
2. Results and Discussion
3. Materials and Methods
General Considerations
X-ray Structure Determination
Cyclic voltammetry (CV) and differential pulse voltammetry (DPV)
Experimental Procedures and Product Characterization
Quantum-chemical Calculations
4. Conclusions
Supplementary Materials
Author Contributions
Funding
Data Availability Statement
Acknowledgments
Conflicts of Interest
References
- Broere, D.L.J.; Plessius, R.; Van Der Vlugt, J.I. New Avenues for Ligand-Mediated Processes-Expanding Metal Reactivity by the Use of Redox-Active Catechol, o-Aminophenol and o-Phenylenediamine Ligands. Chem. Soc. Rev. 2015, 44, 6886–6915. [Google Scholar] [CrossRef] [PubMed]
- Kaim, W.; Paretzki, A. Interacting Metal and Ligand Based Open Shell Systems: Challenges for Experiment and Theory. Coord. Chem. Rev. 2017, 344, 345–354. [Google Scholar] [CrossRef]
- Broere, D.L.J.; Mercado, B.Q.; Bill, E.; Lancaster, K.M.; Sproules, S.; Holland, P.L. Alkali Cation Effects on Redox-Active Formazanate Ligands in Iron Chemistry. Inorg. Chem. 2018, 57, 9580–9591. [Google Scholar] [CrossRef] [PubMed]
- Queyriaux, N. Redox-Active Ligands in Electroassisted Catalytic H+and CO2Reductions: Benefits and Risks. ACS Catal. 2021, 11, 4024–4035. [Google Scholar] [CrossRef]
- Singh, K.; Kundu, A.; Adhikari, D. Ligand-Based Redox: Catalytic Applications and Mechanistic Aspects. ACS Catal. 2022, 12, 13075–13107. [Google Scholar] [CrossRef]
- Kinzel, N.W.; Demirbas, D.; Bill, E.; Weyhermüller, T.; Werlé, C.; Kaeffer, N.; Leitner, W. Systematic Variation of 3d Metal Centers in a Redox-Innocent Ligand Environment: Structures, Electrochemical Properties, and Carbon Dioxide Activation. Inorg. Chem. 2021, 60, 19062–19078. [Google Scholar] [CrossRef] [PubMed]
- Zuckerman, L.A.; Vargo, N.P.; May, C. V.; Crockett, M.P.; Hyre, A.S.; McNeely, J.; Elinburg, J.K.; Brown, A.M.; Robinson, J.R.; Rheingold, A.L.; et al. Thiolate-Thione Redox-Active Ligand with a Six-Membered Chelate Ring via Template Condensation and Its Pt(II) Complexes. Inorg. Chem. 2021, 60, 13376–13387. [Google Scholar] [CrossRef] [PubMed]
- Mondal, R.; Guin, A.K.; Chakraborty, G.; Paul, N.D. Metal-Ligand Cooperative Approaches in Homogeneous Catalysis Using Transition Metal Complex Catalysts of Redox Noninnocent Ligands. Org. Biomol. Chem. 2022, 20, 296–328. [Google Scholar] [CrossRef] [PubMed]
- Luca, O.R.; Crabtree, R.H. Redox-Active Ligands in Catalysis. Chem. Soc. Rev. 2013, 42, 1440–1459. [Google Scholar] [CrossRef] [PubMed]
- Paul, N.D.; Rana, U.; Goswami, S.; Goswami, S.; Mondal, T.K. Azo Anion Radical Complex of Rhodium as a Molecular Memory Switching Device: Isolation, Characterization, and Evaluation of Current-Voltage Characteristics. J. Am. Chem. Soc. 2012, 134, 6520–6523. [Google Scholar] [CrossRef] [PubMed]
- Chirik, P.J.; Wieghardt, K. Radical Ligands Confer Nobility on Base-Metal Catalysts. Science (80-. ). 2010, 327, 794–795. [Google Scholar] [CrossRef] [PubMed]
- Suarez, A.I.O.; Lyaskovskyy, V.; Reek, J.N.H.; Van Der Vlugt, J.I.; De Bruin, B. Complexes with Nitrogen-Centered Radical Ligands: Classification, Spectroscopic Features, Reactivity, and Catalytic Applications. Angew. Chemie - Int. Ed. 2013, 52, 12510–12529. [Google Scholar] [CrossRef]
- Hoyt, J.M.; Schmidt, V.A.; Tondreau, A.M.; Chirik, P.J. Iron-Catalyzed Intermolecular [2+2] Cycloadditions of Unactivated Alkenes. Science (80-. ). 2015, 349, 960–963. [Google Scholar] [CrossRef] [PubMed]
- Fujita, D.; Sugimoto, H.; Morimoto, Y.; Itoh, S. Noninnocent Ligand in Rhodium(III)-Complex-Catalyzed C-H Bond Amination with Tosyl Azide. Inorg. Chem. 2018, 57, 9738–9747. [Google Scholar] [CrossRef] [PubMed]
- Jacquet, J.; Cheaib, K.; Ren, Y.; Vezin, H.; Orio, M.; Blanchard, S.; Fensterbank, L.; Desage-El Murr, M. Circumventing Intrinsic Metal Reactivity: Radical Generation with Redox-Active Ligands. Chem. - A Eur. J. 2017, 23, 15030–15034. [Google Scholar] [CrossRef]
- Demir, S.; Jeon, I.-R.; Long, J.R.; Harris, T.D. Radical Ligand-Containing Single-Molecule Magnets. Coord. Chem. Rev. 2015, 289–290, 149–176. [Google Scholar] [CrossRef]
- Jeon, I.R.; Sun, L.; Negru, B.; Van Duyne, R.P.; Dinca, M.; Harris, T.D. Solid-State Redox Switching of Magnetic Exchange and Electronic Conductivity in a Benzoquinoid-Bridged MnII Chain Compound. J. Am. Chem. Soc. 2016, 138, 6583–6590. [Google Scholar] [CrossRef] [PubMed]
- Degayner, J.A.; Wang, K.; Harris, T.D. A Ferric Semiquinoid Single-Chain Magnet via Thermally-Switchable Metal-Ligand Electron Transfer. J. Am. Chem. Soc. 2018, 140, 6550–6553. [Google Scholar] [CrossRef] [PubMed]
- Shimazaki, Y.; Yajima, T.; Tani, F.; Karasawa, S.; Fukui, K.; Naruta, Y.; Yamauchi, O. Syntheses and Electronic Structures of One-Electron-Oxidized Group 10 Metal(II)-(Disalicylidene)Diamine Complexes (Metal = Ni, Pd, Pt). J. Am. Chem. Soc. 2007, 129, 2559–2568. [Google Scholar] [CrossRef]
- Asami, K.; Tsukidate, K.; Iwatsuki, S.; Tani, F.; Karasawa, S.; Chiang, L.; Storr, T.; Thomas, F.; Shimazaki, Y. New Insights into the Electronic Structure and Reactivity of One-Electron Oxidized Copper(II)-(Disalicylidene)Diamine Complexes. Inorg. Chem. 2012, 51, 12450–12461. [Google Scholar] [CrossRef] [PubMed]
- Whittaker, J.W. Free Radical Catalysis by Galactose Oxidase. Chem. Rev. 2003, 103, 2347–2363. [Google Scholar] [CrossRef]
- Lyons, C.T.; Stack, T.D.P. Recent Advances in Phenoxyl Radical Complexes of Salen-Type Ligands as Mixed-Valent Galactose Oxidase Models. Coord. Chem. Rev. 2013, 257, 528–540. [Google Scholar] [CrossRef]
- Shimazaki, Y.; Arai, N.; Dunn, T.J.; Yajima, T.; Tani, F.; Ramogida, C.F.; Storr, T. Influence of the Chelate Effect on the Electronic Structure of One-Electron Oxidized Group 10 Metal(Ii)-(Disalicylidene)Diamine Complexes. Dalt. Trans. 2011, 40, 2469–2479. [Google Scholar] [CrossRef]
- Thomas, F. Ligand-Centred Oxidative Chemistry in Sterically Hindered Salen Complexes: An Interesting Case with Nickel. Dalt. Trans. 2016, 45, 10866–10877. [Google Scholar] [CrossRef] [PubMed]
- Mustieles Marín, I.; Cheisson, T.; Singh-Chauhan, R.; Herrero, C.; Cordier, M.; Clavaguéra, C.; Nocton, G.; Auffrant, A. Electronic Structures of Mono-Oxidized Copper and Nickel Phosphasalen Complexes. Chem. - A Eur. J. 2017, 23, 17940–17953. [Google Scholar] [CrossRef]
- Oshita, H.; Yoshimura, T.; Mori, S.; Tani, F.; Shimazaki, Y.; Yamauchi, O. Characterization of the One-Electron Oxidized Cu(II)-Salen Complexes with a Side Chain Aromatic Ring: The Effect of the Indole Ring on the Cu(II)-Phenoxyl Radical Species. J. Biol. Inorg. Chem. 2018, 23, 51–59. [Google Scholar] [CrossRef] [PubMed]
- Colomban, C.; Philouze, C.; Molton, F.; Leconte, N.; Thomas, F. Copper(II) Complexes of N3O Ligands as Models for Galactose Oxidase: Effect of Variation of Steric Bulk of Coordinated Phenoxyl Moiety on the Radical Stability and Spectroscopy. Inorganica Chim. Acta 2018, 481, 129–142. [Google Scholar] [CrossRef]
- Smith, A.L.; Hardcastle, K.I.; Soper, J.D. Redox-Active Ligand-Mediated Oxidative Addition and Reductive Elimination at Square Planar Cobalt(III): Multielectron Reactions for Cross-Coupling. J. Am. Chem. Soc. 2010, 132, 14358–14360. [Google Scholar] [CrossRef]
- Dzik, W.I.; Van Der Vlugt, J.I.; Reek, J.N.H.; De Bruin, B. Ligands That Store and Release Electrons during Catalysis. Angew. Chemie - Int. Ed. 2011, 50, 3356–3358. [Google Scholar] [CrossRef]
- Borré, E.; Dahm, G.; Aliprandi, A.; Mauro, M.; Dagorne, S.; Bellemin-Laponnaz, S. Tridentate Complexes of Group 10 Bearing Bis-Aryloxide N-Heterocyclic Carbene Ligands: Synthesis, Structural, Spectroscopic, and Computational Characterization. Organometallics 2014, 33, 4374–4384. [Google Scholar] [CrossRef]
- Romain, C.; Miqueu, K.; Sotiropoulos, J.M.; Bellemin-Laponnaz, S.; Dagorne, S. Non-Innocent Behavior of a Tridentate NHC Chelating Ligand Coordinated onto a Zirconium(IV) Center. Angew. Chemie - Int. Ed. 2010, 49, 2198–2201. [Google Scholar] [CrossRef] [PubMed]
- Gafurov, Z.N.; Kantyukov, A.O.; Kagilev, A.A.; Kagileva, A.A.; Sakhapov, I.F.; Mikhailov, I.K.; Yakhvarov, D.G. Recent Advances in Chemistry of Unsymmetrical Phosphorus-Based Pincer Nickel Complexes: From Design to Catalytic Applications. Molecules 2021, 26, 4063. [Google Scholar] [CrossRef] [PubMed]
- Lee, M.T.; Hu, C.H. Density Functional Study of N-Heterocyclic and Diamino Carbene Complexes: Comparison with Phosphines. Organometallics 2004, 23, 976–983. [Google Scholar] [CrossRef]
- Lummiss, J.A.M.; Higman, C.S.; Fyson, D.L.; McDonald, R.; Fogg, D.E. The Divergent Effects of Strong NHC Donation in Catalysis. Chem. Sci. 2015, 6, 6739–6746. [Google Scholar] [CrossRef] [PubMed]
- Gandara, C.; Philouze, C.; Jarjayes, O.; Thomas, F. Coordination Chemistry of a Redox Non-Innocent NHC Bis(Phenolate) Pincer Ligand with Nickel(II). Inorganica Chim. Acta 2018, 482, 561–566. [Google Scholar] [CrossRef]
- Kunert, R.; Philouze, C.; Jarjayes, O.; Thomas, F. Stable M(II)-Radicals and Nickel(III) Complexes of a Bis(Phenol) N-Heterocyclic Carbene Chelated to Group 10 Metal Ions. Inorg. Chem. 2019, 58, 8030–8044. [Google Scholar] [CrossRef]
- Taakili, R.; Canac, Y. NHC Core Pincer Ligands Exhibiting Two Anionic Coordinating Extremities. Molecules 2020, 25, 2231. [Google Scholar] [CrossRef] [PubMed]
- Harris, C.F.; Bayless, M.B.; Van Leest, N.P.; Bruch, Q.J.; Livesay, B.N.; Bacsa, J.; Hardcastle, K.I.; Shores, M.P.; De Bruin, B.; Soper, J.D. Redox-Active Bis(Phenolate) N-Heterocyclic Carbene [OCO] Pincer Ligands Support Cobalt Electron Transfer Series Spanning Four Oxidation States. Inorg. Chem. 2017, 56, 12421–12435. [Google Scholar] [CrossRef]
- Goswami, M.; Lyaskovskyy, V.; Domingos, S.R.; Buma, W.J.; Woutersen, S.; Troeppner, O.; Ivanović-Burmazović, I.; Lu, H.; Cui, X.; Zhang, X.P.; et al. Characterization of Porphyrin-Co(III)-’nitrene Radical’ Species Relevant in Catalytic Nitrene Transfer Reactions. J. Am. Chem. Soc. 2015, 137, 5468–5479. [Google Scholar] [CrossRef]
- Rosenthal, A.J.; Vogt, M.; De Bruin, B.; Grützmacher, H. A Diolefin Diamide Rhodium(I) Complex and Its One-Electron Oxidation Resulting in a Two-Center, Three-Electron Rh-N Bond. Eur. J. Inorg. Chem. 2013, 2013, 5831–5835. [Google Scholar] [CrossRef]
- Luconi, L.; Gafurov, Z.; Rossin, A.; Tuci, G.; Sinyashin, O.; Yakhvarov, D.; Giambastiani, G. Palladium(II) Pyrazolyl–Pyridyl Complexes Containing a Sterically Hindered N-Heterocyclic Carbene Moiety for the Suzuki-Miyaura Cross-Coupling Reaction. Inorganica Chim. Acta 2018, 470, 100–105. [Google Scholar] [CrossRef]
- Luconi, L.; Garino, C.; Cerreia Vioglio, P.; Gobetto, R.; Chierotti, M.R.; Yakhvarov, D.; Gafurov, Z.N.; Morozov, V.; Sakhapov, I.; Rossin, A.; et al. Halogen-Bonding Interactions and Electrochemical Properties of Unsymmetrical Pyrazole Pincer NiII Halides: A Peculiar Behavior of the Fluoride Complex (PCN)NiF. ACS Omega 2019, 4, 1118–1129. [Google Scholar] [CrossRef]
- Luconi, L.; Tuci, G.; Gafurov, Z.N.; Mercuri, G.; Kagilev, A.A.; Pettinari, C.; Morozov, V.I.; Yakhvarov, D.G.; Rossin, A.; Giambastiani, G. Unsymmetrical Nickel (PCN) Pincer Complexes with a Benzothiazole Side-Arm: Synthesis, Characterization and Electrochemical Properties. Inorganica Chim. Acta 2020, 517, 120182. [Google Scholar] [CrossRef]
- Gafurov, Z.N.; Kantyukov, A.O.; Kagilev, A.A.; Sakhapov, I.F.; Luconi, L.; Rossin, A.; Giambastiani, G.; Babaev, V.M.; Islamov, D.R.; Usachev, K.S.; et al. Electrochemical Generation of Pyrazolyl-Pyridyl N-Heterocyclic Carbene Complexes of Nickel. Russ. J. Electrochem. 2021, 57, 134–140. [Google Scholar] [CrossRef]
- Gafurov, Z.N.; Kagilev, A.A.; Kantyukov, A.O.; Balabaev, A.A.; Sinyashin, O.G.; Yakhvarov, D.G. Classification and Synthesis of Nickel Pincer Complexes. Russ. Chem. Bull. 2018, 67, 385–394. [Google Scholar] [CrossRef]
- Gafurov, Z.N.; Bekmukhamedov, G.E.; Kagilev, A.A.; Kantyukov, A.O.; Sakhapov, I.F.; Mikhailov, I.K.; Khayarov, K.R.; Zaripov, R.B.; Islamov, D.R.; Usachev, K.S.; et al. Unsymmetrical Pyrazole-Based PCN Pincer NiII Halides: Reactivity and Catalytic Activity in Ethylene Oligomerization. J. Organomet. Chem. 2020, 912, 121163. [Google Scholar] [CrossRef]
- Gafurov, Z.N.; Zueva, E.M.; Bekmukhamedov, G.E.; Kagilev, A.A.; Kantyukov, A.O.; Mikhailov, I.K.; Khayarov, K.R.; Petrova, M.M.; Dovzhenko, A.P.; Rossin, A.; et al. Benzothiazole- vs. Pyrazole-Based Unsymmetrical (PCN) Pincer Complexes of Nickel(II) as Homogeneous Catalysts in Ethylene Oligomerization. J. Organomet. Chem. 2021, 949, 121951. [Google Scholar] [CrossRef]
- Long, J.; Lyubov, D.M.; Gurina, G.A.; Nelyubina, Y. V.; Salles, F.; Guari, Y.; Larionova, J.; Trifonov, A.A. Using N-Heterocyclic Carbenes as Weak Equatorial Ligands to Design Single-Molecule Magnets: Zero-Field Slow Relaxation in Two Octahedral Dysprosium(III) Complexes. Inorg. Chem. 2022, 61, 1264–1269. [Google Scholar] [CrossRef] [PubMed]
- Shimazaki, Y.; Stack, T.D.P.; Storr, T. Detailed Evaluation of the Geometric and Electronic Structures of One-Electron Oxidized Group 10 (Ni, Pd, and Pt) Metal(II)-(Disalicylidene) Diamine Complexes. Inorg. Chem. 2009, 48, 8383–8392. [Google Scholar] [CrossRef]
- Rotthaus, O.; Thomas, F.; Jarjayes, O.; Philouze, C.; Saint-Aman, E.; Pierre, J.L. Valence Tautomerism in Octahedral and Square-Planar Phenoxyl-Nickel(II) Complexes: Are Imino Nitrogen Atoms Good Friends? Chem. - A Eur. J. 2006, 12, 6953–6962. [Google Scholar] [CrossRef] [PubMed]
- Pistner, A.J.; Moon, H.W.; Silakov, A.; Yennawar, H.P.; Radosevich, A.T. Stable Open-Shell Phosphorane Based on a Redox-Active Amidodiphenoxide Scaffold. Inorg. Chem. 2017, 56, 8661–8668. [Google Scholar] [CrossRef] [PubMed]
- Poyatos, M.; Maisse-François, A.; Bellemin-Laponnaz, S.; Gade, L.H. Coordination Chemistry of a Modular N,C-Chelating Oxazole-Carbene Ligand and Its Applications in Hydrosilylation Catalysis. Organometallics 2006, 25, 2634–2641. [Google Scholar] [CrossRef]
- Schneider, N.; Bellemin-Laponnaz, S.; Wadepohl, H.; Gade, L.H. A New Class of Modular Oxazoline-NHC Ligands and Their Coordination Chemistry with Platinum Metals. Eur. J. Inorg. Chem. 2008, 2008, 5587–5598. [Google Scholar] [CrossRef]
- Jahnke, M.C.; Pape, T.; Hahn, F.E. Platinum Complexes with Picoline-Functionalized Benzimidazolin-2-Ylidene Ligands. Zeitschrift fur Naturforsch. - Sect. B J. Chem. Sci. 2010, 65, 341–346. [Google Scholar] [CrossRef]
- Meyer, D.; Zeller, A.; Strassner, T. Platinum Complexes with Pyrimidine-Functionalized N-Heterocyclic Carbene Ligands-Synthesis and Solid State Structures. J. Organomet. Chem. 2012, 701, 56–61. [Google Scholar] [CrossRef]
- Cao, P.; Cabrera, J.; Padilla, R.; Serra, D.; Rominger, F.; Limbach, M. Hydroamination of Unactivated Alkenes Catalyzed by Novel Platinum(II) N -Heterocyclic Carbene Complexes. Organometallics 2012, 31, 921–929. [Google Scholar] [CrossRef]
- Wei, C.H.; Hingerty, B.E.; Busing, W.R. Structure of Tetrakis(Pyridine)Platinum(II) Chloride Trihydrate: Unconstrained Anisotropic Least-Squares Refinement of Hydrogen and Non-Hydrogen Atoms from Combined X-Ray–Neutron Diffraction Data. Acta Crystallogr. Sect. C Cryst. Struct. Commun. 1989, 45, 26–30. [Google Scholar] [CrossRef]
- Thomas, F.; Jarjayes, O.; Duboc, C.; Philouze, C.; Saint-Aman, E.; Pierre, J.-L. Intramolecularly Hydrogen-Bonded versus Copper( <scp>ii</Scp> ) Coordinated Mono- and Bis-Phenoxyl Radicals. Dalt. Trans. 2004, 2662–2669. [Google Scholar] [CrossRef]
- Chiang, L.; Kochem, A.; Jarjayes, O.; Dunn, T.J.; Vezin, H.; Sakaguchi, M.; Ogura, T.; Orio, M.; Shimazaki, Y.; Thomas, F.; et al. Radical Localization in a Series of Symmetric NiII Complexes with Oxidized Salen Ligands. Chem. - A Eur. J. 2012, 18, 14117–14127. [Google Scholar] [CrossRef]
- Storr, T.; Wasinger, E.C.; Pratt, R.C.; Stack, T.D.P. The Geometric and Electronic Structure of a One-Electron-Oxidized Nickel(II) Bis(Salicylidene)Diamine Complex. Angew. Chemie 2007, 119, 5290–5293. [Google Scholar] [CrossRef]
- Mruthunjaya, A.K.V.; Torriero, A.A.J. Mechanistic Aspects of the Electrochemical Oxidation of Aliphatic Amines and Aniline Derivatives. Molecules 2023, 28, 471. [Google Scholar] [CrossRef] [PubMed]
- Zhu, Y.; Zhang, J.; Chen, Z.; Zhang, A.; Ma, C. Synthesis of Nitrocarbazole Compounds and Their Electrocatalytic Oxidation of Alcohol. Cuihua Xuebao/Chinese J. Catal. 2016, 37, 533–538. [Google Scholar] [CrossRef]
- Steckhan, E. Indirect Electroorganic Syntheses—A Modern Chapter of Organic Electrochemistry [New Synthetic Methods (59)]. Angew. Chemie Int. Ed. English 1986, 25, 683–701. [Google Scholar] [CrossRef]
- Sheldrick, G.M. SHELXT - Integrated Space-Group and Crystal-Structure Determination. Acta Crystallogr. Sect. A Found. Crystallogr. 2015, 71, 3–8. [Google Scholar] [CrossRef] [PubMed]
- Sheldrick, G.M. Crystal Structure Refinement with SHELXL. Acta Crystallogr. Sect. C Struct. Chem. 2015, 71, 3–8. [Google Scholar] [CrossRef] [PubMed]
- Farrugia, L.J. WinGX and ORTEP for Windows: An Update. J. Appl. Crystallogr. 2012, 45, 849–854. [Google Scholar] [CrossRef]
- Spek, A.L. Structure Validation in Chemical Crystallography. Acta Crystallogr. Sect. D Biol. Crystallogr. 2009, 65, 148–155. [Google Scholar] [CrossRef] [PubMed]
- Macrae, C.F.; Edgington, P.R.; McCabe, P.; Pidcock, E.; Shields, G.P.; Taylor, R.; Towler, M.; Van De Streek, J. Mercury: Visualization and Analysis of Crystal Structures. J. Appl. Crystallogr. 2006, 39, 453–457. [Google Scholar] [CrossRef]
- Adamo, C.; Barone, V. Toward Reliable Density Functional Methods without Adjustable Parameters: The PBE0 Model. J. Chem. Phys. 1999, 110, 6158–6170. [Google Scholar] [CrossRef]
- Dunning, T.H.; Hay, P.J. Gaussian Basis Sets for Molecular Calculations. In Methods of Electronic Structure Theory; Springer US: Boston, MA, 1977; pp. 1–27. [Google Scholar]
- Hay, P.J.; Wadt, W.R. Ab Initio Effective Core Potentials for Molecular Calculations. Potentials for the Transition Metal Atoms Sc to Hg. J. Chem. Phys. 1985, 82, 270–283. [Google Scholar] [CrossRef]
- Wadt, W.R.; Hay, P.J. Ab Initio Effective Core Potentials for Molecular Calculations. Potentials for Main Group Elements Na to Bi. J. Chem. Phys. 1985, 82, 284–298. [Google Scholar] [CrossRef]
- Hay, P.J.; Wadt, W.R. Ab Initio Effective Core Potentials for Molecular Calculations. Potentials for K to Au Including the Outermost Core Orbitale. J. Chem. Phys. 1985, 82, 299–310. [Google Scholar] [CrossRef]
- Becke, A.D. Density-Functional Thermochemistry. III. The Role of Exact Exchange. J. Chem. Phys. 1993, 98, 5648–5652. [Google Scholar] [CrossRef]
- Stephens, P.J.; Devlin, F.J.; Chabalowski, C.F.; Frisch, M.J. Ab Initio Calculation of Vibrational Absorption and Circular Dichroism Spectra Using Density Functional Force Fields. J. Phys. Chem. 1994, 98, 11623–11627. [Google Scholar] [CrossRef]
- Weigend, F.; Ahlrichs, R. Balanced Basis Sets of Split Valence, Triple Zeta Valence and Quadruple Zeta Valence Quality for H to Rn: Design and Assessment of Accuracy. Phys. Chem. Chem. Phys. 2005, 7, 3297–3305. [Google Scholar] [CrossRef] [PubMed]
- Weigend, F. Accurate Coulomb-Fitting Basis Sets for H to Rn. Phys. Chem. Chem. Phys. 2006, 8, 1057–1065. [Google Scholar] [CrossRef]
- Peterson, K.A.; Figgen, D.; Goll, E.; Stoll, H.; Dolg, M. Systematically Convergent Basis Sets with Relativistic Pseudopotentials. II. Small-Core Pseudopotentials and Correlation Consistent Basis Sets for the Post-d Group 16-18 Elements. J. Chem. Phys. 2003, 119, 11113–11123. [Google Scholar] [CrossRef]
- Neese, F. Software Update: The ORCA Program System, Version 4.0. Wiley Interdiscip. Rev. Comput. Mol. Sci. 2018, 8, e1327–e1332. [Google Scholar] [CrossRef]

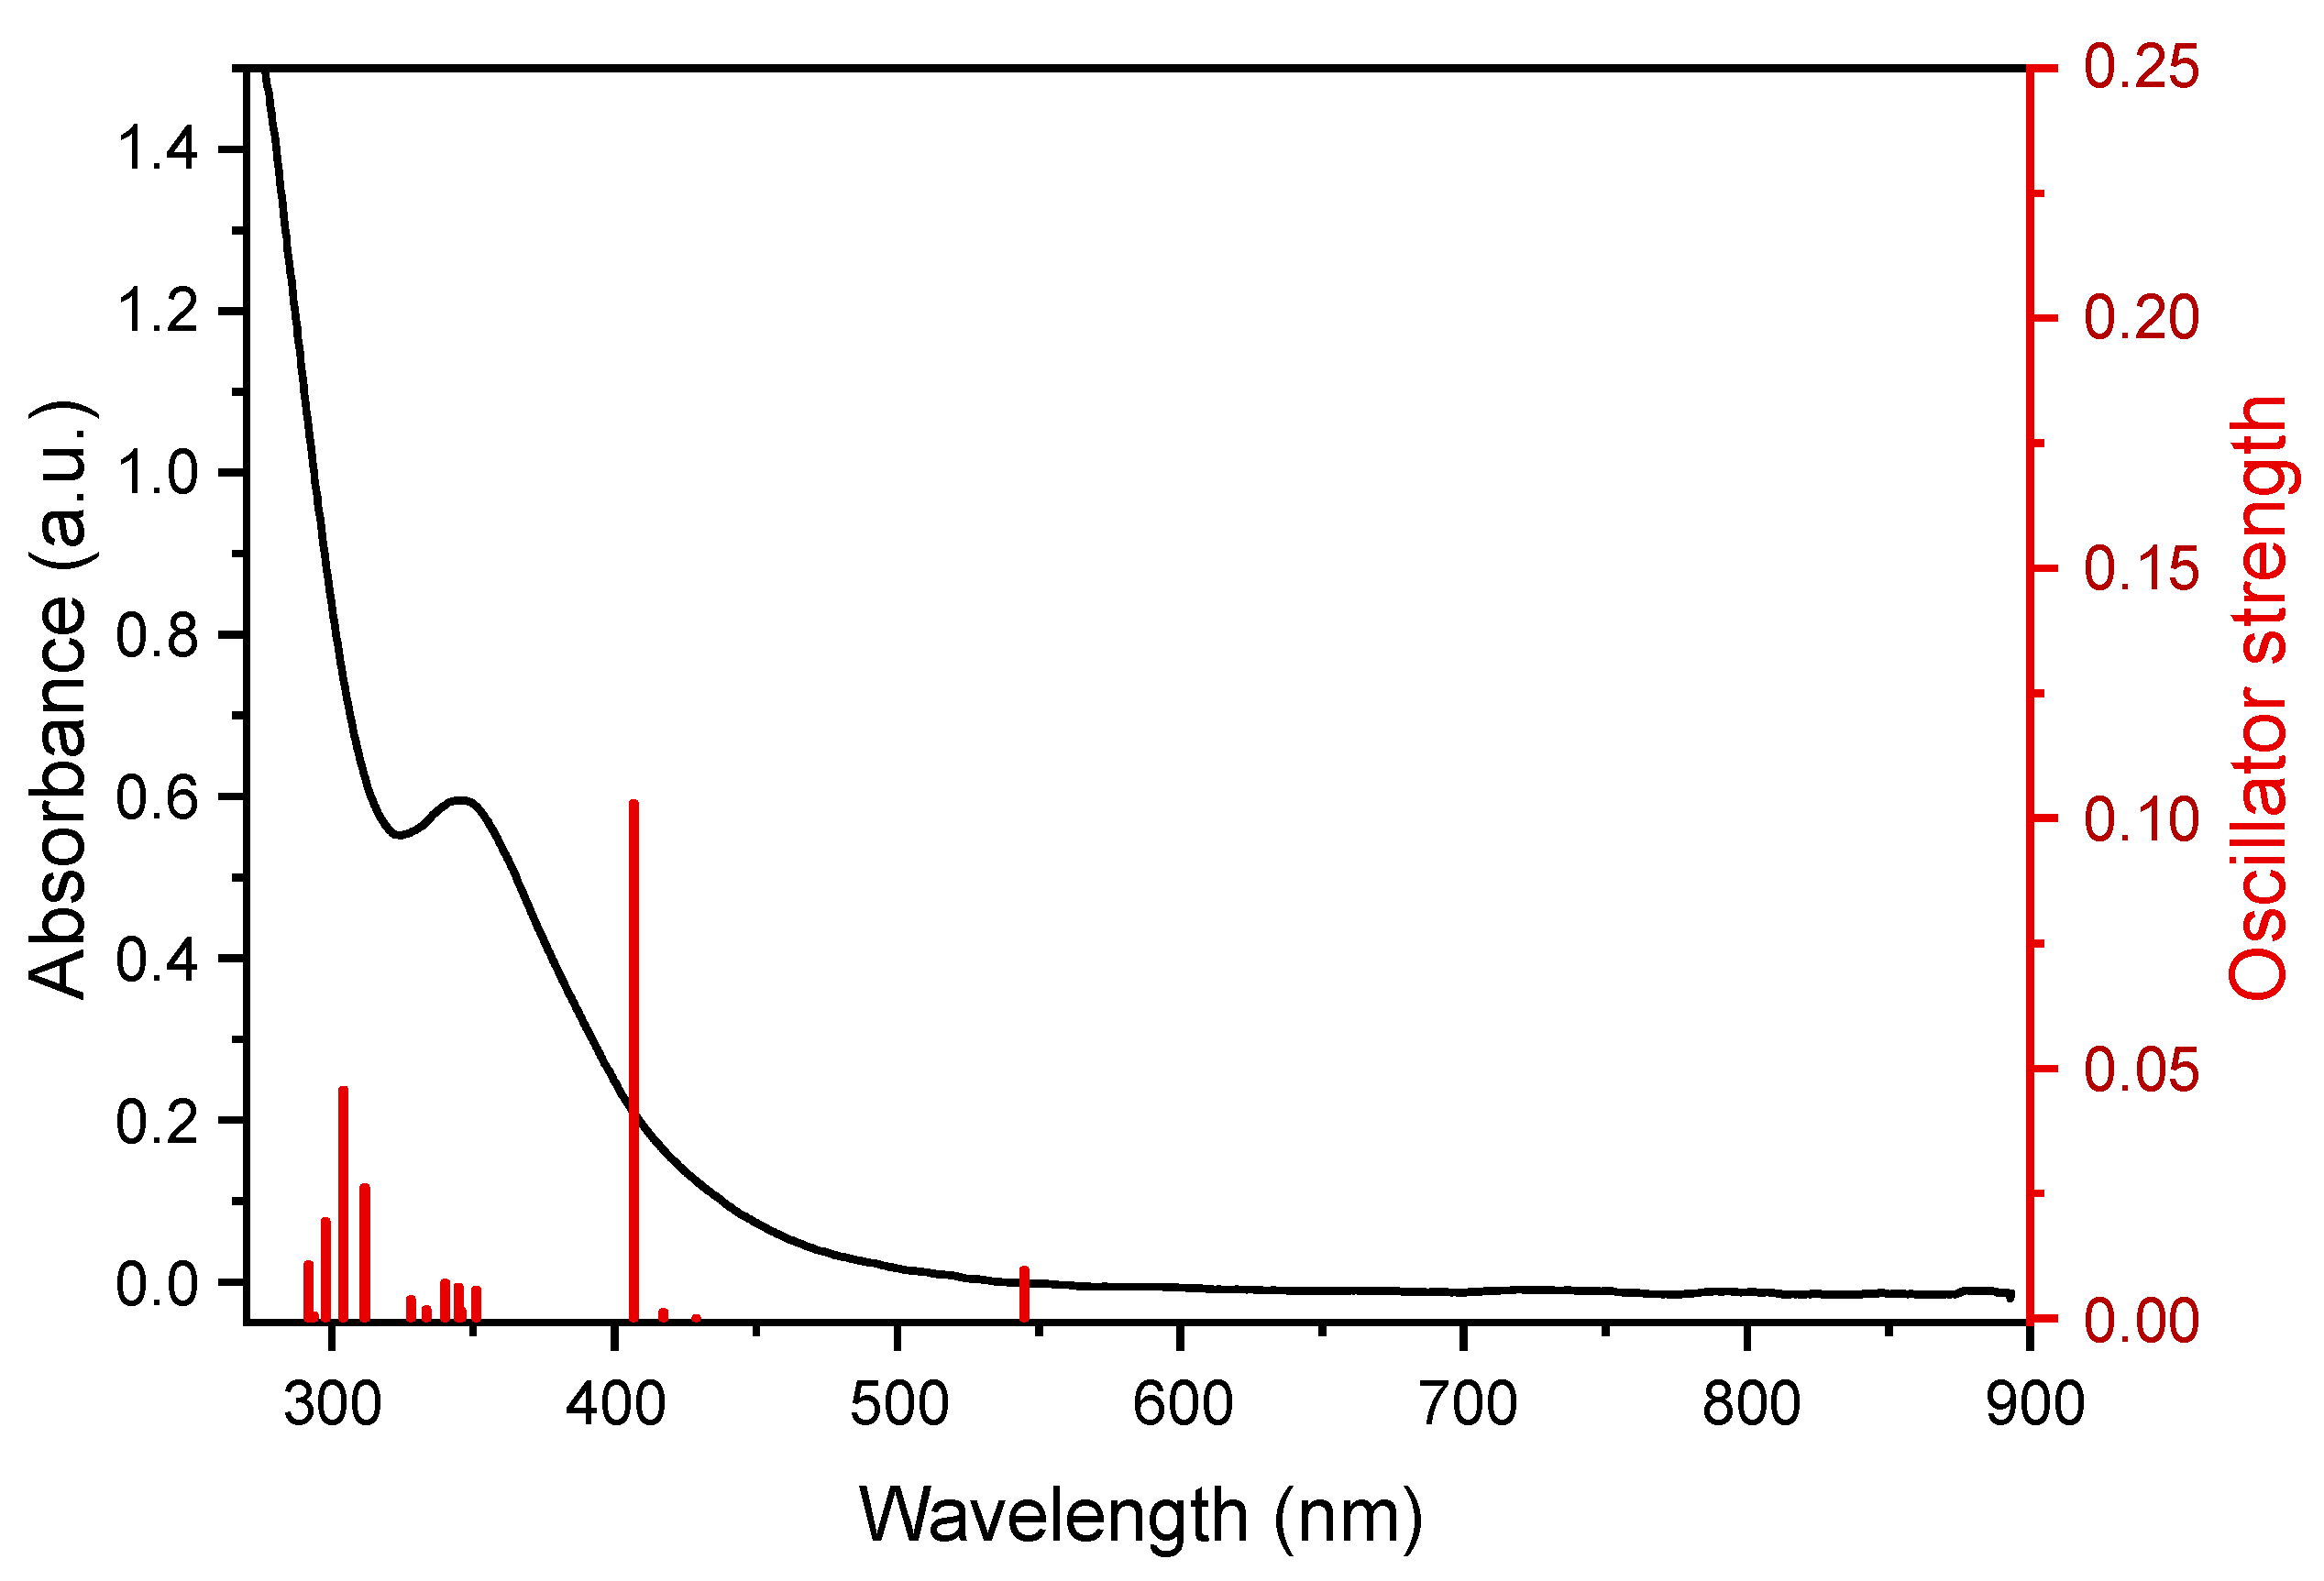
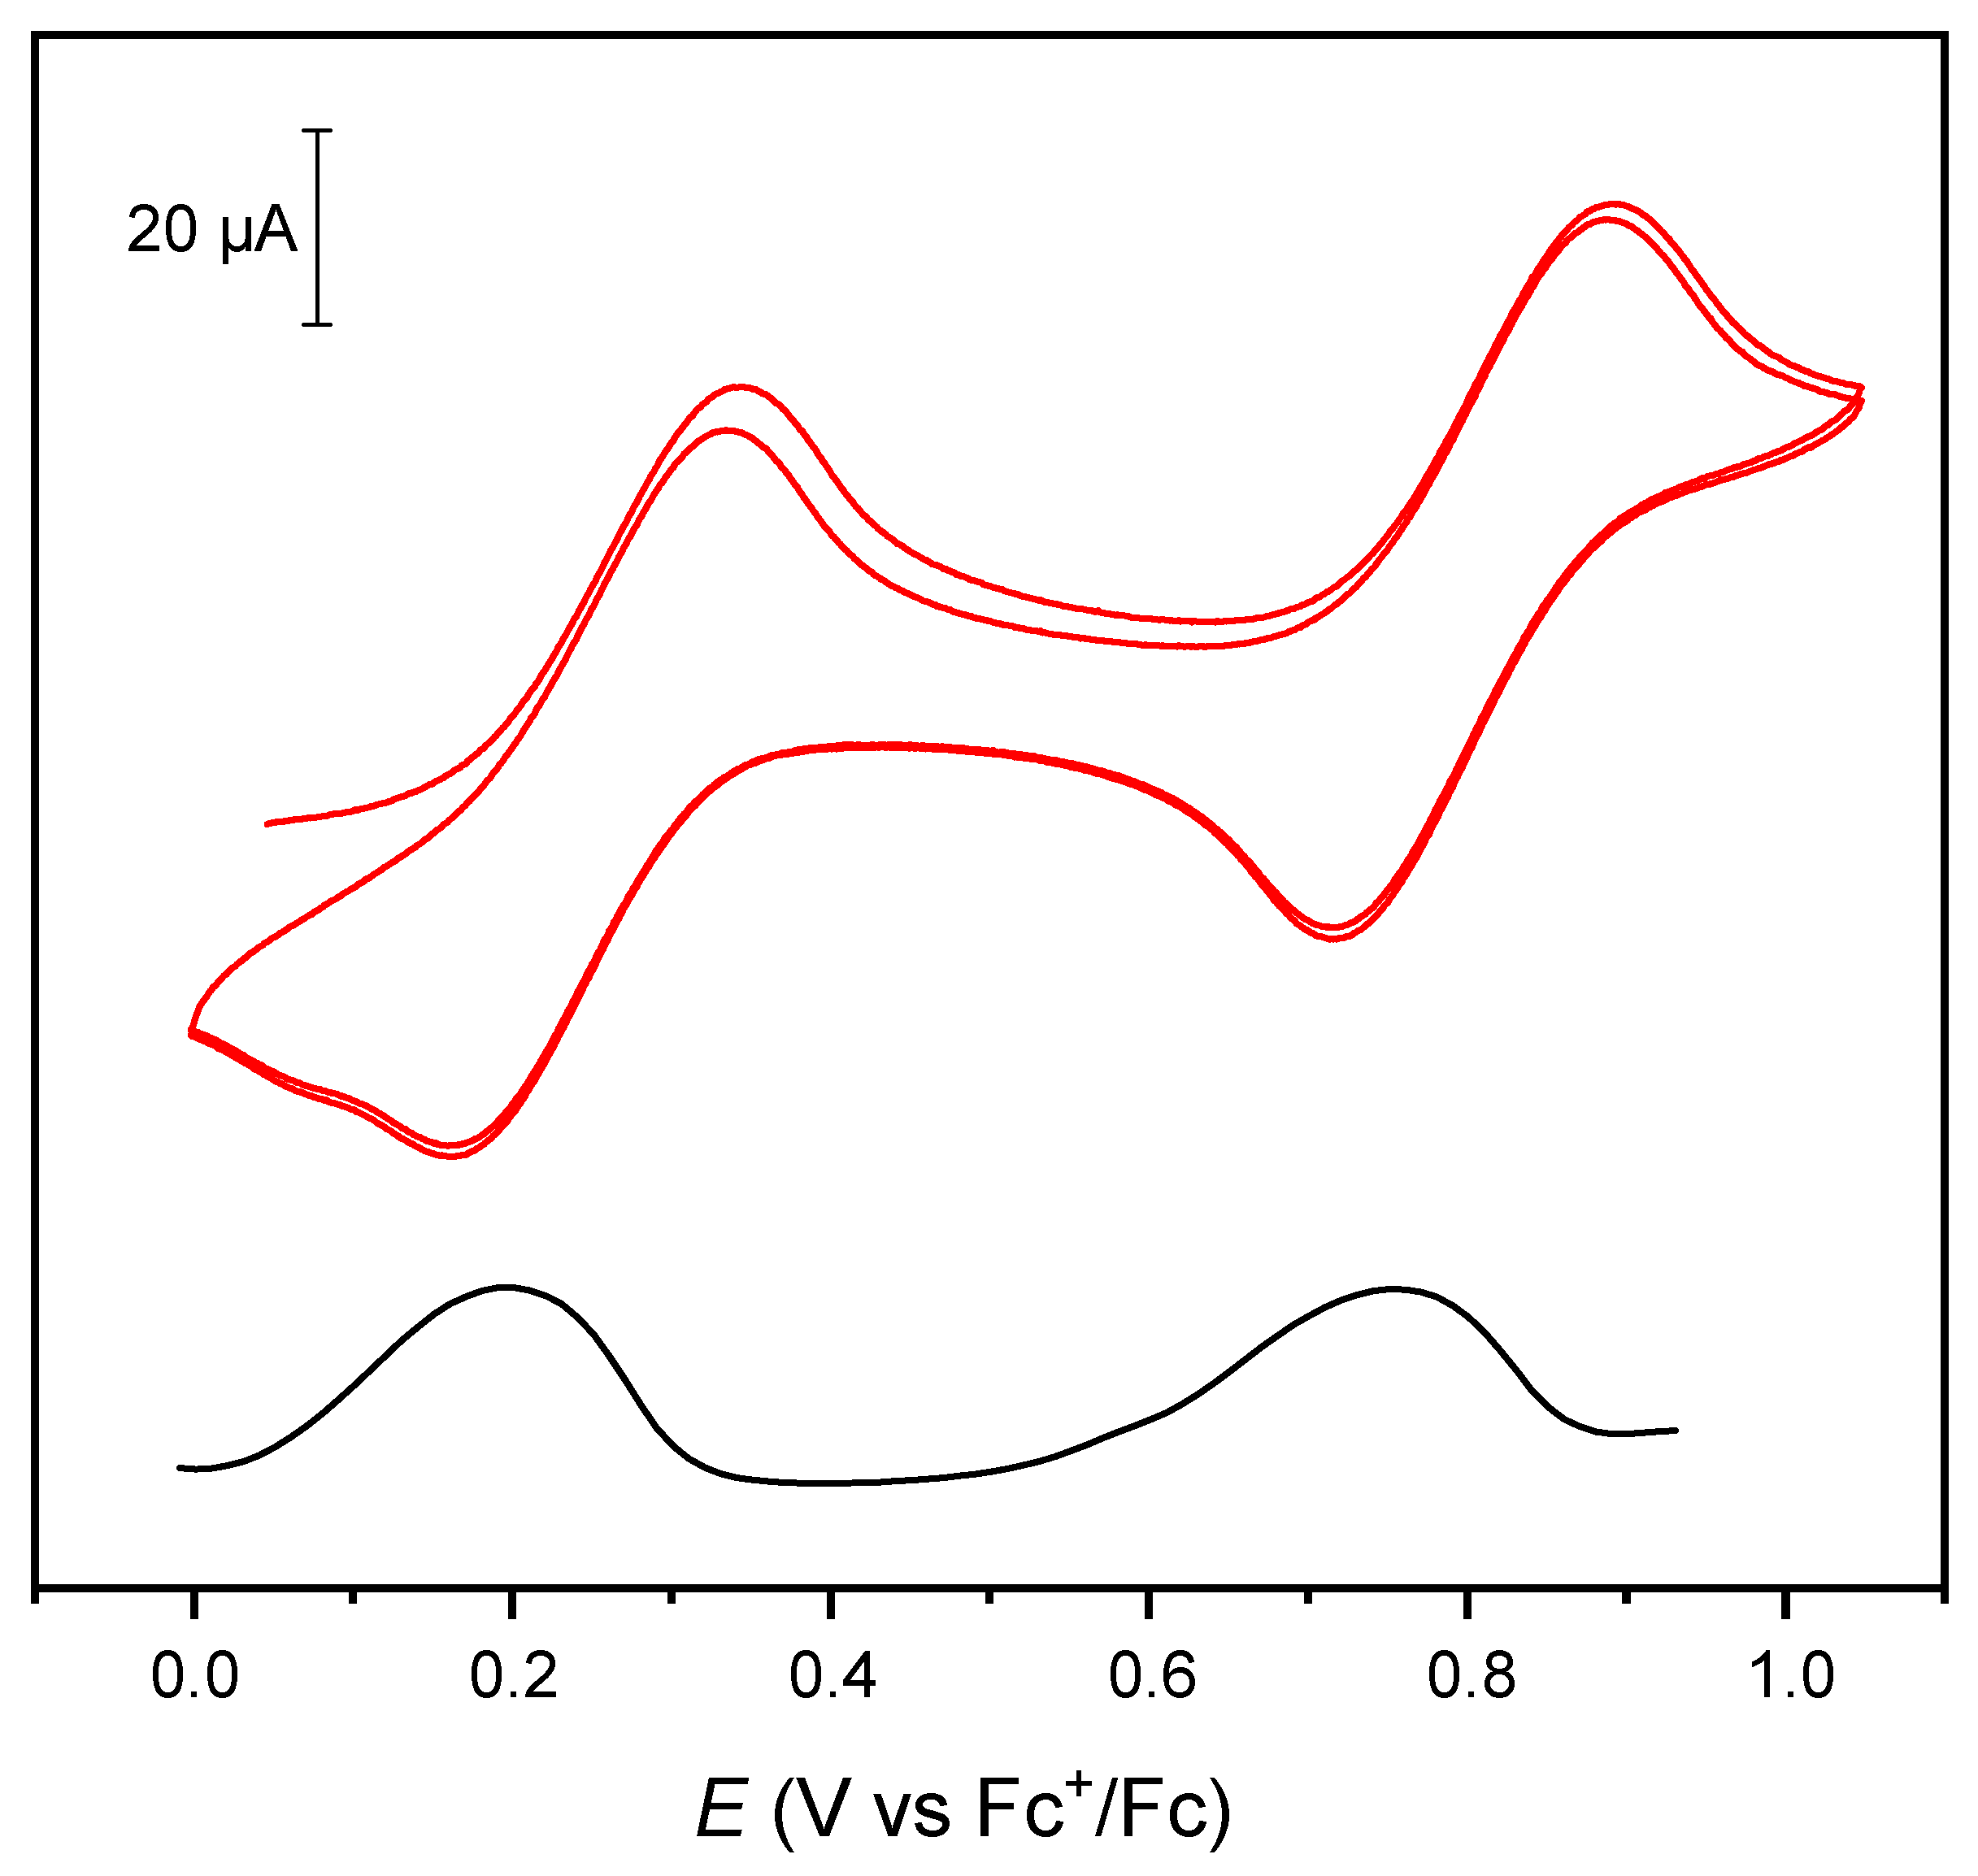

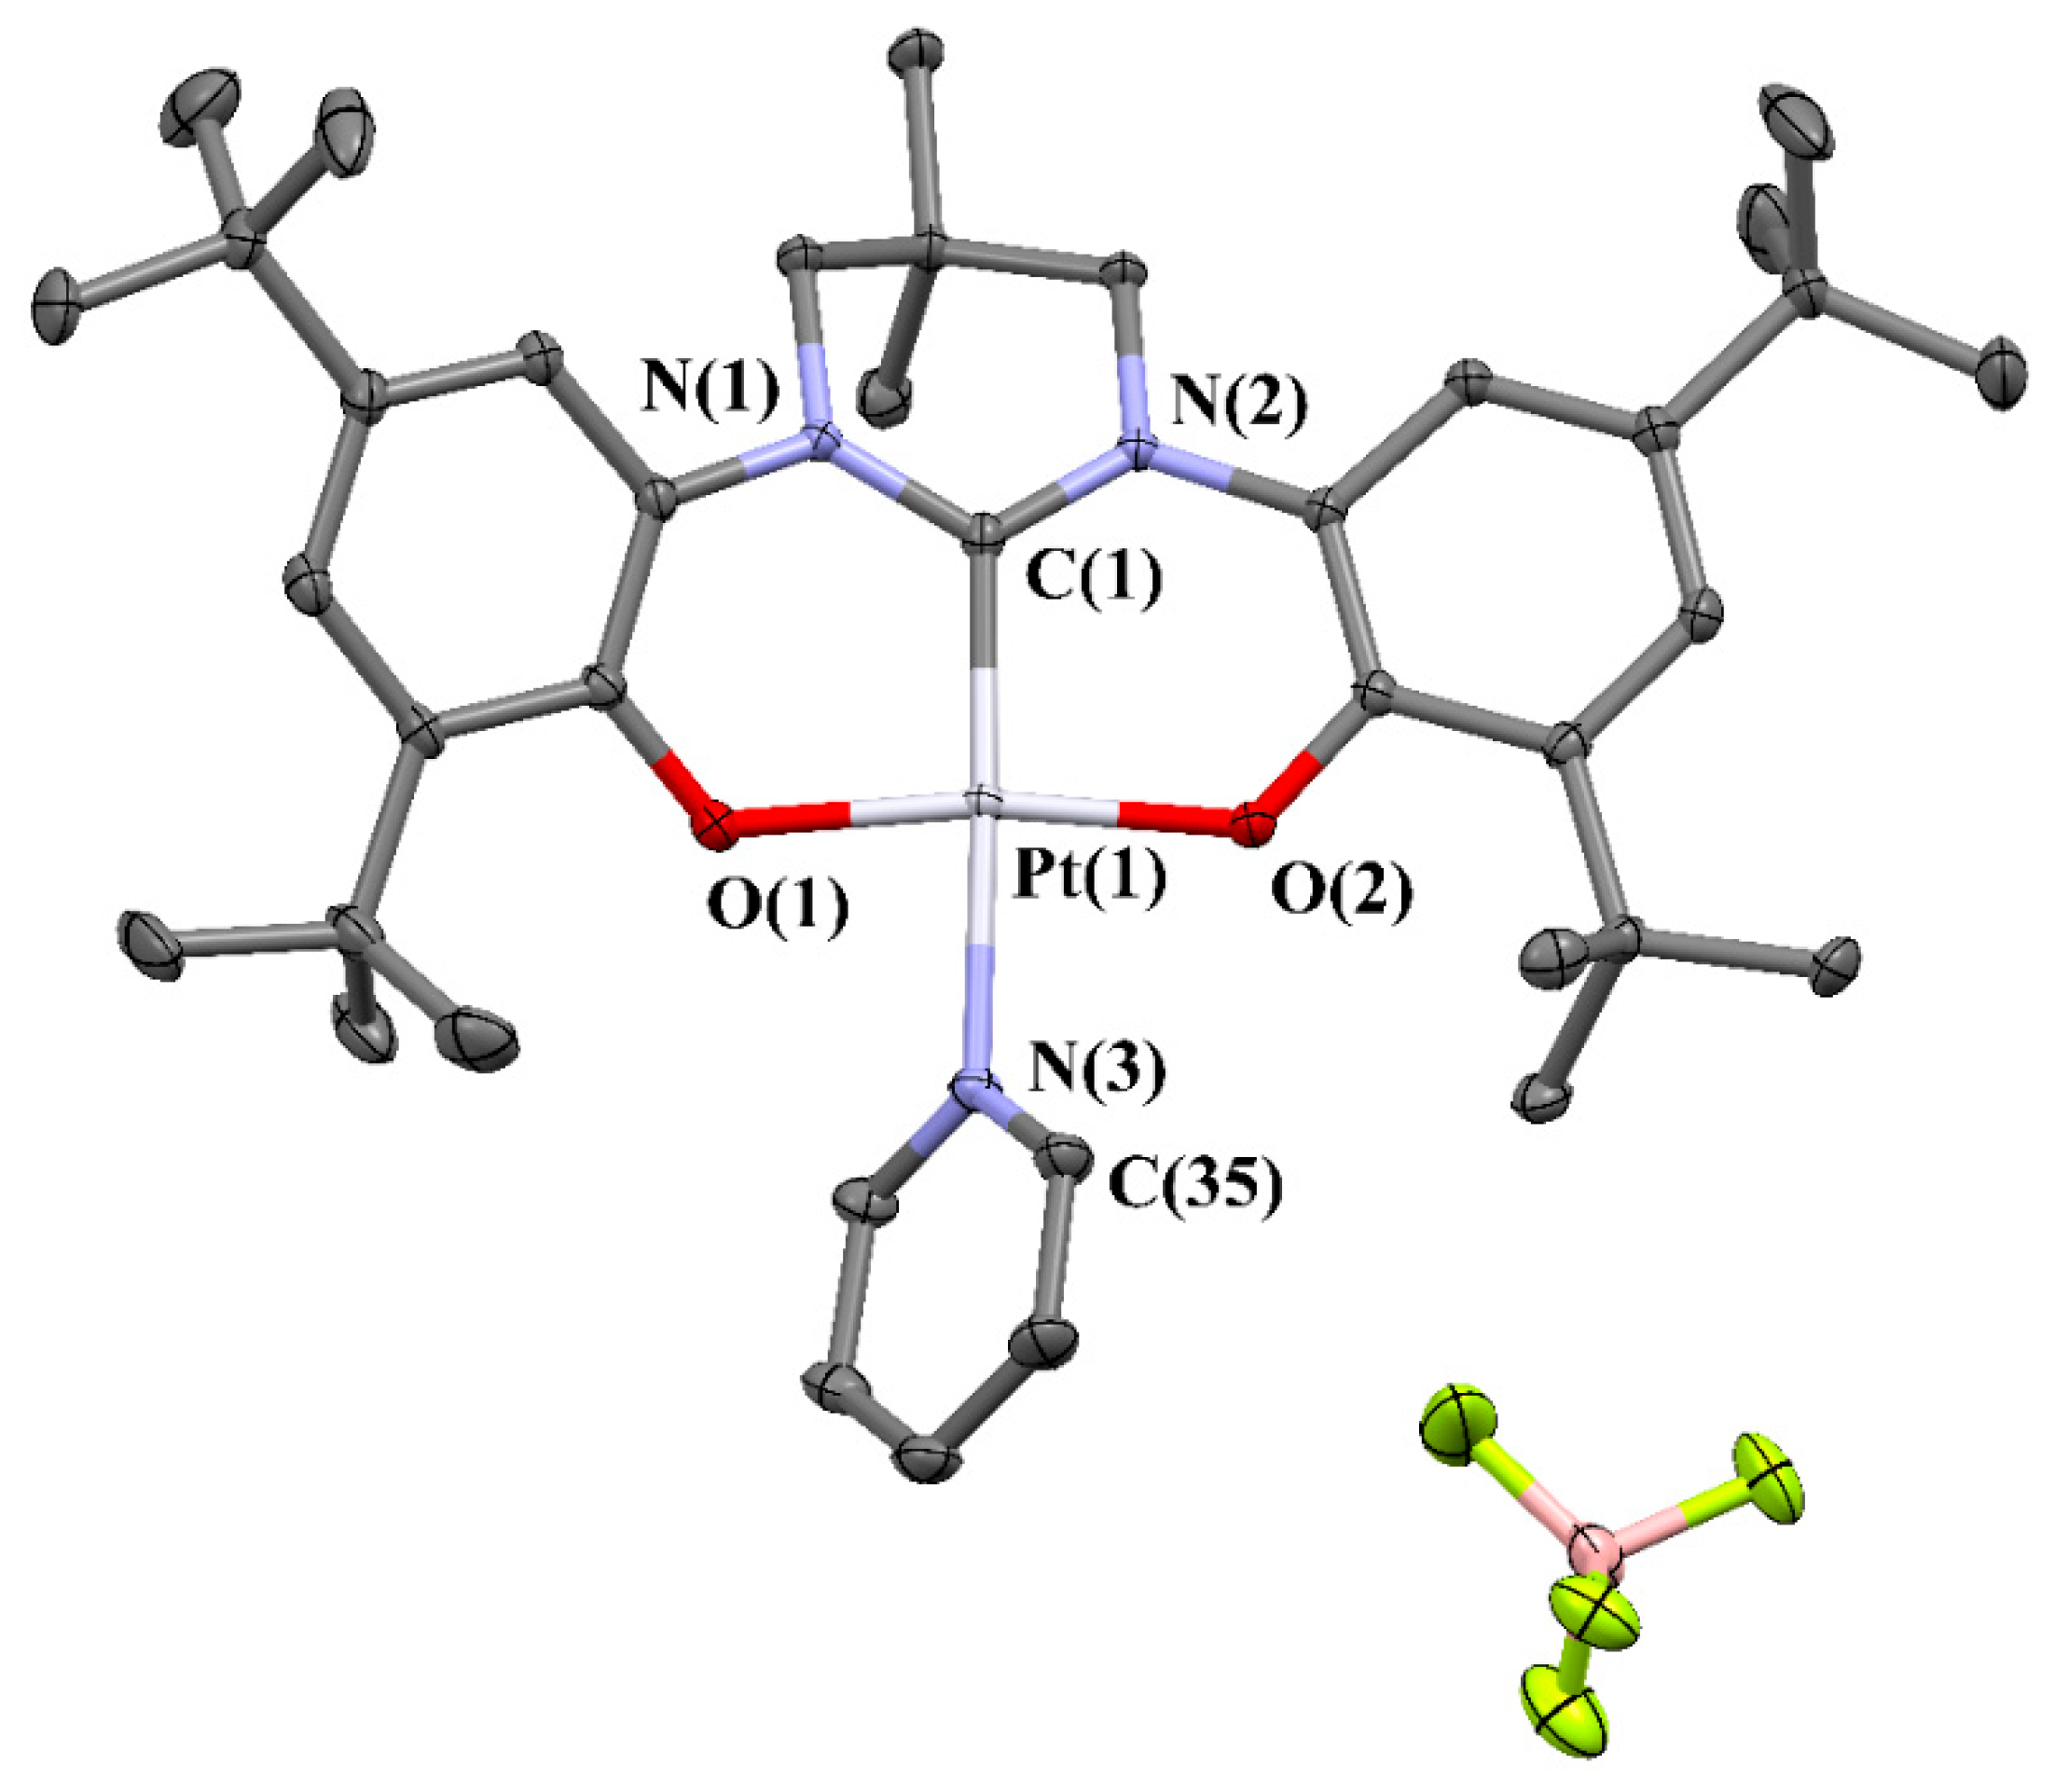
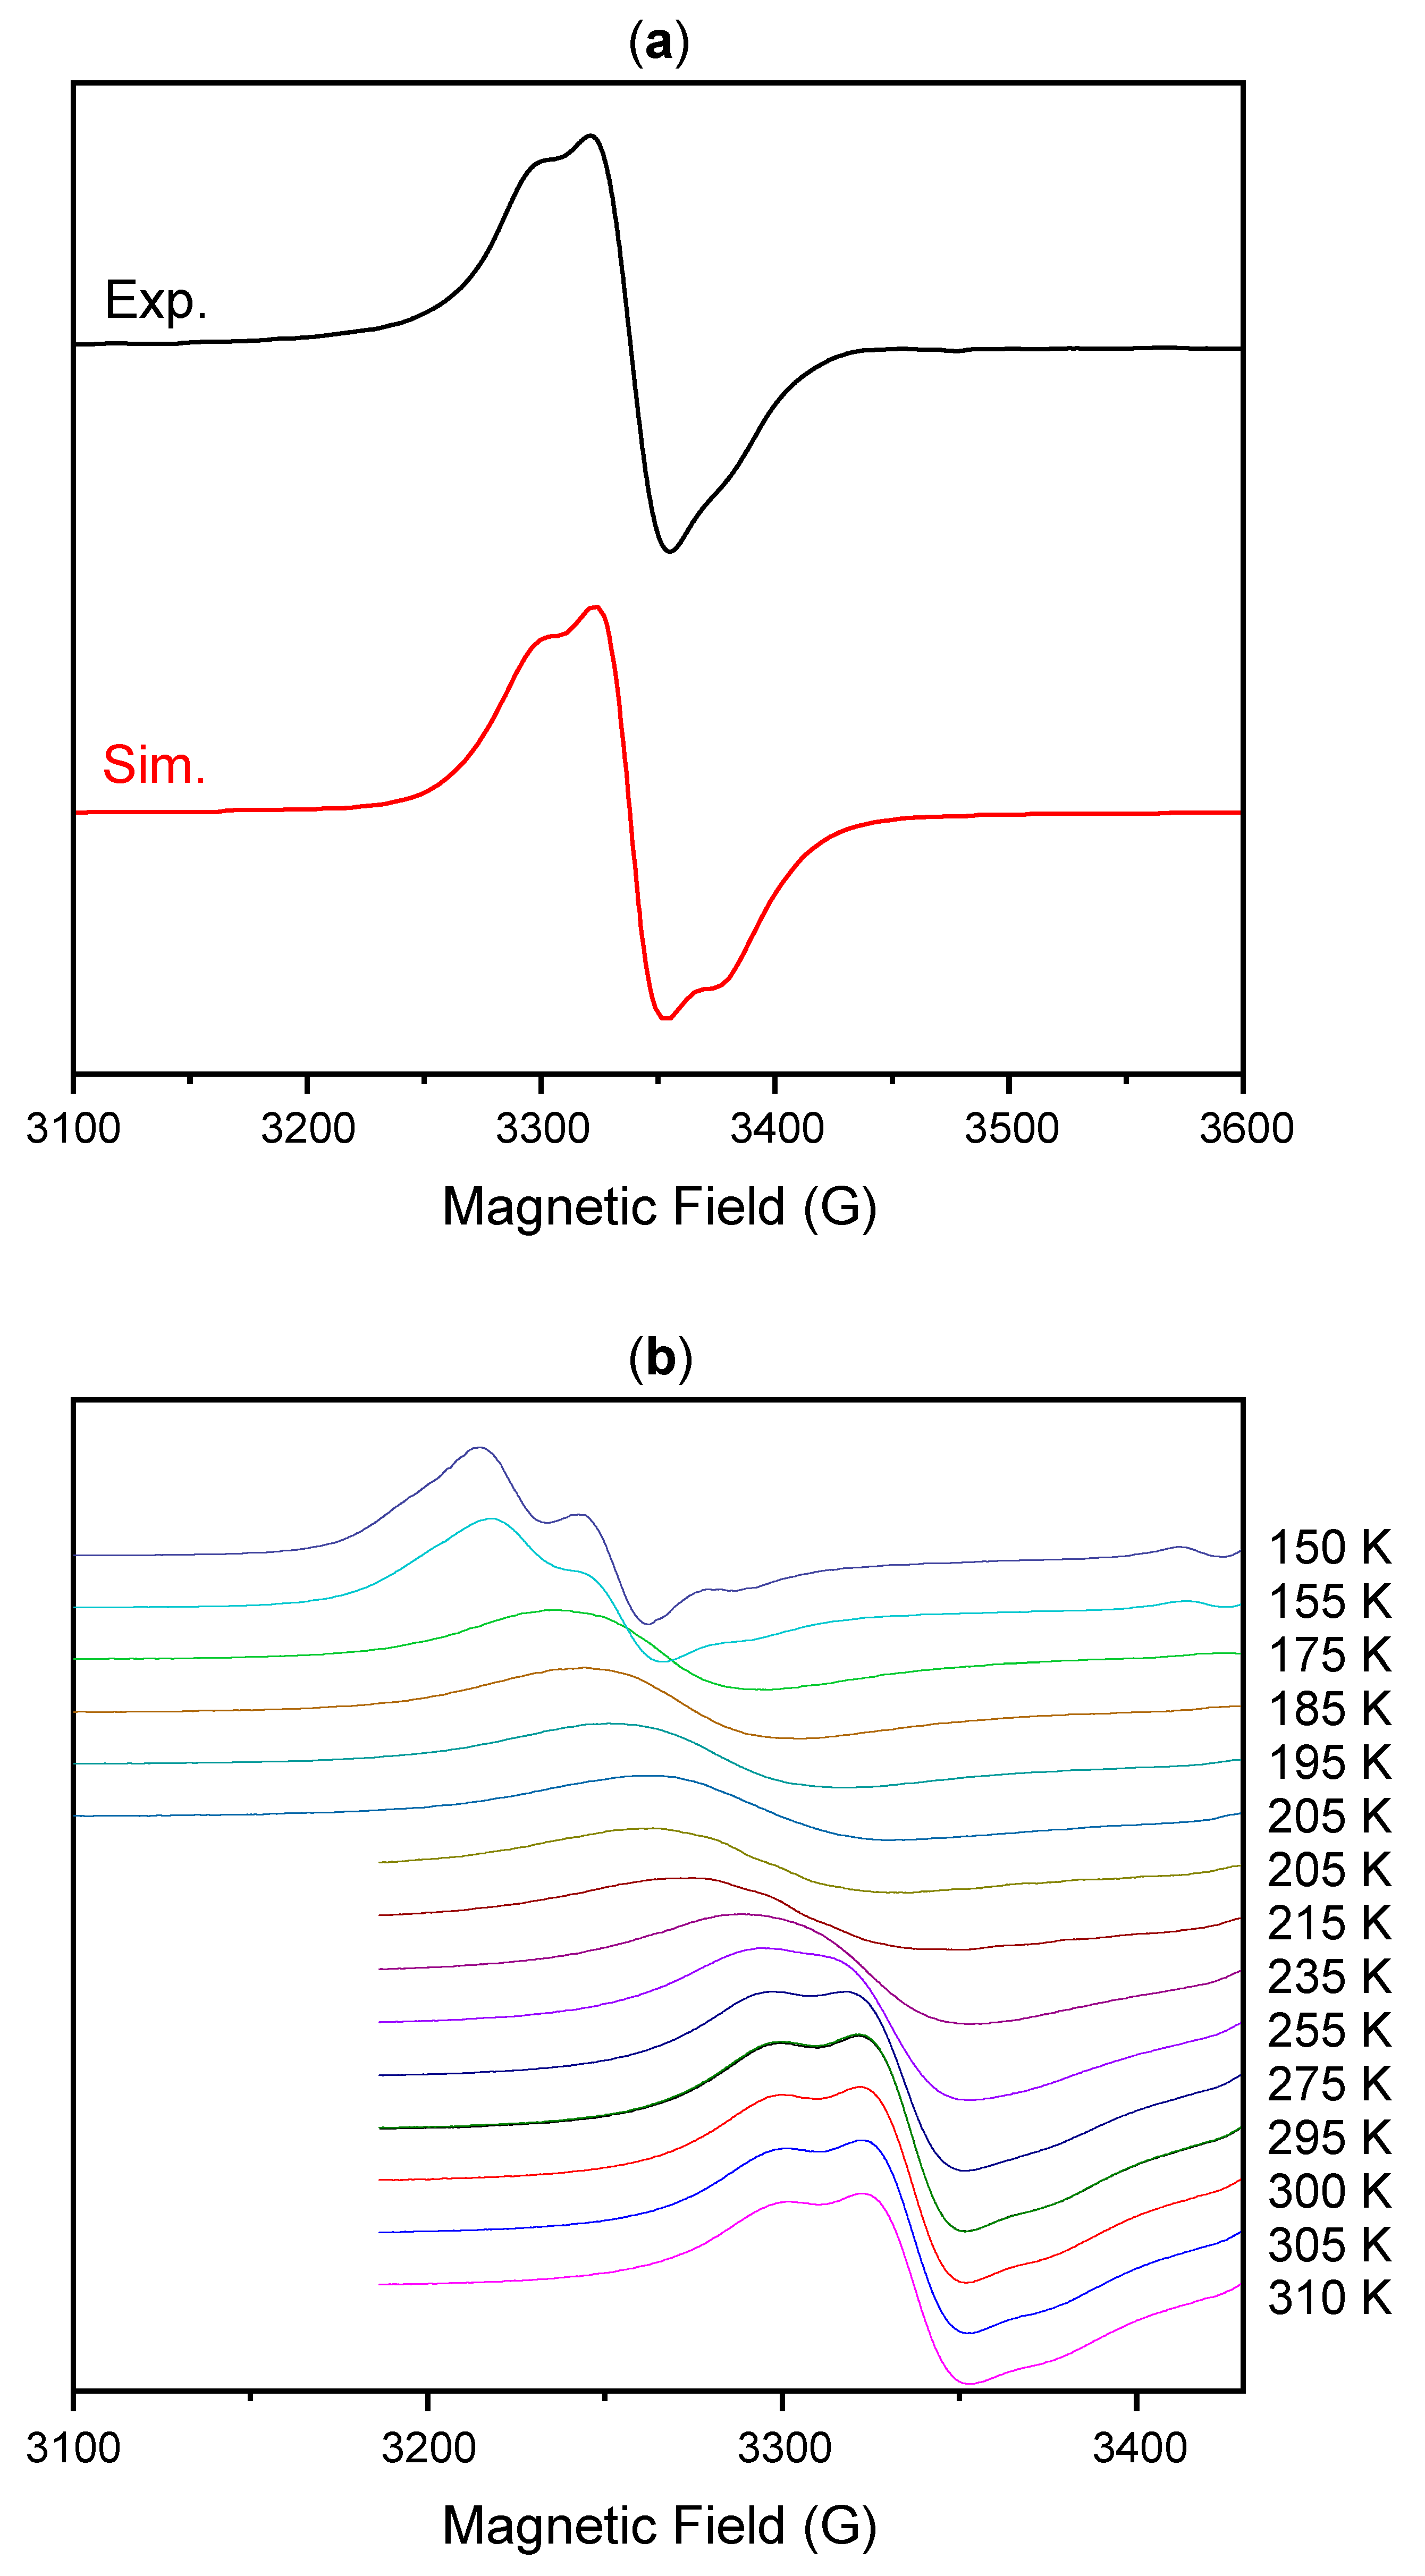
| Moiety Formula Sum Formula |
2(C39H55N3O2Pt), 2(BF4), 3(CH2Cl2) C81H116B2Cl6F8N6O4Pt2 |
| formula weight | 2014.28 |
| temperature [K] | 100(2) |
| wavelength [Å] | 0.71073 |
| crystal system, space group | triclinic, (No. 2) |
| a [Å] | 9.7661(12) |
| b [Å] | 13.8600(15) |
| c [Å] | 16.8963(19) |
| α [deg] | 102.107(3) |
| β [deg] | 91.972(4) |
| γ [deg] | 99.446(3) |
| V [Å3] | 2200.2(4) |
| Z, Dc [g cm−3] | 1, 1.520 |
| absorption coefficient [mm−1] | 3.424 |
| F(000) | 1016 |
| crystal size [mm] | 0.30 × 0.10 × 0.02 |
| Θ range for data collection [deg] | 2.4 – 32.0 |
| limiting indices | −14 ≤ h ≤ 14, −20 ≤ k ≤ 20, −25 ≤ l ≤ 25 |
| reflections measured reflections unique observed reflections[I > 2σ(I)] |
113538 15266 14441 |
| GOF on F2 | 1.093 |
| data/restraints/parameters | 15266/ 2/ 516 |
| final R indices [I > 2σ(I)] | R1 = 0.0241, wR2 = 0.0588 |
| R indices (all data) | R1 = 0.0262, wR2 = 0.0593 |
| largest diff. peak and hole [e Å−3] | 2.02 and -1.47 |
| CCDC number | 2277791 |
Disclaimer/Publisher’s Note: The statements, opinions and data contained in all publications are solely those of the individual author(s) and contributor(s) and not of MDPI and/or the editor(s). MDPI and/or the editor(s) disclaim responsibility for any injury to people or property resulting from any ideas, methods, instructions or products referred to in the content. |
© 2023 by the authors. Licensee MDPI, Basel, Switzerland. This article is an open access article distributed under the terms and conditions of the Creative Commons Attribution (CC BY) license (http://creativecommons.org/licenses/by/4.0/).


